Article

Experimental Investigation of Primary De-NOx Methods Application Effects on NOx and CO Emissions from a Small-Scale Furnace

1
Department of Thermal Technology and Gas Industry, Institute of Metallurgy, Faculty of Materials, Metallurgy and Recycling, Technical University of Kosice, Letná 9, 042 00 Košice, Slovakia
2
Department of Process Technique, Faculty of Manufacturing Technologies of the TU of Kosice with a Seat in Prešov, Technical University of Kosice, Štúrova 31, 080 01 Prešov, Slovakia
3
Department of Chemical and Biochemical Engineering, Faculty of Chemical and Food Technology, Slovak University of Technology, Radlinského 9, 812 37 Bratislava, Slovakia
4
Department of Power Engineering, Institute of Power and Process Engineering, Faculty of Mechanical Engineering, Technical University of Košice, Letná 9, 042 00 Košice, Slovakia
*
Author to whom correspondence should be addressed.
Processes 2020, 8(8), 940; https://doi.org/10.3390/pr8080940
Submission received: 30 June 2020 / Revised: 30 July 2020 / Accepted: 2 August 2020 / Published: 5 August 2020
(This article belongs to the Special Issue Progress in Energy Conversion Systems and Emission Control)

Abstract

:
Nitrogen oxides (NOx) from combustion contribute significantly to atmospheric pollution. An experimental setup was employed to investigate the application of three primary denitrification methods, i.e., reburning (staged combustion), overfiring air (OFA), and flue-gas recirculation (FGR), individually and in combination, combusting natural gas (NG) and propane–butane gas (PBG). Fuel heat inputs of 16 and 18 kW and air excess coefficients of 1.1 and 1.2, respectively, were tested. The highest individual denitrification efficiency of up to 74% was obtained for FGR, followed by reburning and OFA. A denitrification efficiency between 8.9% (reburning + OFA) and 72% (reburning + OFA + FGR) with NG combustion was observed. Using a 20% FGR rate yielded denitrification efficiency of 74% for NG and 65% for PBG and also led to a significant decrease in carbon monoxide (CO) emissions, so this can be recommended as the most efficient denitrification and de-CO method in small-scale furnaces. Reburning alone led to a sharp, more than 12-fold increase in CO emissions compared to the amount without any other method application. The presented results and the difference between our experimental data and the literature data acquired in some other studies indicate the need for further research.

1. Introduction

The use of primary energy sources (fuels) burdens the environment and impacts human health, both in the fuel mining and processing phases [1] as well as in the conversion processes to heat and power [2] or to mechanical energy in transportation systems [3]. Combustion of fuels yields, besides heat, harmful substances emitted into the atmosphere, such as fly-ash, particulate matter, carbon, sulphur, and nitrogen oxides as well as light and heavy metals (often radioactive), especially in liquid and solid fuel combustion. Nitrogen oxides (especially NO and NO2) and their formation and reduction strategies, therefore, play an important role in the protection of the atmosphere [4].
NOx formation during combustion is influenced by several parameters. The most important ones include combustion temperature, fuel nitrogen content and fuel composition [5,6], air excess coefficient [7] and air staging [7,8], combustion process reaction pathways [9], hydrodynamics, burner design [10] and load [5,7], and flue gas residence time [11]. Numerical studies using dedicated software enable their synergies to be assessed [12,13,14,15].
Oxycombustion is a widely studied means of combustion process energy efficiency improvement nowadays but with an ambiguous effect on NOx formation [16,17,18]. A recent review by Liu et al., 2019 [19], surveyed the most important experimental research in the field of oxycombustion, concluding that NOx formation was case-sensitive, strongly dependent on system design and operation specificities, and no general conclusion could be drawn on the impact of oxygen enrichment on NOx formation.
The development and application of advanced flue gas denitrification methods have facilitated meeting the nitrogen oxide limit concentrations, which are steadily becoming more stringent [20]. Denitrification methods can be classified into primary and secondary ones [4,21]. Primary de-NOx methods are based on nitrogen formation suppression directly during fuel combustion through the creation of a reduction zone, which lowers the flame temperature [22]. Secondary de-NOx methods are based on nitrogen oxide reduction or scavenging from the flue gas downstream of combustion processes [23,24].
Primary methods include overfire air (OFA) [10,11,25,26,27,28], reburning [12,29,30,31,32,33,34,35,36,37], flue-gas recirculation (FGR) [13,23,38,39,40,41], and their combinations [14,42,43,44,45]. They are cheaper than the secondary ones, however the thermal efficiency of combustion aggregate decreases as a result of combustion temperature lowering, and there is a subsequent increase in unburnt carbon content in ash and fly-ash. OFA is based on substoichiometric (m = 0.7 to 0.8) fuel combustion with air [25]. The resulting reduction atmosphere suppresses nitrogen oxide formation. Previous studies [10,27,28] confirm that staged air introduction can help in reducing NOx emissions from combustion but can negatively impact the energy performance of the combustion process. The “reburning” method includes the creation of a zone in the combustion chamber with a lack of oxygen, which in turn leads to nitrogen oxide reduction [12,29]. Low-quality gaseous or solid fuel or waste fuels can be used for this purpose [30]. Primary fuel is combusted with a substantial air excess coefficient, which decreases flame temperature and suppresses NOx formation [31]. Optimal means of reburning integration with other denitrification methods for further improvement in NOx emissions reduction were proposed in [14,42]. Flue-gas recirculation (FGR) is one of the simplest and cheapest denitrification methods. It is based on returning part of the obtained flue gas back to the combustion zone. Internal recirculation is achieved in modified burners, resulting in combustion air and flue gas mixing [38,39]. External recirculation is characterized by returning part of the partly cooled flue gas into the space above the burners [15,40]. Flue-gas recirculation is a cheap denitrification method, which is often used to assist other methods in achieving greater denitrification.
Analyzed studies suggest that the synergic effect of simultaneous application of multiple primary denitrification methods varies significantly with the fuels combusted as well as with combustor operation and design. Effects on the emissions of other pollutants, such as carbon monoxide, are to be considered along with NOx emissions to truly prove the beneficial environmental impact of specific denitrification methods. Comprehensive information on their application can be found in a few recently published studies [35,44] with significant differences in their findings. So the key question to be answered with the intention of contributing significantly to environmental protection is: which individual method and which combination of methods would serve as the best for reducing nitrogen oxide emissions while also preventing an increase in other gaseous pollutants? The present experimental study addresses this question by investigating the application and resulting denitrification efficiency of several primary denitrification methods and their combinations and evaluating their impact on carbon monoxide emissions as well. The methods and combinations applied were:
  • OFA
  • Reburning
  • FGR
  • OFA + reburning
  • OFA + reburning + FGR
Natural gas and propane–butane gas served as widely available gaseous fuels. In this way, problems related to particle sizes and their distribution, their porosities, moisture content, and many others, which must be considered when testing solid fuels, did not arise. Carbon monoxide is a common product of incomplete combustion, thus studying changes in its emission levels along with the application of various denitrification methods can be considered representative enough to assess those of other relevant greenhouse gases as well.

2. Materials and Methods

2.1. Experimental Setup

The experimental setup used for denitrification efficiency estimation of individual nitrogen oxide emissions reduction methods and their combination is shown in Figure 1. The following parameters were adjusted in the FGR method: recirculation rate, combustion air excess, and fuel flow rate. The reburning method used an adjustable reburning fuel flow rate. Denitrification efficiency in all three primary methods applied individually and in combination was evaluated at a constant fuel heat input.
The experimental setup comprised the following: combustion chamber, flue-gas duct, stack, and three fans. The main burner combusting premixed primary fuel with air (primary air in the OFA application) was located at the front of the combustion chamber. Two Pt-RhPt thermocouples (T13, T14) were located in the combustion chamber. Reburning fuel could be introduced into the central part of the flue-gas duct, and the reburning zone was followed by OFA entry and the afterburning zone.
Temperature in the flue-gas duct was measured by means of five Cr-Al thermocouples (T3 to T7). Two flue-gas analyzers (A1 and A2) served for flue-gas composition estimation in the duct and at the flue gas to stack discharge point. Supplementary burners were operated at the top of the stack to reduce CO emissions into the environment. Fuel flow rates were regulated with throttling valves. Natural gas was provided from the distribution network and propane–butane gas was supplied from gas cylinders. The composition of NG and PBG is provided in Table 1 and Table 2, respectively.
Thermocouple T3 and analyzer A1 were located in the first part of the duct, enabling us to monitor flue-gas temperature and composition before reburning and the OFA zone. The other four thermocouples were located downstream: T4 at the end of the reburning zone, T5 at the afterburning zone end, and T6 and T7 in the second part of the duct.
Positions of individual thermocouples and their distance from the burner, as shown in Figure 1, are specified in Table 3.
The following gas meters were used for fuel flow rate estimation:
Primary fuel: type G 4 BK, Qmax = 6 m3/h, Qmin = 0.016 m3/h, V = 1.2 dm3, pmax = 20 kPa, 1 imp 0.01 m3,
Reburning fuel: type G 1.6 BK, Qmax = 2.5 m3/h, Qmin = 0.016 m3/h, V = 1.2 dm3, pmax = 20 kPa, 1 imp 0.01 m3.
Testo 350 XL (A2) and Testo 325 (A1) analyzers were employed for the flue-gas composition analysis. Appendix A contains detailed information about NOx and CO measurement methods and measurement errors of both analyzers.

2.2. Primary Denitrification Methods Application

Measurements with NG used both as main and reburning fuel were conducted under steady air excess coefficient conditions (m = 1.1 or 1.2) and under steady fuel thermal inputs of 16 or 18 kW, respectively.
NOx emissions were measured first without any de-NOx method application, followed by application of individual methods and subsequently their combinations.
Emissions of nitrogen oxides and carbon monoxide as well as flue-gas temperature measurements were performed for various natural gas total heat inputs under various process modifications. An overview of performed experiments with individual methods and their combinations is provided in Table 4.
Measurements with PBG combusted were conducted under steady air excess coefficient conditions (m = 1.1 or 1.2) and under steady fuel thermal inputs of 16 to 22 kW, respectively. Combustion without any primary method application was compared with flue-gas recirculation rate of 10 to 20% in measurements.
A detailed description of performed measurements is provided in Appendix B.

3. Results

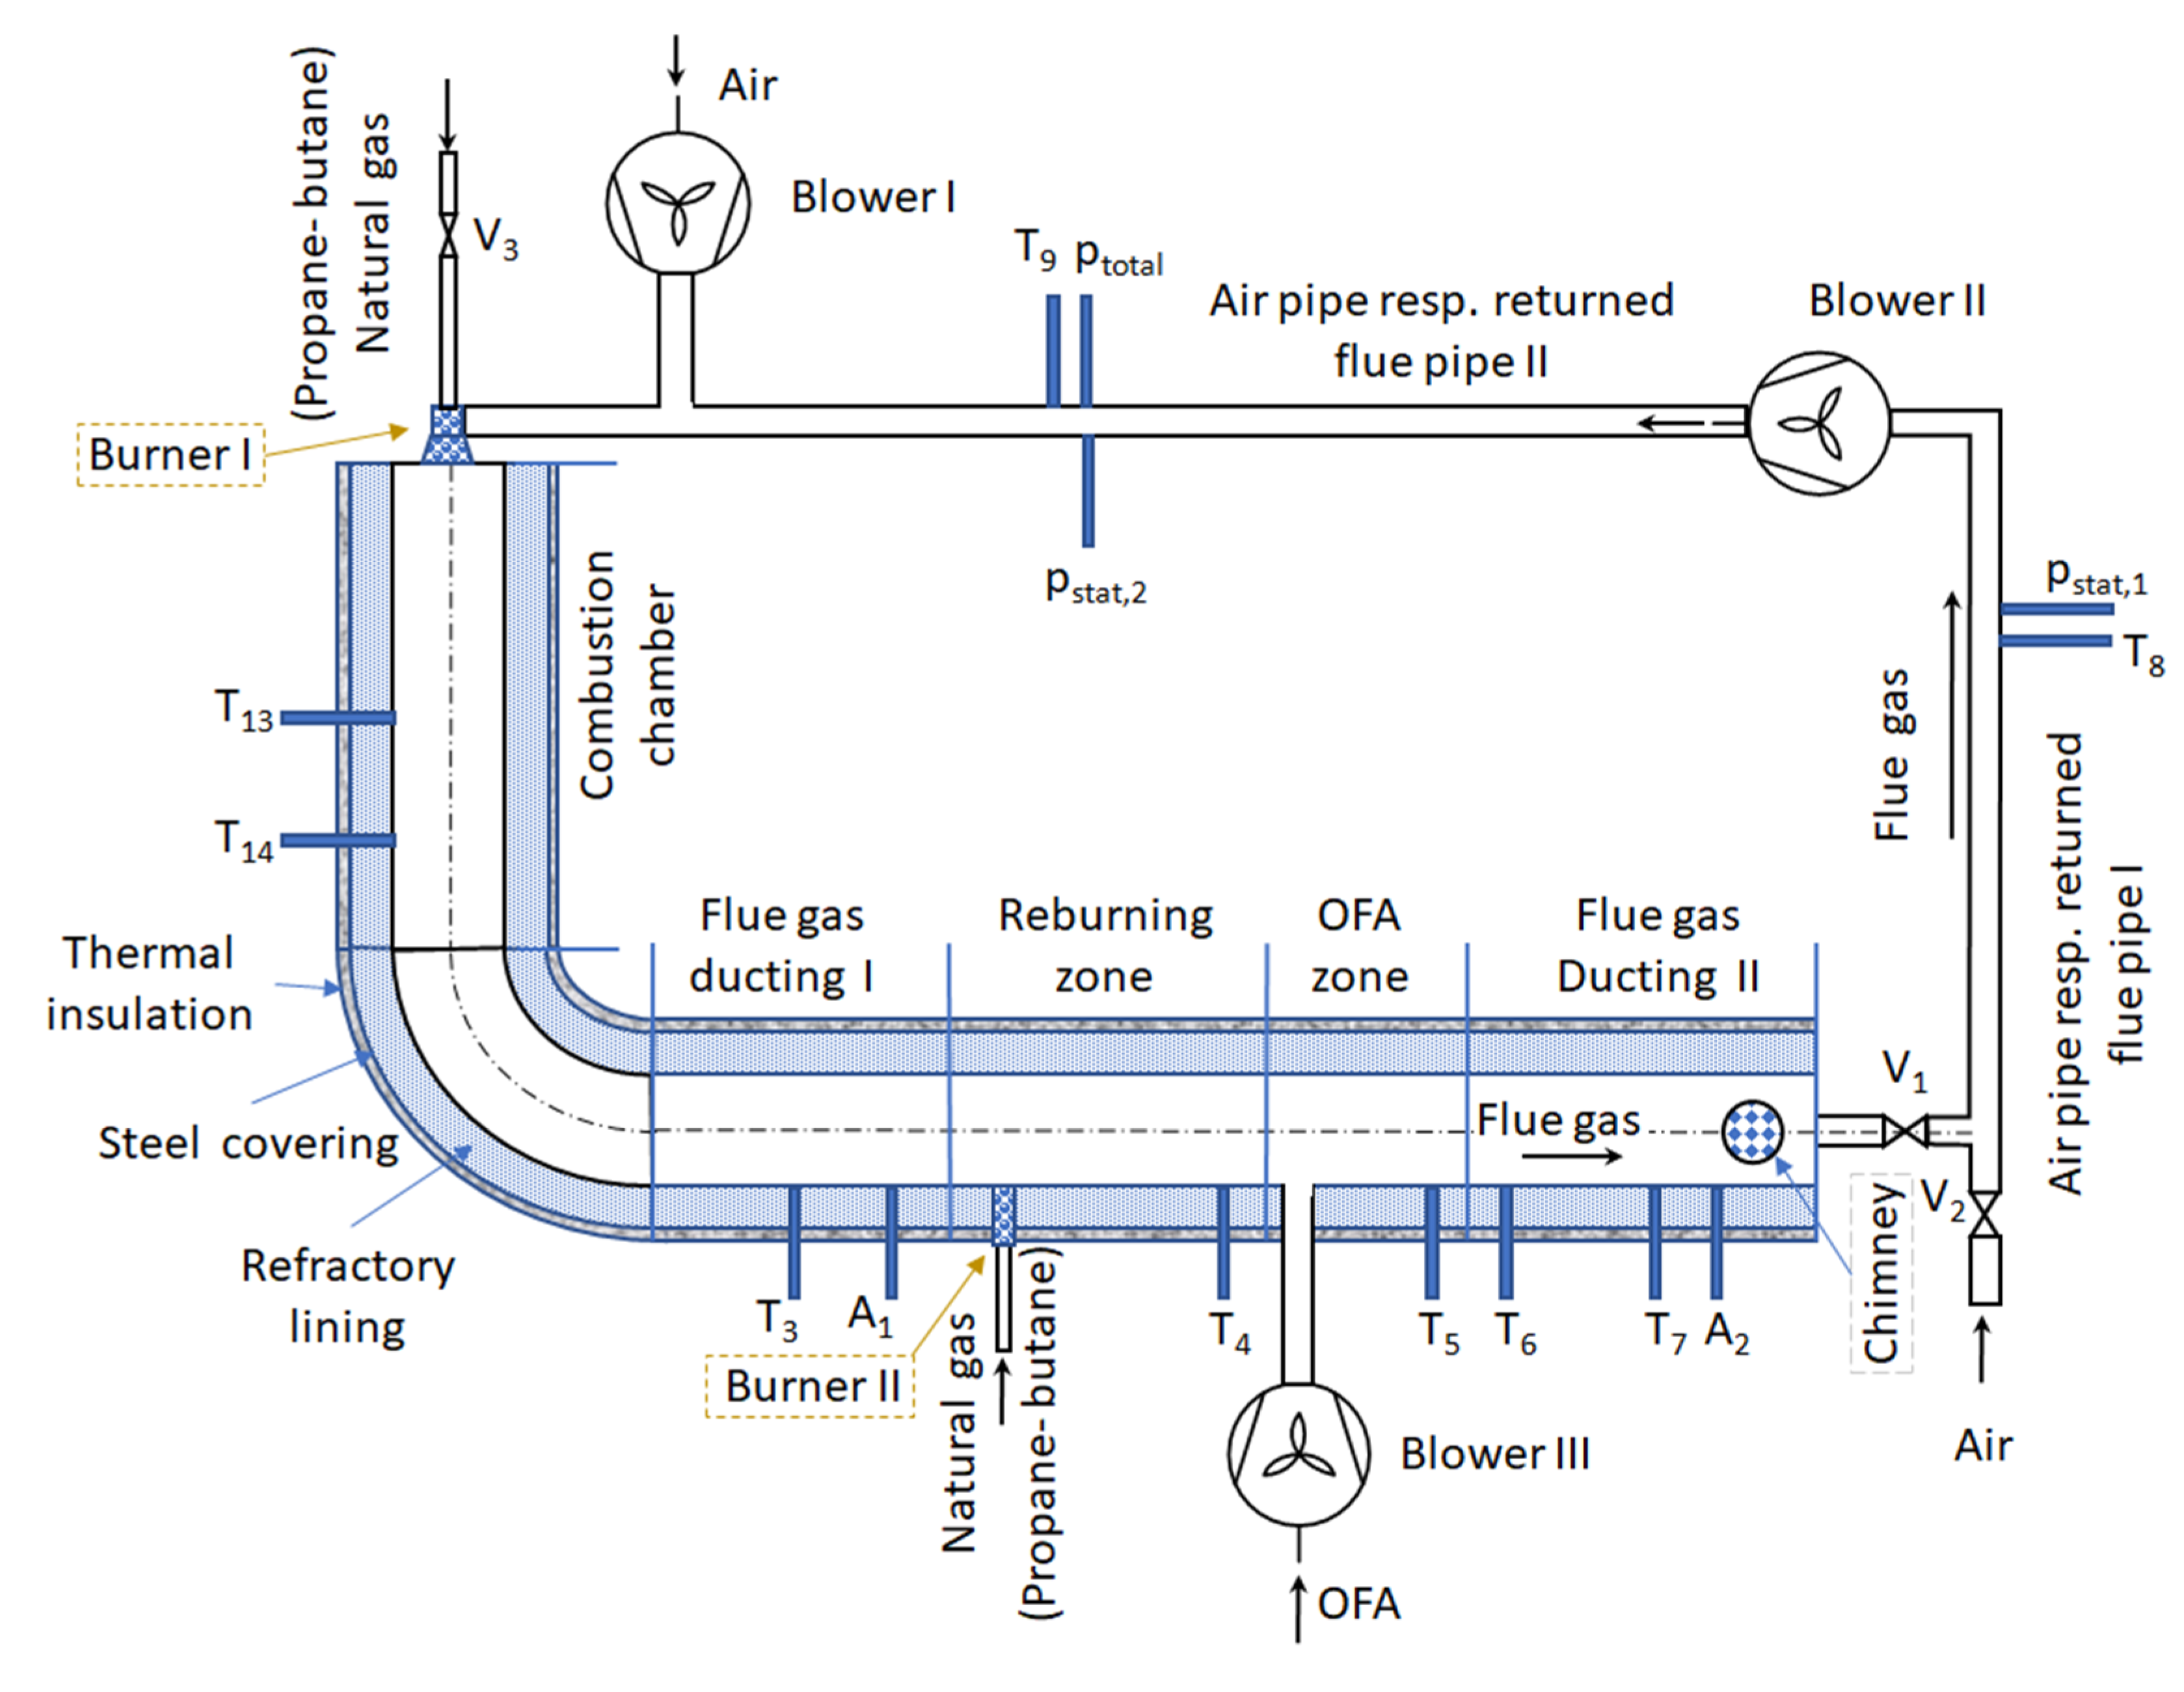
3.1. Natural Gas (NG) Combustion Experiments

This section presents the results of applying primary de-NOx methods to a natural gas-fired system. Denitrification efficiency of flue-gas recirculation, reburning, overfire air use, and combinations of these were evaluated at natural gas thermal inputs of Q = 1.5 and 1.8 m3/h and air excess coefficients of m = 1.1 and 1.2, respectively.
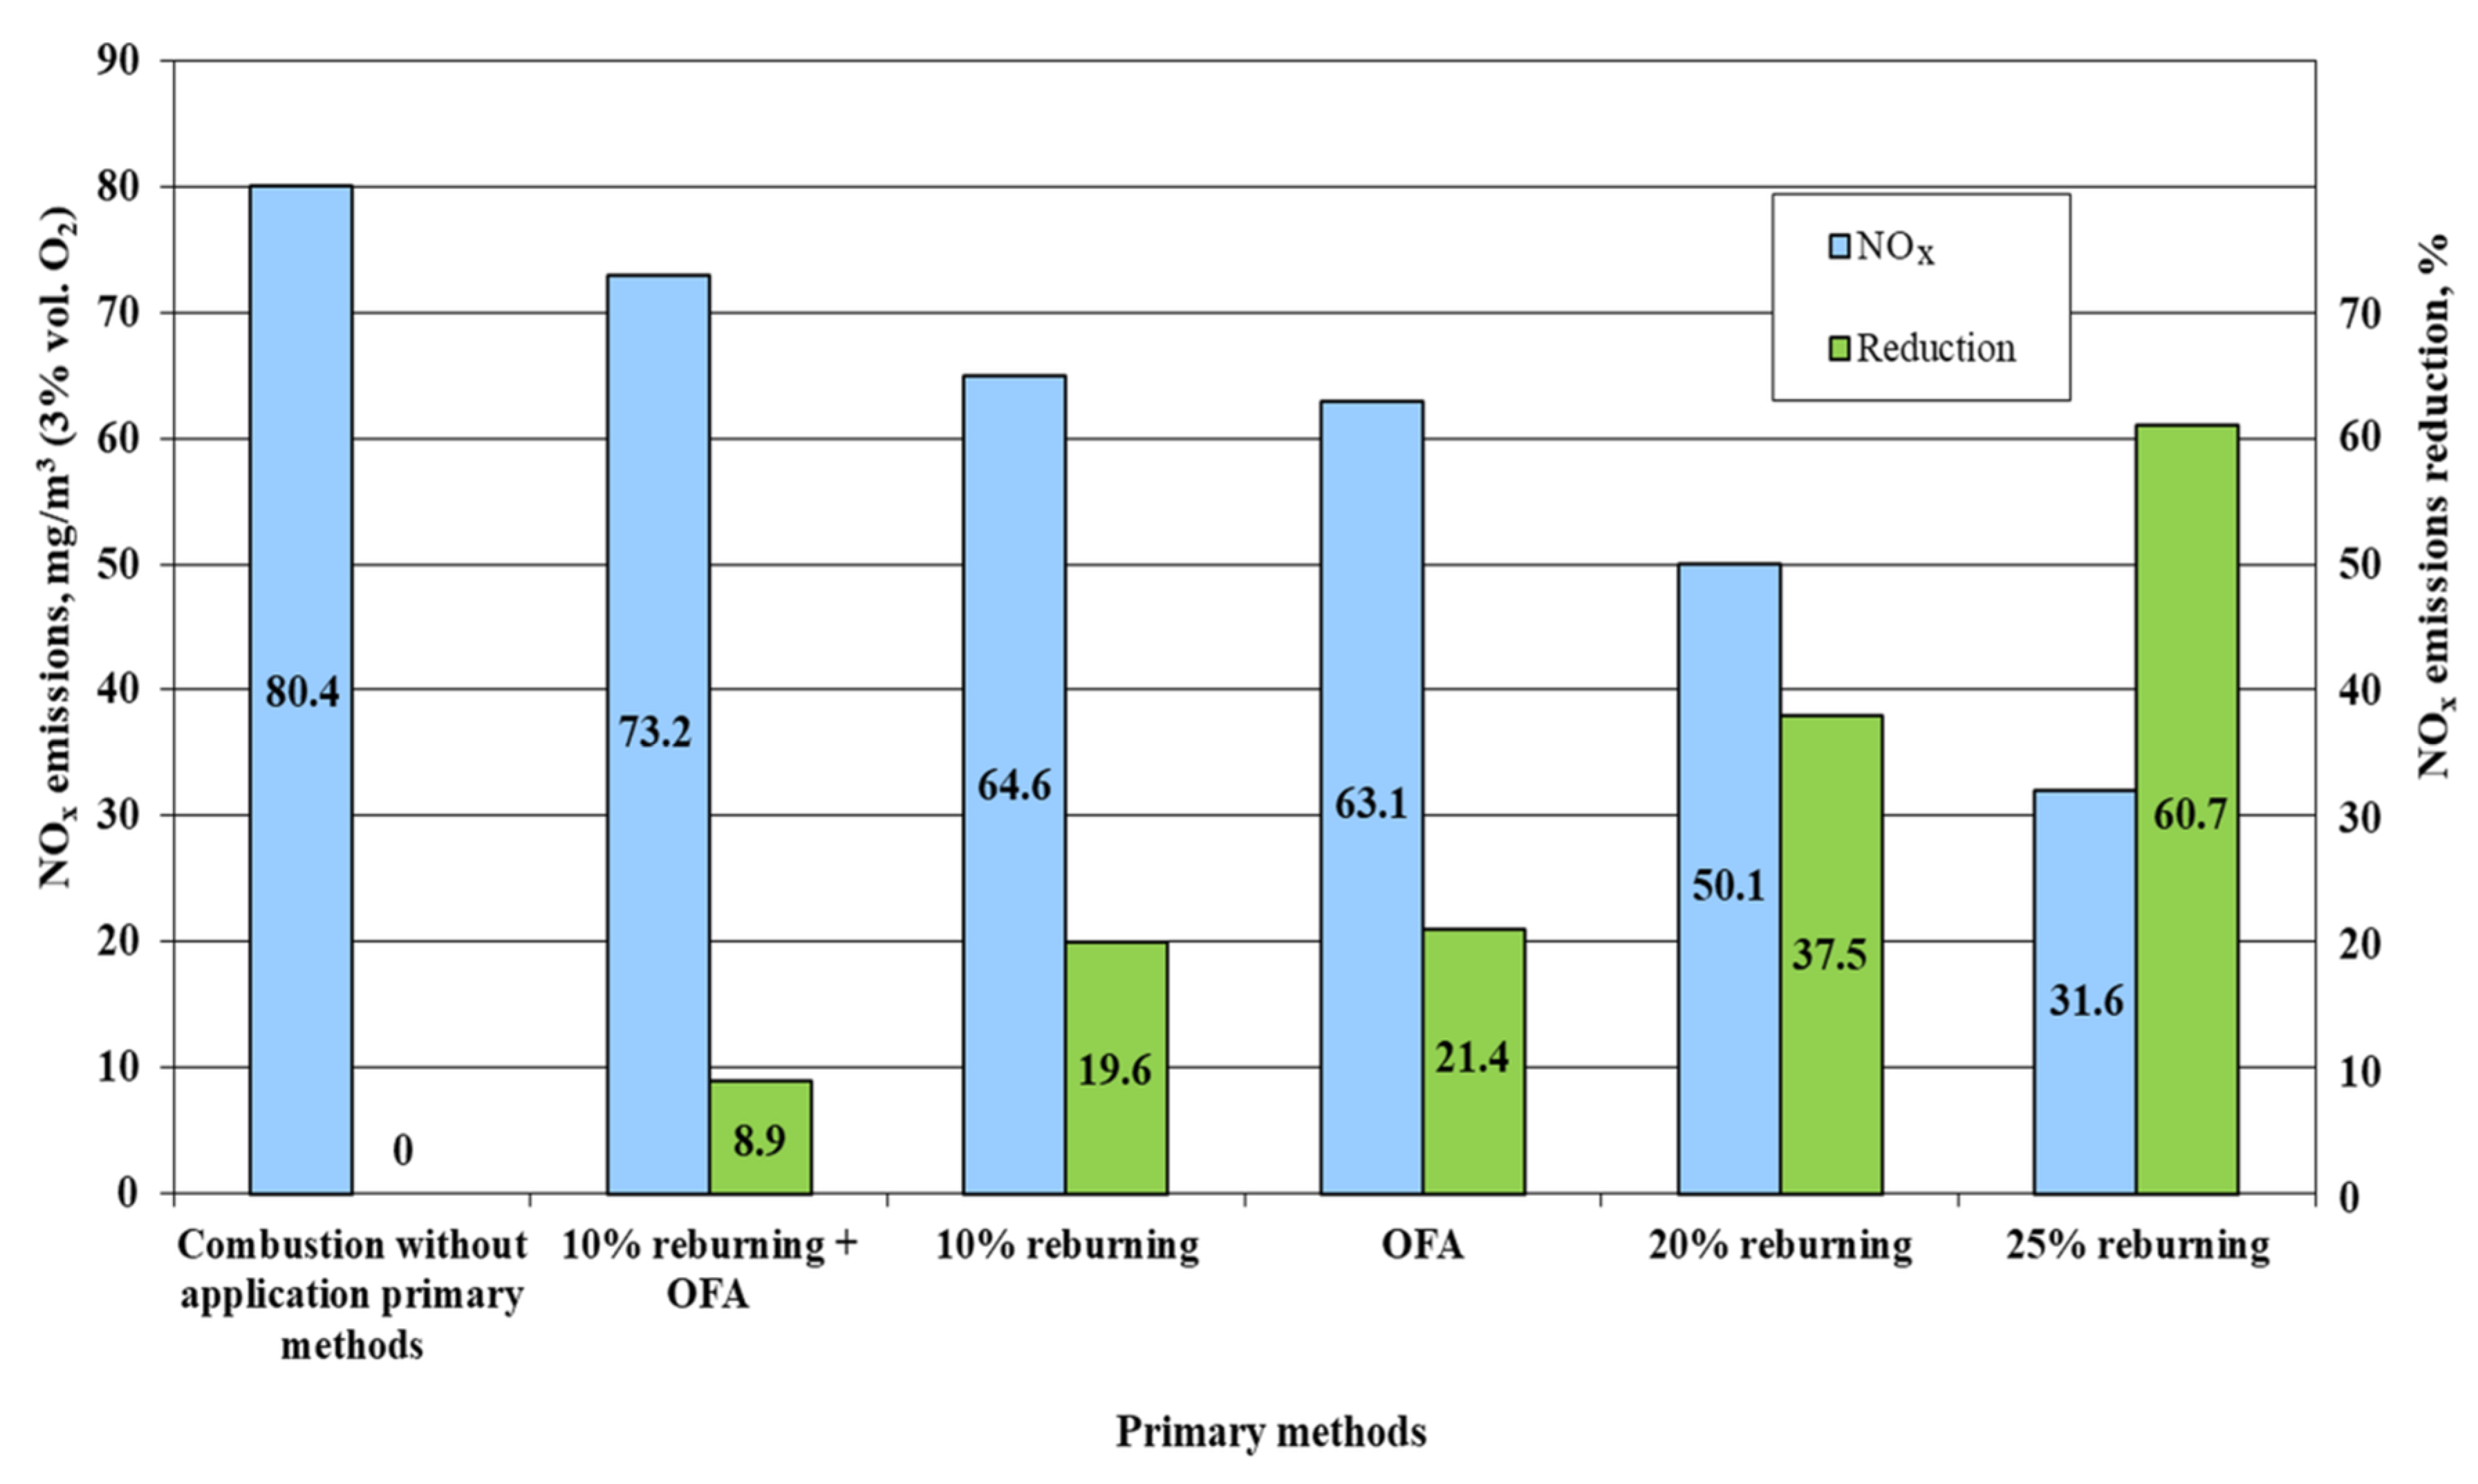
Figure 2 depicts the measured nitrogen oxide emissions and denitrification efficiency of individual primary methods and their combinations at Q = 1.5 m3/h and m = 1.1. Reburning proved to be an efficient primary method; with a rising reburning ratio from 10 to 25%, the denitrification efficiency rose from 9 to over 60%. Overfire air use, whether applied separately or in combination with reburning, did not lead to a significant nitrogen emissions reduction.
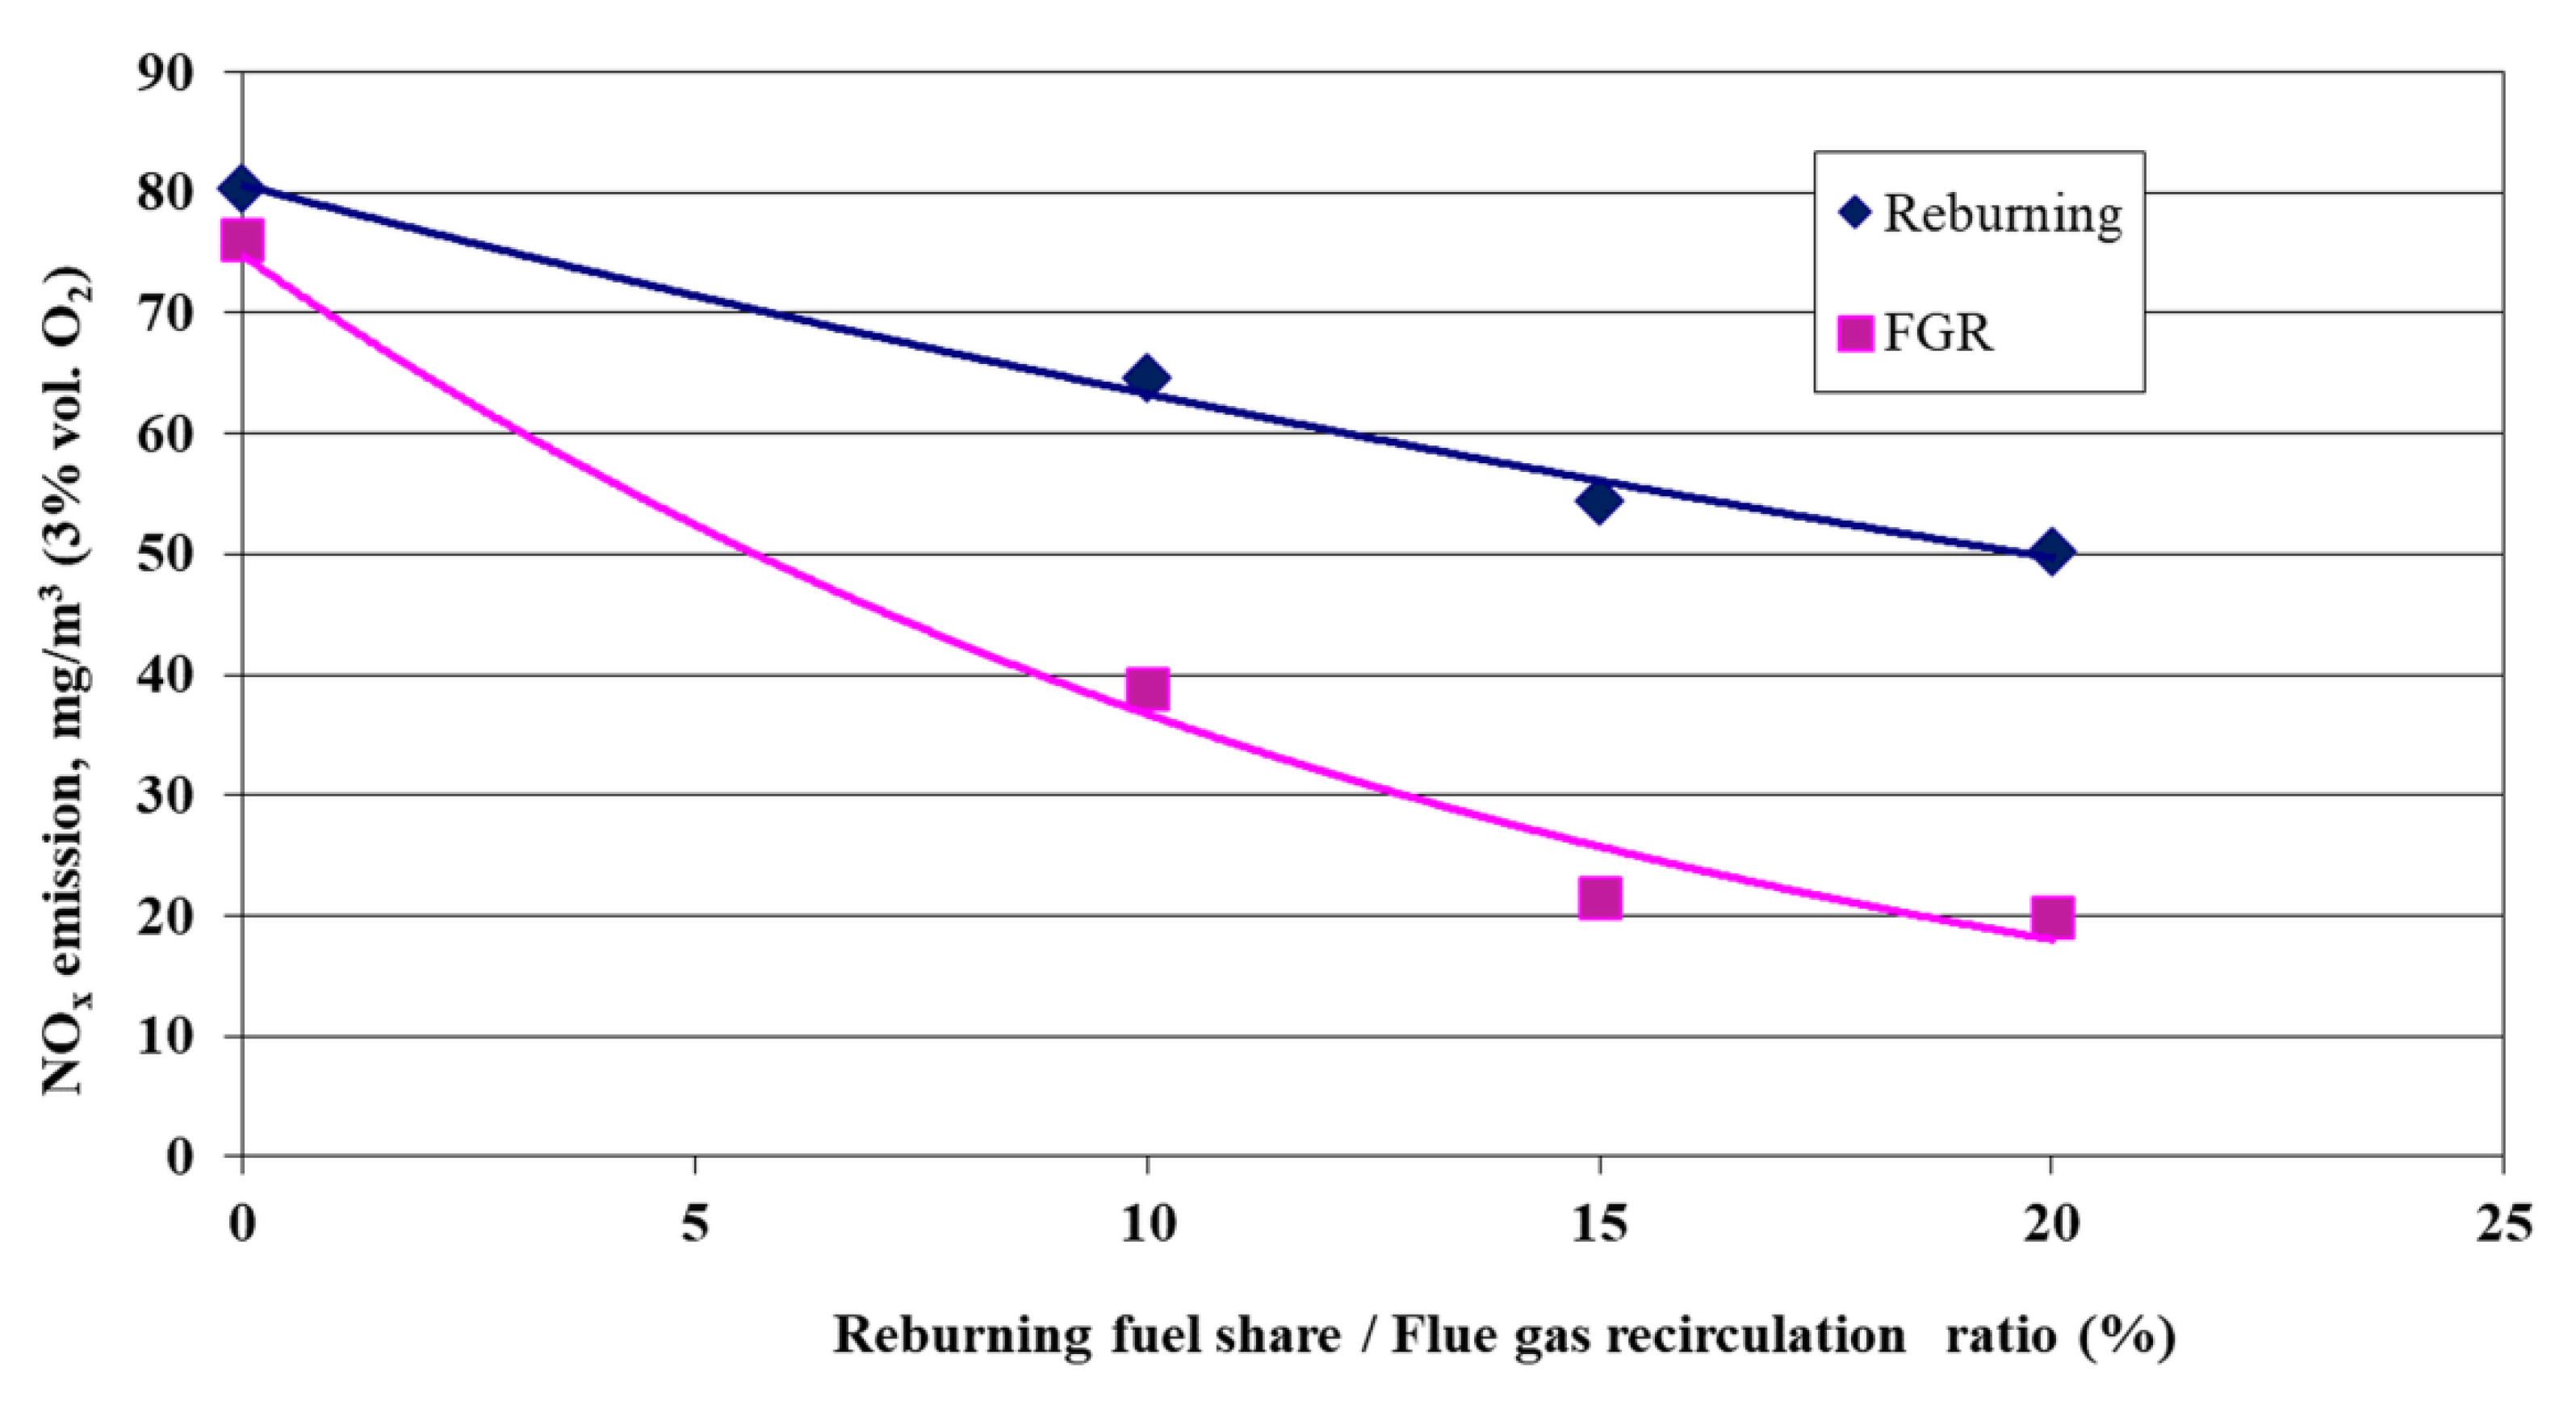
The effects of flue-gas recirculation on nitrogen emissions and its comparison with reburning application at Q = 1.5 m3/h and m = 1.1 are shown in Figure 3. Flue-gas recirculation halved the NOx emissions even at 10% recirculation, and the final NOx emissions at 20% flue-gas recirculation dropped to roughly 20 mg/m3, representing denitrification efficiency of almost 75%. A further increase in flue-gas recirculation was hindered by a significant increase in CO emissions, leading us to conclude that flue-gas recirculation of 20% is the upper limit for feasible combustor operation. Comparison with reburning shows that flue-gas recirculation is a more efficient NOx emissions reduction method, as it reduced them by half at a reburning ratio of over 20% (compare Figure 2 and Figure 3), while 25% represents the upper limit of commonly applied reburning ratios.
The nitrogen oxide reduction values shown in Figure 2 were calculated as relative nitrogen oxide emission differences resulting from measured nitrogen oxide emissions after primary methods application compared to those measured without any denitrification method applied, as follows:
R = ( C WAPM C APM ) C WAPM · 100   ( % )
where R refers to emissions reduction (%), CWAPM stands for nitrogen oxide emissions without application of primary methods, and CAPM represents emissions with application of primary methods.
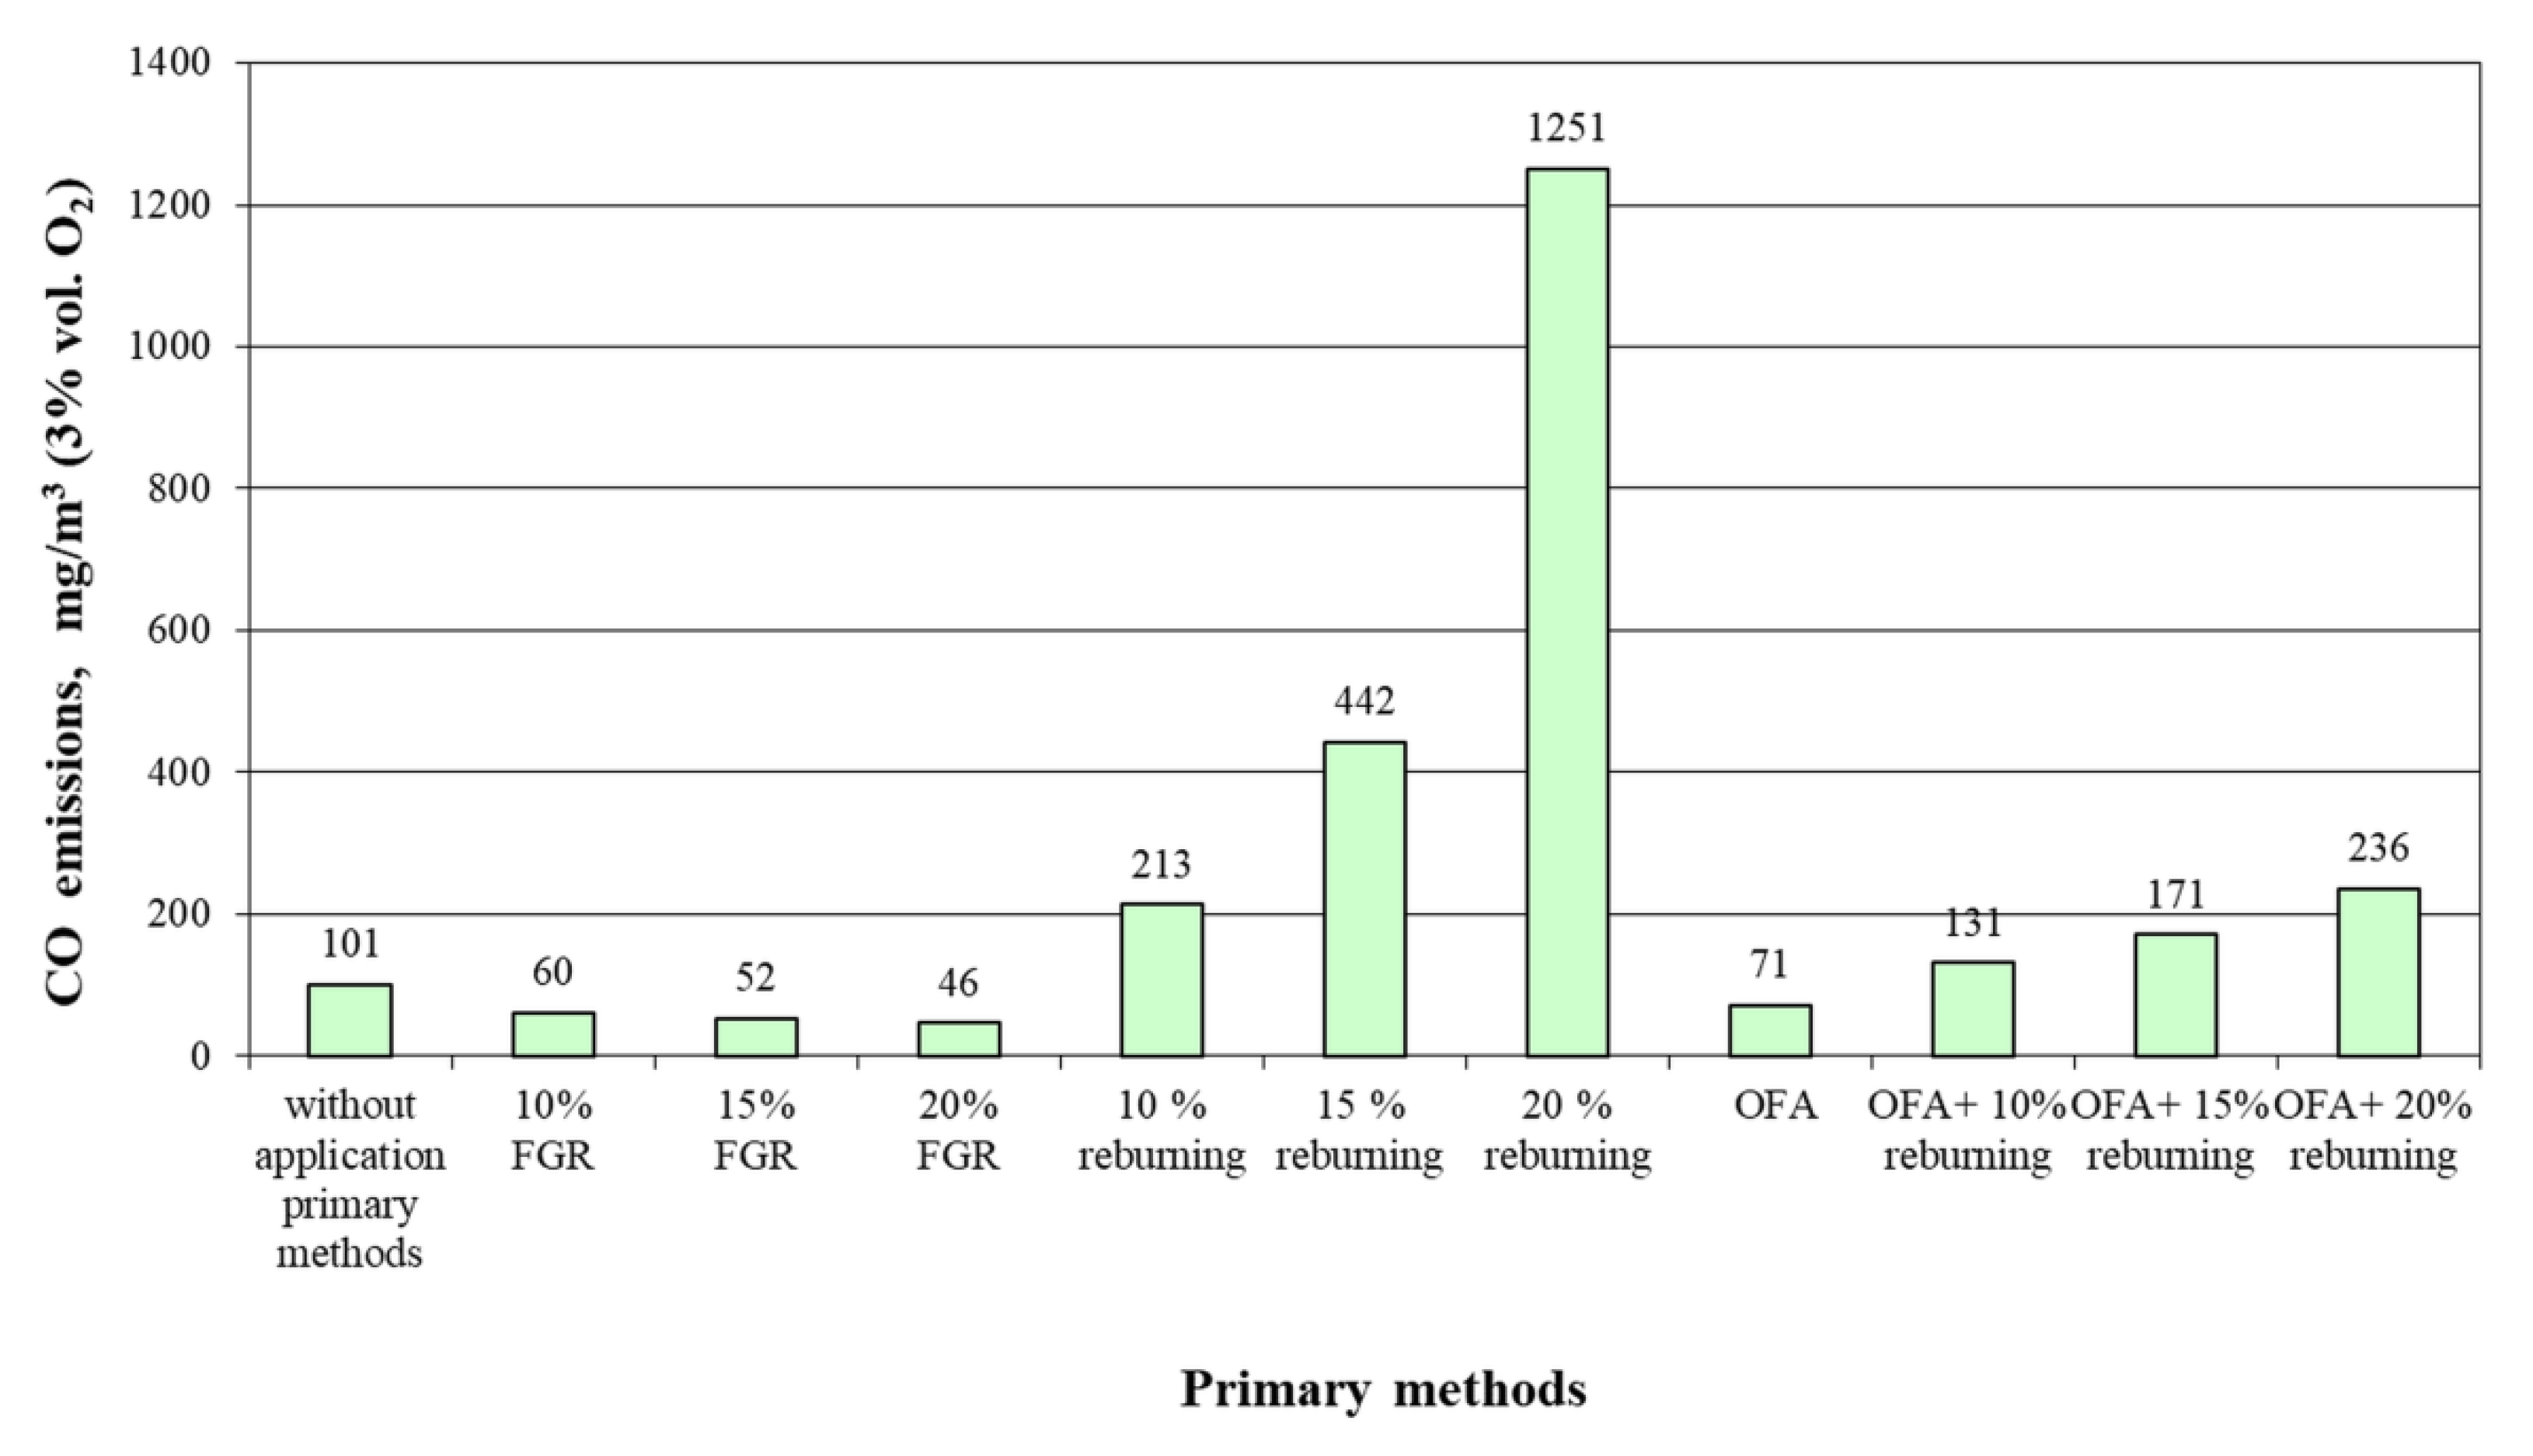
Figure 4 presents the trends in carbon monoxide content in flue gas with the application of individual primary methods and their combinations. Flue-gas recirculation applied alone helped in decreasing CO emissions, compared to the situation without the application of any de-NOx method. Therefore, it can be concluded that the FGR method was able to significantly reduce both NOx and CO emissions (see Figure 3 for comparison) and could thus be considered as a very promising method when striving towards reduction of combustion processes’ environmental impact. All other de-NOx methods and their combinations resulted in increased CO emissions by around 30 mg/m3 (OFA + 10% reburning) to over 1100 mg/m3 (20% reburning). Reburning itself proved to be a less effective de-NOx method than FGR (see Figure 3), yielding substantially higher CO emissions than FGR. Therefore, the application of reburning alone does not appear sensible. Its combination with overfire air, however, reduced the NOx emissions significantly (see Figure 2) and helped approach the emission limit for CO (200 mg/m3). This results from the fact that overfire air introduction leads to oxidation of a major portion of the carbon monoxide formed in the reburning zone.
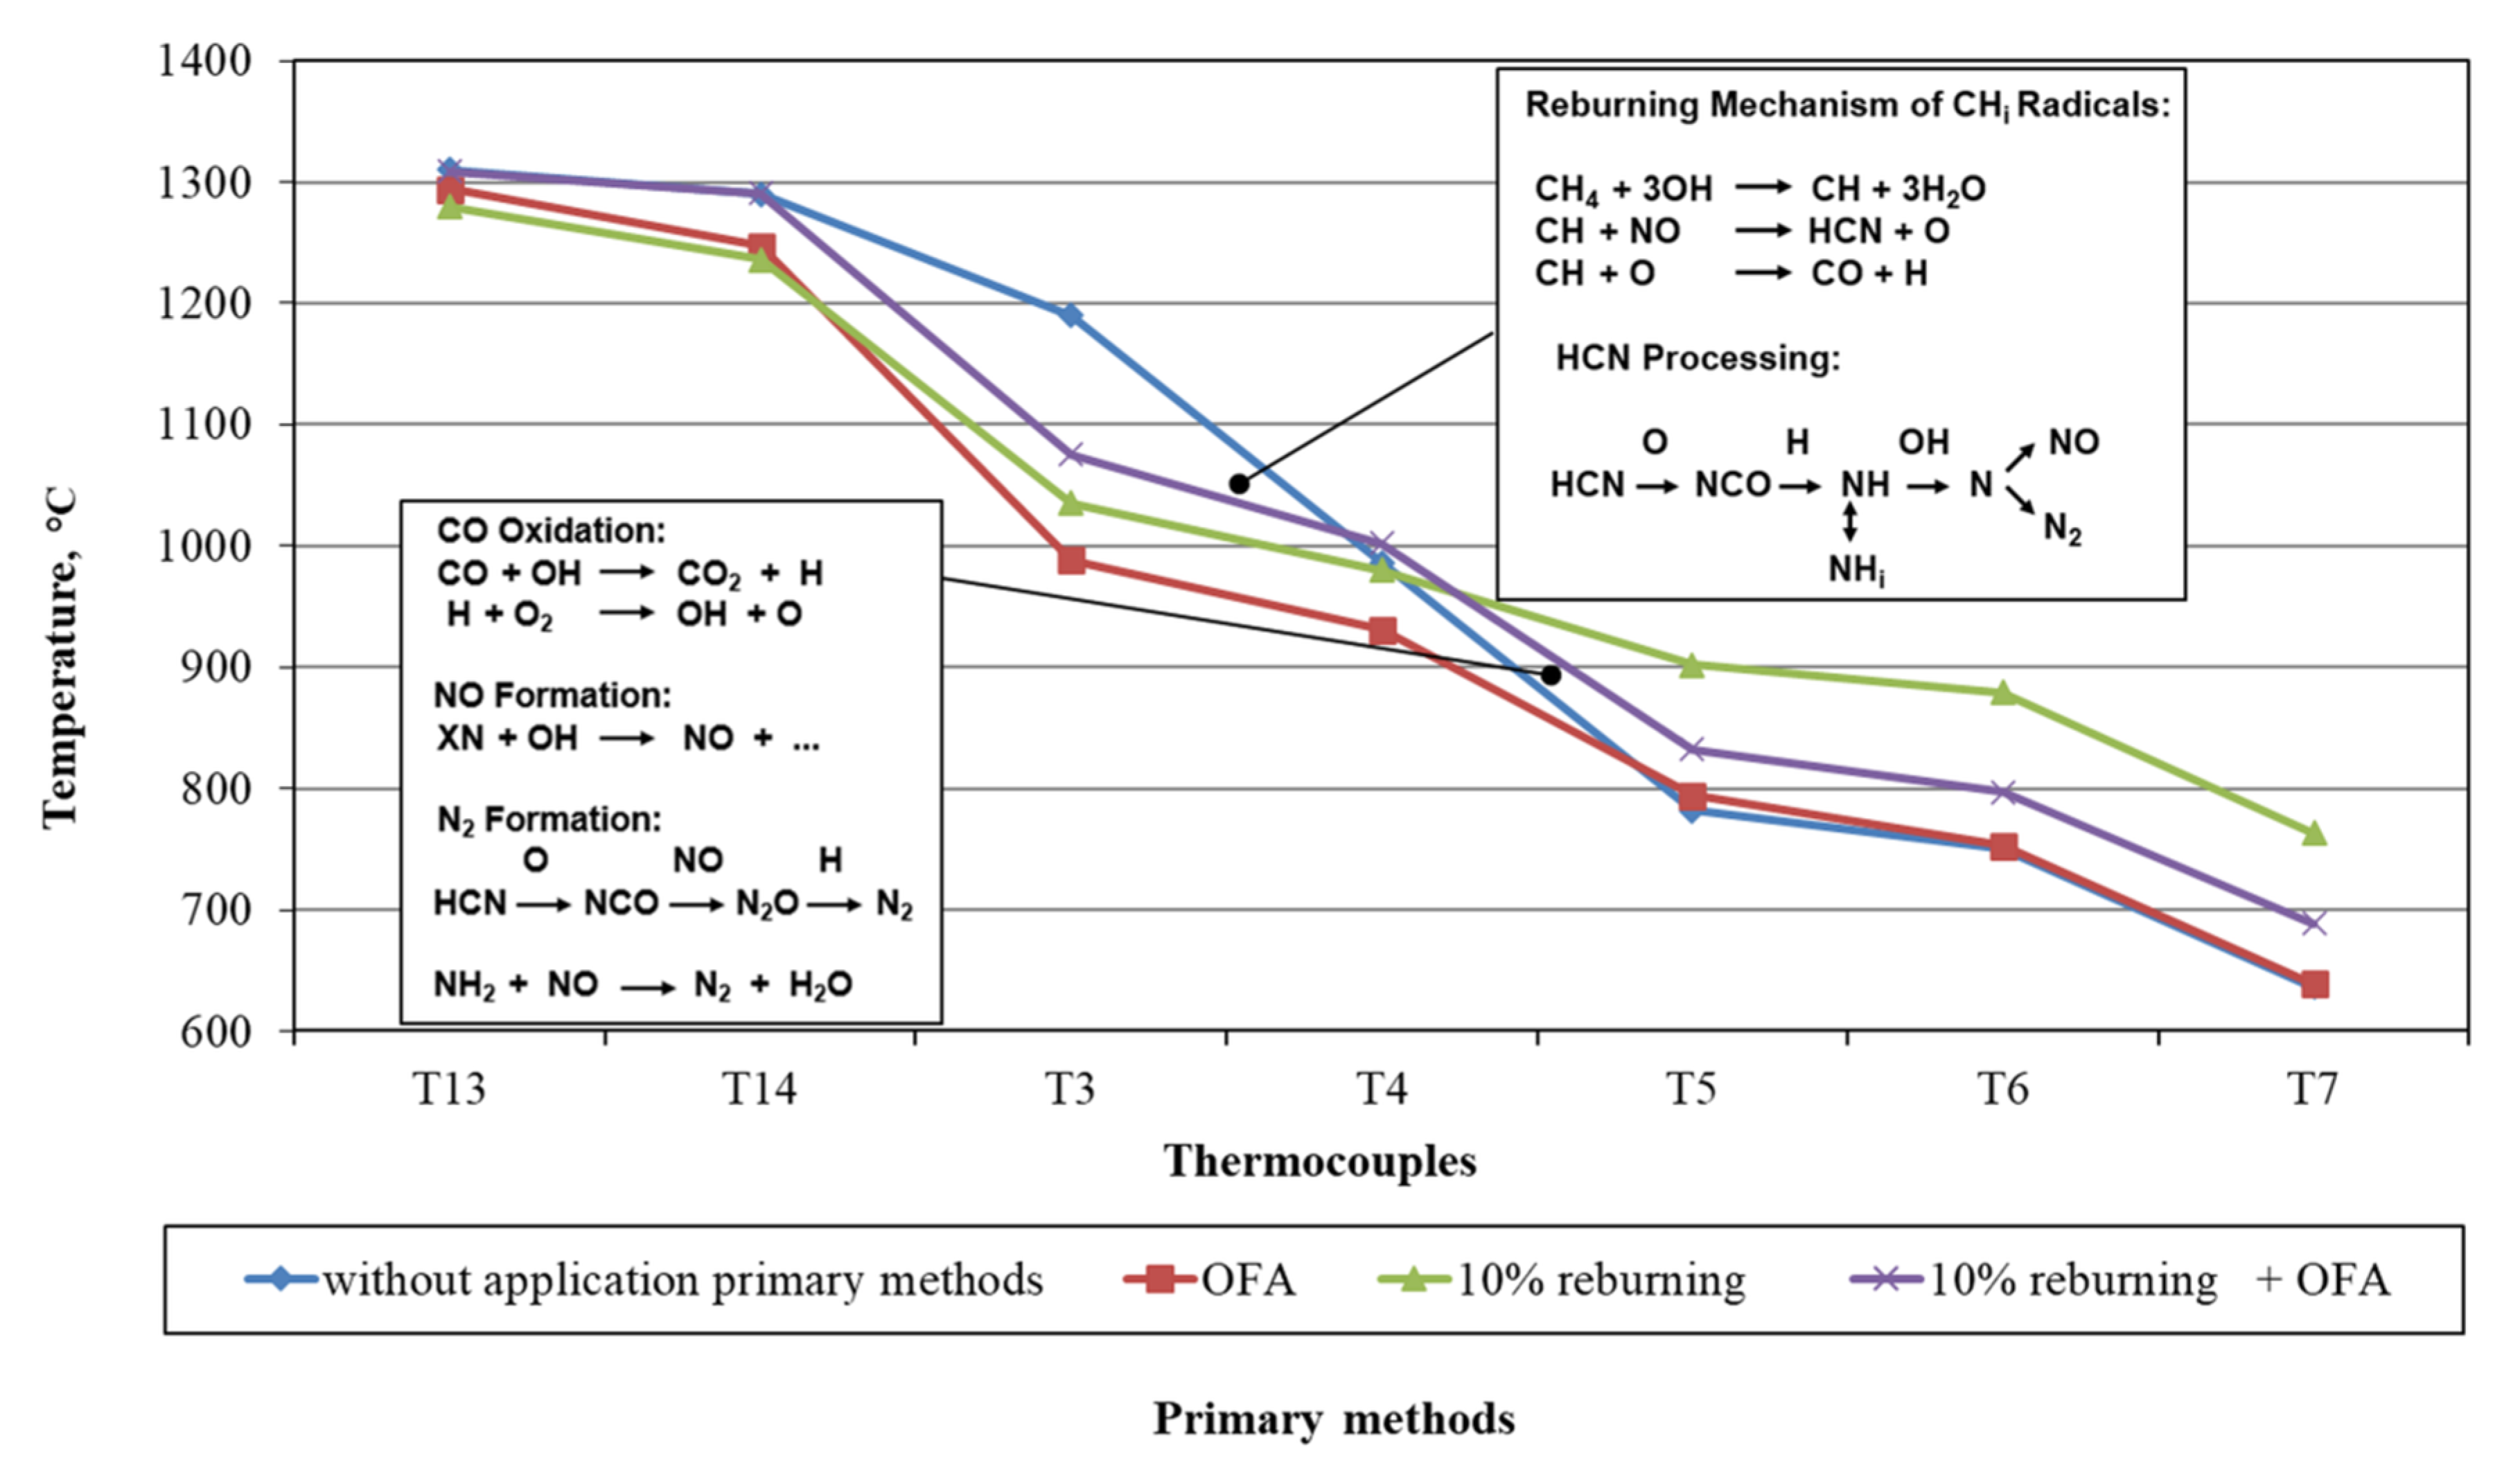
Figure 5 explains the reaction mechanisms leading to NOx and CO formation in individual temperature zones of the furnace and allows monitoring of temperature trends resulting from primary de-NOx methods application.
NOx generated in the main combustion zone (Figure 1 and Figure 5, between T13–T14) reacted with fuel remnants injected into the reburn zone (Figure 1 and Figure 5, between T3–T4), which reduced it to molecular nitrogen. Reburning chemistry involves fuel radicals, which reduce NO to N2 [32,46]. Reburning increases the flue-gas temperature from thermocouple T4 onwards, compared to OFA application or no de-NOx-method use.
The addition of overfire air completed combustion in the burn-out zone (Figure 1 and Figure 5, between T4–T5), but the reaction heat released by CO and hydrocarbon fragments was not enough to compensate for the cold, fresh air introduced, and as a result the flue-gas temperature decreased from T5 onwards, compared to the application of reburning alone.
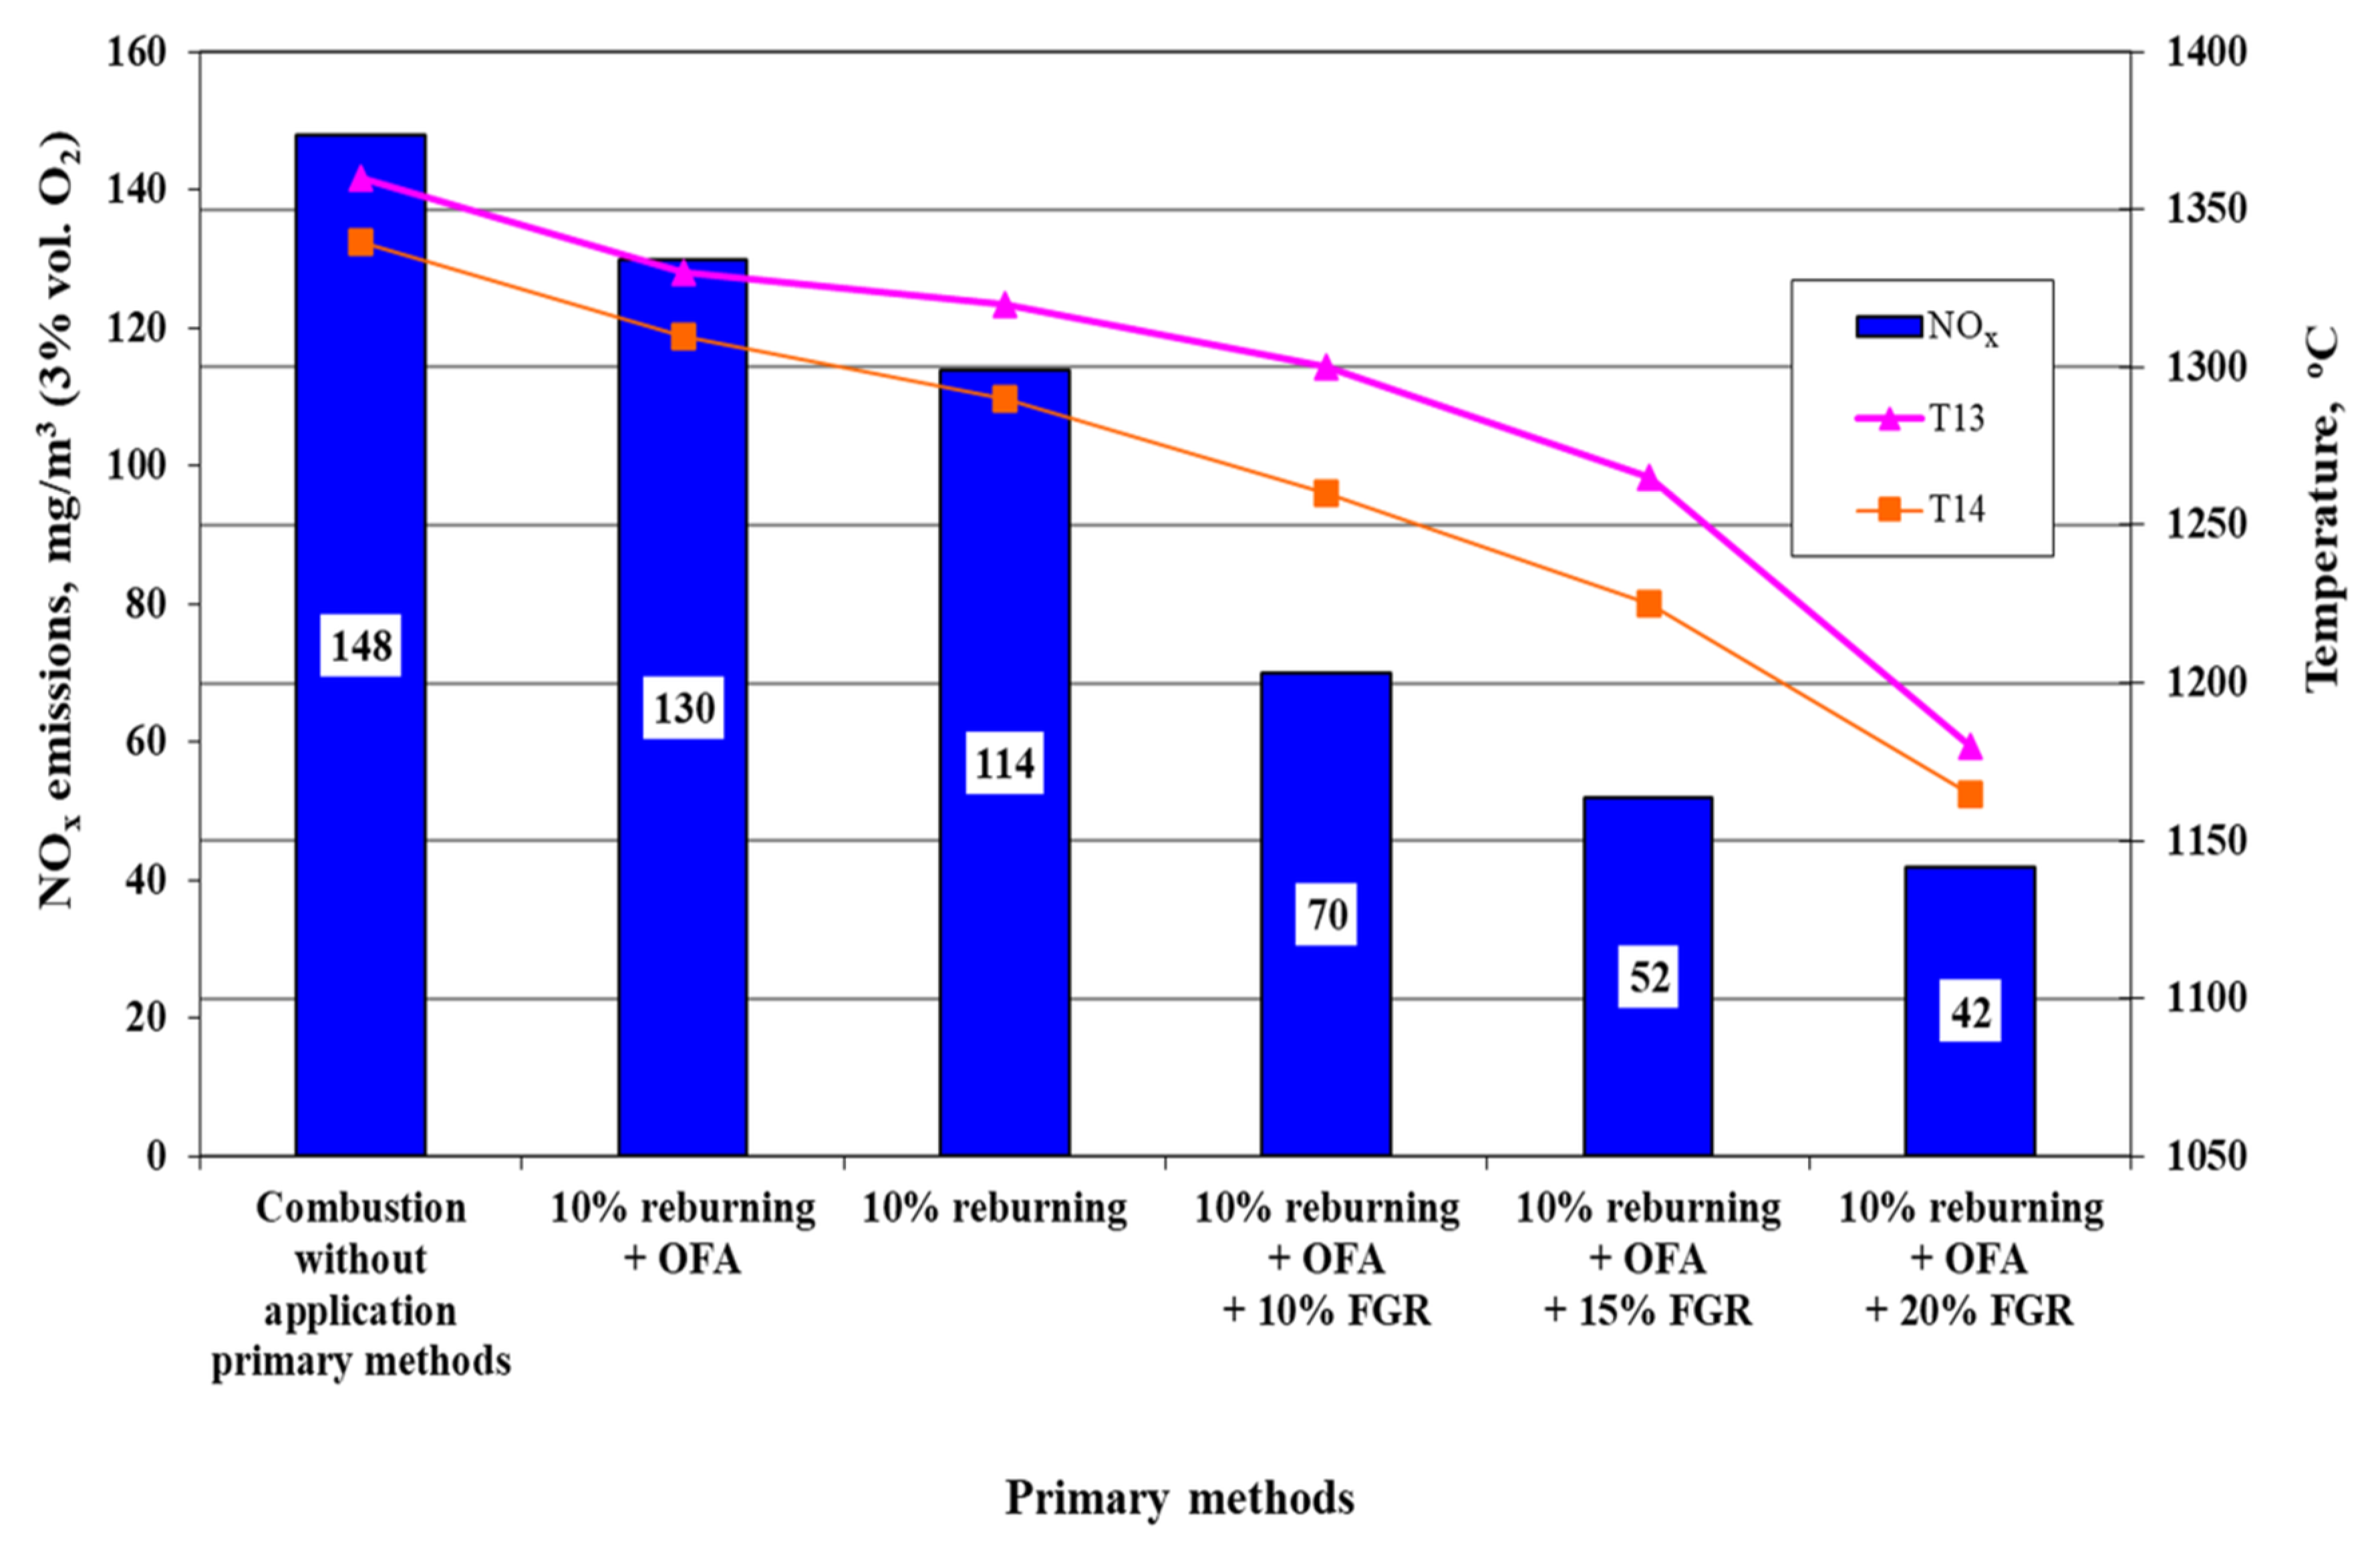
A similar series of measurements was conducted at natural gas thermal input Q = 1.8 m3/h and air excess coefficient m = 1.2, with the results shown in Figure 6 and Figure 7. A comparison of the data shown in Figure 2 and Figure 6 revealed that the latter combustor operation conditions generally yielded higher NOx emissions by around 75 to 100%, which is in accordance with current knowledge on nitrogen oxide formation in combustion processes. Considering the previous finding about FGR application effects, this method was combined with modest reburning (reburning ratio of 10%) and overfire air. Figure 6 documents that the combination of 10% reburning ratio, overfire air, and 10% FGR more than halved the NOx emissions compared to the situation without any primary de-NO
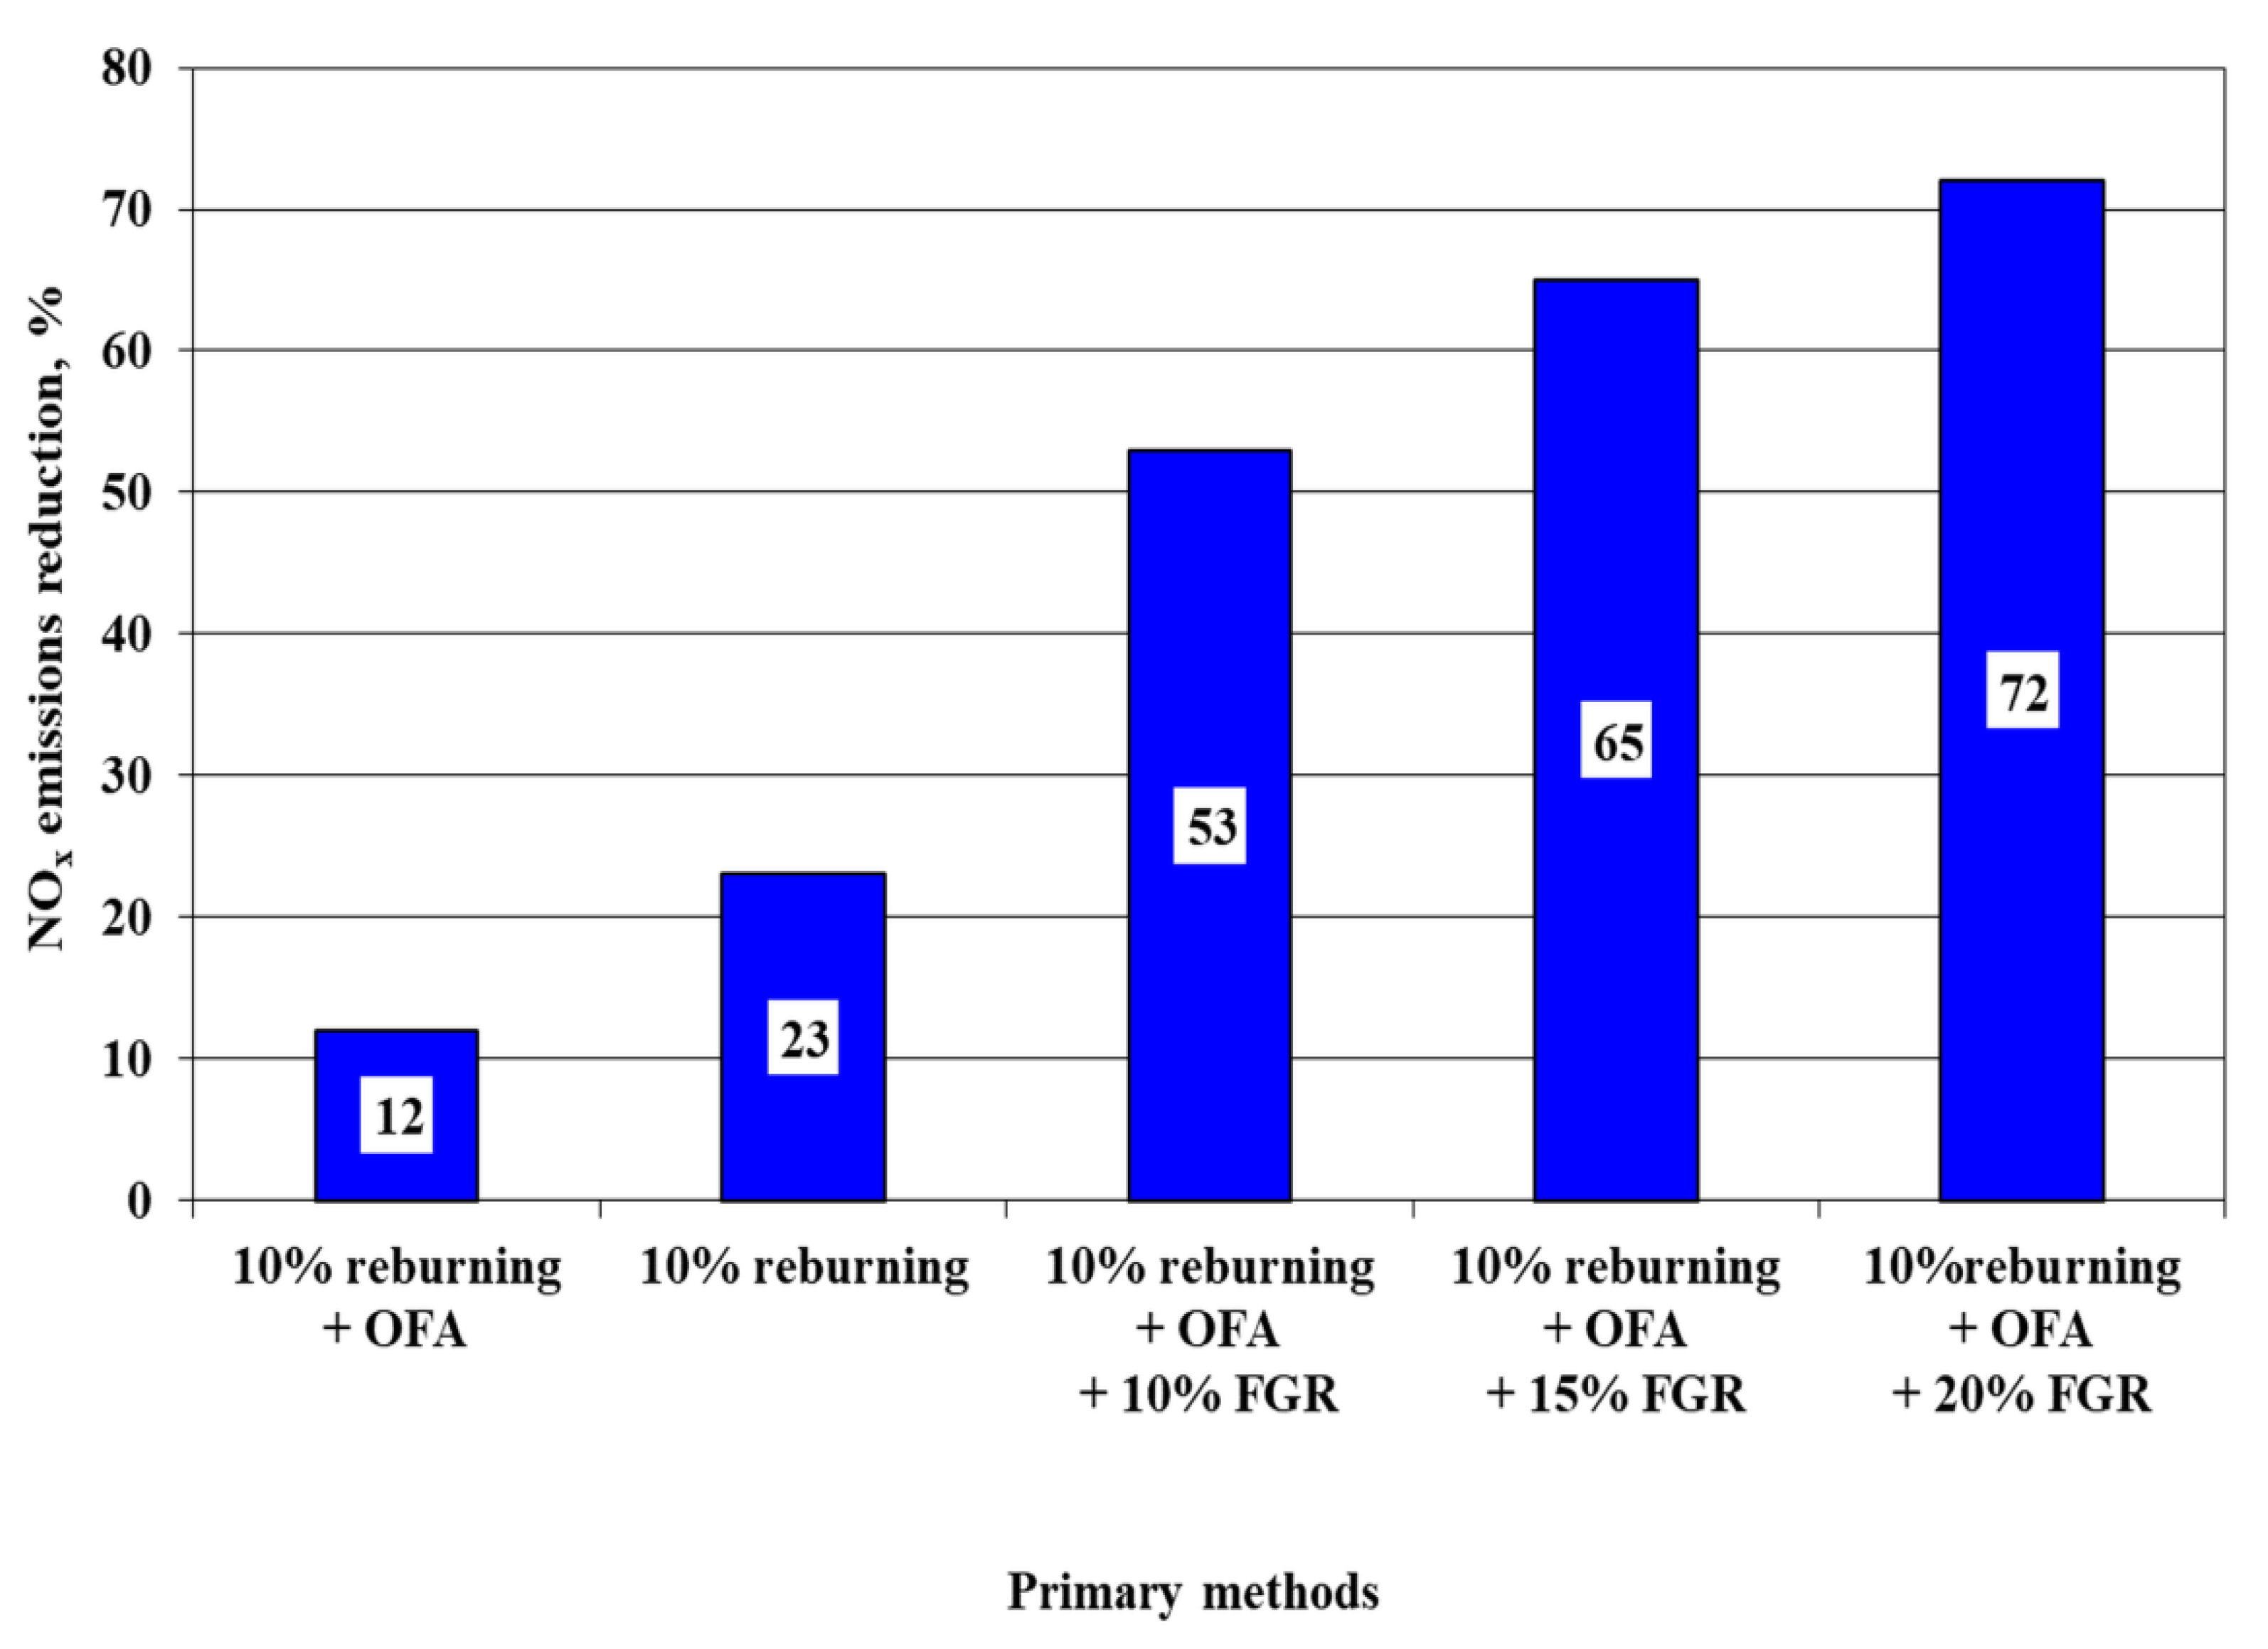
x method application. Further increases in denitrification efficiency can be followed in Figure 7 with increasing FGR, with the highest efficiency value of over 70% being reached at 20% FGR. In contrast to this, application of either modest reburning (reburning ratio of 10%) or overfire air or their combination did not lead to significant denitrification, and the same could be observed at a lower burner load and lower air excess coefficient—see Figure 2. In both situations the denitrification efficiencies reached below or around 20% maximally.
As Figure 6 further shows, denitrification efficiency is closely coupled with combustion temperature. The decrease in combustion temperature resulting from the application of primary denitrification methods hinders the formation of thermal NOx, which, together with the creation of a reductive environment, leads to effective nitrogen oxide emissions reduction. Test experiments aimed at verification of both temperature measurements’ stability and sensitivity to combustion conditions were performed and their results, shown in Appendix C, prove that temperature changes of around 10 °C and higher can be clearly recognized and attributed to process condition changes. This justifies the conclusions drawn from the analysis of the temperature data and their trends presented in Figure 5 and Figure 6.
It can be concluded that OFA application should be part of any combined primary de-NOx method, as it is able to reduce both NOx and CO contents in flue gas on its own, and when applied together with reburning and OFA it should ensure very efficient denitrification while still meeting the CO emission limits.

3.2. Propane–Butane Gas (PBG) Combustion Experiments

This section presents the results of primary de-NOx methods application during propane–butane gas combustion, carried out in parallel with our natural gas combustion experiments. The combustion conditions involved a range of total fuel input Q = 16 to 22 kW and overall air excess coefficient m = 1.1 and 1.2, respectively. Having found that flue-gas recirculation was the most efficient denitrification method in natural gas combustion experiments, it was applied as the sole de-NOx method in our PBG experiments as well.
Figure 8 provides a comparison of NOx emissions in PBG experiments as a result of different fuel input and air excess coefficient values, with no other denitrification method applied. As expected, and in line with our NG experiment results, increased fuel input and air excess coefficient led to an increase in emissions. Nitrogen oxide emissions values in our PBG experiments were around 20% higher than those observed in the NG experiments under identical conditions (i.e., Q = 1.5 m3/h and m = 1.1; Q = 1.8 m3/h and m = 1.2): compare Figure 2 and Figure 6.
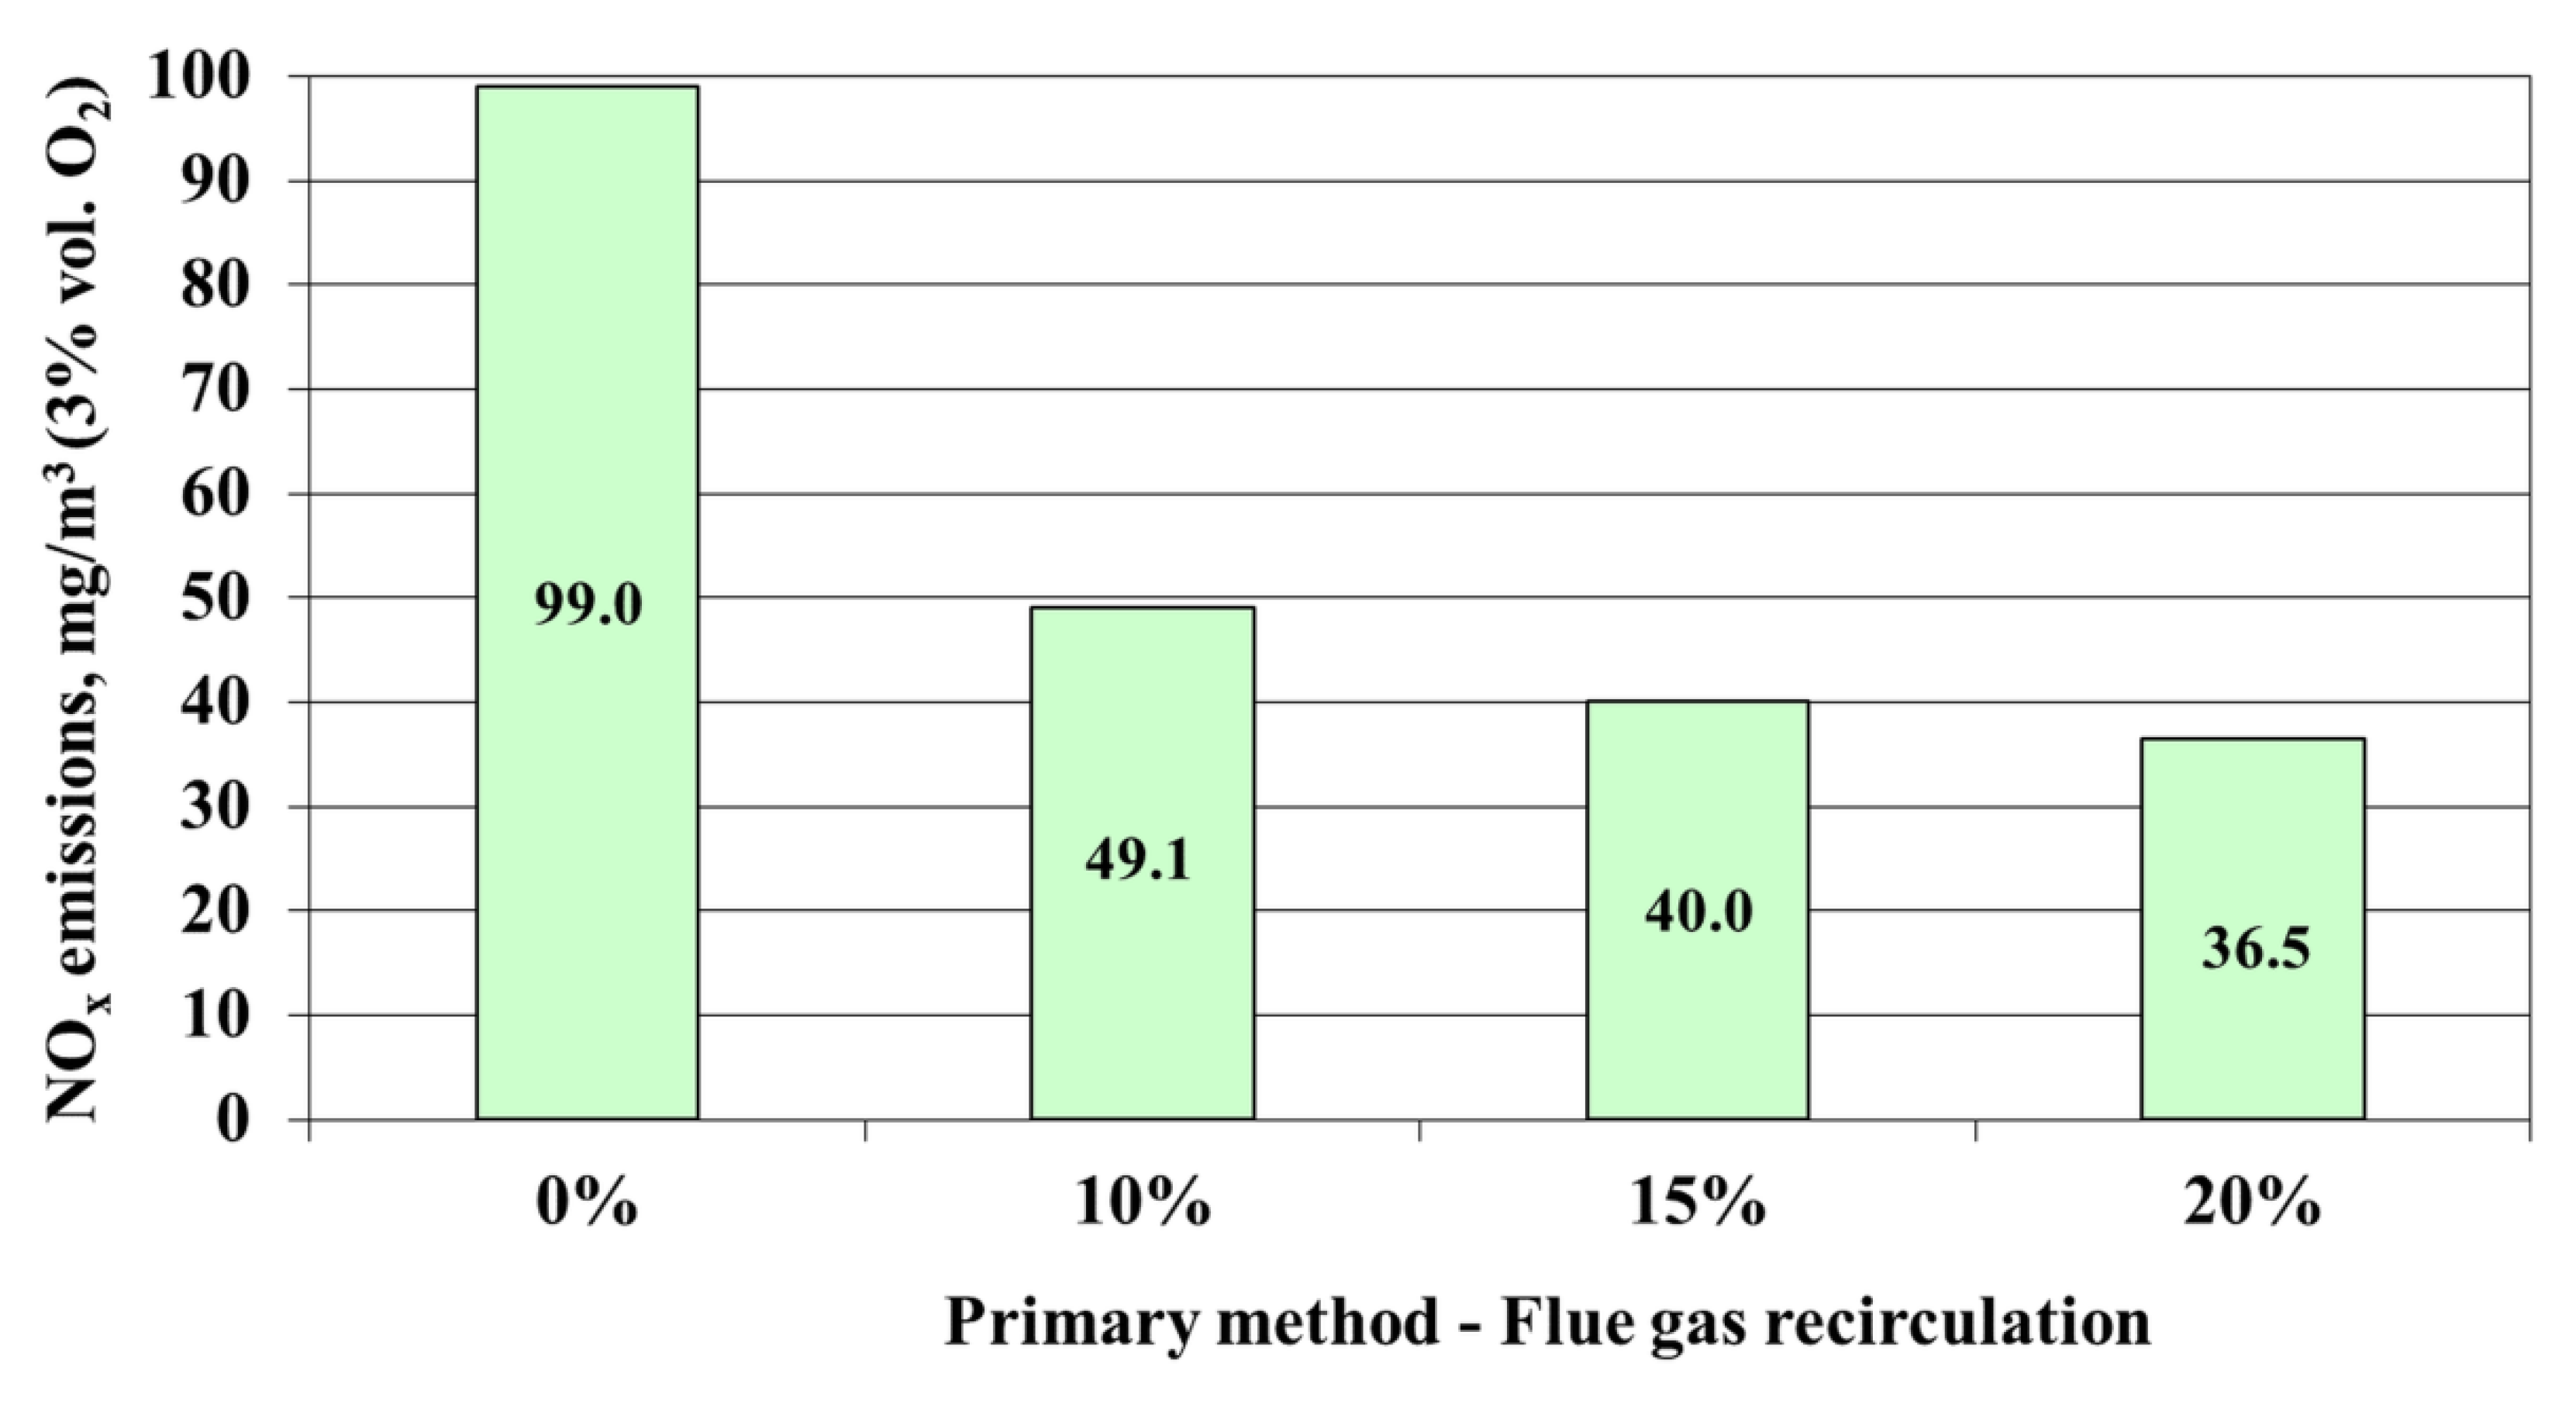
The impact of FGR application on NOx emissions reduction in PGB experiments at burner power input 16 kW and air excess coefficient m = 1.1 is shown in Figure 9. The obtained results are similar to those in our NG experiments, yielding an NOx content decrease with the introduction and increased share of flue-gas recirculation. Both Figure 3 and Figure 9 reveal that the application of 10% FGR decreased the NO
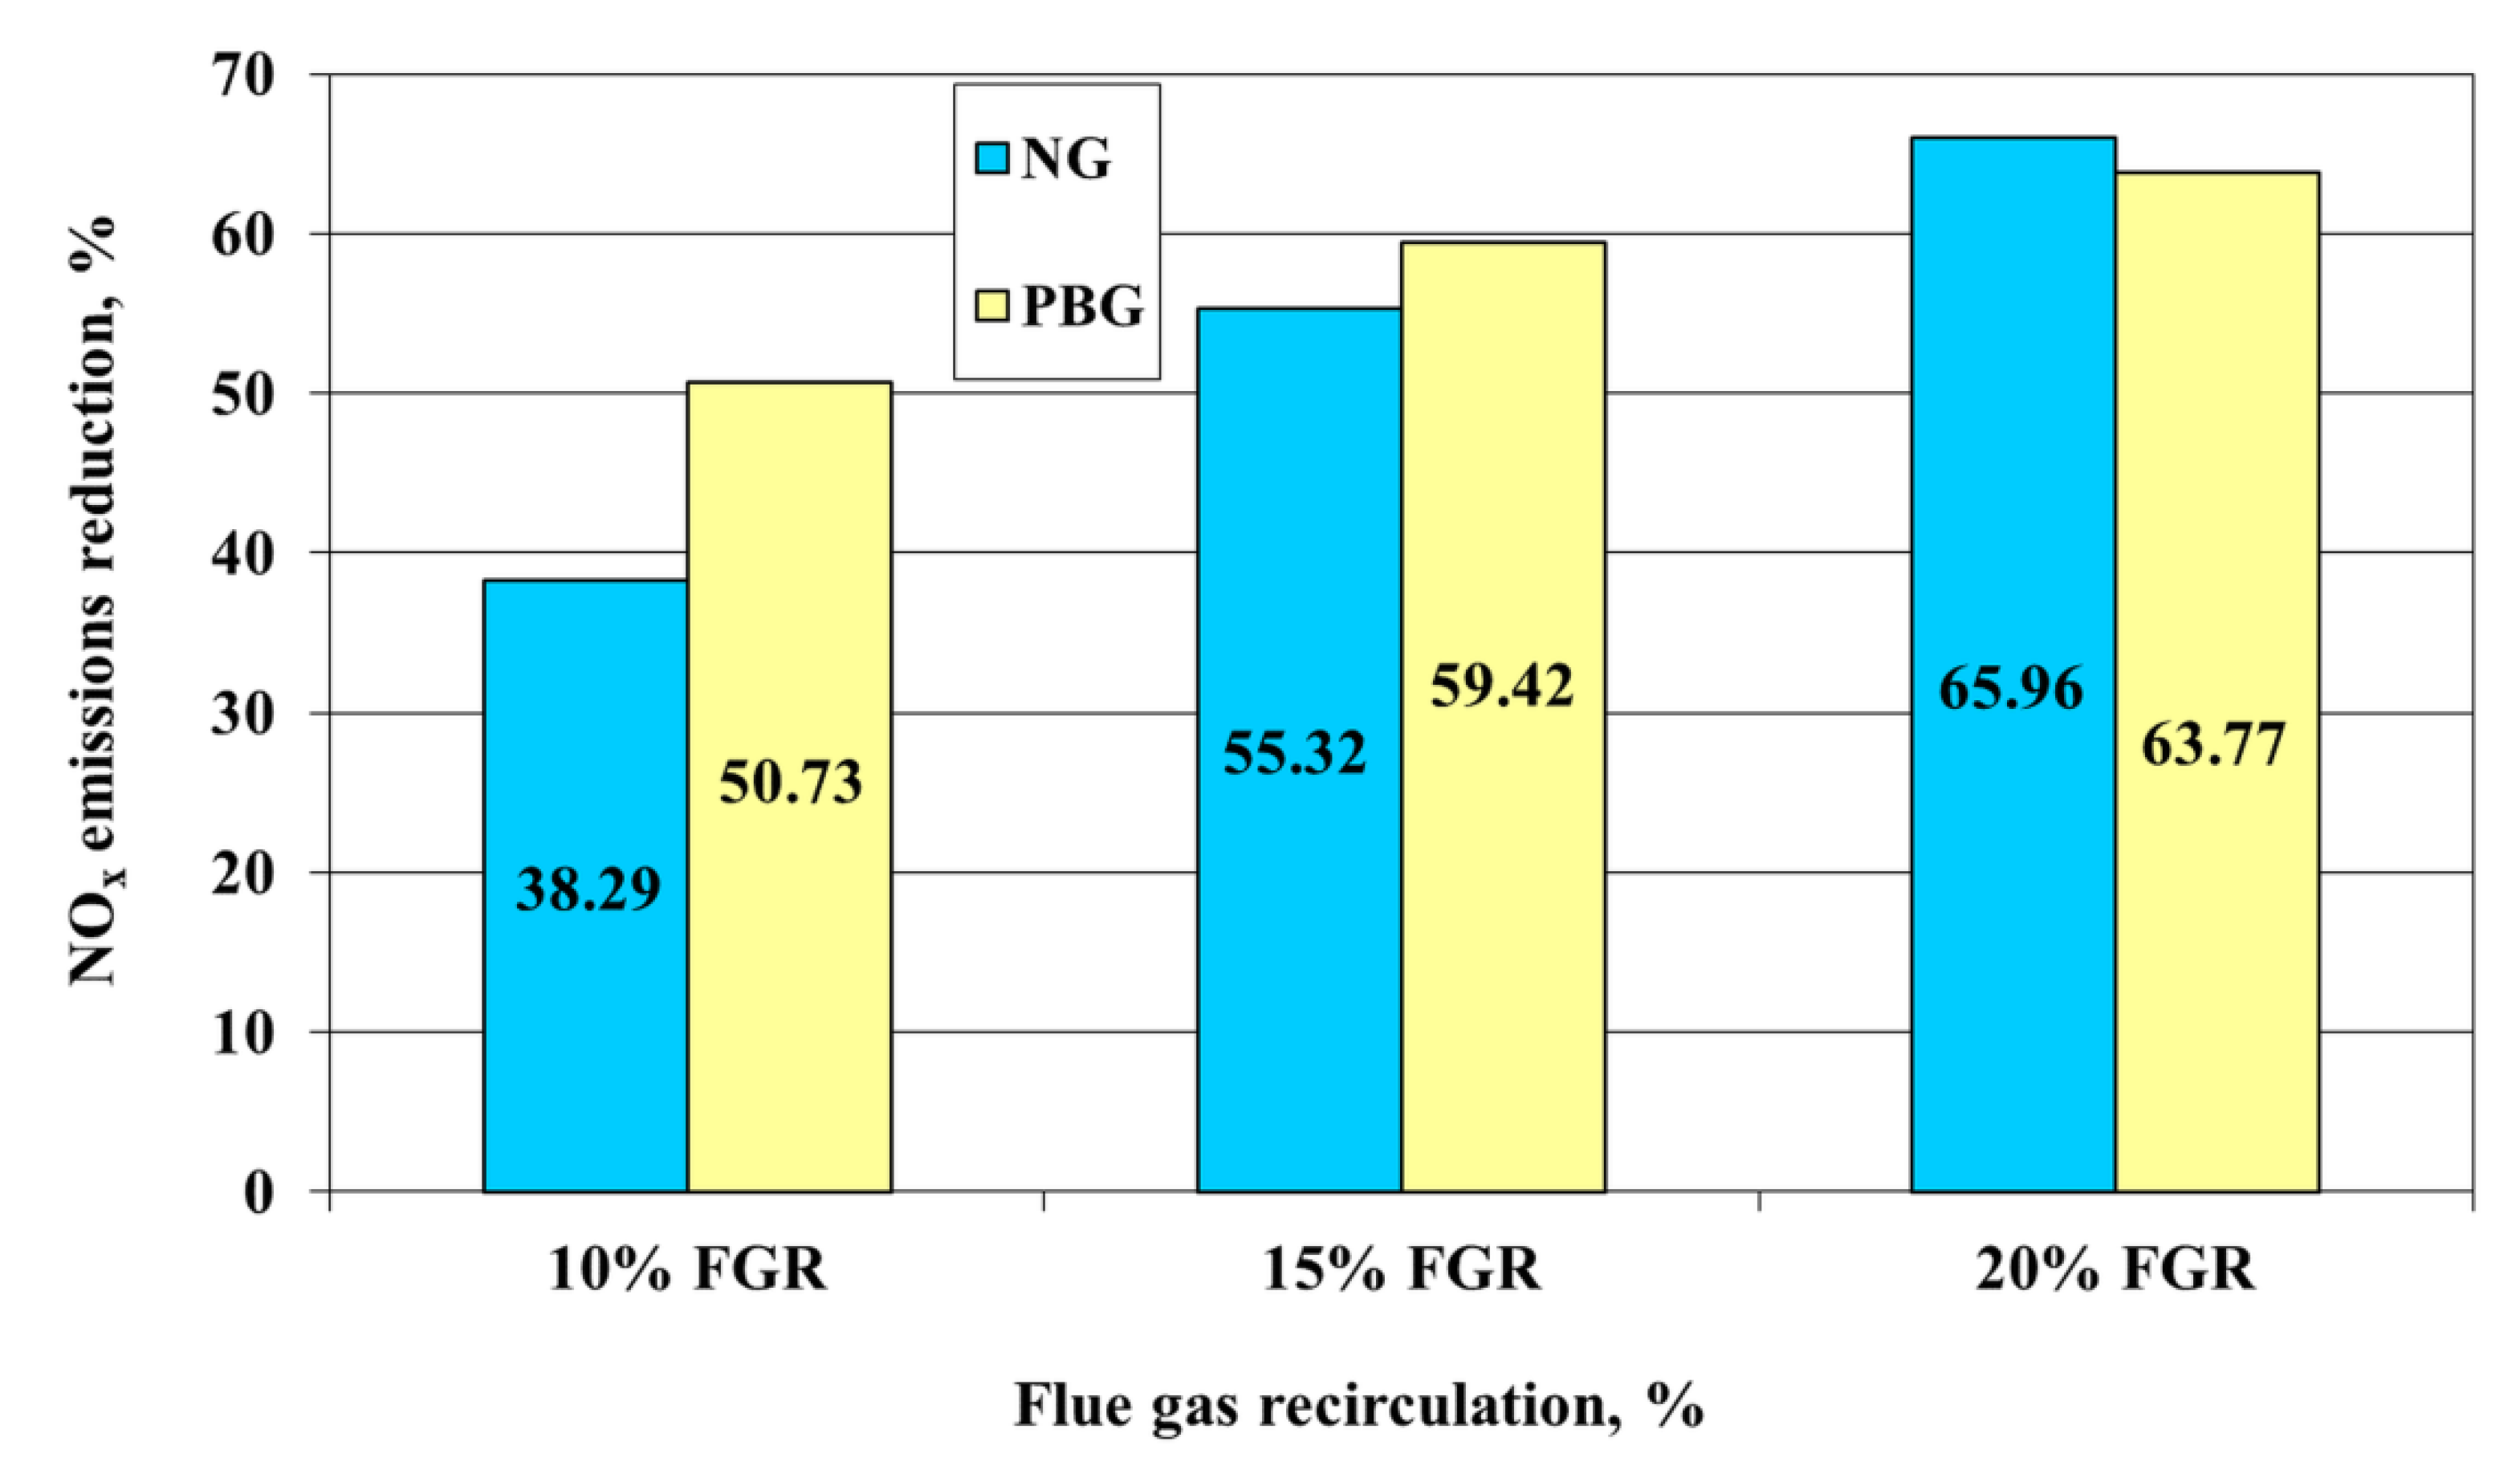
x emissions approximately by half, and a further emissions reduction was achieved with greater FGR increase. Denitrification efficiency of almost 65% was achieved at 20% FGR in our PBG experiments, which is somewhat lower than the almost 75% efficiency documented in the NG experiments under identical conditions.
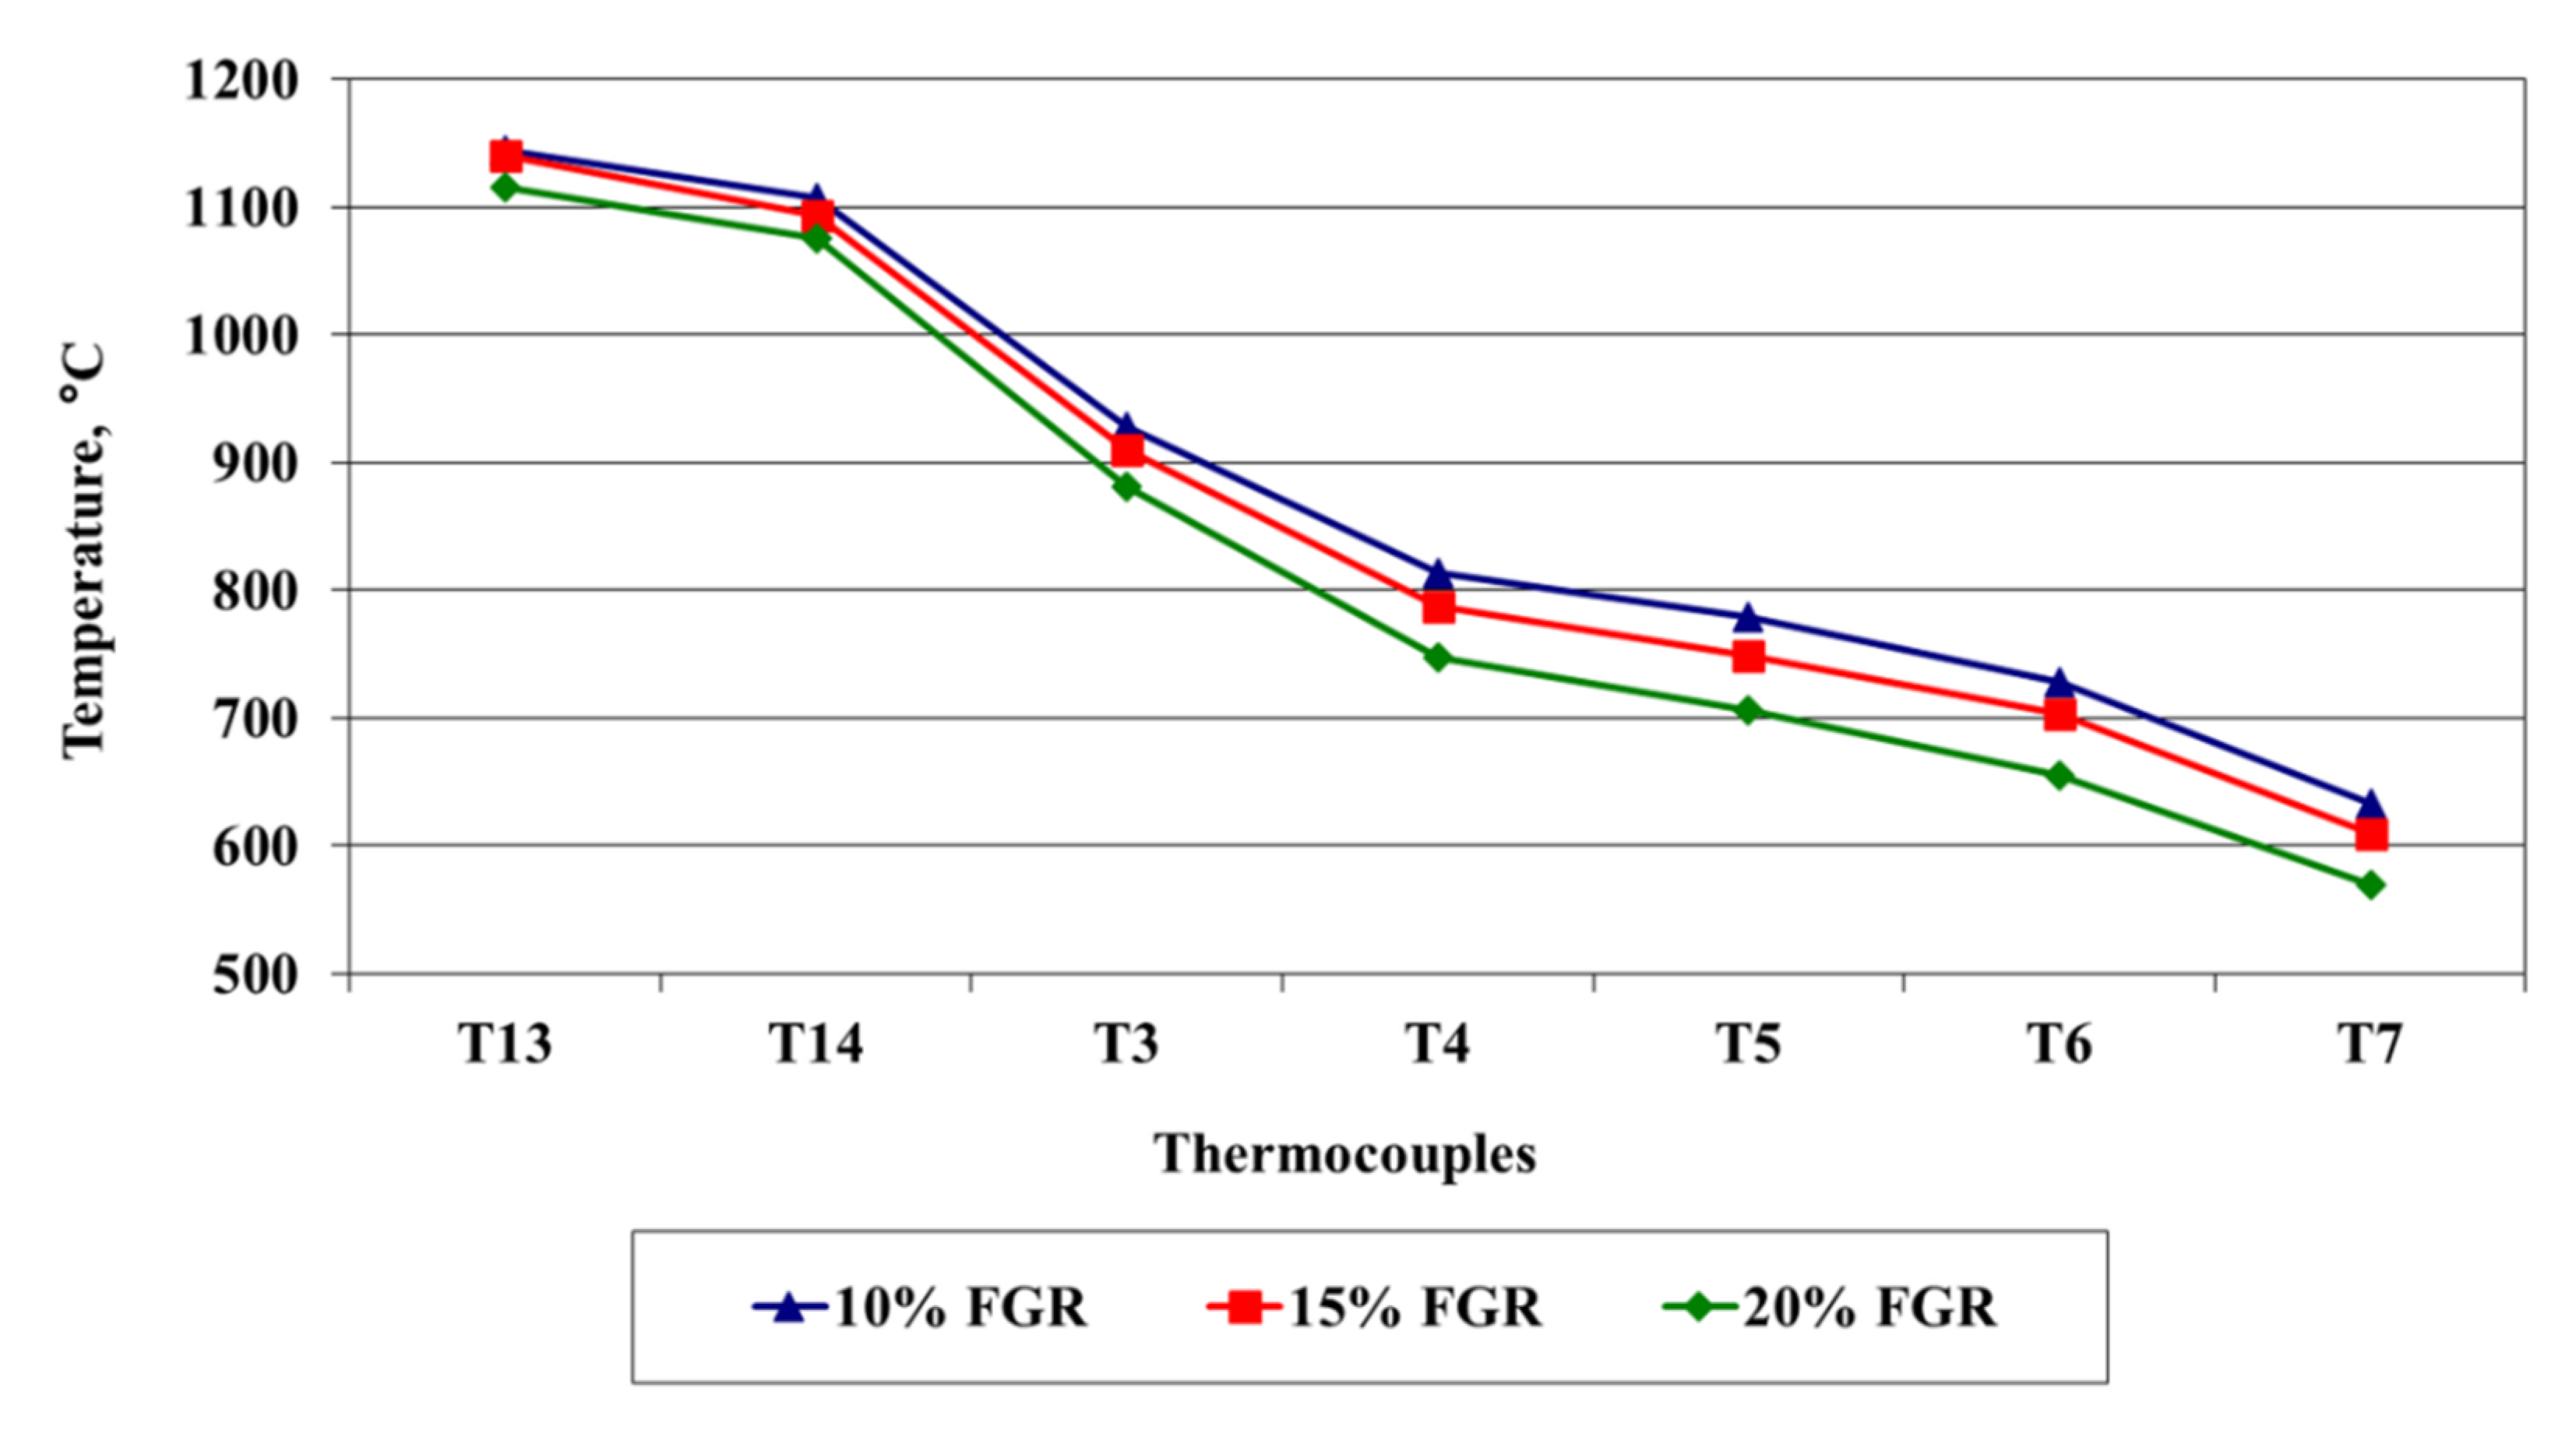
Similar to the NG experiments, denitrification was found to be closely related to flue-gas temperature in the PBG combustion chamber. Its values for 10%, 15%, and 20% FGR are provided in Figure 10. The more modest decrease in combustion temperature (thermocouples T13 and T14) of around 50 °C documented in Figure 10 resulting from an FGR increase from 10% to 20% is lower than the over 100 °C combustion temperature decrease shown in Figure 6 resulting from FGR increase in the same range in the NG experiments. This probably allows for a partial explanation of why the denitrification efficiency increase in our PBG experiments in the range of 10% to 20% FGR is lower than in the NG experiments.
For this reason, experiments with FGR application alone during both NG and PBG combustion are compared in Figure 11 in terms of calculated NOx emissions reduction efficiency.
The trend in nitrogen oxide emissions decrease with increasing FGR can be readily observed in both fuel-type experiments, while the previously commented steeper NOx emissions decrease in NG experiments is clearly confirmed. As a result of the NOx formation reaction mechanisms, the emissions were suppressed due not only to the lower combustion temperature but also to the lower oxygen partial pressure resulting from FGR implementation. The greater NOx emissions reductions observed in our PBG experiments compared to those in the NG experiments most probably resulted from slower combustion of PBG fuel and from its higher volumetric heating value. Higher PBG adiabatic flame temperature compared to NG can play a significant role in this respect too. It results from the observations above that combusted fuel type as well as combustion conditions play an important role in NOx formation and reduction processes. Combustion of PBG yields lower volumetric flow of recirculated flue gas compared to NG for the same burner heat input.

4. Discussion

Our experiments conducted with natural gas and PBG fuels allowed us to document several trends regarding nitrogen oxide and carbon monoxide contents in flue gas from a laboratory furnace:
  • Considering de-NOx methods applied individually (Figure 2 and Figure 3), FGR yielded the highest denitrification efficiencies of up to 74% (at 20% FGR), followed by reburning (61% at 25% reburning ratio), whereas OFA application resulted only in a modest 21% NOx concentration decrease. FGR appears to be the most promising method for decreasing NOx emissions, regardless of the type of gaseous fuel combusted (compare Figure 3 and Figure 9). A range of flue-gas denitrification efficiencies due to FGR implementation is reported in the literature, starting with up to 30% or up to 50% in burners equipped with internal flue-gas recirculation systems [38,39] and exceeding this in external recirculation systems [15]. Thus, it can be concluded that external flue-gas recirculation appears to be a more efficient de-NOx method, though it requires bigger intervention in boiler or furnace design than the mere implementation of burners with internal recirculation.
  • Combined application of de-NOx methods revealed negative synergic effects with OFA + 10% reburning, achieving a lower NOx concentration reduction than the application of OFA and 10% reburning individually (Figure 2 and Figure 6). In contrast, the available experimental and numerical studies [14,42] propose the reburning + OFA combination as a very effective means of flue-gas denitrification and report positive synergy effects. Combined application of 10% reburning + OFA + 20% FGR reduced the NOx content in flue gas by 72%, which is in line with de-NOx efficiencies of over 50% for combined method application reported in the available literature. For comparison, [43] used a combined OFA + FGR method in a 100 kW facility, combusting various gaseous and solid fuels, reaching up to 80% decrease in NO content in flue gas.
  • Increasing the burner load from 16 to 18 kW and the air excess coefficient from 1.1 to 1.2 resulted in 50% to 70% higher NOx emissions, regardless of whether NG or PBG was combusted (Figure 2, Figure 6 and Figure 8), with the air excess coefficient increase visibly playing the major role in NOx emissions increase, which is in line with the findings of the study by Dutka et al., 2016 [5]. However, denitrification efficiencies of individual methods and their combinations appeared to be only modestly affected by burner load and air excess coefficient in our experiments (Figure 2, Figure 3 and Figure 7).
  • FGR, as the most promising de-NOx method, was applied in our PBG combustion tests, achieving similar denitrification efficiency as in the NG combustion tests (Figure 11). However, denitrification efficiency increase with rising flue-gas recirculation was more pronounced in the case of NG combustion. This could be explained in terms of the far more pronounced temperature drop in the main combustion chamber (thermocouples T13, T14) observed in our NG combustion tests with rising flue-gas recirculation. Comparison of the respective temperature values in Figure 6 and Figure 10 reveals that temperature drops of over 100 °C could be documented for NG combustion compared to around only 50 °C for PBG combustion. This finding deserves more attention and further investigation in the future, as the relevant literature surveyed [43] suggests that similar trends should be obtained with similar gaseous reburning fuels.
  • FGR yielded a visible decrease in carbon monoxide emissions (Figure 4). A modest decrease in flue-gas CO content could be seen after OFA application as well; however, reburning produced a sharp, more than 12-fold increase in these emissions (1251 mg/m3) compared to that without any de-NOx method application (101 mg/m3). This could partly be resolved by combined reburning + OFA application, but the reburning fuel share should be limited to around 15% in order not to violate the CO emissions limit of 200 mg/m3. In contrast to this, [35] did not observe any significant effect of reburning application on CO emissions, despite similar experimental furnace heat input (65 kW vs. 16 to 22 kW in this study) and despite the same fuel being used both as the main and reburning fuel (NG). [44] performed experiments with various recirculated flue-gas introduction spots in an experimental heavy fuel oil-fired furnace, namely direct mixing with primary air, separate introduction after primary air supply, and separate introduction after secondary air supply. Compared to basic-case CO emissions of around 20 mg/m3, all reburning options produced an increase in CO emissions, compared to operation without FGR. The differences documented above allow us to conclude that CO formation and conversion to CO2 with primary de-NOx methods application is a complex phenomenon yielding very variable results even under seemingly similar experimental conditions. Further work on this topic needs to be done.

5. Conclusions

An experimental laboratory furnace setup was used to assess the trends and variations in nitrogen oxide and carbon monoxide emissions from natural gas and propane–butane gas combustion. Individual primary flue-gas denitrification methods as well as their combined use allowed us to identify the most efficient individual method (flue-gas recirculation) and the most efficient combination of methods (overfire air + reburning + flue-gas recirculation). The achieved denitrification efficiencies (close to 65% for propane–butane gas combustion or even over 70% for natural gas combustion) are promising and suggest that further research should be aimed at investigating the use of wood gasification gas as fuel in the test rig. Combined application of 10% reburning + OFA + 20% FGR reduced the flue gas’ NOx content by 72% in the studied furnace under the given combustion conditions. Considering the given conditions, the fuels combusted, and the furnace geometry, this combination can be recommended as the most efficient one for flue-gas denitrification.
Our carbon monoxide emissions results practically ruled out the application of reburning in the experimental setup, and this became even worse when CO-rich gas was combusted instead of natural gas. Flue-gas recirculation appears to be the most viable method that can readily be applied to different combustion designs and fuels used, as it exhibits both significant de-NOx and de-CO efficiency, although its application limits should be subject to more focused study.

Author Contributions

Conceptualization, L.L. and J.K.; methodology, L.L. and J.K.; validation, M.F. and G.J.; investigation, L.L. and P.L.; resources, M.R.; data curation, L.L and J.J.; writing—original draft preparation, L.L., M.V., and G.J.; writing—review and editing, M.V., J.J., and P.L.; visualization, P.L.; supervision, G.J.; funding acquisition, L.L., M.R., and M.F. All authors have read and agreed to the published version of the manuscript.

Funding

This work was financially supported by the Slovak Research and Development Agency, Grants No. APVV-16-0192 and APVV-18-0134 and by the Slovak Scientific Agency, Grant No. VEGA 1/0691/18.

Conflicts of Interest

The authors declare no conflict of interest. The funders had no role in the design of the study; in the collection, analyses, or interpretation of data; in the writing of the manuscript, or in the decision to publish the results.

List of Symbols and Abbreviations

Aanalyzer 
FGRflue-gas recirculation 
LNBlow NOx burner 
mair excess coefficient 
NGnatural gas 
NOxnitrogen oxides 
OFAoverfire air 
PBGpropane–butane gas 
Ptthermal power inputkW
ppressurePa
Qvolumetric flowm3/h
Ttemperature°C
Vthrottle valve 
Remissions reduction (%)
CWAPM nitrogen oxide emissions without application of primary methods 
CAPM nitrogen oxides emissions with application of primary methods 
maxmaximum 
minminimum 
statstatic (pressure) 
totaltotal (pressure) 

Appendix A

Table A1 and Table A2 provide information about the NOx and CO measurement method for the Testo 350 analyzer (A2 analyzer) as stated by the manufacturer [47]. Likewise, Table A3 shows information relating to the Testo 325 (A3 analyzer) measurement method and error range as stated by the manufacturer [48].
Table A1. Nitrogen oxide measurement method and measurement error range stated by Testo 350 analyzer series manufacturer [47].
Testo 350 M and Testo 350 XL
 NONO2
Measurement methodElectrochemical sensorElectrochemical sensor
Metering range0 to 3000 ppm0 to 500 ppm
Measurement error range0 to 99.9 ppm±5 ppm0 to 99.9 ppm±5 ppm
100 to 1999.9 ppm±5% of measured value100 to 500 ppm±5% of measured value
2000 to 3000 ppm±10% of measured value-
Depiction accuracy1 ppm0.1 ppm
Table A2. Carbon monoxide measurement method and measurement error range stated by Testo 350 analyzer series manufacturer [47].
Testo 350 M and Testo 350 XL
 CO
Measurement methodElectrochemical sensor
Metering range0 to 10,000 ppm
Measurement error range0 to 199 ppm±10 ppm
200 to 2000 ppm±5% of measured value
2001 to 10,000 ppm±10% of measured value
Depiction accuracy1 ppm
Table A3. Measurement method and measurement error range stated by Testo 325-I analyzer manufacturer [48].
Testo 325-I
 NOCO
Measurement methodElectrochemical sensorElectrochemical sensor
Metering range0–1000 ppm0–2000 ppm
Measurement error range0 to 400 ppm<20 ppm0 to 400 ppm<20 ppm
>200 ppm<±5% of measured value>400 ppm<±5% of measured value
Depiction accuracy1 ppm1 ppm

Appendix B

After primary burner ignition, the desired fuel volumetric flow and air excess coefficient were set for combustion without any primary denitrification method application. Afterwards, stable combustion conditions, a stable temperature profile, and stable oxygen concentration in the flue gas were reached, which took, depending on initial conditions, up to several hours. On reaching the stationary state, values of NO, NO2, O2, and CO concentrations measured by the analyzers and temperatures indicated by all thermocouples were recorded pointwise at five-minute intervals. Temperature readings were continuously recorded by the Comet data unit.
After all process parameter readings were done, additional air was introduced in the OFA zone (see Figure 1) so as to reach a constant final air excess coefficient (m = 1.1 or 1.2) in the place where analyzer A2 was located. After reaching stationary conditions (see the previous paragraph), readings of gas concentrations and temperatures were recorded periodically within 30 to 45 min of stable furnace operation at five-minute intervals.
In the FGR experiments, the evaluated process parameters included the amount of recirculated flue gas (10 to 20%), air excess coefficient, combustion temperature, and fuel volumetric flow. Various fuel volumetric flows were used in the experiments. The recirculation rate was estimated from the oxygen material balance setup using the data on the oxygen concentration (Analyzers A1,2) and on fuel and combustion air volumetric flows. Starting with zero FGR, flue-gas recirculation was introduced until the desired oxygen content in the air–flue gas mixture was reached. It was kept constant during the given measurement, which ensured a constant flue-gas recirculation rate. Flue-gas recirculation rate was increased afterwards until a new value of oxygen content in the air–flue gas mixture was reached, and the measurement was repeated.
When using the reburning method, the reburning fuel was introduced in the middle part of the flue-gas duct (see Figure 1) with its amount ranging between 10 to 25% of total fuel combusted (the sum of primary and reburning fuel), while the amount of total fuel combusted was kept constant.
Nitrogen oxide and carbon monoxide values shown and discussed in the manuscript are average concentration values obtained from individual measurements for the given fuel consumption and air excess coefficient.

Appendix C

Figure A1 and Figure A2 show the time courses of measured temperature values in the furnace during test experiments. Test experiments were aimed at verifying sufficient stability of temperature measurements during stable furnace operation as well as their sufficient sensitivity to the changes of combustion conditions.
Figure A1. Measured flue-gas temperatures through the furnace during test experiments involving fuel input Q = 1.6 m3/h1 and air excess coefficient m = 1.1 with varying reburning ratio. Stable operation states as indicated in the Figure: 1 = without any primary method applied; 2 = reburning share of 25%; 3 = reburning share of 20%; 4 = reburning share of 35%.
Processes 08 00940 g0a1
As can be recognized from both Figure A1 and Figure A2, temperatures measured by individual thermocouples vary within a few °C during steady operation of the furnace. Contrary to that, changes of temperatures measured by thermocouples T6 and T7, resulting from performed step changes of reburning share, are clearly recognizable. Moreover, well-defined individual temperature plateaus corresponding to stable operation of the furnace with different reburning shares can be seen as well. The results of preliminary experiments proved that the temperature measurements were both sufficiently stable and sensitive to the changes of the operation conditions.
Figure A2. Measured flue-gas temperatures through the furnace during test experiments involving fuel input Q = 1.8 m3/h and air excess coefficient m = 1.1 with varying reburning ratio. Stable operation states as indicated in the Figure: 1 = reburning share of 20%; 2 = reburning share of 25%; 3 = reburning share of 35%.
Processes 08 00940 g0a2

References

  1. Munawer, M.E. Human health and environmental impacts of coal combustion and post-combustion wastes. J. Sustain. Min. 2018, 17, 87–96. [Google Scholar] [CrossRef]
  2. Lin, F.; Wang, Z.; Zhang, Z.; He, Y.; Zhu, Y.; Shao, J.; Yuan, D.; Chen, G.; Cen, K. Flue gas treatment with ozone oxidation: An overview on NO, organic pollutants, and mercury. Chem. Eng. J. 2020, 382, 123030. [Google Scholar] [CrossRef]
  3. Mohan, S.; Dinesha, P.; Kumar, P. NOx reduction behaviour in copper zeolite catalysts for ammonia SCR systems: A review. Chem. Eng. J. 2020, 384, 123253. [Google Scholar] [CrossRef]
  4. Gholami, F.; Tomas, M.; Gholami, Z.; Vakili, M. Technologies for the nitrogen oxides reduction from flue gas: A review. Sci. Total Environ. 2020, 714, 136712. [Google Scholar] [CrossRef] [PubMed]
  5. Dutka, M.; Ditaranto, M.; Løvås, T. NOx emissions and turbulent flow field in a partially premixed bluff body burner with CH4 and H2 fuels. Int. J. Hydrog. Energy 2016, 41, 12397–12410. [Google Scholar] [CrossRef]
  6. Arun, S.; Raghuram, S.; Sreenivasan, R.; Raghavan, V. Effect of hydrogen addition in the co-flow of a methane diffusion flame in reducing nitric oxide emissions. Int. J. Hydrog. Energy 2012, 37, 19198–19209. [Google Scholar] [CrossRef]
  7. Bělohradský, P.; Skryja, P.; Hudák, I. Experimental study on the influence of oxygen content in the combustion air on the combustion characteristics. Energy 2014, 75, 116–126. [Google Scholar] [CrossRef]
  8. Habib, M.A.; Elshafei, M.; Dajani, M. Influence of combustion parameters on NOx production in an industrial boiler. Comput. Fluids 2008, 37, 12–23. [Google Scholar] [CrossRef]
  9. Liu, Y.; Zhang, X.; Ding, J. Chemical effect of NO on CH4 oxidation during combustion in O2/NO environments. Chem. Phys. Lett. 2019, 727, 59–65. [Google Scholar] [CrossRef]
  10. Cozzi, F.; Coghe, A. Effect of air staging on a coaxial swirled natural gas flame. Exp. Therm. Fluid Sci. 2012, 43, 32–39. [Google Scholar] [CrossRef]
  11. Fan, W.; Chen, J.; Feng, Z.; Wu, X.; Liu, S. Effects of reburning fuel characteristics on NOx emission during pulverized coal combustion and comparison with air-staged combustion. Fuel 2020, 265, 117007. [Google Scholar] [CrossRef]
  12. Smoot, L.D.; Hill, S.C.; Xu, H. NOx control through reburning. Prog. Energy Combust. Sci. 1998, 24, 385–408. [Google Scholar] [CrossRef]
  13. Chen, S.; Xing, Y.; Li, A. CFD investigation on Low-NOx strategy of folded flame pattern based on fuel-staging natural gas burner. Appl. Therm. Eng. 2017, 112, 1487–1496. [Google Scholar] [CrossRef]
  14. Motyl, P.; Łach, J. Computational Modelling of Retrofitting a Coal Fired Boiler Type OP-230 for Predicting NOx Reduction. J. Therm. Sci. 2018, 27, 433–439. [Google Scholar] [CrossRef]
  15. Gamrat, S.; Poraj, J.; Bodys, J.; Smolka, J.; Adamczyk, W. Influence of external flue gas recirculation on gas combustion in a coke oven heating system. Fuel Process. Technol. 2016, 152, 430–437. [Google Scholar] [CrossRef]
  16. Pawlak-Kruczek, H.; Ostrycharczyk, M.; Czerep, M.; Baranowski, M.; Zgóra, J. Examinations of the process of hard coal and biomass blend combustion in OEA (oxygen enriched atmosphere). Energy 2015, 92, 40–46. [Google Scholar] [CrossRef]
  17. Duan, L.; Duan, Y.; Zhao, C.; Anthony, E.J. NO emission during co-firing coal and biomass in an oxy-fuel circulating fluidized bed combustor. Fuel 2015, 150, 8–13. [Google Scholar] [CrossRef]
  18. Varol, M.; Symonds, R.; Anthony, E.J.; Lu, D.; Jia, L.; Tan, Y. Emissions from co-firing lignite and biomass in an oxy-fired CFBC. Fuel Proces. Technol. 2018, 173, 126–133. [Google Scholar] [CrossRef] [Green Version]
  19. Liu, Q.; Shi, Y.; Zhong, W.; Yu, A. Co-firing of coal and biomass in oxy-fuel fluidized bed for CO2 capture: A review of recent advances. Chin. J. Chem. Eng. 2019, 27, 2261–2272. [Google Scholar] [CrossRef]
  20. Šlančiauskas, A.; Striūgas, N. Various compositions of burner gas fuel and air streams for lower CO and NOx yield. Int. J. Heat Mass Transf. 2012, 55, 5609–5615. [Google Scholar] [CrossRef]
  21. Korpela, T.; Kumpulainen, P.; Majanne, Y.; Häyrinen, A.; Lautala, P. Indirect NOx emissions monitoring in natural gas fired boilers. Control Eng. Pract. 2017, 65, 11–25. [Google Scholar] [CrossRef]
  22. Bilbao, R.; Alzueta, M.U.; Millera, A.; Cantín, V. Experimental study and modelling of the burnout zone in the natural gas reburning process. Chem. Eng. Sci. 1995, 50, 2579–2587. [Google Scholar] [CrossRef]
  23. Lukáč, L.; Suchý, T.; Doliňáková, A. Analýza vplyvu aplikácie primárnych metód na znižovanie emisií NOx. (Analysis of primary methods application influence on NOx emissions lowering; in Slovak). Acta Metall. Slovaca 2005, 11, 199–204. [Google Scholar]
  24. Elbaz, A.M.; Moneib, H.A.; Shebil, K.M.; Roberts, W.L. Low NOx—LPG staged combustion double swirl flames. Renew. Energy 2019, 138, 303–315. [Google Scholar] [CrossRef]
  25. Hesselmann, G.J. Optimization of combustion by fuel testing in a NOx reduction test facility. Fuel 1997, 76, 1269–1275. [Google Scholar] [CrossRef]
  26. Lukáč, L.; Holoubek, D. Využitie primárnych deNOx metód v uhoľných kotloch. (Use of primary deNOx methods in coal boilers; in Slovak). Acta Metall. Slovaca 2002, 8, 109–117. [Google Scholar]
  27. Sung, Y.; Lee, S.; Kim, C.; Jun, D.; Moon, C.; Choi, G.; Kim, D. Synergistic effect of co-firing woody biomass with coal on NOx reduction and burnout during air-staged combustion. Exp. Therm. Fluid Sci. 2016, 71, 114–125. [Google Scholar] [CrossRef]
  28. Liang, Z.; Chen, H.; Zhao, B.; Jia, J.; Cheng, K. Synergetic effects of firing gases/coal blends and adopting deep air staging on combustion characteristics. Appl. Energy 2018, 228, 499–511. [Google Scholar] [CrossRef]
  29. Bilbao, R.; Millera, A.; Alzueta, M.U.; Prada, L. Evaluation of the use of different hydrocarbon fuels for gas reburning. Fuel 1997, 76, 1401–1407. [Google Scholar] [CrossRef]
  30. Harding, N.S.; Adams, B.R. Biomass as a reburning fuel: A specialized cofiring application. Biomass Bioenergy 2000, 19, 429–445. [Google Scholar] [CrossRef]
  31. Kicherer, A.; Spliethoff, H.; Maier, H.; Hein, K.R.G. The effect of different reburning fuels on NOx reduction. Fuel 1994, 73, 1443–1446. [Google Scholar] [CrossRef]
  32. Smart, J.P.; Morgan, D.J. The effectiveness of multi-fuel reburning in an internally fuel-staged burner for NOx reduction. Fuel 1994, 73, 1437–1442. [Google Scholar] [CrossRef]
  33. Su, S.; Xiang, J.; Sun, L.; Hu, S.; Zhang, Z.; Zhu, J. Application of gaseous fuel reburning for controlling nitric oxide emissions in boilers. Fuel Process. Technol. 2009, 90, 396–402. [Google Scholar] [CrossRef]
  34. Casaca, C.; Costa, M. Detailed measurements in a laboratory furnace with reburning. Fuel 2011, 90, 1090–1100. [Google Scholar] [CrossRef]
  35. Chae, T.; Lee, J.; Yang, W.; Ryu, C. Characteristics of syngas reburning in a natural gas firing furnace—Effects of combustible gas species in the syngas. J. Mech. Sci. Technol. 2016, 30, 3861–3868. [Google Scholar] [CrossRef]
  36. Zhou, A.; Xu, H.; Xu, M.; Yu, W.; Li, Z.; Yang, W. Numerical investigation of biomass co-combustion with methane for NOx reduction. Energy 2020, 194, 116868. [Google Scholar] [CrossRef]
  37. Holoubek, D. Spaľovacie Zariadenia, Výmenníky Tepla a Kotly. (Combustion Appliances, Heat Exchangers and Boilers; in Slovak); TU v Košiciach: Košice, Slovakia, 2002; p. 215. ISBN 80-7099-832-6. [Google Scholar]
  38. Delabroy, O.; Haile, E.; Lacas, F.; Candel, S.; Pollard, A.; Sobiesiak, A.; Becker, H.A. Passive and active control of NOx in industrial burners. Exp. Therm. Fluid Sci. 1998, 16, 64–75. [Google Scholar] [CrossRef]
  39. Shi, B.; Hu, J.; Peng, H.; Ishizuka, S. Effects of internal flue gas recirculation rate on the NO emission in a methane/air premixed flame. Combust. Flame 2018, 188, 199–211. [Google Scholar] [CrossRef]
  40. Shalaj, V.V.; Mikhajlov, A.G.; Novikova, E.E.; Terebilov, S.V.; Novikova, T.V. Gas Recirculation Impact on the Nitrogen Oxides Formation in the Boiler Furnace. Procedia Eng. 2016, 152, 434–438. [Google Scholar] [CrossRef] [Green Version]
  41. Shalaj, V.V.; Mikhailov, A.G.; Slobodina, E.N.; Terebilov, S.V. Issues on Nitrogen Oxides Concentration Reduction in the Combustion Products of Natural Gas. Procedia Eng. 2015, 113, 287–291. [Google Scholar] [CrossRef] [Green Version]
  42. Hodžić, N.; Kazagić, A.; Smajević, I. Influence of multiple air staging and reburning on NOx emissions during co-firing of low rank brown coal with woody biomass and natural gas. Appl. Energy 2016, 168, 38–47. [Google Scholar] [CrossRef]
  43. Normann, F.; Andersson, K.; Johnsson, F.; Leckner, B. NOx reburning in oxy-fuel combustion: A comparison between solid and gaseous fuels. Int. J. Greenh. Gas Control 2011, 5, 120–126. [Google Scholar] [CrossRef]
  44. Ling, Z.; Zhou, H.; Ren, T. Effect of the flue gas recirculation supply location on the heavy oil combustion and NOx emission characteristics within a pilot furnace fired by a swirl burner. Energy 2015, 91, 110–116. [Google Scholar] [CrossRef]
  45. Lipardi, A.C.A.; Versailles, P.; Watson, G.M.G.; Bourque, G.; Bergthorson, J.M. Experimental and numerical study on NOx formation in CH4 -air mixtures diluted with exhaust gas components. Combust. Flame 2017, 179, 325–337. [Google Scholar] [CrossRef]
  46. Glarborg, F.; Miller, J.A.; Ruscic, B.; Klippenstein, S.J. Modeling nitrogen chemistry in combustion. Prog. Energy Combust. Sci. 2018, 67, 31–68. [Google Scholar] [CrossRef] [Green Version]
  47. Instruction Manual for the Testo 350M-XL Analyzers, Page 11. Available online: http://ktest.sk/testo2006/Emissions_service_thermal/testo_350M-XL.pdf (accessed on 17 July 2020).
  48. Instruction Manual for the Testo 325-I Analyzer, Page 8. Available online: https://static-int.testo.com/media/ee/39/e503b6bedf0c/testo-325-1-2-sira-Instruction-Manual.pdf (accessed on 17 July 2020).
Figure 1. Experimental setup scheme with main equipment dimensions listed in mm. Legend: T—thermocouple, A—analyzer, V—throttle valve, pstat—static pressure, ptotal—total pressure, OFA— overfire air.
Processes 08 00940 g001
Figure 2. Nitrogen oxide emissions (expressed in mg/m3 at 3% vol. oxygen in dry flue gas under normal temperature and pressure) and their reduction after the application of reburning and overfire air methods at total fuel input Q = 1.5 m3/h and air excess coefficient m = 1.1.
Processes 08 00940 g002
Figure 3. Flue-gas recirculation and reburning methods: denitrification efficiency comparison at total fuel input Q = 1.5 m3/h and air excess coefficient m = 1.1.
Processes 08 00940 g003
Figure 4. CO content in flue gas is a result of application of individual de-NOx methods and their combinations at total fuel input Q = 1.5 m3/h and air excess coefficient m = 1.1.
Processes 08 00940 g004
Figure 5. Measured flue-gas temperatures through the furnace during experiments involving fuel input Q = 1.5 m3/h and air excess coefficient m = 1.1.
Processes 08 00940 g005
Figure 6. NOx emissions (expressed in mg/m3 at 3% vol. oxygen in dry flue gas under normal temperature and pressure) and measured temperatures in the combustion chamber after the application of primary methods in combination at total fuel input Q = 1.8 m3/h and air excess coefficient m = 1.2.
Processes 08 00940 g006
Figure 7. NOx emissions reduction achieved after application of primary methods and their combinations at total fuel input Q = 1.8 m3/h and air excess coefficient m = 1.2.
Processes 08 00940 g007
Figure 8. Nitrogen oxide formation (expressed in mg/m3 at 3% vol. oxygen in dry flue gas under normal temperature and pressure) as a result of variable burner fuel input and air excess coefficient m = 1.1 and 1.2.
Processes 08 00940 g008
Figure 9. NOx emissions (expressed in mg/m3 at 3% vol. oxygen in dry flue gas under normal temperature and pressure) dependence on flue-gas recirculation at burner power input 16 kW and air excess coefficient m = 1.1.
Processes 08 00940 g009
Figure 10. Effect of increasing flue-gas recirculation share on the course of the temperature field through the furnace at burner power input 16 kW and air excess coefficient m = 1.1.
Processes 08 00940 g010
Figure 11. Nitrogen oxide emissions reduction after the application of flue-gas recirculation: comparison of natural gas (NG) and propane–butane gas (PBG) combustion at various flue-gas recirculation rates. For both fuels, burner power input was 16 kW and air excess coefficient m = 1.1.
Processes 08 00940 g011
Table 1. Composition of natural gas (NG) in % vol.
CH4C2H6C3H8C4H10C5H12CO2N2
98.04%0.77%0.26%0.08%0.02%0.06%0.77%
Table 2. Composition and properties of propane–butane gas (PBG).
Propane–ButaneDensity in the Liquid Phase (kg/dm3)Density in the Gas Phase (kg/m3)Calorific Value (Lower Heating Value) (MJ/m3)Composition (% vol.)
C3H80.5082.01992.9740
C4H100.5852.59123.7460
Table 3. Distance of individual thermocouples from burner outflow.
ThermocoupleT13T14T3T4T5T6T7
Distance (m)0.250.350.951.71.952.02.1
Table 4. Primary methods applied individually and in combination. Legend: FGR—flue-gas recirculation.
RatioCombustion without/with Primary Denitrification Method Applied Individually
 Without   
10, 15, 20% FGR  
10, 15, 20, 25%  Reburning 
    OFA
 Combustion with Primary Denitrification Methods Applied in Combination
Combination  10, 15, 20% ReburningOFA
Combination 10, 15, 20% FGR10% ReburningOFA

