Article

Selection and Validation of Reference Genes for Quantitative Real-Time PCR in White Clover (Trifolium repens L.) Involved in Five Abiotic Stresses

Department of Grassland Science, College of Animal Science and Technology, Sichuan Agricultural University, Chengdu 611130, China
*
Author to whom correspondence should be addressed.
Plants 2020, 9(8), 996; https://doi.org/10.3390/plants9080996
Submission received: 8 July 2020 / Revised: 1 August 2020 / Accepted: 2 August 2020 / Published: 5 August 2020

Abstract

:
White clover (Trifolium repens L.) is a widely cultivated cool-season perennial forage legume in temperate grassland systems. Many studies have analyzed the gene expression in this grass species using quantitative real-time reverse transcription PCR (qRT-PCR). The selection of stable reference genes for qRT-PCR is crucial. However, there was no detailed study on reference genes in different tissues of white clover under various abiotic stress conditions. Herein, 14 candidate reference genes (ACT7, ACT101, TUA1109, TUB, CYP, 60SrRNA, UBQ, E3, GAPDH1, GAPDH2, PP2A, BAM3, SAMDC, and ABC) were selected and analyzed by four programs (GeNorm, NormFinder, BestKeeper, and RefFinder). Samples were taken from two tissues (leaves and roots) under five different abiotic stresses (drought, salt, heat, cold, and heavy metal stress). Our results showed that 60SrRNA and ACT101 were the two top-ranked genes for all samples. Under various experimental conditions, the most stable gene was different; however, SAMDC, UBQ, 60SrRNA, and ACT101 were always top ranked. The most suitable reference genes should be selected according to different plant tissues and growth conditions. Validation of these reference genes by expression analysis of Cyt-Cu/Zn SOD and CAT confirmed their reliability. Our study will benefit the subsequent research of gene function in this species.

1. Introduction

Quantitative real-time reverse transcription PCR (qRT-PCR) using cDNA as a template is a sensitive and powerful technique for measuring gene expression level [1]. Quantitative real-time PCR can be used not only to analyze the regulation of gene expression, monitor the expression pattern of mRNA, and quantitatively analyze the transcription level of genes, but also to conduct spatial–temporal analysis of target genes in different tissues under various treatments; as such, qRT-PCR has been widely applied in the field of molecular biology [2,3,4]. However, the quality of gene expression is affected by many experimental factors [5], and the relative quantitative method selected by researchers first needs to correct the expression amount of the target gene in the experimental process [6]. So far, using one or more reference genes is the preferred method of normalization [7], and this is also the simplest method of data processing. Accurate determination of target gene expression levels depends on the selection of stable reference genes [8,9,10].
White clover (Trifolium repens L.) is an important cool-season perennial legume forage which is widely cultivated in temperate grassland systems [11]. It has a high feed value and strong N fixation capacity in soil [12]. However, white clover is susceptible to drought, salt, and heat stress [13]. The understanding of expression patterns of some key genes, especially which associated with abiotic stress responses, will help in exploring the molecular mechanisms of stress response and improving the stress resistance of white clover.
Recent studies have found some suitable reference genes for plant organs and experimental conditions in different plant species [14]. To date, there has been a report on reference genes in white clover, but this report only analyzed seven candidate reference genes in two organs (leaves and stolons) under two treatments (water-limited and well-watered) [15]. Nevertheless, there is no detailed study on the reference genes in different tissues of white clover under various abiotic stresses. The ideal reference gene should be expressed stably in all cells and physiological states [16]. Genes such as ACT [17], GAPDH [18], TUA [19], TUB [20], and EF1α [21] are normally used as reference genes. However, some of these reference genes may have different expression among plant tissues, species, and growth conditions [22]. As no single reference gene is universally suitable for all experiments, the selection of reference genes under various experimental conditions is crucial for exactly quantifying the expression levels of genes induced by all kinds of abiotic stress [23].
In this study, we analyzed the expression stability of 14 candidate reference genes (ACT7, ACT101, TUA1109, TUB, CYP, 60SrRNA, UBQ, E3, GAPDH1, GAPDH2, PP2A, BAM3, SAMDC, and ABC) in white clover leaves and roots under drought, salt, heat, cold, and heavy metal treatments. We used four different software programs, namely GeNorm [24], NormFinder [25], BestKeeper [26] and RefFinder [27], to identify the most stable gene for qPCR. Finally, two target genes, namely Cyt-Cu/Zn SOD and CAT, from white clover were used to validate these candidate reference genes.

2. Materials and Methods

2.1. Plant Materials, Growth Conditions, and Abiotic Stress Treatments

Seeds of white clover cv. Haifa were grown in 20 × 15 × 5 cm pots containing 1 kg silica sand. Each pot was sprinkled with 0.4 g of seeds, supplemented with Hoagland’s nutrient solution, and maintained in an environmental growth chamber set to a light intensity of 100 µmol/(m·s) at 23/19 °C (day/night) with a 12-h photoperiod. One-month-old plants were used for all stress experiments. We observed the extent of five different abiotic stresses on plants, characterizing stress as mild, moderate, and severe, and then took samples. For drought stress, the plants were treated with 17% concentration of PEG6000, and samples were taken at 0, 6, 8, and 10 days. For salinity stress, the plants were treated with 250 mmol/L NaCl, and samples were taken at 0, 12, 14, and 16 days. For heat stress, plants were put in an environmental growth chamber set to 38/33 °C (day/night), and samples were taken at 0, 15, 22, and 23 days. Cold stress was imposed at 4 °C in an incubator, and samples were taken at 0, 12, 17, and 22 days. For heavy metal treatment, the nutrient solution was filled with 600 μmol/L Cd2+ Hoagland’s, and samples were taken at 0, 12, 17, and 22 days. Meanwhile, control plants were treated with an equal quantity of Hoagland’s nutrient solution. For all controls and treatments, the leaf and root tissues were sampled separately at three different time points with four biological replicates. All the samples were frozen immediately in liquid nitrogen and stored at −80 °C for later use.

2.2. RNA Isolation and cDNA Synthesis

Total RNA was extracted from the leaf and root tissues using the HiPure Universal RNA Kit (Magen Biotech Co., Ltd., China) with RNase-free DNase I (GBC, Beijing, China). RNA purity and concentration were measured with a NanoDrop ND-1000 Micro-Volume UV–Vis Spectrophotometer (NanoDrop Technologies, Wilmington, DE, USA) at 260/280 nm ratio within the range of 1.8–2.2 and 260/230 nm around 2.0. After 1% agarose gel electrophoresis, the RNA integrity was checked. Following the manufacturer’s instructions, 0.5 μg total RNA was used for first-strand cDNA synthesis using PrimeScript RT reagent Kit with gDNA Eraser (Perfect Real Time) (TaKaRa, Japan). The threefold dilution products of the generated cDNA were stored at −80 °C and used for qRT-PCR analyses.

2.3. Selection of Reference Genes and PCR Primer Design

Fourteen reference genes (ACT7, ACT101, TUA1109, TUB, CYP, 60S rRNA, UBQ, E3, GAPDH1, GAPDH2, PP2A, BAM3, SAMDC, and ABC) from white clover transcriptome data were selected as candidate reference genes. The target genes Cyt-Cu/Zn SOD and CAT were obtained from our research group. Primers were designed with Primer3 [28]. The primer design conditions were as follows: Tm, 59.5–62.3 °C; PCR product length, 80–199 bp; Length of primers, 20–24 bp; GC content, 45–62% (Table 1). Conventional PCR was performed to check the primers’ specificity by electrophoresis on 1.5% agarose gel.

2.4. qRT-PCR Analysis

qRT-PCR analyses were performed in 96-well blocks with a BIO-RAD CFX96 Real-Time PCR system (Bio-Rad, Hercules, California, USA) using NovoStart SYBR qPCR Supermix Plus (Novoprotein, China) in a 10-μL volume, containing 5 μL 2× NovoStart SYBR qPCR Supermix Plus, 1 μL diluted cDNA, 0.5 µL of forward primer (10 µmol/L), 0.5 µL of reverse primer (10 µmol/L), and 3 µL of ddH2O. The cycling conditions were as recommended by the manufacturer: 1 min at 95 °C, followed by 39 cycles of 95 °C for 5 s, 60 °C for 30 s, and 95 °C for 5 s. To confirm the specificity of the primers, melting curves were included after amplification. At the end of the reaction process, the melting curve was derived by heating the amplicon from 65 to 95 °C. All qRT-PCR analyses were run in technical quadruplicates and biological triplicates.

2.5. Stability Ranking of Candidate Reference Genes

Three different software programs (GeNorm [24], NormFinder [4], BestKeeper [26]) and the RefFinder (https://www.heartcure.com.au/reffinder/) web tool were used to evaluate the stability of 14 candidate reference genes under various stress conditions. Expression levels of the candidate reference genes were determined by quantification cycle (Cq) values. The three software programs of statistical analyses were conducted according to the manufacturer’s instructions. RefFinder was used to calculate the final rank of the 14 candidate reference genes. Results from CFX manager were exported into Microsoft Excel 2003 and transformed to create input files for each target according to the requirements of each software. For GeNorm and NormFinder, the Cq values were transformed into relative quantities using the formula 2−ΔCq, in which ΔCq = corresponding Cq value—minimum Cq value [29]. GeNorm identifies reference genes with good stability by calculating the M value, with a smaller M value indicating a better stability of the reference gene [26]. The program considers M values below 1.5 to indicate stable expression. The software can also calculate the V values, and the optimal number of reference genes for target gene expression normalization was decided by pairwise variation (Vn/Vn+1). A Vn/Vn+1 cutoff value of 0.15 indicates that an additional reference gene is not necessary [24,30]. The stability value calculated by NormFinder determines inter- and intragroup variation, and the lowest value indicates the highest stability. BestKeeper analyzes the stability of the candidate reference genes based on untransformed Cq values. The reference genes are considered to be the most stable when they exhibit the lowest CV and standard deviation (CV ± SD). Finally, RefFinder assigns an appropriate weight to each gene and calculates the geometric mean of their weights for the overall final ranking based on the rankings from each program.

2.6. Validation of Reference Genes by Expression Analysis of Cyt-Cu/Zn SOD and CAT Under Abiotic Stresses

To validate the reliability of the reference genes from software programs analysis, two target genes, namely Cyt-Cu/Zn SOD and CAT, were selected to analyze the expression patterns using the two most stable reference genes and the least stable reference gene. The results were calculated using the 2−ΔΔCq method [31]. Three technical replicates were performed for each sample. The expression level of Cyt-Cu/Zn SOD in white clover was determined with forward primer 5′-AACTGTGTACCACGAGGACTTC-3′ and reverse primer 5′-AGACTAACAGGTGCTAACAACG-3′, while the expression level of CAT was determined with forward primer 5′-AACAGGACGGGAATAGCACG-3′ and reverse primer 5′-ACCAGGTTCAGACACGGAGACA-3′.

3. Results

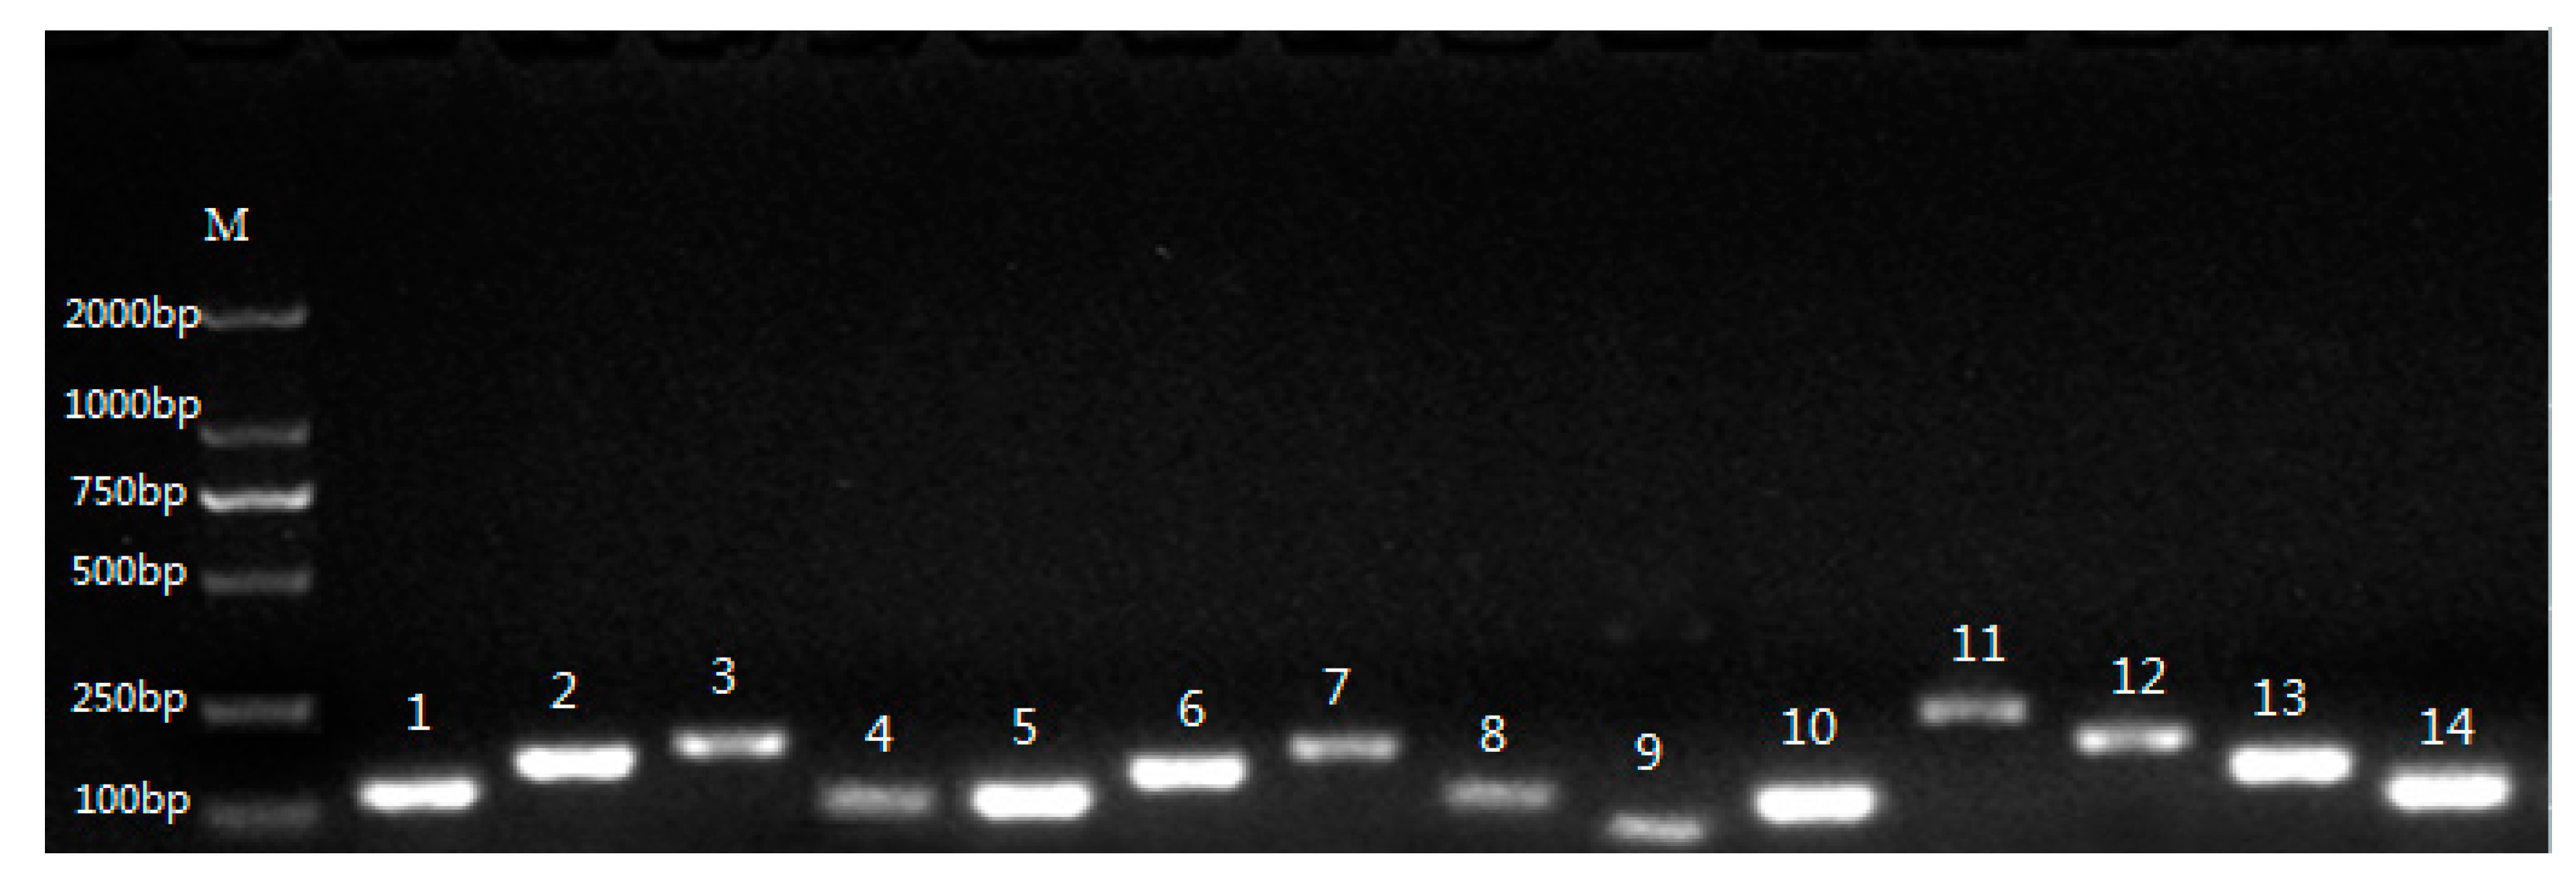
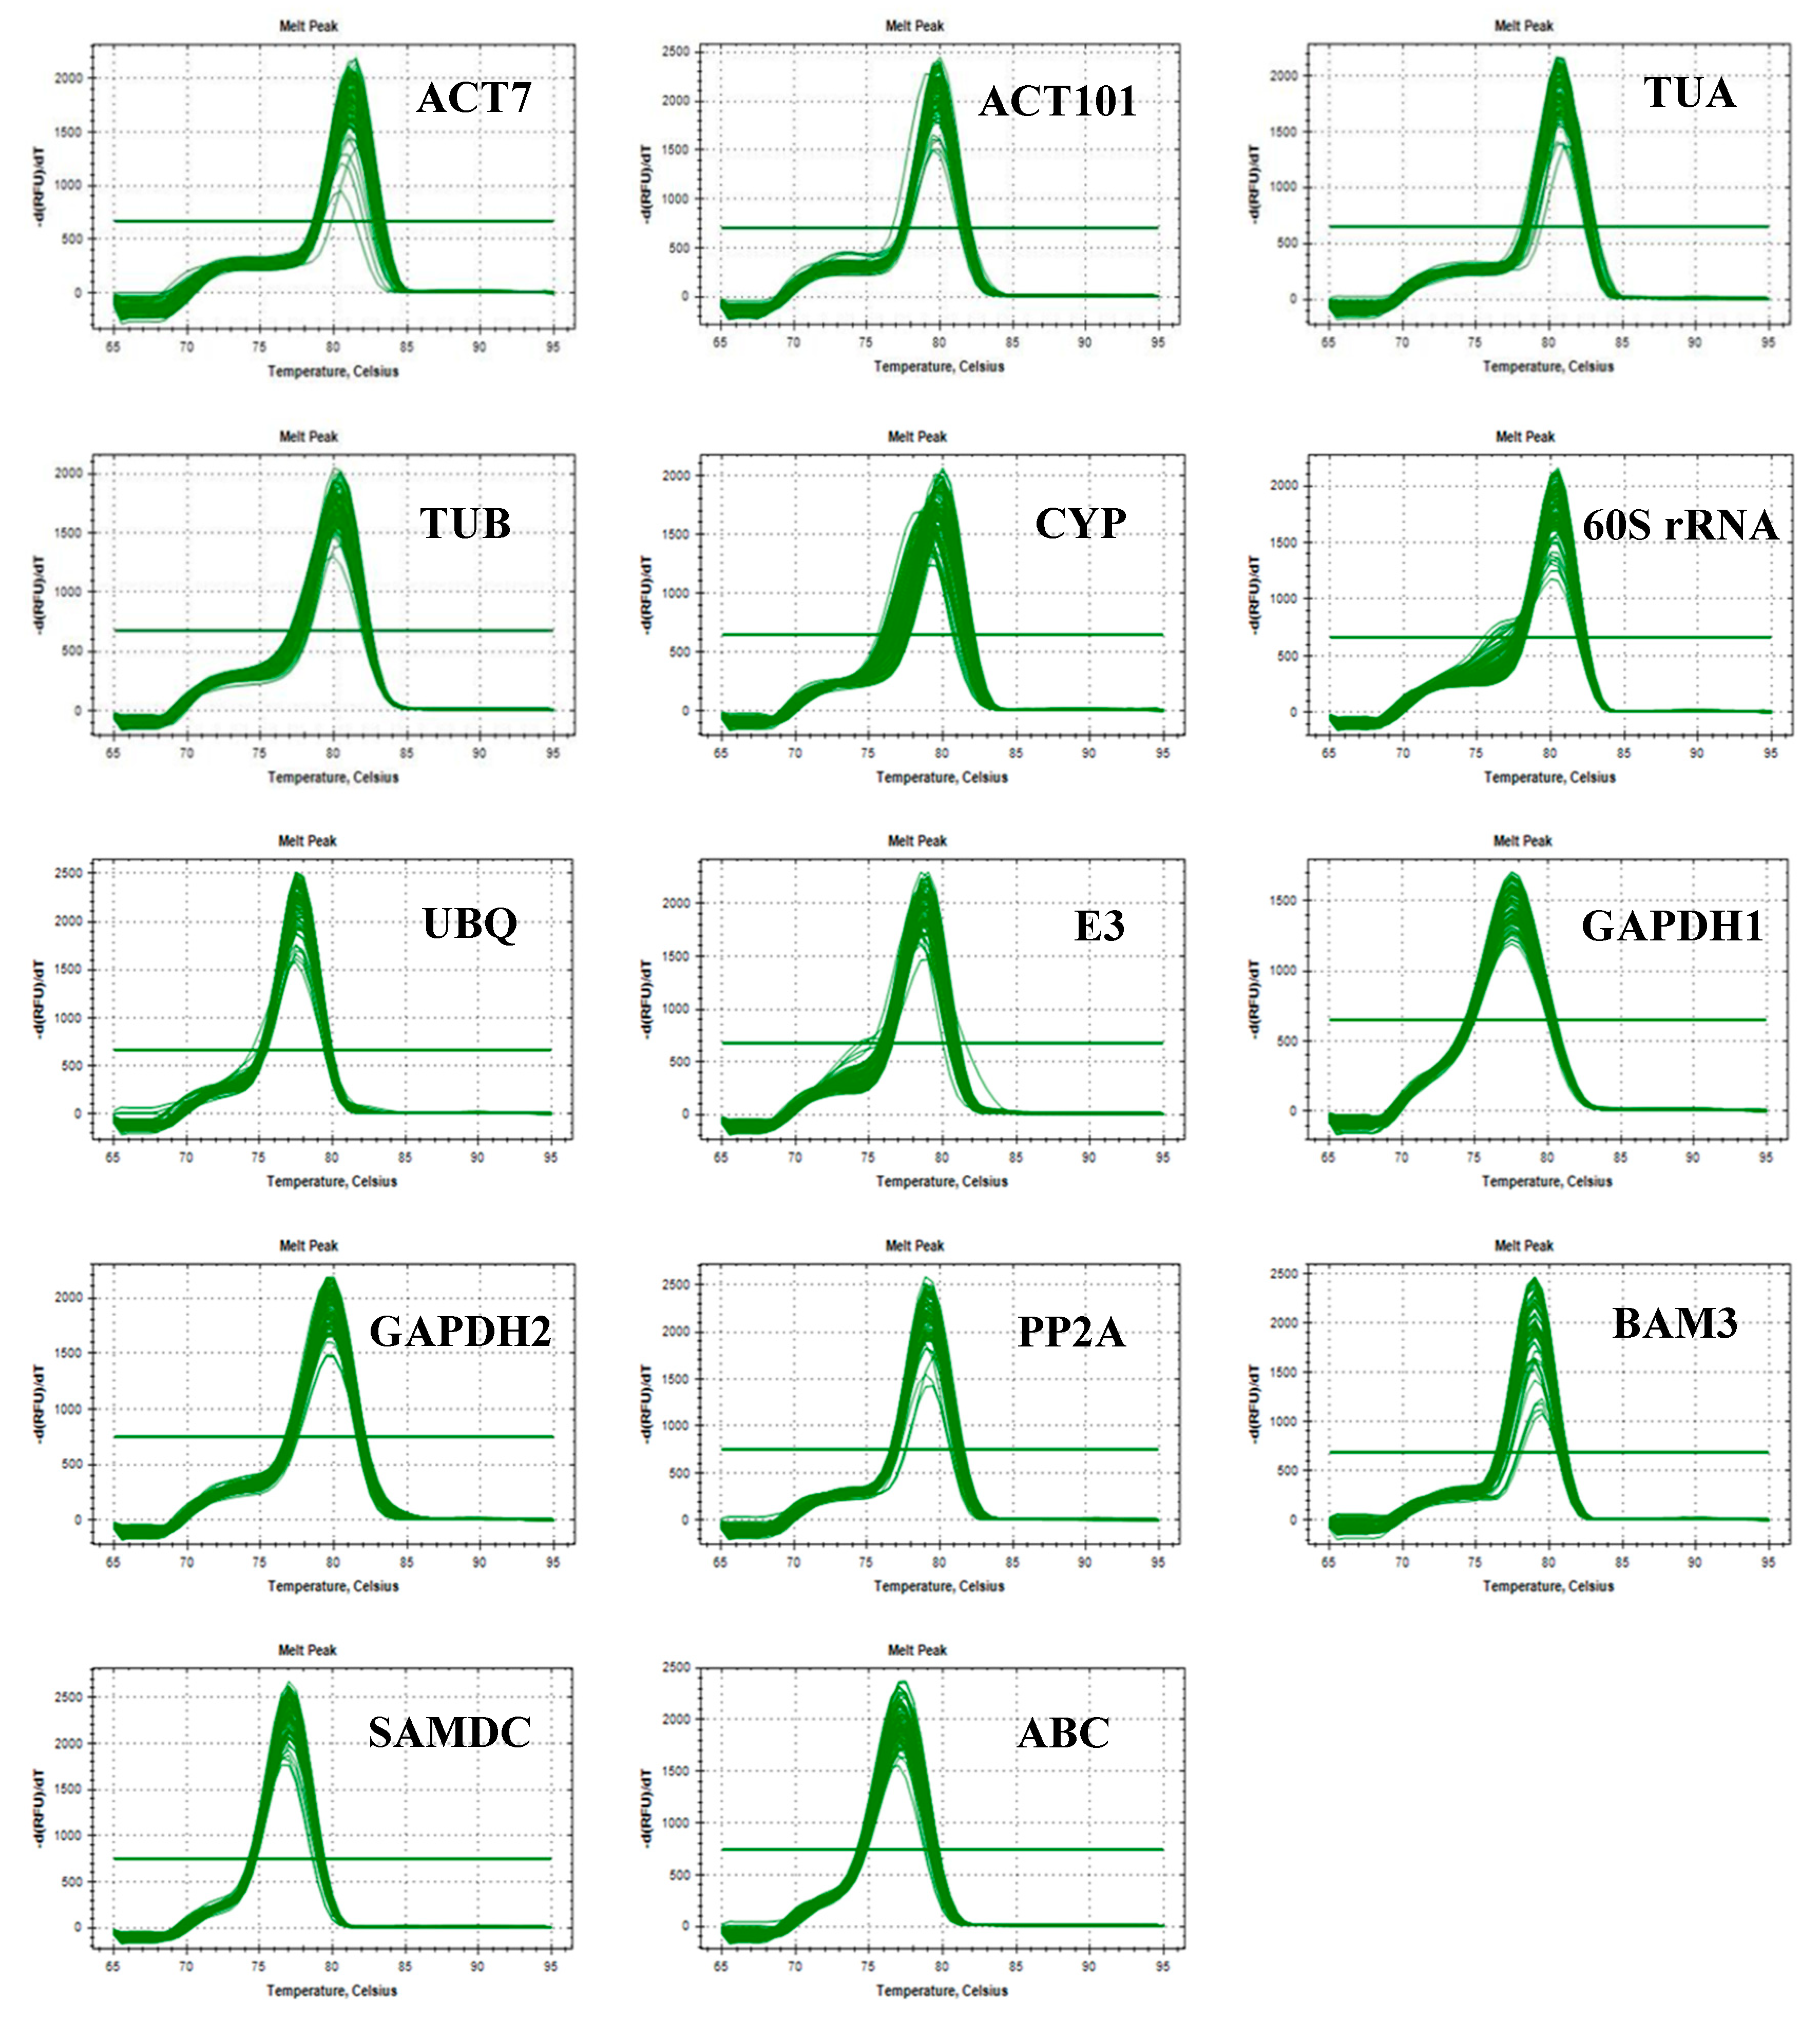
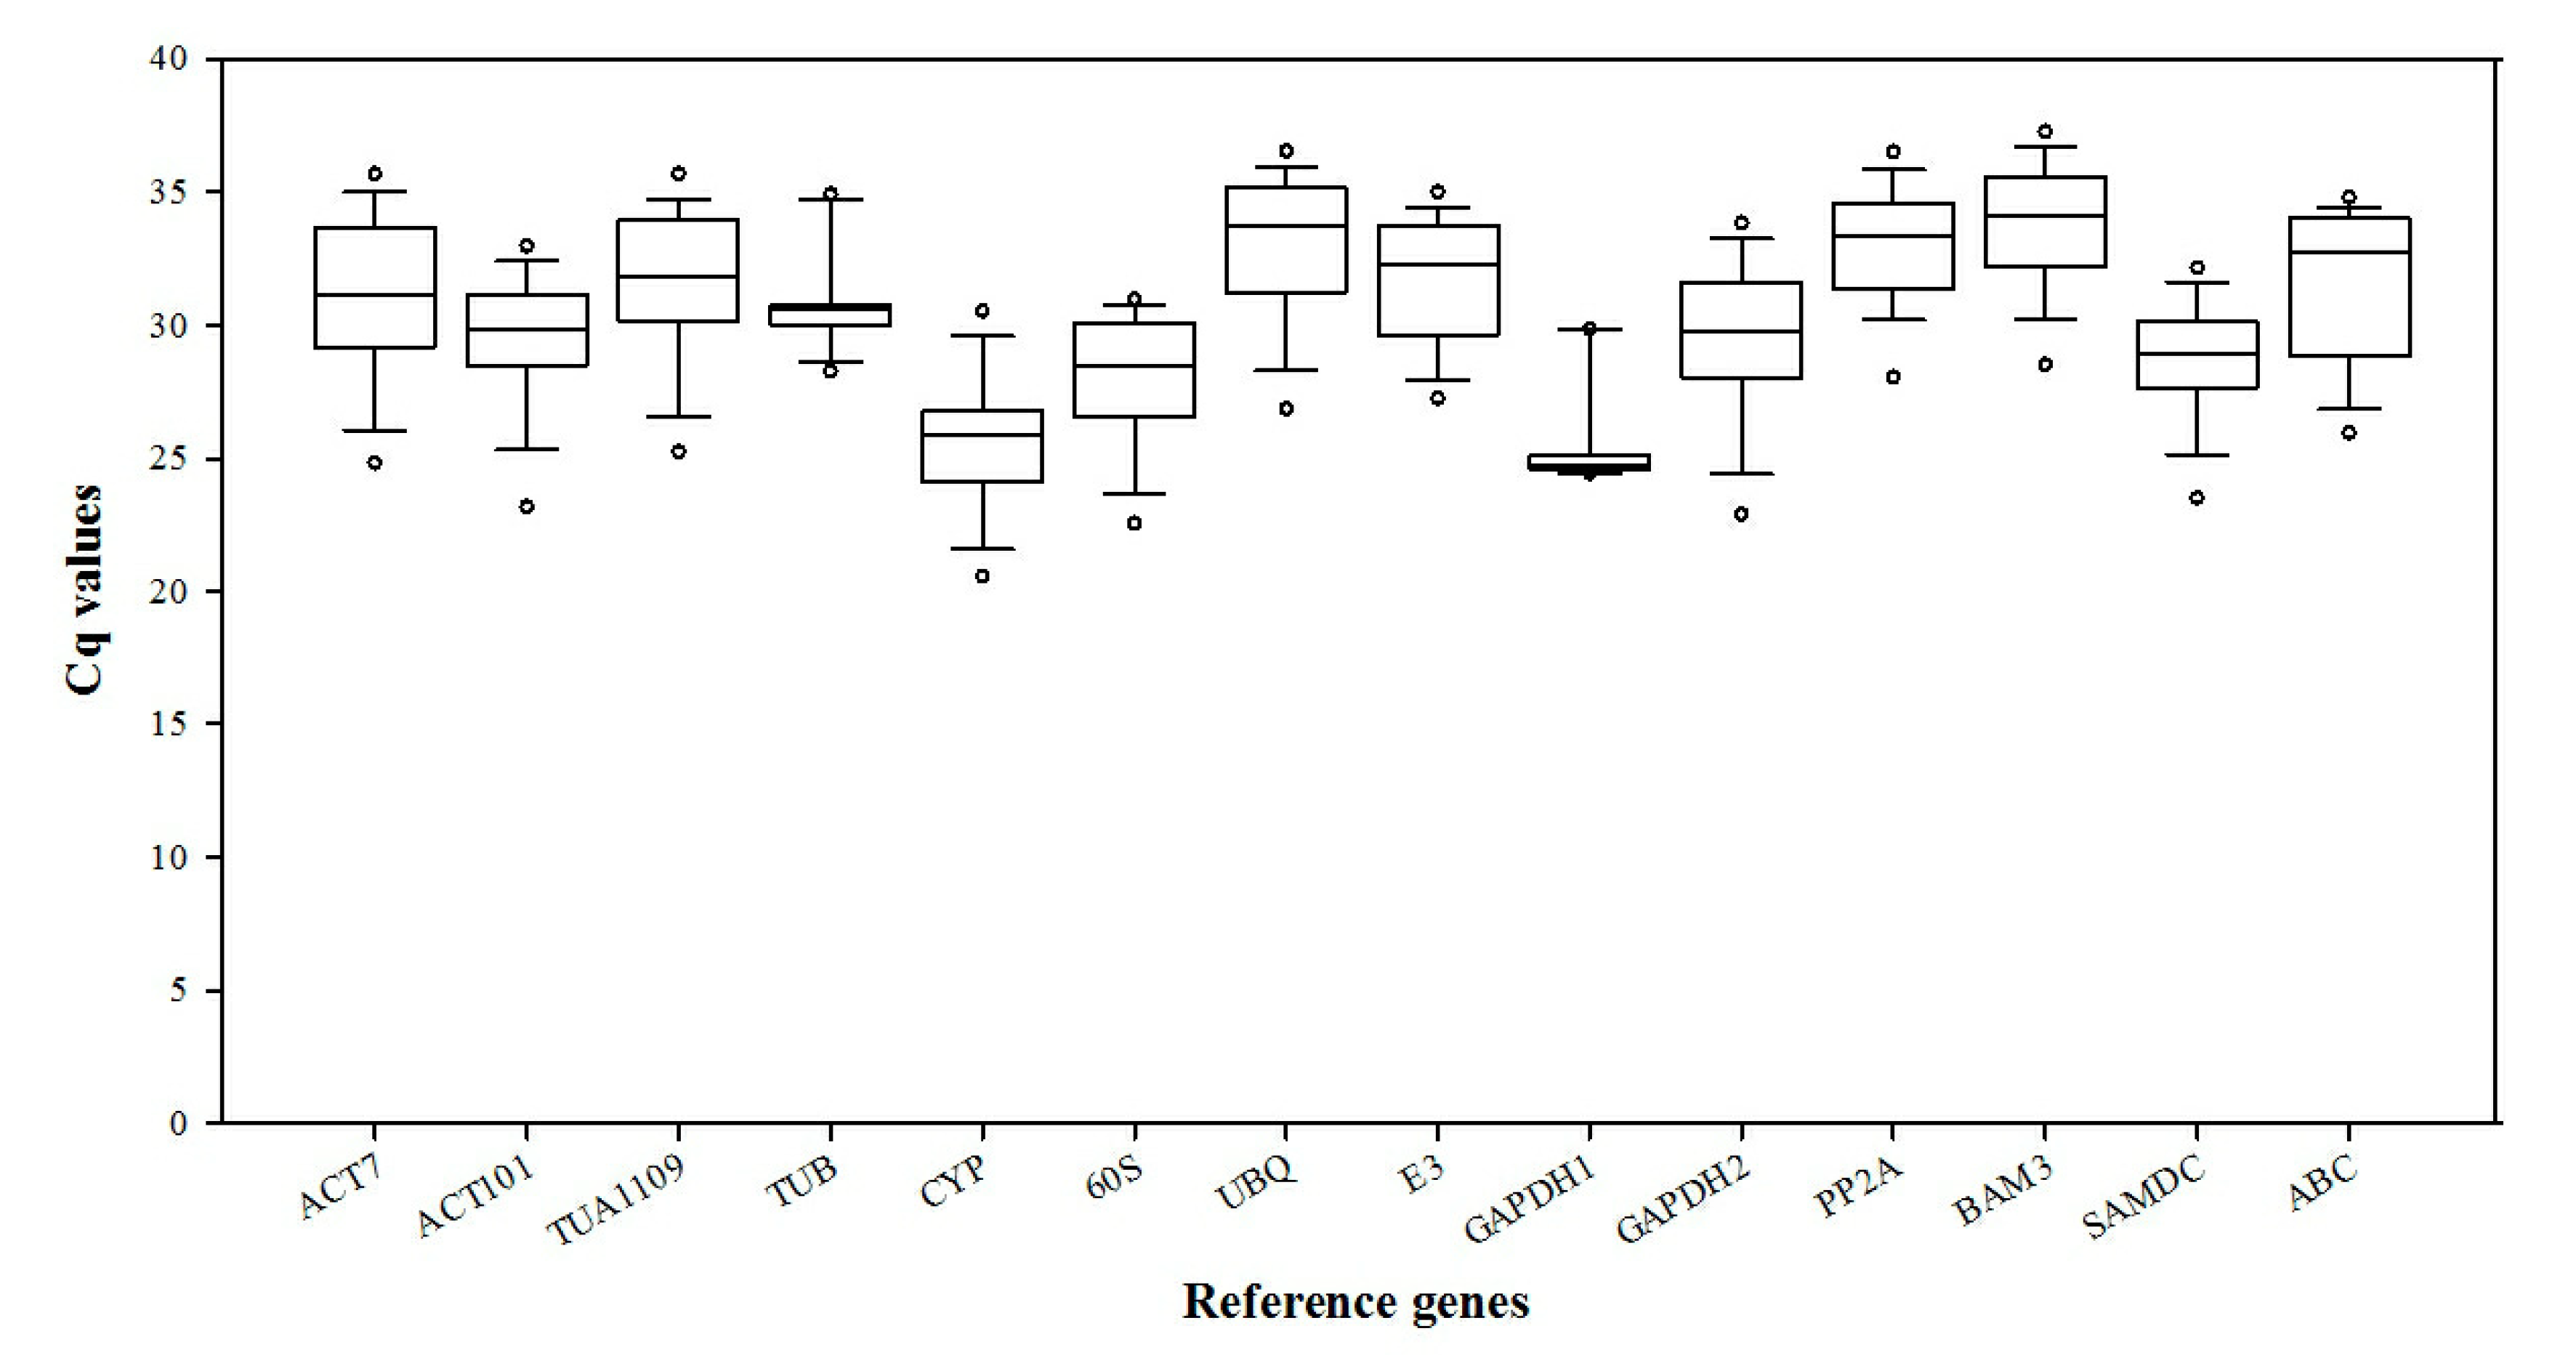
3.1. Verification of PCR Amplicons, Primer Specificity, and Gene-Specific PCR Amplification Efficiency

The amplicon sizes of 14 reference genes were checked by testing each primer pair using electrophoresis on a 2% agarose gel. The PCR products showed that the 80–199 bp fragments of ACT7, ACT101, TUA1109, TUB, CYP, 60SrRNA, UBQ, E3, GAPDH1, GAPDH2, PP2A, BAM3, SAMDC, and ABC were clearly amplified, consistent with the expected fragment sizes, and no impurities or primer dimers were observed (Figure 1).
Each melting curve of 14 candidate reference genes under various abiotic stresses only exhibited a single peak, and the gene amplification curves had good repeatability (Figure 2), showing that the primers were highly specific for later qRT-PCR and the results were reliable.
The expression levels of 14 candidate reference genes in all white clover samples are shown in the box plot (Figure 3). The quantification cycle (Cq) values ranged from 20.25 to 38.24. The lower Cq values reflect the higher mRNA transcript levels. However, under different abiotic stresses, gene expression showed different variations. Therefore, it was necessary to analyze the gene expression stability of different tissues under various abiotic stresses.

3.2. Stability Ranking of Candidate Reference Genes

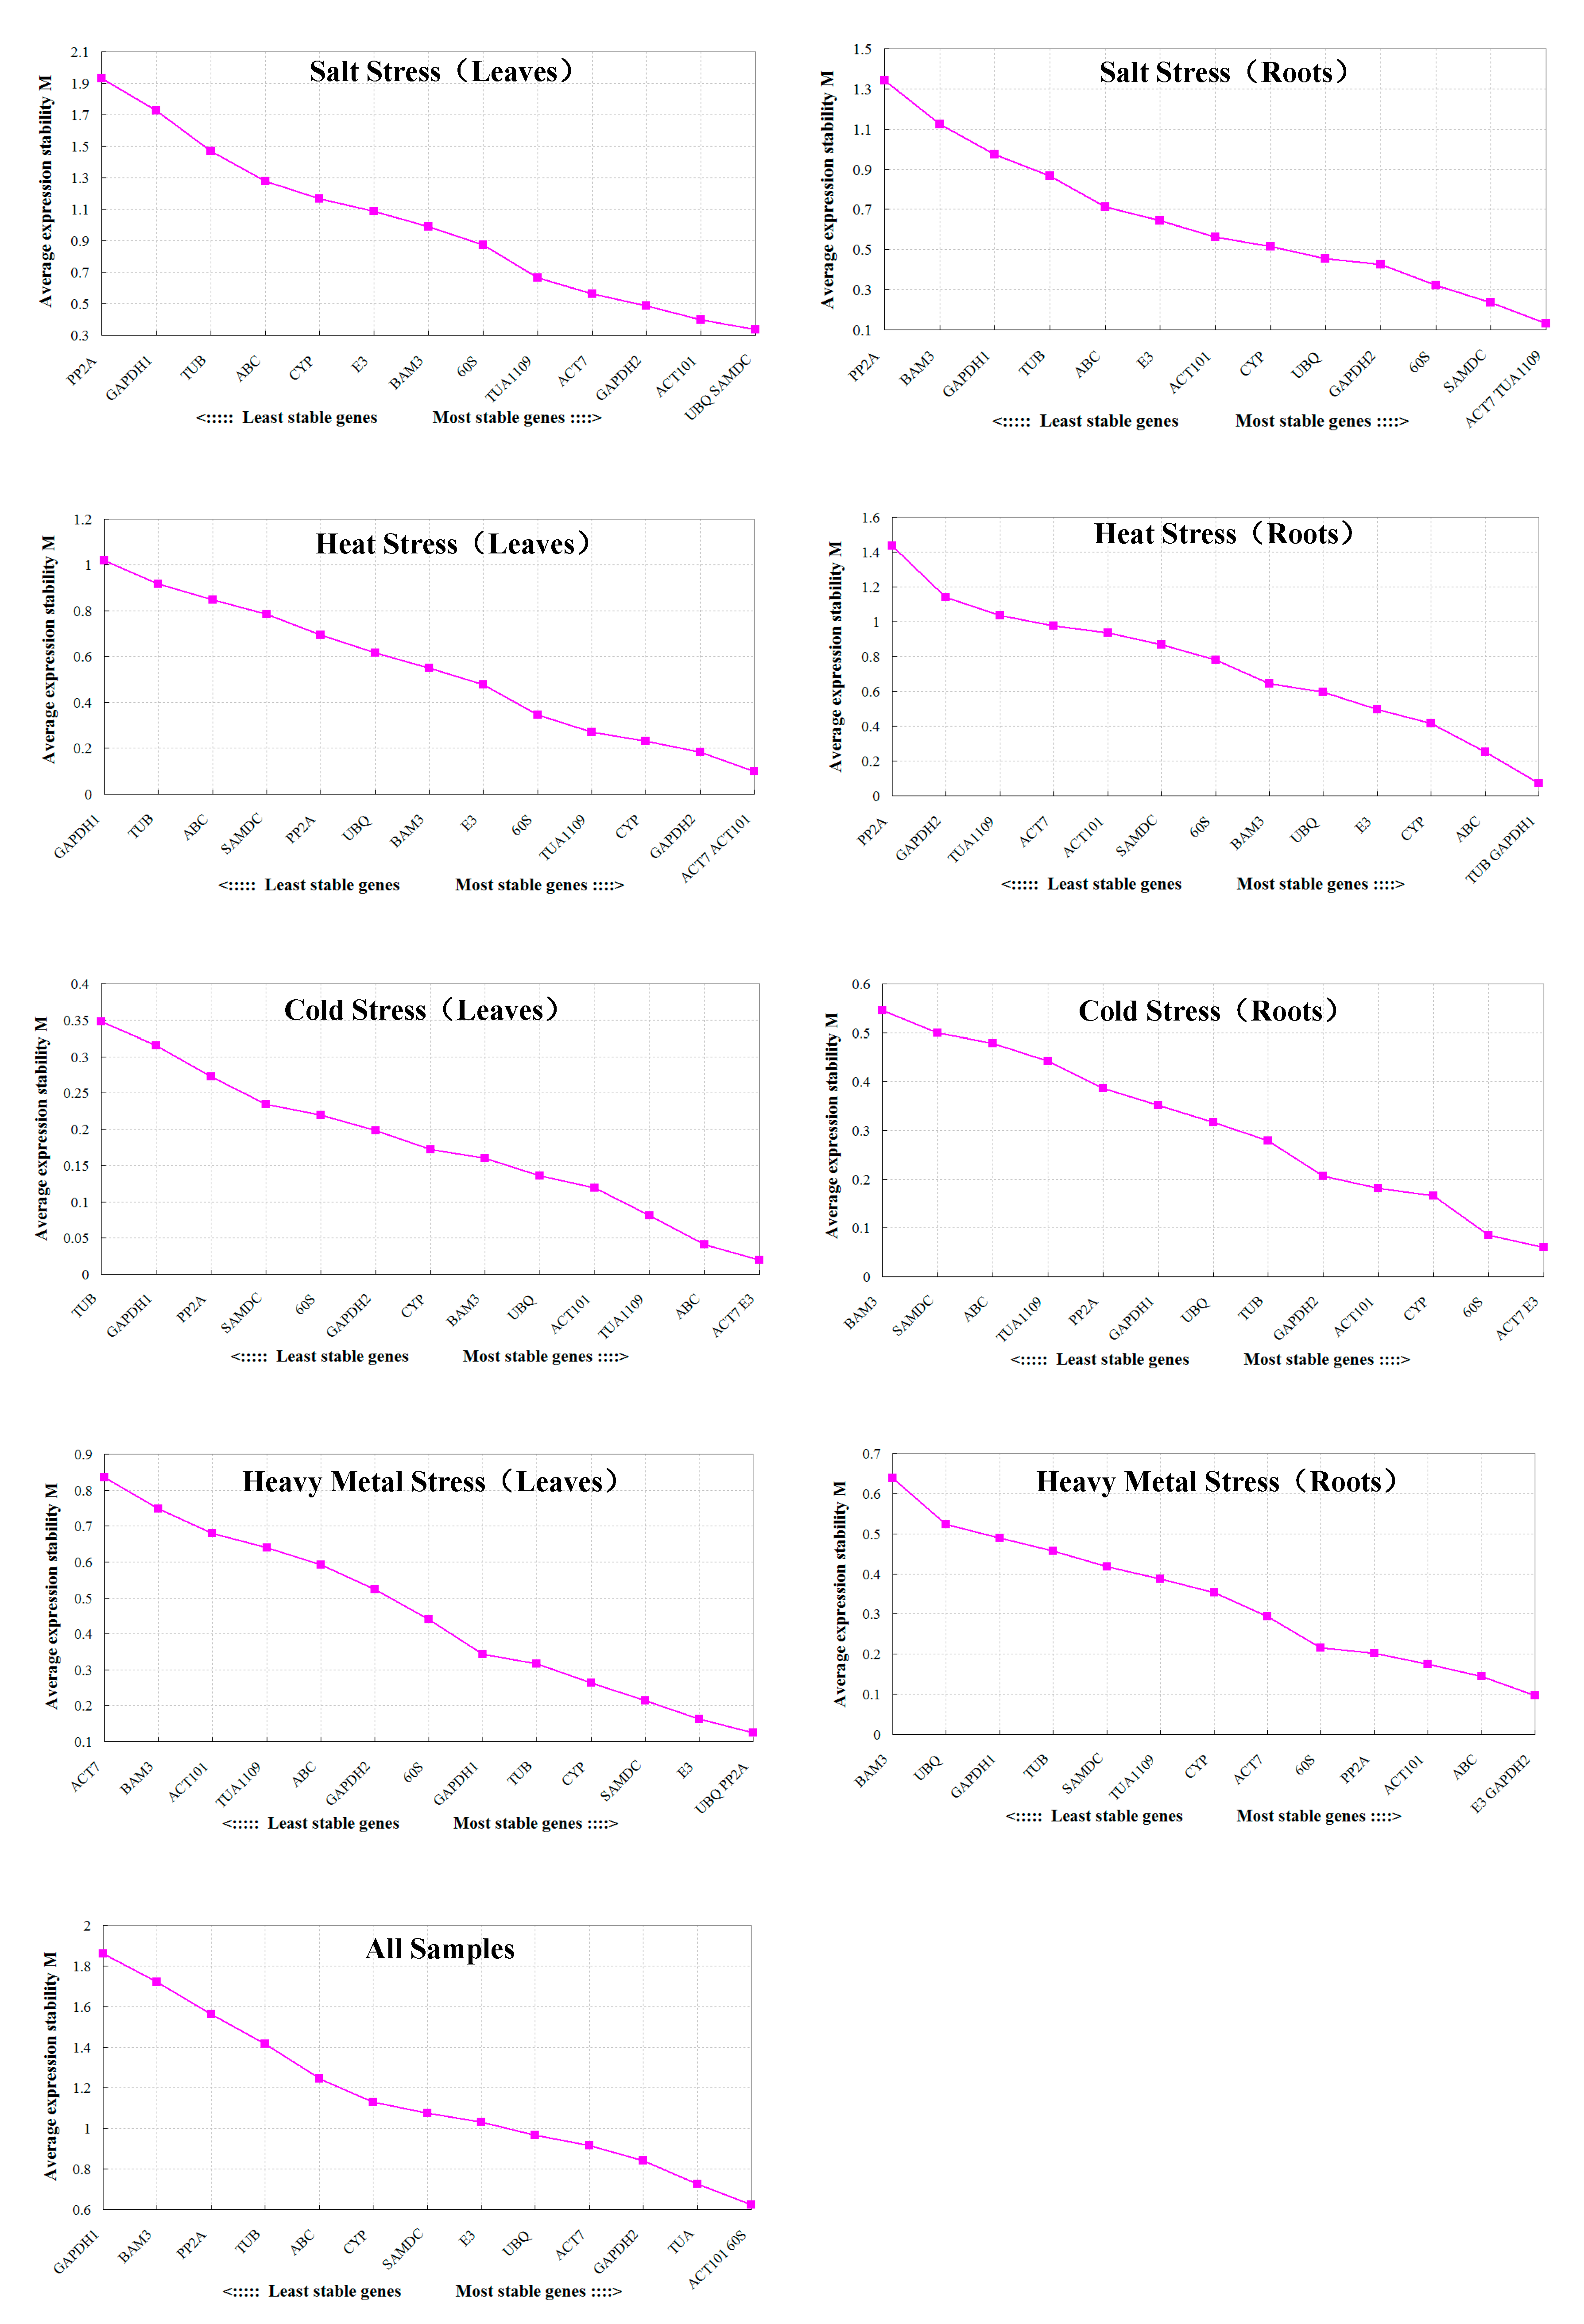
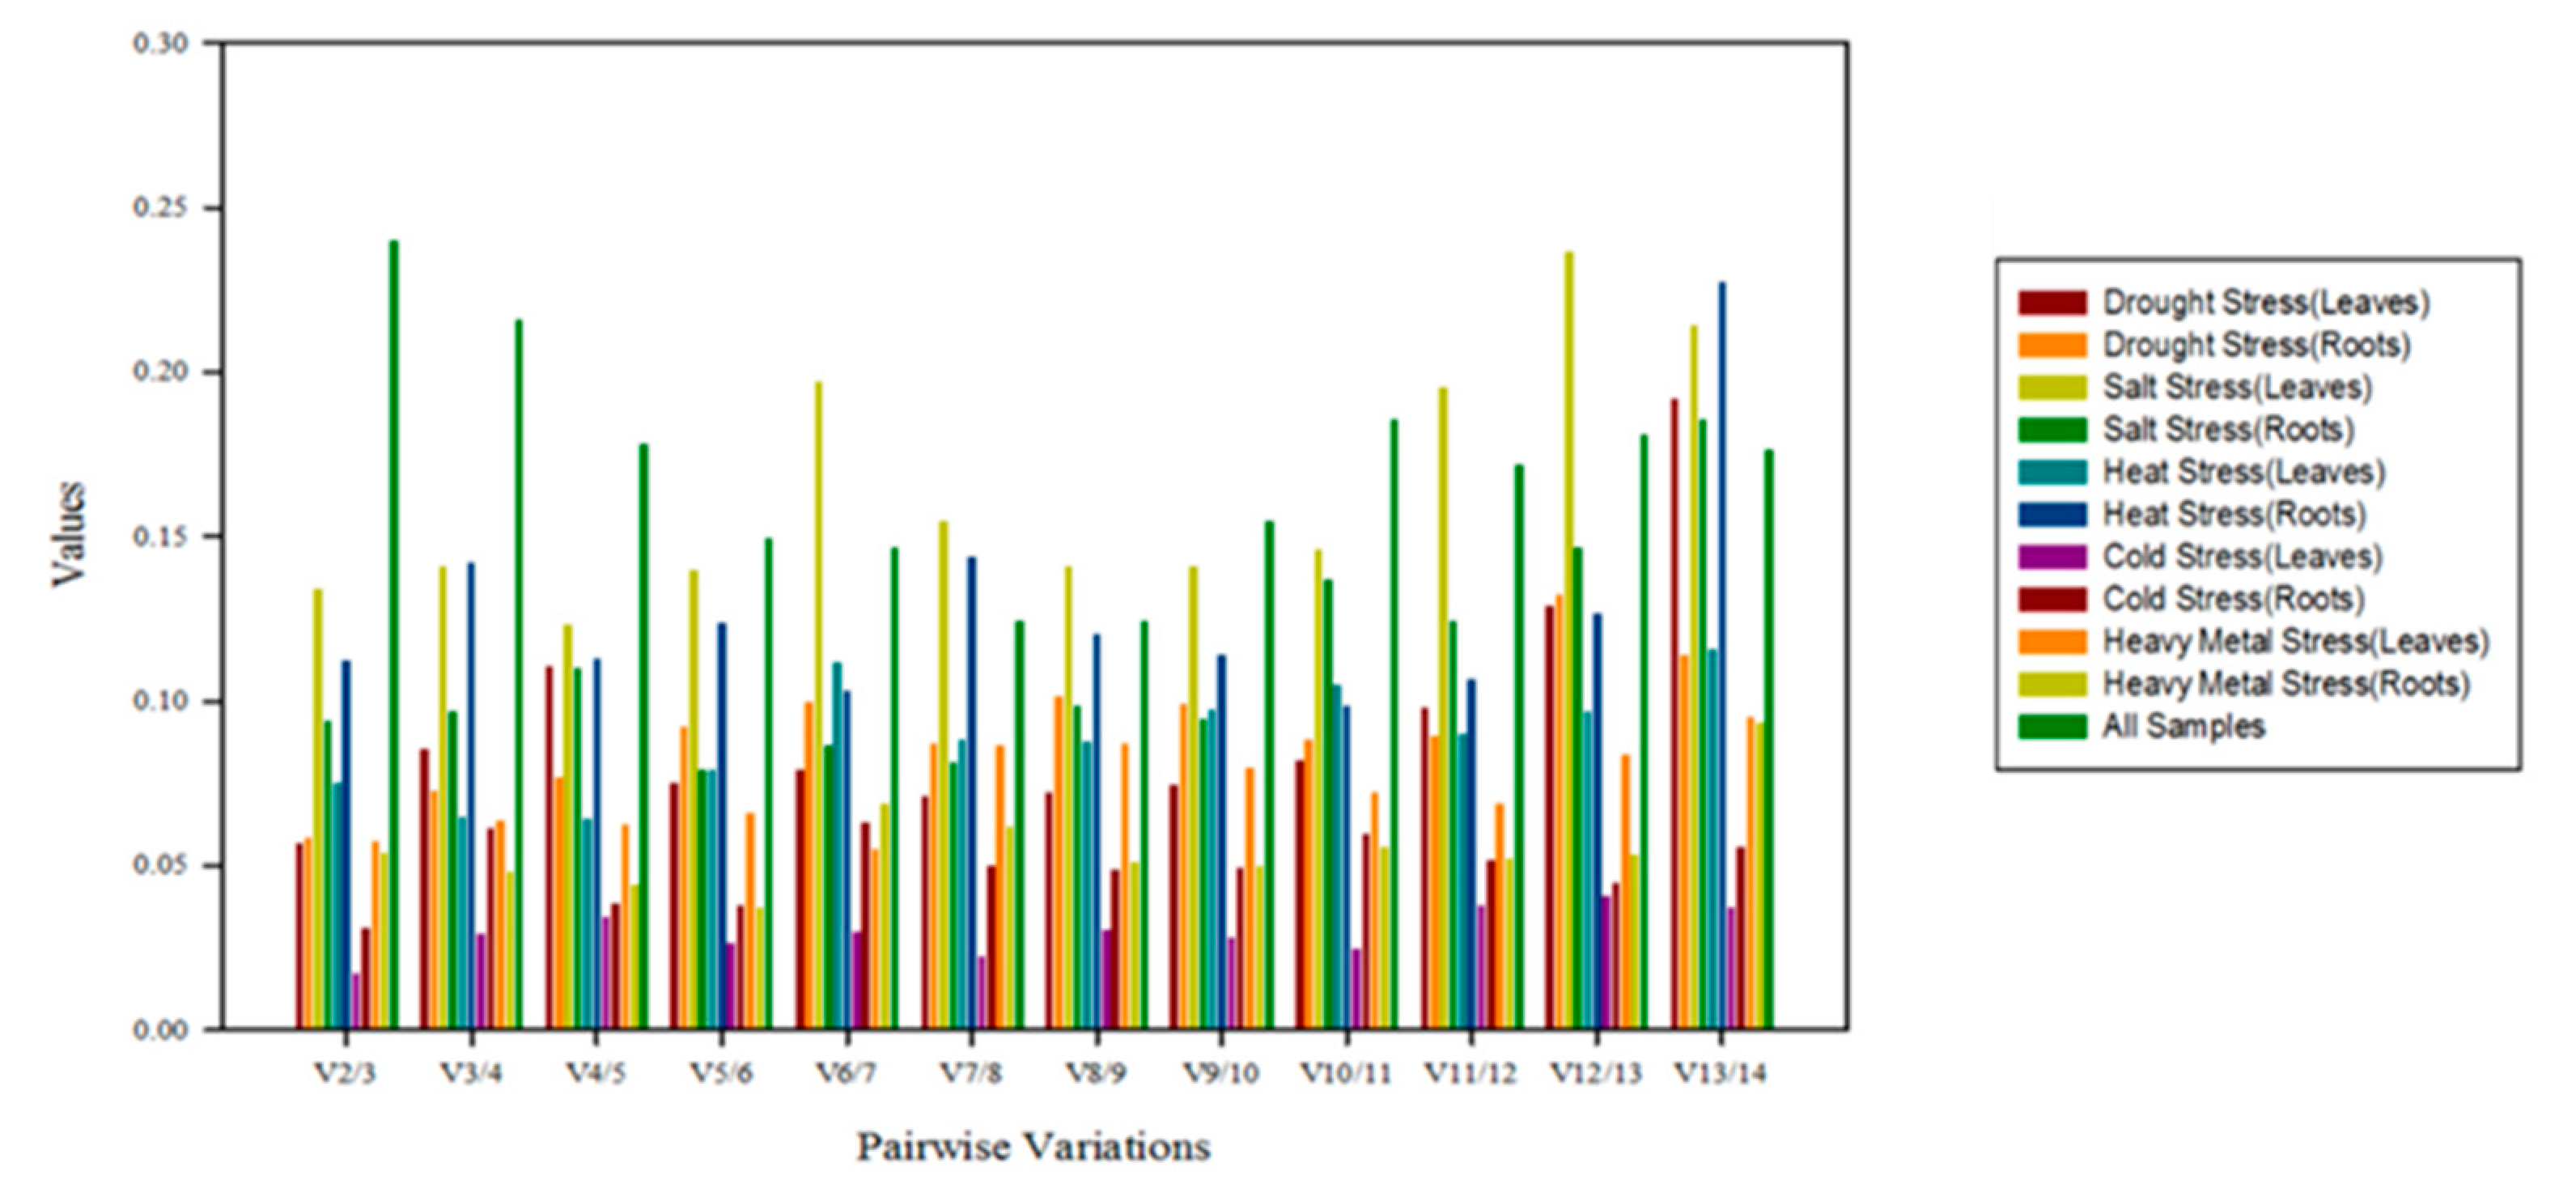
3.2.1. GeNorm Analysis

In GeNorm analysis, the M values were calculated to rank the average expression stability of 14 candidate reference genes (Figure 4). Previous studies had confirmed that an M value below the threshold of 1.5 was considered as indicative of a suitable reference gene. A lower M value represents a higher degree of expression stability for the candidate reference gene. In this study, ACT101 and 60SrRNA were the most stable genes for all samples, including different tissues under various abiotic stresses, while GAPDH1 was the least stably expressed gene. For drought stress, E3 and SAMDC were the most stable genes in leaf samples, while ACT101 and PP2A were the most stable genes in root samples. Similarly, the ACT101 and SAMDC genes ranked the highest in terms of stability for leaf samples under salt stress, while ACT7 and TUA1109 were the most stable for root samples. For heat stress, the ACT7 and ACT101 genes were the most stable in leaf samples, while the TUB and GAPDH1 genes were the most stable in root samples. ACT7 and E3 were the most stable genes in cold-treated roots and leaves. For heavy metal stress, UBQ and PP2A were the most stable genes in leaves, while E3 and GAPDH2 were the most stable in roots.
GeNorm procedure was also used for determining the optimal number of reference genes required for qRT-PCR. The optimal number of reference genes for target gene expression normalization was decided by pairwise variation (Vn/Vn+1). A 0.15 Vn/Vn+1 cutoff value indicates that an additional reference gene is not necessary. In this study, except for the case of all samples, the V2/V3 values were less than 0.15 in leaves and roots under abiotic stress (Figure 5), indicating that the combination of two reference genes was suitable. However, when all samples were analyzed together to determine the optimal number of reference genes, the pairwise variation of V2/V3 was higher than 0.15, and the V5/V6 was just 0.15, indicating that five reference genes should be used for gene expression studies in white clover including various stress conditions. Thus, it was more convenient to select optimal reference genes according to different experimental conditions.

3.2.2. NormFinder Analysis

The stability value calculated by NormFinder determines inter- and intragroup variation, and the lowest value means the most stable. The expression stability calculated by NormFinder for each gene showed that E3 was the top ranked gene in leaves under drought stress, while UBQ was the most stable reference gene in roots under drought, heat, and cold stress and for all samples. The 60S gene ranked highest in leaves under salt and heat stress. Meanwhile, SAMDC was the best in roots under salt stress, and TUA1109 was the top ranked gene in leaves under cold stress. For heavy metal stress, UBQ and ACT101 were the most stable reference genes in leaves and roots, respectively (Table 2).

3.2.3. BestKeeper Analysis

BestKeeper software was used to synchronously analyze the untransformed Cq values, which reflect the stability of the candidate reference genes. The reference genes are considered to be the most stable when they exhibit the lowest CV ± SD. The results indicated that TUB and GAPDH1 were the two most stable genes in our study. GAPDH1 ranked the highest in leaves under drought, salt, heat, and cold stress and in roots under drought and salt stress. Meanwhile, TUB ranked the highest in leaves under heavy metal stress and roots under heat, cold, and heavy metal stress. For all samples, TUB was also the most stable reference gene (Table 3).

3.2.4. RefFinder Analysis

Finally, RefFinder was used to assign an appropriate weight to each gene and calculate the geometric mean of their weights for the overall final ranking, based on the rankings from each program (Table 4). For all samples and drought-treated leaves, the two top-ranked genes determined by RefFinder method were the same as those determined by GeNorm. Both UBQ and 60S were the most suitable reference genes in drought-treated samples. UBQ and SAMDC were identified as the most stable reference genes in leaf samples under salt stress, and SAMDC and 60S were identified as the most stable reference genes in root samples under salt stress. For heat stress, the most stable combinations were 60S plus ACT7 in leaves and UBQ and BAM3 in roots. TUA1109 and ACT7 were the most stable genes in cold-treated leaf samples, while TUB and UBQ were the most stable genes in cold-treated root samples. For heavy metal stress, the most stable combinations were UBQ plus CYP in leaves and ACT101 plus E3 in roots.

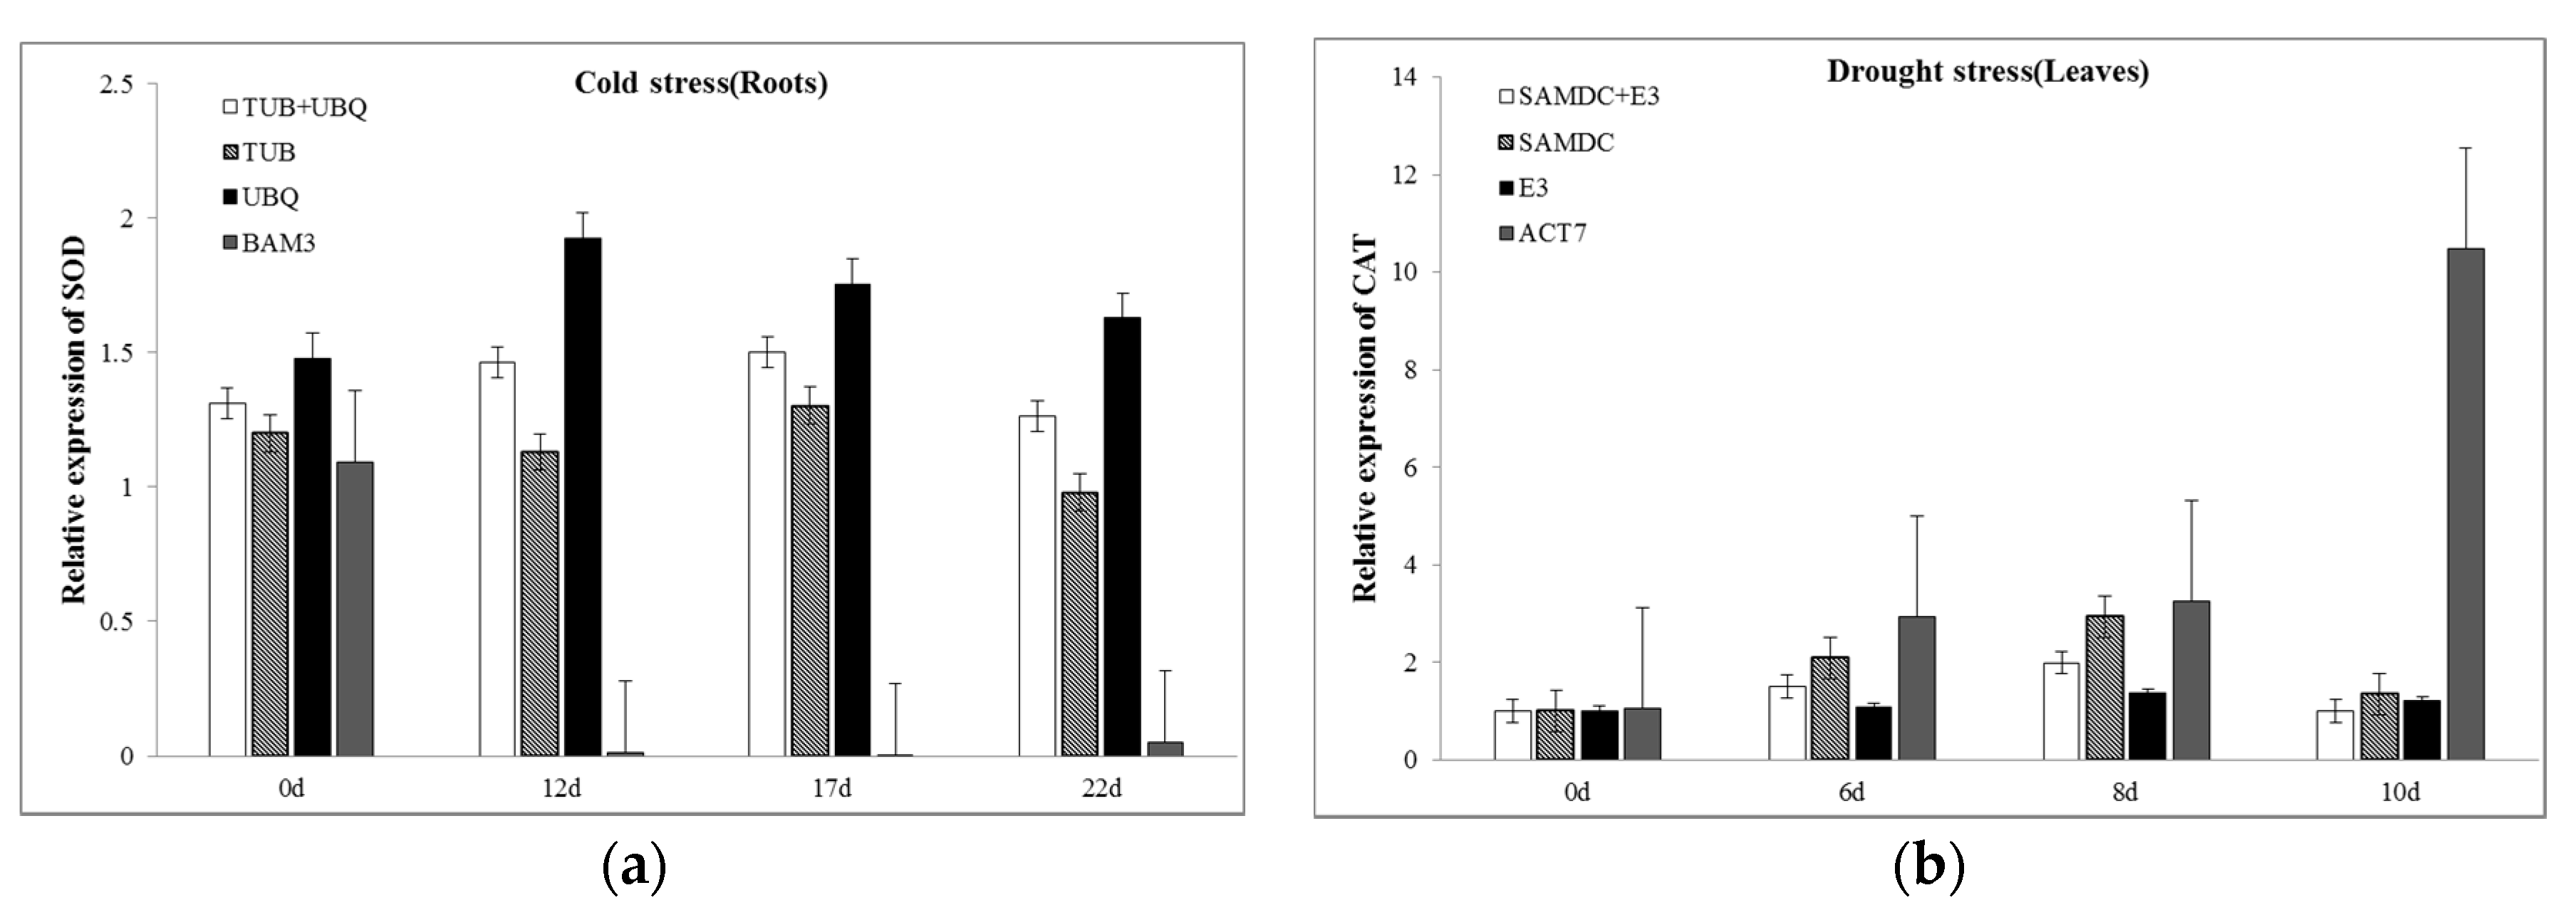
3.3. Validation of the Reference Genes Identified from this Study

The relative expression levels of Cyt-Cu/Zn superoxide dismutase (SOD) and catalase (CAT) genes were used to validate the performance of the identified reference genes in this study. SOD, which catalyzes superoxide to H2O2 and O2, initiates the defense system by removing superoxide, and it can be classified into three distinct groups by their metal cofactors: Cu/Zn, Mn, and Fe [32]. Cu/Zn SOD is present in the cytosol and chloroplasts [33]. Transgenic tobacco and cotton overexpressing chloroplastic Cu/Zn SOD and chloroplast-targeted MnSOD showed enhanced photosynthetic rates under chilling stress [34,35]. CAT reacts with H2O2 directly to form H2O and O2. In most species, SOD and CAT activities are relatively sensitive in response to various abiotic stresses [36].
The relative expression levels of Cyt-Cu/Zn SOD and CAT genes were normalized using the two most stable reference genes and the least stable reference gene in white clover at different times. As shown in Figure 6, the normalized expression level of SOD in roots increased at 12 days and then decreased under cold treatment when using the two most stable genes (TUB and UBQ), while the expression level at 12 days was extremely low when BAM3 was used as a reference gene. In response to drought stress, the expression levels of CAT in leaves were similar at 6 and 8 days. However, the relative expression decreased at 10 days when the two most stable genes (SAMDC and E3) were adopted. Meanwhile, a 10- to 11-fold higher expression level occurred at 10 days when using ACT7 as a reference gene.

4. Discussion

In the process of plant growth and development, it is inevitable to face a lot of adversities. Conventional breeding techniques usually take a long time for selecting valuable genes with stable expression, but transgenic technology could improve the efficiency greatly. When studying the molecular mechanisms of stress resistance in plants and cloning stress resistance genes, real-time quantitative PCR (qRT-PCR) is needed to analyze the expression of a target gene. The accurate determination of relative gene expression mainly depends on the reference genes [37]. Therefore, the selection of suitable reference genes can reduce the experimental error [38]. Previous studies have demonstrated that there is no “universal” reference gene applicable for various experimental conditions [39]. Thus, it is necessary to select matched reference genes for quantitative real-time PCR in white clover involved in various abiotic stresses.
In this study, we observed the growth process of plants under five abiotic stresses. Leaf and root tissues under mild, moderate, and severe stress were sampled. Fourteen frequently used reference genes were picked out, and their stability was analyzed by four software programs (GeNorm, NormFinder, BestKeeperand RefFinder) under five experimental conditions (drought, salt, cold, heat, and heavy metal stress). Notably, the different algorithms evaluating the expression stability of reference genes selected different stable genes due to their different mathematical calculations [40]. Furthermore, RefFinder was used to integrate and generate the comprehensive ranking of the candidate reference genes based on the geometric mean of the weights of every gene calculated by each program [27]. The RefFinder results show us the overall ranking order, which has been widely used to select suitable reference genes in previous studies. The GeNorm results showed that it was better to select two reference genes in most experimental conditions. Finally, we concluded that the top two reference genes as ranked by the RefFinder program should be selected. In order to validate these selected candidate reference genes in white clover, the relative expression levels of Cyt-Cu/Zn SOD and CAT genes were normalized using the two most stable reference genes and the least stable reference gene. The validation results suggested that using inappropriate reference genes may significantly increase the error of target gene expression and make the results unreliable.
Furthermore, we determined that there was no single reference gene that exhibits a constant expression level in all samples of various tissues and under different experimental conditions; this was consistent with previous research [41]. Rafael Narancio [15] determined that EF1a, followed by ACT11 and UBQ, was the most stably expressed gene across organs and treatments in white clover. From our results, ACT and UBQ also showed a high stability across most experimental conditions. However, under certain conditions, the most stable genes may be different from other species. Therefore, it is necessary to choose the most suitable reference gene for a more accurate result according to different experimental conditions, as the expression of a target gene is bound to change when using different reference genes.
In conclusion, 14 candidate reference genes were first selected in white clover. However, the optimal reference genes for different tissues (leaves and roots) under different experimental conditions are not identical. For all samples, 60SrRNA and ACT101 were the two top-ranked genes. Under drought stress, SAMDC and UBQ were identified as the most stable reference genes in the leaf and root samples, respectively. UBQ, SAMDC, and 60SrRNA were suggested as suitable reference genes in salt stress. For heat stress, the most stable gene was 60SrRNA in leaves, while UBQ was the most stable in roots. TUA was the most stable gene for cold-treated leaf samples, while TUB was the most stable gene for cold-treated root samples. For heavy metal stress, UBQ was the most stable gene in leaves, while ACT101 was the most stable gene in roots. For the first time, we analyzed the most stable reference genes for different tissues in white clover under five different abiotic stresses, providing the most suitable reference for gene expression analysis in later research. This is of great significance and will be helpful in exploring the potential molecular mechanisms of the abiotic stress response in white clover.

Author Contributions

Conceptualization, Z.L.; Data curation, Q.P.; Funding acquisition, Y.P.; Methodology, Z.L.; Software, G.N.; Supervision, Y.P.; Validation, J.Z. and L.L.; Writing—original draft, Q.P.; Writing—review & editing, Y.P. All authors have read and agreed to the published version of the manuscript.

Funding

This research was funded by the International Cooperation Project of Sichuan (Grand No. 2018HH0067) and Sichuan Forage Innovation Team Program (No.SCCXTD-2020-16).

Acknowledgments

Not applicable.

Conflicts of Interest

The authors declare no conflict of interest.

References

  1. Huang, L.; Yan, H.; Jiang, X.; Zhang, X.; Zhang, Y.; Huang, X.; Zhang, Y.; Miao, J.; Xu, B.; Frazier, Y. Evaluation of candidate reference genes for normalization of quantitative RT-PCR in switchgrass under various abiotic stress conditions. BioEnergy Res. 2014, 7, 1201–1211. [Google Scholar] [CrossRef]
  2. Schmittgen, T.D.; Zakrajsek, B.A. Effect of experimental treatment on housekeeping gene expression: Validation by real-time, quantitative RT-PCR. J. Biochem. Biophys. Methods 2000, 46, 69–81. [Google Scholar] [CrossRef]
  3. Liu, S.; Cai, P.; Hou, N.; Piao, X.; Wang, H.; Hung, T.; Chen, Q. Genome-wide identification and characterization of a panel of house-keeping genes in Schistosoma japonicum. Mol. Biochem. Parasitol. 2012, 182, 75–82. [Google Scholar] [CrossRef]
  4. Andersen, C.L.; Jensen, J.L.; Orntoft, T.F. Normalization of real-time quantitative reverse transcription-PCR data: A model-based variance estimation approach to identify genes suited for normalization, applied to bladder and colon cancer data sets. Cancer Res. 2004, 64, 5245–5250. [Google Scholar] [CrossRef] [Green Version]
  5. Ginzinger, D.G. Gene quantification using real-time quantitative PCR: An emerging technology hits the mainstream. Exp. Hematol. 2002, 30, 503–512. [Google Scholar] [CrossRef]
  6. Weyrich, A.; Axtner, J.; Sommer, S. Selection and validation of reference genes for real-time RT-PCR studies in the non-model species Delomys sublineatus, an endemic Brazilian rodent. Biochem. Biophys. Res. Commun. 2010, 392, 145–149. [Google Scholar] [CrossRef]
  7. Zhu, X.; Li, X.; Chen, W.; Chen, J.; Lu, W.; Chen, L.; Fu, D. Evaluation of new reference genes in papaya for accurate transcript normalization under different experimental conditions. PLoS ONE 2012, 7, e44405. [Google Scholar] [CrossRef]
  8. Li, Q.F.; Sun, S.; Yuan, D.Y.; Yu, H.X.; Gu, M.H.; Liu, Q.Q. Validation of candidate reference genes for the accurate normalization of real-time quantitative RT-PCR data in rice during seed development. Plant Mol. Biol. Rep. 2010, 28, 49–57. [Google Scholar] [CrossRef]
  9. Cook, N.L.; Robert, V.; Donkin, J.J.; Corinna, V.D.H. Validation of reference genes for normalization of real-time quantitative RT-PCR data in traumatic brain injury. J. Neurosci. Res. 2010, 87, 34–41. [Google Scholar] [CrossRef]
  10. Zheng, W.J.; Sun, L. Evaluation of housekeeping genes as references for quantitative real time RT-PCR analysis of gene expression in Japanese flounder (Paralichthys olivaceus). Fish Shellfish Immunol. 2011, 30, 638–645. [Google Scholar] [CrossRef]
  11. Zhang, Y.; Li, Z.; Li, Y.P.; Zhang, X.Q.; Ma, X.; Huang, L.K.; Yan, Y.H.; Peng, Y. Chitosan and spermine enhance drought resistance in white clover, associated with changes in endogenous phytohormones and polyamines, and antioxidant metabolism. Funct. Plant Biol. 2018, 45, 1205–1222. [Google Scholar] [CrossRef] [PubMed]
  12. Li, Z.; Zhu, Y.; He, X.; Yong, B.; Peng, Y.; Zhang, X.; Ma, X.; Yan, Y.; Huang, L.; Nie, G. The hydrogen sulfide, a downstream signaling molecule of hydrogen peroxide and nitric oxide, involves spermidine-regulated transcription factors and antioxidant defense in white clover in response to dehydration. Environ. Exp. Bot. 2019, 161, 255–264. [Google Scholar] [CrossRef]
  13. Li, Z.; Zhang, Y.; Zhang, X.; Merewitz, E.; Peng, Y.; Ma, X.; Huang, L.; Yan, Y. Metabolic pathways regulated by chitosan contributing to drought resistance in white clover. J. Proteome Res. 2017, 16, 3039–3052. [Google Scholar] [CrossRef] [PubMed]
  14. Tony, R.; Karen, S.; Kelly, O.; Dennis, M.; Jaco, V.; Ann, C. Normalisation of real-time RT-PCR gene expression measurements in Arabidopsis thaliana exposed to increased metal concentrations. Planta 2008, 227, 1343–1349. [Google Scholar]
  15. Narancio, R.; John, U.; Mason, J.; Spangenberg, G. Selection of optimal reference genes for quantitative RT-PCR transcript abundance analysis in white clover (Trifolium repens L.). Funct. Plant Biol. 2018, 45, 737–744. [Google Scholar] [CrossRef]
  16. Mukesh, J.; Aashima, N.; Tyagi, A.K.; Khurana, J.P. Validation of housekeeping genes as internal control for studying gene expression in rice by quantitative real-time PCR. Biochem. Biophys. Res. Commun. 2006, 345, 646–651. [Google Scholar]
  17. Mori, R.; Wang, Q.; Danenberg, K.D.; Pinski, J.K.; Danenberg, P.V. Both beta-actin and GAPDH are useful reference genes for normalization of quantitative RT-PCR in human FFPE tissue samples of prostate cancer. Prostate 2008, 68, 1555–1560. [Google Scholar] [CrossRef]
  18. Glare, E.M.; Divjak, M.; Bailey, M.J.; Walters, E.H. Beta-Actin and GAPDH housekeeping gene expression in asthmatic airways is variable and not suitable for normalising mRNA levels. Thorax 2002, 57, 765–770. [Google Scholar] [CrossRef] [Green Version]
  19. Kong, Q.; Yuan, J.; Niu, P.; Xie, J.; Jiang, W.; Huang, Y.; Bie, Z. Screening suitable reference genes for normalization in reverse transcription quantitative real-time PCR analysis in melon. PLoS ONE 2014, 9, e87197. [Google Scholar] [CrossRef]
  20. Xiao, Z.; Sun, X.; Liu, X.; Li, C.; He, L.; Chen, S.; Su, J. Selection of reliable reference genes for gene expression studies on rhododendron molle G. Don. Front. Plant Sci. 2016, 7, 1547. [Google Scholar] [CrossRef] [Green Version]
  21. Saraiva, K.D.; Fernandes de Melo, D.; Morais, V.D.; Vasconcelos, I.M.; Costa, J.H. Selection of suitable soybean EF1α genes as internal controls for real-time PCR analyses of tissues during plant development and under stress conditions. Plant Cell Rep. 2014, 33, 1453. [Google Scholar] [CrossRef] [PubMed]
  22. Shukla, P.; Reddy, R.A.; Ponnuvel, K.M.; Rohela, G.K.; Shabnam, A.A.; Ghosh, M.; Mishra, R.K. Selection of suitable reference genes for quantitative real-time PCR gene expression analysis in Mulberry (Morus alba L.) under different abiotic stresses. Mol. Biol. Rep. 2019, 46, 1809–1817. [Google Scholar] [CrossRef] [PubMed]
  23. Li, C.; Hu, L.; Wang, X.; Liu, H.; Tian, H.; Wang, J. Selection of reliable reference genes for gene expression analysis in seeds at different developmental stages and across various tissues in Paeonia ostii. Mol. Biol. Rep. 2019, 46, 6003–6011. [Google Scholar] [CrossRef] [PubMed]
  24. Vandesompele, J.; Preter, K.D.; Pattyn, F.; Poppe, B.; Roy, N.V.; Paepe, A.D.; Speleman, F. Accurate normalization of real-time quantitative RT-PCR data by geometric averaging of multiple internal control genes. Genome Biol. 2002, 3, research0034.1. [Google Scholar] [CrossRef] [PubMed] [Green Version]
  25. Wang, Q.; Ishikawa, T.; Michiue, T.; Zhu, B.L.; Guan, D.W.; Maeda, H. Stability of endogenous reference genes in postmortem human brains for normalization of quantitative real-time PCR data: Comprehensive evaluation using geNorm, NormFinder, and BestKeeper. Int. J. Leg. Med. 2012, 126, 943–952. [Google Scholar] [CrossRef]
  26. Pfaffl, M.W.; Tichopad, A.; Prgomet, C.; Neuvians, T.P. Determination of stable housekeeping genes, differentially regulated target genes and sample integrity: BestKeeper--Excel-based tool using pair-wise correlations. Biotechnol. Lett. 2004, 26, 509–515. [Google Scholar] [CrossRef]
  27. Xie, F.; Xiao, P.; Chen, D.; Xu, L.; Zhang, B. miRDeepFinder: A miRNA analysis tool for deep sequencing of plant small RNAs. Plant Mol. Biol. 2012, 80, 75–84. [Google Scholar] [CrossRef]
  28. Andreas, U.; Ioana, C.; Triinu, K.; Jian, Y.; Faircloth, B.C.; Maido, R.; Steven, G.R. Primer3--new capabilities and interfaces. Nucleic Acids Res. 2012, 40, e115. [Google Scholar]
  29. Chen, Y.; Hu, B.; Tan, Z.; Liu, J.; Yang, Z.; Li, Z.; Huang, B.R. Selection of reference genes for quantitative real-time PCR normalization in creeping bentgrass involved in four abiotic stresses. Plant Cell Rep. 2015, 34, 1825–1834. [Google Scholar] [CrossRef]
  30. Jacinta, G.; Nicholas, E.; Allen, V.D.; Eduardo, B. Selection and validation of reference genes for gene expression analysis in switchgrass (Panicum virgatum) using quantitative real-time RT-PCR. PLoS ONE 2014, 9, e91474. [Google Scholar]
  31. Wong, M.L.; Medrano, J.F. Real-time PCR for mRNA quantitation. Biotechniques 2005, 39, 75–85. [Google Scholar] [CrossRef] [PubMed]
  32. Lee, S.C.; Kwon, S.Y.; Kim, S.R. Ectopic expression of a cold-responsive CuZn superoxide dismutase gene, SodCc1, in transgenic rice(Oryza sativa L.). J. Plant Biol. 2009, 52, 154–160. [Google Scholar] [CrossRef]
  33. Jackson, C.; Dench, J.; Moore, A.L.; Halliwell, B.; Foyer, C.H.; Hall, D.O. Subcellular localisation and identification of superoxide dismutase in the leaves of higher plants. Eur. J. Biochem. 1978, 91, 339–344. [Google Scholar] [CrossRef] [PubMed]
  34. Gupta, A.S.; Heinen, J.L.; Holaday, A.S.; Burke, J.J.; Allen, R.D. Increased resistance to oxidative stress in transgenic plants that overexpress chloroplastic Cu/Zn superoxide dismutase. Proc. Natl. Acad. Sci. USA 1993, 90, 1629–1633. [Google Scholar] [CrossRef] [Green Version]
  35. Kornyeyev, D.; Logan, B.P.; Allen, R.D.; Holaday, A.S. Enhanced photochemical light utilization and decreased chilling-inducedphotoinhibition of photosystem II in cotton overexpressing genes encodingchloroplast-targeted antioxidant enzymes. Physiol. Plant 2010, 113, 323–331. [Google Scholar] [CrossRef] [Green Version]
  36. Zhang, J.; Kirkham, M.B. Drought-stress-induced changes in activities of superoxide dismutase, catalase, and peroxidase in wheat species. Plant Cell Physiol. 1994, 35, 785–791. [Google Scholar] [CrossRef]
  37. Huang, T.; Long, J.; Liu, S.W.; Yang, Z.W.; Zhu, Q.J.; Zhao, X.L.; Peng, C.C. Selection and validation of reference genes for mRNA expression by quantitative real-time PCR analysis in neolamarckia cadamba. Sci. Rep. 2018, 8, 9311. [Google Scholar] [CrossRef]
  38. Dheda, K.; Huggett, J.F.; Chang, J.S.; Kim, L.U.; Bustin, S.A.; Johnson, M.A.; Rook, G.A.W.; Zumla, A. The implications of using an inappropriate reference gene for real-time reverse transcription PCR data normalization. Anal. Biochem. 2005, 344, 141–143. [Google Scholar] [CrossRef]
  39. Lü, J.; Chen, S.; Guo, M.; Ye, C.; Qiu, B.; Wu, J.; Yang, C.; Pan, H. Selection and validation of reference genes for RT-qPCR analysis of the ladybird beetle Henosepilachna vigintioctomaculata. Front. Physiol. 2018, 9, e01614. [Google Scholar] [CrossRef] [Green Version]
  40. Zhao, D.; Wang, X.; Chen, J.; Huang, Z.; Huo, H.; Jiang, C.; Huang, H.; Zhang, C.; Wei, S. Selection of reference genes for qPCR normalization in buffalobur (Solanum rostratum Dunal). Sci. Rep. 2019, 9, 6948. [Google Scholar] [CrossRef] [Green Version]
  41. Artico, S.; Nardeli, S.M.; Brilhante, O.; Grossi-De-Sa, M.F.; Alves-Ferreira, M. Identification and evaluation of new reference genes in Gossypium hirsutum for accurate normalization of real-time quantitative RT-PCR data. BMC Plant Biol. 2010, 10, 49. [Google Scholar] [CrossRef] [PubMed] [Green Version]
Figure 1. PCR products of 14 reference genes. M, DNA marker; 1, ACT7; 2, ACT101; 3, TUA; 4, TUB; 5, CYP; 6, 60S rRNA; 7, UBQ; 8, E3; 9, GAPDH1; 10, GAPDH2; 11, PP2A; 12, BAM3; 13, SAMDC; 14, ABC.
Plants 09 00996 g001
Figure 2. Melting curves for 14 reference genes (the horizontal lines represent baseline thresholds).
Plants 09 00996 g002
Figure 3. qRT-PCR Cq values for 14 candidate reference genes in white clover leaf and root samples under various abiotic stresses.
Plants 09 00996 g003
Figure 4. Average expression stability values (M) of candidate reference genes as determined by GeNorm analysis.
Plants 09 00996 g004
Figure 5. Pairwise variation (V) measure of the candidate reference genes.
Plants 09 00996 g005
Figure 6. Relative expression levels of target genes. (a) Relative expression levels of Cyt-Cu/Zn SOD under cold stress using the two most stable reference genes and the least stable reference gene for normalization in white clover root tissues at different times; (b) relative expression levels of CAT under drought stress using the two most stable reference genes and the least stable reference gene for normalization in white clover leaf tissues at different times.
Plants 09 00996 g006
Table 1. Primer sequences for 14 reference genes used in the real-time qRT-PCR analysis.
Gene AbbreviationGene NamePrimer Sequence Forward and ReverseAmplicon Length (bp)Tm (°C)Accession Number
ACT7Actin 7GGCAGACGCTGAGGATATTCAACC ATGACGTGGTCGGCCAACAATAC12460.3MT822509
ACT101Actin 101TGCTTGATTCCGGTGATGGTGTG TTCTCGGCAGAGGTACTGAAGGAG16360.3MT822510
TUAAlpha tubulinTGGAGGAACTGGATCTGGTCTTGG AACAGGACAGCAACATCGGTGTG18660.6MT822511
TUBBeta tubulinCCAGCAGTACCGCAACTTGTCTG ACGACCGTGGCGTGGATCTG9462.3MT822512
CYPCyclophilinACGTTGTGTTCGGTCAAGTTGTTG GGCGACGACAACAGGCTTAGAG10159.6MT822513
60S rRNA 60S ribosomal RNAAACGGTGCTGTGGAGACAATGTAC TTGTGGAACTGCTTAGTGCTCTCC13459.5MT822514
UBQUbiquitinACTGCGTGCAACCAAGGATGATAG TGCCTCGTCTGAAGACTGACCAG16360.0MT822515
E3UbiquitinATTGCCTGCTGATCCTGATCTGC ACCACTGCAACCACACCAAGC9560.7MT822516
GAPDH1Glyceraldehyde 3-phosphate dehydrogenase 1GCGTGAACGAGGCTGACTACAAG CCTTGACGATGCCGAACTTCTCC11760.8MT822517
GAPDH2Glyceraldehyde 3-phosphate dehydrogenase 2CCATCACTGCCACTCAGAAGACTG AATGTTGAATGAGGCGGCTCTTCC8060.1MT822518
PP2AProtein phosphatase 2ACGGAGCCGGTGTTGTGACAAG AGGCGTGCTCTGTAGGAACTCC19961.9MT822519
BAM3Beta-amylase 3TGTTGGTGACTCATGCAGCATTCC GTGGTGTCCTTCCGGCAAGAAC15860.8MT822520
SAMDCS-adenosylmethionine decarboxylaseTCAGCAGCCAAGATGACCAACAAC ACAGCAGCACCTTCAACAGAGTTC11960.0MT822521
ABCATP-bindingAAGGATGTACCGCGCCTTCTTATG ATCTCCGCATCTTCCGCACAATAC8259.5MT822522
Table 2. Expression stability values for 14 white clover candidate reference genes calculated using NormFinder.
RankDrought StressSalt StressHeat StressCold StressHeavy metal StressAll Samples
LeavesRootsLeavesRootsLeavesRootsLeavesRootsLeavesRoots
1E3
(0.029)
UBQ
(0.164)
60S
(0.154)
SAMDC
(0.136)
60S
(0.106)
UBQ
(0.063)
TUA1109
(0.032)
UBQ
(0.061)
UBQ
(0.156)
ACT101
(0.101)
UBQ
(0.049)
2SAMDC
(0.029)
CYP
(0.180)
UBQ
(0.286)
CYP
(0.136)
TUA1109
(0.156)
BAM3
(0.063)
ACT101
(0.053)
TUB
(0.072)
CYP
(0.177)
TUA1109
(0.124)
TUB
(0.125)
3UBQ
(0.043)
60S
(0.195)
CYP
(0.444)
60S
(0.203)
GAPDH2
(0.171)
CYP
(0.136)
CYP
(0.081)
PP2A
(0.185)
60S
(0.189)
CYP
(0.140)
CYP
(0.130)
460S
(0.124)
ABC
(0.299)
SAMDC
(0.487)
ACT101
(0.267)
ACT7
(0.303)
ABC
(0.498)
UBQ
(0.100)
GAPDH1
(0.226)
PP2A
(0.266)
SAMDC
(0.198)
GAPDH2
(0.171)
5CYP
(0.287)
PP2A
(0.431)
BAM3
(0.526)
ACT7
(0.350)
E3
(0.316)
60S
(0.512)
ACT7
(0.108)
ACT101
(0.227)
E3
(0.270)
E3
(0.224)
ACT101
(0.349)
6GAPDH2
(0.307)
TUB
(0.432)
E3
(0.564)
TUA1109
(0.451)
CYP
(0.326)
SAMDC
(0.544)
E3
(0.111)
ACT7
(0.255)
GAPDH2
(0.372)
PP2A
(0.229)
TUA
(0.414)
7ACT101
(0.477)
GAPDH2
(0.514)
ACT101
(0.686)
GAPDH2
(0.576)
ACT101
(0.384)
E3
(0.553)
ABC
(0.115)
CYP
(0.272)
GAPDH1
(0.388)
GAPDH2
(0.291)
GAPDH1
(0.487)
8PP2A
(0.506)
ACT101
(0.536)
GAPDH2
(0.919)
UBQ
(0.644)
BAM3
(0.401)
GAPDH1
(0.595)
BAM3
(0.137)
60S
(0.291)
TUB
(0.405)
ACT7
(0.295)
PP2A
(0.526)
9TUA1109
(0.538)
E3
(0.565)
ACT7
(1.029)
TUB
(0.657)
UBQ
(0.444)
TUB
(0.646)
GAPDH2
(0.164)
E3
(0.300)
SAMDC
(0.418)
ABC
(0.295)
SAMDC
(0.527)
10ABC
(0.584)
TUA1109
(0.662)
TUB
(1.257)
GAPDH1
(0.754)
PP2A
(0.656)
ACT101
(0.656)
60S
(0.248)
TUA1109
(0.342)
ABC
(0.430)
60S
(0.328)
ABC
(0.607)
11BAM3
(0.604)
SAMDC
(0.700)
TUA1109
(1.279)
E3
(0.816)
TUB
(0.765)
ACT7
(0.688)
PP2A
(0.256)
ABC
(0.349)
TUA1109
(0.464)
TUB
(0.335)
E3
(0.649)
12ACT7
(0.891)
ACT7
(0.765)
ABC
(1.288)
ABC
(1.025)
SAMDC
(0.859)
TUA1109
(0.919)
SAMDC
(0.257)
SAMDC
(0.362)
ACT101
(0.547)
GAPDH1
(0.386)
ACT7
(0.708)
13TUB
(1.008)
GAPDH1
(1.103)
GAPDH1
(1.979)
BAM3
(1.182)
ABC
(0.873)
GAPDH2
(1.283)
GAPDH1
(0.335)
GAPDH2
(0.399)
BAM3
(0.813)
UBQ
(0.532)
60S
(0.773)
14GAPDH1
(1.871)
BAM3
(1.112)
PP2A
(2.064)
PP2A
(1.794)
GAPDH1
(1.117)
PP2A
(2.200)
TUB
(0.358)
BAM3
(0.537)
ACT7
(0.914)
BAM3
(0.906)
BAM3
(2.841)
Table 3. Expression stability values for 14 white clover candidate reference genes calculated using BestKeeper.
RankDrought StressSalt StressHeat StressCold StressHeavy Metal StressAll Samples
LeavesRootsLeavesRootsLeavesRootsLeavesRootsLeavesRoots
1GAPDH1
(1.25 ± 0.31)
GAPDH1
(0.73 ± 0.18)
GAPDH1
(0.25 ± 0.06)
GAPDH1
(0.01 ± 0.00)
GAPDH1
(0.20 ± 0.05)
TUB
(0.20 ± 0.06)
GAPDH1
(0.03 ± 0.01)
TUB
(0.19 ± 0.07)
TUB
(0.02 ± 0.01)
TUB
(0.06 ± 0.02)
TUB
(4.73 ± 1.47)
2TUB
(2.28 ± 0.67)
BAM3
(1.33 ± 0.46)
PP2A
(1.55 ± 4.81)
TUB
(0.35 ± 0.11)
TUB
(1.06 ± 0.32)
GAPDH1
(0.38 ± 0.09)
TUB
(0.18 ± 0.06)
GAPDH1
(0.24 ± 0.07)
GAPDH1
(0.32 ± 0.08)
GAPDH1
(0.18 ± 0.04)
PP2A
(5.39 ± 1.78)
3E3
(5.89 ± 1.74)
TUB
(2.27 ± 0.67)
BAM3
(2.26 ± 6.73)
BAM3
(1.40 ± 0.48)
ACT101
(2.42 ± 0.71)
ABC
(0.89 ± 0.30)
PP2A
(0.48 ± 0.16)
PP2A
(0.48 ± 0.16)
CYP
(0.76 ± 0.20)
SAMDC
(0.50 ± 0.14)
BAM3
(5.44 ± 1.84)
4BAM3
(5.91 ± 1.75)
E3
(2.50 ± 0.69)
SAMDC
(2.48 ± 8.60)
ACT101
(2.82 ± 0.83)
ACT7
(2.61 ± 0.78)
E3
(1.71 ± 0.56)
UBQ
(0.87 ± 0.29)
UBQ
(0.55 ± 0.20)
E3
(0.78 ± 0.26)
TUA1109
(0.64 ± 0.20)
SAMDC
(6.17 ± 1.77)
560S
(6.15 ± 1.56)
ABC
(2.61 ± 0.73)
ABC
(2.78 ± 9.20)
SAMDC
(3.20 ± 0.94)
TUA1109
(2.99 ± 0.92)
UBQ
(1.99 ± 0.68)
ACT101
(0.92 ± 0.29)
ACT101
(0.90 ± 0.28)
UBQ
(0.97 ± 0.35)
CYP
(0.91 ± 0.23)
E3
(6.20 ± 1.97)
6UBQ
(6.20 ± 1..80)
UBQ
(3.86 ± 1.08)
TUB
(2.80 ± 0.84)
PP2A
(3.49 ± 1.15)
GAPDH2
(3.03 ± 0.88)
CYP
(2.16 ± 0.57)
TUA1109
(1.01 ± 0.34)
CYP
(1.03 ± 0.31)
SAMDC
(1.05 ± 0.32)
BAM3
(1.54 ± 0.52)
GAPDH1
(6.32 ± 1.63)
7CYP
(6.21 ± 1.38)
CYP
(4.73 ± 1.03)
E3
(6.16 ± 1.93)
60S
(3.53 ± 0.98)
CYP
(3.36 ± 0.84)
BAM3
(2.23 ± 0.81)
ACT7
(1.30 ± 0.43)
ABC
(1.11 ± 0.38)
PP2A
(1.06 ± 0.38)
ACT7
(1.66 ± 0.51)
ACT101
(6.85 ± 2.01)
8PP2A
(6.71 ± 2.09)
PP2A
(5.12 ± 1.52)
CYP
(6.59 ± 1.61)
ACT7
(3.57 ± 1.11)
60S
(4.13 ± 1.16)
SAMDC
(3.78 ± 1.16)
E3
(1.34 ± 0.43)
ACT7
(1.16 ± 0.41)
BAM3
(1.21 ± 0.41)
PP2A
(1.72 ± 0.60)
UBQ
(7.14 ± 2.35)
9SAMDC
(6.91 ± 1.81)
60S
(5.48 ± 1.28)
60S
(6.65 ± 1.86)
CYP
(3.72 ± 0.94)
BAM3
(4.26 ± 1.43)
ACT7
(4.07 ± 1.34)
GAPDH2
(1.36 ± 0.41)
BAM3
(1.25 ± 0.46)
ABC
(2.04 ± 0.69)
ACT101
(1.78 ± 0.52)
60S
(7.21 ± 2.02)
10TUA1109
(7.99 ± 2.25)
TUA1109
(5.90 ± 1.58)
UBQ
(6.80 ± 2.24)
TUA1109
(3.76 ± 1.19)
E3
(4.79 ± 1.48)
60S
(4.37 ± 1.29)
BAM3
(1.38 ± 0.43)
E3
(1.28 ± 0.45)
60S
(2.06 ± 0.63)
E3
(1.85 ± 0.61)
TUA1109
(7.35 ± 2.31)
11ABC
(8.02 ± 2.21)
GAPDH2
(6.18 ± 1.52)
ACT101
(8.65 ± 2.57)
UBQ
(3.92 ± 1.32)
UBQ
(4.80 ± 1.54)
ACT101
(4.55 ± 1.40)
CYP
(1.40 ± 0.38)
GAPDH2
(1.29 ± 0.42)
GAPDH2
(2.66 ± 0.83)
ABC
(2.03 ± 0.69)
CYP
(7.48 ± 1.90)
12GAPDH2
(8.09 ± 2.06)
ACT101
(6.40 ± 1.60)
ACT7
(8.84 ± 2.72)
GAPDH2
(4.32 ± 1.27)
PP2A
(5.02 ± 1.70)
TUA1109
(4.62 ± 1.50)
ABC
(1.43 ± 0.43)
SAMDC
(1.31 ± 0.40)
TUA1109
(2.68 ± 0.90)
GAPDH2
(2.23 ± 0.65)
ACT7
(7.70 ± 2.40)
13ACT101
(8.37 ± 2.19)
ACT7
(6.59 ± 1.79)
GAPDH2
(9.52 ± 2.82)
E3
(4.97 ± 1.58)
ABC
(6.66 ± 2.02)
PP2A
(4.74 ± 1.55)
60S
(1.79 ± 0.53)
TUA1109
(1.33 ± 0.46)
ACT101
(3.15 ± 1.00)
60S
(2.52 ± 0.70)
GAPDH2
(7.84 ± 2.30)
14ACT7
(9.56 ± 2.63)
SAMDC
(7.12 ± 1.79)
TUA1109
(9.72 ± 3.11)
ABC
(5.23 ± 1.71)
SAMDC
(6.89 ± 1.98)
GAPDH2
(6.33 ± 2.05)
SAMDC
(1.93 ± 0.55)
60S
(1.53 ± 0.46)
ACT7
(3.91 ± 1.31)
UBQ
(2.71 ± 0.92)
ABC
(8.33 ± 2.61)
Table 4. Expression stability values for white clover candidate reference genes calculated using RefFinder.
TreatmentRanking order
1234567891011121314
All samples60SACT101E3SAMDCCYPTUA1109TUBUBQGAPDH2ACT7GAPDH1PP2ABAM3ABC
Drought stress (Leaves)SAMDCE3UBQ60SGAPDH2CYPGAPDH1ACT101TUBTUA1109PP2ABAM3ABCACT7
Drought stress (Roots)UBQ60SPP2ACYPACT101ABCGAPDH2TUBGAPDH1E3BAM3SAMDCTUA1109ACT7
Salt stress (Leaves)UBQSAMDC60SACT101CYPBAM3GAPDH1E3TUBGAPDH2ACT7PP2ATUA1109ABC
Salt stress (Roots)SAMDC60SACT7TUA1109CYPACT101GAPDH1TUBGAPDH2UBQBAM3E3ABCPP2A
Heat stress (Leaves)60SACT7GAPDH2ACT101TUA1109CYPE3GAPDH1TUBBAM3UBQPP2ASAMDCABC
Heat stress (Roots)UBQBAM3TUBGAPDH1CYPABCE360SSAMDCACT101ACT7TUA1109GAPDH2PP2A
Cold stress (Leaves)TUA1109ACT7ACT101E3CYPUBQABCGAPDH1BAM3PP2ATUBGAPDH260SSAMDC
Cold stress (Roots)TUBUBQACT7ACT101PP2AGAPDH1E3CYP60SABCGAPDH2SAMDCTUA1109BAM3
Heavy metal stress (Leaves)UBQCYPPP2AE3TUBGAPDH160SSAMDCGAPDH2ABCTUA1109BAM3ACT101ACT7
Heavy metal stress (Roots)ACT101E3TUA1109CYPGAPDH2SAMDCTUBPP2AABCGAPDH1ACT760SBAM3UBQ

