A Practical Method to Implement Strain-Level Metagenomics-Based Foodborne Outbreak Investigation and Source Tracking in Routine

 , , and
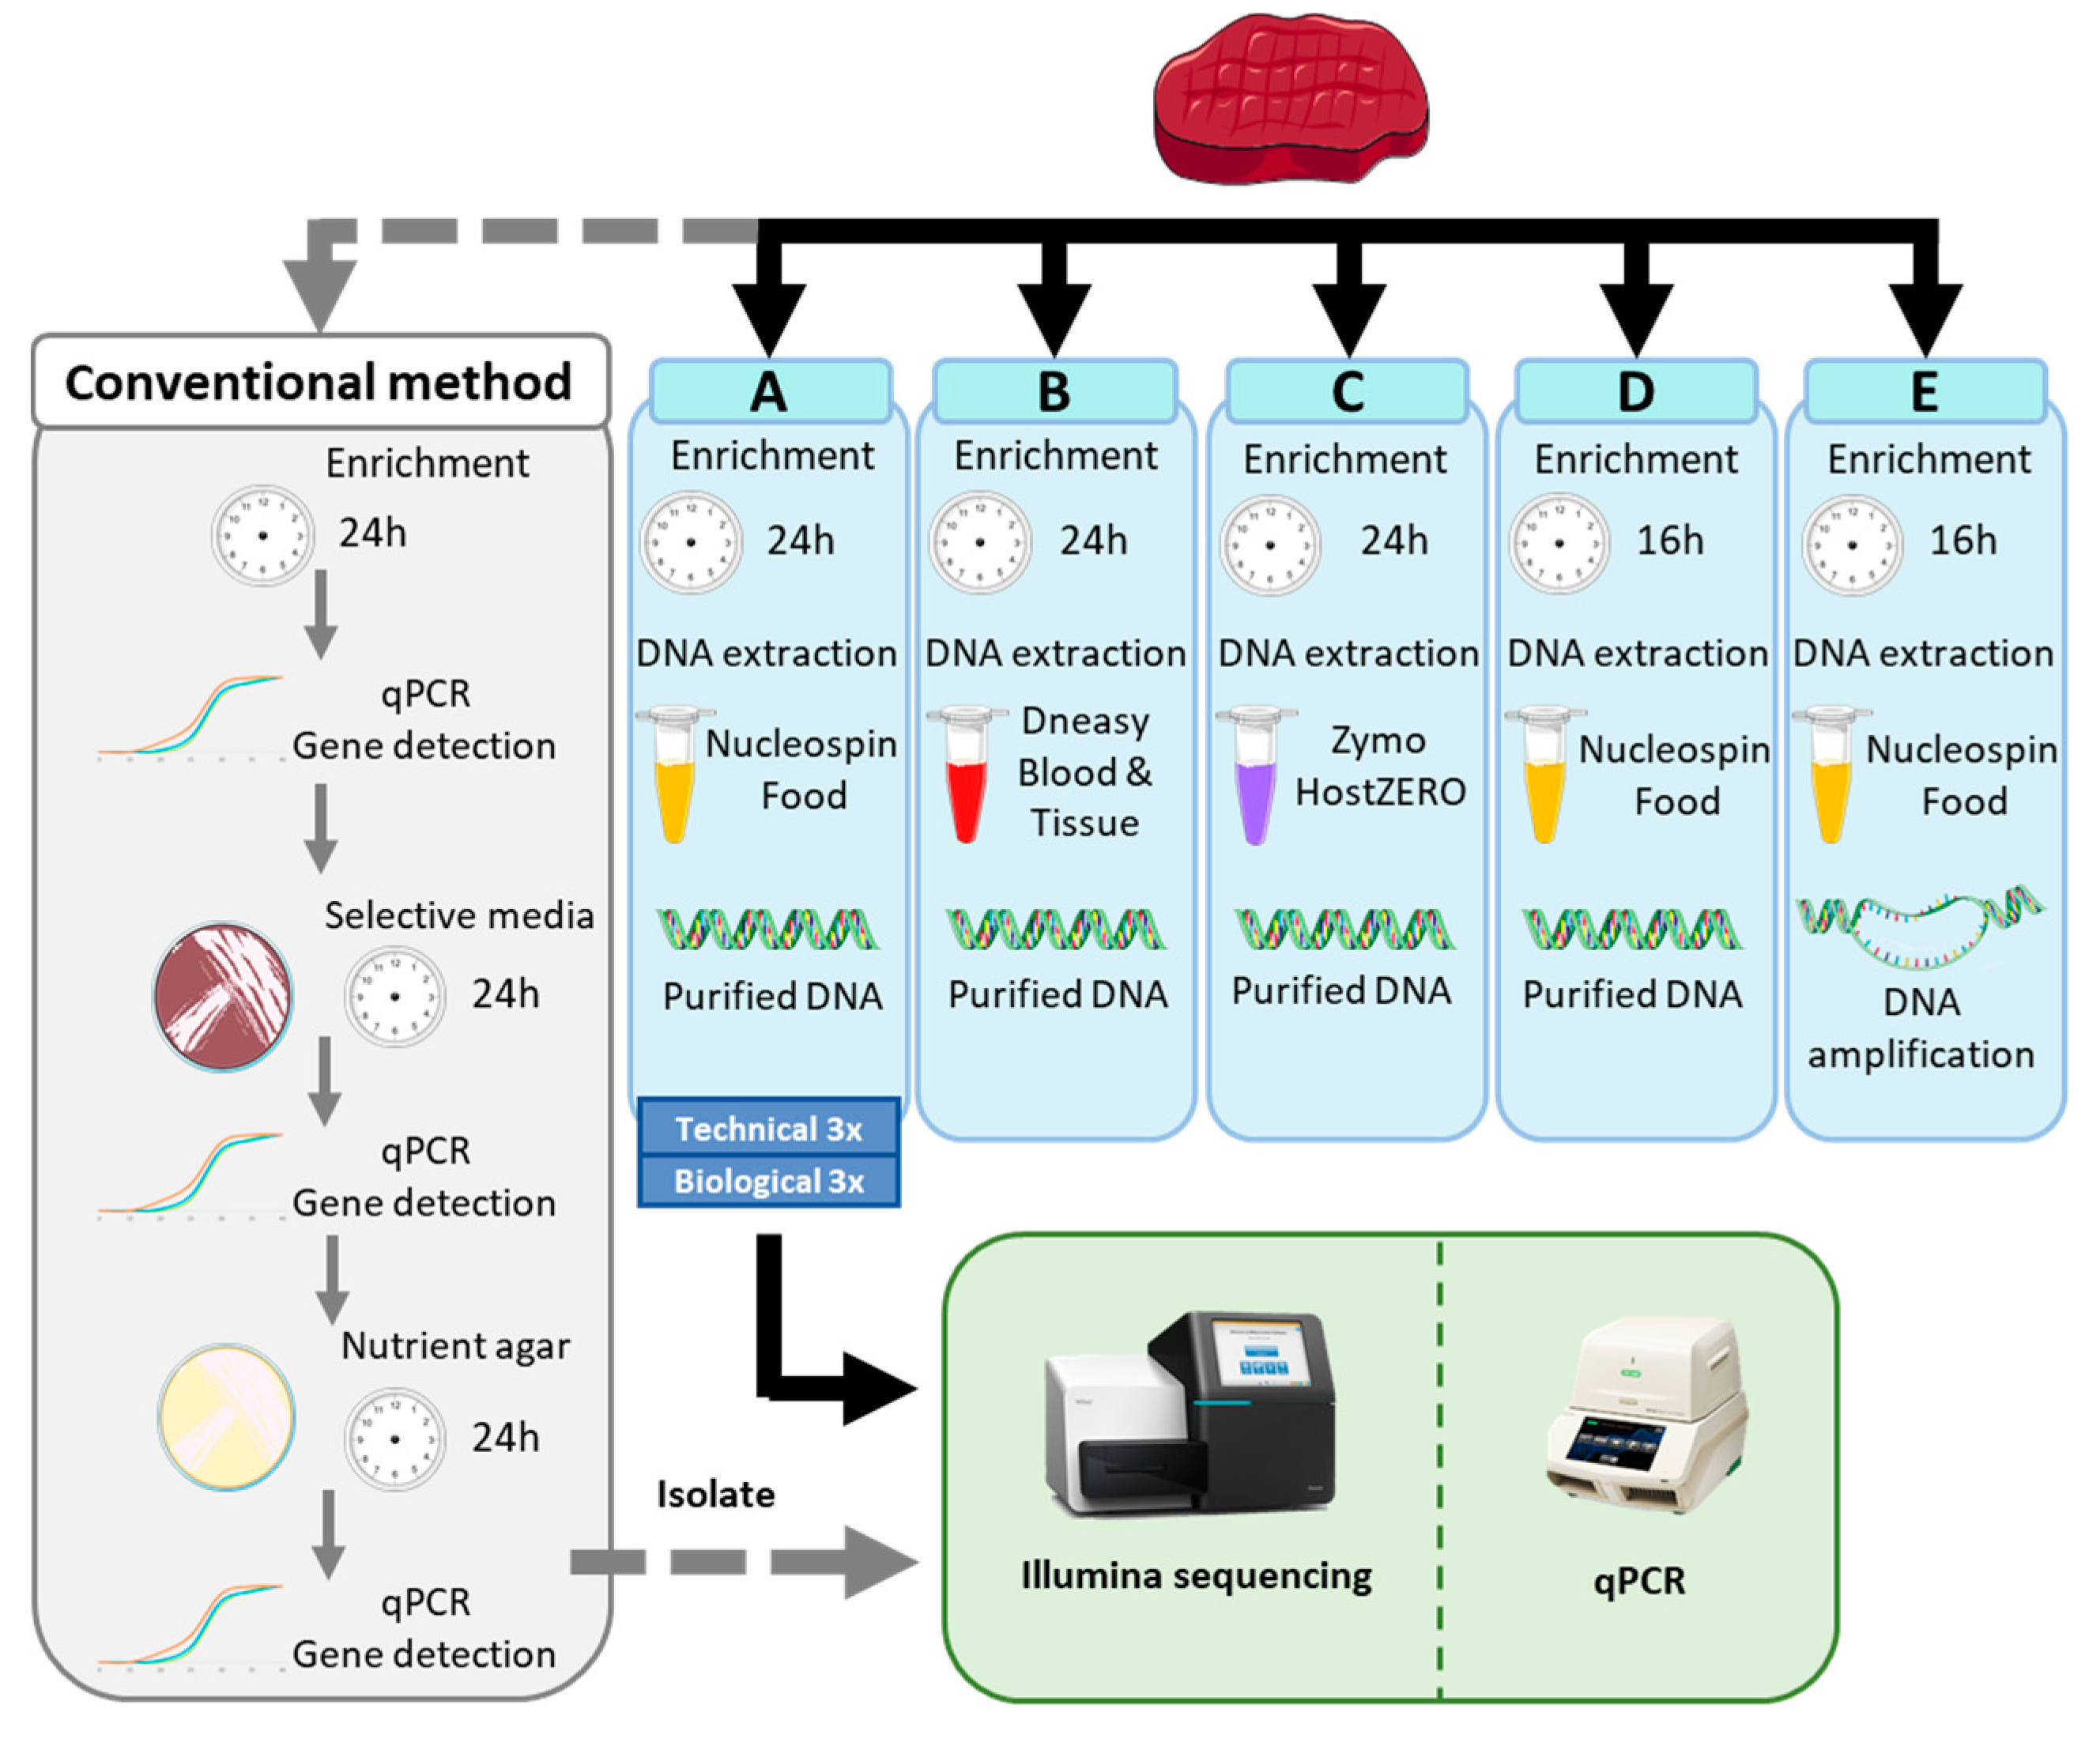
Abstract
:1. Introduction
2. Materials and Methods
2.1. Spiked Sample Preparation
2.2. DNA Extract Preparation
2.3. Real-Time Polymerase Chain Reaction Verification
2.4. Validation with ISO Method
2.5. Next-Generation Sequencing
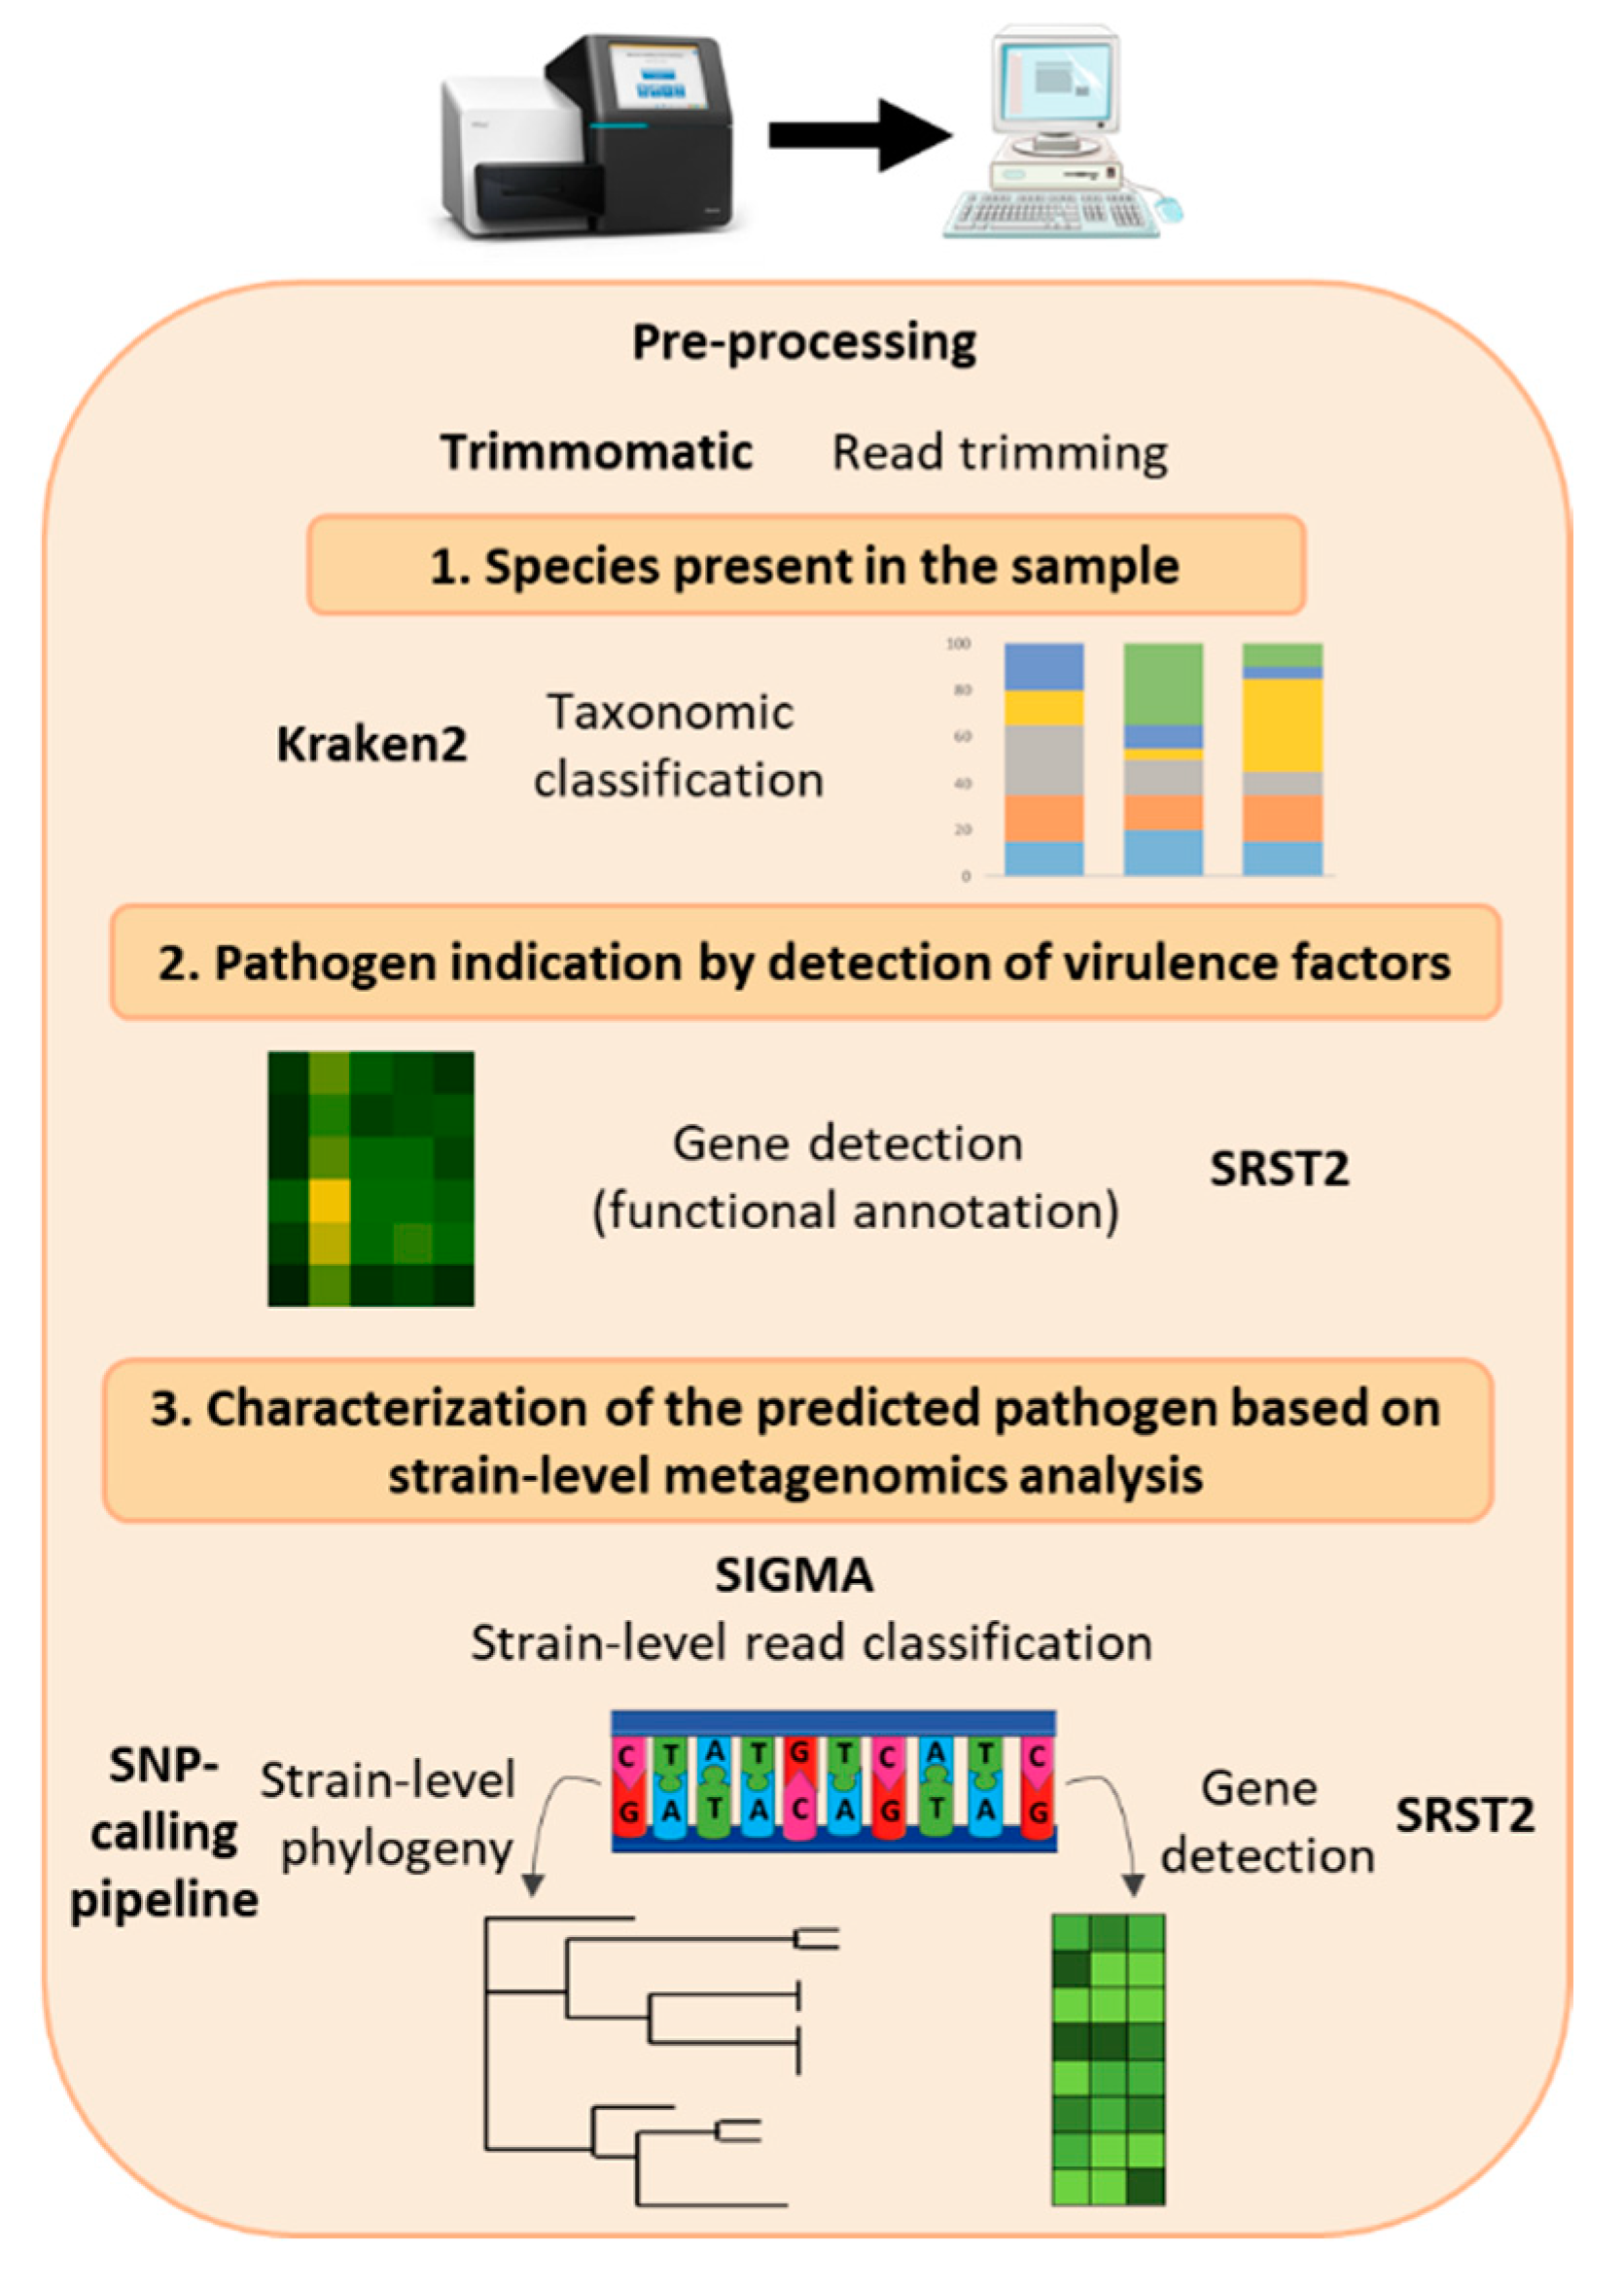
2.6. Data Analysis
3. Results
3.1. Testing of 5 Sample Preparation Workflows for Metagenomics Analysis Applied on Spiked Beef
3.1.1. Comparison of the Experiment with Conventional Methods
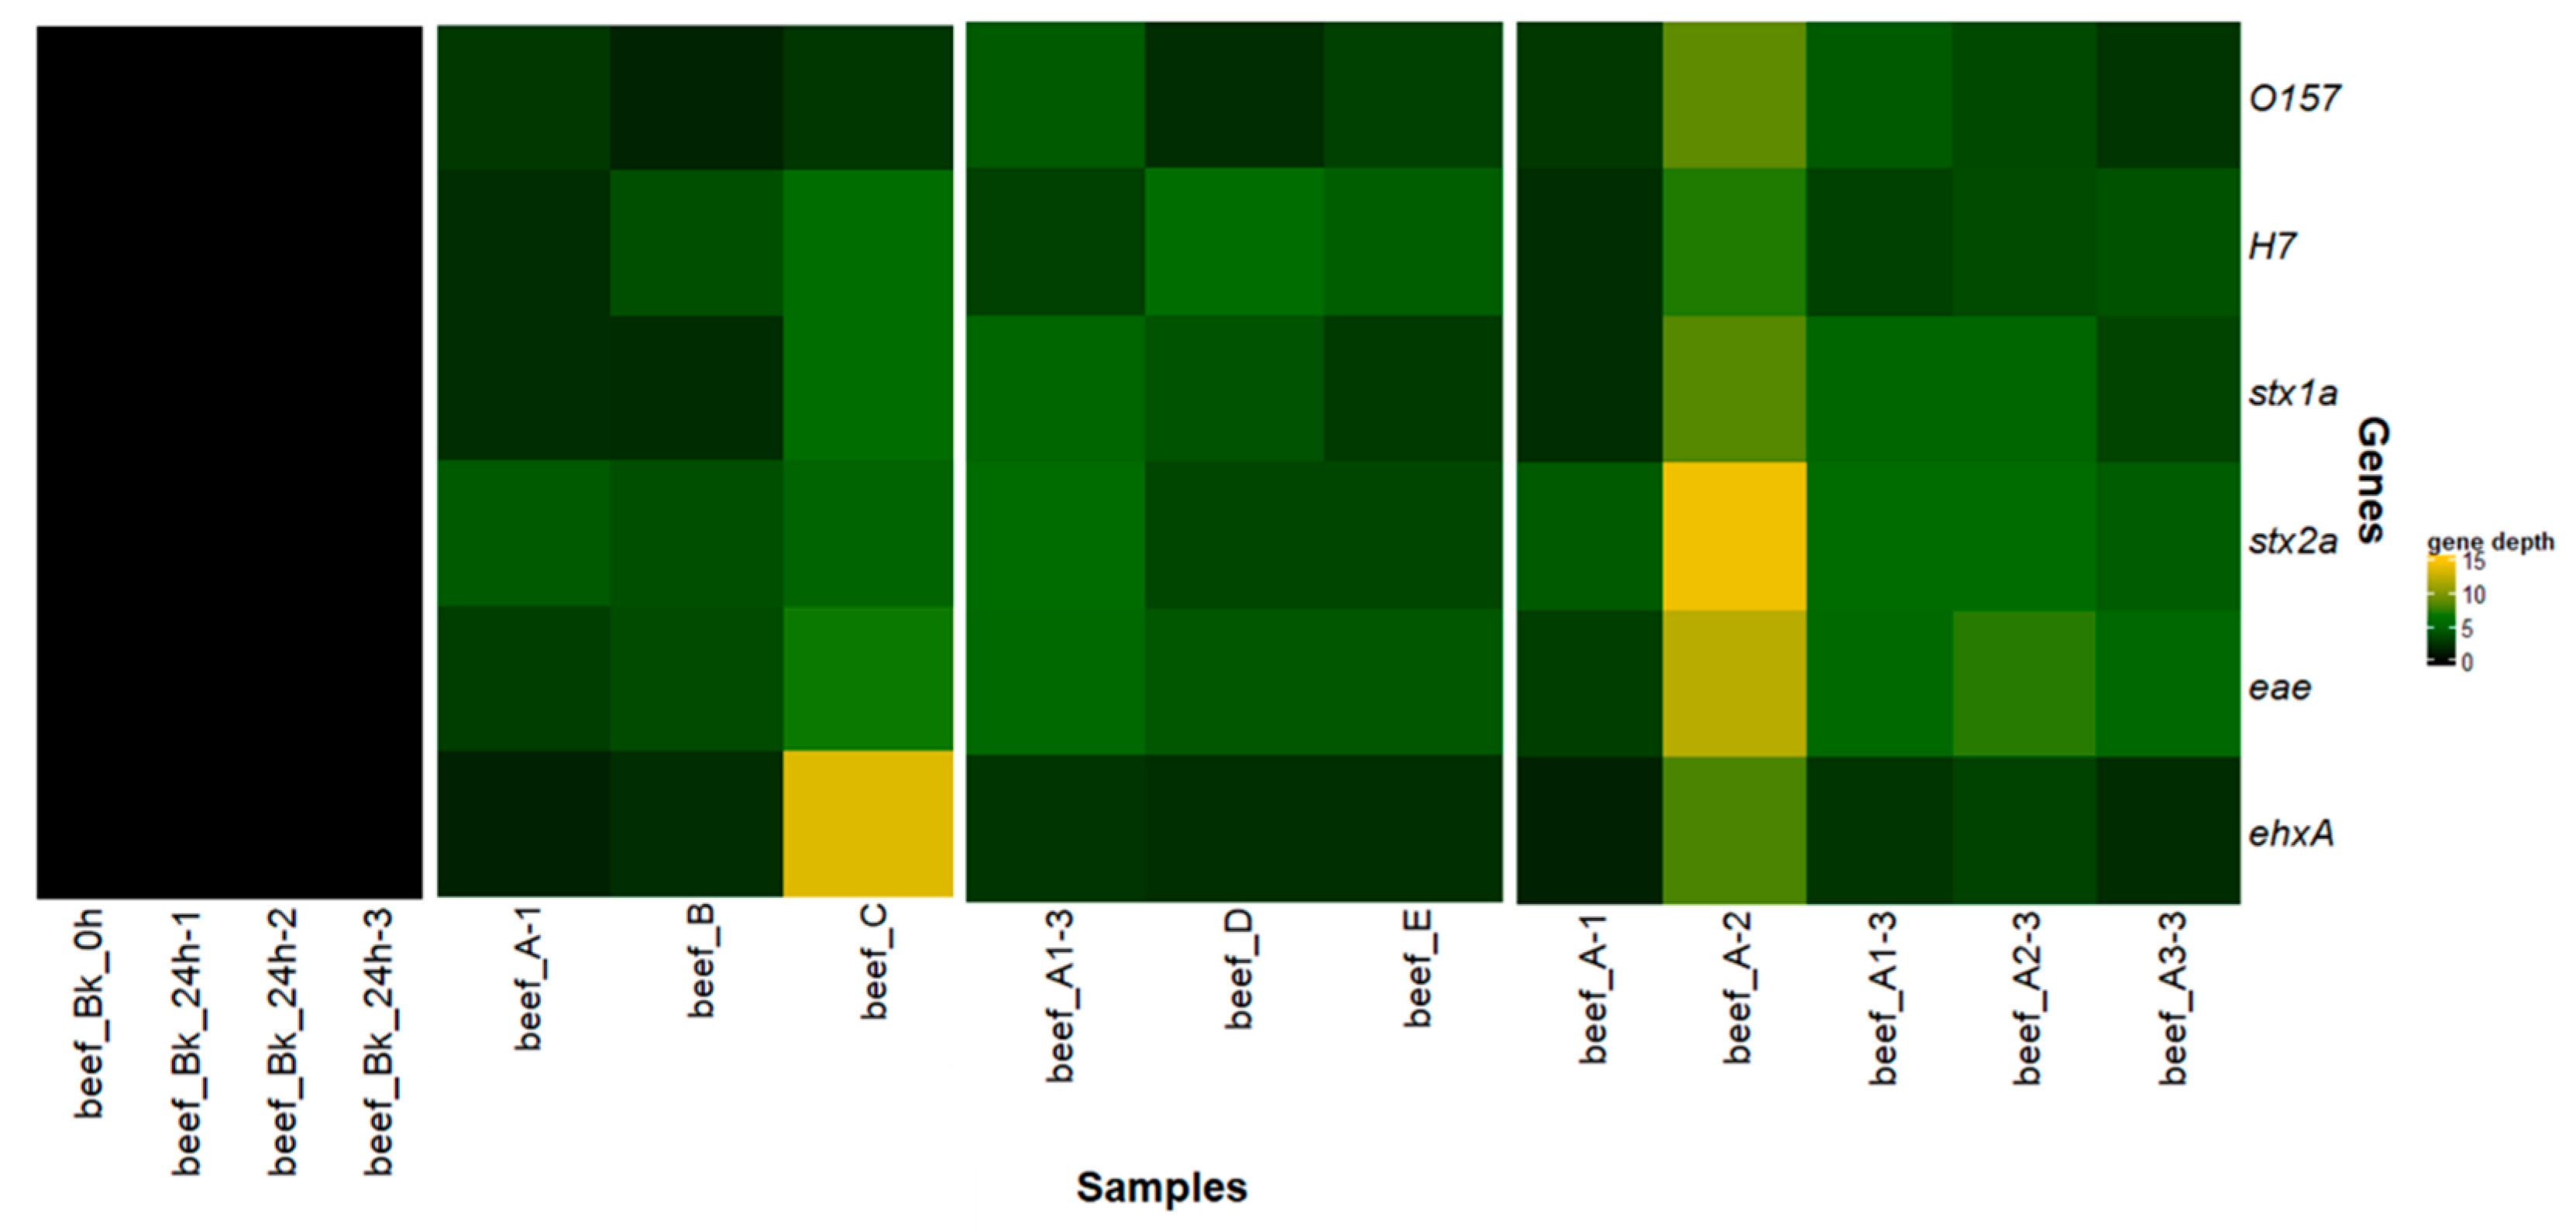
3.1.2. Analysis of Blank Beef Samples
3.1.3. Testing of 3 DNA Extraction Kits for the Spiked Beef Samples
3.1.4. Testing of Different Enrichment Procedures
3.1.5. Evaluation of the Performances of the Tested Metagenomics Workflows
3.1.6. Reproducibility of Workflow A
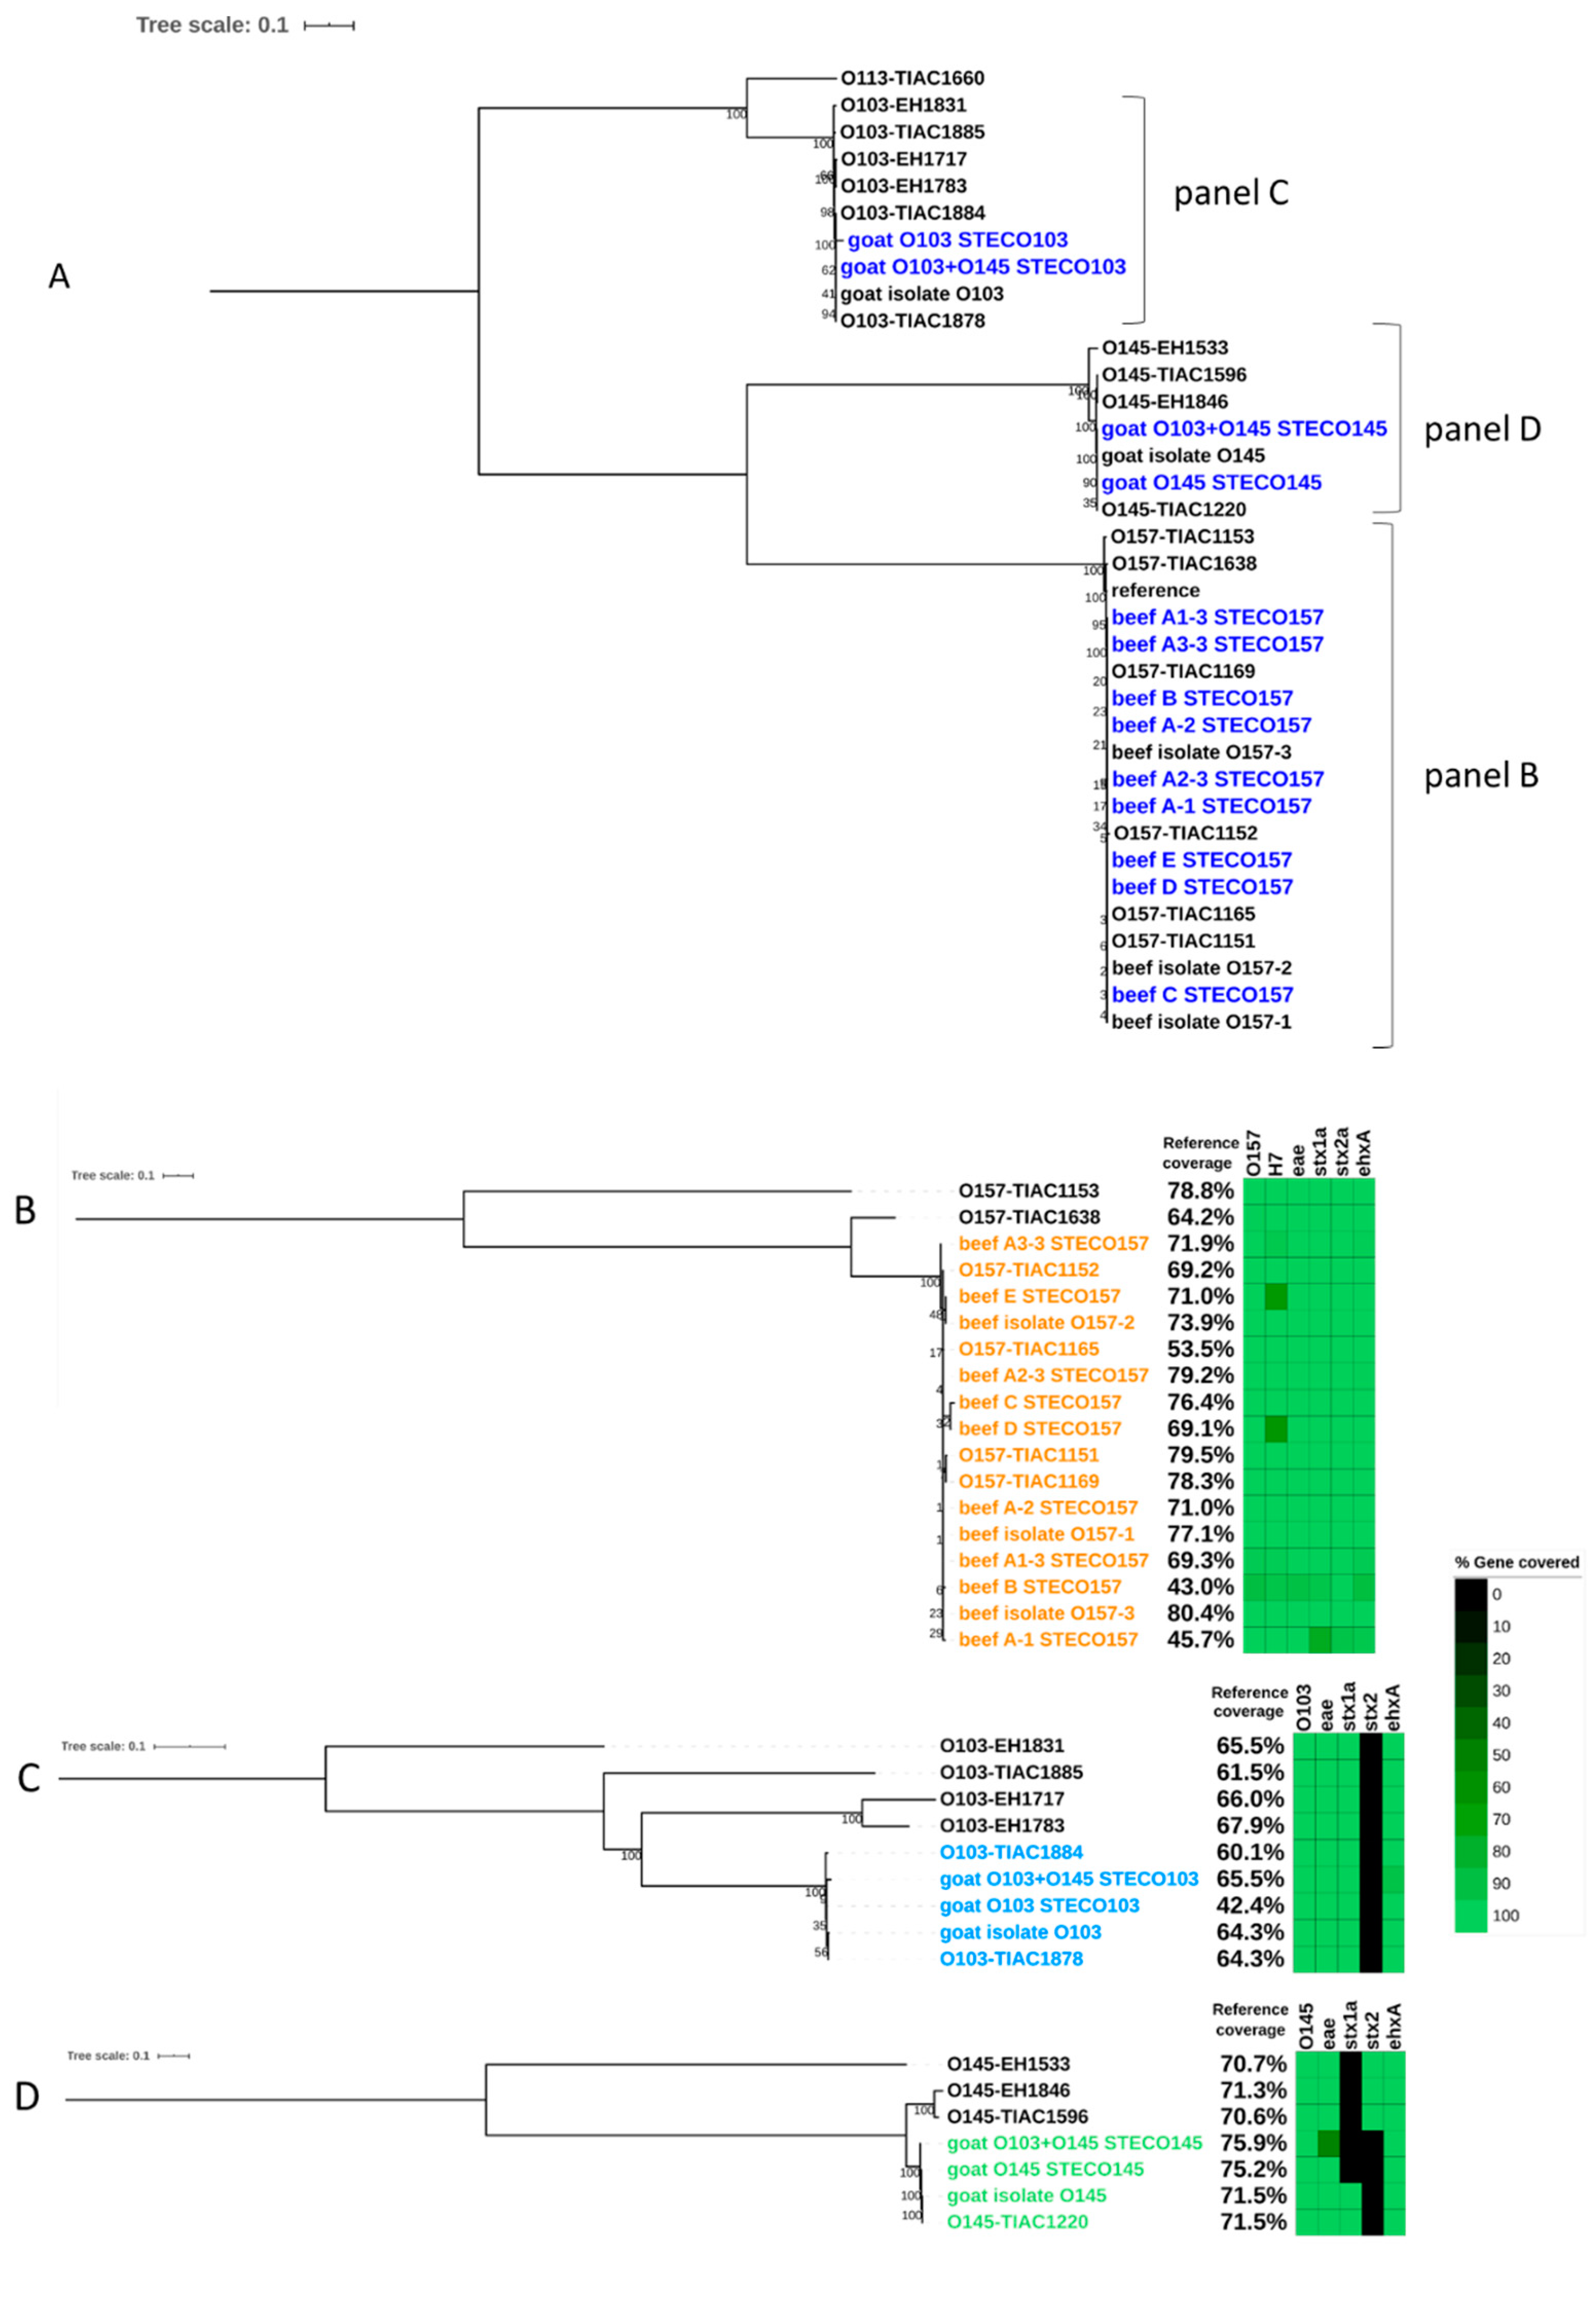
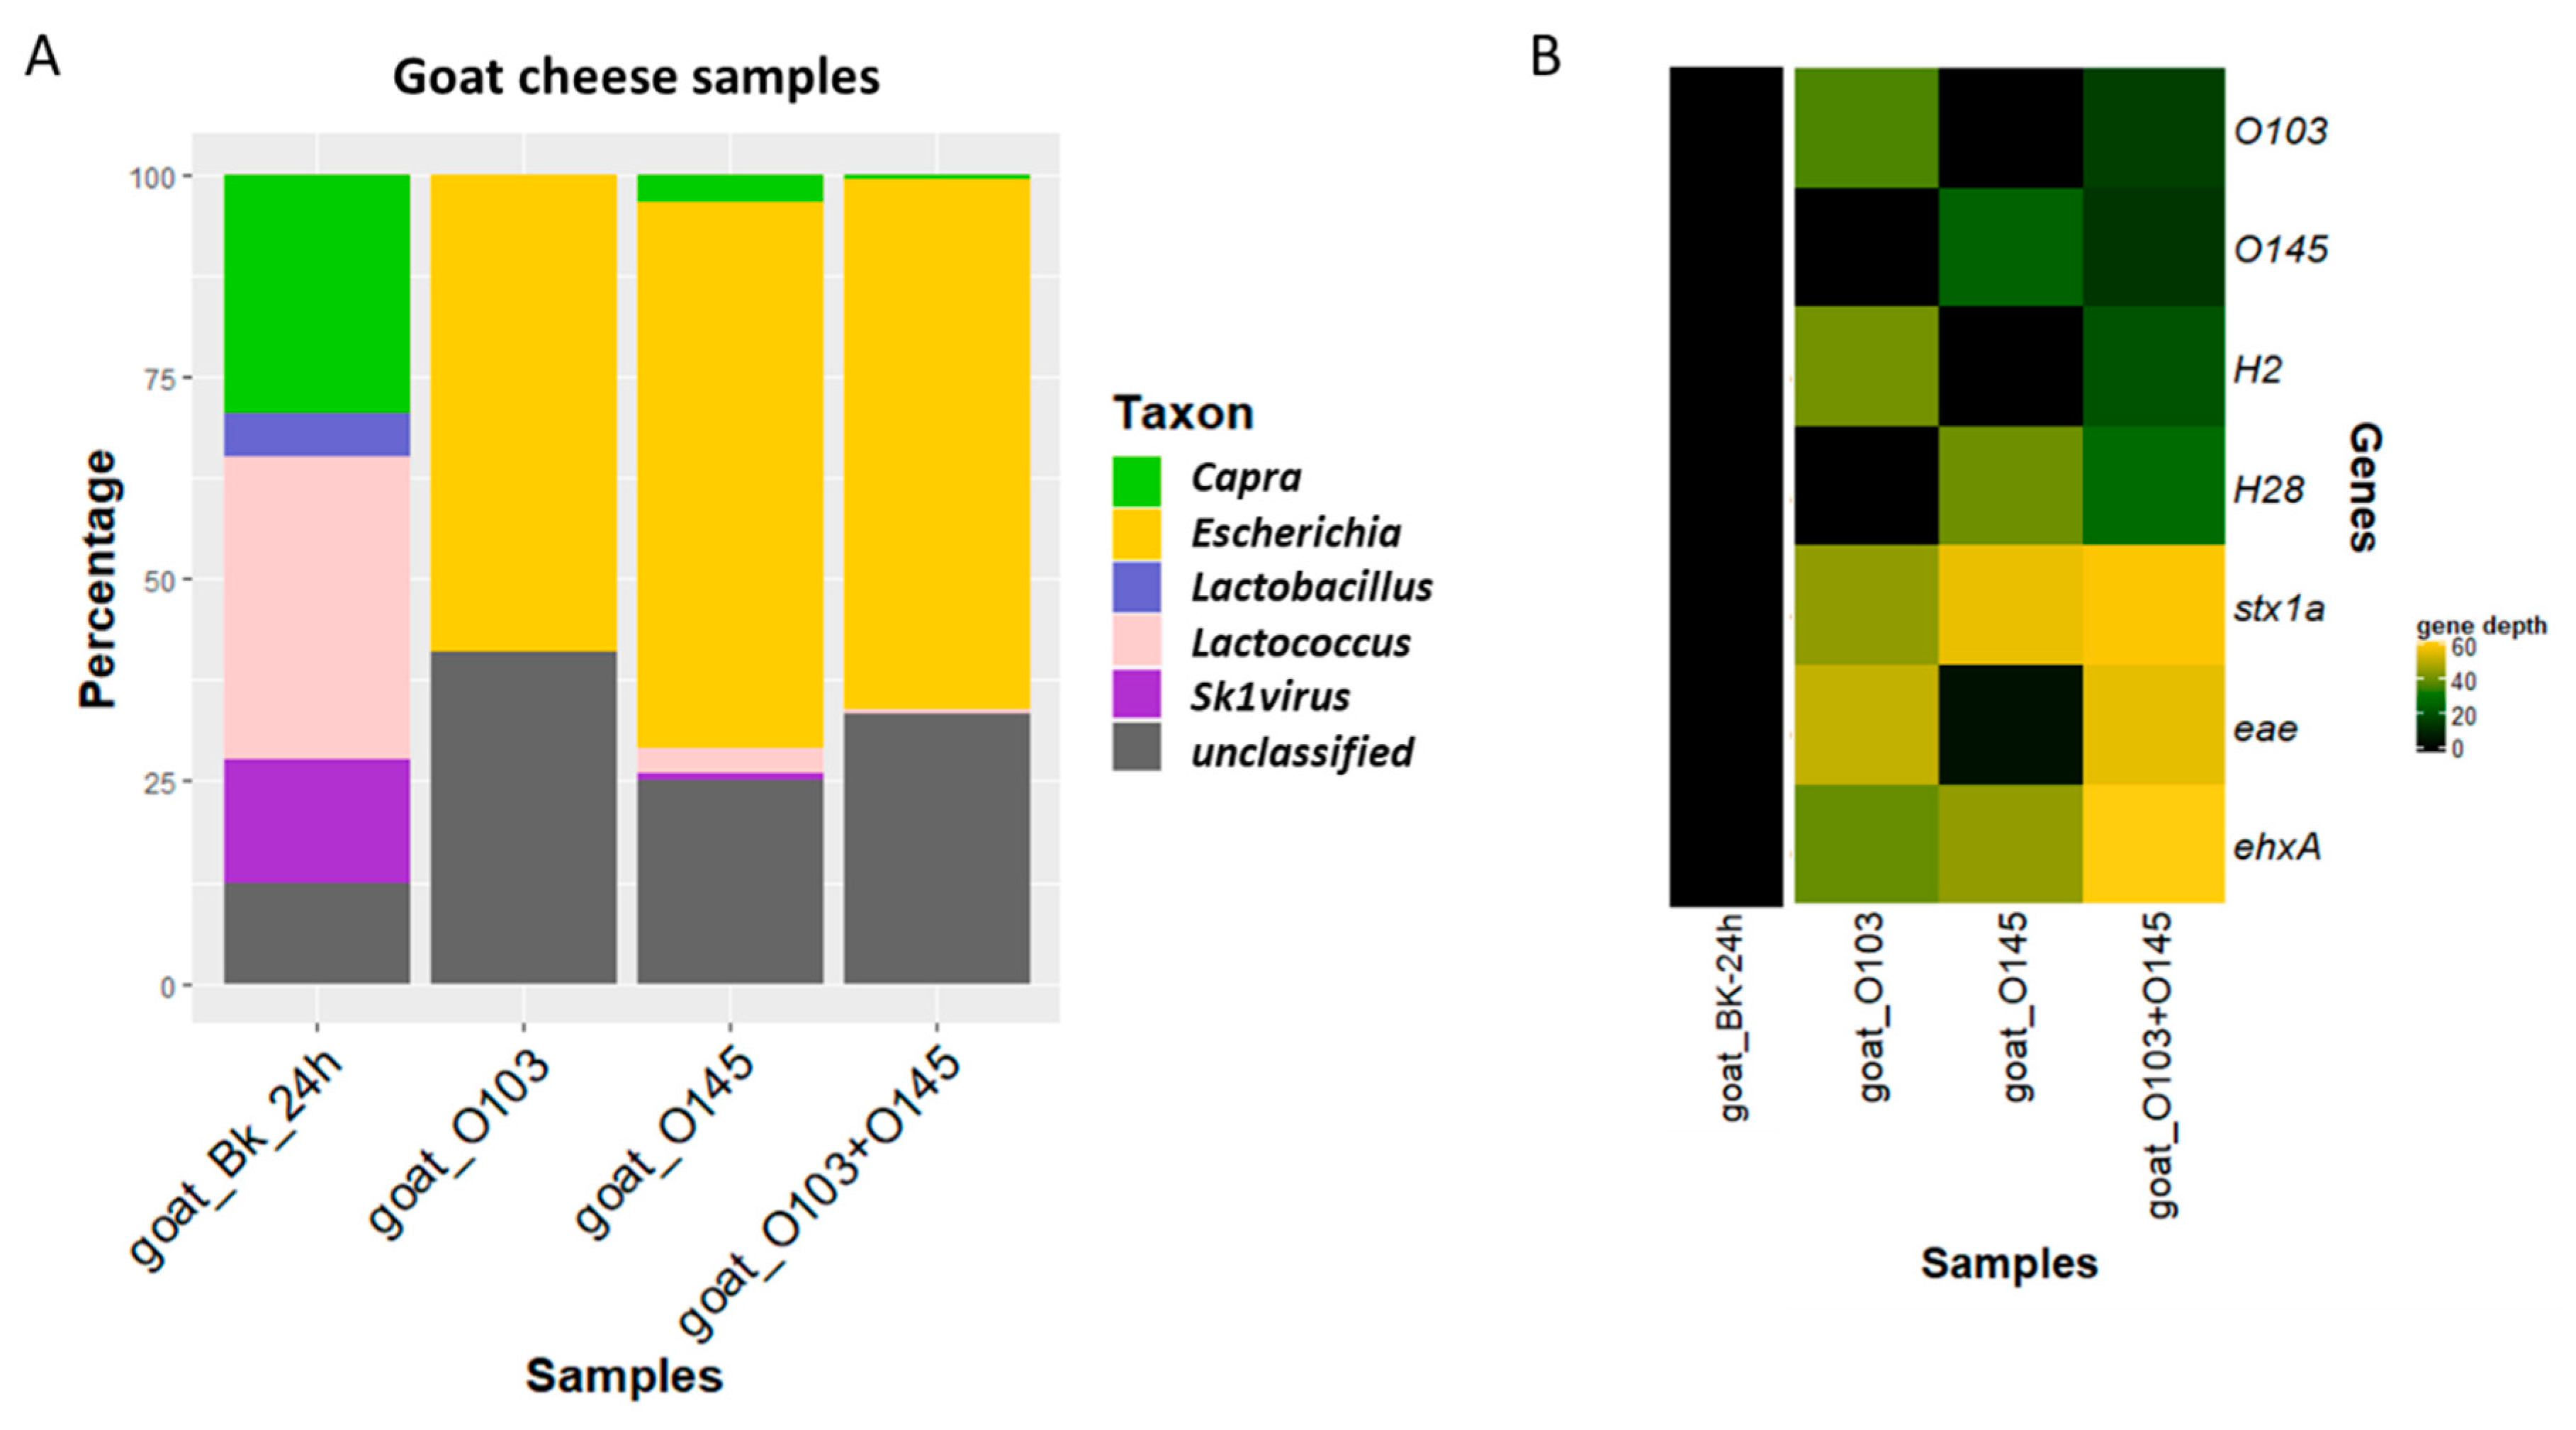
3.2. Detection and Characterization of Two STEC Strains in Goat Cheese
3.2.1. Comparison of the Experiment with Conventional Method
3.2.2. Metagenomics Analysis
4. Discussion
Supplementary Materials
Author Contributions
Funding
Acknowledgments
Conflicts of Interest
References
- WHO. WHO Estimates of the Global Burden of Foodborne Diseases. 2015. Available online: https://apps.who.int/iris/bitstream/handle/10665/199350/9789241565165_eng.pdf?sequence=1 (accessed on 29 October 2019).
- Fratamico, P.M.; DebRoy, C.; Needleman, D.S. Editorial: Emerging Approaches for Typing, Detection, Characterization, and Traceback of Escherichia coli. Front. Microbiol. 2016, 7, 2089. [Google Scholar] [CrossRef] [PubMed]
- Franz, E.; Gras, L.M.; Dallman, T. Significance of whole genome sequencing for surveillance, source attribution and microbial risk assessment of foodborne pathogens. Curr. Opin. Food Sci. 2016, 8, 74–79. [Google Scholar] [CrossRef]
- Deng, X.; den Bakker, H.C.; Hendriksen, R.S. Genomic Epidemiology: Whole-Genome-Sequencing–Powered Surveillance and Outbreak Investigation of Foodborne Bacterial Pathogens. Annu. Rev. Food Sci. Technol. 2016, 7, 353–374. [Google Scholar] [CrossRef] [Green Version]
- European Centre for Disease Prevention and Control. ECDC Roadmap for Integration of Molecular and Genomic Typing into European-Level Surveillance and Epidemic Preparedness – Version 2.1, 2016-19; ECDC: Stockholm, Sweden, August 2016; ISBN 978-92-9193-884-1. [Google Scholar] [CrossRef]
- Revez, J.; Espinosa, L.; Albiger, B.; Leitmeyer, K.C.; Struelens, M.J. Survey on the Use of Whole-Genome Sequencing for Infectious Diseases Surveillance: Rapid Expansion of European National Capacities, 2015–2016. Front. Public Health 2017, 5. [Google Scholar] [CrossRef] [Green Version]
- EFSA Panel on EFSA Biological Hazards (BIOHAZ). EFSA Scientific Opinion on the evaluation of molecular typing methods for major food-borne microbiological hazards and their use for attribution modelling, outbreak investigation and scanning surveillance: Part 1 (evaluation of methods and applications). EFSA J. 2013, 11, 1–84. [Google Scholar] [CrossRef] [Green Version]
- McMeekin, T.A. Detecting Pathogens in Food; Woodhead Publishing Series in Food Science, Technology and Nutrition; Woodhead Publishing: Cambridge, UK, 2003; pp. xv–xix. ISBN 9781855736702. [Google Scholar] [CrossRef]
- Forbes, J.D.; Knox, N.C.; Ronholm, J.; Pagotto, F.; Reimer, A. Metagenomics: The next culture-independent game changer. Front. Microbiol. 2017, 8, 1–21. [Google Scholar] [CrossRef] [Green Version]
- Gardy, J.L.; Loman, N.J. Towards a genomics-informed, real-time, global pathogen surveillance system. Nat. Rev. Genet. 2018, 19, 9–20. [Google Scholar] [CrossRef]
- Knudsen, B.E.; Bergmark, L.; Munk, P.; Lukjancenko, O.; Priemé, A.; Aarestrup, F.M.; Pamp, S.J. Impact of Sample Type and DNA Isolation Procedure on Genomic Inference of Microbiome Composition. mSystems 2016, 1, e00095-16. [Google Scholar] [CrossRef] [Green Version]
- Josefsen, M.H.; Andersen, S.C.; Christensen, J.; Hoorfar, J. Microbial food safety: Potential of DNA extraction methods for use in diagnostic metagenomics. J. Microbiol. Methods 2015, 114, 30–34. [Google Scholar] [CrossRef]
- Leonard, S.R.; Mammel, M.K.; Lacher, D.W.; Elkins, C.A. Application of metagenomic sequencing to food safety: Detection of shiga toxin-producing Escherichia coli on fresh bagged spinach. Appl. Environ. Microbiol. 2015, 81, 8183–8191. [Google Scholar] [CrossRef] [Green Version]
- Hyeon, J.; Li, S.; Mann, D.A.; Zhang, S.; Li, Z.; Chen, Y.; Deng, X. Quasimetagenomics-based and real-time-sequencing-aided detection and subtyping of Salmonella enterica from food samples. Appl. Environ. Microbiol. 2018, 84, 1–15. [Google Scholar] [CrossRef] [PubMed] [Green Version]
- Leonard, S.R.; Mammel, M.K.; Lacher, D.W.; Elkins, C.A. Strain-level discrimination of shiga toxin-producing Escherichia coli in spinach using metagenomic sequencing. PLoS ONE 2016, 11, 1–21. [Google Scholar] [CrossRef] [PubMed]
- Yang, X.; Noyes, N.R.; Doster, E.; Martin, J.N.; Linke, L.M.; Magnuson, R.J.; Yang, H.; Geornaras, I.; Woerner, D.R.; Jones, K.L.; et al. Use of metagenomic shotgun sequencing technology to detect foodborne pathogens within the microbiome of the beef production chain. Appl. Environ. Microbiol. 2016, 82, 2433–2443. [Google Scholar] [CrossRef] [PubMed] [Green Version]
- Walsh, A.M.; Crispie, F.; Daari, K.; O’Sullivan, O.; Martin, J.C.; Arthur, C.T.; Claesson, M.J.; Scott, K.P.; Cotter, P.D. Strain-Level Metagenomic Analysis of the Fermented Dairy Beverage Nunu Highlights Potential Food Safety Risks. Appl. Environ. Microbiol. 2017, 83, 1–13. [Google Scholar] [CrossRef] [PubMed] [Green Version]
- Grü, tzke; Malorny, B.; Hammerl, J.A.; Busch, A.; Tausch, S.H.; Tomaso, H.; Deneke, C. Fishing in the Soup—Pathogen Detection in Food Safety Using Metabarcoding and Metagenomic Sequencing. Front. Microbiol. 2019, 10, 1–15. [Google Scholar]
- Huang, A.D.; Luo, C.; Pena-Gonzalez, A.; Weigand, M.R.; Tarr, C.L.; Konstantinidis, K.T. Metagenomics of two severe foodborne outbreaks provides diagnostic signatures and signs of coinfection not attainable by traditional methods. Appl. Environ. Microbiol. 2017, 83, 1–14. [Google Scholar] [CrossRef] [Green Version]
- Singh, N.; Lapierre, P.; Quinlan, T.M.; Halse, T.A.; Wirth, S.; Dickinson, M.C.; Lasek-nesselquist, E.; Musser, A. Whole_Genome Single-Nucleotide Polymorphism (SNP) Analysis Applied Directly to Stool for Genotyping Shiga Toxin-Producing Escherichia coli: An Advanced Molecular detection method for foodborne disease surveillance and outbreak tracking. J. Clin. Microbiol. 2019, 57, 1–11. [Google Scholar] [CrossRef] [Green Version]
- Feng, P.D.; Weagant., S.; Jinneman, K. BAM: Diarrheagenic Escherichia coli. Available online: http://www.fda.gov/Food/FoodScienceResearch/LaboratoryMethods/ucm070080.htm. (accessed on 29 October 2019).
- EFSA BIOHAZ Panel; Koutsoumanis, K.; Allende, A.; Alvarez-Ordóñez, A.; Bover-Cid, S.; Chemaly, M.; Davies, R.; De Cesare, A.; Herman, L.; Hilbert, F.; et al. Pathogenicity assessment of Shiga toxin-producing Escherichia coli ( STEC ) and the public health risk posed by contamination of food with STEC. EFSA J. 2020, 18, 1–105. [Google Scholar] [CrossRef]
- ISO: International Organization for Standardization ISO/TS 13136:2012 Microbiology of Food and Animal Feed - Real-Time Polymerase Chain Reaction (PCR)-Based Method for the Detetion of Food-Borne Pathogens - Horizontal Method for the Detection of Shiga Toxin-Producing Escherichia coli (STEC) and the Determi Nation of O157, O111, O26, O103 and O145 Serogroups. 2012. Available online: https://www.iso.org/standard/53328.html (accessed on 17 December 2012).
- Hayashi, T.; Makino, K.; Ohnishi, M.; Kurokawa, K.; Ishii, K.; Yokoyama, K.; Han, C.G.; Ohtsubo, E.; Nakayama, K.; Murata, T.; et al. Complete genome sequence of enterohemorrhagic Eschelichia coli O157:H7 and genomic comparison with a laboratory strain K-12. DNA Res. 2001, 8, 11–22. [Google Scholar] [CrossRef] [Green Version]
- Krüger, A.; Lucchesi, P.M.A.; Parma, A.E. Verotoxins in bovine and meat verotoxin-producing Escherichia coli isolates: Type, number of variants, and relationship to cytotoxicity. Appl. Environ. Microbiol. 2011, 77, 73–79. [Google Scholar] [CrossRef] [Green Version]
- Ethelberg, S.; Olsen, K.E.P.; Scheutz, F.; Jensen, C.; Schiellerup, P.; Engberg, J.; Petersen, A.M.; Olesen, B.; Gerner-Smidt, P.; Mølbak, K. Virulence Factors for Hemolytic Uremic Syndrome, Denmark. Emerg. Infect. Dis. 2004, 10, 842–847. [Google Scholar] [CrossRef]
- Braeye, T.; Denayer, S.; De Rauw, K.; Forier, A.; Verluyten, J.; Fourier, L.; Dierick, K.; Botteldoorn, N.; Quoilin, S.; Coss, P.; et al. Lessons learned from a textbook outbreak: EHEC-O157 infections associated with the consumption of raw meat products, June 2012, Limburg, Belgium. Arch. Public Heal. 2014, 72, 44. [Google Scholar] [CrossRef] [PubMed] [Green Version]
- Robert Koch Institute Report: Final Presentation and Evaluation of Epidemiological Findings in the EHEC O104 :H4 Outbreak, Germany 2011. 2011. Available online: https://www.rki.de/EN/Content/infections/epidemiology/outbreaks/EHEC_O104/EHEC_final_report.pdf?__blob=publicationFile (accessed on 19 August 2019).
- Nouws, S.; Bogaerts, B.; Verhaegen, B.; Denayer, S.; Piérard, D.; Marchal, K.; Roosens, N.H.C.; Vanneste, K.; De Keersmaecker, S.C.J. Impact of DNA Extraction on Whole Genome Sequencing Analysis for Characterization and Relatedness of Shiga Toxin-Producing Escherichia Coli Isolates. Sci. Rep. 2020. in revision. [Google Scholar]
- Barbau-Piednoir, E.; Dierick, K.; Botteldoorn, N.; Denayer, S.; De Keersmaecker, S.; Roosens, N.H. Detection and discrimination in food samples of five E. coli pathotypes using a Combinatory SYBR®Green qPCR screening system. Appl. Microbiol. Biotechnol. 2018, 3267–3285. [Google Scholar] [CrossRef] [PubMed] [Green Version]
- U.S. Department of Agriculture, A.R.S. USDA Food and Nutrient Database for Dietary Studies 2017-2018. Available online: http://www.ars.usda.gov/nea/bhnrc/fsrg. (accessed on 31 July 2020).
- Volk, H.; Piskernik, S.; Kurincic, M.; Klancnik, A.; Toplak, N.; Jersek, B. Evaluation of different methods for DNA extraction from milk. J. Food Nutr. Res. 2014, 53, 97–104. [Google Scholar]
- Wood, D.E.; Lu, J.; Langmead, B. Improved metagenomic analysis with Kraken 2. bioRxiv 2019, 762302. [Google Scholar] [CrossRef] [Green Version]
- Nouws, S.; Bogaerts, B.; Verhaegen, B.; Denayer, S.; Crombé, F.; De Rauw, K.; Piérard, D.; Marchal, K.; Vanneste, K.; Roosens, N.H.C.; et al. The benefits of whole genome sequencing for foodborne outbreak investigation from the perspective of a National Reference Laboratory in a smaller country. Foods 2020, 9, 1030. [Google Scholar] [CrossRef]
- Bolger, A.M.; Lohse, M.; Usadel, B. Trimmomatic: A flexible trimmer for Illumina sequence data. Bioinformatics 2014, 30, 2114–2120. [Google Scholar] [CrossRef] [Green Version]
- O’Leary, N.A.; Wright, M.W.; Brister, J.R.; Ciufo, S.; Haddad, D.; McVeigh, R.; Rajput, B.; Robbertse, B.; Smith-White, B.; Ako-Adjei, D.; et al. Reference sequence (RefSeq) database at NCBI: Current status, taxonomic expansion, and functional annotation. Nucleic Acids Res. 2016, 44, D733–D745. [Google Scholar] [CrossRef] [Green Version]
- Inouye, M.; Dashnow, H.; Raven, L.A.; Schultz, M.B.; Pope, B.J.; Tomita, T.; Zobel, J.; Holt, K.E. SRST2: Rapid genomic surveillance for public health and hospital microbiology labs. Genome Med. 2014, 6, 1–16. [Google Scholar] [CrossRef] [Green Version]
- Joensen, K.G.; Scheutz, F.; Lund, O.; Hasman, H.; Kaas, R.S.; Nielsen, E.M.; Aarestrup, F.M. Real-time whole-genome sequencing for routine typing, surveillance, and outbreak detection of verotoxigenic Escherichia coli. J. Clin. Microbiol. 2014, 52, 1501–1510. [Google Scholar] [CrossRef] [Green Version]
- Joensen, K.G.; Tetzschner, A.M.M.; Iguchi, A.; Aarestrup, F.M.; Scheutz, F. Rapid and easy in silico serotyping of Escherichia coli isolates by use of whole-genome sequencing data. J. Clin. Microbiol. 2015, 53, 2410–2426. [Google Scholar] [CrossRef] [Green Version]
- Gu, Z.; Eils, R.; Schlesner, M. Complex heatmaps reveal patterns and correlations in multidimensional genomic data. Bioinformatics 2016, 32, 2847–2849. [Google Scholar] [CrossRef] [PubMed] [Green Version]
- Ahn, T.H.; Chai, J.; Pan, C. Sigma: Strain-level inference of genomes from metagenomic analysis for biosurveillance. Bioinformatics 2015, 31, 170–177. [Google Scholar] [CrossRef] [PubMed]
- Saltykova, A.; Buytaers, F.E.; Denayer, S.; Verhaegen, B.; Roosens, N.H.C.; Piérard, D.; Marchal, K.; De Keersmaecker, S.C.J. Strain-level metagenomic data analysis of enriched in vitro and in silico spiked food samples: Paving the way towards culture-free foodborne outbreak investigation using STEC as a case study. Int. J. Mol. Sci. 2020. in revision. [Google Scholar]
- Kumar, S.; Stecher, G.; Li, M.; Knyaz, C.; Tamura, K. MEGA X: Molecular evolutionary genetics analysis across computing platforms. Mol. Biol. Evol. 2018, 35, 1547–1549. [Google Scholar] [CrossRef] [PubMed]
- Letunic, I.; Bork, P. Interactive tree of life (iTOL) v3: An online tool for the display and annotation of phylogenetic and other trees. Nucleic Acids Res. 2016, 44, W242–W245. [Google Scholar] [CrossRef] [PubMed]
- Janda, J.M.; Abbott, S.L. The genus Hafnia: From soup to nuts. Clin. Microbiol. Rev. 2006, 19, 12–28. [Google Scholar] [CrossRef] [PubMed] [Green Version]
- Davies, A.R.; Board, R.J.; Board, R.G. Microbiology of Meat and Poultry; Davies, A., Ed.; Springer Science & Business Media: Berlin/Heidelberg, Germany, 1998; ISBN 978-0-7514-0398-5. [Google Scholar]
- EFSA Panel on Biological Hazards (BIOHAZ). Growth of spoilage bacteria during storage and transport of meat. EFSA J. 2016, 14, e04523. [Google Scholar]
- Food Safety Authority of Ireland Advice on Shiga toxin-producing Escherichia coli ( STEC ) Detection in Food. 2019. ISBN 9781910348222. Available online: https://www.fsai.ie/publications/STEC_Report/ (accessed on 31 July 2020).
- Scheuch, M.; Höper, D.; Beer, M. RIEMS: A software pipeline for sensitive and comprehensive taxonomic classification of reads from metagenomics datasets. BMC Bioinform. 2015, 16. [Google Scholar] [CrossRef] [Green Version]
- De Rauw, K.; Buyl, R.; Jacquinet, S.; Piérard, D. Risk determinants for the development of typical haemolytic uremic syndrome in Belgium and proposition of a new virulence typing algorithm for Shiga toxin-producing Escherichia coli. Epidemiol. Infect. 2019, 147. [Google Scholar] [CrossRef] [Green Version]
- Kircher, M.; Sawyer, S.; Meyer, M. Double indexing overcomes inaccuracies in multiplex sequencing on the Illumina platform. Nucleic Acids Res. 2012, 40, 1–8. [Google Scholar] [CrossRef] [Green Version]
- Delaney, S.; Murphy, R.; Walsh, F. A comparison of methods for the extraction of plasmids capable of conferring antibiotic resistance in a human pathogen from complex broiler cecal samples. Front. Microbiol. 2018. [Google Scholar] [CrossRef]
- Brusa, V.; Piñeyro, P.E.; Galli, L.; Linares, L.H.; Ortega, E.E.; Padola, N.L.; Leotta, G.A. Isolation of Shiga toxin-producing Escherichia coli from ground beef using multiple combinations of enrichment broths and selective agars. Foodborne Pathog. Dis. 2016, 13, 163–170. [Google Scholar] [CrossRef]
- Jasson, V.; Rajkovic, A.; Baert, L.; Debevere, J.; Uyttendaele, M. Comparison of enrichment conditions for rapid detection of low numbers of sublethally injured Escherichia coli 0157 in food. J. Food Prot. 2009, 72, 1862–1868. [Google Scholar] [CrossRef]
- Kinnula, S.; Hemminki, K.; Kotilainen, H.; Ruotsalainen, E.; Tarkka, E.; Salmenlinna, S.; Hallanvuo, S.; Leinonen, E.; Jukka, O.; Rimhanen-Finne, R. Outbreak of multiple strains of non-o157 shiga toxin-producing and enteropathogenic Escherichia coli associated with rocket salad, Finland, autumn 2016. Eurosurveillance 2018, 23, 1–8. [Google Scholar] [CrossRef] [Green Version]
- Somerville, V.; Lutz, S.; Schmid, M.; Frei, D.; Moser, A.; Irmler, S.; Frey, J.E.; Ahrens, C.H. Long read-based de novo assembly of low complex metagenome samples results in finished genomes and reveals insights into strain diversity and an active phage system. bioRxiv 2018, 476747. [Google Scholar] [CrossRef] [Green Version]
- EFSA The European Union One Health 2018 Zoonoses Report. 2019. Vol. 17. Available online: https://efsa.onlinelibrary.wiley.com/doi/epdf/10.2903/j.efsa.2019.5926 (accessed on 12 June 2019).
- Andersen, S.C.; Fachmann, M.S.R.; Kiil, K.; Nielsen, E.M.; Hoorfar, J. Gene-based pathogen detection: Can we use qPCR to predict the outcome of diagnostic metagenomics? Genes 2017, 8, 332. [Google Scholar] [CrossRef] [Green Version]
- Höper, D.; Mettenleiter, T.C.; Beer, M. Metagenomic approaches to identifying infectious agents. Rev. Sci. Tech. 2016, 35, 83–93. [Google Scholar] [CrossRef]
- Carleton, H.A.; Besser, J.; Williams-Newkirk, A.J.; Huang, A.; Trees, E.; Gerner-Smidt, P. Metagenomic Approaches for Public Health Surveillance of Foodborne Infections: Opportunities and Challenges. Foodborne Pathog. Dis. 2019, 16, 474–479. [Google Scholar] [CrossRef]
- Timme, R.E.; Sanchez Leon, M.; Allard, M.W. Utilizing the Public GenomeTrakr Database for Foodborne Pathogen Traceback. Methods Mol. Biol. 2019. [Google Scholar] [CrossRef]
- Carter, M.Q.; Quinones, B.; He, X.; Zhong, W.; Louie, J.W.; Lee, B.G.; Yambao, J.C.; Mandrell, R.E.; Cooley, B. Clonal population exhibits high-level phenotypic variation that includes virulence traits. Appl. Environ. Microbiol. 2016, 82, 1090–1101. [Google Scholar] [CrossRef] [Green Version]
- De Schrijver, K.; Buvens, G.; Possé, B.; Van den Branden, D.; Oosterlynck, O.; De Zutter, L.; Eilers, K.; Piérard, D.; Dierick, K.; Van Damme-Lombaerts, R.; et al. Outbreak of verocytotoxin-producing E. coli O145 and O26 infections associated with the consumption of ice cream produced at a farm, Belgium, 2007. Eurosurveillance 2008, 13, 9–10. [Google Scholar] [CrossRef]
- Cheung, M.; Li, L.; Nong, W.; Kwan, H. 2011 German Escherichia coli O104:H4 outbreak: Whole-genome phylogeny without alignment. BMC Res. Notes 2011, 4, 533. [Google Scholar] [CrossRef] [Green Version]
- EFSA Panel on Biological Hazards (EFSA BIOHAZ Panel); Koutsoumanis, K.; Allende, A.; Alvarez-Ordóñez, A.; Bolton, D.; Bover-Cid, S.; Chemaly, M.; Davies, R.; De Cesare, A.; Hilbert, F.; et al. EFSA Whole genome sequencing and metagenomics for outbreak investigation , source attribution and risk assessment of food-borne microorganisms. EFSA J. 2019. [Google Scholar] [CrossRef] [Green Version]


© 2020 by the authors. Licensee MDPI, Basel, Switzerland. This article is an open access article distributed under the terms and conditions of the Creative Commons Attribution (CC BY) license (http://creativecommons.org/licenses/by/4.0/).
Share and Cite
Buytaers, F.E.; Saltykova, A.; Denayer, S.; Verhaegen, B.; Vanneste, K.; Roosens, N.H.C.; Piérard, D.; Marchal, K.; De Keersmaecker, S.C.J. A Practical Method to Implement Strain-Level Metagenomics-Based Foodborne Outbreak Investigation and Source Tracking in Routine. Microorganisms 2020, 8, 1191. https://doi.org/10.3390/microorganisms8081191
Buytaers FE, Saltykova A, Denayer S, Verhaegen B, Vanneste K, Roosens NHC, Piérard D, Marchal K, De Keersmaecker SCJ. A Practical Method to Implement Strain-Level Metagenomics-Based Foodborne Outbreak Investigation and Source Tracking in Routine. Microorganisms. 2020; 8(8):1191. https://doi.org/10.3390/microorganisms8081191
Chicago/Turabian StyleBuytaers, Florence E., Assia Saltykova, Sarah Denayer, Bavo Verhaegen, Kevin Vanneste, Nancy H. C. Roosens, Denis Piérard, Kathleen Marchal, and Sigrid C. J. De Keersmaecker. 2020. "A Practical Method to Implement Strain-Level Metagenomics-Based Foodborne Outbreak Investigation and Source Tracking in Routine" Microorganisms 8, no. 8: 1191. https://doi.org/10.3390/microorganisms8081191