Temporal Association between Abdominal Weight Status and Healthy Aging: Findings from the 2011–2018 National Health and Aging Trends Study

 ,
, 
Abstract
:1. Introduction
2. Method
2.1. Abdominal Weight Status
2.2. Healthy Aging Score (HAS)
2.3. Demographic Characteristics
2.4. Data Analysis
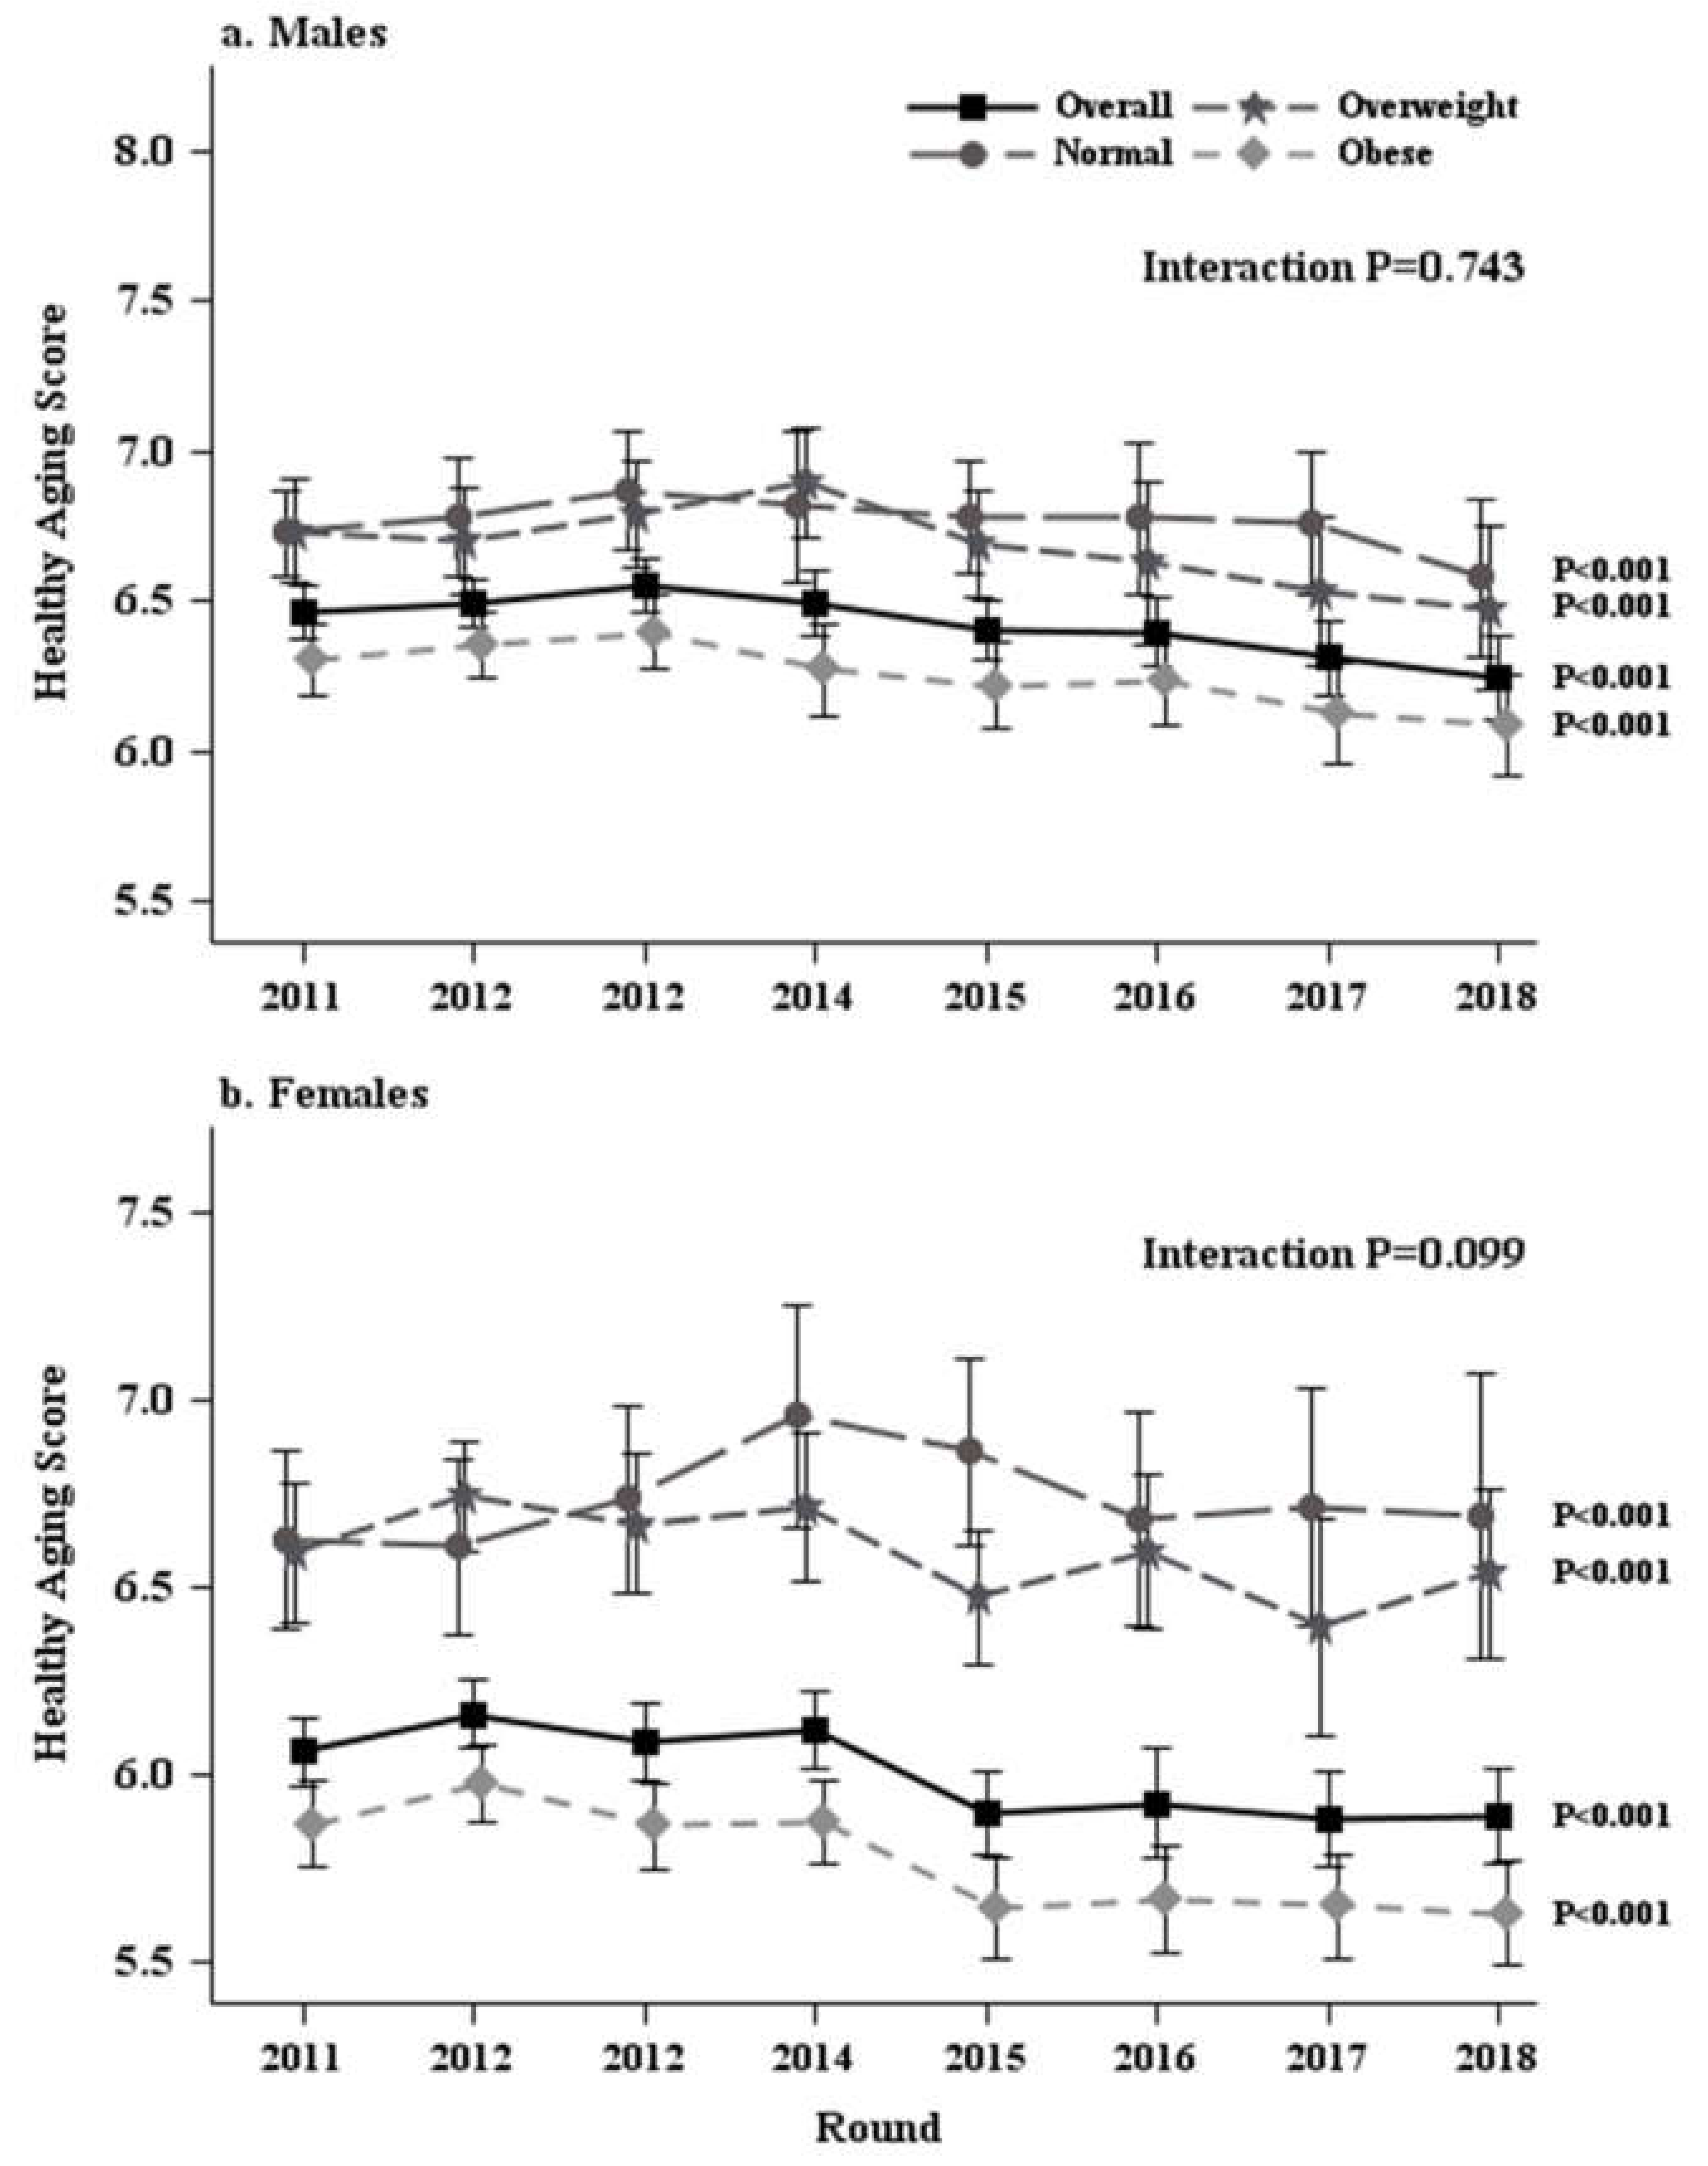
3. Results
4. Discussion
5. Conclusions
Supplementary Materials
Author Contributions
Funding
Acknowledgments
Conflicts of Interest
References
- US Census Bureau. National Population Projections. 2017. Available online: https://www.census.gov/%20newsroom/press-releases/2018/cb18-41-population-projections.html (accessed on 16 January 2020).
- World Health Organization. What is Healthy Ageing. Available online: https://www.who.int/ageing/healthy-ageing/en/ (accessed on 16 January 2020).
- Lu, W.; Pikhart, H.; Sacker, A. Domains and measurements of healthy aging in epidemiological studies: A review. Gerontologist 2019, 59, e294–e310. [Google Scholar] [CrossRef] [PubMed]
- Rowe, J.W.; Kahn, R.L. Successful aging. Gerontologist 1997, 37, 433–440. [Google Scholar] [CrossRef] [PubMed]
- Assmann, K.E.; Andreeva, V.A.; Jeandel, C.; Hercberg, S.; Galan, P.; Kesse-Guyot, E. Healthy aging 5 years after a period of daily supplementation with antioxidant nutrients: A post hoc analysis of the French randomized trial SU.VI.MAX. Am. J. Epidemiol. 2015, 182, 694–704. [Google Scholar] [CrossRef] [PubMed] [Green Version]
- Jaspers, L.; Schoufour, J.D.; Erler, N.S.; Darweesh, S.K.; Portegies, M.L.; Sedaghat, S.; Lahousse, L.; Brusselle, G.G.; Stricker, B.H.; Tiemeier, H.; et al. Development of a healthy aging score in the population-based Rotterdam study: Evaluating age and sex differences. J. Am. Med. Dir. Assoc. 2017, 18, 276.e1–276.e7. [Google Scholar] [CrossRef]
- Bell, C.L.; Chen, R.; Masaki, K.; Yee, P.; He, Q.; Grove, J.; Donlon, T.; Curb, J.D.; Willcox, D.C.; Poon, L.W.; et al. Late-life factors associated with healthy aging in older men. J. Am. Geriatr. Soc. 2014, 62, 880–888. [Google Scholar] [CrossRef] [PubMed] [Green Version]
- Pedditizi, E.; Peters, R.; Beckett, N. The risk of overweight/obesity in mid-life and late life for the development of dementia: A systematic review and meta-analysis of longitudinal studies. Age Ageing 2016, 45, 14–21. [Google Scholar] [CrossRef] [Green Version]
- De Hollander, E.L.; Bemelmans, W.J.; Boshuizen, H.C.; Friedrich, N.; Wallaschofski, H.; Guallar-Castillón, P.; Walter, S.; Zillikens, M.C.; Rosengren, A.; Lissner, L.; et al. The association between waist circumference and risk of mortality considering body mass index in 65- to 74-year-olds: A meta-analysis of 29 cohorts involving more than 58 000 elderly persons. Int. J. Epidemiol. 2012, 41, 805–817. [Google Scholar] [CrossRef] [Green Version]
- Chang, S.H.; Beason, T.S.; Hunleth, J.M.; Colditz, G.A. A systematic review of body fat distribution and mortality in older people. Maturitas 2012, 72, 175–191. [Google Scholar] [CrossRef] [Green Version]
- Beaudart, C.; Zaaria, M.; Pasleau, F.; Reginster, J.; Bruyere, O. Health outcomes of saropenia: A systematic review and meta-analysis. PLoS ONE 2017, 12, e0169548. [Google Scholar] [CrossRef] [Green Version]
- Ostan, R.; Monti, D.; Gueresi, P.; Bussolotto, M.; Franceschi, C.; Baggio, G. Gender, aging and longevity in humans: An update of an intriguing/neglected scenario paving the way to a gender-specific medicine. Clin. Sci. (Lond) 2016, 130, 1711–1725. [Google Scholar] [CrossRef] [Green Version]
- Kasper, J.D.; Freedman, V.A. National Health and Aging Trends Study User Guide: Rounds 1, 2, 3, 4 and 5 Beta Release; Johns Hopkins University School of Public Health: Baltimore, MD, USA, 2016; Available online: https://www.nhats.org/researcher/nhats/methods-documentation?id=user_guide (accessed on 6 January 2020).
- Kasper, J.D.; Freedman, V.A. National Health and Aging Trends Study User Guide: Rounds 1-8 Final Release; Johns Hopkins University School of Public Health: Baltimore, MD, USA, 2019; Available online: https://www.nhats.org/researcher/nhats/methods-documentation?id=user_guide (accessed on 18 January 2020).
- Kasper, J.; Freedman, V.A. National Health and Aging Trends Study Round 1 User Guide: Final Release; Johns Hopkins University School of Public Health: Baltimore, MD, USA, 2012; Available online: https://www.nhats.org/researcher/nhats/methods-documentation?id=user_guide (accessed on 6 January 2020).
- Nadal, K. The Sage Encyclopedia of Psychology and Gender; Sage: Thousand Oaks, CA, USA, 2017. [Google Scholar]
- Kasper, J.D.; Freedman, V.A.; Niefeld, M.R. Construction of Performance-Based Summary Measures of Physical Capacity in the National Health and Aging Trends Study. NHATS; Technical Paper #4; Johns Hopkins University School of Public Health: Baltimore, MD, USA, 2012; Available online: https://www.nhats.org/researcher/nhats/methods-documentation?id=user_guide (accessed on 6 January 2020).
- Howel, D. Waist circumference and abdominal obesity among older adults: Patterns, prevalence and trends. PLoS ONE 2012, 7, e48528. [Google Scholar] [CrossRef] [PubMed] [Green Version]
- Niefeld, M.R. SAS Programming Statements for Construction of Performance-Based Summary Measures of Physical Capacity in the National Health and Aging Trends Study; Addendum to NHATS Technical Paper #4. Johns Hopkins University School of Public Health: Baltimore, MD, USA, 2012. Available online: https://www.nhats.org/researcher/nhats/methods-documentation?id=user_guide (accessed on 6 January 2020).
- Guralnik, J.M.; Ferrucci, L.; Pieper, C.F.; Leveille, S.G.; Markides, K.S.; Ostir, G.V.; Studenski, S.; Berkman, L.F.; Wallace, R.B. Lower extremity function and subsequent disability: Consistency across studies, predictive models, and value of gait speed alone compared with the short physical performance battery. J. Gerontol. A Biol. Sci. Med. Sci. 2000, 55, M221–M231. [Google Scholar] [CrossRef] [PubMed] [Green Version]
- Guralnik, J.M.; Simonsick, E.M.; Ferrucci, L.; Glynn, R.J.; Berkman, L.F.; Blazer, D.G.; Scherr, P.A.; Wallace, R.B. A short physical performance battery assessing lower extremity function: Association with self-reported disability and prediction of mortality and nursing home admission. J. Gerontol. Med Sci. 1994, 49, M85–M94. [Google Scholar] [CrossRef] [PubMed]
- Kasper, J.D.; Freedman, V.A.; Spillman, B. Classification of Persons by Dementia Status in the National Health and Aging Trends Study; Technical Paper #5; Johns Hopkins University School of Public Health: Baltimore, MD, USA, 2013; Available online: https://www.nhats.org/researcher/nhats/methods-documentation?id=user_guide (accessed on 18 January 2020).
- Spillman, B.C.; Skehan, M.E. SAS Programming Statements for Construction of Dementia Classification in the National Health and Aging Trends Study; Addendum to NHATS Technical Paper #5; Johns Hopkins University School of Public Health: Baltimore, MD, USA, 2013; Available online: https://www.nhats.org/researcher/nhats/methods-documentation?id=user_guide (accessed on 6 January 2020).
- Kasper, J.D.; Freedman, V.A.; Spillman, B.C.; Skehan, M.E. Addendum to Classification of Persons by Dementia Status in the National Health and Aging Trends Study for Follow-Up Rounds; Johns Hopkins University School of Public Health: Baltimore, MD, USA, 2015; Available online: https://www.nhats.org/researcher/nhats/methods-documentation?id=user_guide (accessed on 6 January 2020).
- Kim, K.; Lehning, A.J.; Sacco, P. Assessing the factor structure of well-being in older adults: Findings from the national health and aging trends study. Aging Ment Health 2016, 20, 814–822. [Google Scholar] [CrossRef] [PubMed] [Green Version]
- Kroenke, K.; Spitzer, R.L.; Williams, J.B.W. The patient health questionnaire-2: Validity of a two item depression screener. Med Care 2003, 41, 1284–1292. [Google Scholar] [CrossRef] [PubMed]
- Kroenke, K.; Spitzer, R.L.; Williams, J.B.; Monahan, P.O.; Löwe, B. Anxiety disorders in primary care: Prevalence, impairment, comorbidity, and detection. Ann. Intern. Med. 2007, 146, 317–325. [Google Scholar] [CrossRef]
- Freedman, V.A.; Kasper, J.D.; Cornman, J.C.; Agree, E.M.; Bandeen-Roche, K.; Mor, V.; Spillman, B.C.; Wallace, R.; Wolf, D.A. Validation of new measures of disability and functioning in the National Health and Aging Trends Study. J. Gerontol. A Biol. Sci. Med. Sci. 2011, 66, 1013–1021. [Google Scholar] [CrossRef] [Green Version]
- Ornstein, K.A.; Leff, B.; Covinsky, K.E.; Ritchie, C.S.; Federman, A.D.; Roberts, L.; Kelley, A.S.; Siu, A.L.; Szanton, S.L. Epidemiology of the homebound population in the United States. JAMA Intern. Med. 2015, 175, 1180–1186. [Google Scholar] [CrossRef]
- Montaquila, J.; Freedman, V.A.; Spillman, B.; Kasper, J.D. National Health and Aging Trends Study Development of Round 1 Survey Weights; NHATS Technical Paper #2; Johns Hopkins University School of Public Health: Baltimore, MD, USA, 2012; Available online: https://www.nhats.org/researcher/nhats/methods-documentation?id=user_guide (accessed on 6 January 2020).
- Montaquila, J.; Freedman, V.A.; Spillman, B.; Kasper, J.D. National Health and Aging Trends Study Development of Round 2 Survey Weights; NHATS Technical Paper #6; Johns Hopkins University School of Public Health: Baltimore, MD, USA, 2014; Available online: https://www.nhats.org/researcher/nhats/methods-documentation?id=user_guide (accessed on 6 January 2020).
- Vincent, H.K.; Vincent, K.R.; Lamb, K.M. Obesity and mobility disability in the older adult. Obes. Rev. 2010, 11, 568–579. [Google Scholar] [CrossRef]
- Zettel-Watson, L.; Britton, M. The impact of obesity on the social participation of older adults. J. Gen. Psychol. 2008, 135, 409–423. [Google Scholar] [CrossRef]
- Elena, B.A.; Gabriela, B.; Andreea, V.; Tatar, R.; Daniela, S.; Tilea, I.; Gabos-Grecu, I. Association between increased waist circumference and depression and anxiety trend. Acta Med. Marisiensis 2015, 61, 87–90. [Google Scholar] [CrossRef] [Green Version]
- Heim, N.; Snijder, M.B.; Deeg, D.J.H.; Seidell, J.C.; Visser, M. Obesity in older adults is associated with an increased prevalence and incidence of pain. Epidemiology 2008, 16, 2510–2517. [Google Scholar] [CrossRef]
- Luchsinger, J.A.; Patel, B.; Tang, M.X.; Schupf, N.; Mayeux, R. Measures of adiposity and dementia risk in elderly persons. Arch Neurol. 2007, 64, 392–398. [Google Scholar] [CrossRef] [PubMed]
- Ryo, M.; Nakamura, T.; Kihara, S.; Kumada, M.; Shibazaki, S.; Takahashi, M.; Nagai, M.; Matsuzawa, Y.; Funahashi, T. Adiponectin as a biomarker of the metabolic syndrome. Circ. J. 2004, 68, 975–981. [Google Scholar] [CrossRef] [PubMed] [Green Version]
- Kivimäki, M.; Luukkonen, R.; Batty, G.D.; Ferrie, J.E.; Pentti, J.; Nyberg, S.T.; Shipley, M.J.; Alfredsson, L.; Fransson, E.I.; Goldberg, M.; et al. Body mass index and risk of dementia: Analysis of individual-level data from 1.3 million individuals. Alzheimers Dement. 2018, 14, 601–609. [Google Scholar] [CrossRef] [PubMed]
- Winter, J.E.; MacInnis, R.J.; Wattanapenpaiboon, N.; Nowson, C.A. BMI and all-cause mortality in older adults: A meta-analysis. Am. J. Clin. Nutr. 2014, 99, 875–890. [Google Scholar] [CrossRef] [Green Version]
- Vasan, S.K.; Osmond, C.; Canoy, D.; Christodoulides, C.; Neville, M.J.; Di Gravio, C.; Fall, C.H.; Karpe, F. Comparison of regional fat measurements by dual-energy X-ray absorptiometry and conventional anthropometry and their association with markers of diabetes and cardiovascular disease risk. Int. J. Obes. 2018, 42, 850–857. [Google Scholar] [CrossRef] [Green Version]
- Guerra, R.S.; Amaral, T.F.; Marques, E.A.; Mota, J.; Restivo, M.T. Anatomical location for waist circumference measurement in older adults: A preliminary study. Nutr. Hosp. 2012, 27, 1554–1561. [Google Scholar]


| Health Indicator | Met Criteria (Score of 1) | Not Met Criteria (Score of 0) |
|---|---|---|
| Physical function | SPPB = 10–12 | SPPB < 10 |
| Cognitive impairment | No cognitive impairment or dementia | Cognitive impairment or dementia |
| Wellbeing | Scored 38–41 (3rd tertile) | <38 (1st and 2nd tertiles) |
| Major chronic disease | No heart disease, diabetes, or cancer | Had 1 or more major chronic diseases (heart disease, diabetes, cancer) |
| Depression | PHQ-2 scored < 3 | PHQ-2 scored ≥ 3 |
| Anxiety | GAD-2 scored < 3 | GAD-2 scored ≥ 3 |
| IADL limitations | No IADL limitation | Had 1 or more IADL limitations |
| HRLS | No HRLS | Had HRLS |
| Function limiting pain | No function limiting pain | Had function limiting pain |
| Perceived overall health | Excellent, very good, or good | Fair or poor |
| Variables | Total | Good HAS $ | Poor HAS $ | p-Value |
|---|---|---|---|---|
| n = 5211 | n = 2369 (50.4%) | n = 2842 (49.6%) | ||
| Females, n (weighted%) | 2916 (54.8) | 1196 (50.1) | 1720 (59.6) | <0.001 * |
| Age classification, n (weighted %) | ||||
| 65–74 yrs | 2299 (56.9) | 1233 (64.0) | 1066 (49.8) | <0.001 * |
| 75–84 yrs | 2100 (33.5) | 894 (30.2) | 1206 (37.0) | <0.001 * |
| 85+ yrs | 812 (9.5) | 242 (5.8) | 570 (13.2) | <0.001 * |
| Race/ethnicity, n (weighted %) | ||||
| White | 3770 (84.0) | 1836 (87.2) | 1934 (80.7) | <0.001 * |
| Black | 1048 (7.4) | 386 (5.8) | 662 (9.0) | <0.001 * |
| Hispanic | 269 (6.0) | 87 (4.3) | 182 (7.7) | <0.001 * |
| Others | 115 (2.6) | 55 (2.6) | 60 (2.6) | 0.962 |
| Education, n (weighted %) | ||||
| High school or less | 1177 (18.3) | 350 (12.6) | 827 (24.1) | <0.001 * |
| College or above | 4032 (81.7) | 2017 (87.4) | 2015 (75.9) | <0.001 * |
| Annual income, n (weighted %) | ||||
| <$27,600 | 2293 (37.3) | 723 (25.7) | 1570 (49.1) | <0.001 * |
| $27,600–$41,999 | 975 (18.7) | 451 (18.2) | 524 (19.1) | 0.424 |
| $42,000–$63,999 | 838 (17.5) | 475 (20.2) | 363 (14.7) | <0.001 * |
| $64,000–$107,999 | 716 (17.0) | 455 (22.6) | 261 (11.4) | <0.001 * |
| ≥ $108,000 | 389 (9.5) | 265 (13.3) | 124 (5.7) | <0.001 * |
| Homebound status, n (weighted %) | ||||
| Homebound | 174 (2.5) | 9 (0.2) | 165 (4.8) | <0.001 * |
| Semi-homebound | 238 (3.7) | 14 (0.4) | 224 (7.0) | <0.001 * |
| Not homebound | 4799 (93.8) | 2346 (99.4) | 2453 (88.2) | <0.001 * |
| WC, inches | 39.6 ± 0.2 | 38.7 ± 0.2 | 40.5 ± 0.2 | <0.001 * |
| Abdominal weight status, n (weighted %) | ||||
| Normal # | 600 (11.4) | 345 (14.2) | 255 (8.6) | <0.001 * |
| Overweight # | 1003 (19.6) | 552 (23.1) | 451 (15.9) | <0.001 * |
| Obese # | 3608 (69.0) | 1472 (62.7) | 2136 (75.4) | <0.001 * |
| HAS (0–10) | 6.2 ± 0.0 | 7.7 ± 0.0 | 4.8 ± 0.0 | <0.001 * |
| Health indicators met criteria, n (weighted %) | ||||
| Met physical function criterion | 2444 (55.1) | 1824 (82.9) | 620 (27.0) | <0.001 * |
| Met no cognitive impairment/no dementia criterion | 4324 (86.8) | 2220 (95.1) | 2104 (78.3) | <0.001 * |
| Met good well-being criterion | 1591 (31.5) | 1260 (51.8) | 331 (10.8) | <0.001 * |
| Met no major chronic diseases criterion | 2459 (48.7) | 1587 (66.9) | 872 (30.2) | <0.001 * |
| Met no depression criterion | 4555 (88.5) | 2324 (98.0) | 2231 (78.8) | <0.001 * |
| Met no anxiety criterion | 4651 (89.8) | 2348 (99.0) | 2303 (80.4) | <0.001 * |
| Met no IADL limitation criterion | 329 (5.4) | 114 (4.4) | 215 (6.5) | <0.001 * |
| Met no HRLS criterion | 4353 (85.5) | 2329 (98.4) | 2024 (72.5) | <0.001 * |
| Met perceived overall health criterion | 3974 (79.7) | 2315 (98.3) | 1659 (60.9) | <0.001 * |
| Met no function-limiting pain criterion | 2745 (53.2) | 1849 (76.3) | 896 (29.8) | <0.001 * |
| Variables | Total HAS | Good HAS $ | Poor HAS $ | |
|---|---|---|---|---|
| Adjusted β (95% CI), p for Trend & | Adjusted OR (95% CI), p for Trend @ | |||
| Males stratified by AWS | ||||
| Normal | −0.09 (−0.12, −0.06), <0.001 * | 0.86 (0.82, 0.90), <0.001 * | 1.16 (1.11, 1.22), <0.001 * | |
| Overweight | −0.09 (−0.11, −0.07), <0.001 * | 0.88 (0.84, 0.92), <0.001 * | 1.14 (1.09, 1.19), <0.001 * | |
| Obese | −0.10 (−0.11, −0.08), <0.001 * | 0.87 (0.85, 0.89), <0.001 * | 1.15 (1.12, 1.18), <0.001 * | |
| Interaction terms AWS *round # | 0.781 | 0.772 | 0.772 | |
| Normal | REF | REF | REF | |
| Overweight | 0.000 (−0.036, 0.036), 0.997 | 1.02 (0.96, 1.09), 0.48 | 0.98 (0.92, 1.04), 0.48 | |
| Obese | −0.008 (−0.040, 0.024), 0.627 | 1.01 (0.96, 1.07), 0.617 | 0.99 (0.93, 1.04), 0.617 | |
| Females stratified by AWS | ||||
| Normal | −0.08 (−0.11, −0.05), <0.001 * | 0.91 (0.86, 0.96), <0.001 * | 1.10 (1.04, 1.16), <0.001 * | |
| Overweight | −0.08 (−0.10, −0.06), <0.001 * | 0.89 (0.85, 0.93), <0.001 * | 1.12 (1.07, 1.18), <0.001 * | |
| Obese | −0.10 (−0.12, −0.09), <0.001 * | 0.89 (0.87, 0.91), <0.001 * | 1.13 (1.10, 1.15), <0.001 * | |
| Interaction terms AWS *round# | 0.102 | 0.588 | 0.588 | |
| Normal | REF | REF | REF | |
| Overweight | −0.006 (−0.045, 0.033), 0.751 | 0.98 (0.91, 1.04), 0.467 | 1.03 (0.96, 1.10), 0.467 | |
| Obese | −0.027 (−0.061, 0.006), 0.113 | 0.97 (0.92, 1.03), 0.295 | 1.03 (0.97, 1.09), 0.295 | |
| Variables | Total HAS | Poor HAS vs. Good HAS $ |
|---|---|---|
| β (95% CI), p-Value # | OR (95% CI), p-Value & | |
| Males stratified by AWS | ||
| Normal | REF | REF |
| Overweight | −0.05 (−0.15, 0.04), 0.265 | 1.26 (1.08, 1.48), 0.004 * |
| Obese | −0.20 (−0.30, −0.10), <0.001 * | 1.52 (1.29, 1.79), <0.001 * |
| Females stratified by AWS | ||
| Normal | REF | REF |
| Overweight | −0.05 (−0.14, 0.05), 0.328 | 1.16 (1.01, 1.35), 0.049 * |
| Obese | −0.15 (−0.24, −0.05), 0.002 * | 1.42 (1.21, 1.66), <0.001 * |
© 2020 by the authors. Licensee MDPI, Basel, Switzerland. This article is an open access article distributed under the terms and conditions of the Creative Commons Attribution (CC BY) license (http://creativecommons.org/licenses/by/4.0/).
Share and Cite
Xu, F.; Earp, J.E.; Greene, G.W.; Cohen, S.A.; Lofgren, I.E.; Delmonico, M.J.; Greaney, M.L. Temporal Association between Abdominal Weight Status and Healthy Aging: Findings from the 2011–2018 National Health and Aging Trends Study. Int. J. Environ. Res. Public Health 2020, 17, 5656. https://doi.org/10.3390/ijerph17165656
Xu F, Earp JE, Greene GW, Cohen SA, Lofgren IE, Delmonico MJ, Greaney ML. Temporal Association between Abdominal Weight Status and Healthy Aging: Findings from the 2011–2018 National Health and Aging Trends Study. International Journal of Environmental Research and Public Health. 2020; 17(16):5656. https://doi.org/10.3390/ijerph17165656
Chicago/Turabian StyleXu, Furong, Jacob E. Earp, Geoffrey W. Greene, Steven A. Cohen, Ingrid E. Lofgren, Matthew J. Delmonico, and Mary L. Greaney. 2020. "Temporal Association between Abdominal Weight Status and Healthy Aging: Findings from the 2011–2018 National Health and Aging Trends Study" International Journal of Environmental Research and Public Health 17, no. 16: 5656. https://doi.org/10.3390/ijerph17165656