

Abstract
The development of flexible electronic devices has primarily been focused on the production of flat 2-dimensional sensors and has lacked the ability to manufacture devices with complicated 3-dimensional geometry. A mold-based method for manufacturing devices with 3-dimensional geometry that is cost-effective and repeatable is presented herein. This technique is demonstrated by the fabrication of a novel pressure sensor using a 3-dimensional PDMS membrane patterned with a resistive silver nanowire network. The specific geometry of the sensor was chosen to provide a uniform strain distribution along the silver nanowire network. The sensor has a linear response to pressure, a gauge factor of 4–29, and behaves well under repeated cyclical testing. A flat sensor with a 2-dimensional membrane was also manufactured for comparison to the 3-dimensional sensor. It was observed that the flat membrane has a higher gauge factor but has a non-linear response to pressure.
Export citation and abstract BibTeX RIS
1. Introduction
Flexible electronic materials have generated substantial research interest due to their potential applications in a variety of sensors and devices including touch screens, strain gauges, and tactile pressure sensors, as well as wearable devices like hydration sensors, ECG sensors, and temperature sensors [1–12]. Embedding conductive nanoparticles (such as silver nanowires (AgNWs), copper nanowires, or carbon nanotubes) in a flexible substrate is one way to form a composite material which is flexible and conductive [1–5, 11, 13–16]. There are several well-developed techniques for fabricating these kinds of composite materials, however, so far these techniques have mainly focused on the ability to manufacture flat, 2-dimensional components on 2-dimensional substrates. In this paper, a technique for patterning nanowires onto curved flexible substrates is demonstrated. Herein, a pressure sensor based on a resistive strain gauge patterned onto a spherical portion of polydimethylsiloxane (PDMS) is presented. In this work, the sensor was used to detect air pressures in the range of 0–2.5 kPa. With a few modifications to the design, this sensor would also be suitable for detecting pressure in liquids.
There are many other potential applications for flexible electronics with curved surfaces, such as biosensors. Contact lenses with embedded sensors for glucose monitoring or intraocular pressure (IOP) monitoring for glaucoma detection are examples of instances when it is necessary to have sensor geometry which directly matches a 3-dimensional surface, in this case is the eye [17, 18]. Contact lenses for IOP sensing need to be sensitive to low pressures around 10–35 mm Hg (≈1.33–4.66 kPa), similar to the range investigated in this work [19, 20]. This technique would also be applicable to other devices which require conformal contact with complex geometry, such as mouthguards with sensors embedded for the detection of metabolites [21]. Other than wearable devices, 3-dimensional flow sensors are another related application which can require conductive nanoparticles patterned on a 3-dimensional surface [22].
A common method for fabricating composite AgNW/PDMS includes screen printing nanowires onto PDMS. In this technique, a shadow mask is first placed on the substrate to define the area of the pattern. This requires a rigid 2-dimensional substrate like silicon or glass onto which the nanowires suspended in a solution are drop-cast onto a substrate and the solution is let to dry [1–3, 16]. Afterwards, the mask is removed and PDMS is poured overtop of the dried nanowires. The PDMS is thermally cured and removed from the substrate, forming a composite material. Another common approach for creating AgNW micropatterns involves using techniques such as lithography or reactive ion etching and depositing AgNWs via spray coating [23]. These techniques are expensive and specialized for 2-dimensional applications where a beam of photons or ions are used in conjunction with a shadow mask to create a micro pattern on a flat rigid substrate like silicon. In this technique, the beam operates perpendicular to the substrate creating a 2-dimensional pattern in the x-y plane [24]. Lee et al demonstrated the use of photolithography to create 3-dimensional mogul-shaped micro features on a 2-dimensional substrate. The 3-dimensional mogul-shaped bumps were coated with a thin layer of gold to create stretchable electronic features [25]. The capability to produce 3-dimensional features on the microscale exists on 2-dimensional substrates, however the method presented in this paper differs as it specializes in producing 3-dimensional features on a macroscale like this pressure sensing membrane with curved features on the order of several millimeters.
To overcome the limitations presented by traditional AgNW patterning methods, a mold-based method is utilized to imprint PDMS with a channel that matches the desired pattern. The channel can then be filled directly with AgNWs. This allows for the direct creation of substrates with curved patterns in 3-dimensions, uniquely designed for a specific application. This technique is demonstrated here by the development of a fluidic pressure sensor. The operating principle of the fluidic pressure sensor is similar to a linear resistive strain gauge. When an AgNW network is stretched, some of the junctions between AgNWs temporarily disconnect, decreasing the number of conductive pathways and increasing the resistance [11]. In this paper, the AgNW network is patterned on a spherical PDMS membrane. When pressure is applied on one side of the membrane the patterned AgNW network expands slightly, disconnecting AgNW junctions and increasing the resistance. This resistance can be measured and used to infer the pressure being applied. The spherical geometry and the channel pattern were chosen based on the criteria of fabricating a membrane which has a uniform strain distribution and maximizes the total change in resistance. A sensor using a flat membrane was also fabricated, and its performance is compared to the sensor using the spherical membrane.
2. Membrane fabrication
In order to fabricate the unique 3-D membrane, a reusable aluminum mold that can be used to produce a PDMS membrane patterned with the desired channel was utilized. To form a thin, spherical membrane a 2-piece mold is needed. The bottom piece contains an intrusive spherical depression with a raised patterned channel. The top piece is extrusive and spherical with a radius slightly smaller than the bottom piece allowing it to fit easily inside. The radius of curvature for the bottom piece was 5.86 mm and the radius of the top piece was fabricated to 5.36 mm in order to produce PDMS membrane 500 µm thick. The bottom part of the mold was produced using a Microlution 363-S micromilling machine and the top part was produced with a Sherline 4410 lathe.
To produce the curved portion of PDMS, liquid PDMS mixed at a ratio of 15-parts base to 1-part curing agent was degassed in a vacuum for 30 min, poured into the bottom part of the aluminum mold, and degassed again. After degassing, the top piece was inserted onto the bottom, displacing the excess PDMS such that only a thin layer of PDMS with a thickness of 500 µm remained between the pieces. The filled mold was then placed in an oven for 60 min at 60 °C, to cure the PDMS. Once the PDMS was fully cured, the solid PDMS was removed from the mold, as illustrated in figure 1(a). The raised channel on the bottom piece of the mold has a height of 150 µm and a width of 1.5 mm, which imprinted a channel with a depth and width with the same dimensions onto the PDMS. The 150 µm walls on the channel are necessary to contain the AgNWs within the patterned region.

Figure 1. (a) Schematic illustrating the fabrication process of the AgNW/PDMS pressur sensor. The patterned PDMS sensor was manufactured using an aluminum mold with a defined channel pattern, then filled with AgNWs. (b) Final product of the AgNW/PDMS pressure sensor after fabrication but before the fixation onto the testing apparatus and the attachment of the connection wires that are later used during experimentation. With corona surface treatment, the AgNW channel is continuously distributed. The specific dimensions of the channel allow for the AgNWs to be defined within the patterned area with little overflow.
Download figure:
Standard image High-resolution imageBefore the AgNWs were deposited on the PDMS, the PDMS was surface treated using an Electrotechnics BD-20AC laboratory corona surface treater for 1 min. This was used to increase the affinity between the ethanol in which the AgNWs are suspended and the PDMS. Typically, ethanol and PDMS have a low affinity which would cause the solution to distribute unevenly on the substrate [10]. It has been shown previously that by surface treating PDMS with corona surface treatment or oxygen plasma, the affinity between PDMS and ethanol increases resulting in a more evenly distributed AgNW network [7, 26, 27]. After surface treatment, AgNW/ethanol solution with a concentration of 5 mg ml−1 was deposited by a pipette in 100 µl increments. This was the maximum amount of solution that could be deposited before the channel would overflow. The same amount of solution was deposited multiple times to increase the density of the AgNWs in the channel, thereby lowering the initial resistance. The final sample is pictured in figure 1(b).
3. Membrane design
An investigation using finite element analysis (FEA) compared sensor designs with flat membranes to those with curved membranes. The membranes that were compared had equal diameters of approximately 14.5 mm, and equal channel widths of 1.5 mm. Two flat and two curved sensor designs were tested using these methods. For each sensor design (curved and flat) two different channel pattern layouts were compared: a linear channel stretched straight across the sensor, in case one, and a horseshoe shaped channel, in case two. This horseshoe design has an increased unstretched length when compared to the linear design, as it doubles back on itself across the face of the sensor. The numerical parameters used in the simulations are summarized in table 1. All membranes had the same thickness and the channels had the same width and height. The PDMS was modelled as a neo-Hookean hyperelastic material with an initial shear modulus, G, of 335 kPa. This was calculated using the equation  , where the Young's modulus, E, was 1 MPa and Poisson's ratio, ν, was 0.49 [28, 29]. The designs that were simulated with this methodology are shown in figure 2. Using ANSYS, the response of the four designs were simulated at pressures between 0–2.5 kPa. All simulations had similar constraints. The flat outer edge (width 4 mm) was fixed in all directions, which reflects the experimental testing conditions used in section 4. A normal pressure was applied uniformly to the central circular portions of the membranes.

Figure 2. Four designs which were investigated in FEA to identify a membrane that would have a large change in resistance when pressurized.
Download figure:
Standard image High-resolution imageTable 1. Numerical parameters used in simulations of the membrane behaviour.
| Parameter | Value |
|---|---|
| Membrane thickness | 250 µm |
| Channel height | 150 µm |
| Channel width | 1.5 mm |
| Shear modulus | 335 kPa |
In general, the relationship between resistance, R, and length, L, of a conductor can be described using the relationship  , where
  is resistivity and A is the cross-sectional area of the conductor. As resistance has a linear response to change in length, for the sensors described here, the change in length (ΔL) of the channel that would be patterned with AgNWs can be used as a predictor of the change in resistance of the sensor. In simulations, as pressure increased, the membranes expanded, increasing the length of the channels. The simulation results show that the curved membrane with the horseshoe patterned channel has the largest change in length (970 µm at 2.5 kPa), which is significantly greater than the next largest change in length (720 µm at 2.5 kPa for the flat membrane with the horseshoe pattern). This is expected as a curved membrane creates a larger surface area that can accommodate a longer channel. When normalizing for original channel length (L0), the flat membrane with the linear pattern has the greatest response to pressure, followed closely by the curved linear and curved horseshoe patterns, as shown in figure 3. However, the total change in length for the curved membrane with horseshoe pattern is almost double that of the flat membrane with the linear pattern. Recalling the relationship between resistance and conductor length, this means that for the curved membrane with horseshoe pattern, the change in the measurable signal R is expected to be largest of all the samples. This is beneficial in that having a higher absolute change in resistance is expected to produce a higher signal-to-noise ratio, however, the curved horseshoe sample has a lower relative change in length compared to the flat linear sample, meaning it is expected to have a lower gauge factor than the flat linear sample would. Though the relative change in length was similar for both the curved horseshoe and curved linear designs, experimental testing proceeded using the curved horseshoe design as it had a much larger total change in length. The flat linear design was also tested experimentally as a comparison, it was selected because the simulation predicted it would have the highest gauge factor.
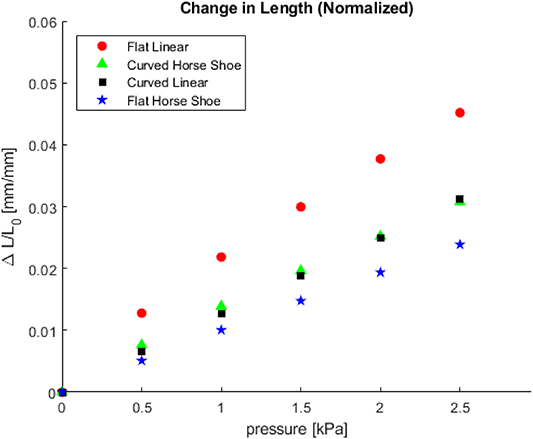
Figure 3. The change in length of the different channels when pressurized, normalized to their unstretched length.
Download figure:
Standard image High-resolution imageFigure 4 demonstrates the deformation of the four designs at 2.5 kPa. This shows that the membranes with curved topologies undergo approximately isotropic expansion, experiencing roughly equal deformation across the curved face. The flat membranes, however, have a deformation profile with a strong peak in the center. This means the curved horseshoe design will have uniform strain along the channel, with the only exception being where the channel connects to the pads, whereas for a design such as the flat membrane with a linear channel, a greater degree of stretching will occur when the channel crosses the centre of the membrane. It is advantageous to have a design with symmetric deformation, as a local maximum such as the one present in the flat linear design could provide a point of failure at higher pressures or after repeated use, or could contribute to a non-linear sensor response.
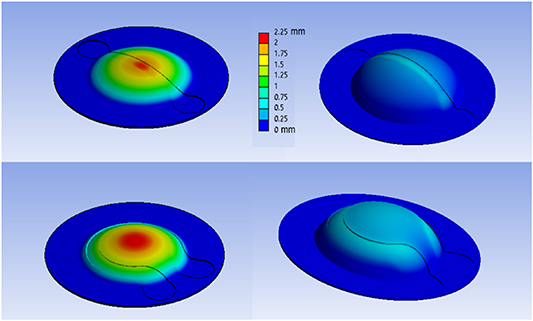
Figure 4. The finite element analysis results of the magnitude of deformation experienced by the membrane at a pressure of 2.5 kPa. Clockwise from top left, the designs shown are flat with linear channel, curved with linear channel, curved with horseshoe channel, and flat with horseshoe channel.
Download figure:
Standard image High-resolution image4. Experimental results
4.1. Silver nanowire distribution
Microscope images were used to verify that the nanowires formed a well distributed network. The images show that the corona surface treatment step in the fabrication process provided continuous nanowire coverage to the entire channel with no bare regions. This is important, as any areas with poor coverage could lead to discontinuities in the electrical pathway of the network. Figure 5(a) depicts where the edge of the channel meets the PDMS wall outside the patterned region. These images show a sharp and well-defined transition between the regions with little to no overflow of AgNWs. This is essential for creating patterns with high resolution and shows that even though the channel on the curved membrane is inclined at approximately a 30-degree angle, minimal overflow occurred when AgNWs were drop-cast in the channel during fabrication.
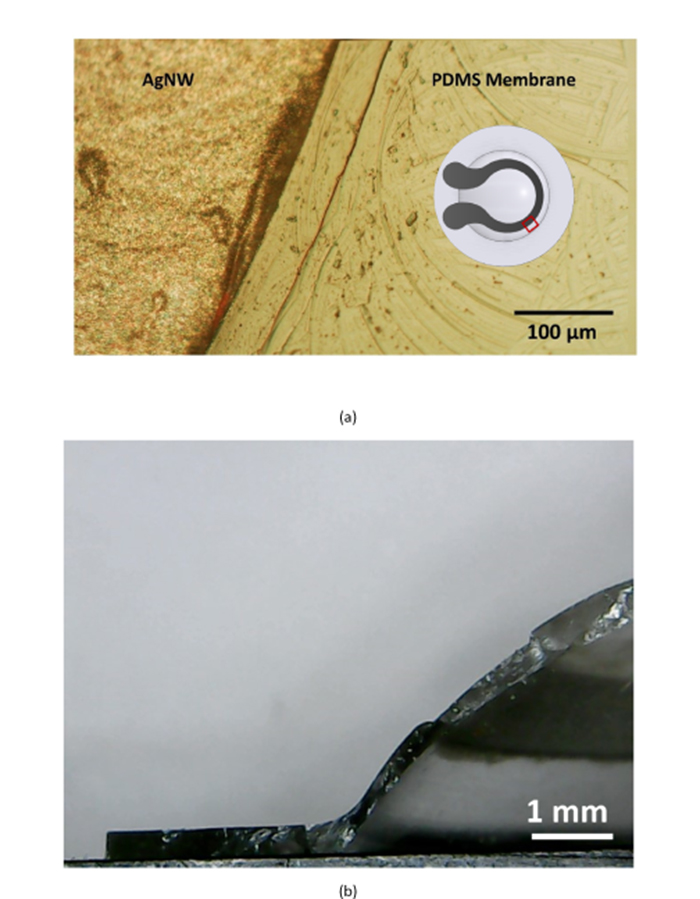
Figure 5. (a) Image of the transition between AgNW patterned region and bare PDMS membrane. This is a composite image formed from two separate images in order to have both regions in focus in the same figure. (b) Demonstrates the cross-section of the PDMS membrane. This figure highlights the relative dimensions of the membrane and was used to measure its features.
Download figure:
Standard image High-resolution imageFigure 5(b) shows a cross-section of the curved membrane. The dimensions of the channel height, channel width, and membrane thickness were measured using this image and compared to the mold dimensions (table 2). These dimensions closely match the mold dimensions specified in section 2 and the simulation dimensions discussed in section 3. The height of the channel was slightly less, 110 µm compared to the 150 µm of the mold. The overall membrane thickness had a mean of approximately 325 µm. The membrane was thicker near the top of the sphere and thinner near the edge. The cross-section further reveals that the nanowires formed an extremely thin layer with a thickness that is much less than the 110 µm sides of the channel.
Table 2. Dimensions of the mold and PDMS membrane.
| Mold | PDMS membrane | |
|---|---|---|
| Channel height | 150 µm | 110 ± 25 µm |
| Channel width | 1.5 mm | 1.57 ± 0.02 mm |
| Membrane thickness | 500 µm | 325 ± 140 µm |
4.2. Sensor performance
The deformation behaviour of the pressure sensors was characterized using simulation and experimentation to determine the relationship between pressure, the change in length of the conductive pathway, and resistance. In many linear strain gauges made of AgNWs and PDMS, the relationship between strain and change in resistance (ΔR) has been shown to be linear [11, 15]. As this device has a unique 3-dimensional geometry, an investigation was made to determine whether the pressure/resistance relationship is linear for this case. The behavior of the sample was investigated by inflating the PDMS membrane with compressed air. Using a liquid like water instead of air for the tests described in this section was briefly considered, however it was observed that water permeated the thin PDMS membrane wetting the AgNW network. By either thickening the PDMS membrane or adding an additional membrane made of a water impermeable material to the testing apparatus, this sensor could be extended to detect liquid pressure in application such as microfluidics.
During performance testing of the sensors, an air-tight seal was formed by fastening the membrane between two acrylic disks screwed onto an aluminum block. Holes were drilled in the aluminum block so that a small compressed air hose could be attached to the block to funnel air into the membrane (figure 6). A pressure regulator was used so that the air directed towards the pressure sensing membrane was at a constant pressure.

Figure 6. The apparatus used during experimental testing of the PDMS membrane. The flat outer ring of the PDMS membrane is clamped between two pieces of acrylic to create a seal for pressure measurement. The sample shown here is the curved membrane with the horseshoe channel.
Download figure:
Standard image High-resolution imageBecause the membrane stretches in 3-dimensions when deformed by pressure, it is difficult to measure the change in length, ΔL, of the channel directly. However, as the horseshoe shape of the channel mainly consists of a circle and because the membrane inflates isotropically, the change in the radius of circle can be used to approximate the overall change in length of the channel. Whereas it is difficult to measure the entire length of the channel at a given instant, by using optical microscope imaging it is easy to measure the change in radius (Δr) by measuring the deflection of a given point along the edge of the channel in the x-y plane. As the circumference of a circle has a linear relationship to its radius, the change in length of the channel is expected to be proportional to change in radius. Figures 7(a) and (b) show images of the sample which were captured using a Motic PSM 1000 microscope. Measurement of the displacement of the channel using the images was completed with ImageJ. The results of the experimental analysis of the pressure sensing membrane were also compared to the results from the FEA model that was used earlier in the design investigation. The results of both experiment and simulation are summarized in figure 7(c). From the simulation, measurements of both ΔL and Δr were obtained.
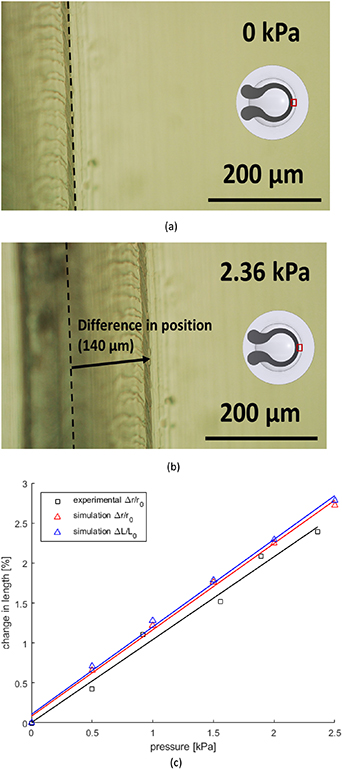
Figure 7. (a) Image of sensor used in experimental analysis when no pressure was applied. This was used to determine the experimental unstretched radius, r0. (b) Image of sensor used in experimental analysis with a pressure of 2.36 kPa applied. The dotted line in this figure identifies r0, the radius at 0 kPa. The arrow represents the change in radius, Δr, which is 140 μm at this pressure. The inset images in both (a) and (b) identify the imaging location for this measurement, which was the same for both figures. (c) The experimental and simulated results of the change in length and change in radius at pressures between 0 and 2.5 kPa.
Download figure:
Standard image High-resolution imageIn figure 7(c), the experimental results of Δr/r0 show a linear relationship (r-squared value of 0.986). The simulation results for both the total change in length and the change in radius also show a linear relationship (r-squared values of 0.995 and 0.996, respectively). The simulation results confirm that even though an estimate for the change in length of the transition region and the pad region could not be factored into the experimental measurement, the change in radius of the circular region is a good proxy for the total change in length of the entire channel, as both results have very similar linear relationships.
The relationship between pressure and resistance for the samples was characterized in a similar way to the relationship between pressure and change in length. An LCR meter was connected to the sample using 100 µm thick wires with the ends twisted into spirals. The wires were held in place between the two acrylic plates on the aluminum block. Using the same pressure regulator as before, constant pressure was applied to the membrane. The pressure was held constant for 30 s, during which time the resistance of the sample was measured. This was repeated for four different samples of curved horseshoe membranes. The pressure is plotted against the mean resistance over the interval in figure 8(a). The error bars represent the standard deviation during the 30 s interval. Based on the linear relationship between pressure and change in length, as well as previous studies showing a linear relationship between strain and resistance, it was expected that the relationship between pressure and resistance would also be linear. Linear fits for the samples had r-squared values ranging between 0.852–0.995. The gauge factor (GF) of the sensor was calculated using the equation
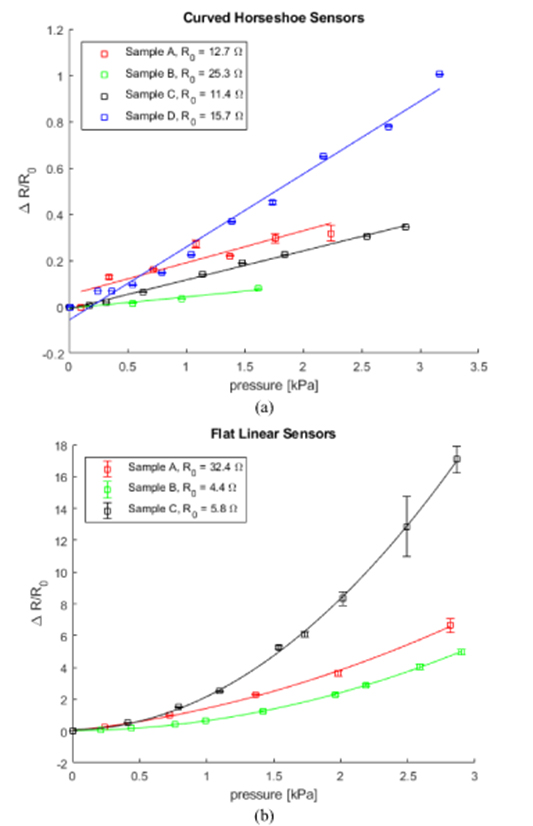
Figure 8. (a) Resistance response of the curved horseshoe sensor samples over a pressure range of 0–3 kPa. (b) Resistance response of the flat linear sensor samples over a pressure range of 0–3 kPa.
Download figure:
Standard image High-resolution imageThe samples have gauge factors ranging 4–29, similar to other typical AgNW based resistive strain gauges [11, 23, 30]. In addition to having different gauge factors, the samples also have different R0 values, ranging 11.4 Ω—25.3 Ω. The differences in gauge factors and initial resistances of the samples indicate the need for a calibration step to characterize the responses of the sensors. The differences in these values likely arise as a result of small differences in network distribution between samples. As discussed in section 4.1, the distribution of AgNWs is continuous, however, due to the 3-dimensional shape of the channel it is difficult to ensure that this distribution is uniform. For example, the slope of the channel is steepest where it connects to the pads, meaning the AgNW solution tends to flow from the channel into the pad, which causes the AgNW network to be less dense in this region of the channel. The density of the AgNWs is closely associated with network resistance, where a lower density causes higher resistances [12]. Effects such as this can cause difference in resistances between samples due to variations in the local AgNW areal densities. As a comparison, the resistance response to pressure was tested for the flat linear design that was discussed in section 3. The flat samples were made using a similar 2-part mold as was used for the 3-dimensionsonal samples. Three different flat samples were tested using the same procedure as was used for the curved horseshoe sample. The results are shown in figure 8(b). The flat samples with linear channels show a higher gauge factor than the curved samples and display a resistance response to pressure that is non-linear. A second order polynomial fit showed good agreement with this data, with r-squared values exceeding 0.995 for all samples. The gauge factors for the flat linear samples are about 150, 90, and 280 at 2.5 kPa for samples A, B, and C, respectively. Based on the simulation results shown in figure 3, the flat linear sample is expected to be slightly more responsive than the curved horseshoe sample. Simulations predict an increase in channel length of 0.0452 mm mm−1 for the flat linear samples and an increase of 0.0307 mm mm−1 for the curved horseshoe sample. It is expected that the resistance response would be larger by a similar factor, however, we observe an order of magnitude increase, rather than a lesser increase of 50%. The simulation results also predict that both sensors should have a change in length that is linear with respect to pressure, however the resistance response is non-linear for the flat sample with linear channel, indicating that there is something effecting its behaviour that does not occur in the curved horseshoe sample. The increased gauge factor and non-linear sensor behaviour for the flat linear sample could be a result of the stress concentration shown in the FEA results of the flat linear sample in figure 4. No such stress concentration appear in the curved horseshoe sample where isotropic stretching occurs. This could contribute to the better linearity seen in the curved horseshoe sensor behaviour.
There are two main contributors for the uncertainty associated with the measurements for the samples presented in figure 8. The first comes from the dynamic response of the sensor when pressurized. As can be seen from the resistance measurements shown in figure 9, there is an initial peak in resistance that coincidence with the pressure turning on. This is a significant contribution to the variance in resistance of the time interval the measurements were recorded for. Another primary contribution comes from the sensitive connection between the AgNW network and the coiled wires used as leads to connect to the LCR meter for reading resistance. In the future, this could be adjusted by incorporating a wireless output reading device so that the network does not need to be connected to rigid leads to output.
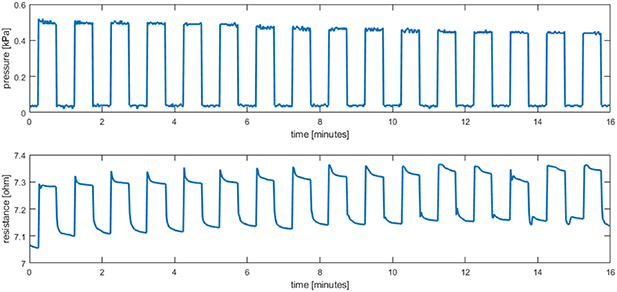
Figure 9. Cyclic pressure testing of the AgNW PDMS sensor, for 16 cycles at 30 s intervals.
Download figure:
Standard image High-resolution image
The behaviour of the pressure sensor over time and repeated stretching is another important factor to characterize. Experimentation of the behaviour of the curved horseshoe AgNW/PDMS pressure sensor over multiple pressure cycle was conducted using controlled air flow. A different sample was used for this experiment than the samples which appeared in earlier discussions. A diverting air valve was used to cycle the pressure on and off. When the valve was turned off, the air flow was be redirected out through an exhaust valve. When the valve was turned on, the air continued to a T-junction where one end was attached to a reference pressure sensor used to measure the pressure applied to the AgNW sensor, and the other end was attached to the same aluminum apparatus described above where the AgNW/PDMS sensor was fixed over top a the only opening. The airflow pressure was cycled between 0.05 and 0.5 kPa for 16 cycles. Each cycle consisted of a period of 30 s and 30 s off, for a total experimental time of 16 min. The results from this test are shown in figure 9.
It should be noted that when the airflow was cycled off the expected pressure is 0 kPa, however the measured pressure was consistently 0.05 kPa. This was likely due to either the error in the reference pressure sensor used, the result of any air trapped in the tubing or a combination of the two. The resistance of the sensor when not pressurized (R0) was 7.1 Ω and the resistance increased to approximately 7.3 Ω when a pressure of 0.5 kPa was applied, resulting in a gauge factor of 5.6. The device shows good repeatability during cycling. There is a slight increase in the baseline of the resistance that occurs during testing. This could be due to either noise in the signal, or a steady increase to the baseline which is a feature sometimes present in AgNW/PDMS piezoresistive sensors [13]. If it is the latter case, in the future it could be accounted for through calibration.
5. Conclusion
In this paper a mold-based patterning technique for manufacturing 3-dimensional flexible electronics was investigated. This technique was demonstrated through the fabrication of a curved pressure sensor. Initial FEA simulations demonstrated the benefit of utilizing 3-dimensional substrates to provide a uniform strain distribution and large change in channel length. The manufacturing process used micromilled molds to produce curved PDMS with imprinted channels that could be filled with AgNWs. Analysis of microscope images of the sample revealed that the AgNWs coated the entire channel with little overflow onto the PDMS outside of the patterned area. An investigation of the sensor performance completed using compressed air showed the change in length of the patterned area filled with AgNWs had a linear relationship with the pressure and had gauge factors ranging from 4–29. During experimental testing, only the displacement of the outer edge of the patterned channel could be measured when pressure was applied. This was found to be a good approximation for the total change in length, as a simulation using an FEA model verified that the total change in length of the channel and the change in the radius both had similar results to the experimental test. The resistance of the AgNW network also demonstrated a linear trend when pressure was applied. During cyclic testing, the resistance changed almost instantaneously in response to the change in pressure. When the pressure was cycled off, the resistance returned to its original value. This 3-dimensional design was compared to a design using a pattern on a 2-dimensional, flat membrane. It was observed that the samples with the flat membranes had higher gauge factors (90–280), but had non-linear responses to pressure, possibly due to the non-uniform strain distribution which is present on the flat membrane. Compressed air was used in the tests performed on the sensor; however, the device would also be compatible with liquid provided that a water impermeable membrane is added to the testing apparatus. Until now, the patterning of silver nanowires has been restricted to 2-dimensional substrates. The method demonstrated in this work extends the range of possibilities to patterning on 3-dimensional substrates, which has applications beyond the pressure sensor shown herein, including biomedical sensors such as contact lenses.
Acknowledgments
This work is supported by Natural Sciences and Engineering Research Council of Canada under funding no. RGPIN/30763.