Numerical Simulation on Impact Test of CFRP Strengthened Reinforced Concrete Beams
 He Qingfeng
 Li Jiang
 Yue Leiyang
 Mao Jiawei
- 1College of Civil Engineering, Hunan University, Changsha, China
- 2Key Laboratory of Structural Damage Diagnosis in Hunan Province, Changsha, China
As the main horizontal load-bearing member, the research on the impact resistance of reinforced concrete beams is an important part of the design of building structures against strong dynamic loads. Therefore, impact-resistant design is critical to the safety and maintainability of such structures. However, the impact performance of RC beams has not been well understood, and the methods of strengthening RC structures to resist impact loads are still very limited. In this study, experimental tests and numerical simulations were carried out to study the performance of RC beams with or without FRP reinforcement under impact loads. In order to study the dynamic performance of reinforced concrete beams before and after CFRP reinforcement under different impact conditions, the finite element analysis software ANSYS/LSDYNA was used to simulate the impact test of five ordinary RC beams and five strengthened beams. The impact speed and impact weight of the drop hammer are mainly changed during the simulation, and the stress distribution, crack development and failure morphology, and CFRP resistance contribution of the specimen were analyzed. The simulation results show that CFRP can alleviate the high stress in the impact transient concrete, reduce the deformation of the beam body, limit the crack development, and provide a certain impact resistance. The increase of the impact height has a more significant effect on the transient response of the component. CFRP can effectively restrain the deformation under different impact weight conditions. Therefore, strengthening RC beams with CFRP is an effective method to improve the impact load resistance.
Introduction
In recent years, impact accidents caused by various reasons have caused a large number of casualties and property losses. The impact resistance of building structures has become a difficult problem in the field of civil engineering. The impact load is a kind of strong dynamic load with high loading rate, short acting time and great destructiveness, which is fatal to the structure damage (Liu, 2017). There are many reasons for the impact load, such as the impact of falling rocks caused by natural disasters, the impact of vehicles caused by human accidents or reckless operations, and the fall of heavy objects in factories (Meng, 2012). For a large number of existing engineering structures, especially concrete structures, the effect of impact load was rarely considered in the original design. At present, strengthening existing concrete structures to improve their impact resistance is more time-saving and economical than demolishing and rebuilding. FRP materials have become the main choice for strengthening and repairing concrete structures due to its excellent properties. Therefore, the application of FRP to improve the impact resistance of concrete structures has more optimistic prospects.
Reinforced concrete beams are the basic components of building structures, and the research on their impact resistance and failure mechanism is the basis for exploring the overall impact resistance of structures. There are many tests conducted on the impact resistance of reinforced concrete beams at home and abroad, and some scholars have carried out the drop weight impact test of FRP reinforced beams. Pham and Hao (2017) studied the performance of FRP-reinforced RC beams under impact load through experiments. Goldston et al. (2016) analyzed the effect of long-winding reinforcement on the shear resistance and failure mode of beams with insufficient static shear strength under impact loading. Wang et al. (2015) conducted an experimental study on the performance of unreinforced beams and externally bonded AFRP reinforced beams, and analyzed the failure process of concrete beams under impact loading and the strain curve of externally bonded AFRP cloth. However, limited by the development level of the existing impact test technology, it is difficult to refine the dynamic performance of reinforced concrete structures under the impact load by using test methods. In order to find the uniform law of the dynamic response of the test pieces, it is often necessary to carry out the impact test of multiple groups of test pieces, which is time-consuming, low economic and difficult to achieve.
The numerical simulation based on the finite element method provides an effective means to obtain the dynamic performance of different specimens under more working conditions, among them, the LS-DYNA program is currently the most widely used finite element analysis software in this field, many researchers have used this software to simulate the dynamic response of structures under impact loads and have achieved rich results (Kishi et al., 2001, 2011; Mohammed and Parvin, 2011; Tavakkolizadeh and Fazelipour, 2012). Jiang et al. (2012) used the elastoplastic damage cap model to perform numerical simulation on the impact test of reinforced concrete beams. The simulated collision force, mid-span deflection of the beam body and the damage status of the beam body are in good agreement with the experimental conditions. Liu et al. (2015) used LS-DYNA nonlinear finite element software to numerically simulate the RC beam transverse low-speed impact test, and studied the impact response process and failure mechanism of the RC beam from the aspects of dynamic damage expansion and impact energy conversion. Liao et al. (2017) used explicit finite element analysis software ls-dyna to numerically analyze the impact resistance of reinforced concrete beams before and after reinforcement under impact load, and found that high-strength steel strand net-polymer mortar reinforcement can significantly improve the impact resistance of reinforced concrete beams. The above literature provides some ideas and help for the simulation of this article, but the content of its research also has certain limitations. At present, there are few studies on the dynamic performance of CFRP-reinforced concrete members under impact load. The impact damage mechanism, dynamic response characteristics and CFRP impact resistance contribution are not yet clear, and a reasonable and feasible design method for impact-reinforcement reinforcement has not yet been formed.
Based on this, in order to explore the dynamic performance of reinforced concrete beams strengthened by CFRP under different impact conditions, this paper uses the finite element analysis software ANSYS/LS-DYNA to establish a simplified model of the drop weight impact test. After the actual impact test of reinforced concrete beams of the same size and reinforcement verified the model’s rationality, the dynamic performance of CFRP reinforced concrete beams under different impact conditions was simulated and analyzed. The impact resistance of reinforced concrete beams after CFRP reinforcement is studied, which provides a reference for the impact resistance design of actual reinforced structures.
Impact Test
In order to verify the rationality of the ANSYS/LS-DYNA model and parameter settings used for impact simulation, the impact test of reinforced concrete beams of the same size and reinforcement was simulated. The experiment designed and produced a cast-in-place reinforced concrete beam with a beam section size of 150 × 320 mm, a total length of 3500 mm, and a net span of 2900 mm. The longitudinal reinforcement strength class is HRB400; the stirrup HPB300 is encrypted at both ends of the beam. The test beam reinforcement and dimensions are shown in Figure 1, and the drop weight impact test device is shown in Figure 2. In the test, the standard concrete cube test block and the steel bar sample are reserved when the test piece is produced. The test results of the mechanical properties of the materials are shown in Table 1.
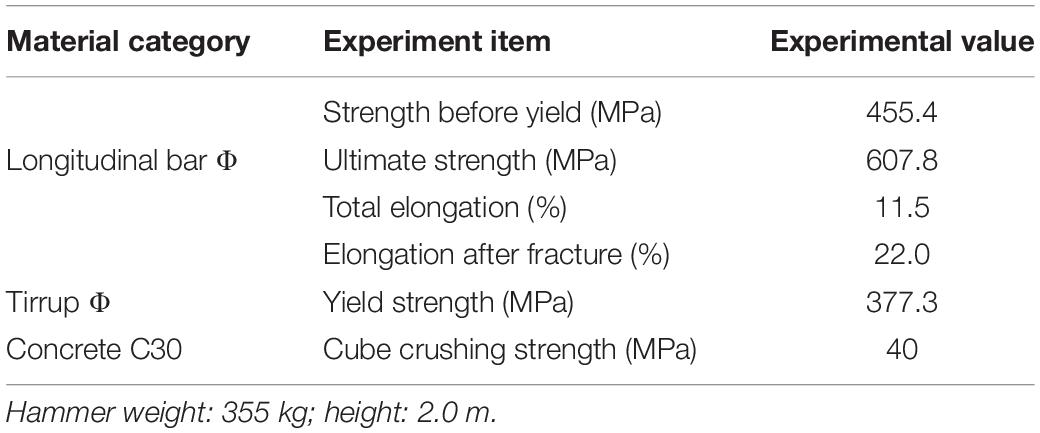
Table 1. Experimental results of material properties.
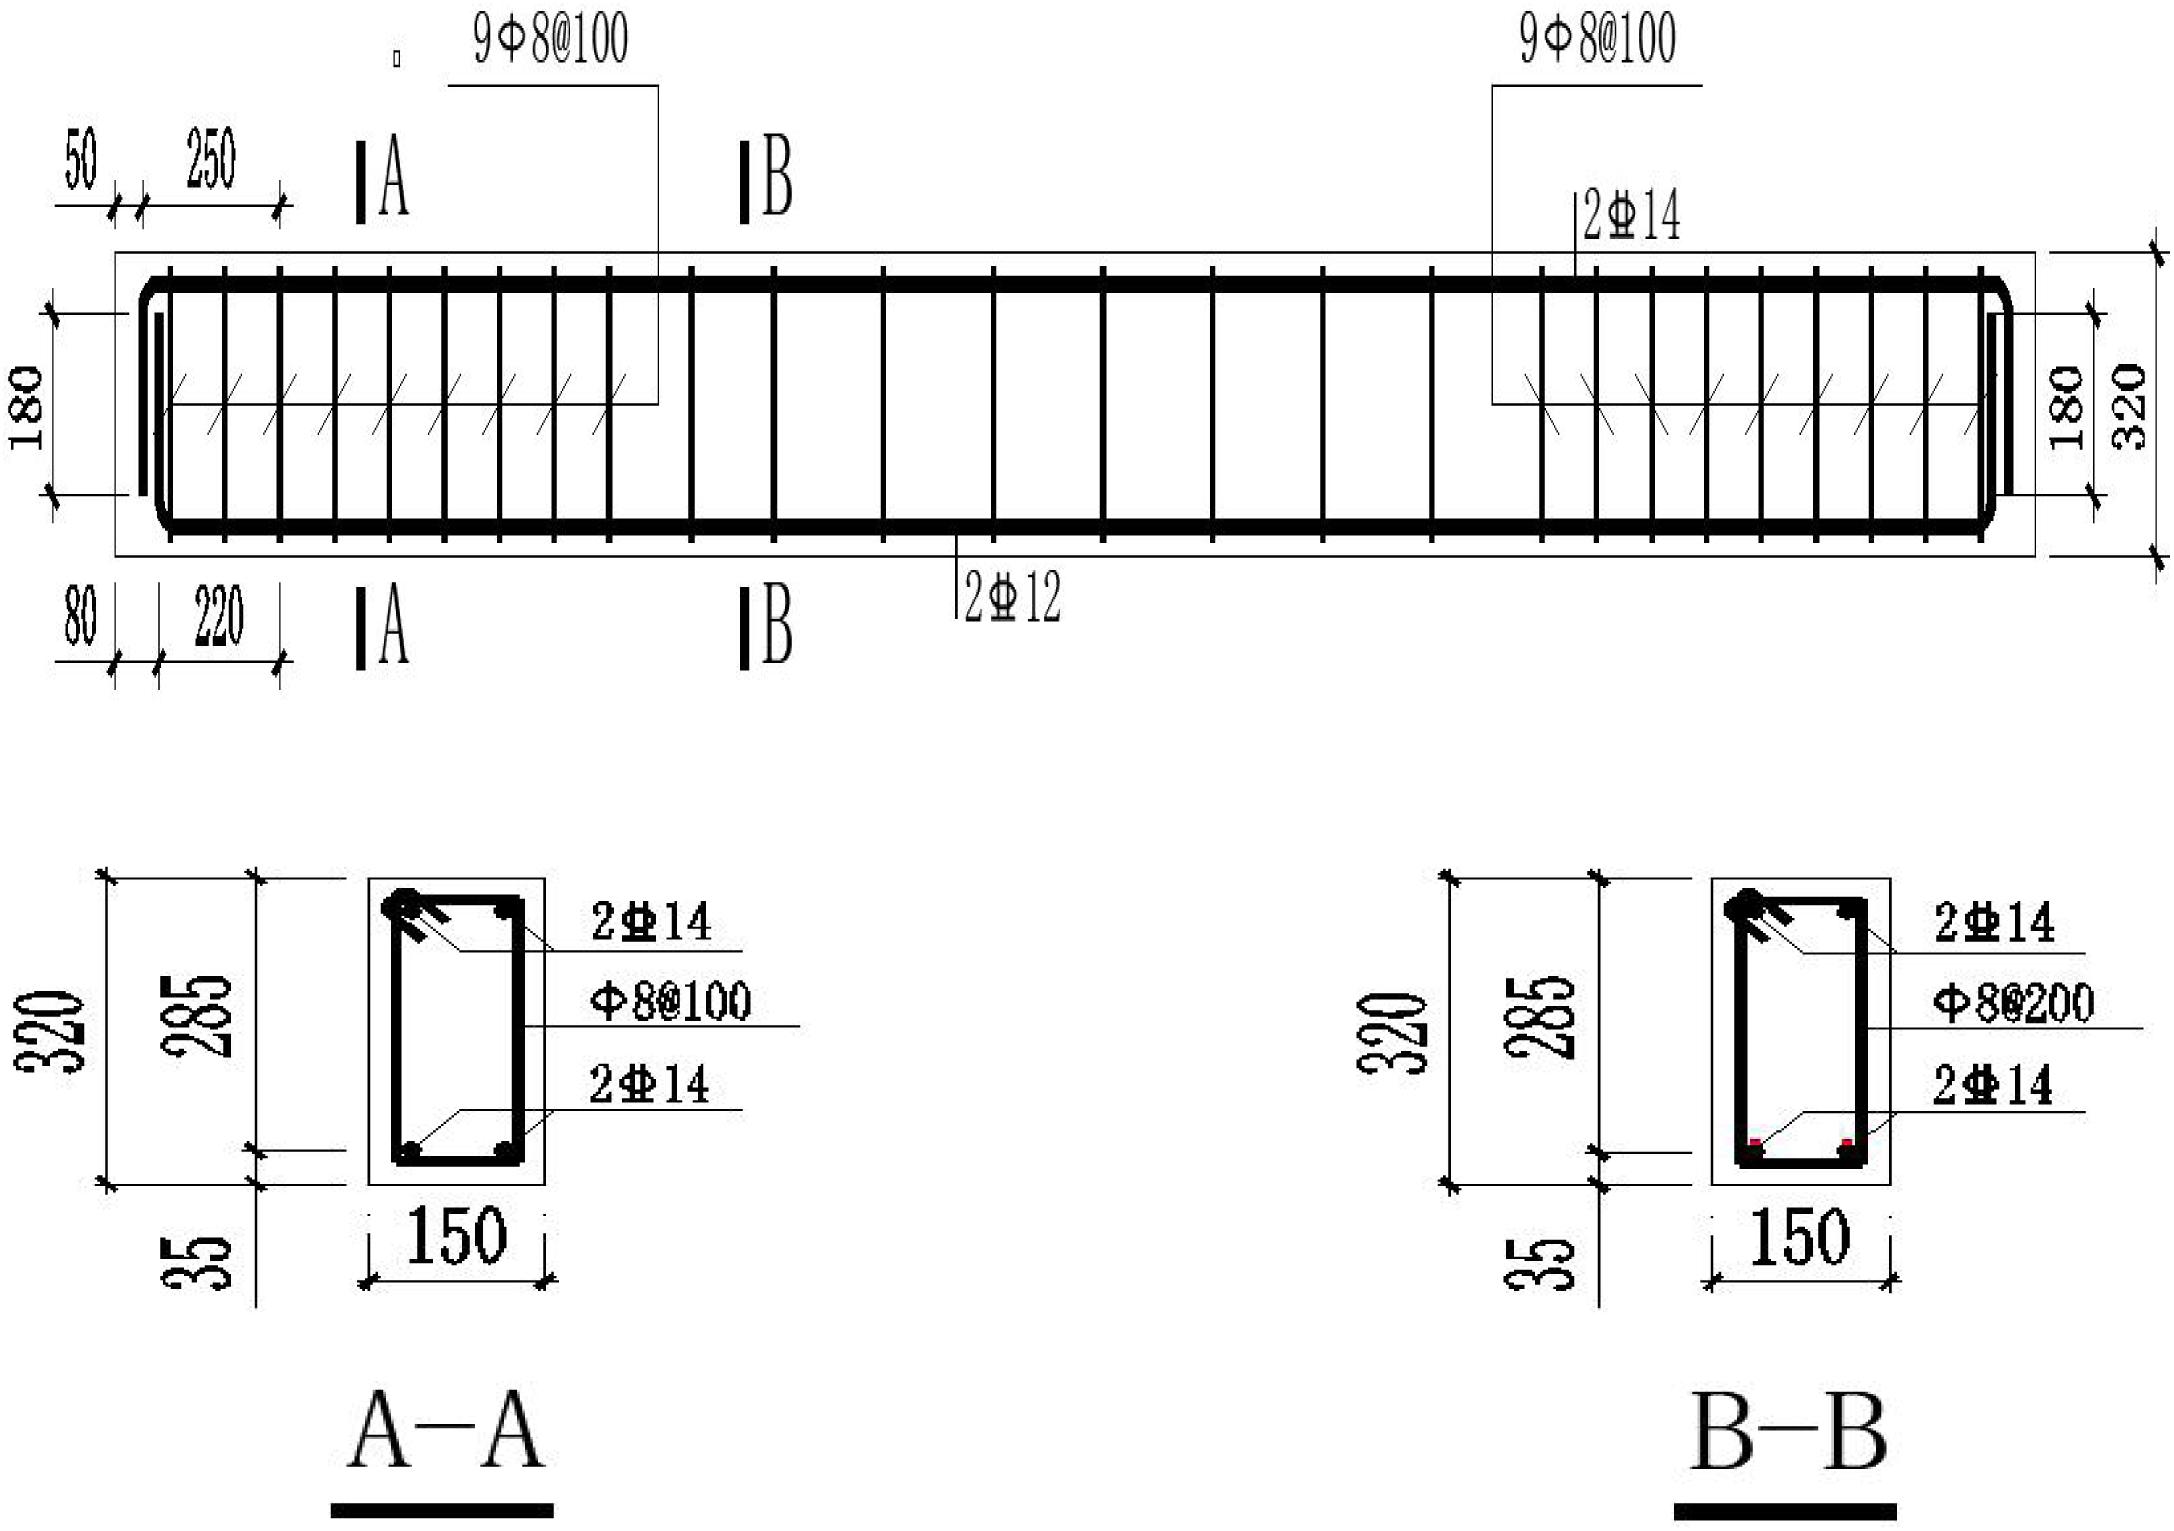
Figure 1. Specimen size and reinforcement (unit: mm).
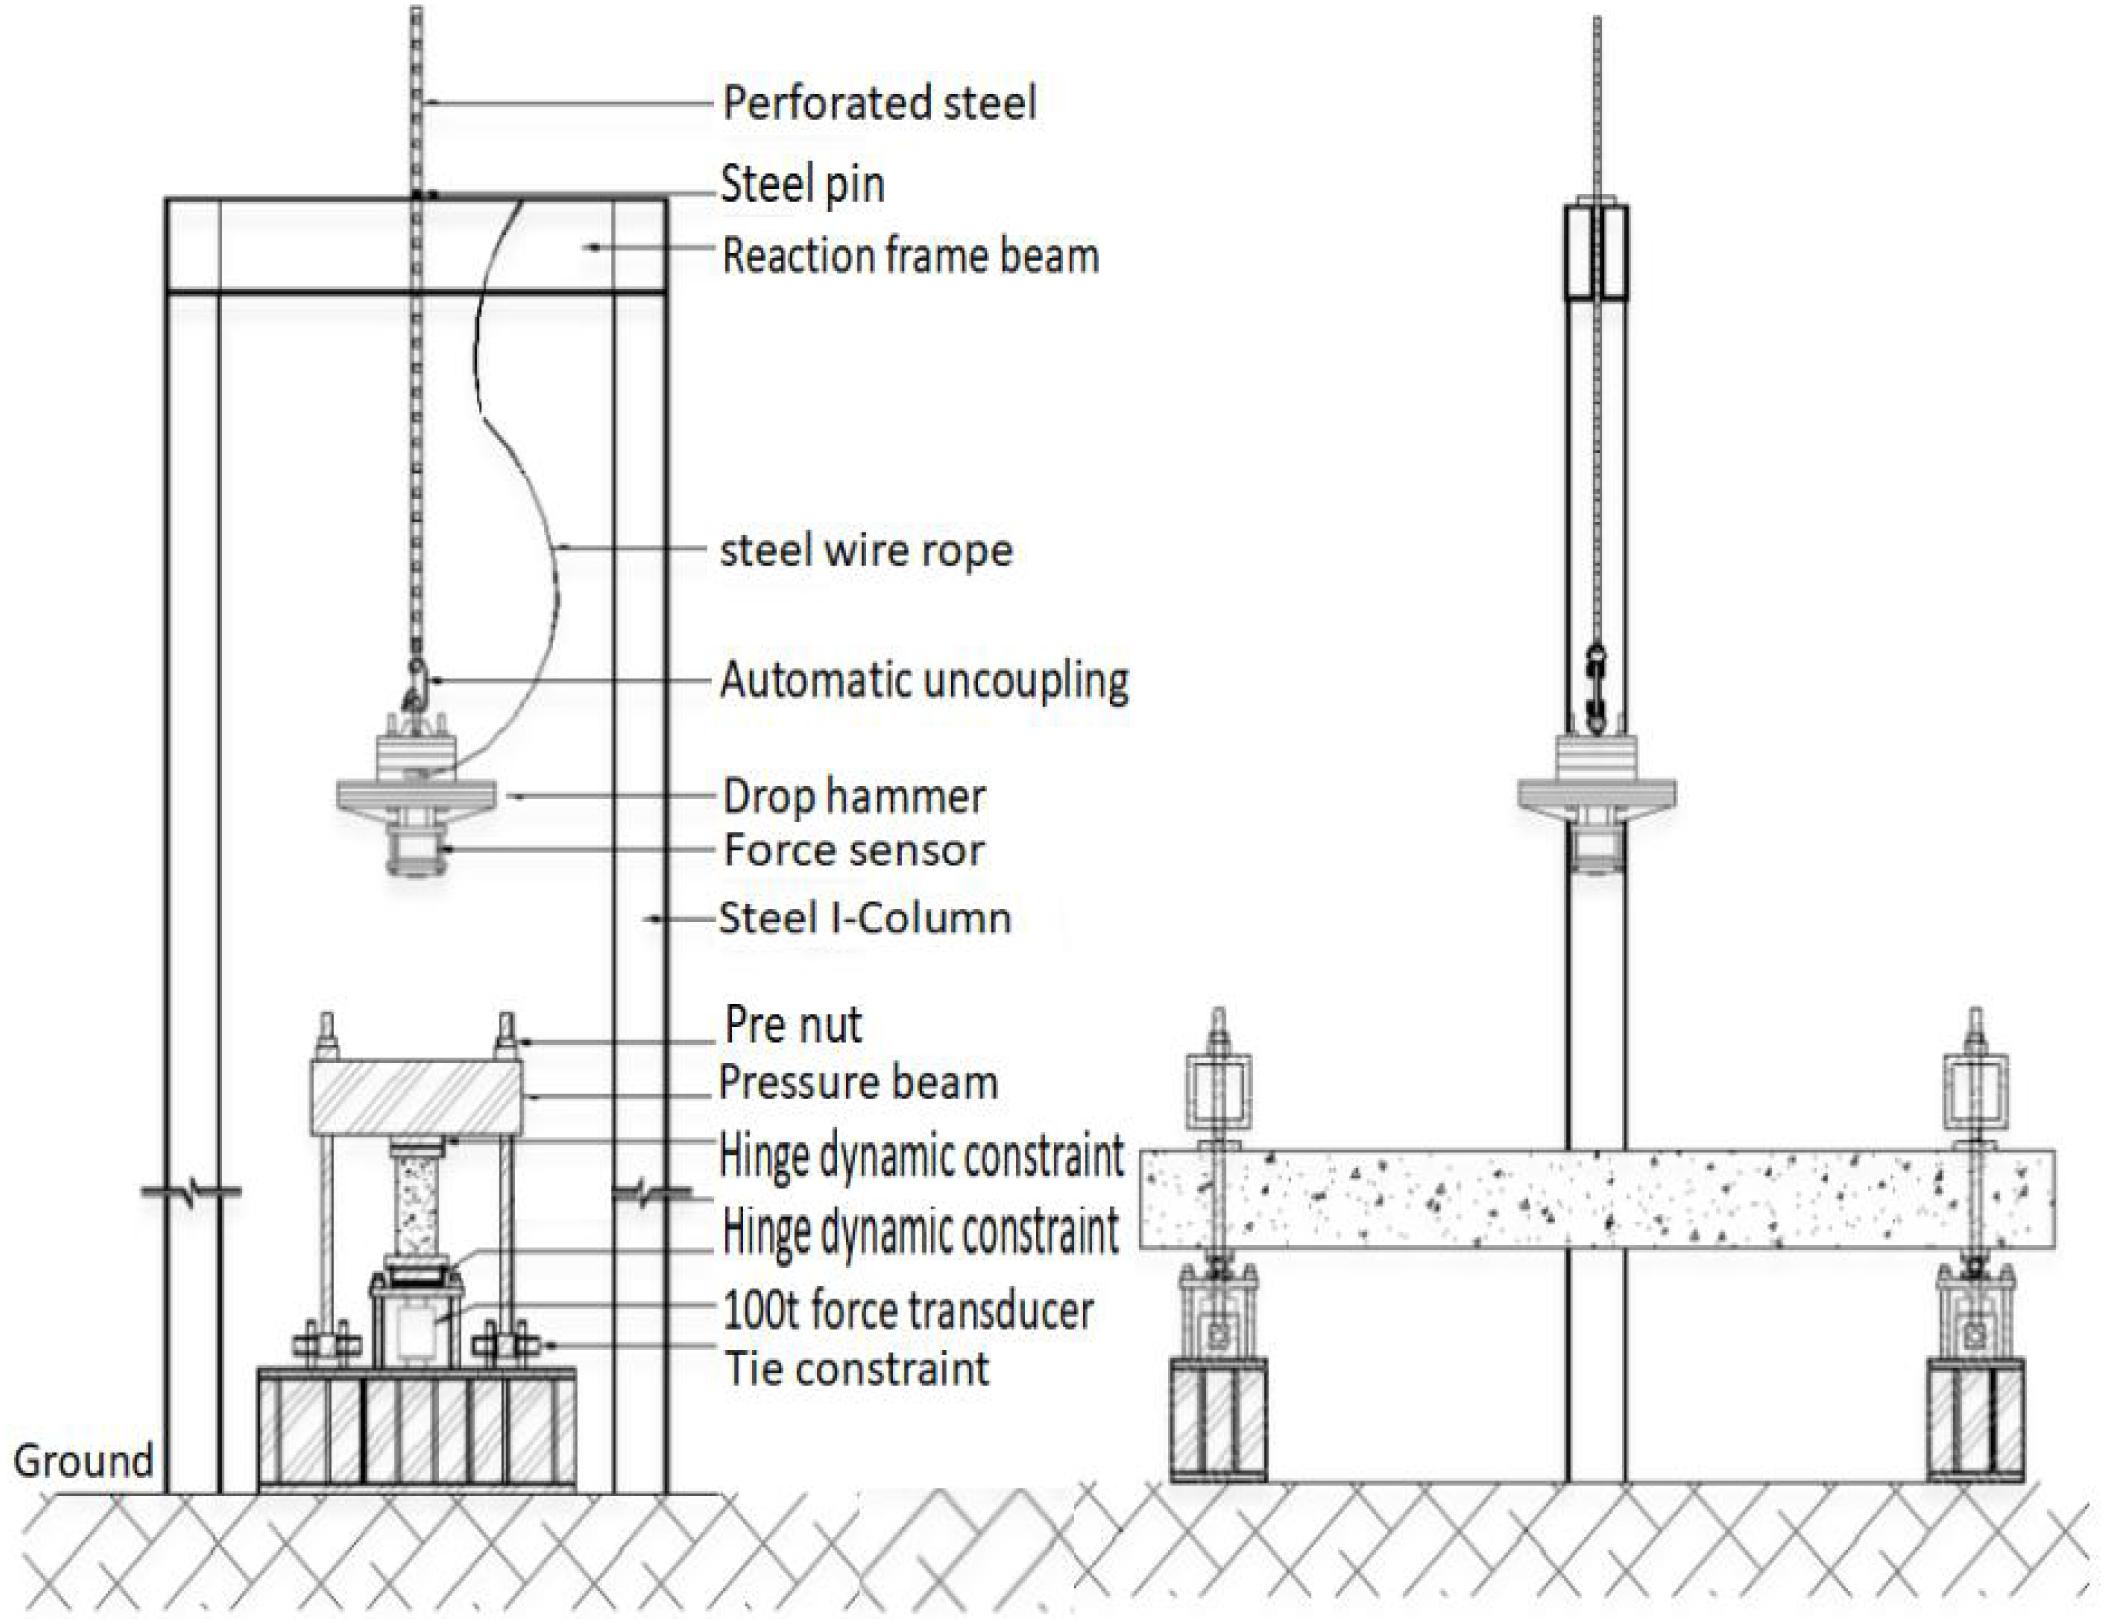
Figure 2. Impact test device.
Test Simulation
Introduction to the Model
In the modeling process, the beam restraint support and the drop weight device were simplified, and the initial velocity of the actual impact test was applied to the drop weight body. In order to avoid the penetration phenomenon and reduce the calculation time, set the drop weight model 5 mm above the impact point. Modeling under different impact conditions is achieved by adjusting the initial velocity and density of the falling weight. For RC structures subjected to strong dynamic loads such as explosion and impact, the impact process is almost completed in a few milliseconds due to the extremely short loading time. Therefore, it can be assumed that there is no bond slip between the reinforcement node and the concrete node, and the element common node method can be used to model the reinforcement and concrete. At the same time as the conventional treatment in the impact simulation literature (Liu, 2017), the interface contact method of CFRP and concrete glue adopts direct common node consolidation, and the load is transmitted between the CFRP unit and the concrete unit through a common node, and the deformation of the two is coordinated and consistent. Finally, in order to obtain a high-precision calculation result using a simplified model, the size of the member adopts a full-scale model and fine meshing. The following takes the impact working condition 2.0 m-355 kg modeling as an example, the details of the model are shown below:
(1) The model adopts 1/2 symmetry modeling and the mesh size is 10 mm.
(2) Simplify the falling weight into a cylinder with a initial speed (−6261 mm/s), the cylinder size r × h= 75 mm× 350 mm, density = 0.355/(300 ×π× 752) = 6.70 × 10⁻⁸ Mg/mm3;
(3) The support is simplified as a hinge constraint on the upper and lower surfaces 300 mm from the beam end;
(4) The beam body and the steel bar share common nodes during modeling, and there is no bond slip. The material strength is measured by the impact test;
(5) FRP and concrete are well bonded, common node modeling.
The model mainly uses three element types to simulate the drop weight, concrete, rubber pad and CFRP. The name of each element type and the corresponding material model are shown in Table 2.
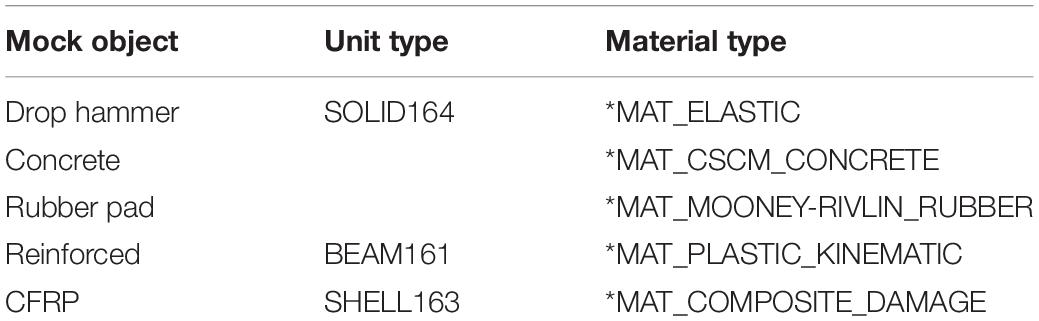
Table 2. Unit and material type selection.
In order to reduce the impact energy dissipation, reduce the shock of the instantaneous impact force, extend the duration of the impact to better analyze the failure process and the mechanism of stress, in the simulation, a rubber pad is set on the impact point of the beam, as shown in Figure 3. In the test, the same setting was also set at the impact point.
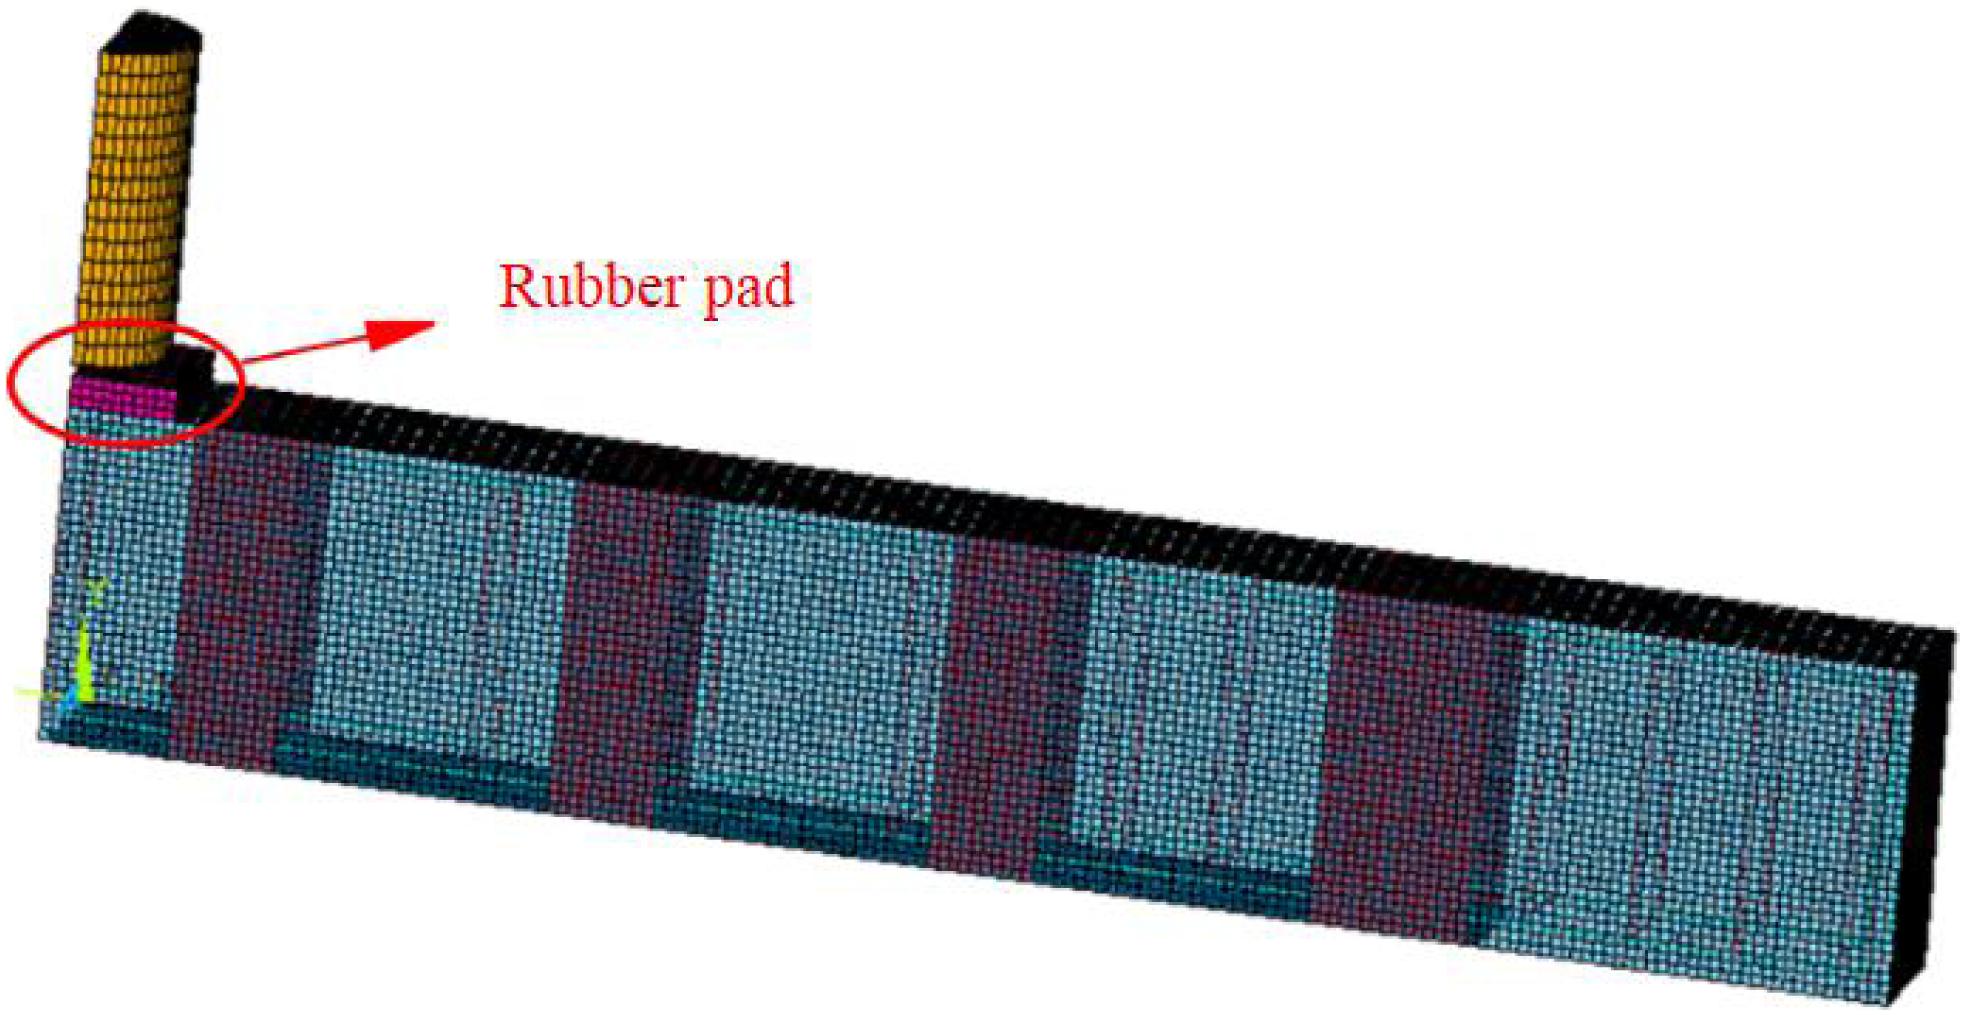
Figure 3. Impact test model.
Simulation Condition and Reinforcement Method
In order to further study the impact resistance of reinforced concrete beams after CFRP reinforcement, a total of 10 Simulation conditions were simulated in this paper, mainly considering the impact height, impact weight and reinforcement. The simulation conditions are shown in Table 3.
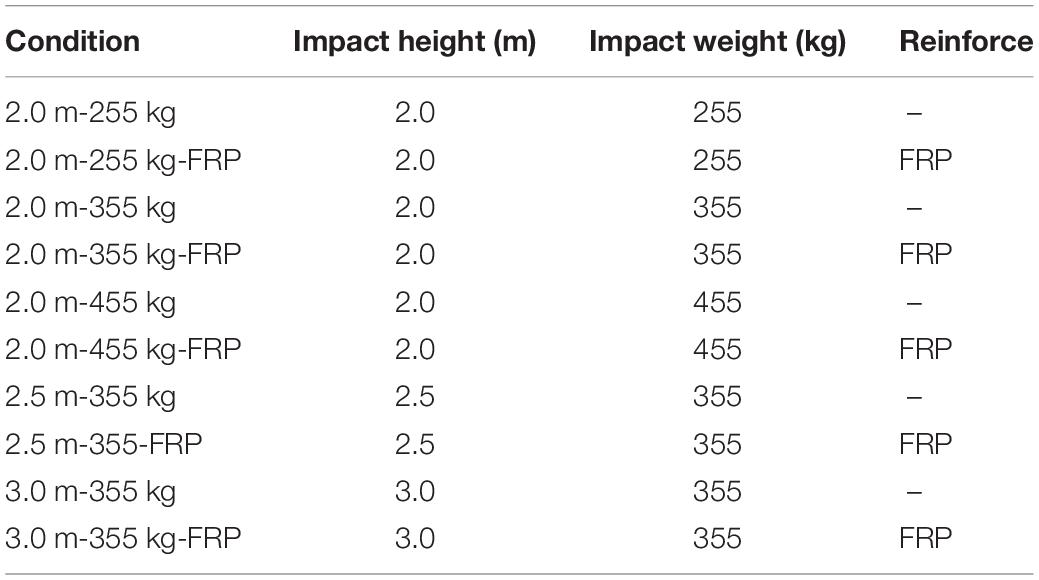
Table 3. Simulation conditions.
CFRP strip width and clear distance are selected with reference to «Design Specification for Concrete Structure Reinforcement (GB50367-2013) (Department of Housing and Urban-Rural Development Sichuan Province, 2014). Taking into account the improvement of the flexural bearing capacity after reinforcement, in order to continue to meet the design requirements of strong shear and weak bending, two additional U-shaped hoops are added on each side to strengthen the reinforced shear bearing capacity. During the simulation, the amount of CFRP bottom bending strips (130 × 2700 mm) of the test piece was 1 piece, the amount of end hoops (150 × 800 mm) was 2 pieces, and the amount of middle U-hoops (100 × 800 mm) was 6 pieces. At the same time, the CFRP settings are the same in all simulation conditions. The specific CFRP material parameters are shown in Table 4, and the CFRP reinforcement methods and dimensions are shown in Figure 4.

Table 4. CFRP material parameters.
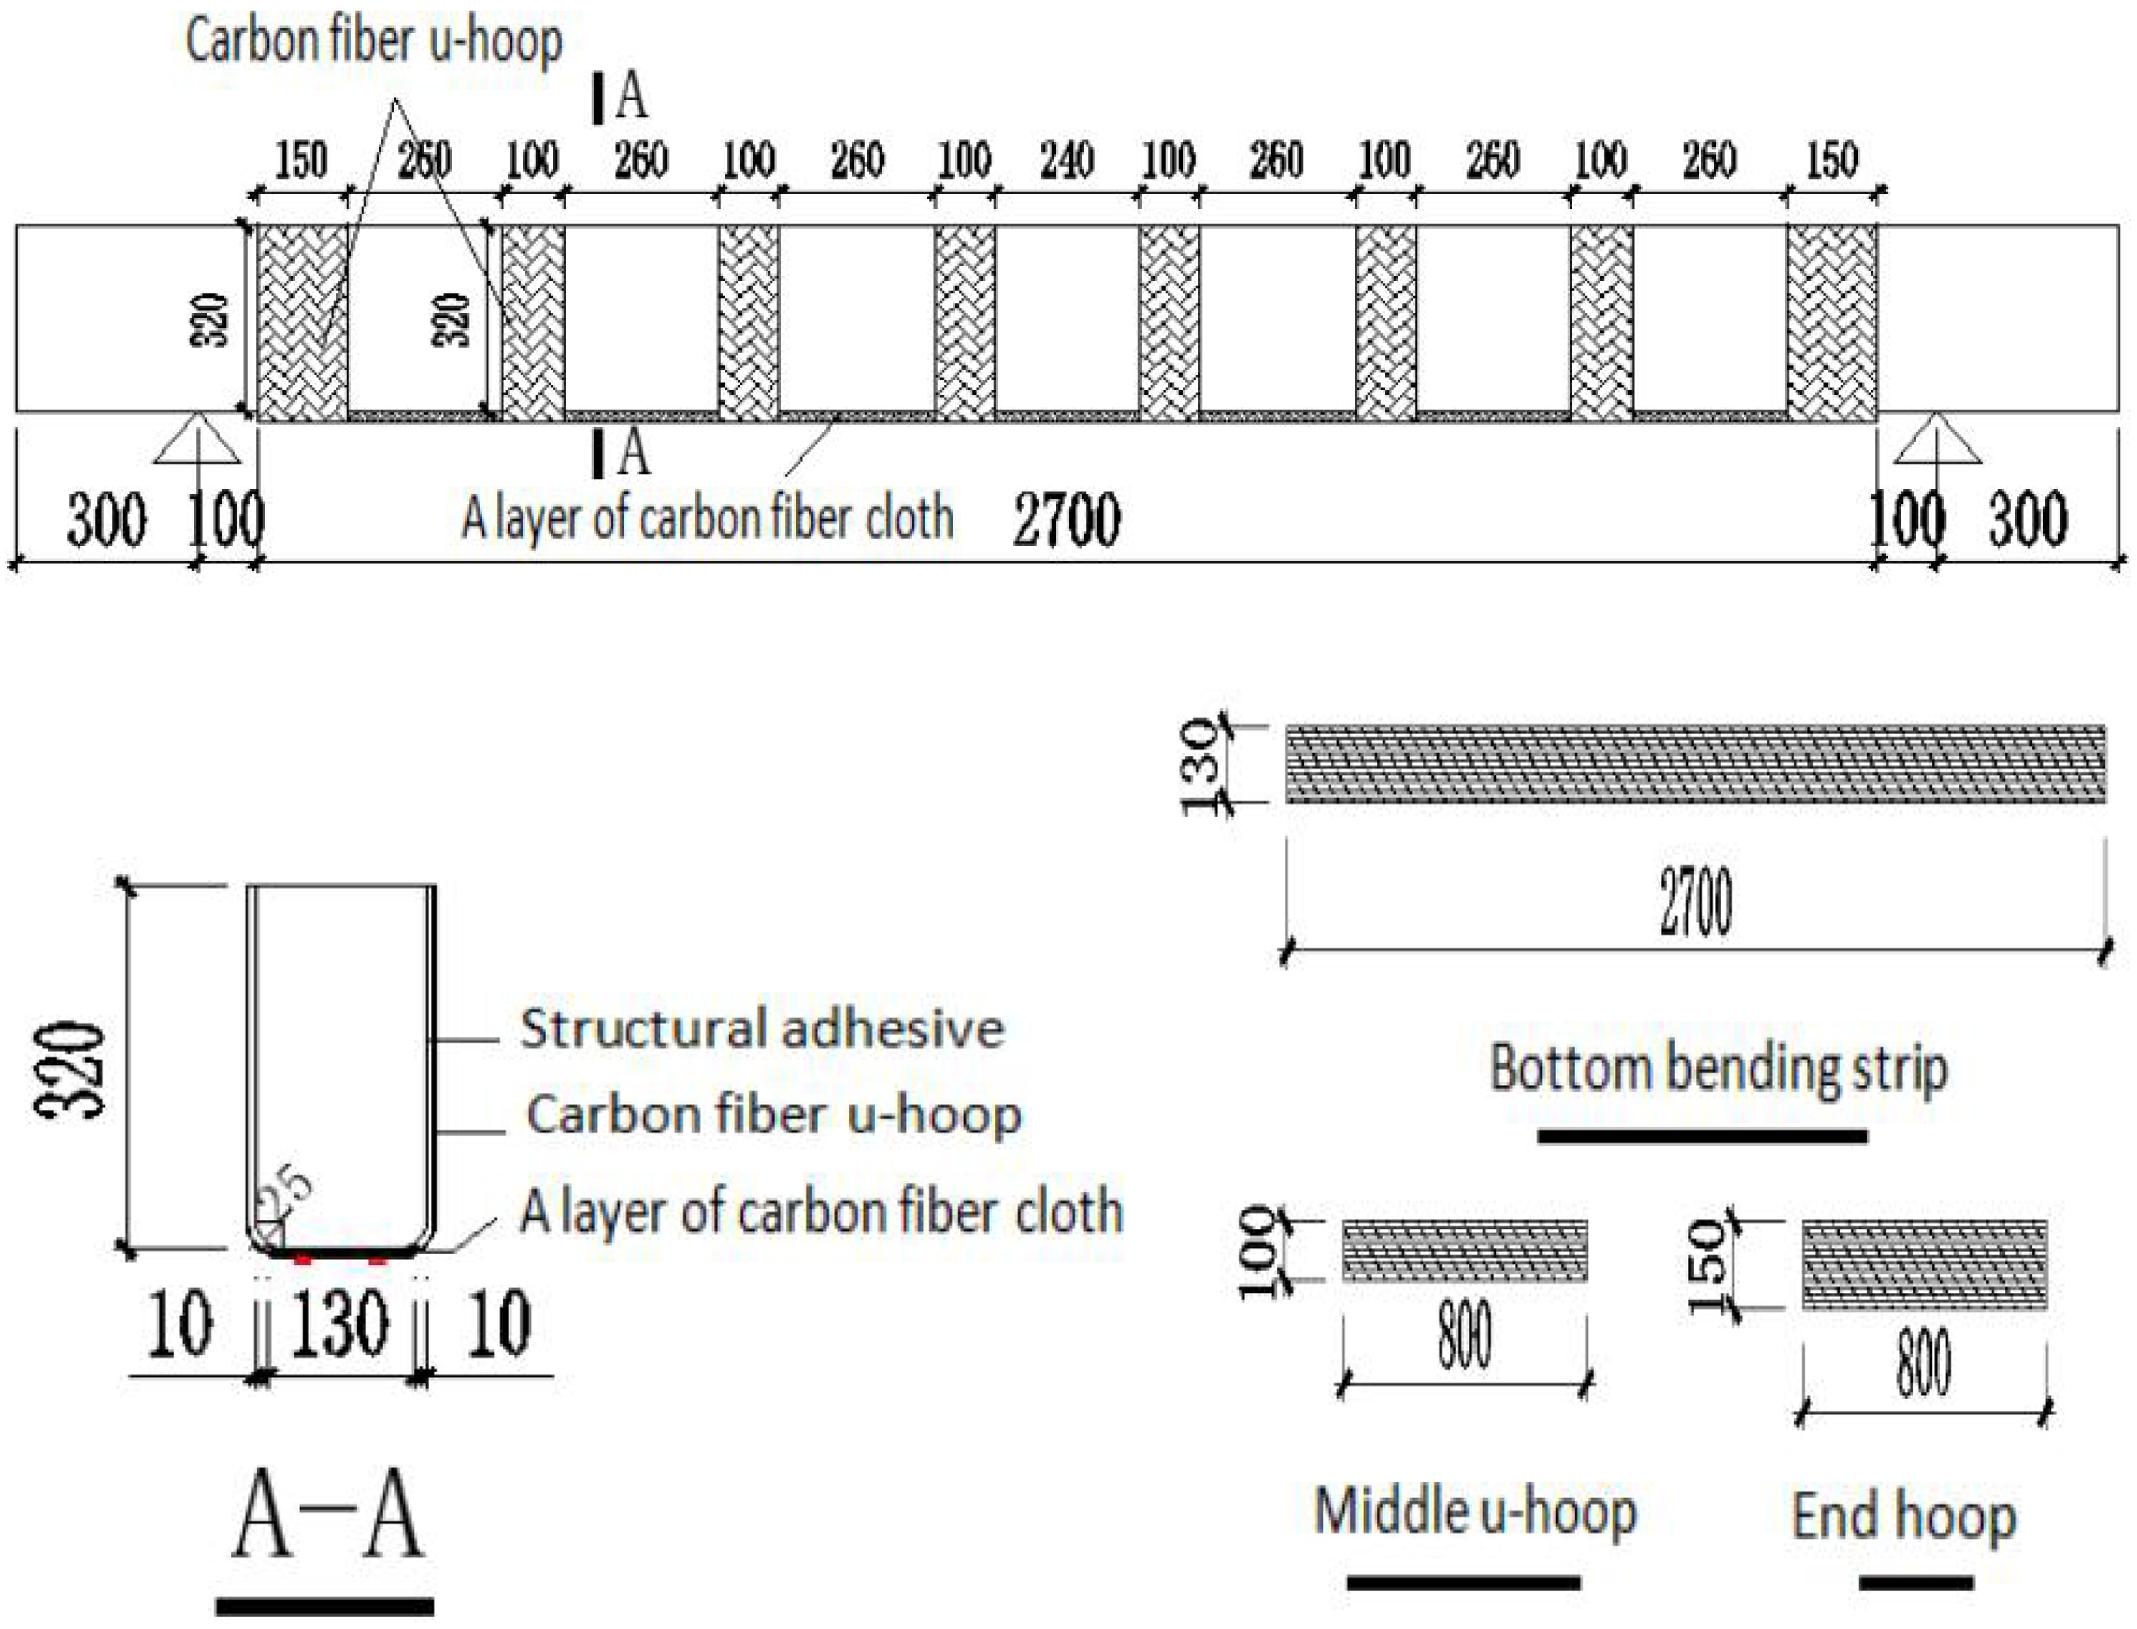
Figure 4. CFRP reinforcement method (units: mm).
Model Verification
After modeling and completing the corresponding parameters and analysis settings, the accuracy of the finite element model needs to be verified. The test results are compared with the simulation results, and the rationality of applying the finite element results to predict the actual impact is analyzed.
Figure 5 is a test and simulation comparison chart of cracks and failure modes of reinforced concrete beams under impact load. Figures 5A,B are the stress transmission of the model during the impact contact and crack development, and the actual crack distribution; Figure 5C is the comparison of the final crack morphology and damage area. It can be seen from the figure that, at the moment of impact, the stress of the model is concentrated at the impact point and develops to both sides along the impact, and a large plastic strain is generated along the stress propagation path, which corresponds to the rubber deformation in the equivalent plastic strain diagram. At the same time, the concrete in the compression zone was crushed and formed oblique cracks in the span.
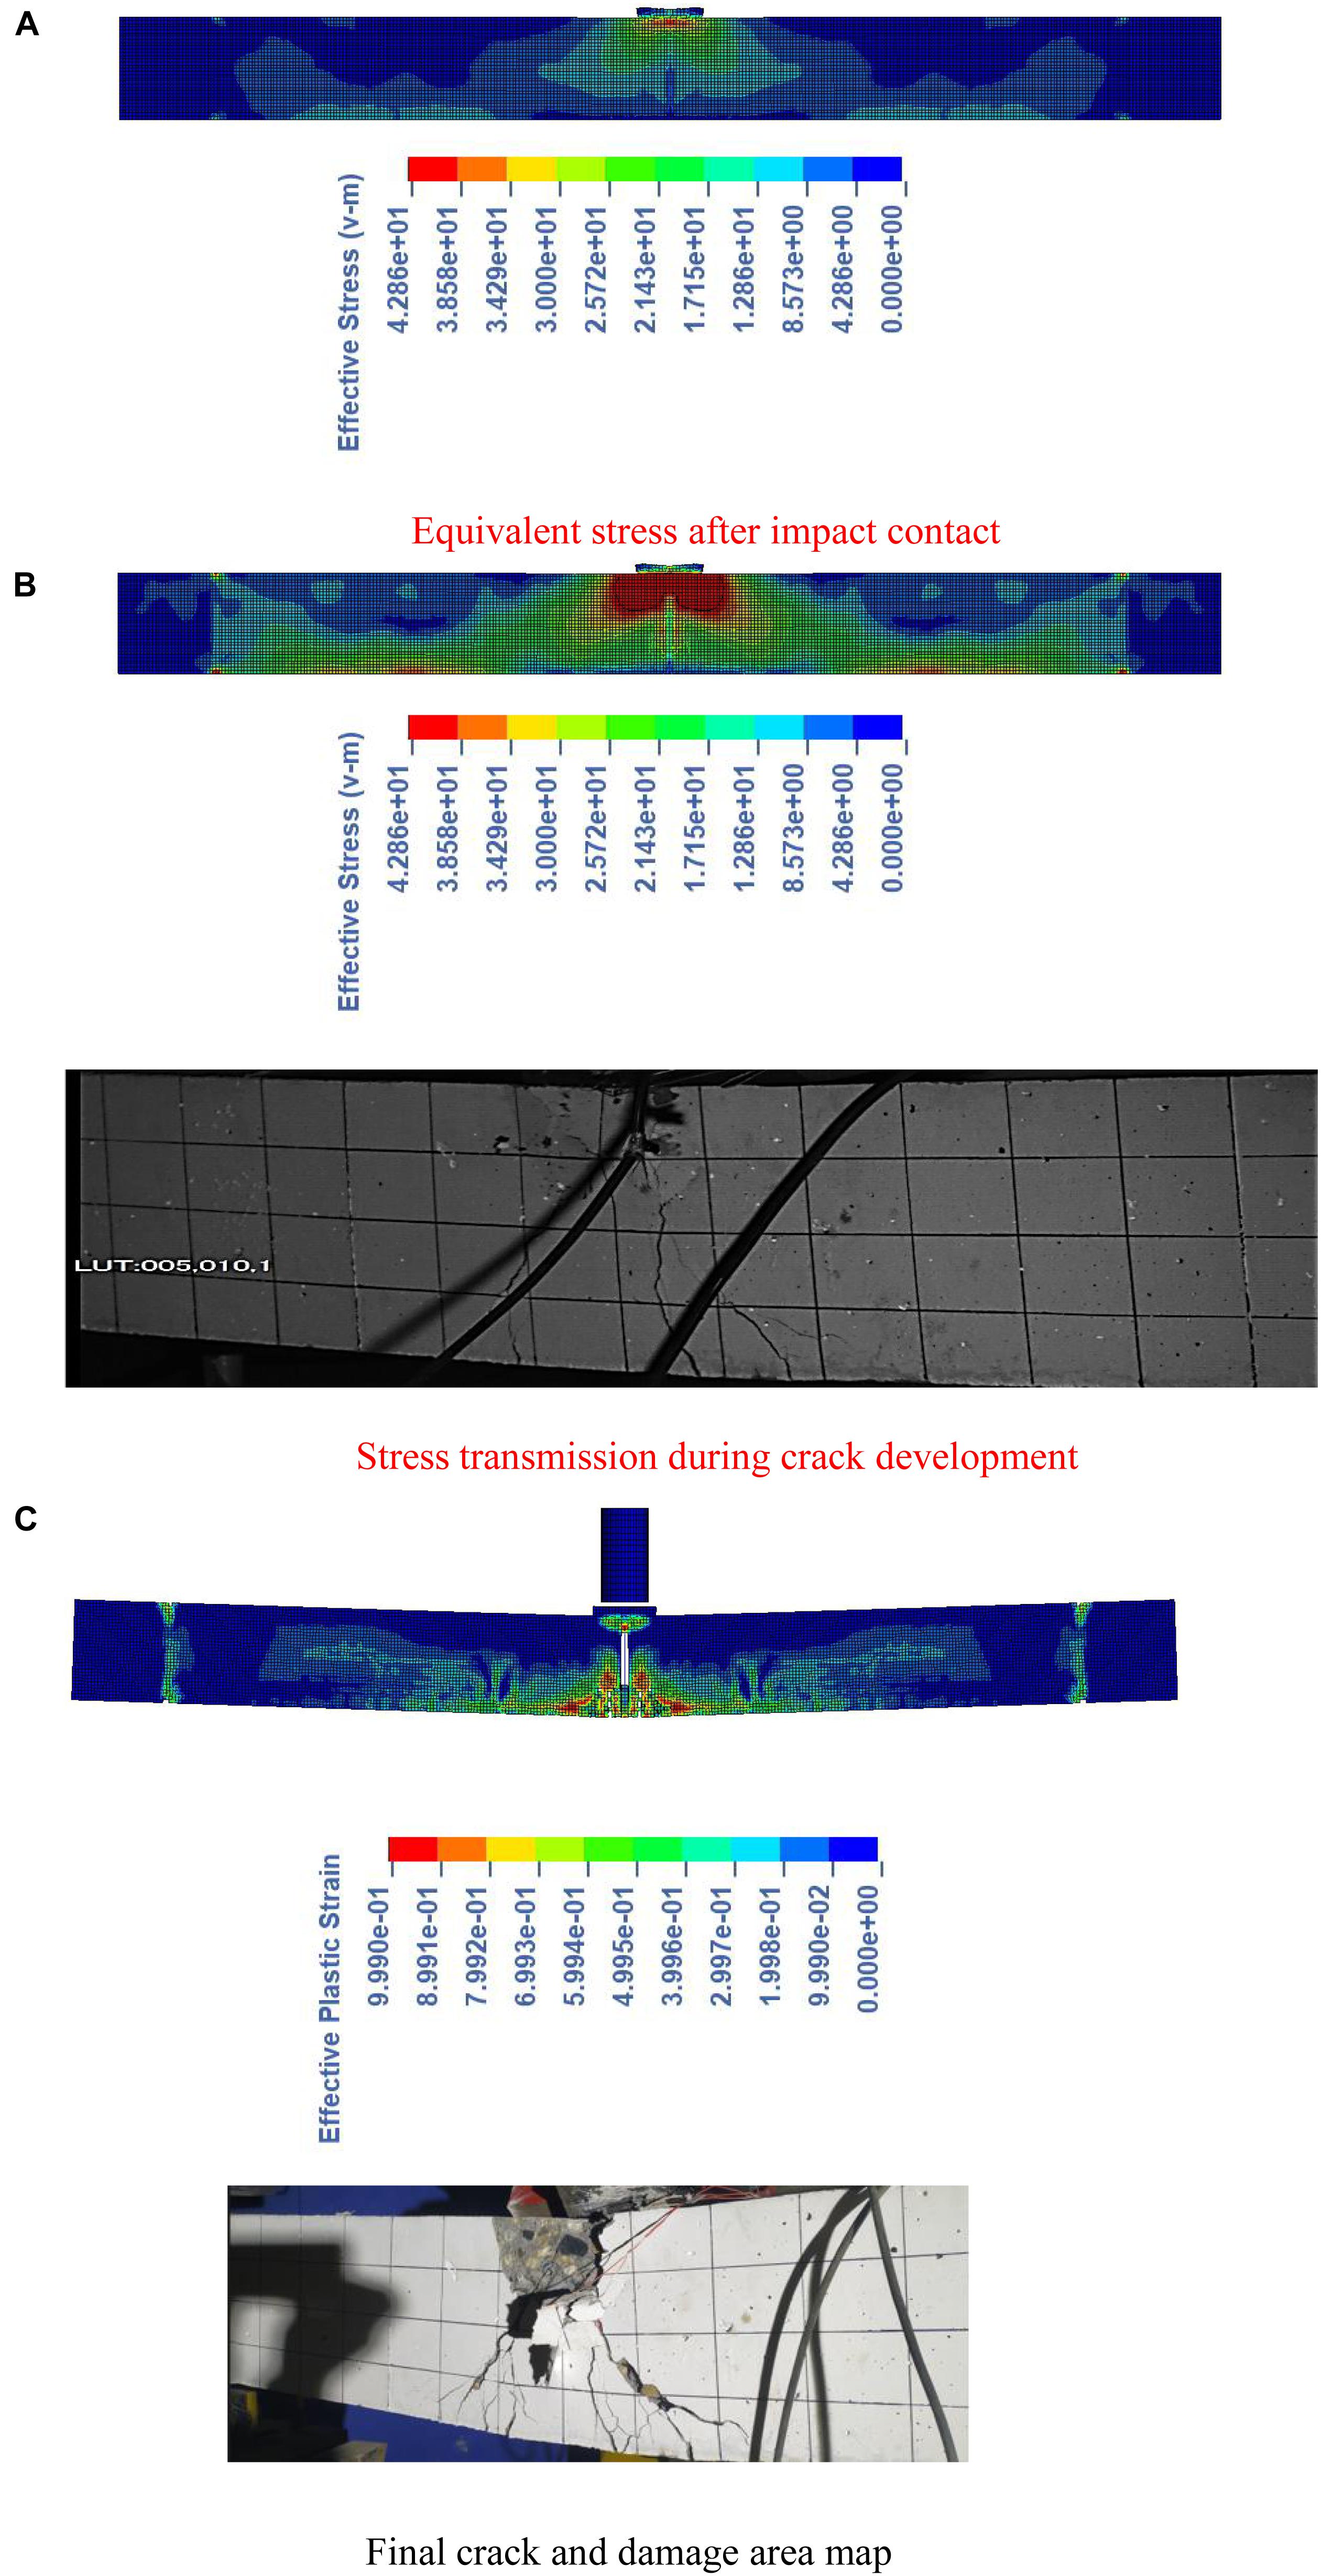
Figure 5. Comparison of cracks and damage patterns. (A) Equivalent stress after impact contact. (B) Stress transmission during crack development. (C) Final crack and damage area map.
Figure 6 is a comparison of the load time history curve. The figure shows that the peak value of the impact force of the numerical simulation curve is slightly higher than the test value (306 kN), which is 329 kN, and the error is about 7%. The duration of the first impact force is also shorter, but the overall gap is not large. Figure 7 is the load-displacement curve of the structure under the impact load. The figure shows that the cast-in-situ beam quickly reaches the peak of the impact force at a small displacement. Then, as the beam section cracks, the structural rigidity decreases and the impact force of the beam also follows reduce. Consistent with the law of the load time history curve, the peak value of the impact force of the numerical simulation load and displacement curve is slightly higher than the test value, but the change trend of the two and the impact energy difference are not large. The numerical simulation results are in good agreement with the experimental results, which can be used to analyze the impact force difference of the beam under different working conditions.
Figure 6. Load time history curve.
Figure 7. Load-displacement curve.
It can be seen from the above analysis that although the two have a small deviation in the data, the model can reflect the dynamic response law of the beam under impact load, and also has a better prediction of the crack shape and failure mode of the structure.
Dynamic Performance of Reinforced Beams Under Different Impact Conditions
Different Impact Heights
Impact Instantaneous Stress Distribution
Most of the main cracks of the specimen have been formed at the initial stage of the impact process. Analysis of the stress distribution of each test piece during impact contact, especially the concentration of high stress, is helpful to study the formation process, distribution shape and possible damage area of the main cracks. Figures 8, 9 are equivalent Stress field of beams under different impact heights of each test piece.
Figure 8. Equivalent Stress field of ordinary beam under different impact heights.

Figure 9. Equivalent Stress field of reinforced beams under different impact heights.
It can be seen in Figure 8 that with the increase of impact height, the stress change of ordinary beams is mainly manifested in two aspects. On the one hand, the stress distribution of all specimens is measured by the stress level under the impact height of 2 m (2.0 m-355 kg). Obviously, as the impact height increases, the stress level increases significantly, and the area of the high stress area increases. On the other hand, when the stress peaks of different specimens were used to measure their respective stress distributions, it was found that the higher the impact height, the smaller the area of the mid-span total stress zone (Compare the stress field of the 2.0 m-355 kg and 3.0 m-355 kg specimens in Figure 8), the instantaneous stress of the beam is more concentrated. At the same time, the stress zone at the bottom of the 1/4 span of the beam shrinks on both sides, the test piece 3.0 m-355 kg stress zone extends to both sides less than the test piece 2.0 m-355 kg. From the distribution of the two stress zones and the stress level, when the impact height is low, the stress diffuses from the mid-span to both ends within a certain impact time and gradually transforms into the overall response of the specimen. As the impact height increases, the ability of the specimen to transmit stress to both ends decreases.
The reinforced specimens showed different changes. In order to highlight the stress of reinforced concrete, the stress distribution of FRP is hidden in Figure 9. In fact, the stress level of FRP is higher than that of concrete. By observing the stress transfer process of the ordinary test piece and the reinforced test piece during the impact process, it is found that part of the high stress transmission at the impact point of the reinforced beam is similar to that of the ordinary beam, and diffuses along the internal concrete stress transmission path. In the other part, due to the existence of u-type FRP on both sides of the mid-span, excessive mid-span stress is restrained to both sides, and part of the stress is concentrated downward. Therefore, the stress level at the impact point of the reinforced beam in the figure decreases, and the area of the high-stress zone also decreases; at the same time, due to the presence of tensile FRP at the bottom, the concentration of stress in the bottom of the 1/4 span is also reduced. When the impact height increases, the instantaneous impact stress increases correspondingly, and the proportion of the single layer FRP transmission and the bear stress decreases. In addition, comparing the reinforced beam with the impact height of 2 and 3 m, respectively, to the ordinary beam, the concrete stress of the latter at the bottom of the diagonal beam increases, and the stress area at the bottom of the reinforced beam is significantly reduced compared to the ordinary beam. This shows that with the increase of the impact height, the beam body has a tendency to develop diagonal cracks, and the bottom of the reinforced beam FRP can reduce the stress in the concrete.
Comparison of Cracks and Damage Patterns
Corresponding to the stress distribution, Figures 10, 11 are the instantaneous crack distribution of each specimen and the damage situation of the impact point.
Figure 10. Ordinary beam failure morphology at different impact heights.
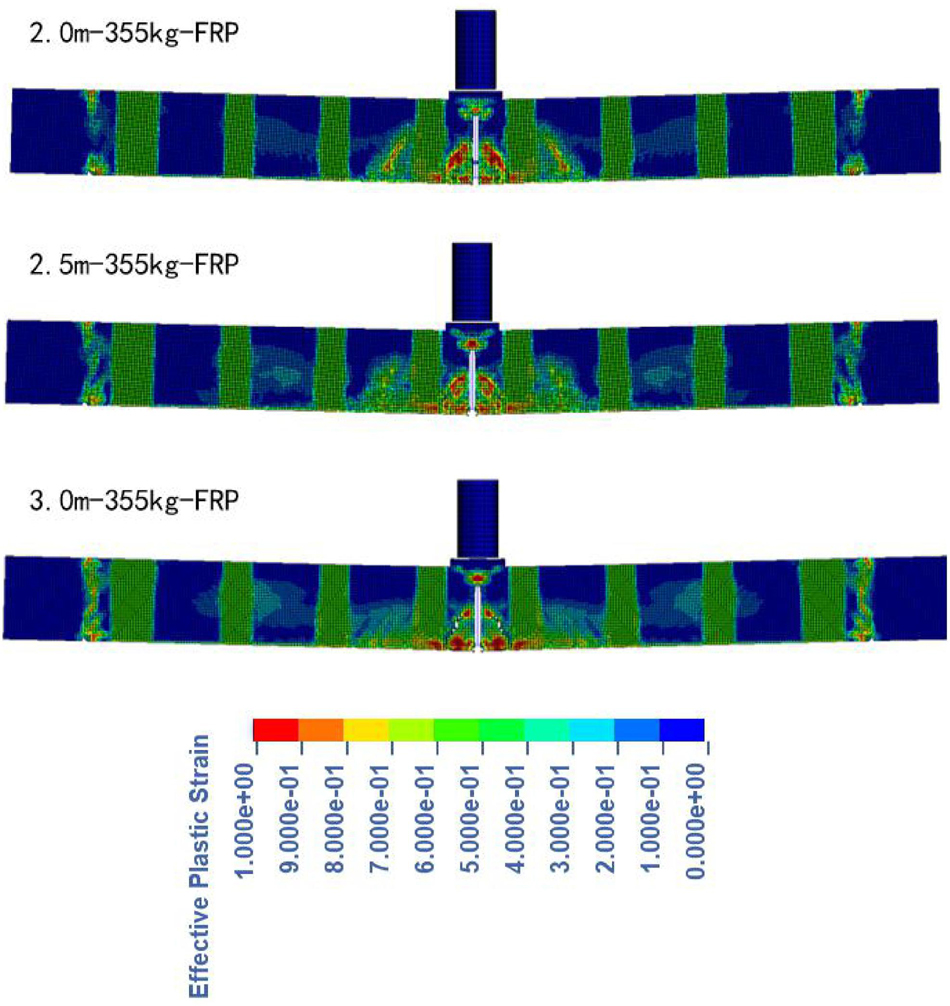
Figure 11. Reinforced beam failure morphology at different impact heights.
Under the impact height of 2 m (2.0 m-355 kg), ordinary beams developed two main cracks and several small associated cracks in the middle of the beam body. The concrete at the impact point was crushed and fell off. Compared with the impact point, the damage area at the bottom of the mid-span is wider (Including crack development zone). When an impact height of 2.5 m is applied (2.5 m-355 kg), the destruction area of the impact point extends downward, and the crack formation area expands. At this time, the number of mid-span cracks is more, and the original vertical upward small cracks on both sides gradually change into inclined. When the impact height is increased to 3 m (3.0 m-355 kg), the damage of the mid-span impact point is further increased, the inclination angle of the two outermost cracks of the mid-span crack is further reduced, the number of cracks is more and the distribution is complicated.
Under the impact height of 2 m (2.0 m-355 kg-FRP), the extension of the main crack in the span of the original member is restricted, which is shown by the distortion of the FRP in the figure. After reinforcement, the crack develops to stagnation when it contacts the FRP. Similar to ordinary beams, as the impact height increases, the damage of the reinforced beams still tends to concentrate toward the mid-span. However, the cracks developed on both sides of the ordinary beam span are blocked by the fiber cloth in the reinforced beam, so a new crack is formed between the two U-shaped strips. And the higher the impact height, the number of secondary cracks on both sides decreases, and the distribution of cracks becomes more concentrated. It is worth noting that the red part of the FRP band in the figure is mostly the deformation of the CFRP there. When the cracks of concrete reach the edge of CFRP, the stress level decreases and the growth rate slows down. Figure 12 is a crack diagram of 3 m-355 kg-frp specimen when displaying and hiding FRP deformation.
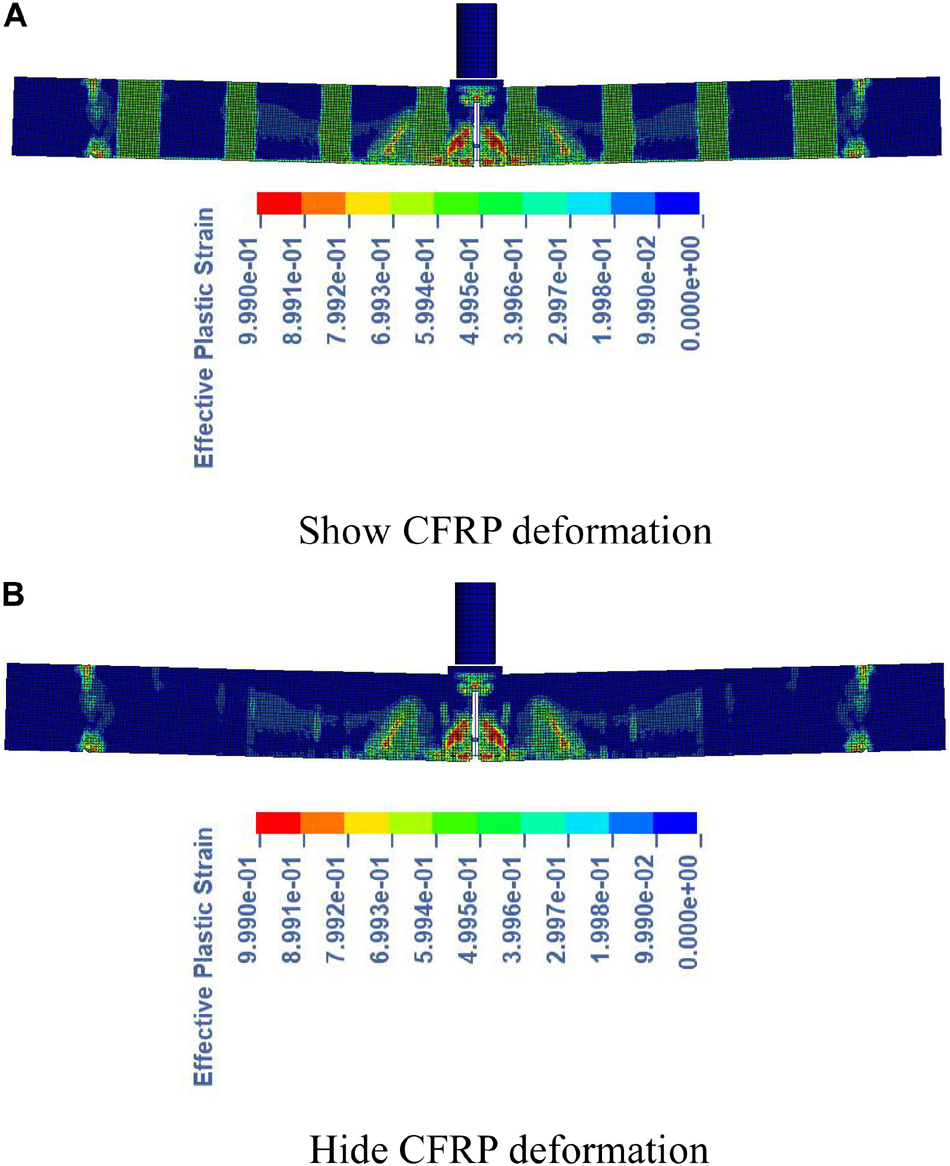
Figure 12. Crack and failure pattern of 3 m-355 kg-FRP specimen. (A) Show CFRP deformation. (B) Hide CFRP deformation.
In summary, strengthening the beam can reduce the stress concentration of the concrete at the bottom of the beam and inhibit the development of mid-span cracks that are too large and wide. As the impact height increases, the failure area shrinks, the beam body changes from the overall response to a more intense local failure, and the role of CFRP in resisting the impact load is weakened. And because the damage is concentrated in the mid-span, except for the U-shaped strips and the bottom strips on both sides of the impact point, the remaining U-shaped strips are more difficult to fully exert their resistance at higher impact speeds.
Comparison of Impact Force and Deflection
The time-history curves of impact force and displacement of each test piece at different heights are shown in Figures 13, 14. Table 5 shows the peak impact energy and impact force of each test piece.
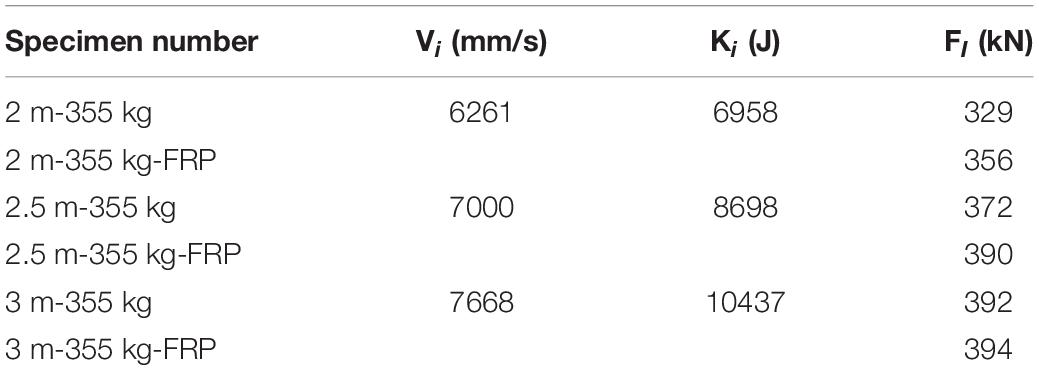
Table 5. Impact energy and impact force at different heights.
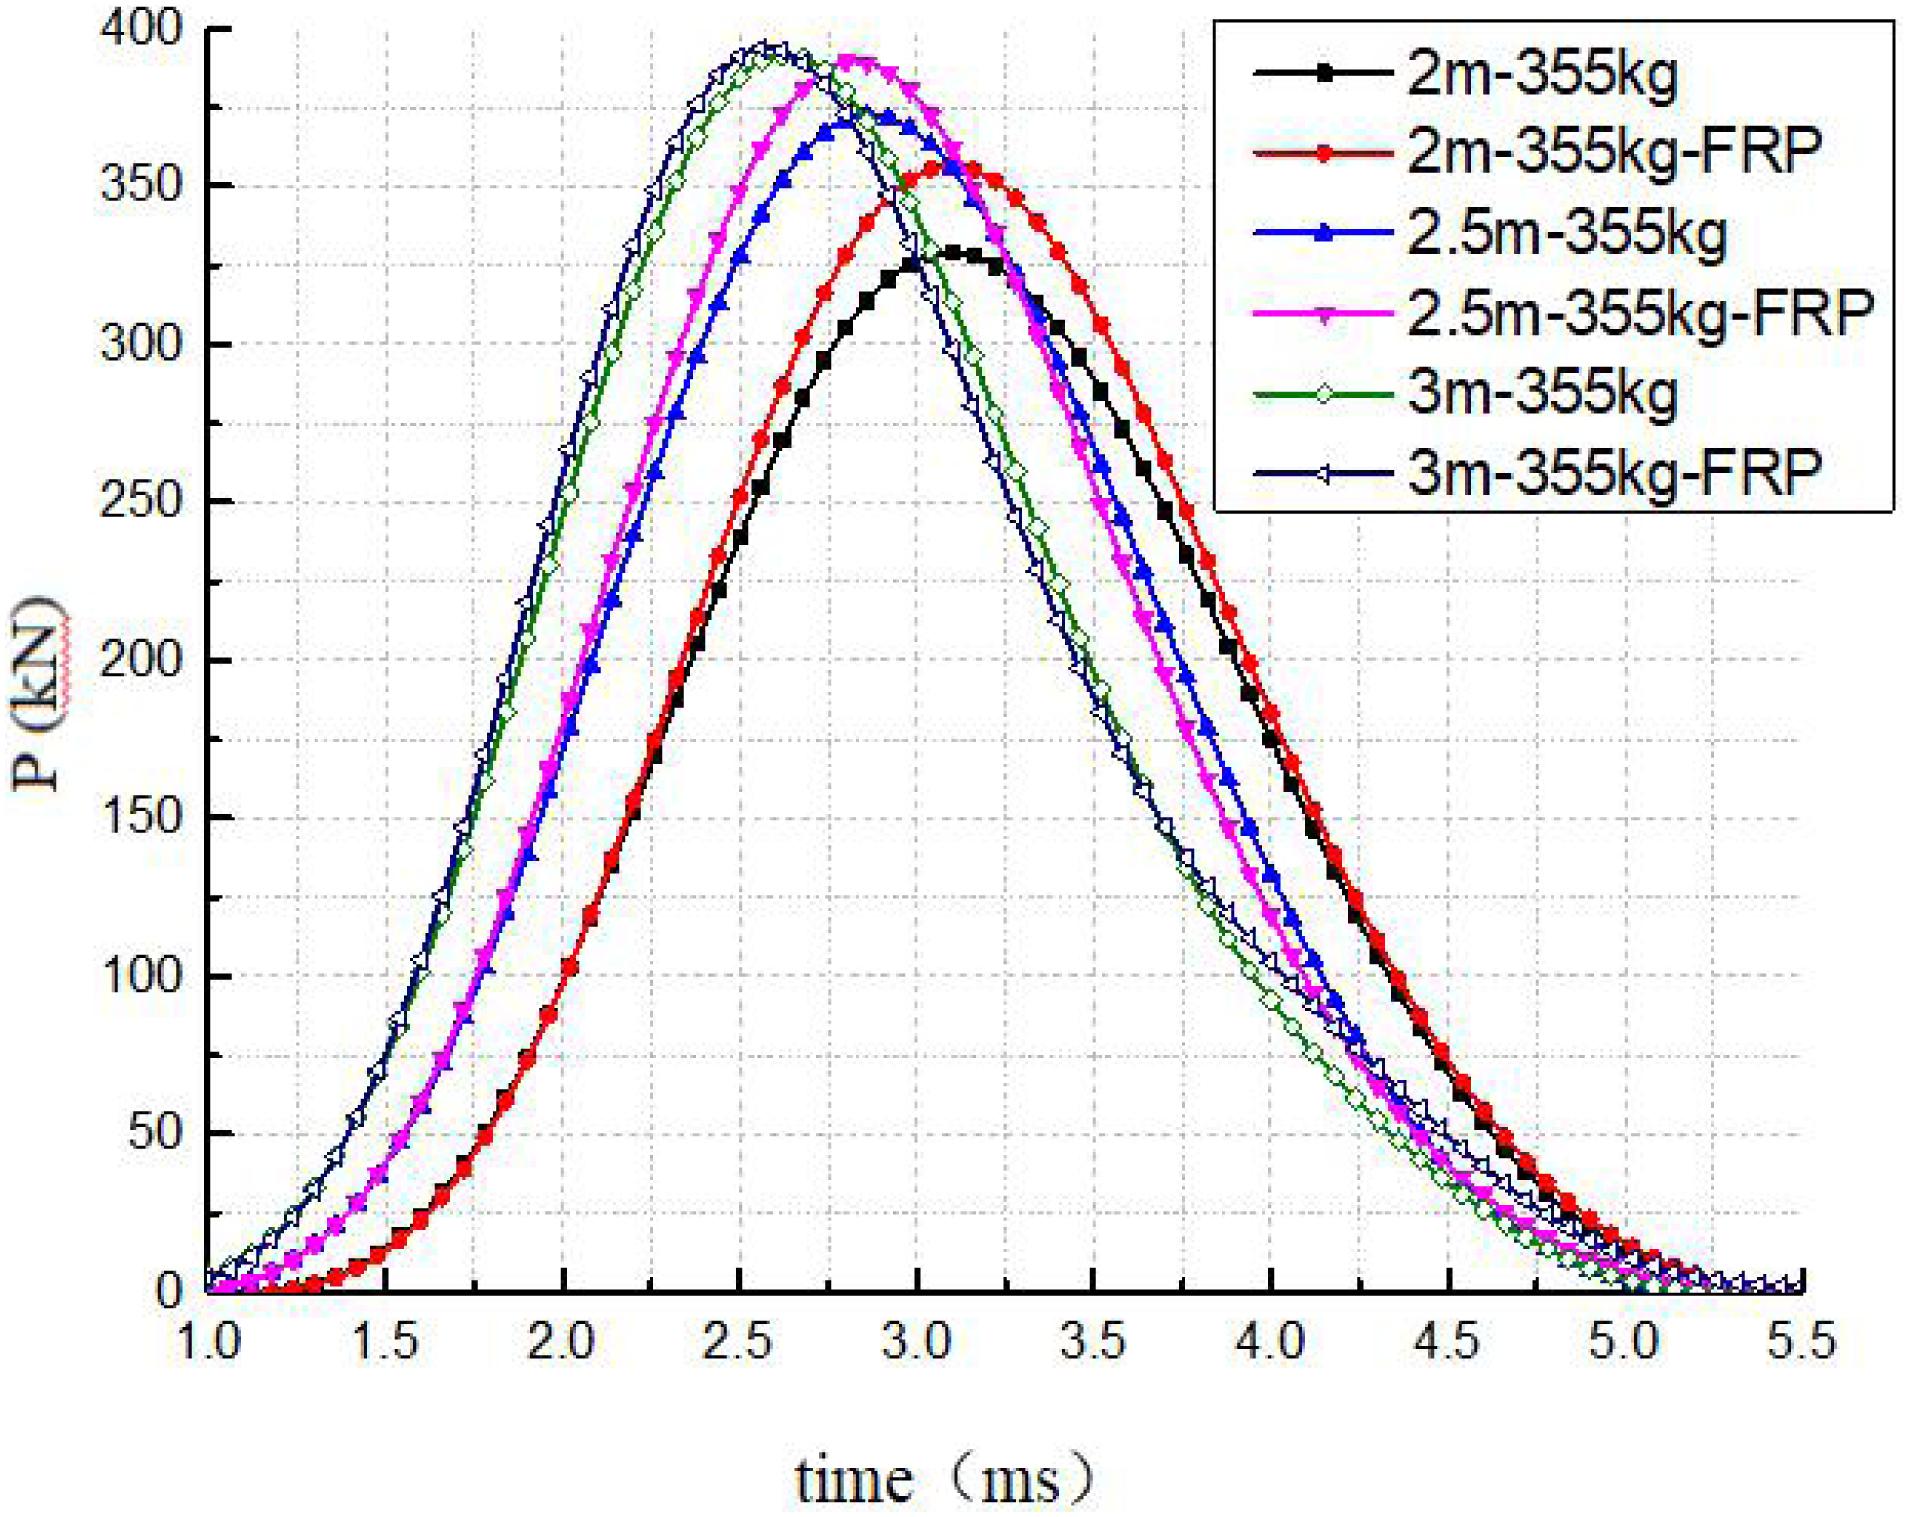
Figure 13. Impact force time history curves at different heights.
Figure 14. Displacement time history curves at different heights.
It can be seen from the figure that the higher the initial impact velocity, the earlier the initial impact force starts. This is because there is a certain distance between the drop weight and the rubber pad during the initial setting, and the time of contact with the rubber is related to its initial velocity.
With the increase of the impact height, the impact force of the ordinary beam increases, and the increasing range is not proportional to the increasing range of the impact height. With the increase of impact height, the increasing range of impact force decreases gradually. The impact force of the reinforced beams shows the same rule, and the impact force is higher than that of the ordinary beam. This may be due to the fact that the impact force has been attenuated after the impact instantaneous drop hammer buffered by the rubber on the upper part of the beam body. The impact force at this time is released through the larger contact area between the lower part of the rubber and the beam body, and then it is resisted by the beam body and CFRP together. In addition, due to the presence of CFRP in the reinforced beam, the deformation of the beam body is constrained (Figure 14), which increases the overall rigidity of the member and further increases its resistance to a certain extent. However, with the increase of impact velocity, the buffer capacity of rubber and the resistance capacity of CFRP are limited, so the gap between the reinforced beams and the ordinary beam is reduced.
CFRP has a more significant effect on the deformation of beams. Figure 14 shows the displacement changes in the first impact contact of each specimen (The displacement measured in the picture is the vertical displacement of the bottom of the mid-span of the beam). It can be seen that under different impact heights, the overall deflection and deformation of the reinforced beam is smaller than that of the ordinary beam, and the slope of the curve is more gentle. This is mainly because, on the one hand, the side sticking restricts the development of cracks and constrains the deformation of the beam; on the other hand, the bottom CFRP enhances the strength of the tensile zone and acts as an additional reinforcement, reducing the downward deflection growth of the beam under the bending action. Different from the impact force, the reduction of deflection is a more dramatic change. Compared with the deflection of the ordinary beam, the reduction cannot be ignored. At the same time, the deflection of the reinforced beam at the impact height of three meters (3 m-355 kg-FRP) is not smaller than that of two meters specimen (2 m-355 kg-FRP), but increased to some extent. These analyses show that CFRP still plays a more important role in limiting displacement and deformation.
Figure 15 shows the load-displacement curve of the structure under different impact heights. As can be seen in the figure, with the increase of the impact height, the peak impact force and impact energy gradually increase. Compared with ordinary beams, the reinforced beam under the same conditions has a higher peak impact force, but the gap between the two decreases with the increase of the impact height. Comparing the working conditions of 3 m-355 kg and 3 m-355 kg-FRP, the peak impact force and impact energy of the two are basically the same. The main reason is that the higher the impact height is, the more instantaneous response the structure is, and the more serious the local damage is to the beam body. Therefore, the beam body only has less CFRP to participate in the force, and the strengthening effect of CFRP on RC beam is weakened, so there is not much difference between the peak impact force of strengthened beam and ordinary beam.
Figure 15. Load-displacement curve.
Different Weight of Drop Weight
Comparison of Stress Distribution and Failure Mode
Figure 16 shows the stress field of the same ordinary beam and reinforced beam under different impact weight, and the impact weight increases from 255 to 455 kg.

Figure 16. Equivalent Stress field under different weights.
With the increase of the impact weight of ordinary beam and reinforced beam, there is a tendency for stress concentration and peak value increasing at the impact point in the middle of the span. Different from increasing the impact height, under the stress scale with the impact weight of 455 kg, when the impact weight is increased or decreased, the influence on the mid span stress is weaker than that of the impact height. When the impact weight in the figure is reduced from 455 to 255 kg, there is still a relatively obvious high stress area. Under higher impact weight, the area of stress area near the impact point increases, and part of the stress is transferred along the U-shaped FRP, certain rectangular area appears on both sides of the stress area of the middle span of the strengthened specimen with an impact weight of 455 kg (2.0 m-455 kg-FRP). Compared with the change of impact height, the U-shaped FRP on both sides has more obvious influence on the stress transfer in the change of impact weight.
In addition, the change of the weight of the drop hammer also has a certain impact on the crack and failure pattern in the beam span. According to Figure 17, in the simulation of ordinary beams, this change is mainly manifested in the form of main cracks in the midspan: With the increase of hammer weight, the crack shape of the specimen under the impact point gradually changes from a single wider crack to a dense area of multiple fine cracks, which is similar to the effect of increasing the height of drop hammer. For the reinforced beam, under the hammer weight of 255 kg (2.0 m-255 kg-FRP), the crack between two U-shaped strips is the main crack. With the increase of hammer weight, the development of cracks on both sides is accelerated. When the hammer weight is increased to 455 kg (2.0 m-455 kg-FRP), two obvious cracks have been formed outside the U-shaped strip in the middle of the span. At this time, FRP in the strengthened beam still plays a role in limiting the development of cracks.
Figure 17. Failure morphology under different weights.
Comparison of Impact Force and Deflection
The time history curve of impact force and displacement of each specimen under different weight is shown in Figures 18, 19. The peak value and duration of impact force of each specimen are given in Table 6. It can be seen from the chart that the drop weight and impact force of the reinforced beam and the ordinary beam show similar rules, that is, when the drop weight is increased, the impact force is also increased. The duration of impact force of the reinforced beam is generally lower than that of the corresponding ordinary intact beam, which may be due to the bottom and side sticking of FRP forming a certain amount of wrapping on the beam body, slightly enhancing its stiffness, but generally speaking, the impact is not significant. The impact force changes little with the weight of the hammer. For the ordinary beam, the impact force increases only 47 KN when the weight is nearly doubled (0.8). Similar to the change of impact height, FRP has a certain contribution to the resistance of reinforced beams under different hammer weight.
Table 6. Peak and duration of impact force at different weights.
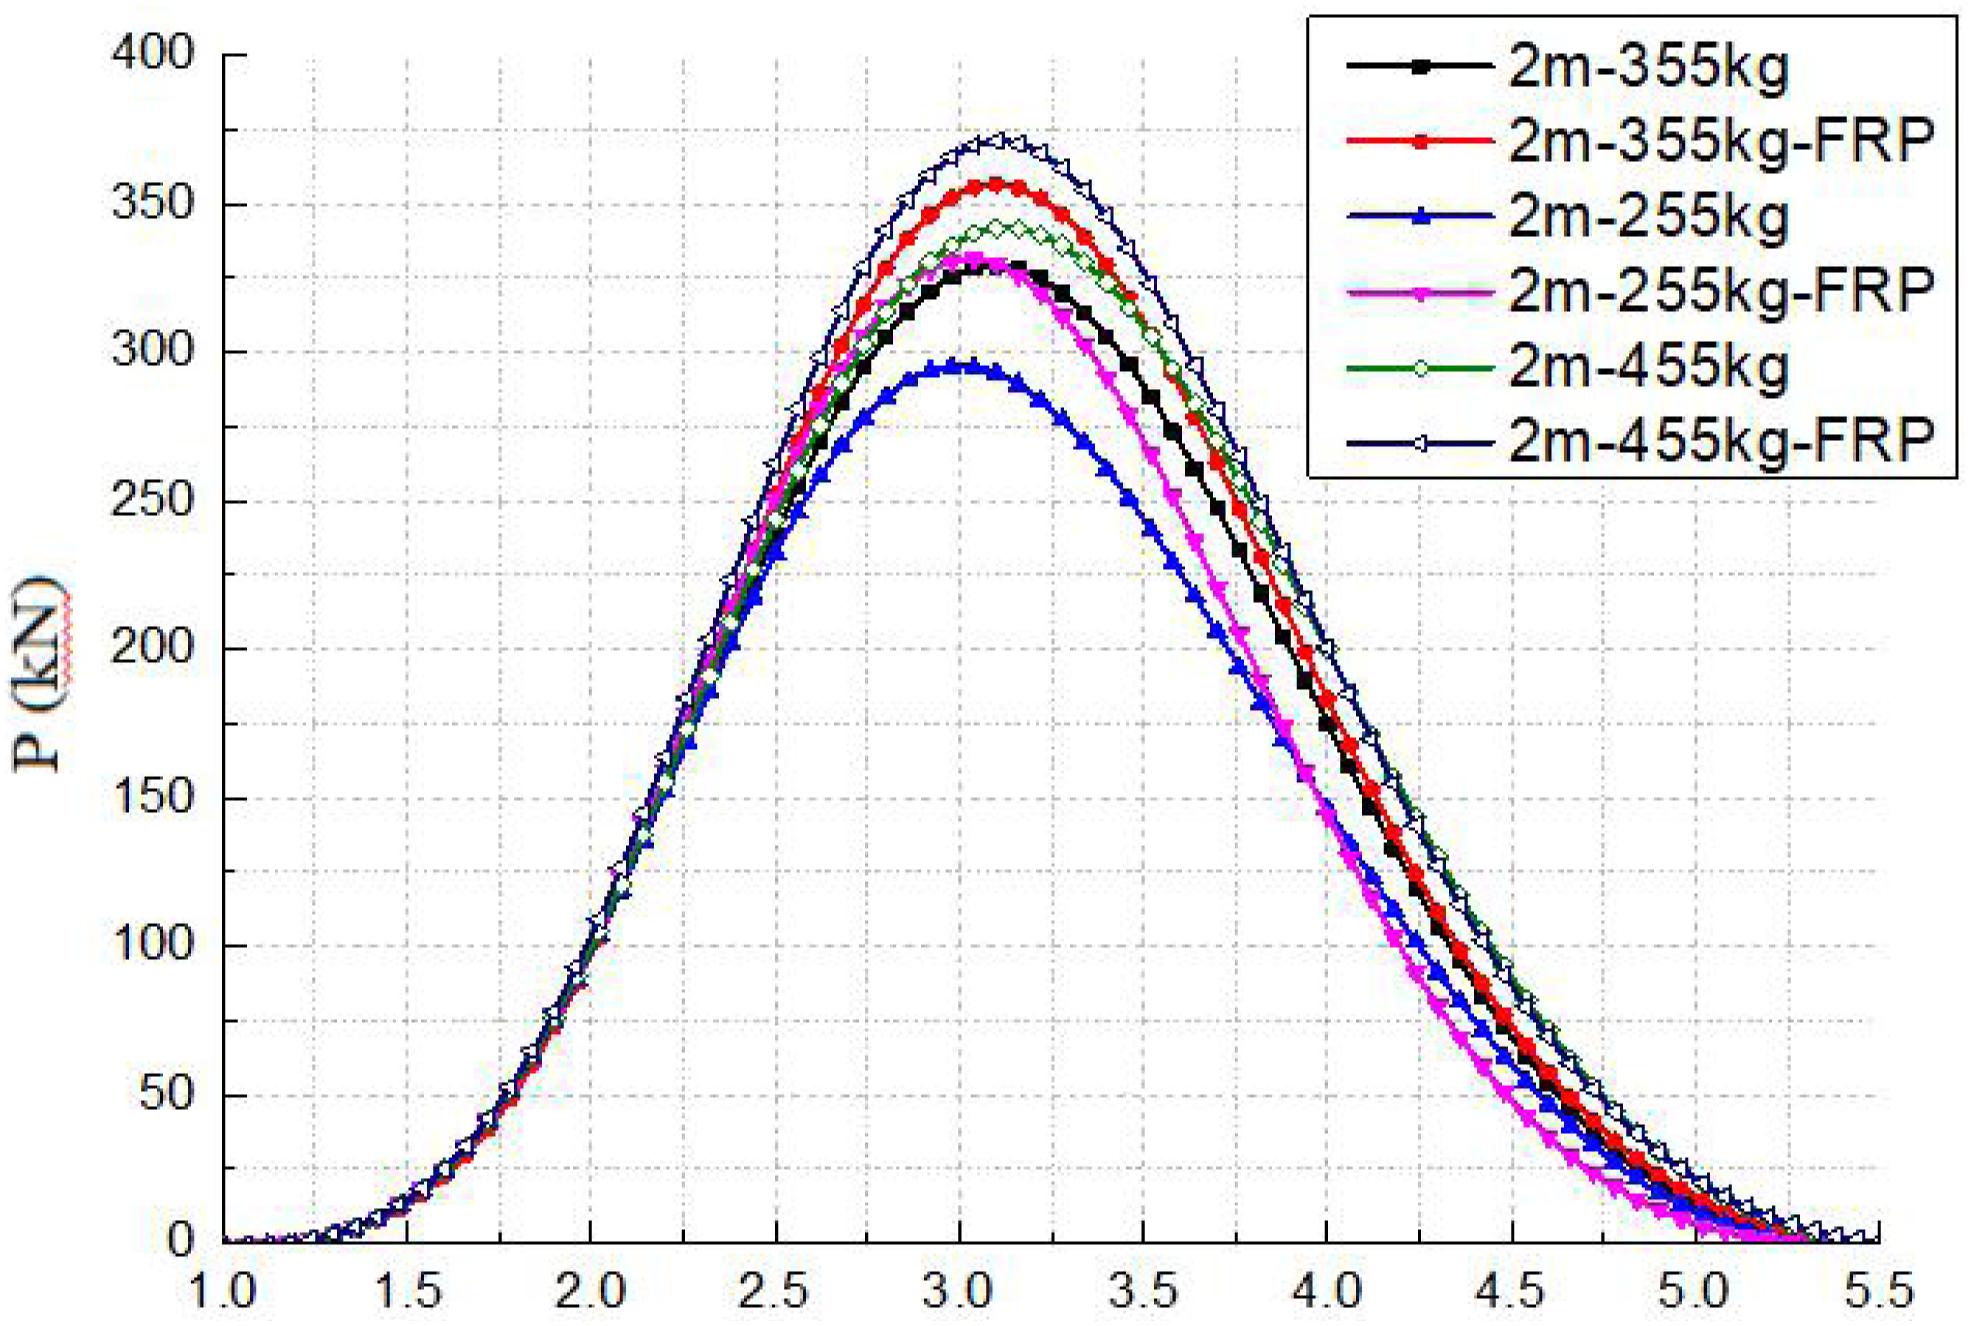
Figure 18. Impact force time history curves at different weights.
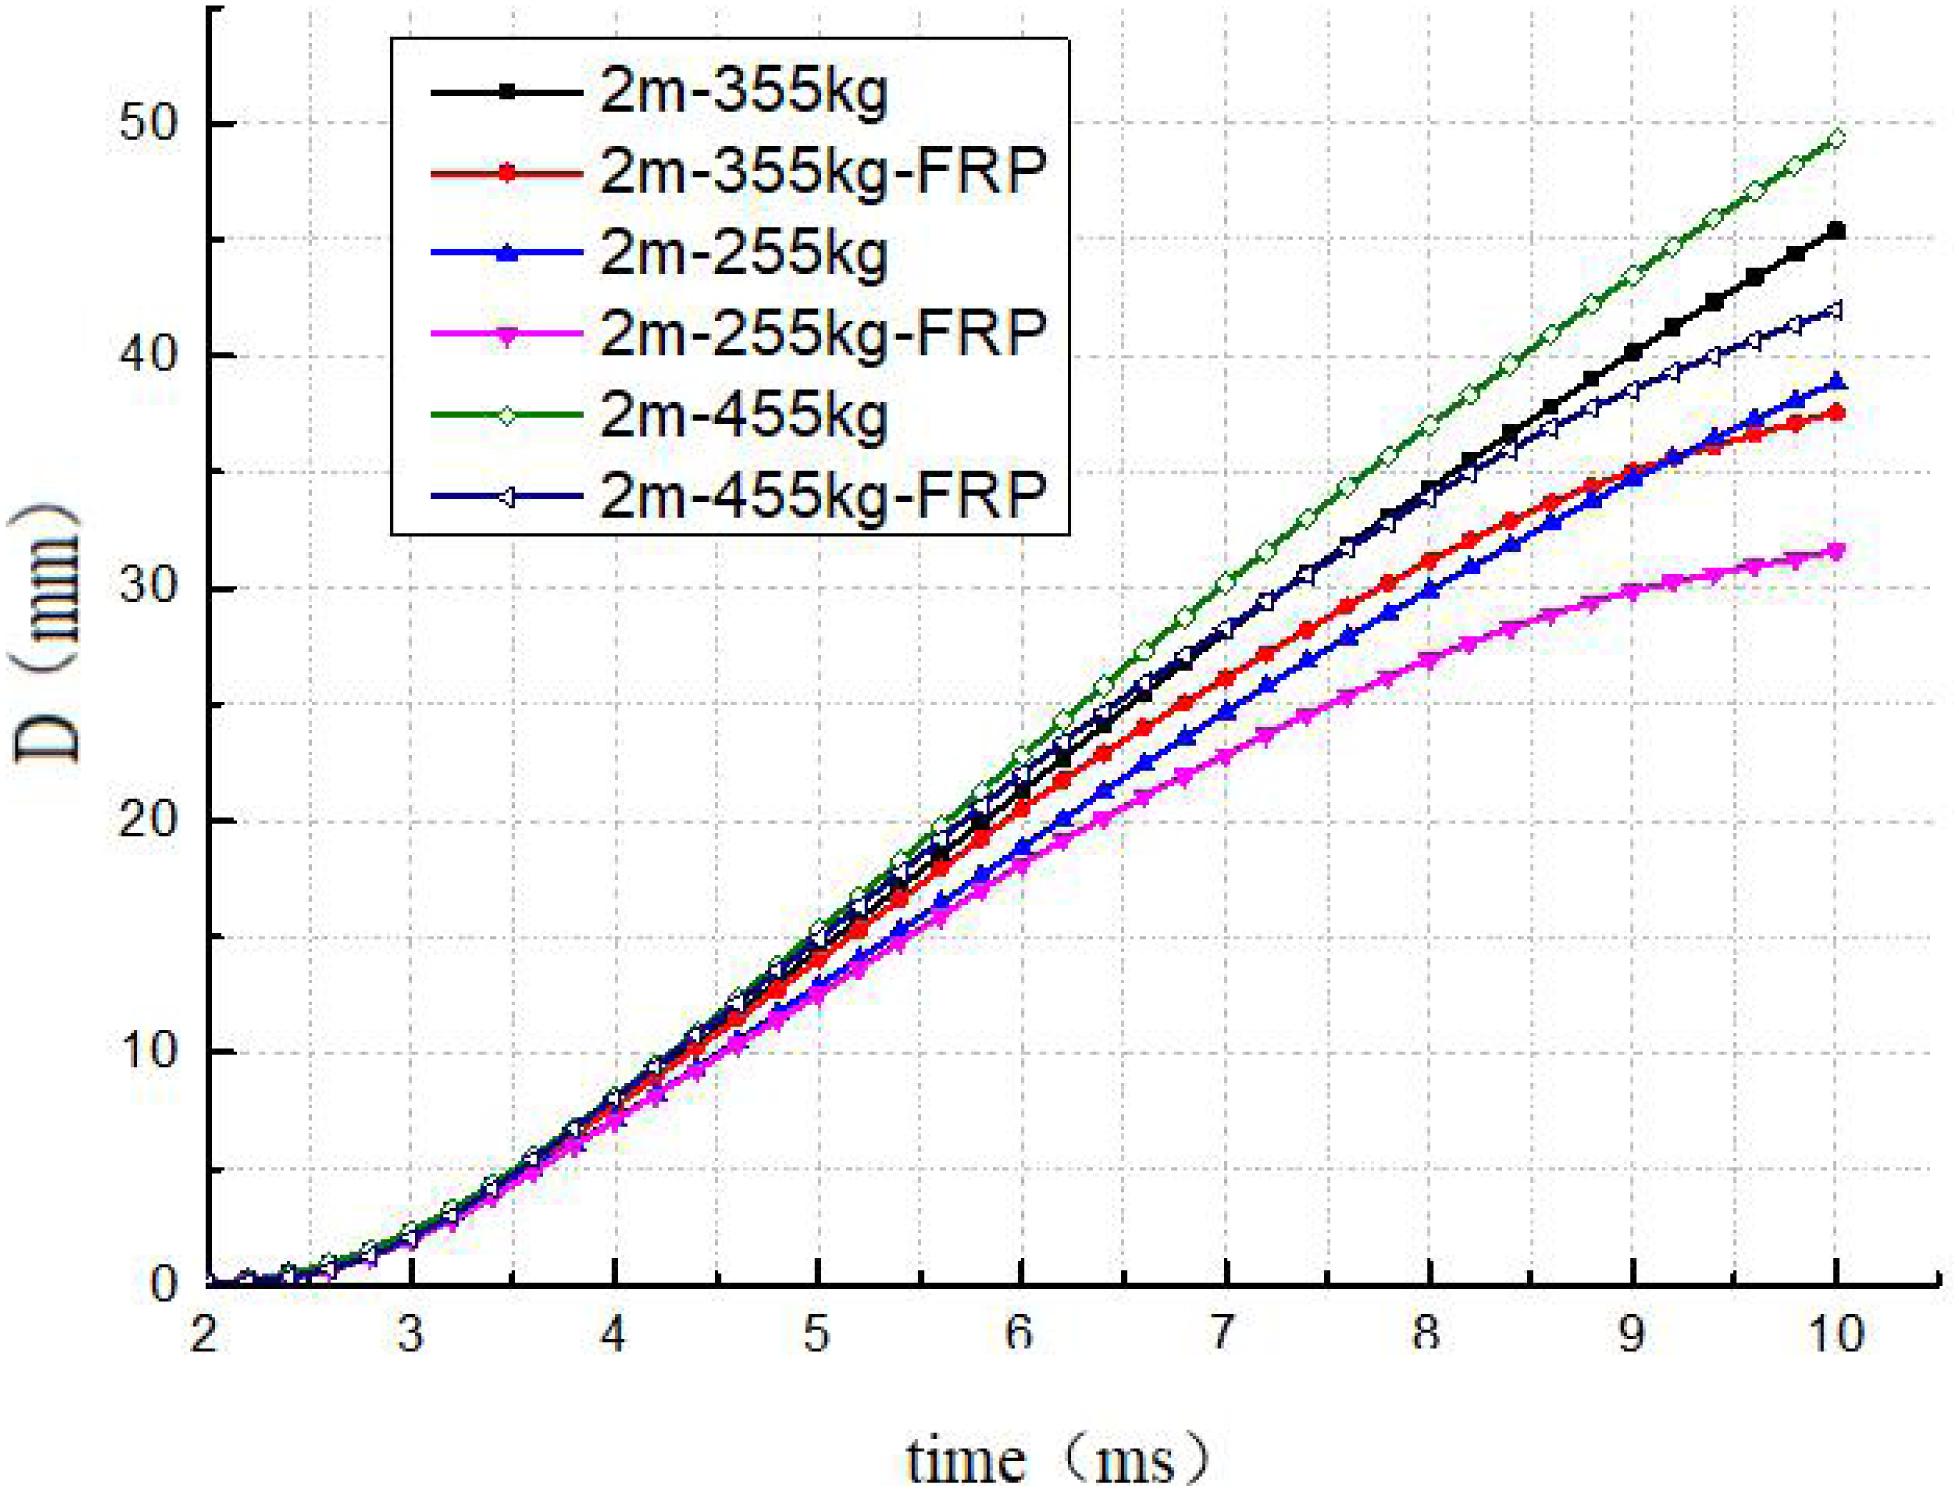
Figure 19. Displacement time history curves at different weights.
The displacement changes in the first impact contact of each specimen are shown in Figure 19 (The displacement measured in the picture is the vertical displacement of the bottom of the mid-span of the beam). It can be seen in Figure 19 that the slope change of deflection of common specimen under different weight of drop hammer is greater than that under different impact height. However, the difference between the ordinary specimen and the reinforced specimen does not show obvious change rule with the increase of hammer weight.
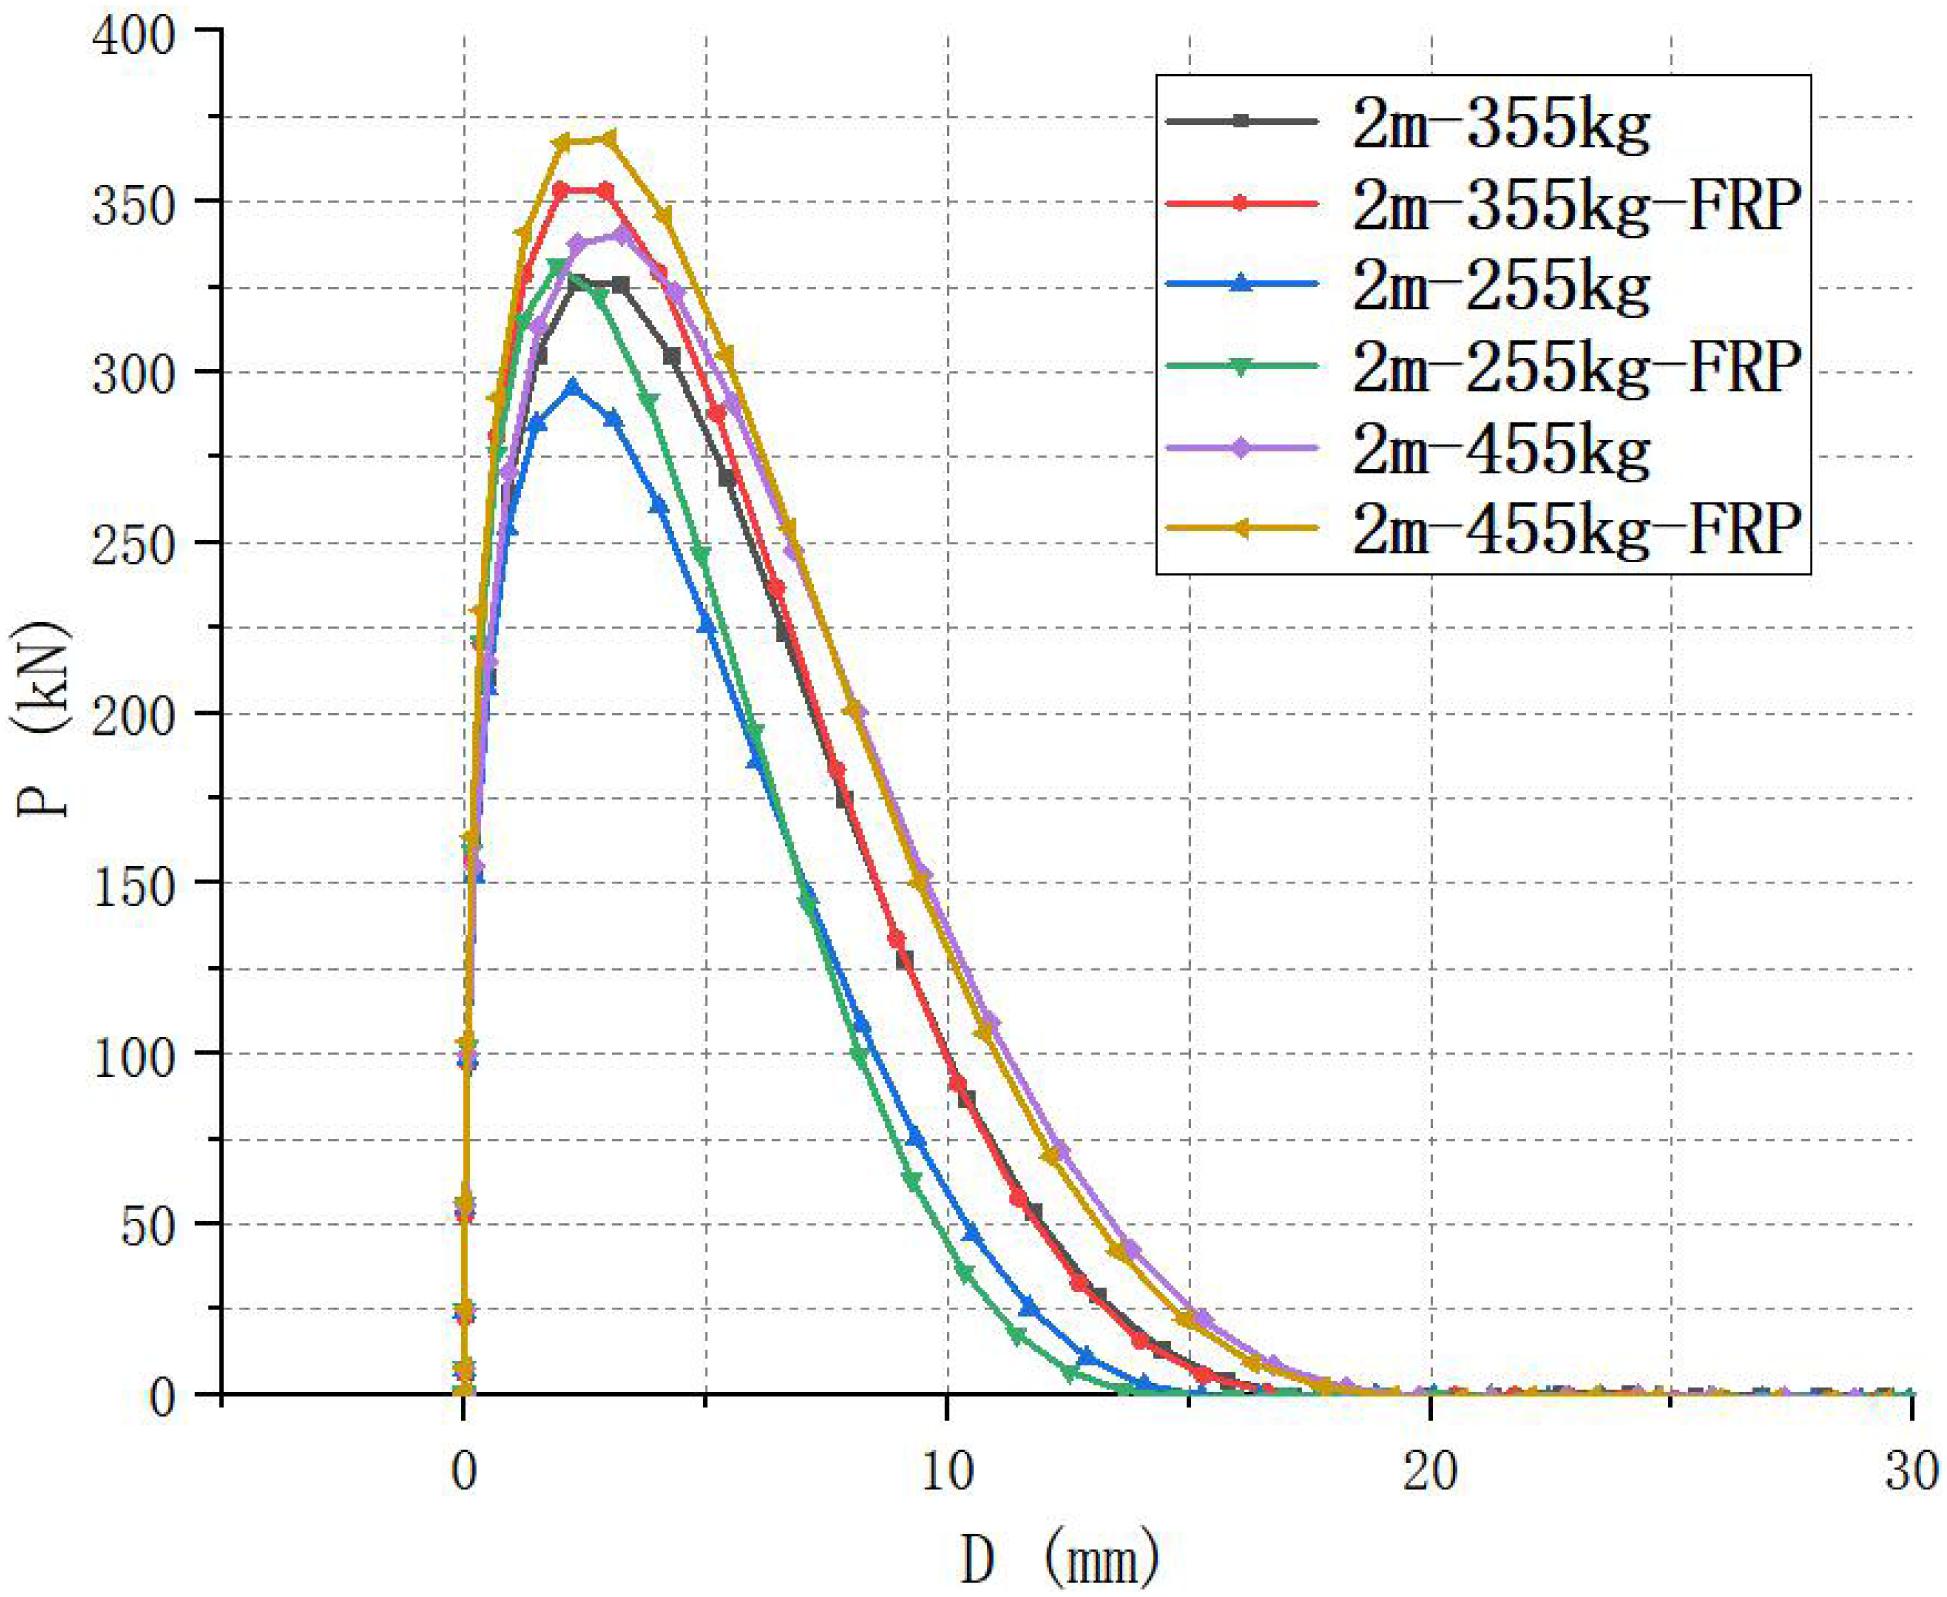
Figure 20. Load-displacement curve.
Figure 20 shows the load displacement curve of the structure under the impact of different hammer weights. As can be seen from the figure, the impact peak value and impact energy of each specimen gradually increase with the increase of hammer weight. At the same time, the difference between the impact energy of the reinforced beam and the ordinary beam under the same hammer weight is not large, but the former’s peak impact force is greater. The reason is mainly due to the strengthening effect of CFRP on the beam body.
Comparative Analysis of Dynamic Behavior of Reinforced Beams Under Two Impact Conditions
By comparing the two impact conditions, it is found that with the increase of the impact height, the local damage of the structure is more serious, and the overall response of the structure is also reduced. However, the response law of the structure is different from that of the former with the increase of the weight of the drop weight. When the local response of the structure increases, the overall response of the structure will also increase.
At the same time, compare the height of the drop weight and the weight of the drop weight, changing the height of the drop hammer (that is, the impact velocity) will have a greater impact on the instantaneous dynamic response of the beam, while keeping the parameters of the specimen unchanged and the impact energy similar. In fact, the impact energy of 2 m-455 kg specimen is higher than that of 2.5 m-355 kg specimen. At the same time, after FRP strengthening, additional stress transfer path is added to the original specimen, local stress concentration is reduced and stress is reduced, and the U-shaped CFRP on the side can inhibit the development of cracks in the midspan which are too large and too wide; the FRP at the bottom enhances the tensile strength of the beam; with the increase of impact velocity, the stress and failure concentrate to the midspan, and the effect of U-hoop on both sides decreases, while the increase of impact weight enlarges the stress area on both sides, indirectly enhances the stress transfer effect of U-hoop. Moreover, the deflection of the strengthened beam is reduced to a large extent in all working conditions. Compared with other dynamic response changes, the reduction of deflection and its reason are intuitionistic and obvious, that is, due to the restraint and tensile action of CFRP.
Finally, the impact force of the strengthened beam is higher than that of the ordinary beam under different conditions of changing the height and weight of the drop hammer. On the one hand, after the beam is strengthened by CFRP, the deformation of the beam is restrained, the effective stiffness of the whole structure is improved, and additional stress paths are added. CFRP can bear part of the impact resistance, so the overall impact resistance of the strengthened beam is increased; On the other hand, in the specimens with lower impact speed and higher impact weight, the overall response of the structure is greater, and more CFRP will participate in the force. CFRP can play a better role in strengthening, which will further improve the impact resistance of the strengthened beam.
Conclusion
(1) In this chapter, the finite element model based on the finite element analysis software ANSYS/LS-DYNA can better reflect the stress distribution, crack development and failure process of the actual beam, and can be used for impact test simulation under different working conditions.
(2) The simulation results after changing different impact parameters show that the impact of the drop weight height on the instantaneous response of the component is more significant, such as the peak impact force. With the increase of the impact velocity, the damage area is concentrated, and the U-shaped CFRP strips on both sides Constraints and restrictions are gradually weakened.
(3) The larger the impact weight is, the better the performance of the U-shaped strip is, but its influence on the instantaneous dynamic response of the beam under the impact is lower than the change of the impact height.
(4) Under different working conditions, CFRP can limit the crack development, reduce the deformation of the beam and reduce the stress concentration of the concrete; in the reinforced beam, CFRP plays a certain role in the impact resistance of the reinforced beams.
Data Availability Statement
The raw data supporting the conclusions of this article will be made available by the authors, without undue reservation.
Author Contributions
HQ contributed to the research ideas and experimental design. LJ and MJ completed the test and collected the data. YL contributed to the finite element calculation. All authors contributed to the article and approved the submitted version.
Conflict of Interest
The authors declare that the research was conducted in the absence of any commercial or financial relationships that could be construed as a potential conflict of interest.
Acknowledgments
Thanks for the financial support provided by basic theory of prefabricated concrete industrial building technology (2016YFC0701400) and the non-industrial transformation technology of existing industrial buildings (2016YFC0701308), and the experimental support of the key laboratory of Structural damage diagnosis in Hunan Province.
References
Department of Housing and Urban-Rural Development Sichuan Province (2014). Design Specification for Concrete Structure Reinforcement. Beijing: China Building Industry Press.
Goldston, M., Remennikov, A., and Sheikh, M. N. (2016). Experimental investigation of the behaviour of concrete beams reinforced with GFRP bars under static and impact loading. Eng. Struct. 100, 220–232. doi: 10.1016/j.engstruct.2016.01.044
Jiang, H., He, H., and Wang, J. (2012). Numerical simulation of impact test of reinforced concrete beams. J. Vibr. Shock 31, 140–145.
Kishi, N., Khasraghy, S. G., and Kon-No, H. (2011). Numerical simulation of reinforced concrete beams under consecutive impact loading. ACI Struct. J. 108, 444–452.
Kishi, N., Mikami, H., and Ando, T. (2001). “An applicability of FE impact analysis on shear-failure-type RC beams with shear rebars,” in Proceedings of the 4th Asia-Pacific Conf. on Shock and Impact Loads on Structures, Singapore, 309–315.
Liao, W., Li, M., Wang, B., Zhang, W., and Tian, Z. (2017). Numerical simulate of impact performance of RC beams strengthened with high strength steel wire mesh, and polymer mortar. Vibr. Shock 36, 63–74.
Liu, F., Luo, Q., and Jiang, Z. (2015). Dynamic responses and failure mechanism of RC beams to low velocity impact. Eng. Mech. 32, 155–161.
Liu, T. (2017). Dynamic Performance of CFRP-Reinforced Reinforced Concrete Beams and Frames Under Impact Loading. Changsha: Hunan University.
Meng, Y. (2012). Experimental and Numerical Simulation of Reinforced Concrete Beams Under Impact Loading. Changsha: Hunan University.
Mohammed, T., and Parvin, A. (2011). “Impact load response of concrete beams strengthened with composites,” in Proceedings of the First Middle East Conference on Smart Monitoring, Assessment and Rehab Rehabilitation of Civil Structures, Dubai, 2–8.
Pham, T. M., and Hao, H. (2017). Performance of fiber-reinforced polymer-strengthened reinforced concrete beams under static and impact loads. Int. J. Protect. Struct. 8, 3–24. doi: 10.1177/2041419616658730
Tavakkolizadeh, M., and Fazelipour, M. (2012). “Numerical analysis of concrete beams strengthened with FRP laminates under i mpact loading,” in Proceedings of the 6th International Conference on FRP Composites in Civil Engineering, Roma, 1–8.
Keywords: CFRP reinforced beam, impact test, numerical simulation, dynamic performance, LSDYNA
Citation: Qingfeng H, Jiang L, Leiyang Y and Jiawei M (2020) Numerical Simulation on Impact Test of CFRP Strengthened Reinforced Concrete Beams. Front. Mater. 7:252. doi: 10.3389/fmats.2020.00252
Received: 29 April 2020; Accepted: 13 July 2020;
Published: 04 August 2020.
Edited by:
Long-yuan Li, University of Plymouth, United KingdomReviewed by:
Carmelo Caggegi, Université Claude Bernard Lyon 1, FranceLik-ho Tam, Beihang University, China
Copyright © 2020 Qingfeng, Jiang, Leiyang and Jiawei. This is an open-access article distributed under the terms of the Creative Commons Attribution License (CC BY). The use, distribution or reproduction in other forums is permitted, provided the original author(s) and the copyright owner(s) are credited and that the original publication in this journal is cited, in accordance with accepted academic practice. No use, distribution or reproduction is permitted which does not comply with these terms.
*Correspondence: He Qingfeng, 5672101@qq.com; sammyhqf@163.com