Transport Mechanism of Suspended Sediments and Migration Trends of Sediments in the Central Hangzhou Bay


1
Second Institute of Oceanography, Ministry of Natural Resources, Hangzhou 310012, China
2
State Key Lab of Estuarine & Coastal Research, East China Normal University, Shanghai 200062, China
*
Author to whom correspondence should be addressed.
Water 2020, 12(8), 2189; https://doi.org/10.3390/w12082189
Submission received: 15 June 2020
/
Revised: 28 July 2020
/
Accepted: 31 July 2020
/
Published: 4 August 2020
(This article belongs to the Section Water Erosion and Sediment Transport)
Abstract
:Based on the 2013 field survey data of hydrology, suspended sediments and bottom sediments in the Central Hangzhou Bay, this paper explores the dynamic mechanism of suspended sediments in Hangzhou Bay by employing material flux decomposition. Meanwhile, the migration trends of bed sediments are also investigated by analyzing grain size trends. The results show that during an ebb or flood tide, the hydrograph of suspended sediment concentration of Hangzhou Bay is dominated by an M shape (bimodal), which is attributed primarily to the generation of a soft mud layer and a separate fluid mud layer. Laterally, the distribution of suspended sediment concentration is high in the south and low in the north. From a macroscopic perspective, the net sediment transport in the study area displays a “north-landward and south-seaward” trend, presenting a “C”-shaped transport mode. That is, the sediments are transported from the bay mouth to the bay head on the north side and from the bay head to the bay mouth on the south side. The sediment transports by advection and tidal pumping are predominant, while the sediment transport by vertical circulation makes little contribution to the total sediment transport. Moreover, the sediment transport in the center of the reach area is dominated by advection, whereas that near both sides of the banks is controlled by tidal pumping. The asymmetry of the tides, i.e., flood-dominance in the north and ebb-dominance in the south, is the primary cause of the dynamic mechanism for the overall “C”-shaped transport mode in Hangzhou Bay. Additionally, coupled with the narrow-head wide-mouth geomorphology, Hangzhou Bay remains evolving by south shore silting and north shore scouring.
1. Introduction
Bay areas, as a land-to-ocean connection and transition zone, have always been a key area of great ecological and socio-economic significance due to their rich containment of natural resources, including: reclamation development, ports and waterways, tide and wave energy, aquaculture, seawater desalination, offshore oil, natural gas, mineral resources as well as tourism resources [1,2,3,4]. In spite of the unique ecosystem, the environment of bay areas is also extremely fragile, as they are significantly affected by a range of factors, including: the runoff [5,6], sediment supply [7,8], loss of wetland [9] and sea-level rise [10]. At present, with the growing development activities in the bay areas, environmental issues have become a hot topic in the oceanography field. Additionally, sediment grains are the carriers of organic matters and nutrients, exerting a vital role in the migration and circulation of matter [11]. Therefore, studies related to suspended sediment transport and sediments migration have gained increasing attention [12,13,14,15].
As the core zone of land–sea interaction, bay areas are controlled by factors related to hydrodynamics such as tidal currents, runoffs, waves and monsoons. Due to the changeable transport course and the continuously intensifying impact of anthropogenic activities, the hydrodynamics and sediment transport processes in bays have become increasingly complicated [13,15]. Thus, extensive research [11,16,17] has been conducted to further understand their relationships. For example, Zhu et al. [15] revealed that over the past 30 years, the dominant factor of the coastline change of the Bohai Sea was related to reclamation, leading to over 99% of the amplitude changed in tidal waves. Meanwhile, the reduced tidal flux decreased the water capacity, thereby impacting the ecological environment of the Bohai Sea.
Hangzhou Bay, as one of the most economically developed regions in China, is characterized by its large tidal range, strong tidal currents, abundant sediment sources and drastic changes in erosion and deposition [18,19,20,21]. The sediment flux from the Changjiang River is the main material source of Hangzhou Bay [3]. However, influenced by anthropogenic activities such as the building of dams [7,9], the South-to-North Water Diversion Project [22,23] and afforestation [24], the seaward sediment flux of the Changjiang River has continuously decreased since the 1960s. After the impoundment of the Three Gorges Reservoir in 2003, in particular, the mean annual sediment flux measured by the Datong Hydrologic Station hit the historical lowest value, decreasing from 4.24 × 10⁸ t/a to 1.37 × 10⁸ t/a [25]. On this basis, the hydrodynamics, sediment transport and geomorphologic evolution in Hangzhou Bay were affected significantly. For example, Dai et al. [3] revealed that the outer Hangzhou Bay displayed rapid erosion (2002–2008, i.e., after the Three Gorges Dam operation) at a rate of 58.5 × 10⁶ m3/y. In addition, the high-density siltation promotion and reclamation implemented in recent years in Hangzhou Bay have so far encircled over 1000 m2 of tidal flat. They have altered the shorelines of both the south and north sides of the bay, thereby affecting the hydrodynamics, sediment supply and deposition [13,26,27].
In recent years, the northern estuary of Hangzhou Bay has transited from siltation to erosion due to the reduction of sediment supply from the Changjiang River [3]. However, Xie et al. [28] and Xie et al. [13] have revealed that the effect of reduced sediment supply from the Changjiang Estuary on the morphological evolution of Hangzhou Bay has been insignificant to date, based on the analysis of the historical bathymetric data. In the meanwhile, the location of sediment deposition moved seaward to the inner Hangzhou Bay where the accumulation rate is increasing. Therefore, figuring out the mechanism of sediment transport in the boundary of inner and outer Hangzhou Bay (i.e., the Central Hangzhou Bay) would be key to predict the future evolution of Hangzhou Bay, especially after the drastic reduction of sediment supply from the Changjiang Estuary. Therefore, the current study attempts to utilize the latest measured field hydrodynamics and bed sediment data to explore the overall transport mechanisms of hydrodynamics and suspended sediment and the migration trends of bed sediments in the Central Hangzhou Bay. The current study is structured as follows. The description of the study area is prepared in Section 2. The methods for data processing and analysis are shown in Section 3. The results and discussion are presented in Section 4 and Section 5, respectively, while the summary and final conclusions are presented in Section 6.
2. Study Area
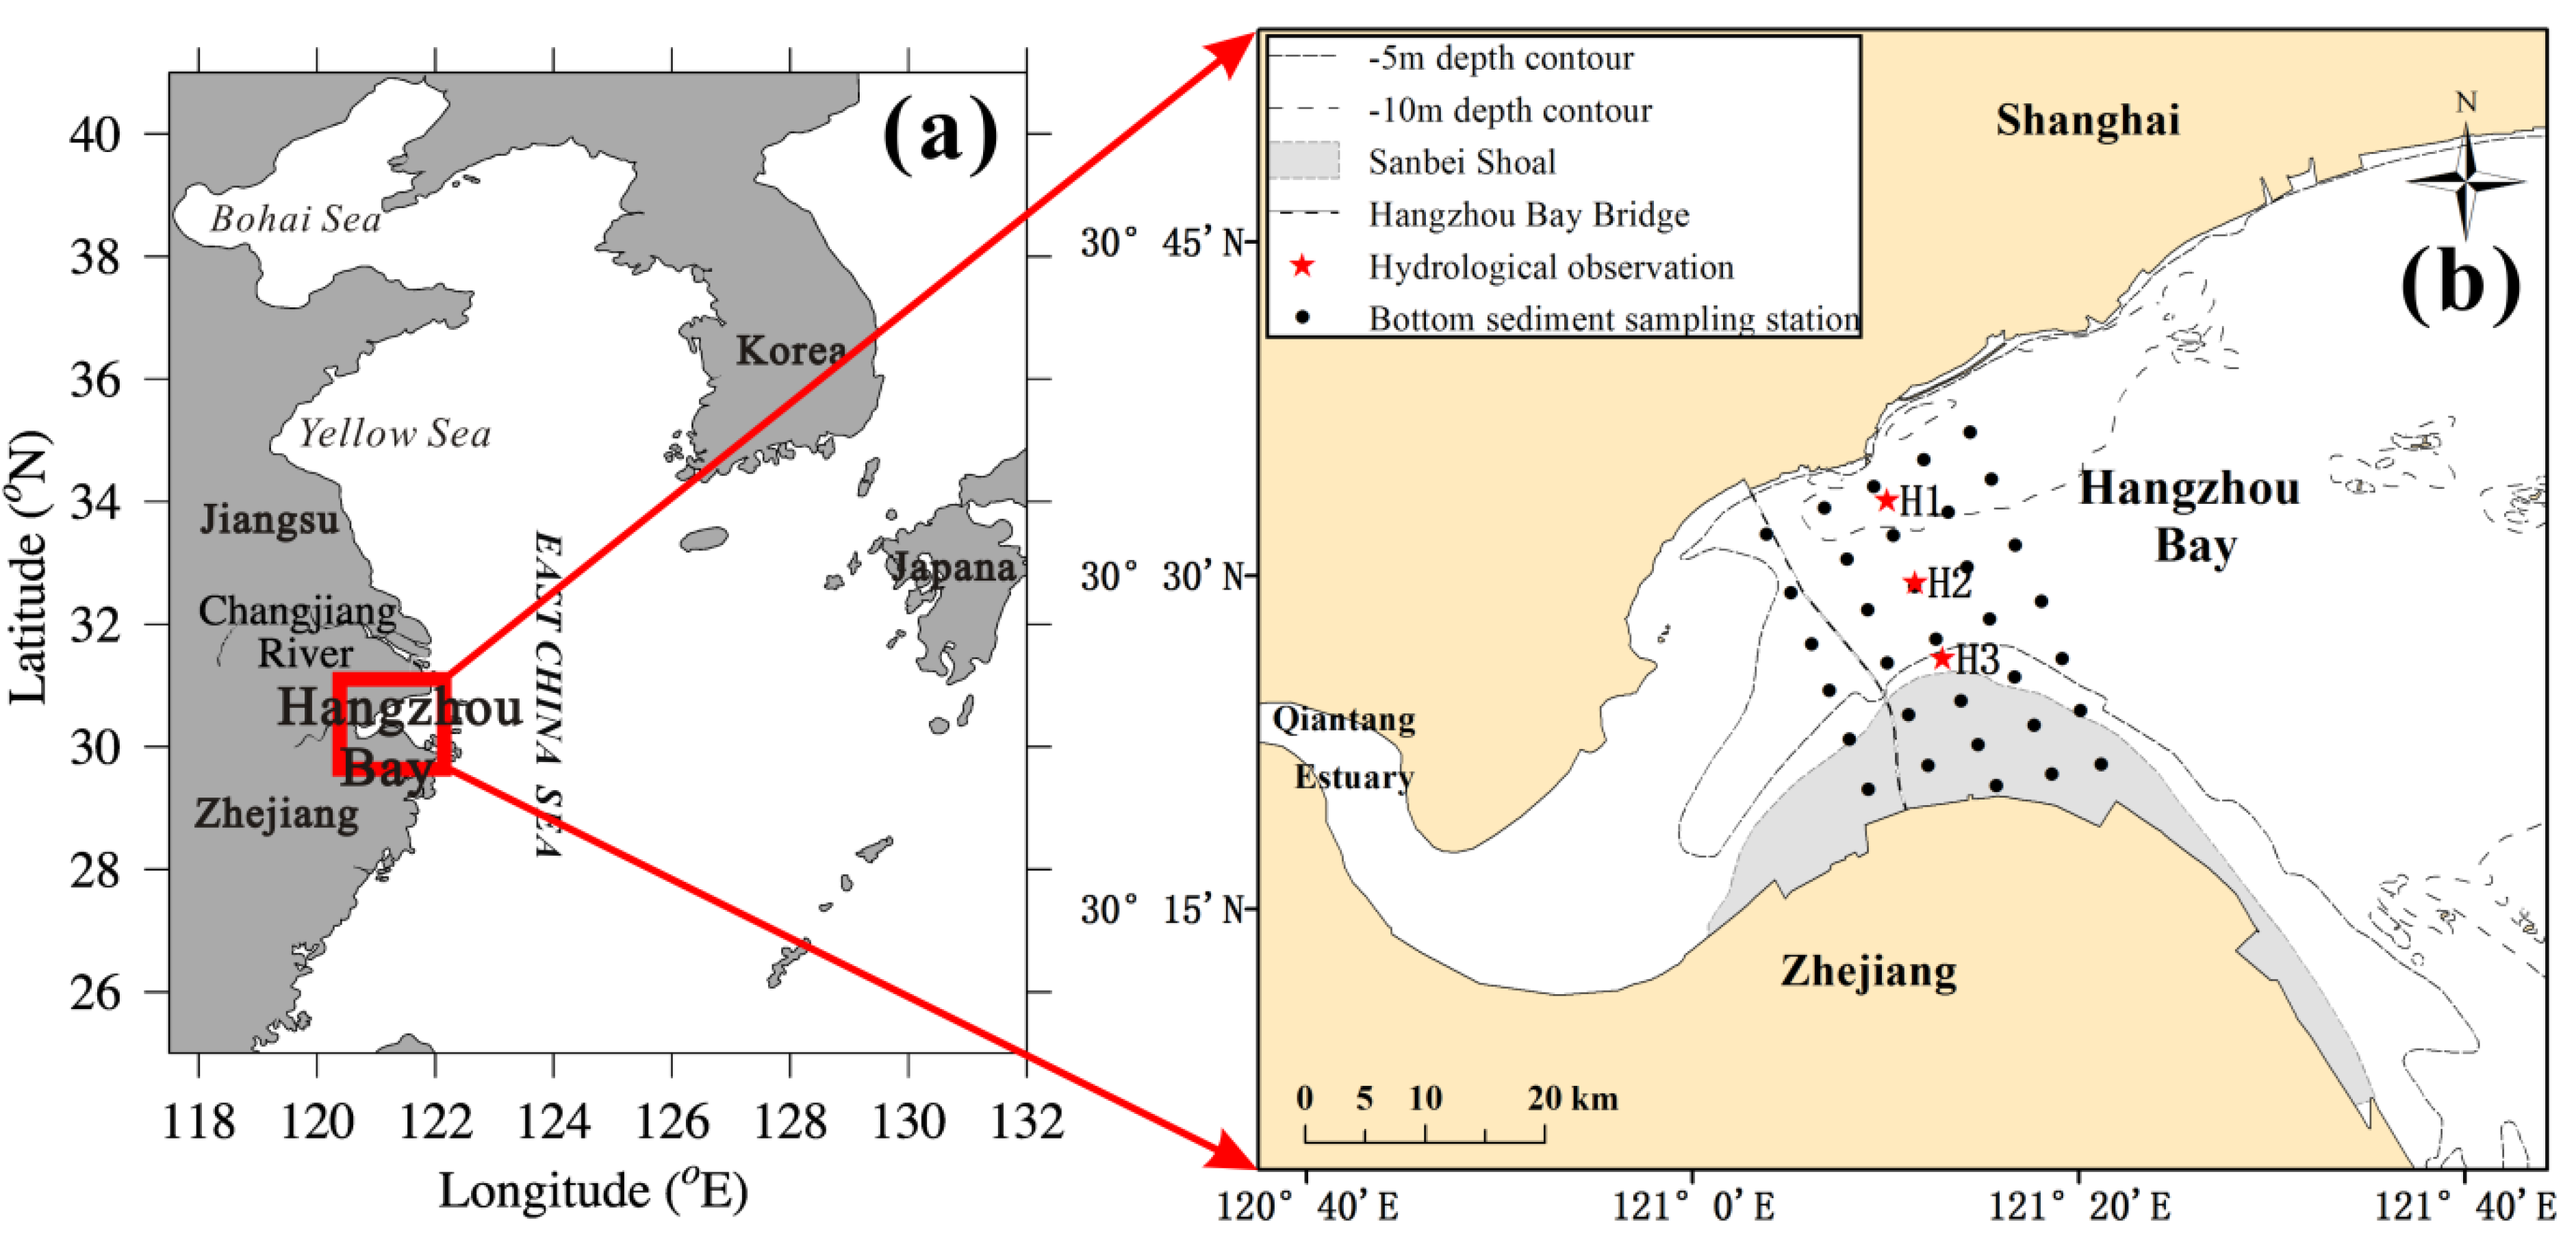
Hangzhou Bay, located in the middle of China’s coastal area, is famous for its large tidal range. It is adjacent to the Changjiang River Estuary in the north, and adjacent to the Qiantang River in the west. Morphologically, Hangzhou Bay is a trumpet-shaped bay with an east–west strike (Figure 1): its width increases continuously from the Ganpu region (the inner bay head) to the bay mouth reaching 98.5 km. Moreover, the water area of the bay is approximately 5000 km2 [21]. The Qiantang River in the west is the largest river flowing into the bay, whose mean annual water discharge is approximately 952 m3/s and mean annual suspended sediment discharge is 6 million t/a [19]. The topography of Hangzhou Bay is relatively flat, and the mean water depth is generally 8–10 m. It is characterized by irregular semidiurnal shallow tides. The tidal range is 3–4 m at the bay mouth, increasing gradually towards the bay head to 4–6 m. The tidal currents are stronger within the bay, with a velocity up to 3 m/s. Meanwhile, the wind wave is small, with a mean annual height ranging between 0.2 m and 0.5 m. The sediments in the bay are composed primarily of clayey silt with the median grain size between 20 μm and 40 μm, and the suspended sediment concentration could reach 3.3–4.4 kg/m3 [28]. Owing to the abundant sources of suspended sediments and the high sediment content, the topography is eroded and silted severely by the strong tidal currents [17,20].
3. Data and Methods
3.1. Field Observations
During three separate periods in 2013: (1) from 8:00 a.m. on 31 January to 9:00 a.m. on 1 February (spring tide), (2) from 9:00 a.m. on 4 February to 10:00 a.m. on 5 February (intermediate tide), and (3) from 13:00 p.m. on 8 February to 14:00 p.m. on 9 February (neap tide), three stations (H1, H2 and H3 in Figure 1b) near the eastside of the Hangzhou Bay bridge were selected for simultaneous in-situ hydrological observations. The observations of each station were made for a continuous period of 26 h, ensuring that two complete tidal cycles were included. The mean water depth of the three stations H1, H2 and H3 were 14.4 m, 12.5 m and 8.9 m, respectively. During the observations, the flow direction and velocity were collected via acoustic Doppler current profilers (ADCP, 1 MHz) installed on the surveying vessels. The transducer draught was 1 m. The measurement interval was set to 10 min, and the vertical sampling bin size was 0.5 m. Regarding the collection of suspended sediment, horizontal water samplers were employed to collect three-layer water samples at 0.2-, 0.6- and 0.8-h (h represents the water depth). Additionally, in May of the same year, thirty-three bottom sediment samples were collected in this survey area using a clamshell dredge, with a sampling interval set around 5000 m (Figure 1).
3.2. Sample Processing
The water samples were weighed in the laboratory after suction filtration (membrane pore size 0.45 μm) and drying, so as to obtain the data on sediment contents in water bodies. Meanwhile, the bottom sediment samples were removed of organic matters by adding excess hydrogen peroxide and removed of carbonates by adding dilute hydrochloric acid. After complete reaction, distilled water was added and it was left to stand for 24 h, followed by the discarding of the supernatant. Subsequently, the residue was added with 4% sodium hexametaphosphate solution and dispersed by ultrasonication. Afterwards, the samples were poured into the Mastersizer 2000 laser diffraction particle size analyzer (Malvern Instruments, measuring range 0.02–2000 μm) for analysis. Finally, the mean grain size (), sorting coefficient () and skewness () of the bottom sediment samples were calculated by the moment formulae Mcmanus [29]: , and , where denotes the percentage of the grain size and n is the total number of grain size fractions.
3.3. Data Analysis Methods
The balance of the suspended sediment flux was analyzed using the method proposed by Dyer [30], in which the tidal mean sediment flux through a unit width cross section could be calculated with the following equation:
where and are the current velocity and SSC (suspended sediment concentration) at the depth respectively. Moreover, “” denotes a tidal-averaged value; and “” denotes a depth-averaged value. At any depth, and , where and are the deviations of the observed values from the depth-averaged values. The tidal fluctuations are written as and , where and are the deviations from the depth-averaged values in a tidal cycle. Meanwhile, the tidal height is , where is the deviation of the tidal height from the mean depth. In this equation, is the flux due to the non-tidal drift, the Eulerian velocity; is the flux due to Stokes drift and is called advection term. is the tidal pumping term which is caused by the phase differences between SSC and tidal currents, i.e., flood–ebb asymmetry in sediment resuspension and water stratification [31]. is the vertical circulation term related to gravitational circulation and vertical profile of velocity and SSC [32,33].
In the present study, a method proposed by Gao and Collins [34] was employed to investigate the net transport trends of bottom sediments in the central Hangzhou Bay. The method was derived from sandy beds, but after nearly 30 years’ application, it is verified to be applicable to silty beds [35,36,37]. In particular, Wang and Gao [37] successfully adopted the method in the investigation of sediment transport trends in Hangzhou Bay.
This semi-quantitative filtering-based method assumes that the grain size trends of bed material occur more frequently along the sediment transport direction than in other reverse directions. It extracts the grain size parameters of sediments quantitatively and converts them into the results of sediment transport trends. Previous research [38,39] has revealed that three grain size parameters , and would be feasible to identify the sediment transport trends. Hence, these three parameters were further calculated and analyzed herein.
For any two adjacent sampling points in the sampling sites, eight types of grain size trends could be obtained through the comparison among three grain size parameters , and . Verified by previous research in the marine sedimentary environments [34,39], two types of grain size trends on sediment migration direction were found to occur more frequently: (1) the sediments are better sorted in the migration direction, with finer and more negatively skewed grains, when abrasion occurs along the transport path; and (2) the sediments are better sorted in the migration direction, with coarser and more positively skewed grains, when bed erosion occurs along the transport path [38]. The grain size parameters of each sampling point were compared one by one with those of the immediately adjacent sampling points. If one of the two situations was satisfied between sampling point a and its adjacent sampling point b, then a unit vector pointing from the sampling point a towards the sampling point b would be defined, so as to determine whether the two sampling points were adjacent. This could be verified with the characteristic distance Dcr (Dcr usually represents the maximum sampling interval). If the distance between two sampling points was less than Dcr, they would be considered adjacent. Otherwise, they would be considered non-adjacent. For each sampling point, all its grain size trend vectors were found out and then added together, so as to derive its resultant vector. Finally, the resultant vectors were subjected to “smooth de-noising” treatment to reflect the net transport trends of bed sediments. The detailed computational method can be found in Gao and Collins [34].
4. Results
4.1. Flow Velocity Characteristics
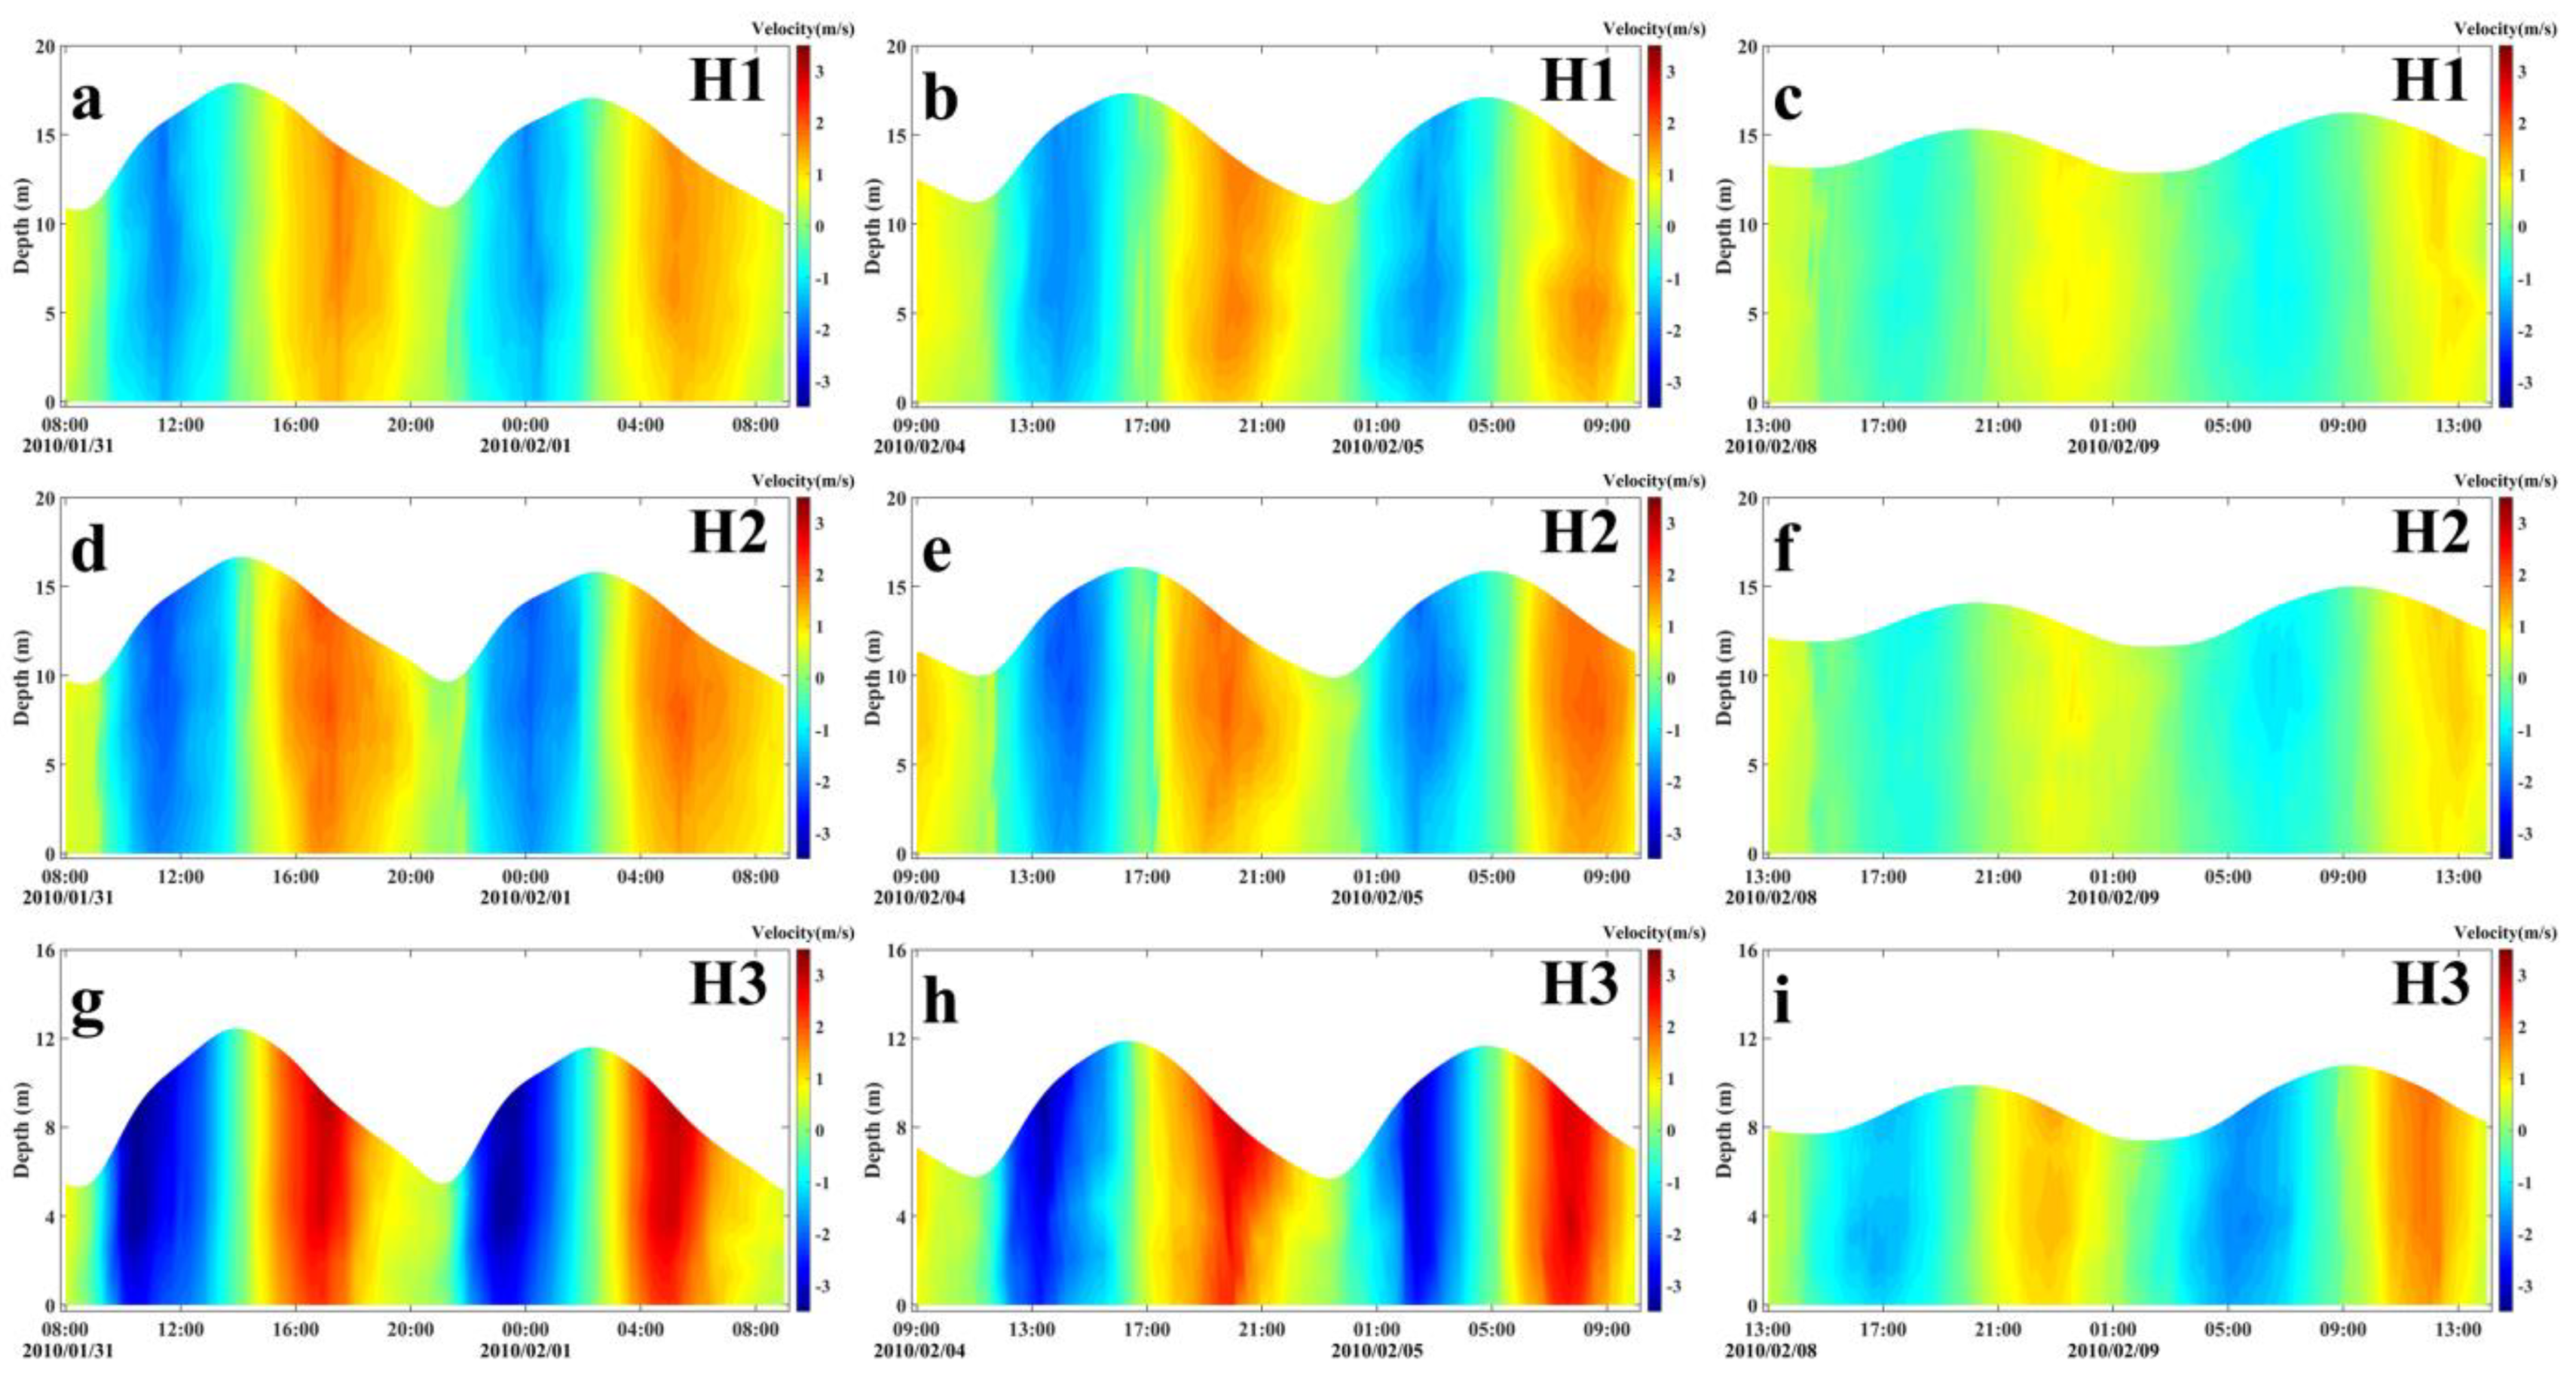
The flow velocity processes (Figure 2) and statistical results (Table 1) from the three stations are presented. From the perspective of the variation trends of mean depth-averaged velocity over tidal cycles at various stations, the velocity was between 0.93 and 1.57 m/s, 0.86 and 1.39 m/s and 0.50 and 0.90 m/s during the spring tide, intermediate tide and neap tide, respectively (Table 1). This indicates that the spring-intermediate-neap variations of flow velocity exhibited a positive correlation with the tidal range changes. According to the inter-station comparison of the observations during the spring tide, the flow velocity was highest at the station H3, up to 3.25 m/s, followed by the station H2, while the station H1 showed the lowest velocity, with a mean velocity of 0.93 m/s. On the whole, laterally, the velocity displayed a decreased trend from the south (H3) to the north (H1).
4.2. Temporal and Spatial Distribution of SSC
Similar to other bays, the process of suspended sediment concentration in Hangzhou Bay exhibited variations in the tidal cycle and spring-neap tide, as well as spatial differences (Figure 2). Relatively high suspended sediment concentration was yielded: (1) the maximum depth-averaged sediment concentration over a tidal cycle was found at station H3, which was 4.1 kg/m3 in the Spring tide; and (2) the highest sediment concentration was observed at the bottom layer of station H3, with a value of up to 12.6 kg/m3.
4.2.1. Intertidal Processes of SSC
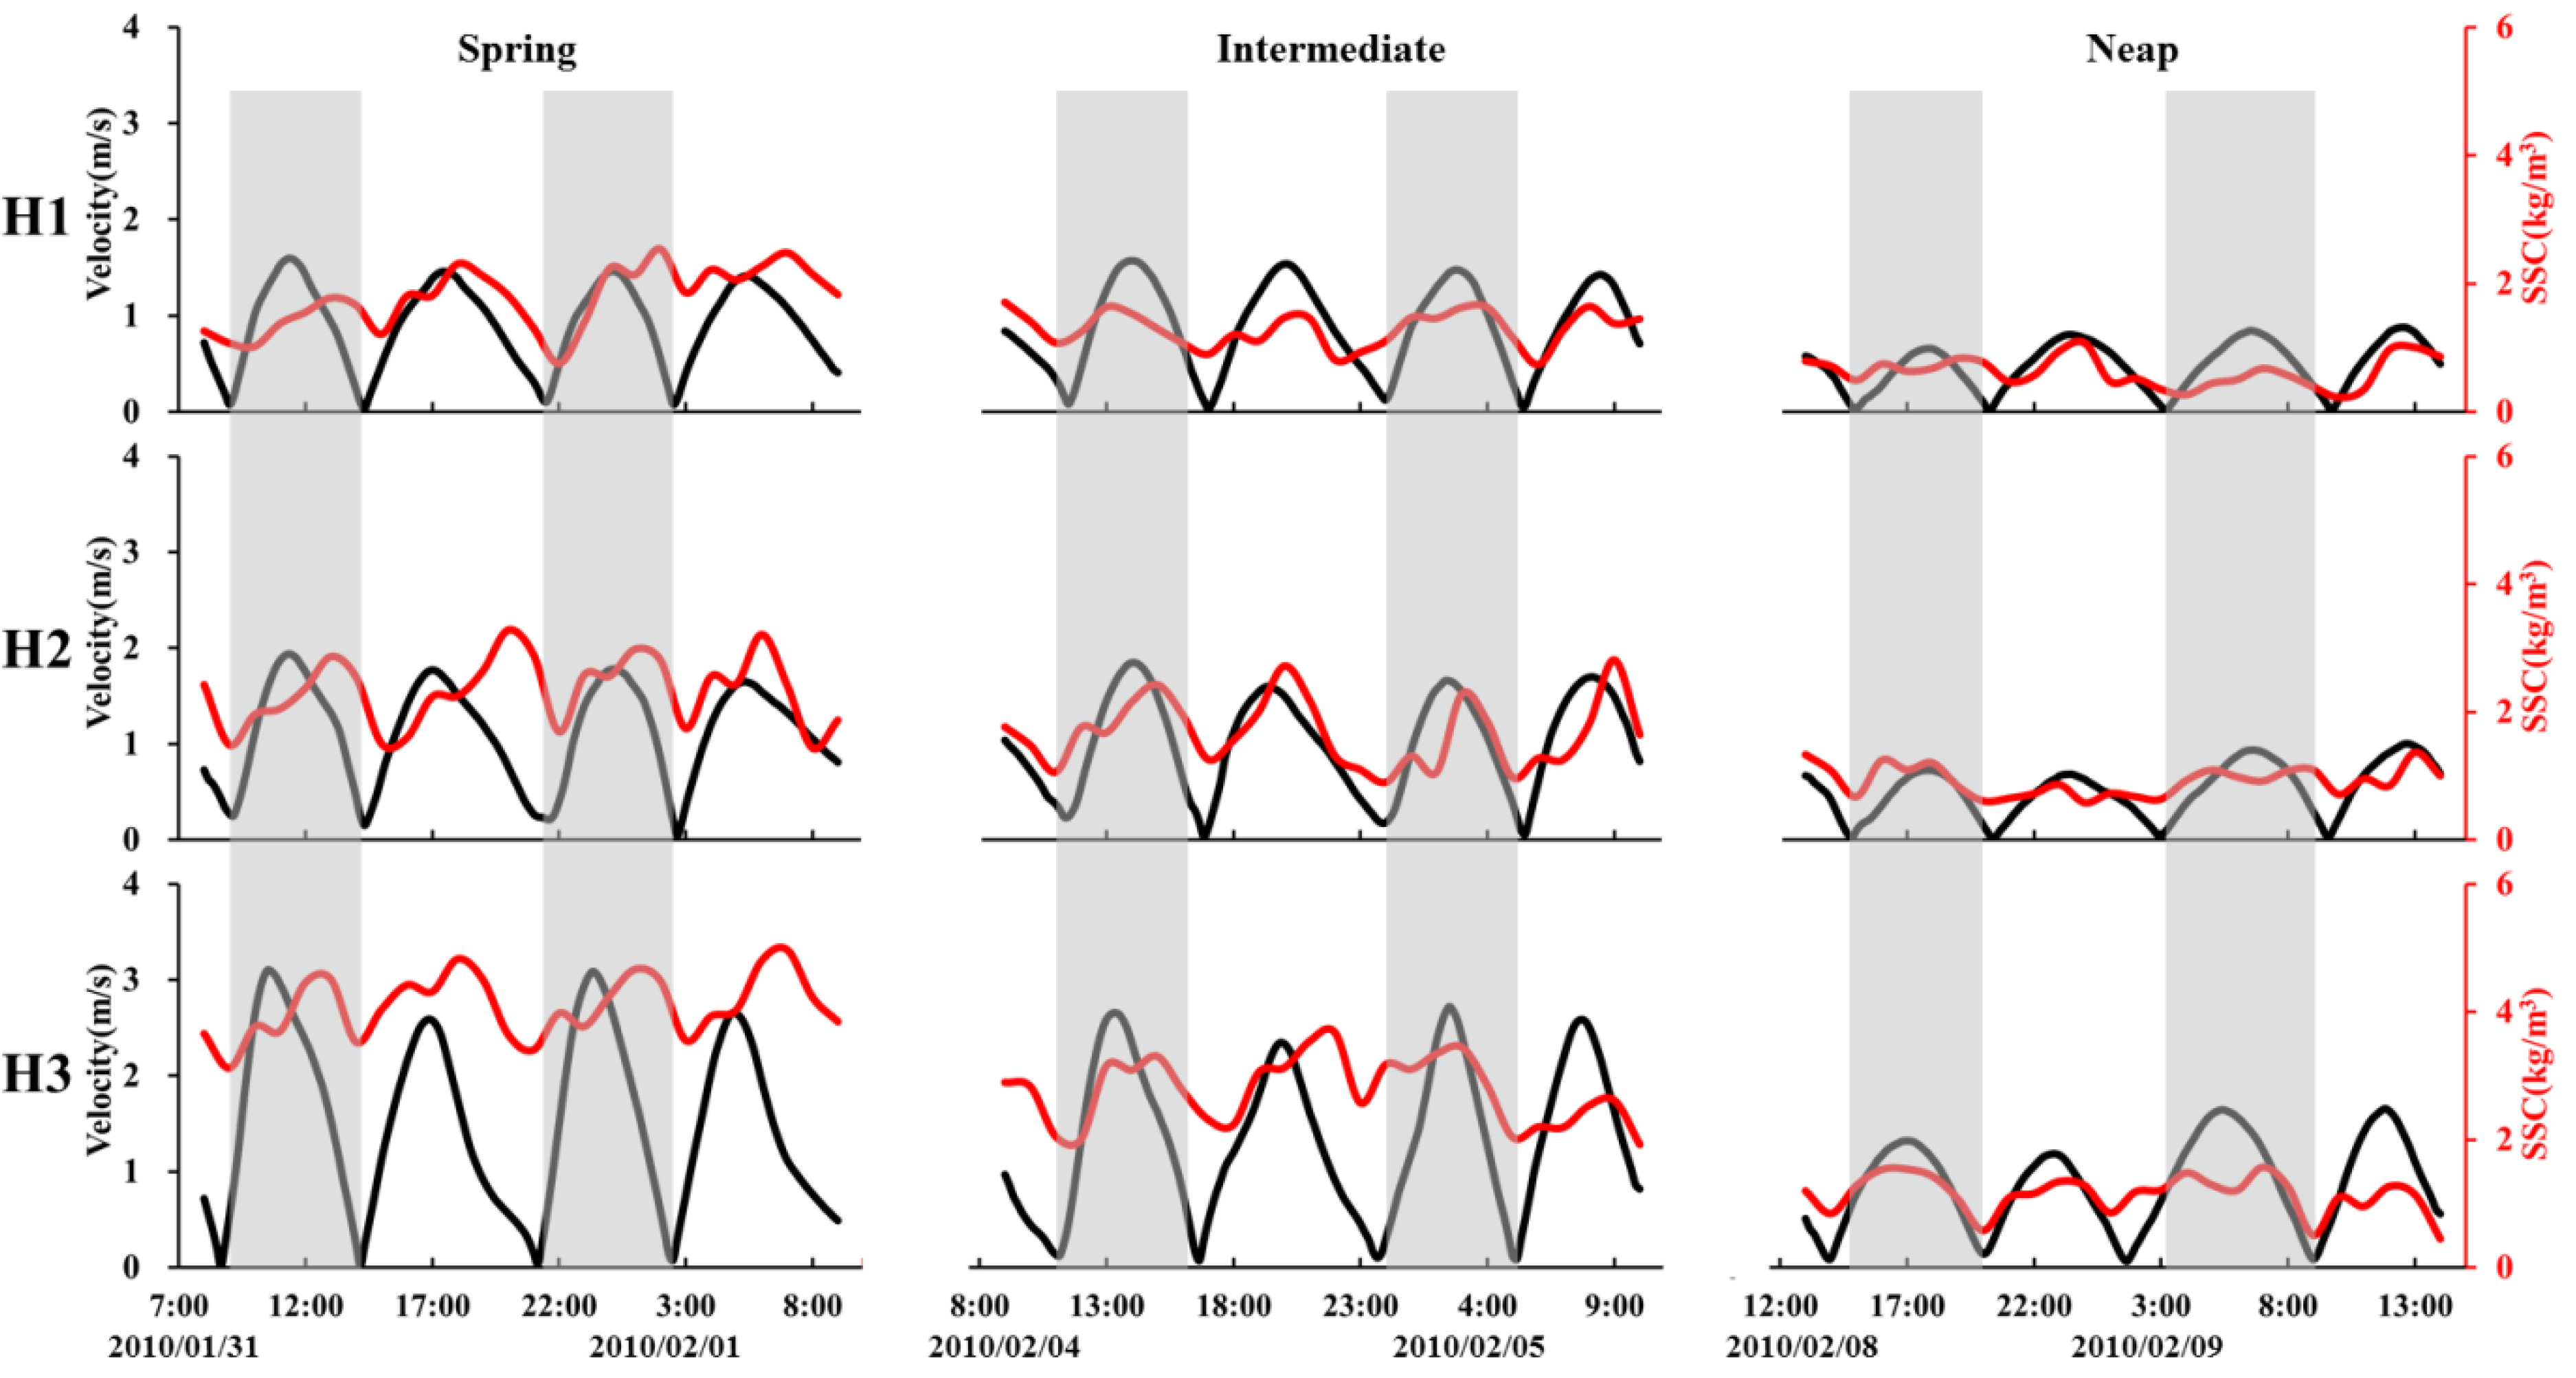
In Figure 3, the variation processes of flow velocity, flow direction and sediment concentration within the tidal cycles are illustrated for the three stations in the central Hangzhou Bay. Clearly, during a flood or ebb tide process, the sediment concentration hydrographs mainly displayed a M (bimodal) shape, i.e., two crests appeared within a flood or ebb tide cycle. The first crest appeared within 1–2 h after the turn of tidal currents, immediately following which a trough appeared. Afterwards, the second crest appeared within 1–2 h after the maximum flow velocity. Moreover, the differences between the magnitude of two crests vary among the tides. During the spring and intermediate tides, the second crests were markedly larger than the first crests, whereas during the neap tide, this was no longer evident. Regarding the occurrence frequency of bimodality, a total of 25 dual crests were observed over 36 tidal cycles of the three stations during the measuring period.
4.2.2. Spring-Neap Processes and Horizontal Distribution of SSC
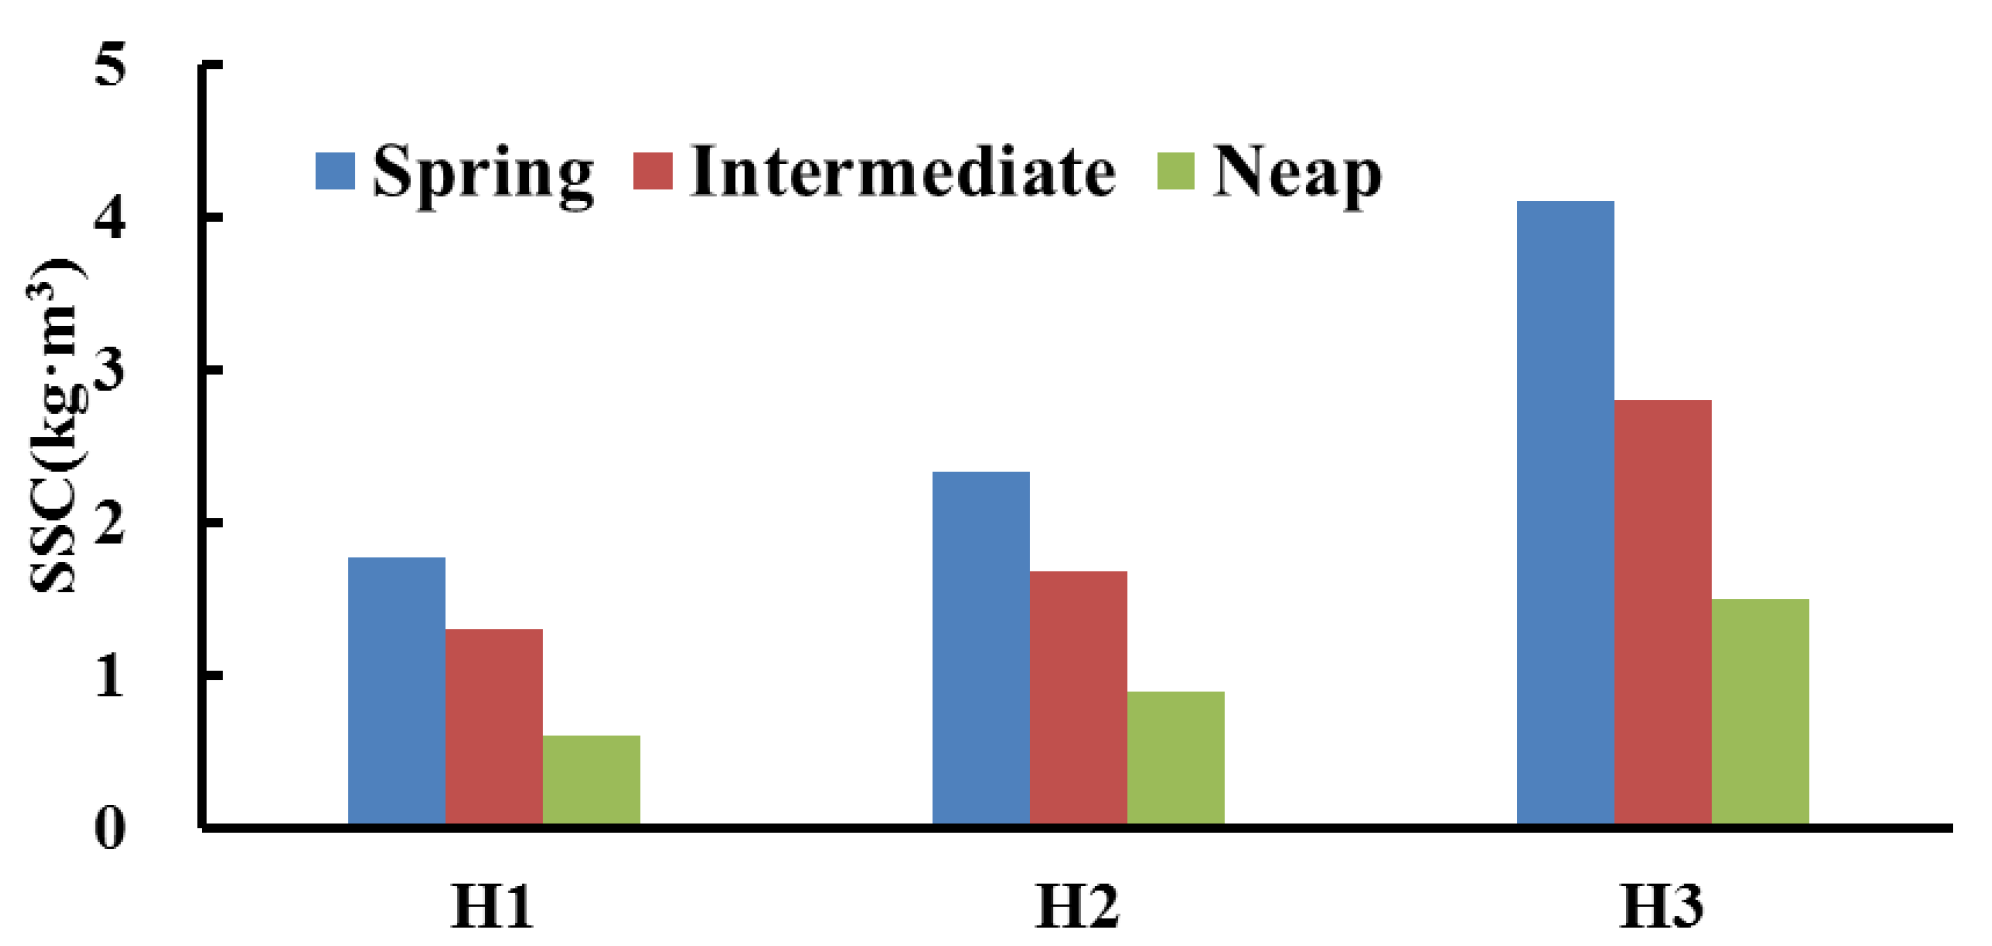
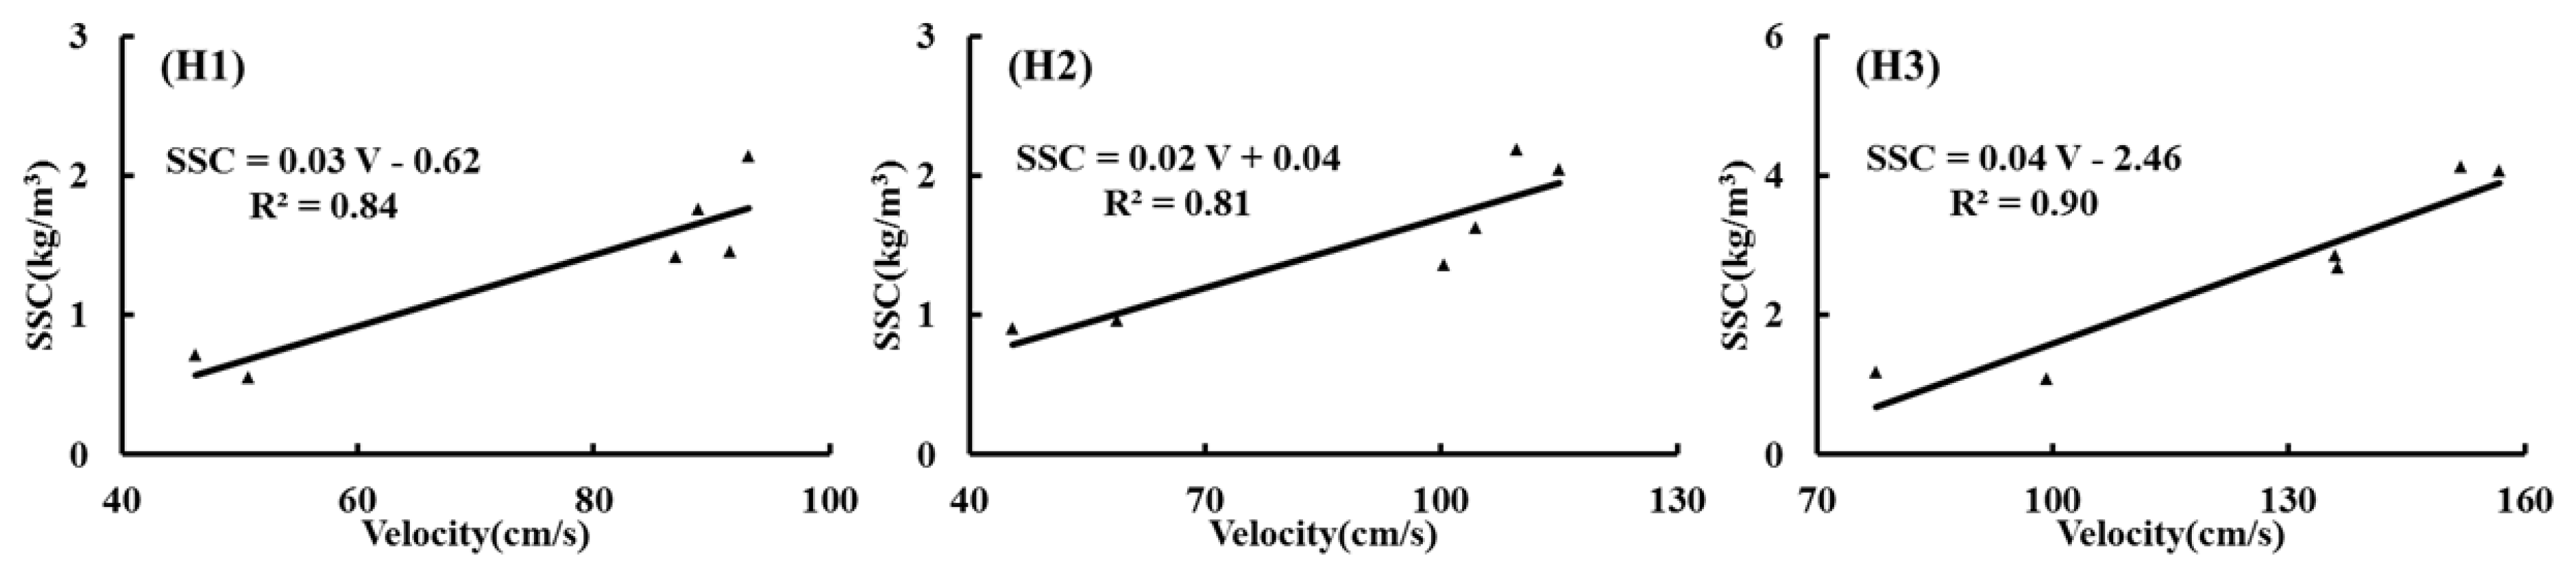
The mean depth-averaged suspended sediment concentration over spring, intermediate and neap tides, acquired from the three stations in the central Hangzhou Bay, are displayed in Figure 4. As is clear, the sediment concentration was between 1.8–4.1 kg/m3, 1.3–2.8 kg/m3 and 0.6–1.5 kg/m3 during spring tides, intermediate tides and neap tides, respectively. That is, the spring tide period exhibited the highest sediment concentration, followed by the intermediate tide period, while the neap tide period showed the lowest concentration. The ratio of mean sediment concentrations during the spring, intermediate and neap tides was 2.7:1.9:1, presenting an evident fortnightly tidal variability. According to a study conducted by Shen et al. [40], if the suspended sediment concentration at a site is correlated strongly with the tidal current velocity, this indicates that the concentration is attributed mainly to the scouring and resuspension of bottom sediments resulting from velocity increase. Otherwise, this indicates that the sediment originates primarily from the advection transport from other sea areas.
The analysis of the correlation between tidal mean flow velocity and tidal mean sediment concentration over six tidal cycles at three stations revealed the presence of a significant correlation between the two (Figure 5). For the three stations H1, H2, and H3, the linear correlation coefficients were 0.84, 0.82 and 0.90, respectively (Figure 5). The correlation between mean flow velocity and mean sediment concentration was rather high for all the three stations, suggesting that the strength of tidal current was the primary factor responsible for the change of sediment concentration in the Central Hangzhou Bay.
The magnitude relationship of sediment concentration was compared between the three stations, finding that the sediment concentration distribution in the Central Hangzhou Bay was high in the south and low in the north laterally (Figure 4).
4.3. Transport Mechanism of Suspended Sediments
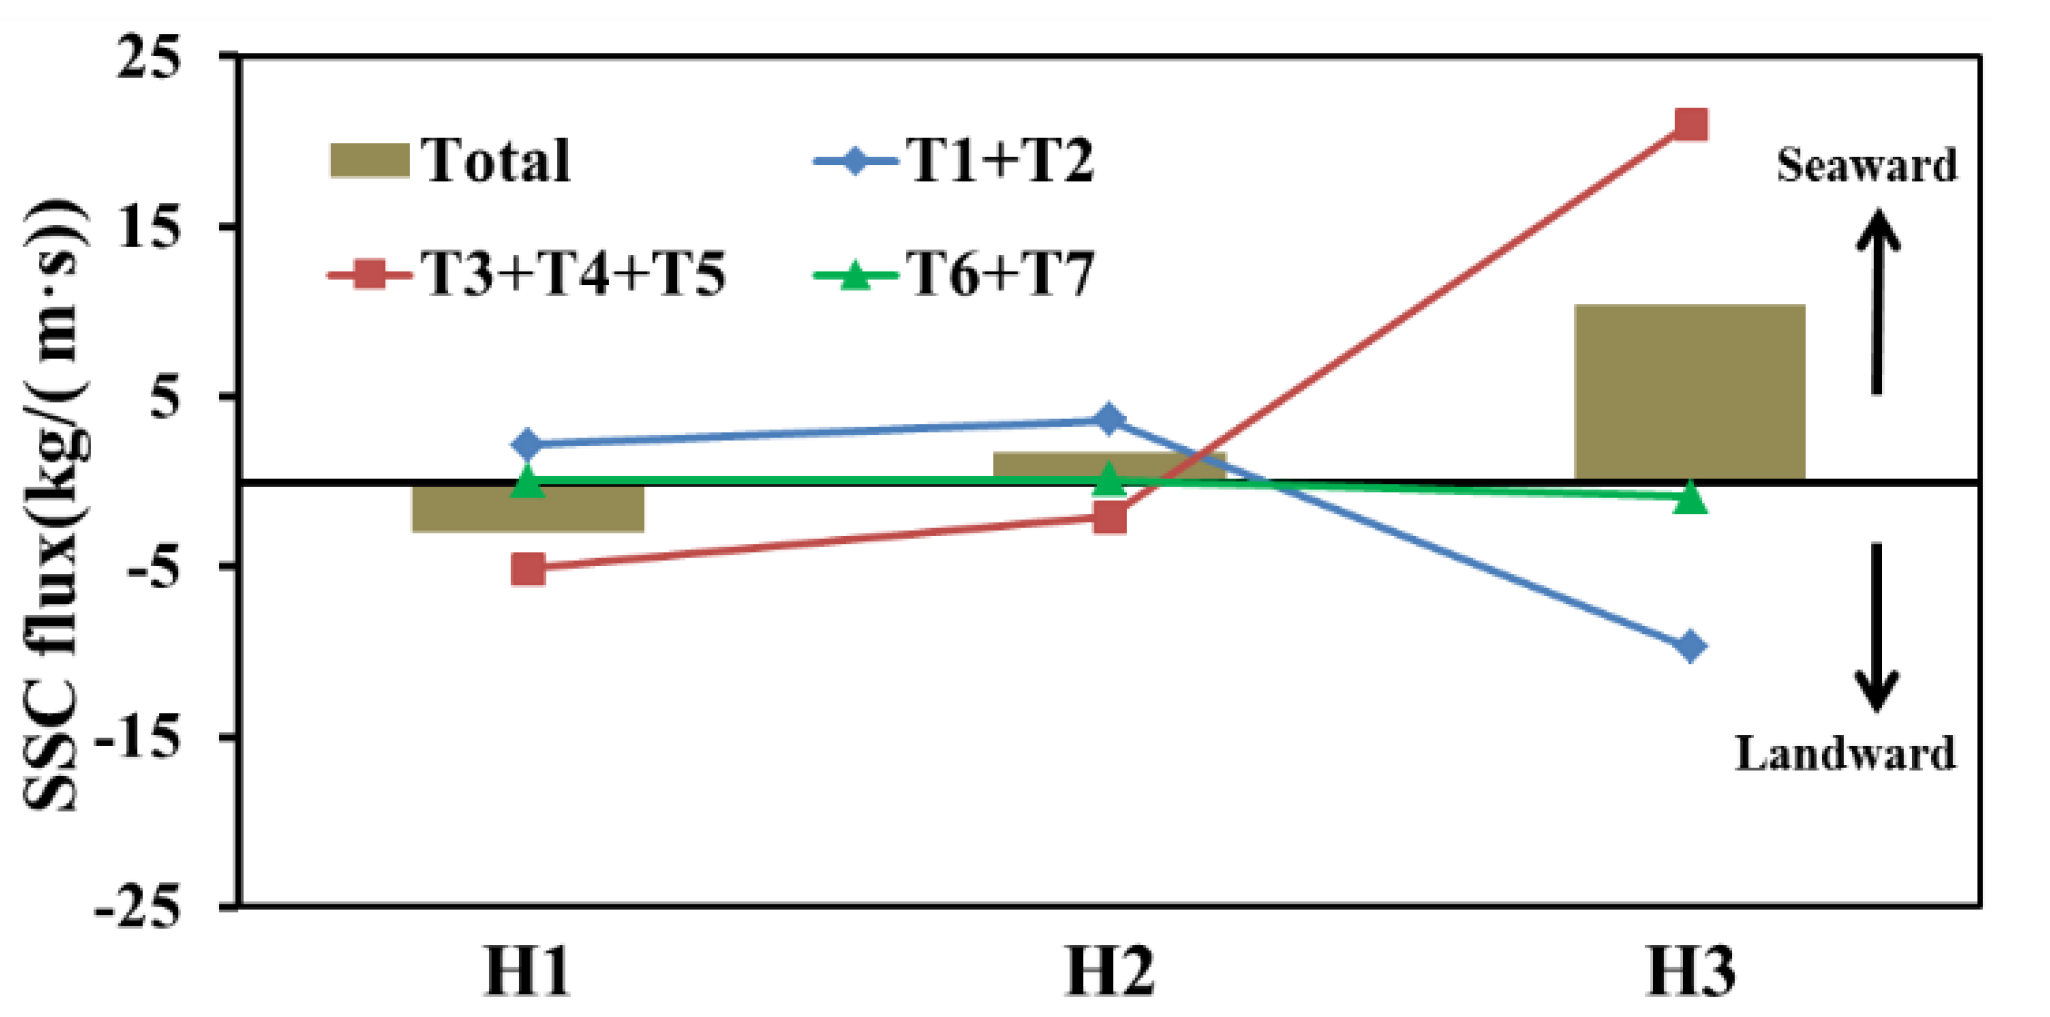
Based on formula (1), the contributions of unit-width sediment transport intensity and major sediment transport factors to the total transport amount within the spring, intermediate and neap tide cycles were computed (Table 2). The advection transport and tidal pumping transport were the major factors of suspended sediment transport in Hangzhou Bay, while the vertical circulation transport contributed little to the net sediment transport (Table 2). Additionally, the contribution of various factors of suspended sediment transport also varied among stations. For the stations H1 and H3, the tidal pumping transport had the greatest contribution, whereas for the station H2, advection transport was predominant (Figure 6).
4.3.1. Advection Transport
The sediment transport by advection, reflecting the roles of Euler and Stokes residual currents in transporting the suspended sediments, was constituted by factors T1 and T2. Overall, the intensity of advection transport at the three stations increased gradually with the tidal cycle from neap to spring tides (Table 2). For example, at the station H1, the intensity of advection transport was 1.5 kg/(m·s) during spring tides, which was six times that of the neap tide intensity of 0.24 kg/(m·s). Moreover, the sediment transport by advection was positive at both H1 and H2, while was negative at H3, indicating an opposite direction of sediment transport.
4.3.2. Tidal Pumping Transport
Within one tidal cycle, the variation of sediment concentration in the water body was attributed primarily to the periodic exchange of sediments between the water body and the bed. The sediment carrying capacity of tidal current changed with the strength of flood and ebb currents, leading to an asymmetric transport of bottom sediments within a tidal cycle during the exchange process (Figure 3). Meanwhile, a certain phase difference was present in the changing processes of sediment concentration and flow velocity (Figure 3). During the high and low tide periods, the sediments exchanged between bed and water body could not be offset completely within a tidal cycle, thereby resulting in net sediment transport, called the tidal pumping transport, consisting of T3, T4 and T5.
Regarding the direction of tidal pumping transport (Table 2), it could be observed that the sediment transport direction was kept consistent at each tidal cycle for all three stations, which was always opposite to the direction of advection transport as well. Within a tidal cycle, the sediments were transported landward at the stations H1 and H2, whereas they were transported seaward at the station H3. The intensity of tidal pumping transport also presented an upward trend with the tidal cycle, indicating the continuously strengthened exchange of sediments between bed and water body in Hangzhou Bay with the increasing tidal range. The two nearshore stations H1 and H3 exhibited high intensity of tidal pumping transport. Particularly, the southern station H3 had a total transport intensity of 21.06 kg/(m·s) within a tidal cycle (Table 2). This value was far greater than that at H2 in the central part of the research area, which was 1.91 kg/(m·s). This suggests that the sediment exchange between bed and water body is considerably more intense at the southern station H3 than at the central station H2.
4.3.3. Vertical Circulation Transport
Due to the vertical inconsistency in the direction and magnitude of residual currents and the uneven distribution of suspended sediment concentration vertically, the vertical circulation of sediment transport within tidal cycle was common. Given the shallow water depth, large tidal range and strong tidal current in Hangzhou Bay, the suspended sediments were well mixed vertically. Therefore, it can be concluded from Table 2 that compared to the advection and tidal pumping transport, the vertical circulation transport was smaller by 1–2 orders of magnitude, which made an extremely limited contribution to the net sediment transport.
4.3.4. Net Sediment Transport
Regarding the direction of unit width sediment transport within tidal cycles at the three stations, the northern station H1 transported sediments landward within tidal cycles, while the southern station H3 and the central station H2 transported sediments seaward (Figure 6). In other words, on the north side of Hangzhou Bay, the suspended sediments flew into Hangzhou Bay from the outer sea. In contrast, the situation was entirely the opposite on the south side of Hangzhou Bay, where the sediments were transported from the bay to the outer sea. Regarding the amount of sediment transport at the three stations, H3 exhibited the highest intensity of sediment transport within tidal cycles, with a total sediment transport of 10.43 kg/(m·s) (Table 2). For the station H1, its total sediment transport within tidal cycles was 2.92 kg/(m·s). Meanwhile, H2 showed the least total sediment transport within tidal cycles, with a value of 1.70 kg/(m·s) only (Figure 6 and Table 2).
4.3.5. Contribution Rates
From the perspective of the major contribution of sediment transport factors to the total transport amount, the advection and tidal pumping transports were predominant in the Central Hangzhou Bay, while the vertical circulation transport made little contribution (Figure 6 and Table 2). At the station H1, the contribution rate of the vertical circulation transport within tidal cycles was merely 1%. The advection and tidal pumping transports constituted the major factors of suspended sediment transport in the Central Hangzhou Bay. Nevertheless, the contribution rates of various suspended sediment transport factors varied among the stations.
At the central station H2, advection transport played a dominant role and was the primary contributing factor of sediment transport, followed by the tidal pumping transport (Table 2). The contribution of advection transport to sediment transport within tidal cycles at the station H2 was 1.8 times that of the tidal pumping transport. In contrast, at the northern station H1 and the southern station H3, the tidal pumping transport prevailed over the advection transport to become the primary contributing factor of sediment transport. The contribution of tidal pumping transport to sediment transport within tidal cycles was 2.4 times and 2.2 times that of the advection transport, at the station H1 and H3 respectively, indicating that the sediment exchange between bed and water body at the nearshore stations H1 and H3 is considerably more intense than that at the central station H2.
4.4. Bed Sediments
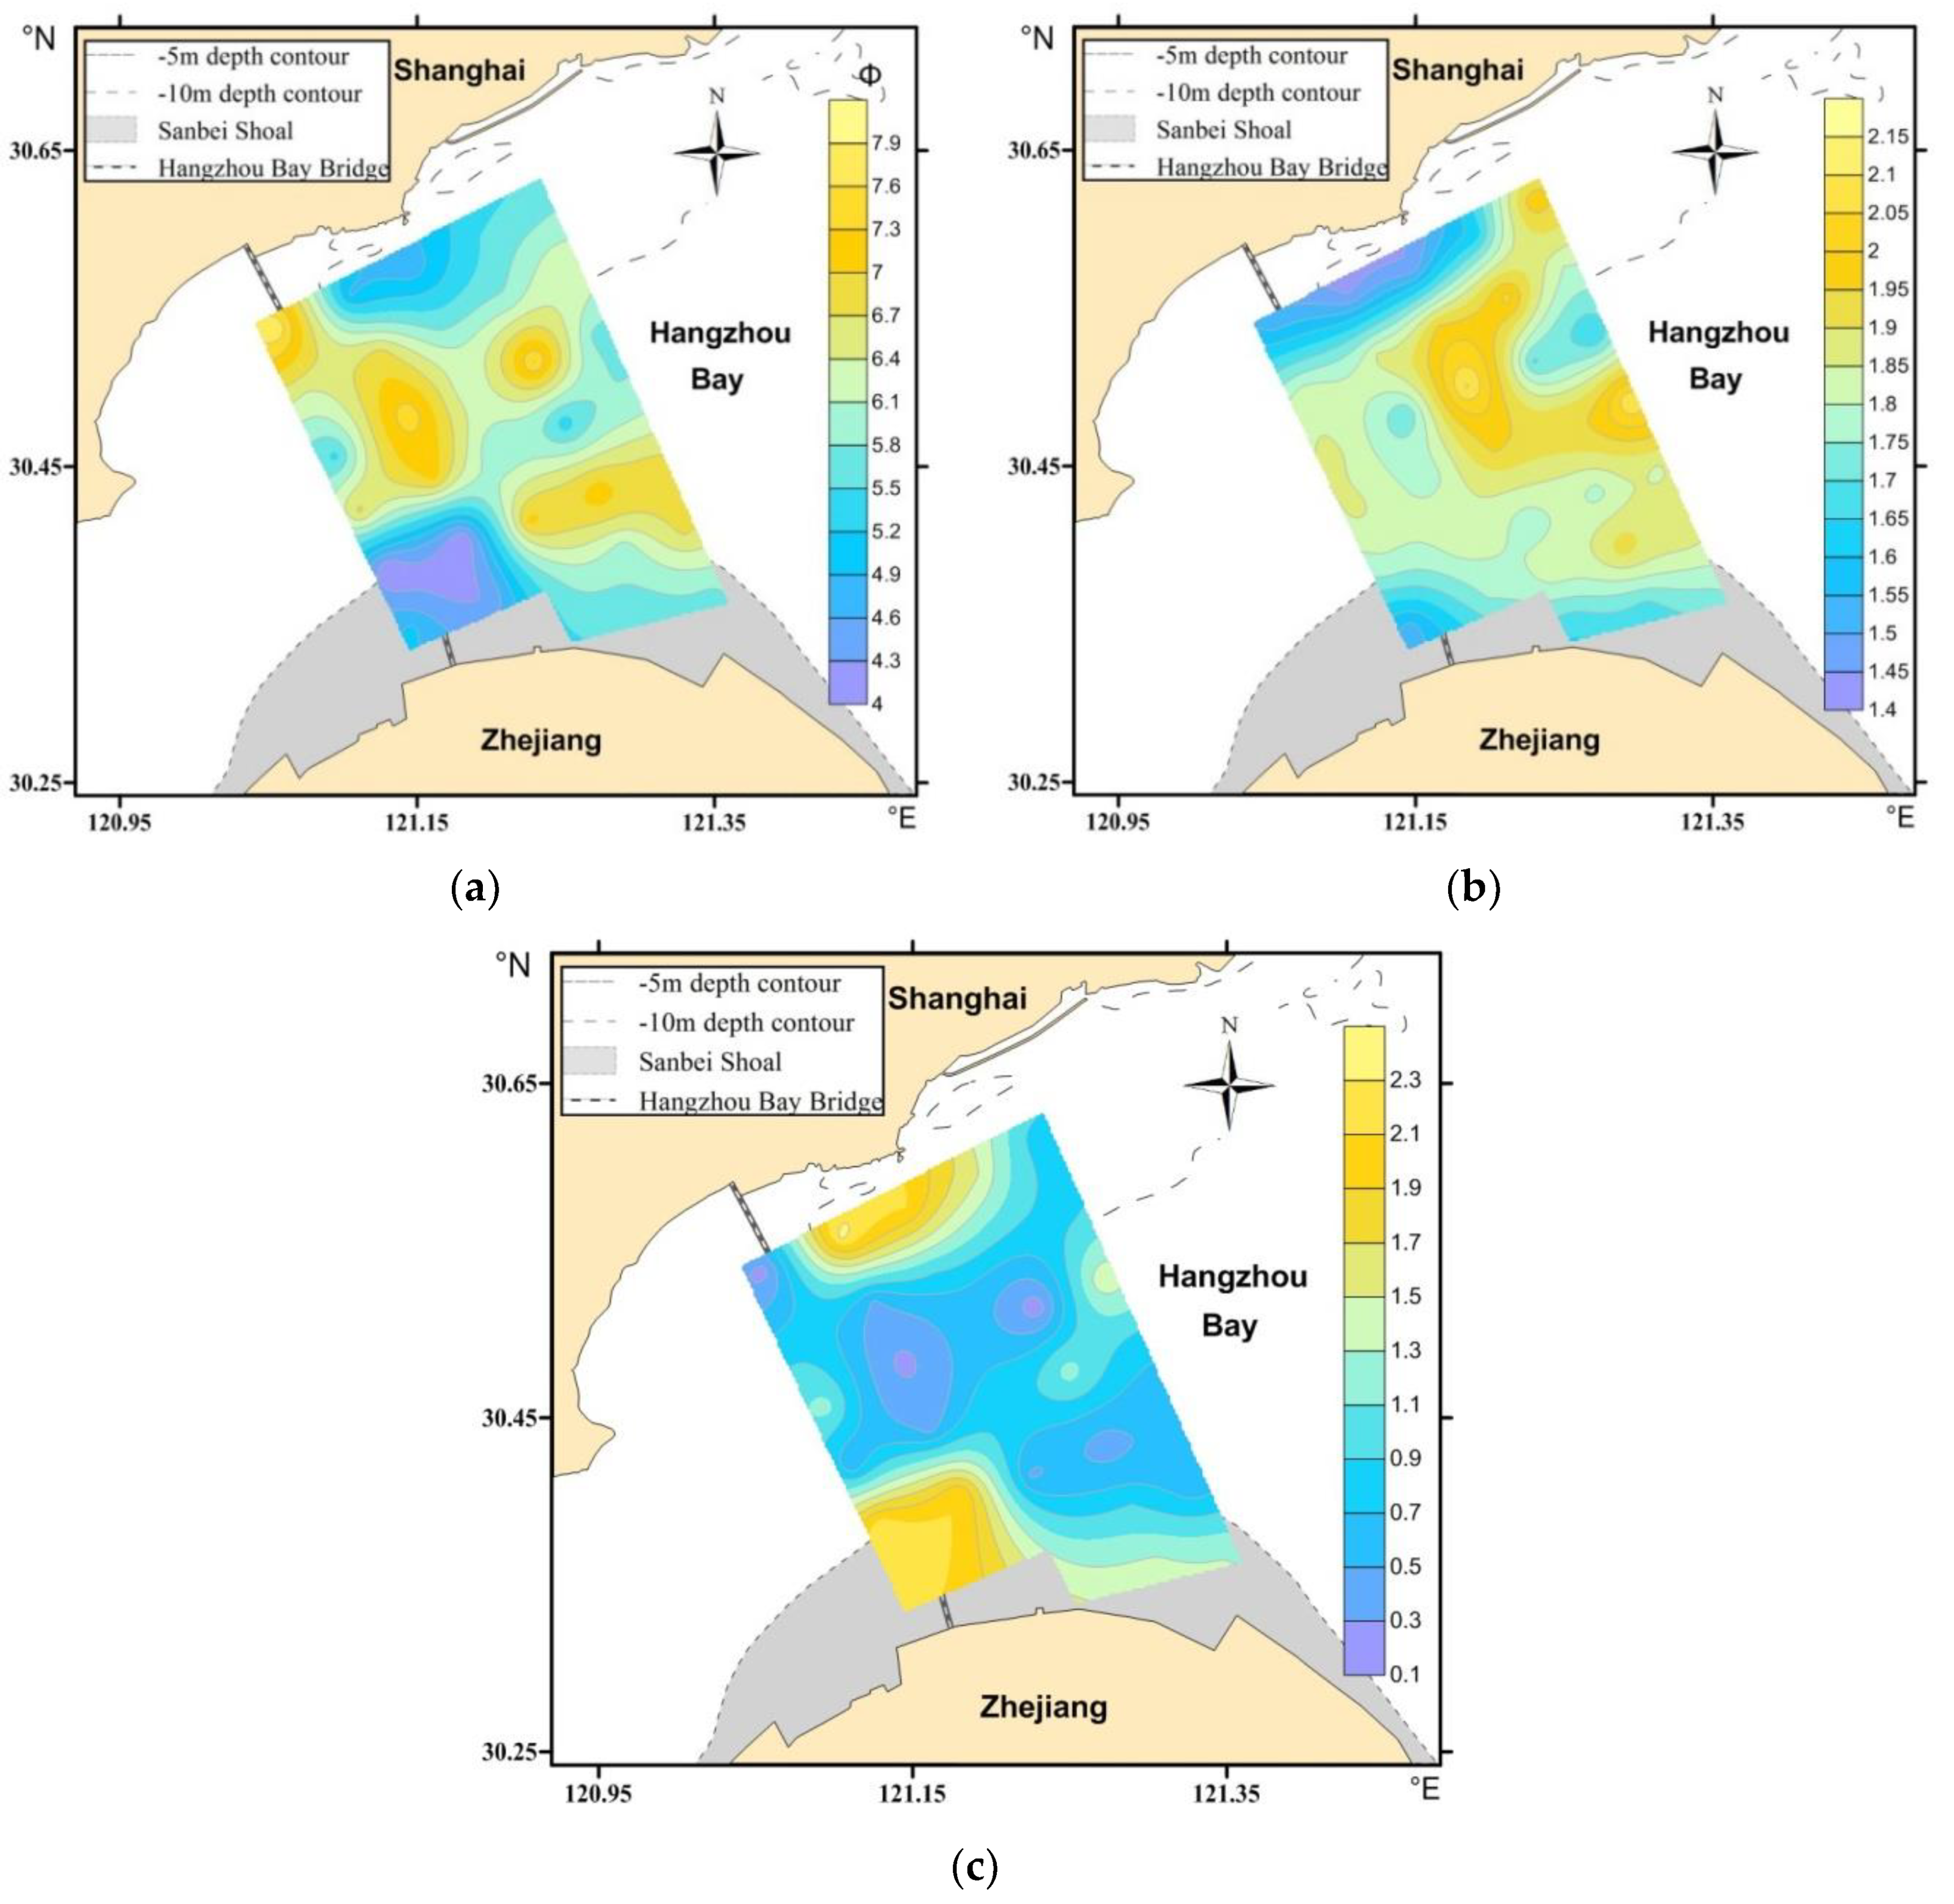
4.4.1. Distribution of Grain Size Parameters , and of Bed Sediments
The mean grain size represents the characteristics of the bed sediments directly, which is able to reflect the strength of dynamic environment. The mean grain size varied between 4 and 8 Φ (Figure 7a). Larger grain sizes were observed at the southwest corner near the Sanbei Shoal, where the water depth was the shallowest, along with the northeast corner of the Jinshan Trough, where the water depth was the deepest in the reach area. The sorting coefficient δ varied between 1.4 and 2.2 (Figure 7b). Similar to the distribution of , the value of δ was smaller near the banks, whereas it was larger in the middle. In contrast, the distribution of skewness displayed an opposite trend with that of . The largest value of over 2 was present at the north and southwest corners, while in the middle areas, the value was less than 1 (Figure 7c).
4.4.2. Sediment Transport Trends
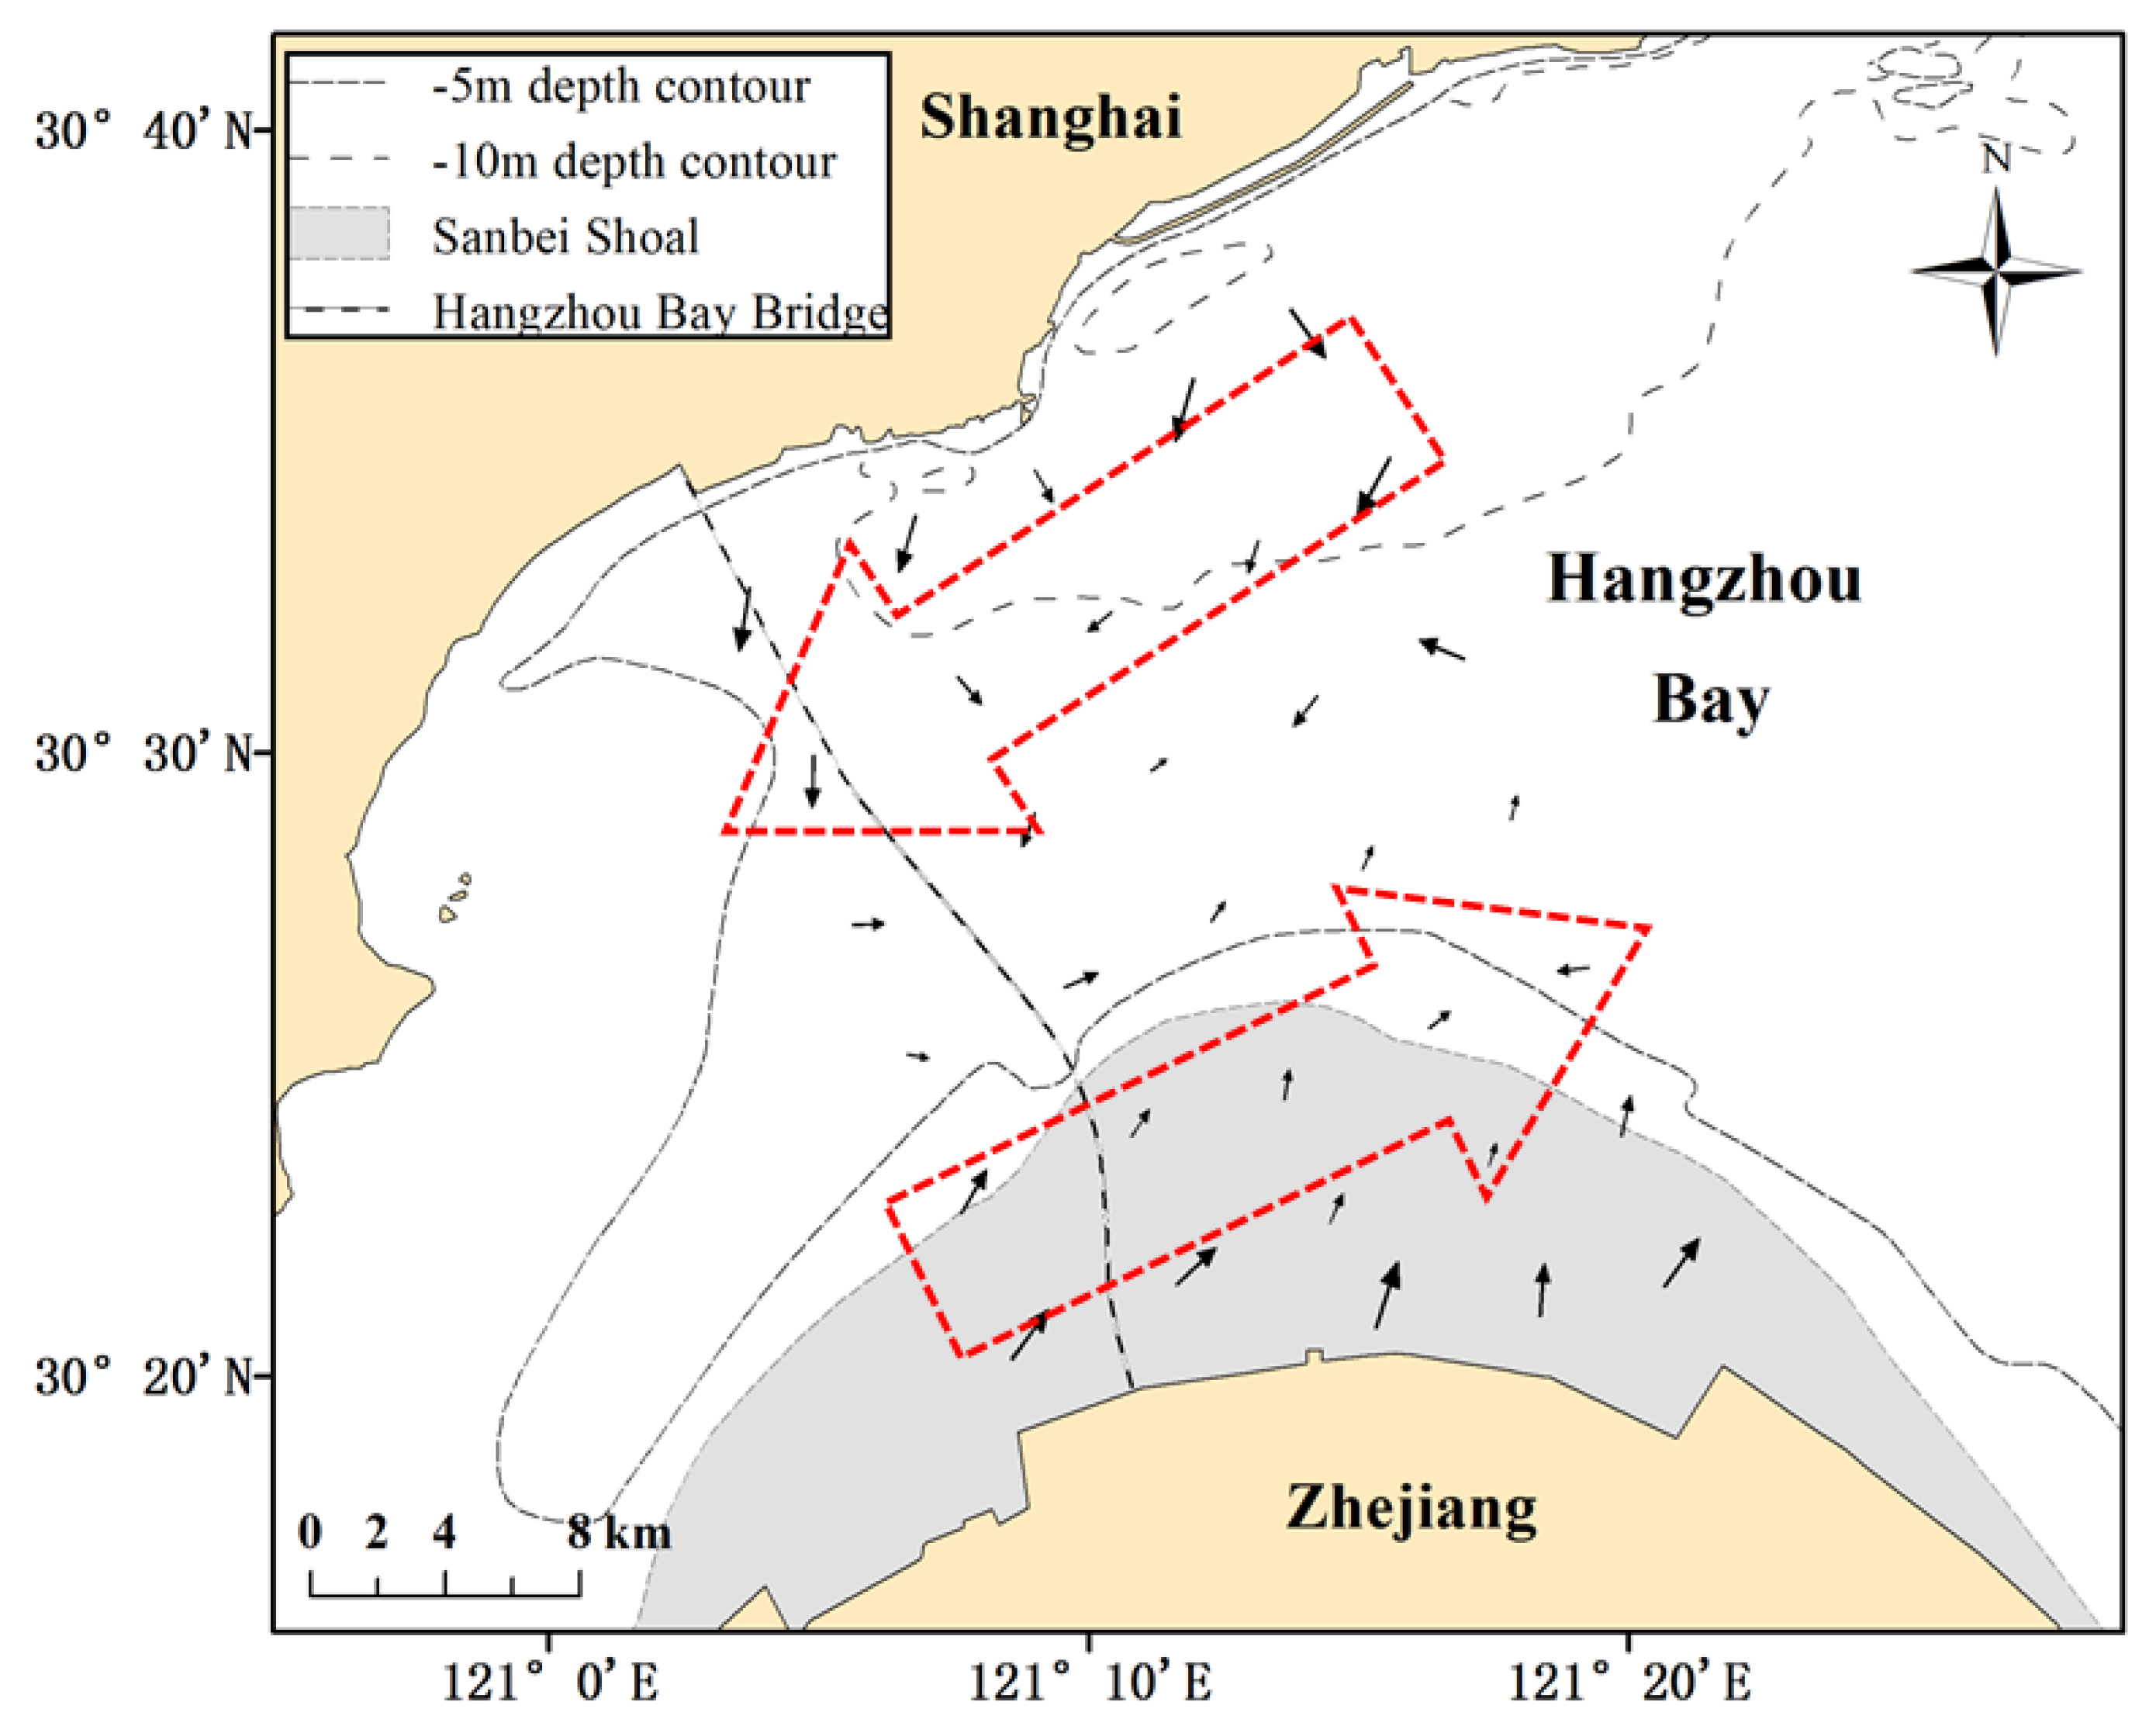
The Gao–Collins grain size trend analysis model was utilized to explore the sediment transport trends in the study area, where the characteristic distance was set at 5360 m (maximum sampling interval). The vectors for sediment transport trends in the Central Hangzhou Bay (Figure 8) were derived based on the results of Figure 7. The direction of the vectors represents the sediment transport direction, while the length of the vector represents the significance of grain size trend, rather than representing the magnitude of sediment transport rate.
Based on Figure 8, the surface sediments on the north side of Hangzhou Bay showed a transport trend from the outer sea to the bay head. The situation on the south side of the bay was the opposite, where a transport trend from the bay head to the outer sea was presented.
5. Discussion
5.1. Generation of Soft Mud Layer in Hangzhou Bay
Structural stratification of bottom sediments is the primary cause of the occurrence of two crests of sediment concentration during a tidal cycle in Central Hangzhou Bay. During the turn of the tidal current, the flow velocity declines and the flow turbulence weakens, resulting in the settling of suspended sediments [41,42]. Given the sorting function of the tidal current, the coarse-grained sediments settle faster, forming a layer of somewhat consolidated soft mud (soft mud layer) on the seabed. In contrast, due to the flocculation, the fine-grained sediments with a high viscosity settle slowly. Consequently, they would be released on the surface of the soft mud layer, forming an unconsolidated viscous layer that is called the fluid mud layer. Compared to the soft mud layer, the grain size of the fluid mud layer is finer, the viscosity higher and the sediment bulk density smaller. Thus, the fluid mud layer is more easily initiated and resuspended. The fluid mud phenomenon has been found to be present at the estuaries of the Gironde [43], Humber [44] and Changjiang rivers [45,46]. Moreover, Shi [42] also observed the presence of fluid mud at Hangzhou Bay. Therefore, according to the variation of SSC within the tidal cycles (Figure 3), we imply that it is highly connected to the generation of the fluid mud.
At the initial stage of flood or ebb tide following a turn of tidal current, the flow velocity begins to increase, and the erosive action of water body acts initially on the fluid mud layer (Figure 3). Due to high viscosity and unconsolidated characteristics, the fluid mud layer can be initiated and resuspended at low flow velocities. Thus, the erosion and resuspension of fluid mud layer within 1 to 2 h of the initial stage of flood or ebb tide form the first crest of SSC over the tidal cycle process. After the rapid erosion of the fluid mud layer, the soft mud layer below is exposed. Compared to the fluid mud layer, the erosion resistance of the soft mud layer increases abruptly, leading to the decrease of erosion rate, i.e., limiting the increase of SSC. Accordingly, the flow velocity increases, while the SSC decreases, reaching the trough 1 h later. Afterwards, with the further increase of flow velocity, the erosion rate of the soft mud layer increases, reaching the maximum at the moment of maximum flood or ebb flow. However, the second crest of SSC generally exits 1–2 h later, rather than at the maximum flow velocity. This is because although the flow is decreasing, the bed keeps being eroded due to the high flow velocity, which is called phase shift between the flow velocity and the bottom shear stress [47,48]. Therefore, the erosion and resuspension process of the soft mud layer is the primary contributing factor to the M-shaped hydrograph of the SSC.
Additionally, the second crest is found to be markedly larger than the first crest during the spring and intermediate tides, suggesting greater erosion and resuspension of the soft mud layer than the fluid mud layer. In contrast, during the neap tide, no significant difference is found between the first and second crests, suggesting approximative erosion and resuspension between the soft mud layer and the fluid mud layer. Xie et al. [13] revealed that due to the coastal embankment and sediment accumulation, the hydrograph of tides in the inner bay is changed; for example, the flood dominance is increased. Thus, the changed tides would further affect the suspended sediment transport, since it was found to be highly related to the erosion and deposition of the fluid mud layer. Due to data limitations, in this paper, it is difficult to quantify the effect of changed tides on the sediment transport attributed to coastal embankment, although it is confirmed to be a significant factor on sediment transport and morphology evolution. Hence, further work needs to be carried out on this, in order to provide guidance for decision-making process of major engineering projects in Hangzhou Bay.
5.2. Sediment Transport Mode in Hangzhou Bay
Through analyzing the suspended sediment transport flux and sediment grain size trend, it is found that Hangzhou Bay presents a “north-landward and south-seaward” trend, a “C”-shaped sediment transport mode macroscopically. To be specific, the sediments are transported from the bay mouth to the bay head on the north side of the bay and from the bay head to the bay mouth on the south side. The sediment transport by tidal pumping at H1 and H3 is the main contributing factor of sediment transport. This is attributed primarily to the “funnel-shaped” geomorphology of Hangzhou Bay, as well as the large tidal range and shallow water depth (the spring tidal range at station H3 is even greater than the mean water depth). Moreover, Hangzhou Bay has a semidiurnal tidal feature, with frequently alternating high and low tides and strong currents (the maximum mean vertical velocity is observed at the station H3 in this study, with a value of 3.25 m/s). Moreover, the grain size composition of sediments is also rather fine. Thus, the bottom sediments can be easily initiated and resuspended in the water body at the time of rapid flow. Even if the sediments fall to the bed during slack current, they will be uplifted by the following tidal currents without being compacted, thereby resulting in repeated transport of sediments.
5.3. Relationship between the Sediment Transport Mode and the Overall Erosion and Deposition in Hangzhou Bay
According to the study of Chen et al. [19], Hangzhou Bay has historically exhibited an evolution pattern of a scoured, receding north shore, and a silted south shore. The current work considers that the “C”-shaped sediment transport mode of Hangzhou Bay decides its evolution pattern, i.e., south shore silting and north shore scouring.
The north shore of Hangzhou Bay closely adjoins the Changjiang River Estuary. Through the comparative analysis of heavy mineral contents, Cao et al. [49] and Liu et al. [20] found that the sediments in Hangzhou Bay came mainly from the Changjiang River Estuary. During the southward diffusion, the runoff from the Changjiang River into the sea entered Hangzhou Bay initially along its north shore with the flood tide process of the bay. At this point, during the advancement of the water body with low sediment concentration into the bay along the north shore, the water flow was concentrated due to the narrowing of the bay mouth. The flow velocity increased and the sediment carrying capacity of the water body was enhanced during flood tides. Moreover, the bottom sediments initiated quickly, forming a water body with high sediment concentration, and transported towards the bay head resulting in scouring on the north bay shore. In ebb tide periods, during the recession of water body with high sediment concentration at the bay head towards the outer sea, when the ebb tide water with strong sediment carrying capacity and high sediment concentration flew through the Andong Shoal on the south bay shore, the entrance of the bay widened suddenly and the water depth shallowed due to the presence of the Andong Shoal. The ebb current was diffused and the sediment carrying capacity decreased. Thus, the suspended sediments were deposited, resulting in the continuous siltation on the south shore of Hangzhou Bay. In summary, the “C”-shaped transport mode and the narrow-head wide-mouth geomorphology determine the evolution pattern of silted south shore and scoured north shore for Hangzhou Bay.
5.4. Mechanism of Hydrodynamics on Controlling Sediment Transport in Hangzhou Bay
It is universally acknowledged that in bays, the shear forces resulting from tidal currents and waves act on the bed surface to suspend and settle sediments, which is the primary dynamic condition leading to the exchange between bed material and suspended sediments [50]. A study carried out by Nidzieko and Ralston [51] stated that in estuary bays without significant runoff impact, the asymmetry of flood and ebb currents determines the net transport direction of masses, which is an important dynamic mechanism for net mass transport. In the present study, the statistical method-based “skewness” () proposed by Nidzieko and Ralston [51] is used to analyze the asymmetry of tidal currents in Hangzhou Bay, which can be computed as follows:
where the m-th origin moment is defined as:
In the formula, denotes the flow velocity at the i-th moment; and N denotes the total number of flow velocity samples. We set the ebb current as positive, and the flood current as negative. Thus, if , it indicates that the ebb current is dominant, and if , it indicates that the flood current is dominant.
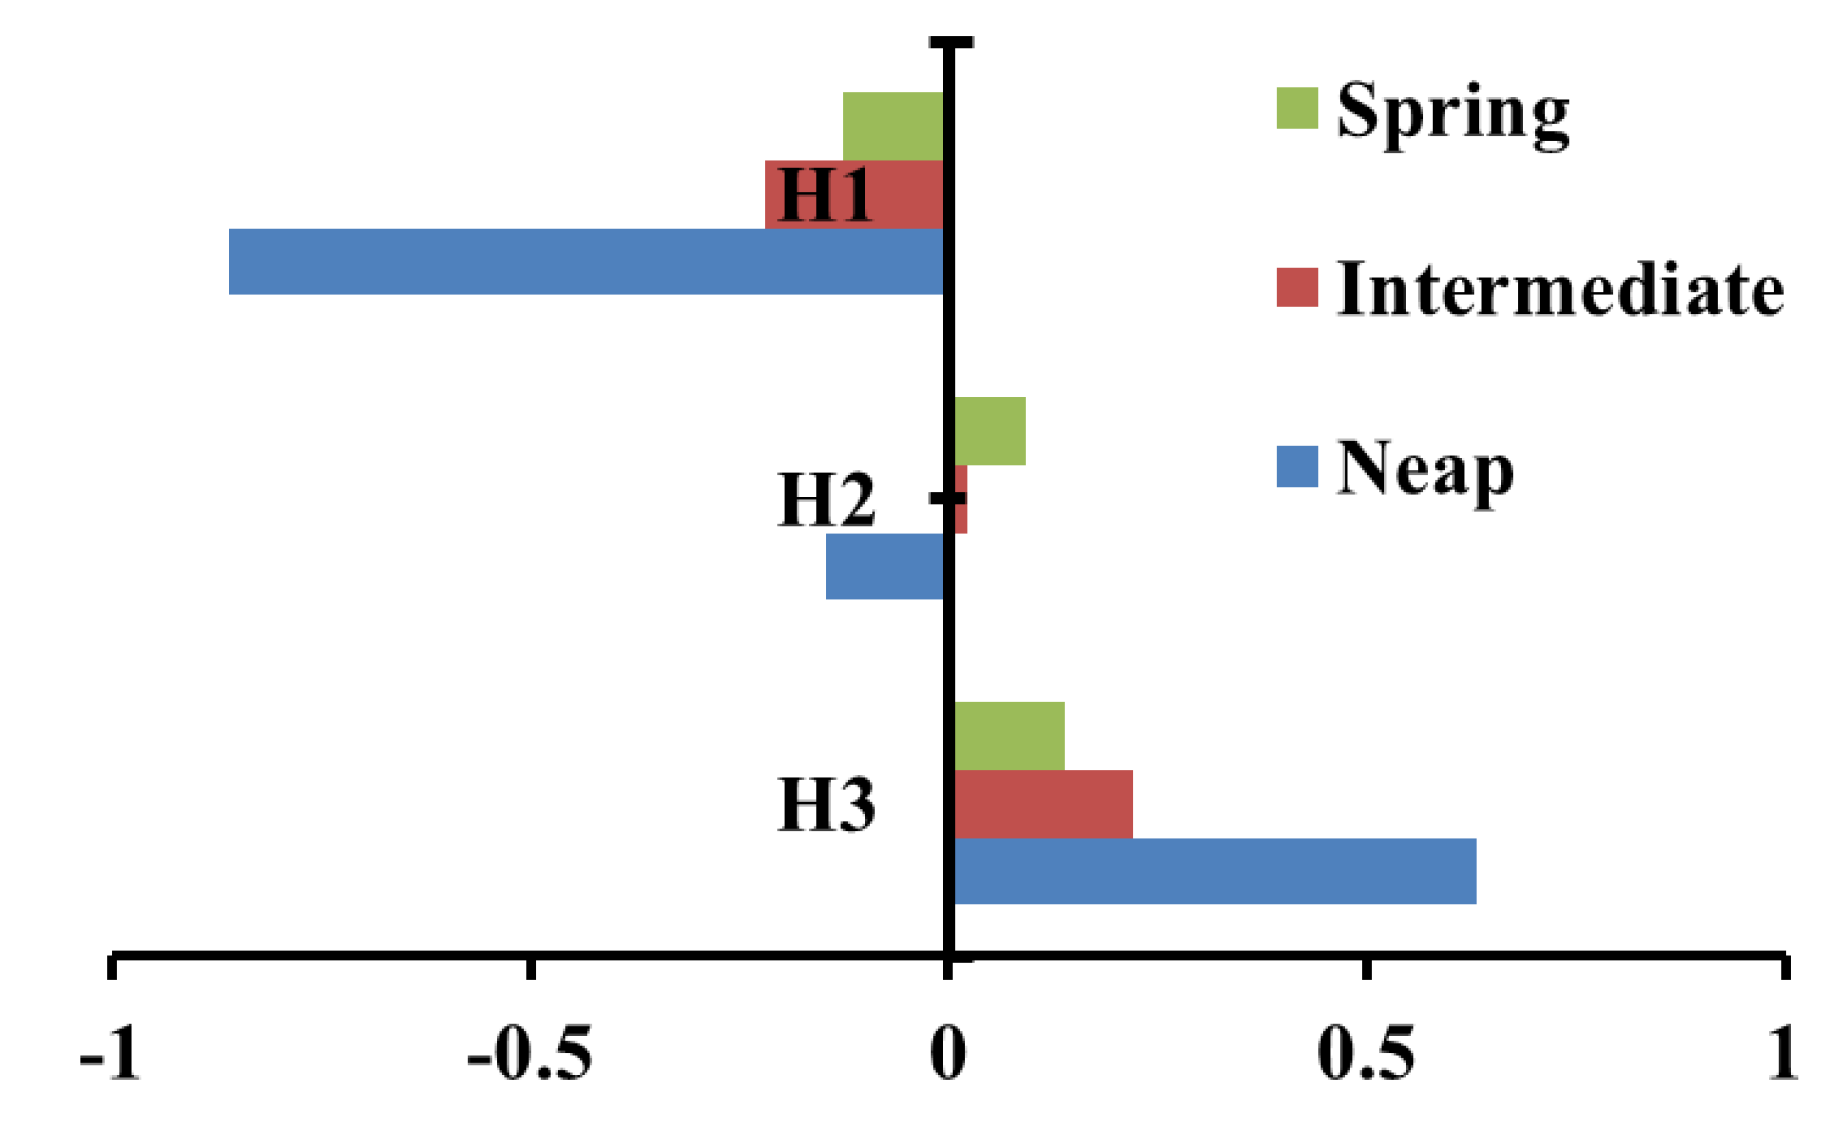
The skewness values of flow velocity during the spring, intermediate and neap tides are calculated according to the formula (2) for the stations H1, H2 and H3 in the Central Hangzhou Bay, as shown in Figure 9. Clearly, the skewness values of the station H1 were negative, indicating that the north side of Hangzhou Bay is dominated by the flood current. For the station H2, the flow velocity is positively skewed during the spring and intermediate tides, whereas it is negatively skewed during the neap tide, without showing a unified predominant direction of tidal currents. Nevertheless, the absolute values of skewness are small, suggesting a mild degree of asymmetry in the flood and ebb currents at H2. As for the station H3, the skewness values are positive, indicating that the south side of Hangzhou Bay is dominated by ebb current. This finding is consistent with the result of the “C”-shaped transport mode derived above in this study. Hence, this paper argues that the asymmetry of flood and ebb currents on the south versus north sides of Hangzhou Bay is the main dynamic mechanism leading to the overall “C”-shaped transport mode of sediments in the bay.
6. Conclusions
Based on the 2013 field survey data of hydrology, suspended and bottom sediments in the Central Hangzhou Bay, this study explored the dynamic mechanism of suspended sediments, as well as the migration trends of bed sediments.
The M-shaped hydrograph of suspended sediment concentration primarily attributes to the generation of both soft mud and fluid mud layers. Meanwhile, the erosion and resuspension of the fluid mud layer is the first-order control on the second peak of the M shape. Xie et al. [13] proved that the coastal embankment and sediment accumulation changed the characteristics of tides in Hangzhou Bay. Therefore, the changed tides would affect the shape of the suspended sediment concentration hydrograph, and thereby the suspended sediment transport and morphology evolution. Hence, further work needs to be completed on this, in order to provide guidance for decision-making processes of major engineering projects in Hangzhou Bay.
Hangzhou Bay presents a “north-landward and south-seaward” trend, a “C”-shaped sediment transport mode, due to the unbalance of flood and ebb currents laterally—the flood current prevalence on the north and the ebb current prevalence on the south. Coupled with the narrow-head, wide-mouth geomorphology, Hangzhou Bay remains evolving by south shore silting and north shore scouring.
Author Contributions
Conceptualization, Z.S. and H.H.; Data curation, Z.S. and J.Z.; Formal analysis, Z.S.; Investigation, W.S. and F.Z.; Methodology, Z.S. and H.H.; Resources, W.S., J.Z., F.Z. and X.X.; Supervision, H.H.; Validation, H.H.; Visualization, Z.S.; Writing—original draft, Z.S.; Writing—review & editing, H.H. All authors have read and agreed to the published version of the manuscript.
Funding
This research was funded by National Key R&D Program of China (Grant Number: 2018YFB1501901).
Conflicts of Interest
The authors declare no conflict of interest.
References
- Chen, G.; Huang, J. Comprehensive utilization of the estuary and coastal zone of China. Water Resour. Hydropower Eng. 2001, 1, 38–42. (In Chinese) [Google Scholar]
- Erica, G. Fortresses of mud: How to protect the San Francisco Bay Area from rising seas. Nature 2018, 562, 178–180. [Google Scholar]
- Dai, Z.; Liu, J.T.; Xie, H.; Shi, W. Sedimentation in the Outer Hangzhou Bay, China: The Influence of Changjiang Sediment Load. J. Coast. Res. 2014, 30, 1218–1225. [Google Scholar] [CrossRef]
- Talke, S.A.; de Swart, H.E.; Schuttelaars, H.M. Feedback between residual circulations and sediment distribution in highly turbid estuaries: An analytical model. Cont. Shelf Res. 2009, 29, 119–135. [Google Scholar] [CrossRef] [Green Version]
- Wei, W.; Dai, Z.; Mei, X.; Liu, J.P.; Gao, S.; Li, S. Shoal morphodynamics of the Changjiang (Yangtze) estuary: Influences from river damming, estuarine hydraulic engineering and reclamation projects. Mar. Geol. 2017, 386, 32–43. [Google Scholar] [CrossRef]
- Guo, L.; Su, N.; Zhu, C.; He, Q. How have the river discharges and sediment loads changed in the Changjiang River basin downstream of the Three Gorges Dam? J. Hydrol. 2018, 560, 259–274. [Google Scholar] [CrossRef] [Green Version]
- Yang, S.; Milliman, J.D.; Xu, K.; Deng, B.; Zhang, X.; Luo, X. Downstream sedimentary and geomorphic impacts of the Three Gorges Dam on the Yangtze River. Earth-Sci. Rev. 2014, 138, 469–486. [Google Scholar] [CrossRef]
- Zhu, L.; He, Q.; Shen, J.; Wang, Y. The influence of human activities on morphodynamics and alteration of sediment source and sink in the Changjiang Estuary. Geomorphology 2016, 273, 52–62. [Google Scholar] [CrossRef]
- Yang, S.; Li, M.; Dai, S.; Liu, Z.; Zhang, J.; Ding, P. Drastic decrease in sediment supply from the Yangtze River and its challenge to coastal wetland management. Geophys. Res. Lett. 2006, 33, L06408. [Google Scholar] [CrossRef]
- Cheng, H.; Chen, J.; Chen, Z.; Ruan, R.; Xu, G.; Zeng, G.; Zhu, J.; Dai, Z.; Chen, X.; Gu, S.; et al. Mapping Sea Level Rise Behavior in an Estuarine Delta System: A Case Study along the Shanghai Coast. Engineering 2018, 4, 156–163. [Google Scholar] [CrossRef]
- Li, Z.; Wang, Y.; Cheng, P.; Zhang, G.; Jiufa, L. Flood-ebb asymmetry in current velocity and suspended sediment transport in the Changjiang Estuary. Acta Oceanol. Sin. 2016, 35, 37–47. [Google Scholar] [CrossRef]
- Hu, Y.; Yu, Z.; Zhou, B.; Li, Y.; Yin, S.; He, X.; Peng, X.; Shum, C.K. Tidal-driven variation of suspended sediment in Hangzhou Bay based on GOCI data. Int. J. Appl. Earth Observ. Geoinf. 2019, 82, 101920. [Google Scholar] [CrossRef]
- Xie, D.; Pan, C.; Wu, X.; Gao, S.; Wang, Z. Local human activities overwhelm decreased sediment supply from the Changjiang River: Continued rapid accumulation in the Hangzhou Bay-Qiantang Estuary system. Mar. Geol. 2017, 392, 66–77. [Google Scholar] [CrossRef]
- Xie, D.; Gao, S.; Wang, Z.; Pan, C. Numerical modeling of tidal currents, sediment transport and morphological evolution in Hangzhou Bay, China. Int. J. Sediment Res. 2013, 28, 316–328. [Google Scholar] [CrossRef]
- Zhu, L.; Hu, R.; Zhu, H.; Jiang, S.; Xu, Y.; Wang, N. Modeling studies of tidal dynamics and the associated responses to coastline changes in the Bohai Sea, China. Ocean Dyn. 2018, 68, 1625–1648. [Google Scholar] [CrossRef]
- Milliman, J.D.; Chen, H.; Yang, Z.; Meade, R.H. Transport and Deposition of River Sediment in the Changjiang Estuary and Adjacent Continental Shelf. Cont. Shelf Res. 1985, 4, 37–45. [Google Scholar] [CrossRef]
- Wei, W.; Mei, X.; Dai, Z.; Tang, Z. Recent morphodynamic evolution of the largest uninhibited island in the Yangtze (Changjiang) estuary during 1998–2014: Influence of the anthropogenic interference. Cont. Shelf Res. 2016, 124, 83–94. [Google Scholar] [CrossRef] [Green Version]
- Su, J.; Wang, K. Changjiang river plume and suspended sediment transport in Hangzhou Bay. Cont. Shelf Res. 1989, 9, 93–111. [Google Scholar]
- Chen, J.; Liu, C.; Zhang, C.; Walker, H.J. Geomorphological Development and Sedimentation in Qiantang Estuary and Hangzhou Bay. J. Coast. Res. 1990, 6, 559–572. [Google Scholar]
- Liu, Y.F.; Chen, S.L.; Cai, T.L.; Jia, J.J.; Xia, X.M. Morphological evolution and forecast of Jinshan Trough in the Hangzhou Bay of China. Mar. Sci. Bull. 2017, 36, 284–292. (In Chinese) [Google Scholar]
- Xie, D.; Wang, Z.; Gao, S.; Vriend, H.J.D. Modeling the tidal channel morphodynamics in a macro-tidal embayment, Hangzhou Bay, China. Cont. Shelf Res. 2009, 29, 1757–1767. [Google Scholar] [CrossRef]
- Yang, S.; Zhao, Q.; Zhu, J. Possible influence of the South-to-North Water Diversion Project on the evolvement of the Yangtze delta. Shanghai Geol. 2001, 2, 7–11. (In Chinese) [Google Scholar]
- Liu, S.; Zhong, G.; Kuang, C.; Sun, B.; Gou, H.; Huang, W. Effects of South-To-North Water Transfer Project on Salinity Intrusion in Yangtze Estuary. Coast. Hazards 2013, 119–128. [Google Scholar]
- Yang, Z.; Wang, H.; Saito, Y.; Milliman, J.D.; Xu, K.; Qiao, S.; Shi, G. Dam impacts on the Changjiang (Yangtze) River sediment discharge to the sea: The past 55 years and after the Three Gorges Dam. Water Resour. Res. 2006, 42, W04407. [Google Scholar] [CrossRef]
- Zhu, B.; Li, Y.; YU, W.; Sun, Z.; Deng, J.; Chai, Y.; Zhang, C. An Analysis of the Processes and Trends of Changes in Yangtze River Water and Sediment Fluxes into the Ocean. Resour. Environ. Yangtze Basin 2019, 28, 2980–2991. (In Chinese) [Google Scholar] [CrossRef]
- Yu, J.; Cao, Y. Sediment deposition after regulation and reclaiming of Qiantang Estuary. J. Sediment Res. 2006, 01, 17–24. (In Chinese) [Google Scholar]
- Pan, C.; Han, Z. Regulation of Qiantang River estuary and scientific and technological innovations. China Water Resour. 2011, 10, 19–22. (In Chinese) [Google Scholar]
- Xie, D.; Pan, C.; Wu, X.; Gao, S.; Wang, Z. The variations of sediment transport patterns in the outer Changjiang Estuary and Hangzhou Bay over the last 30 years. J. Geophys. Res. Oceans 2017, 122, 2999–3020. [Google Scholar] [CrossRef] [Green Version]
- Mcmanus, J. Grain size determination and interpretation. In Techniques in Sedimentology; Tucker, M., Ed.; Blackwell Scientific Publications: Oxford, UK, 1988; pp. 63–83. [Google Scholar]
- Dyer, K.R. The salt balance in stratified estuaries. Estuar. Coast. Mar. Sci. 1974, 2, 273–281. [Google Scholar] [CrossRef]
- Zhong, W.; Zhu, L.; Dong, P.; Hu, R.; Wu, J.; Zhu, Y.; Duan, H. Mechanisms of sediment trapping in coastal embayments off the Shandong Peninsula in summer—A case study in Weihai Bay. Estuar. Coast. Shelf Sci. 2020, 236, 106623. [Google Scholar] [CrossRef]
- Hua, X.; Huang, H.; Wang, Y.; Lan, Y.; Zha, K.; Chen, D. Abnormal ETM in the North Passage of the Changjiang River Estuary: Observations in the wet and dry seasons of 2016. Estuar. Coast. Shelf Sci. 2019, 227, 106334. [Google Scholar] [CrossRef]
- Li, X.; Zhu, J.; Yuan, R.; Qiu, C.; Wu, H. Sediment trapping in the Changjiang Estuary: Observations in the North Passage over a spring-neap tidal cycle. Estuar. Coast. Shelf Sci. 2016, 177, 8–19. [Google Scholar] [CrossRef]
- Gao, S.; Collins, M.B. Analysis of Grain Size Trends, for Defining Sediment Transport Pathways in Marine Environments. J. Coast. Res. 1994, 10, 70–78. [Google Scholar]
- Qiao, S.; Shi, X.; Wang, G.; Yang, G.; Hu, N.; Liu, S.; Liu, Y.; Zhu, A.; Li, C. Discussion on grain-size characteristics of seafloor sediment and transport pattern in the Bohai Sea. Haiyang Xuebao 2010, 32, 139–147. (In Chinese) [Google Scholar]
- Wang, G.; Shi, X.; Liu, Y.; Wang, K. Grain-size trend analysis on the south branch of the Changjiang Estuary in China and its implication. Haiyang Xuebao 2007, 29, 161–166. (In Chinese) [Google Scholar]
- Wang, H.; Gao, S. Tidal flat sediment characteristics and transport trends along the northern bank of Hangzhou bay. Mar. Geol. Quat. Geol. 2007, 27, 25–30. (In Chinese) [Google Scholar]
- Gao, S.; Collins, M. Net sediment transport patterns inferred from grain-size trends, based upon definition of “transport vectors”. Sediment. Geol. 1992, 81, 47–60. [Google Scholar] [CrossRef]
- Wang, Y.; Gao, S.; Jia, J. Sediment Distribution and Transport Patterns in Jiaozhou Bay and Adjoining Areas. Acta Geophys. Sin. 2000, 67, 449–458. (In Chinese) [Google Scholar]
- Shen, Q.; Gao, Q.; Gu, F.; Qi, D. Analysis of the sediment motion at north passage in flood and dry season after 3rd phase engineering of the deep waterways in Changjiang Estuary. Acta Oceanol. Sin. 2014, 36, 118–124. (In Chinese) [Google Scholar]
- Hu, H.; Wei, T.; Yang, Z.; Hackney, C.R.; Parsons, D.R. Low-angle dunes in the Changjiang (Yangtze) Estuary: Flow and sediment dynamics under tidal influence. Estuar. Coast. Shelf Sci. 2018, 205, 110–122. [Google Scholar] [CrossRef]
- Shi, Z. Observation of fluid in the deepwater navigational channel of Hangzhou Bay. Mar. Sci. Bull. 2001, 06, 40–50. (In Chinese) [Google Scholar]
- Abril, G.; Etcheber, H.; Hir, P.L.; Bassoullet, P.; Boutier, B.; Frankignoulle, M. Oxic/Anoxic Oscillations and Organic Carbon Mineralization in an Estuarine Maximum Turbidity Zone (The Gironde, France). Limnol. Oceanogr. 1999, 44, 1304–1315. [Google Scholar] [CrossRef] [Green Version]
- Uncles, R.J.; Stephens, J.A.; Harris, C. Runoff and tidal influences on the estuarine turbidity maximum of a highly turbid system: The upper Humber and Ouse Estuary, UK. Mar. Geol. 2006, 235, 213–228. [Google Scholar] [CrossRef]
- Liu, G.; Zhu, J.; Wang, Y.; Hui, W.; Wu, J. Tripod measured residual currents and sediment flux: Impacts on the silting of the Deepwater Navigation Channel in the Changjiang Estuary. Estuar. Coast. Shelf Sci. 2011, 93, 192–201. [Google Scholar] [CrossRef]
- Dalrymple, R.W. Sedimentary Facies and Stratigraphy of the Changjiang (Yangtze River) Delta. In Proceedings of the AGU Fall Meeting, New Orleans, LA, USA, 11–15 December 2017. [Google Scholar]
- Hu, H.; Cheng, H.; Wei, T.; Yang, Z. Measuring bed load with an acoustic Doppler current profiler in Changjiang Estuary. J. Sediment Res. 2015, 05, 1–6. (In Chinese) [Google Scholar]
- Antunes, D.C.; José, S.; Temperville, A.; Seabra-Santos, F.J. Bottom friction and time-dependent shear stress for wave-current interaction. J. Hydraul. Res. 2003, 41, 27–37. [Google Scholar] [CrossRef]
- Cao, P.; Gu, G.; Dong, Y.; Hu, F. Basic Characteristics of Sediment Transport in Hangzhou Bay. J. East China Norm. Univ. 1985, 3, 75–84. (In Chinese) [Google Scholar]
- Gao, S.; Wang, D.; Yang, Y.; Zhou, L.; Zhao, Y.; Gao, W.; Han, Z.; Yu, Q.; Li, G. Holocene sedimentary systems on a broad continental shelf with abundant river input: Process-product relationships. Geol. Soc. Lond. Spec. Publ. 2016, 429, 223–259. [Google Scholar] [CrossRef]
- Nidzieko, N.J.; Ralston, D.K. Tidal asymmetry and velocity skew over tidal flats and shallow channels within a macrotidal river delta. J. Geophys. Res. Oceans 2012, 117, C03001. [Google Scholar] [CrossRef] [Green Version]
Figure 1.
(a) Location of the study area. (b) Sketch of Hangzhou Bay and the measurement sites.

Figure 2.
Temporal variations of the current velocity (positive indicates ebb) at H1 H2 H3. Spring tide (a,d,g), intermediate tide (b,e,h), neap tide (c,f,i).
Figure 2.
Temporal variations of the current velocity (positive indicates ebb) at H1 H2 H3. Spring tide (a,d,g), intermediate tide (b,e,h), neap tide (c,f,i).

Figure 3.
The variations of the depth-averaged velocity (black line) and depth-averaged SSC (red line) at three stations in spring tide (left column), intermediate tide (middle column), and neap tide (right column). The gray area indicates the flood tide, whereas white area indicates the ebb tide.
Figure 3.
The variations of the depth-averaged velocity (black line) and depth-averaged SSC (red line) at three stations in spring tide (left column), intermediate tide (middle column), and neap tide (right column). The gray area indicates the flood tide, whereas white area indicates the ebb tide.

Figure 4.
Variation of tidal mean SSC from spring tide to neap tide.

Figure 5.
Correlation between tidal mean SSC and tidal mean velocity.

Figure 6.
Components of total net suspended sediment fluxes at the three stations. T1 + T2 is the advection term, T3 + T4 + T5 is the tidal pumping term; and T6 + T7 is the vertical circulation term.
Figure 6.
Components of total net suspended sediment fluxes at the three stations. T1 + T2 is the advection term, T3 + T4 + T5 is the tidal pumping term; and T6 + T7 is the vertical circulation term.

Figure 7.
Distributions of (a) mean grain size (), (b) sorting coefficient () and (c) skewness () of surficial bed sediment in the Central Hangzhou Bay.
Figure 7.
Distributions of (a) mean grain size (), (b) sorting coefficient () and (c) skewness () of surficial bed sediment in the Central Hangzhou Bay.

Figure 8.
Distribution of sediment transport vector in the middle of Hangzhou Bay. The black arrows represent the computational results of sampling points, and the red dotted arrows are the macroscopic transport diagrams of sediments.
Figure 8.
Distribution of sediment transport vector in the middle of Hangzhou Bay. The black arrows represent the computational results of sampling points, and the red dotted arrows are the macroscopic transport diagrams of sediments.

Figure 9.
The tidal current skewness () at three stations.


Table 1.
The current velocity (m/s) statistics at three stations.
| Station No. | Statistics | Spring Tide | Intermediate Tide | Neap Tide |
|---|---|---|---|---|
| H1 | Average | 0.93 | 0.86 | 0.50 |
| Max | 1.76 | 1.66 | 0.96 | |
| H2 | Average | 1.15 | 1.05 | 0.53 |
| Max | 2.03 | 1.91 | 1.07 | |
| H3 | Average | 1.57 | 1.39 | 0.9 |
| Max | 3.25 | 3.01 | 1.74 |
Table 2.
Suspended sediment transport rate and contribution of main transport terms. is the flux due to the non-tidal drift, the Eulerian velocity; is the flux due to Stokes drift and is called advection term. is the tidal pumping term which is related to the sediments exchange between water column and stream bed under periodic tidal dynamics. is the vertical circulation term that is related to gravitational circulation and vertical profile of velocity and SSC [32,33]. The total net flux was computed by T1 + T2 + T3 + T4 + T5 + T6 + T7. The ratio indicates the proportion of each flux to the sum of all flux magnitudes, while the “-” only represents the landward direction of sediment transport.
| Station | Tidal Cycle | T1 + T2 | T3 + T4 + T5 | T6 + T7 | Total Net Flux kg/(m·s) | |||
|---|---|---|---|---|---|---|---|---|
| Flux kg/(m·s) | Ratio % | Flux kg/(m·s) | Ratio % | Flux kg/(m·s) | Ratio % | |||
| H1 | Spring | 1.50 | 30 | −3.46 | −70 | 0.00 | 0 | −1.96 |
| Intermediate | 0.39 | 20 | −1.43 | −73 | 0.13 | 7 | −0.91 | |
| Neap | 0.24 | 44 | −0.22 | −41 | −0.08 | −15 | −0.06 | |
| Total | 2.13 | 29 | −5.11 | −70 | 0.05 | 1 | −2.92 | |
| H2 | Spring | 2.26 | 66 | −1.15 | −33 | 0.04 | 1 | 1.15 |
| Intermediate | 0.88 | 55 | −0.57 | −36 | 0.15 | 9 | 0.46 | |
| Neap | 0.51 | 55 | −0.36 | −39 | −0.06 | −6 | 0.09 | |
| Total | 3.65 | 62 | −2.08 | −35 | 0.13 | 2 | 1.7 | |
| H3 | Spring | −5.56 | −28 | 13.97 | 70 | −0.53 | −3 | 7.88 |
| Intermediate | −2.90 | −36 | 5.20 | 64 | −0.03 | 0 | 2.27 | |
| Neap | −1.28 | −37 | 1.89 | 54 | −0.33 | −9 | 0.28 | |
| Total | −9.74 | −31 | 21.06 | 66 | −0.89 | −3 | 10.43 | |
© 2020 by the authors. Licensee MDPI, Basel, Switzerland. This article is an open access article distributed under the terms and conditions of the Creative Commons Attribution (CC BY) license (http://creativecommons.org/licenses/by/4.0/).
Share and Cite
MDPI and ACS Style
Song, Z.; Shi, W.; Zhang, J.; Hu, H.; Zhang, F.; Xu, X. Transport Mechanism of Suspended Sediments and Migration Trends of Sediments in the Central Hangzhou Bay. Water 2020, 12, 2189. https://doi.org/10.3390/w12082189
AMA Style
Song Z, Shi W, Zhang J, Hu H, Zhang F, Xu X. Transport Mechanism of Suspended Sediments and Migration Trends of Sediments in the Central Hangzhou Bay. Water. 2020; 12(8):2189. https://doi.org/10.3390/w12082189
Chicago/Turabian StyleSong, Zekun, Weiyong Shi, Junbiao Zhang, Hao Hu, Feng Zhang, and Xuefeng Xu. 2020. "Transport Mechanism of Suspended Sediments and Migration Trends of Sediments in the Central Hangzhou Bay" Water 12, no. 8: 2189. https://doi.org/10.3390/w12082189
Note that from the first issue of 2016, this journal uses article numbers instead of page numbers. See further details here.