Article

Rapidly Accelerating Deforestation in Cambodia’s Mekong River Basin: A Comparative Analysis of Spatial Patterns and Drivers

1
Department of Biology, University of Nevada, Reno, NV 89557, USA
2
Global Water Center, University of Nevada, Reno, NV 89577, USA
3
Department of Watershed Sciences, Utah State University, Logan, UT 84322, USA
4
Department of Natural Resources and Environmental Science, University of Nevada, Reno, NV 89557, USA
*
Author to whom correspondence should be addressed.
Current Affiliation: W.A. Franke College of Forestry and Conservation, University of Montana, Missoula, MT 59812, USA.
Water 2020, 12(8), 2191; https://doi.org/10.3390/w12082191
Submission received: 9 July 2020 / Revised: 29 July 2020 / Accepted: 30 July 2020 / Published: 4 August 2020

Abstract

:
The Mekong River is a globally important river system, known for its unique flood pulse hydrology, ecological productivity, and biodiversity. Flooded forests provide critical terrestrial nutrient inputs and habitat to support aquatic species. However, the Mekong River is under threat from anthropogenic stressors, including deforestation from land cultivation and urbanization, and dam construction that inundates forests and encourages road development. This study investigated spatio-temporal patterns of deforestation in Cambodia and portions of neighboring Laos and Vietnam that form the Srepok–Sesan–Sekong watershed. A random forest model predicted tree cover change over a 25-year period (1993–2017) using the Landsat satellite archive. Then, a statistical predictive deforestation model was developed using annual-resolution predictors such as land-cover change, hydropower development, forest fragmentation, and socio-economic, topo-edaphic and climatic predictors. The results show that almost 19% of primary forest (nearly 24,000 km2) was lost, with more deforestation in floodplain (31%) than upland (18%) areas. Our results corroborate studies showing extremely high rates of deforestation in Cambodia. Given the rapidly accelerating deforestation rates, even in protected areas and community forests, influenced by a growing population and economy and extreme poverty, our study highlights landscape features indicating an increased risk of future deforestation, supporting a spatial framework for future conservation and mitigation efforts.

1. Introduction

Deforestation is the conversion of forests into non-forest through land clearing. The Intergovernmental Panel on Climate Change identified deforestation and forest degradation as the second biggest source of global greenhouse gas emissions (17%), after fossil fuel use (57%) [1]. Gross global deforestation between 2000–2005 was 12.9 million ha/year due to the conversion of forests to agricultural land, expansion of settlements, infrastructure, and unsustainable logging practices [2]. Almost 32% of global forest loss occurred in tropical forests [3], which are among the most biodiverse and highly threatened habitats in the world [4]. Of the 2.3 million km2 of total forest loss due to both natural and anthropogenic sources, both forest-cover change (loss or gain) and the ratio of loss to gain were highest in the tropics [3].
Southeast Asia has been identified as one of the world’s hotspots for deforestation [3,5]. Miettinen et al. [6] estimated an average annual forest loss of 1% across southeast Asia between 2000 and 2010. The Mekong River Basin, which is shared by China, Myanmar, Laos, Thailand, Cambodia, and Vietnam, has experienced accelerated deforestation rates in recent decades as Southeast Asian countries have rapidly developed and urbanized [4,5,7]. Drivers of deforestation in the Mekong Basin are complex, varying among countries and over time with social, cultural, and macroeconomic conditions. However, agricultural expansion, resettlement, urbanization, industrialization, and other developmental activities are common causes [8,9]. Landscape heterogeneity, fragmentation and topography have been identified as important parameters for the prediction of forest loss [10]. Cushman et al. [10] found that metrics of forest fragmentation, such as edge density, patch density, aggregation, and landscape diversity, were important predictors of deforestation in Borneo, but the relative importance of these metrics varied among Indonesia, Malaysia, and Brunei. Cambodia has the highest proportion of forests but also the highest deforestation rate among all Mekong Basin countries [7,11,12]. For the Lower Mekong countries between 1973 and 2009, forest loss was highest in Cambodia (7.0%), followed by Laos (5.3%), and Thailand, Vietnam, and Myanmar (2–4%) [12]. Anthropogenic factors such as migration, poorly controlled logging operations, shifting cultivation, large-scale monoculture cash crop plantations, small-scale fruit orchards, and hydropower development have further exacerbated deforestation [7,9].
China, followed by Thailand and Vietnam, and most recently Laos and Cambodia, has built numerous dams to meet growing urban and industrial energy demands [13,14]. Dams contribute to deforestation and land-use changes, including the development of new roads and towns, conversion of forests to agriculture, logging, and the inundation of terrestrial ecosystems by reservoirs [15,16]. In the Lower Mekong Basin, many individual and cascade dams are being built on the Srepok, Sesan, and Sekong Rivers (the 3S Basin) shared by Cambodia, Laos, and Vietnam [17]. Climate change is anticipated to further alter river hydrology and the timing and magnitude of seasonal inundation, compounding land-use change in the Lower Mekong Basin [18,19]. Studies examining the role of dam building, reservoir expansion, and hydropower infrastructure development on tropical deforestation rates are rare (but see [20]), and, to our knowledge, no study exists that links dam development to deforestation rates in the Lower Mekong Basin.
Seasonally flooded forests in the Lower Mekong Basin (LMB) are caused by Cambodia’s unique flood pulse and provide important habitat for fish, bird, reptile, and mammal species [21]. However, the relative magnitude of deforestation in flooded vs. upland forests is not well known. Tonle Sap Lake and the 3S Basin are identified as areas of high importance [17]. Tonle Sap Lake, which is the biggest inland fishery in the world, is undergoing immense change in its ecological productivity due to climate change, over-fishing, and streamflow alteration from hydropower dams [21,22]. Similarly, habitat is becoming degraded in the 3S Basin from rapid hydropower dam development, land-use conversions, and climate change [17,23]. Reservoirs behind dams, new settlements, and roads coincide with dam construction and likely influence deforestation but have yet to be quantified.
Establishing protected areas is one of the most important conservation strategies for maintaining intact ecosystems and biodiversity [24]; however, protected area effectiveness can be reduced by a lack of local support, insufficient funding and manpower to minimize resource loss within protected areas, and habitat loss outside of the protected area that may affect ecosystem services within protected areas (e.g., the loss of keystone animal species, invasive species, altered flows of water and nutrients) [25]. The first protected areas in the Lower Mekong Basin were established in the 1960s and increased to cover 26% of Cambodia, 17% of Laos, and 8% of Vietnam by 2017 [26,27]. These percentages exceed or are comparable to the global average of 11% of land area per country [28]. In the Lower Mekong Basin, illegal logging, wildlife poaching, and even settlement and agricultural clearing have been so significant that some protected areas have had their protected status revoked (e.g., Snoul Wildlife Sanctuary in Cambodia) [29]. Accurately mapping deforestation within protected areas may be especially critical in developing countries such as Cambodia because, even though there is the highest percent cover of protected areas, Cambodia also has the highest rates of deforestation, so there appears to be a disconnect between the assumption that protected status alone can lead to a lack of future deforestation.
The first community-managed forest (hereafter referred to as community forest) in Cambodia was established in the early 1990s to reduce forest loss by providing local communities with benefits and responsibilities of those forests [30,31]. Community forests grew rapidly and occupied 0.7% of Cambodia’s total forest areas by 2002 [32]. Community forests have been recorded in nearly 500 sites across Cambodia, although only 50 of them have been formalized [33]. There are few studies showing the effectiveness and success of community forests and protected areas in reducing forest loss [34,35]. Therefore, our study analyzed trends of forest change both within protected areas and community forests, and in adjacent areas, to quantify both the local and neighborhood influences of these conservation management designations.
There have been numerous remote sensing studies to quantify and assess forest-cover change globally [3,36,37], in the tropics [10,38,39,40], and in the Mekong Basin [14,41]. However, most of those studies have compared forest-cover change over multiple static years. Studies have also used annual time series of satellite imagery to quantify annual-resolution tropical deforestation [3,11]. Potapov et al. [11] monitored changes in woody vegetation structure in the Lower Mekong region from 2000 to 2017 using annual Landsat data and found that Cambodia had the highest rates of forest loss among the countries of the Lower Mekong Basin. Understanding how rates of deforestation differ across different countries with contrasting socio-economic pressures can identify drivers of deforestation and strategies to combat deforestation that are tailored to the unique needs of communities. Diamond & Robinson [42] stressed the importance of transnational studies as natural experiments when true experimental studies are either infeasible or amoral, which is typically the case with tropical deforestation.
The goal of this study was to quantify recent historical deforestation trends in Cambodia and the 3S Basin to better understand the major drivers of forest loss. Our predictive model quantifies the association of forest loss with variables representing the major drivers of tropical deforestation. Our specific objectives were to: (1) quantify rates and spatial patterns of deforestation in the LMB over 25 years (1993–2017); (2) analyze deforestation in areas of high importance within the study area, such as floodplain habitats, protected areas, and community forests; (3) statistically model relationships between key predictor variables and forest-cover change; and (4) compare predictor variables of deforestation in different regions within the study area. Our study used annual time series of tree-cover data to statistically model forest cover loss in (1) Cambodia and the 3S Basin, (2) Cambodia only, which has the highest deforestation rate of the LMB countries, (3) 3S Basin, and (4) Tonle Sap Lake. Each of these regions varied in terms of socio-economic and physical drivers, and we expected different predictor variables to be important. For example, the 3S region contains portions of three countries, is distant from major urban centers, such as Phnom Penh, contains less floodplain (7%) than Cambodia as a whole, and supports a variety of upland crops such as cassava and rubber. The Tonle Sap region is mostly floodplain (66%), contains the Tonle Sap Lake, has extensive areas of rice production, and is located between Cambodia’s two largest urban areas, Phnom Penh and Siem Reap. The longer time span, predictive modeling using abiotic variables, and the geographic comparisons makes this study unique compared to other deforestation studies in Cambodia and the lower Mekong.

2. Materials and Methods
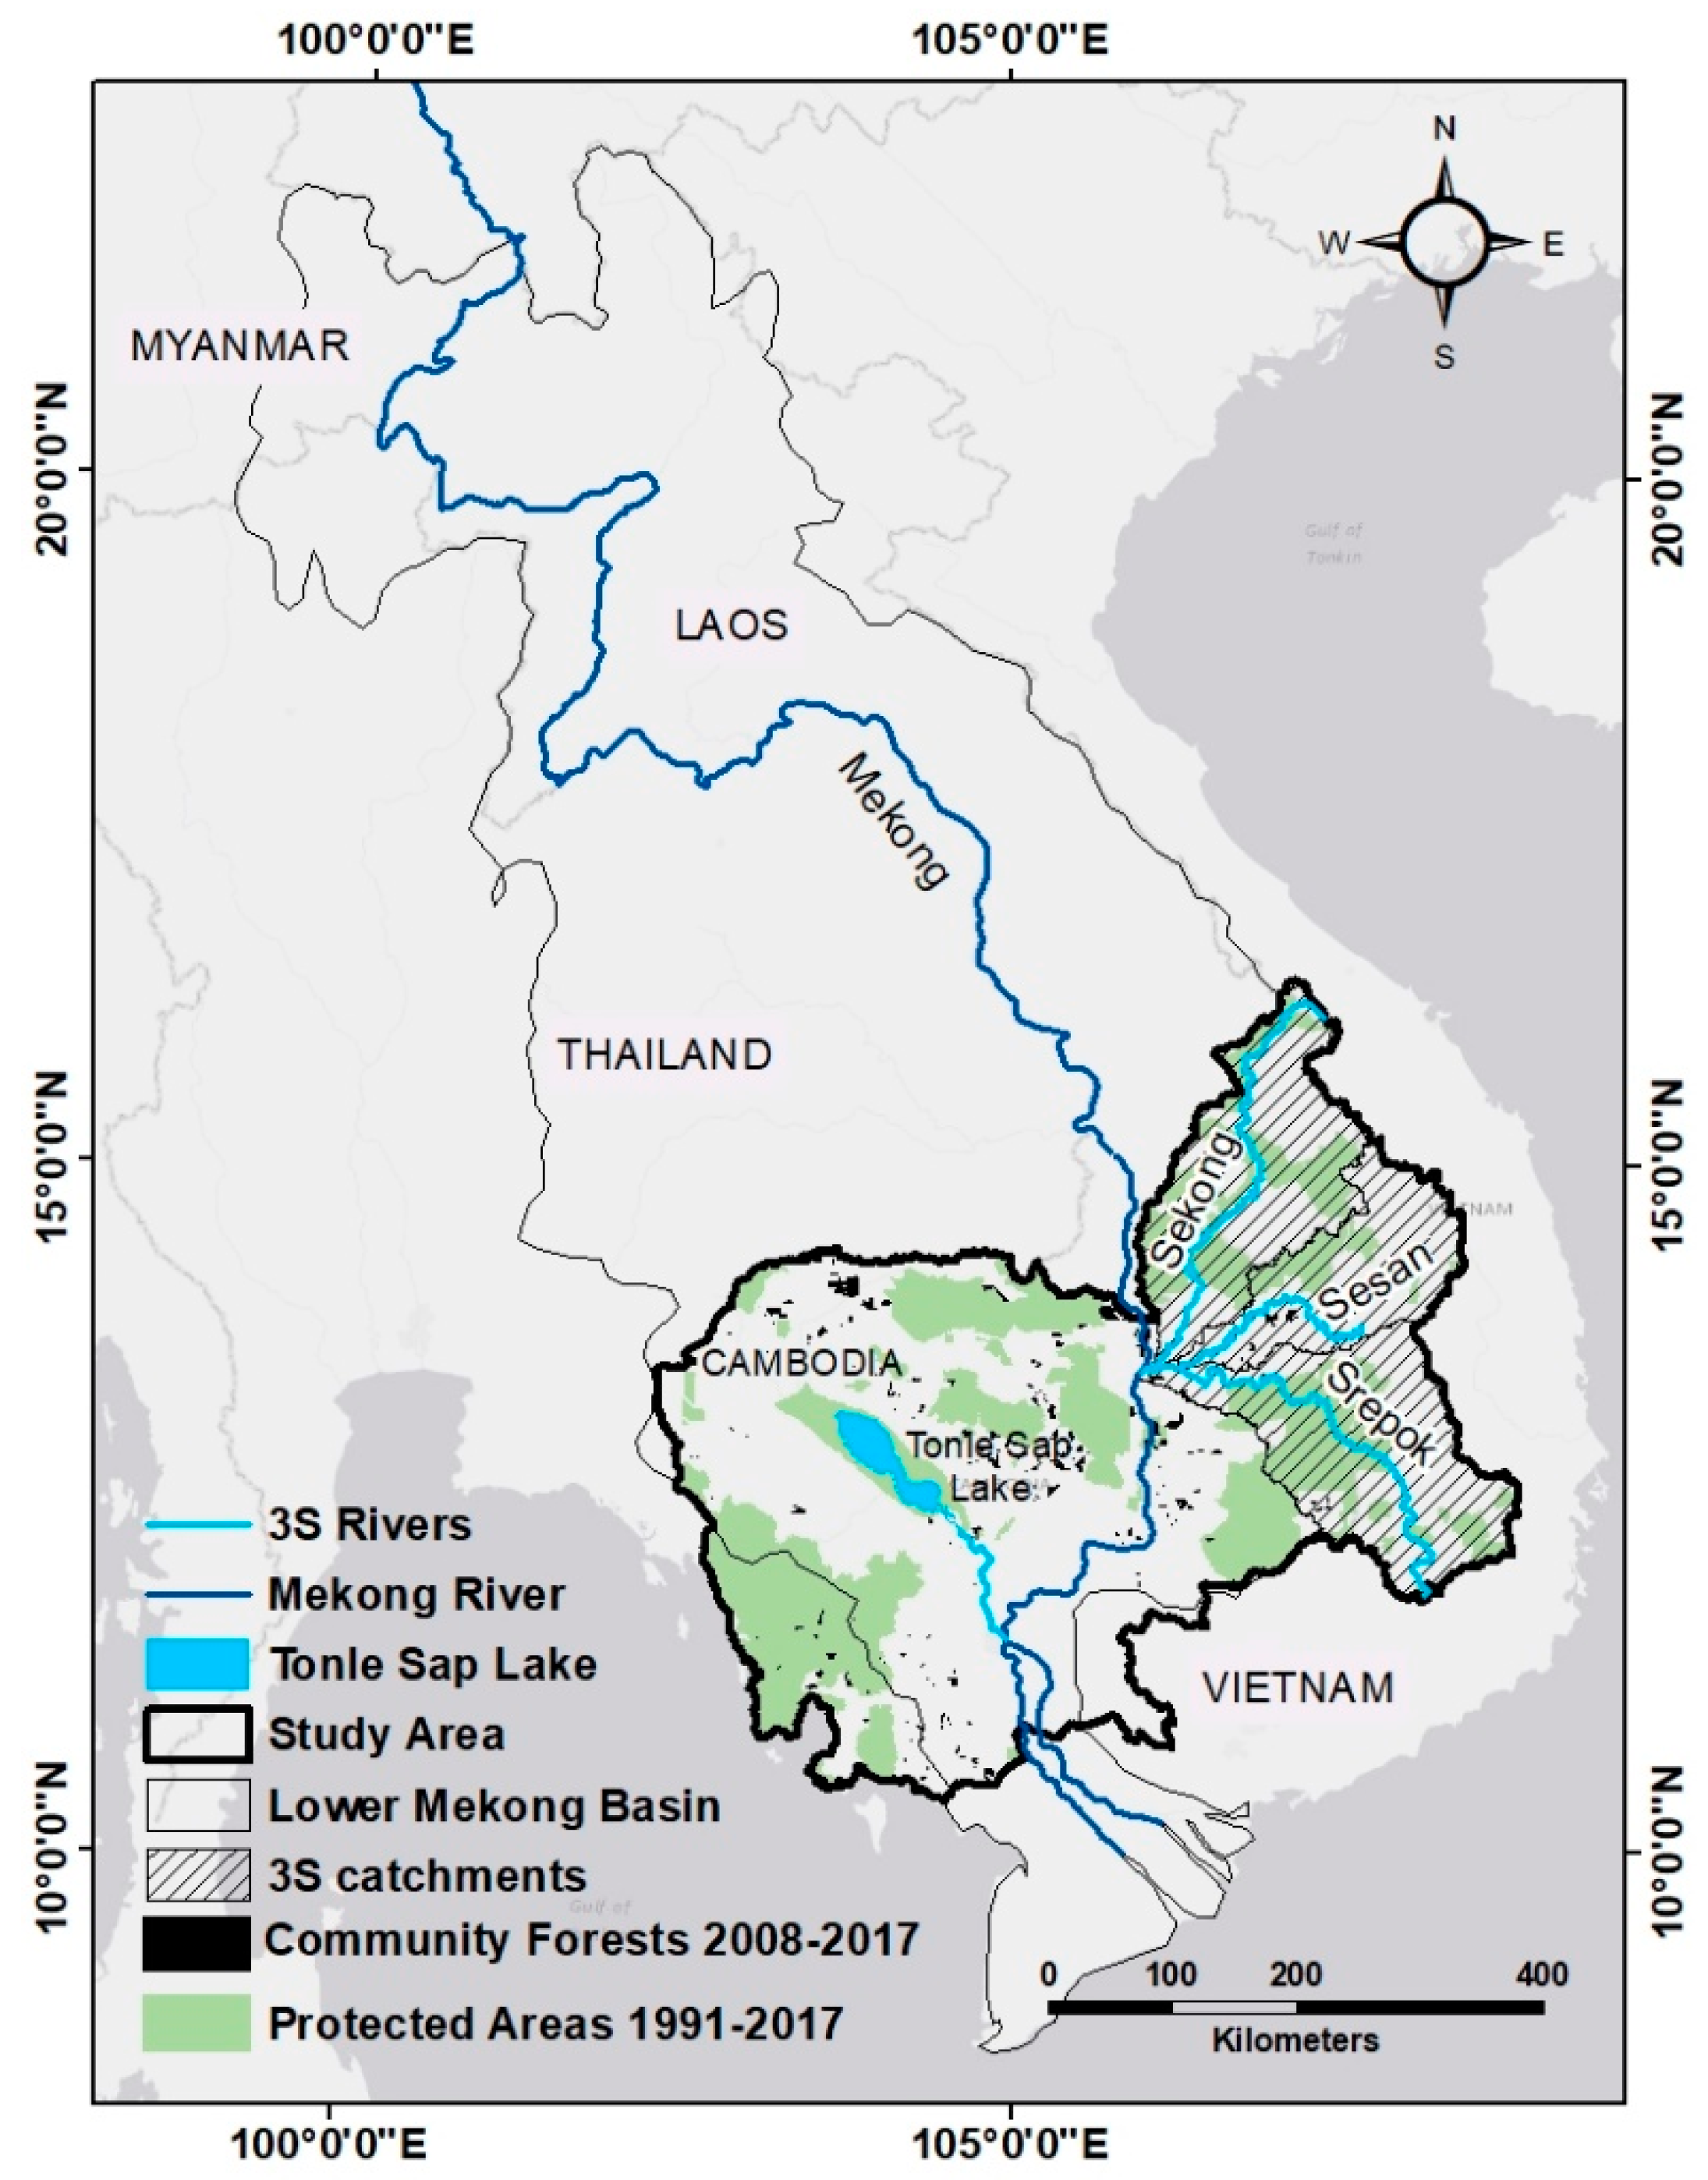
2.1. Study Area

The vast majority of the study area lies within the Mekong Basin, the 12th longest river in the world and the 3rd longest in Asia (Figure 1). The Mekong River originates in the Tibetan Plateau in China and flows through Myanmar, Laos, Thailand, Cambodia and Vietnam. It flows through diverse eco-zones ranging from the snowy Tibetan plateau to the brackish tropical Mekong Delta in Vietnam. Cambodia is one of the most underdeveloped countries in Asia with one of the lowest per capita GDP. Approximately 80% of the population lives in rural areas [43], and Cambodians are highly dependent upon farming and fisheries for their livelihoods [44,45]. Yet, Cambodia also has one of the fastest growing economies, with rapid urbanization around Phnom Penh and a burgeoning tourism industry mostly centered around Angkor and its modern city Siem Reap.
Southeast Asia is subject to large seasonal changes in precipitation, in which more than 65% precipitation falling within a rainy season that usually occurs from May to October [19,46,47]. Tonle Sap Lake is a unique hydrological feature that increases in size by more than 10,000 km2 (almost 5 times) during the rainy season as the Mekong River flows into the Tonle Sap River, backing up the flow of the Tonle Sap River and causing a flow reversal. During the rest of the year, the Tonle Sap River drains into the Mekong River directly [21,22].

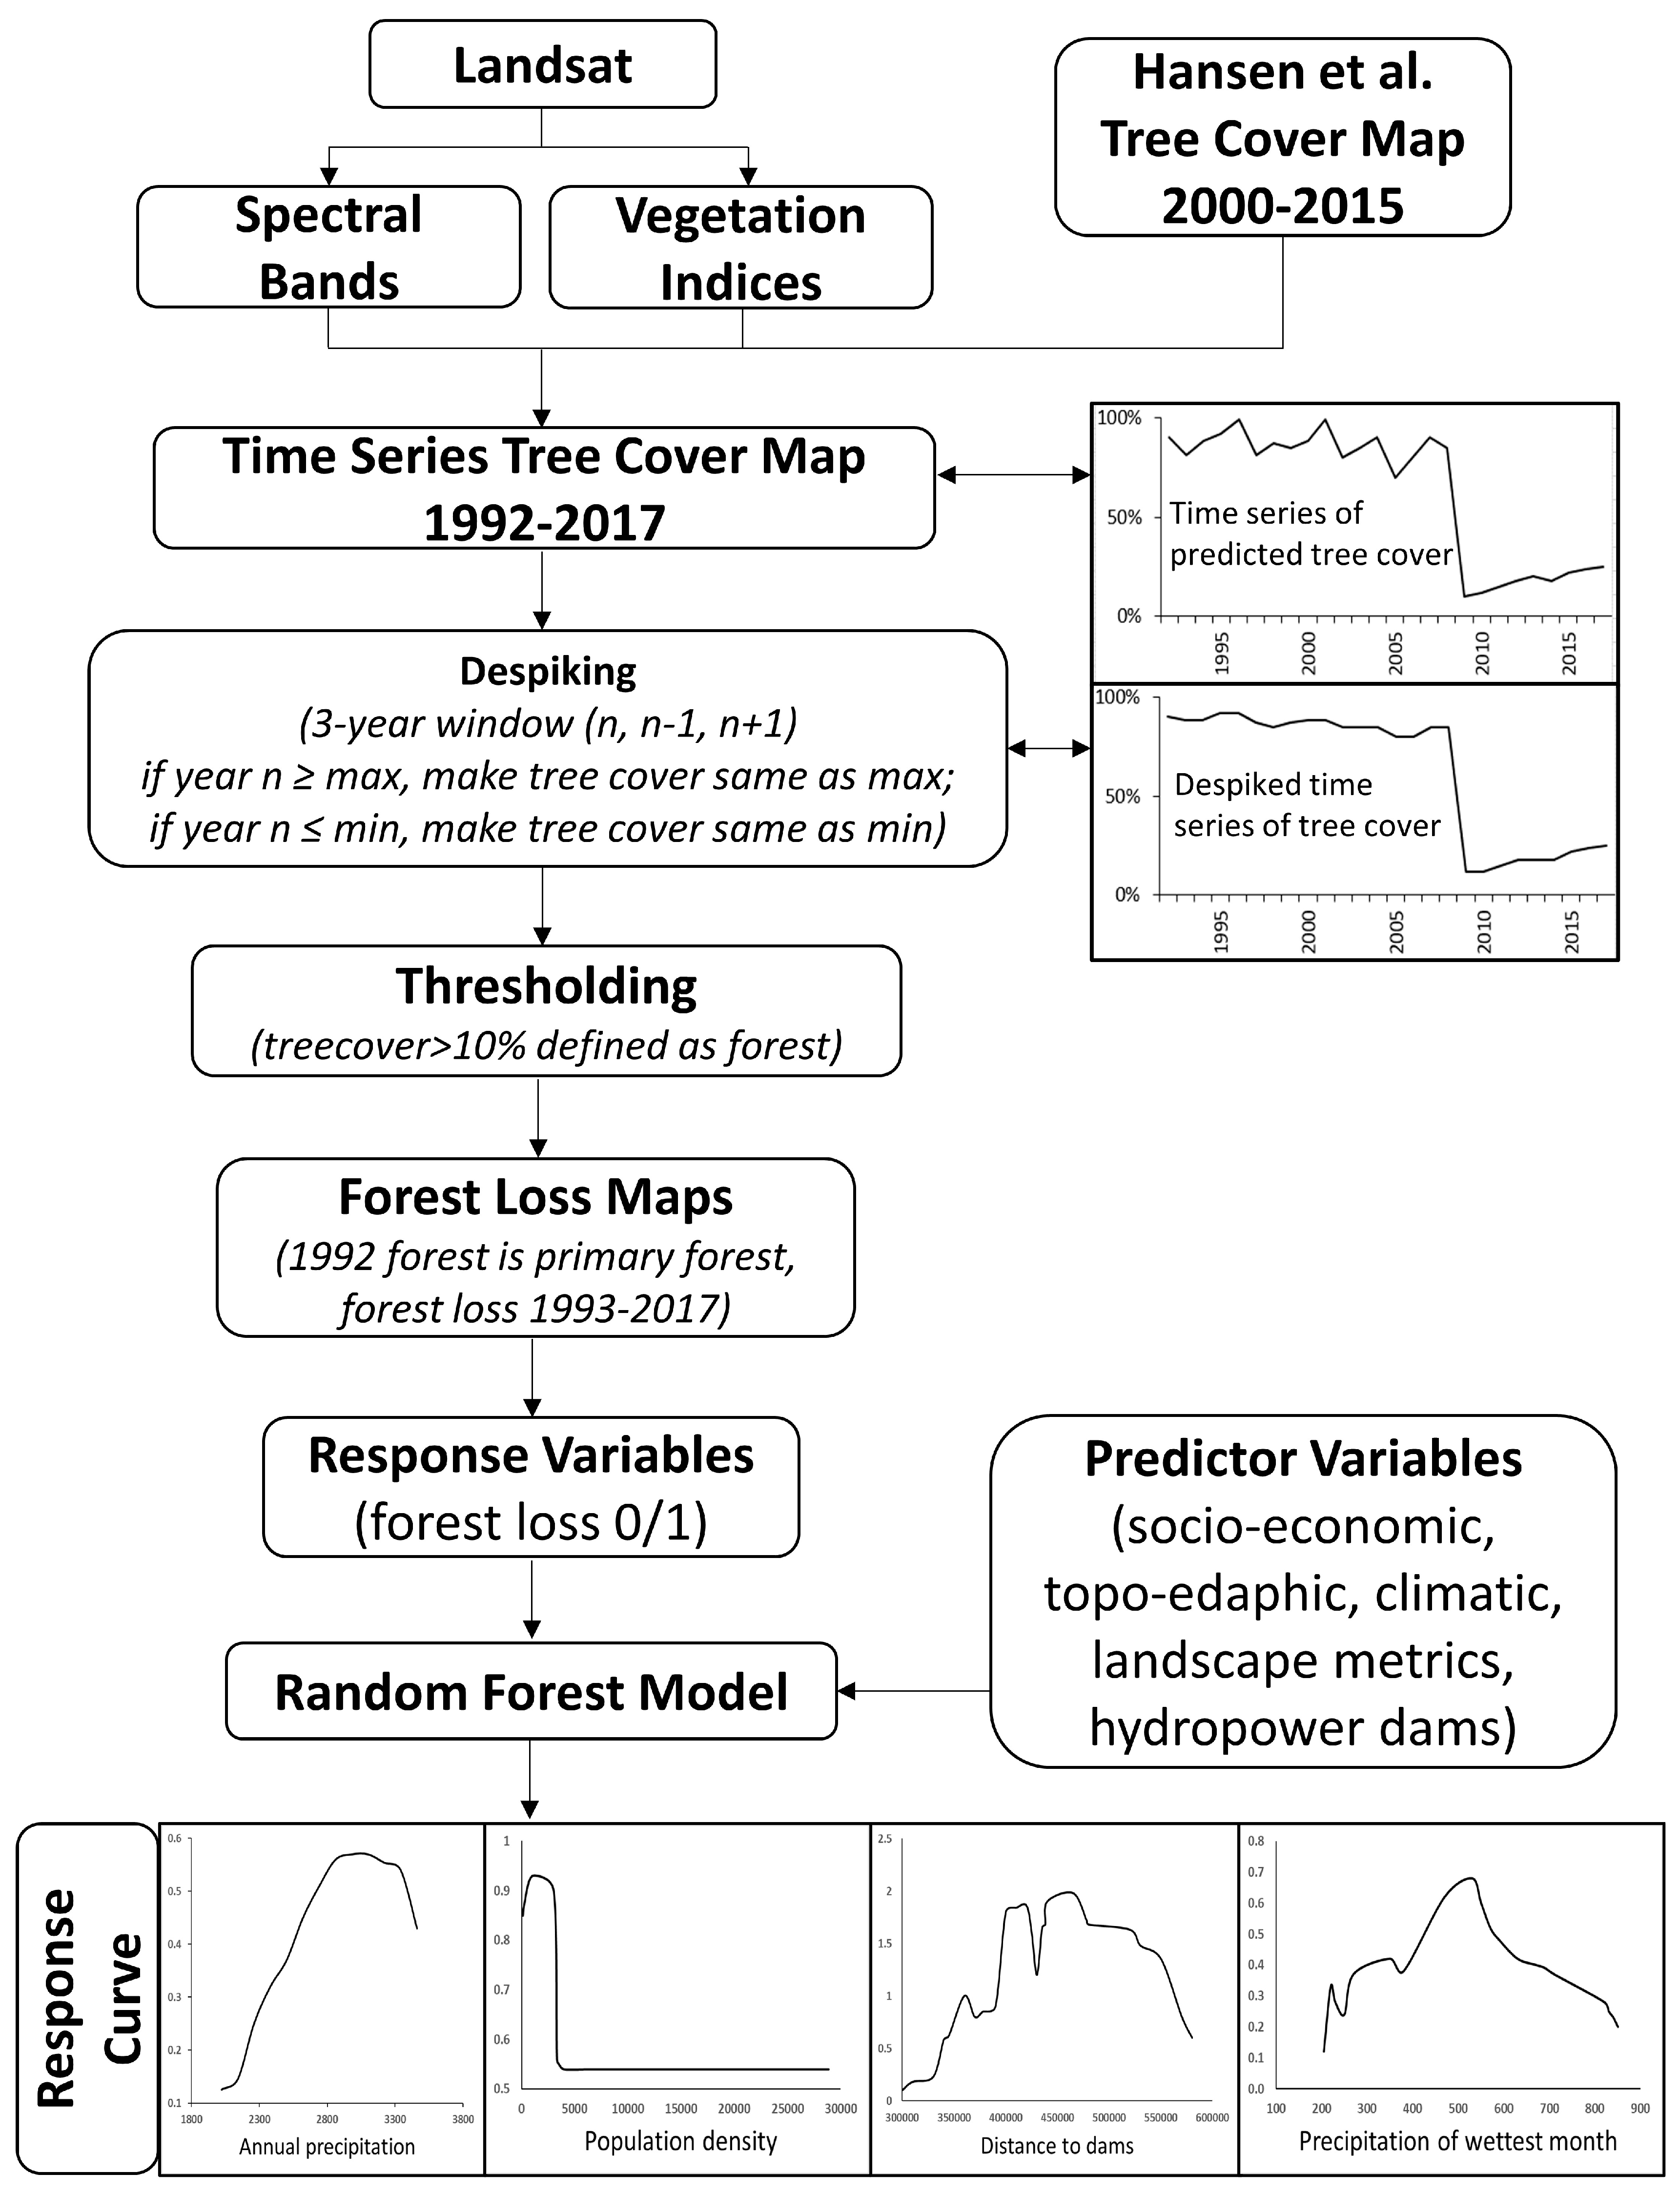
2.2. Mapping Tree Cover and Deforestation from 1992–2017

We developed predictive models of percent forest canopy cover from 1992 to 2017 using training data derived by sampling an existing forest cover layer obtained from the Google Earth Engine that was developed from Landsat satellite imagery [3], for the time period from 2000 to 2015 (Figure 2). Existing validation data for forest cover losses for Cambodia were unavailable from [3], but comparisons with expert-delineated field data showed coefficients of determination (R2) of 0.65 and 0.67 for nearby Indonesia [48]. We developed statistical models to predict forest cover for the 1990s as well as 2016 and 2017, which were time periods that were not included in the [3] training and validation dataset. We randomly placed 1000 points throughout the study area and extracted tree cover values for each of the 15 years available in the [3] dataset. We then extracted reflectance data from the following Landsat bands: blue, green, red, near-infrared, shortwave infrared 1, and shortwave infrared 2 (0.45–0.52, 0.52–0.60, 0.63–0.69, 0.76–0.90, 1.55–1.75, 2.08–2.35 micrometers corresponding with Landsat TM bands 1, 2, 3, 4, 5 and 7). Landsat spectral bands were downloaded using a Google Earth Engine script [49] that identified cloud- and shadow-free pixels and performed image compositing using a median value for images from January to December. Images downloaded were USGS Landsat 8 Surface Reflectance Tier 1 contained within the Google Earth Engine Data Catalog, which includes atmospheric correction using the Landsat 8 Surface Reflectance Code (LaSRC) method [50] and cloud masking using the C Function of Mask (CFMask) algorithm [51] and included portions of the following scenes: Path 49, Row 109 (NE); Path 49, Row 115 (NW); Path 53, Row 115 (SW); and Path 53, Row 109 (SE). In addition to the spectral bands, we derived the Normalized Difference Vegetation Index (NDVI) [52], Modified Soil Adjusted Vegetation Index (MSAVI2) [53], and two versions of the Enhanced Vegetation Index (EVI1 [54], EVI2 [55]) and used them as additional variables in the predictive model. For each random point, we used the NDVI, MSAVI, EVI1, and EVI2 variables and spectral bands from each year to predict that year’s tree cover. Three years (2005, 2010, 2015) were withheld for fully independent validation. Data from the remaining years were randomly partitioned with 50% as training and 50% as validation.
We used the random forest algorithm to model tree cover at an annual time step for our study region. Random forest is an ensemble approach that uses many decision trees to make a continuous prediction [56]. In recent years, random forest has been used in remote sensing applications that predict patterns of deforestation [3,10,37,38,39,40].
After creating the annual-resolution tree-cover maps, we performed a despiking step [57] to remove anomalous single-year changes that were followed by immediate reversals. Though the Google Earth Engine script was capable of removing most noise associated with clouds and cloud shadows, the spectral signal of disturbances in multiple images could result in spikes (false increases or decreases in forest cover) in the Landsat time series data. A 3-year window was chosen for each year, and spikes greater than the maximum of the pre-year and post-year, and spikes less than the minimum of the pre-year and post-year were removed in the despiking step. We deemed this single-year anomaly as artifactual because most forest loss is followed by either a gradual multi-year increase due to secondary growth or a sustained loss of forest cover if the land is converted to agriculture, urban, or industrial uses. To identify forest loss on an annual basis, we converted the despiked forest-cover layer into a binary forest/non-forest map using a 10% forest-cover threshold [11]. We considered forest cover in 1992 to be the primary forest and calculated forest loss for the following 25 years (1993–2017).
Although forest loss can be followed by forest re-growth, we focused our analysis on the loss of primary forests because of the large losses in structural complexity and wildlife biodiversity that occur when primary forest is lost [58]. We defined deforestation such that once a forest was lost, it could no longer be considered as a primary forest to ensure that secondary recovery or conversion to tree crop plantations (e.g., rubber, cashews) did not inflate the estimate of initial deforestation. Finally, to compare forest loss in the flooded forest versus upland forest, we divided the study area into two regions using 15-m vertical Height Above Nearest Drainage [59] and identified areas below that threshold as floodplain areas. Height Above Nearest Drainage was calculated on a 90-m resolution Digital Elevation Model derived from the Shuttle Radar Topography Mission [60].
Forest-cover loss was assessed separately for Cambodia and the 3S Basin, Cambodia-only, Tonle Sap-only, and 3S Basin-only. Additionally, forest-cover losses inside protected areas and community forests were separately compared with forests losses outside those areas. Protected areas in Cambodia and 3S Basin from 1992–2017 and community forests in Cambodia only from 2008–2017 were obtained from the Open Development data portal for the respective countries [61,62,63,64].

2.3. Statistical Model to Predict Drivers of Deforestation

2.3.1. Data Variables

In addition to modeling the long-term loss of primary forest in Cambodia and the 3S watershed, as occurred over multiple decades, we sought to understand the drivers of deforestation on an annual time step. The response variable was binary forest loss/non-loss layers obtained from the deforestation mapping step. We pooled data across all years from 1993 to 2017 and used annual resolution predictor variables when available. Both temporally static and temporally dynamic variables from a broad suite of environmental and anthropogenic gradients were used as predictors of forest loss (Table 1). Static variables included roads, population density, soils, topography, and climatic normals for the 1981 to 2010 time period. Dynamic variables included land cover, dam construction, inundated area, protected area status, and landscape fragmentation metrics. Population data were available every five years in the 1990s, which was linearly interpolated for each year between the five-year blocks. For topographic variables, we calculated slope in percent using ArcGIS Spatial Analyst [65], and Beer’s aspect [66], which uses a sine transformation of aspect to convert it into a proxy variable for solar radiation.
We derived annual-resolution land-cover maps of agricultural and urban areas. We used the SERVIR Mekong land-cover data [11] to identify urban areas and agricultural lands spanning from 1993 to 2017. The maximum level of inundation was mapped annually using data from the Global Surface Water Explorer website, which used expert decision models to identify open water from non-water features, such as shadows and lava [68].
We hypothesized that spatial patterns of land cover may influence the rate of forest loss, with smaller and more fragmented forest patches potentially lost more rapidly than larger more-intact forest patches. Landscape metrics were calculated using FRAGSTATS 4.2.1 (University of Massachusetts, Amherst, MA, USA) to quantify the spatial pattern in forest patches. FRAGSTATS metrics [69] were calculated for the forest layer, urban layer and agriculture layer separately for each year. The FRAGSTATS metrics were calculated for three spatial scales using the moving window option in FRAGSTATS (1, 10, and 20 km), and the spatial scale with the highest accuracy was chosen for statistical analysis. Metrics were chosen that describe the composition of different cover types (PLAND), shape of land cover patches (PAFRAC), and isolation of patches from other patches of the same type (ED, ENN, PD, IJI, PLADJ, AI, CLUMPY) (Table 1). All spatial layers, except landscape metrics, were resampled at a 30 m pixel size. Landscape metrics were calculated at a 270 m resolution due to computational time limits.

2.3.2. Statistical Modeling of Drivers of Deforestation

Values from each raster corresponding to 2000 randomly generated points were extracted and then analyzed using the random forests classification model (package randomForest version 4.6-14) (University of Massachusetts, Amherst, MA, USA). We used default parameters of 500 trees (ntree), seven variables at each split (mtry), and a minimum terminal node size of one (node size). Predictors of deforestation were ranked based on the mean decrease in accuracy and partial response plots for each important variable were examined.

3. Results

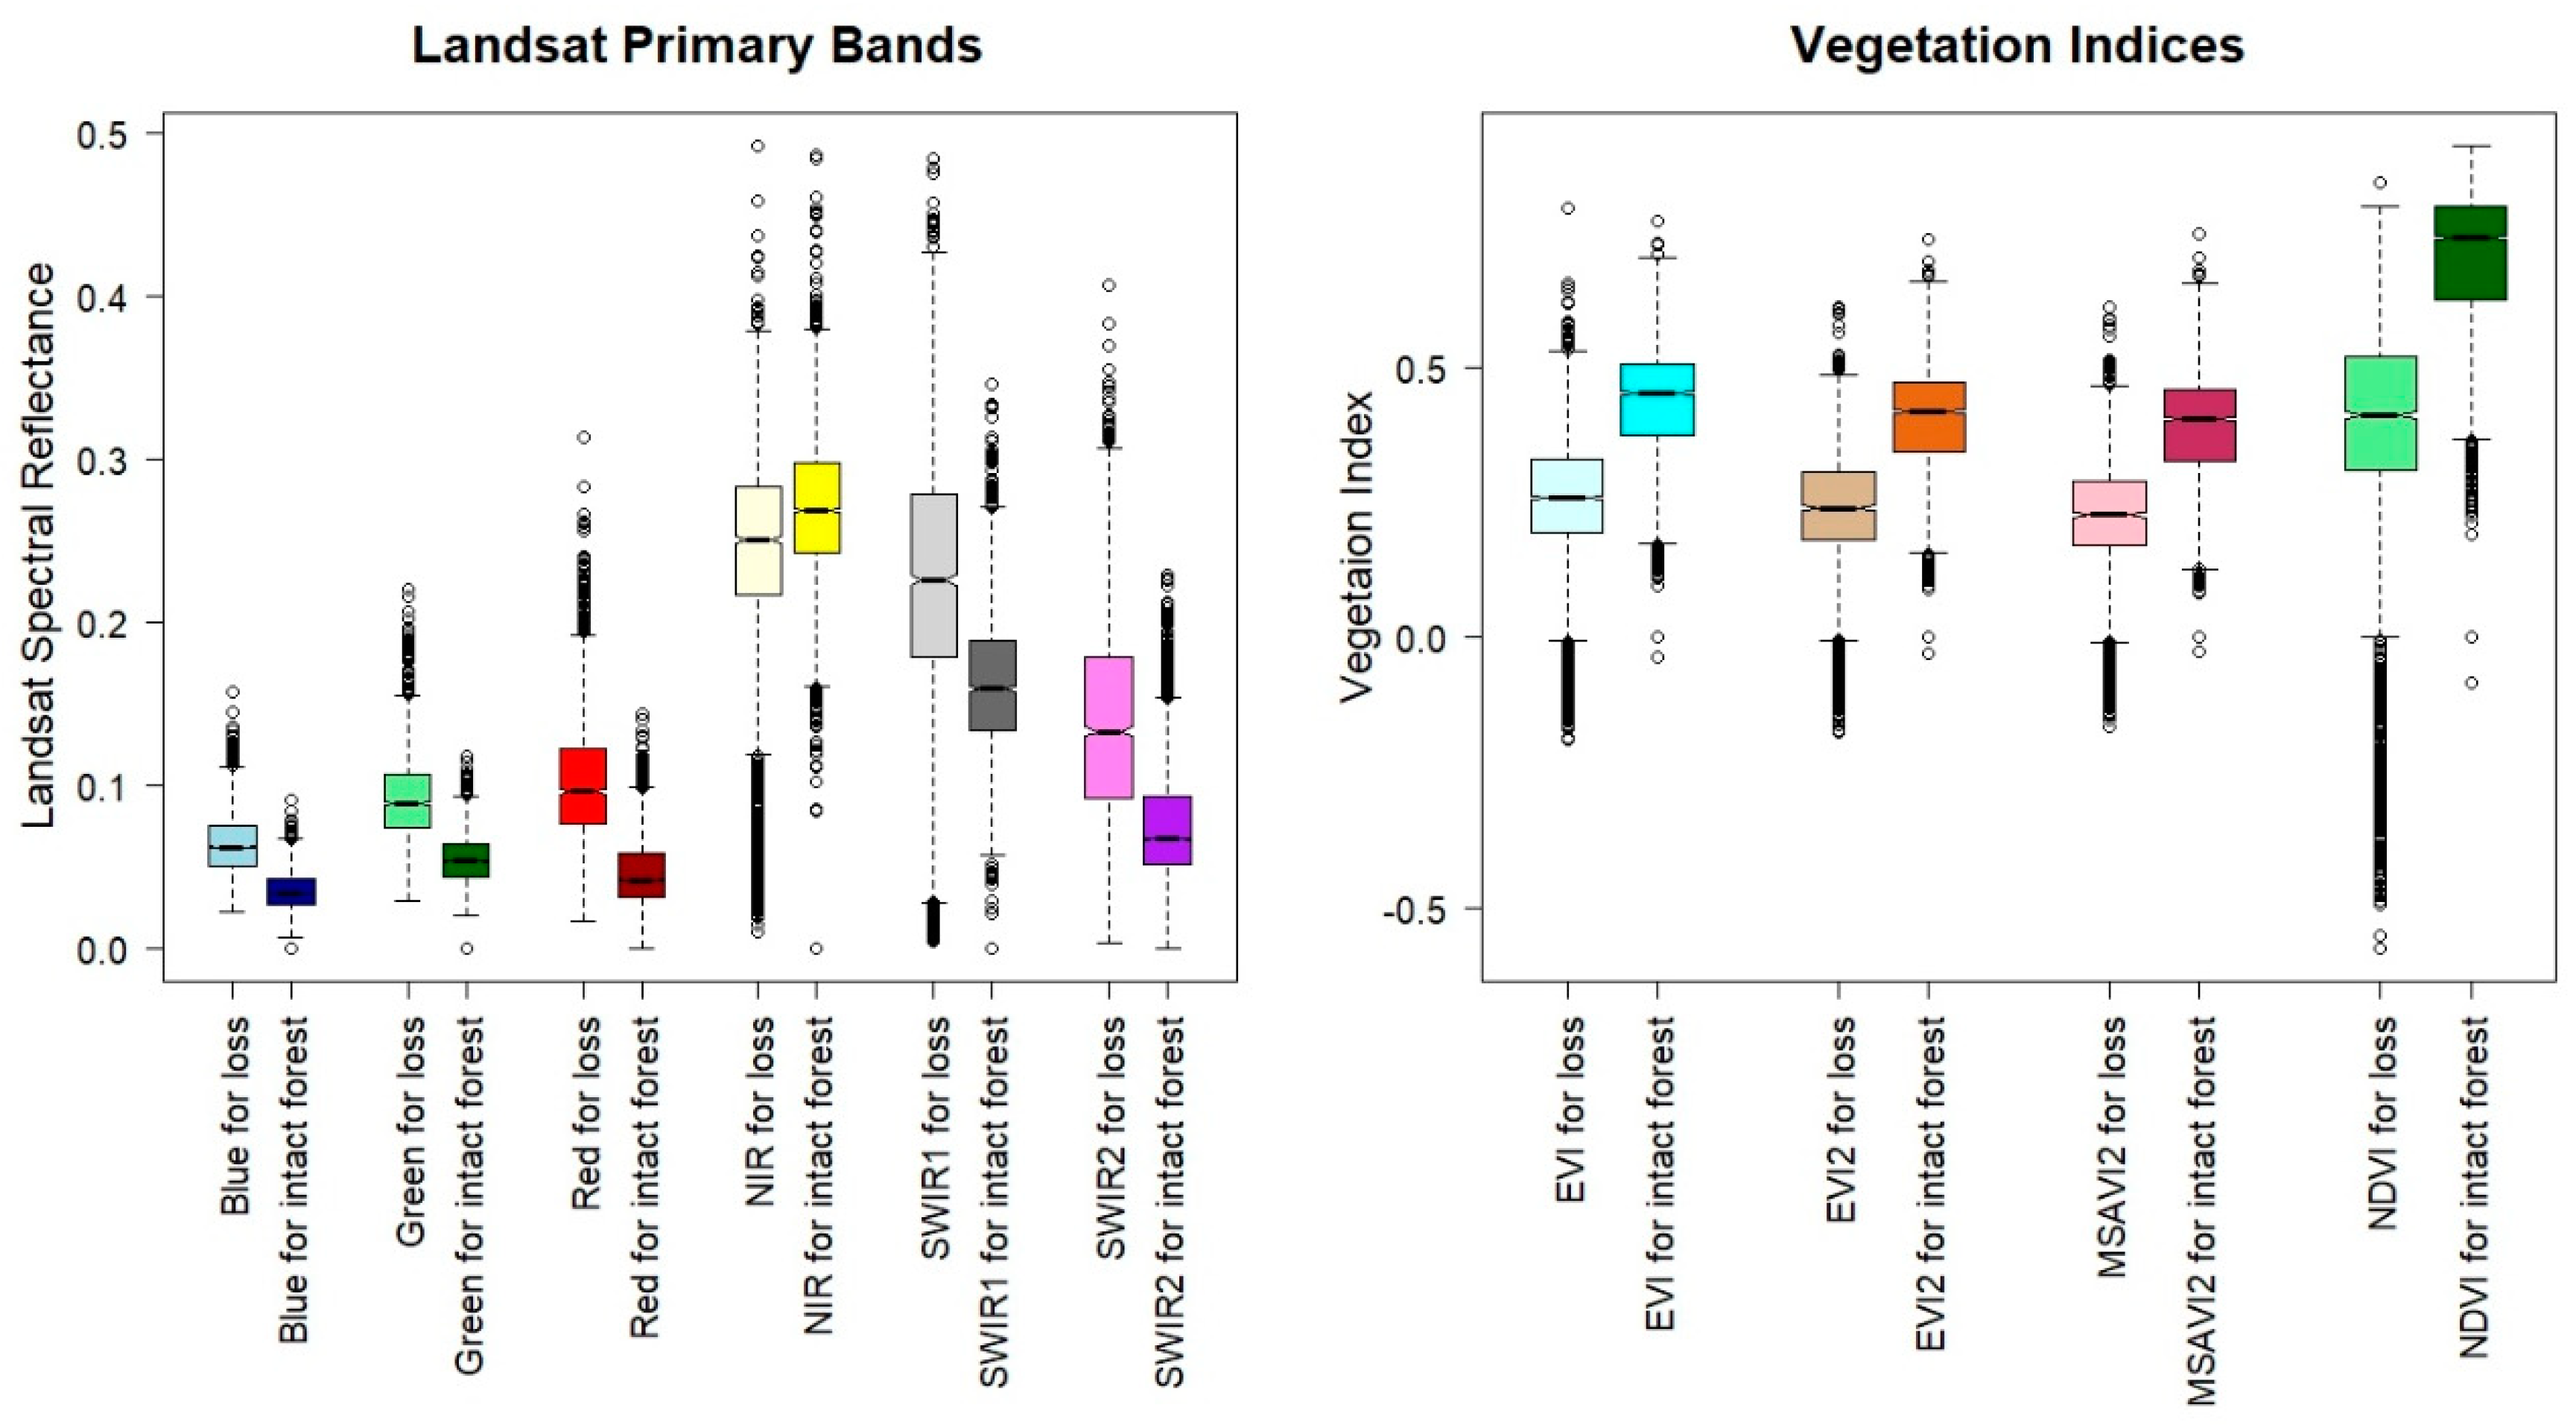
3.1. Mapping Tree Cover from 1992–2017

Validation statistics are presented in Table 2 and cover the time period from 2000 to 2015. The forest cover model predicted 80% of the variance when compared against the [3] forest-cover layer using 1000 randomly selected points from the years in which the training data were derived. When withholding entire years for validation, the percent of variance explained ranged from 56% in 2005 to 77% in 2010 using 1000 random points per year. Percent bias indicates whether the model over- or underpredicts relative to the withheld data. When comparing against random validation data, percent bias was +1.10%, suggesting that the model had a slight tendency to overpredict tree cover (Table 2). In contrast, when using fully withheld validation data, percent bias was negative for all three years and ranged from −5.5% for 2015 to −13.4% for 2010, indicating that in those years the model had a tendency to predict tree cover lower than levels mapped in the [3] dataset (Table 2). Figure 3 shows scatterplots of predicted versus mapped tree cover for the randomly partitioned validation dataset and for individual years in which data were fully withheld. All four scatterplots suggest clusters of data at both low and high cover levels.
Box plots showing the Landsat spectral bands and vegetation indices used for deforestation mapping for both forest loss and non-loss validation points can be observed in Figure A1.

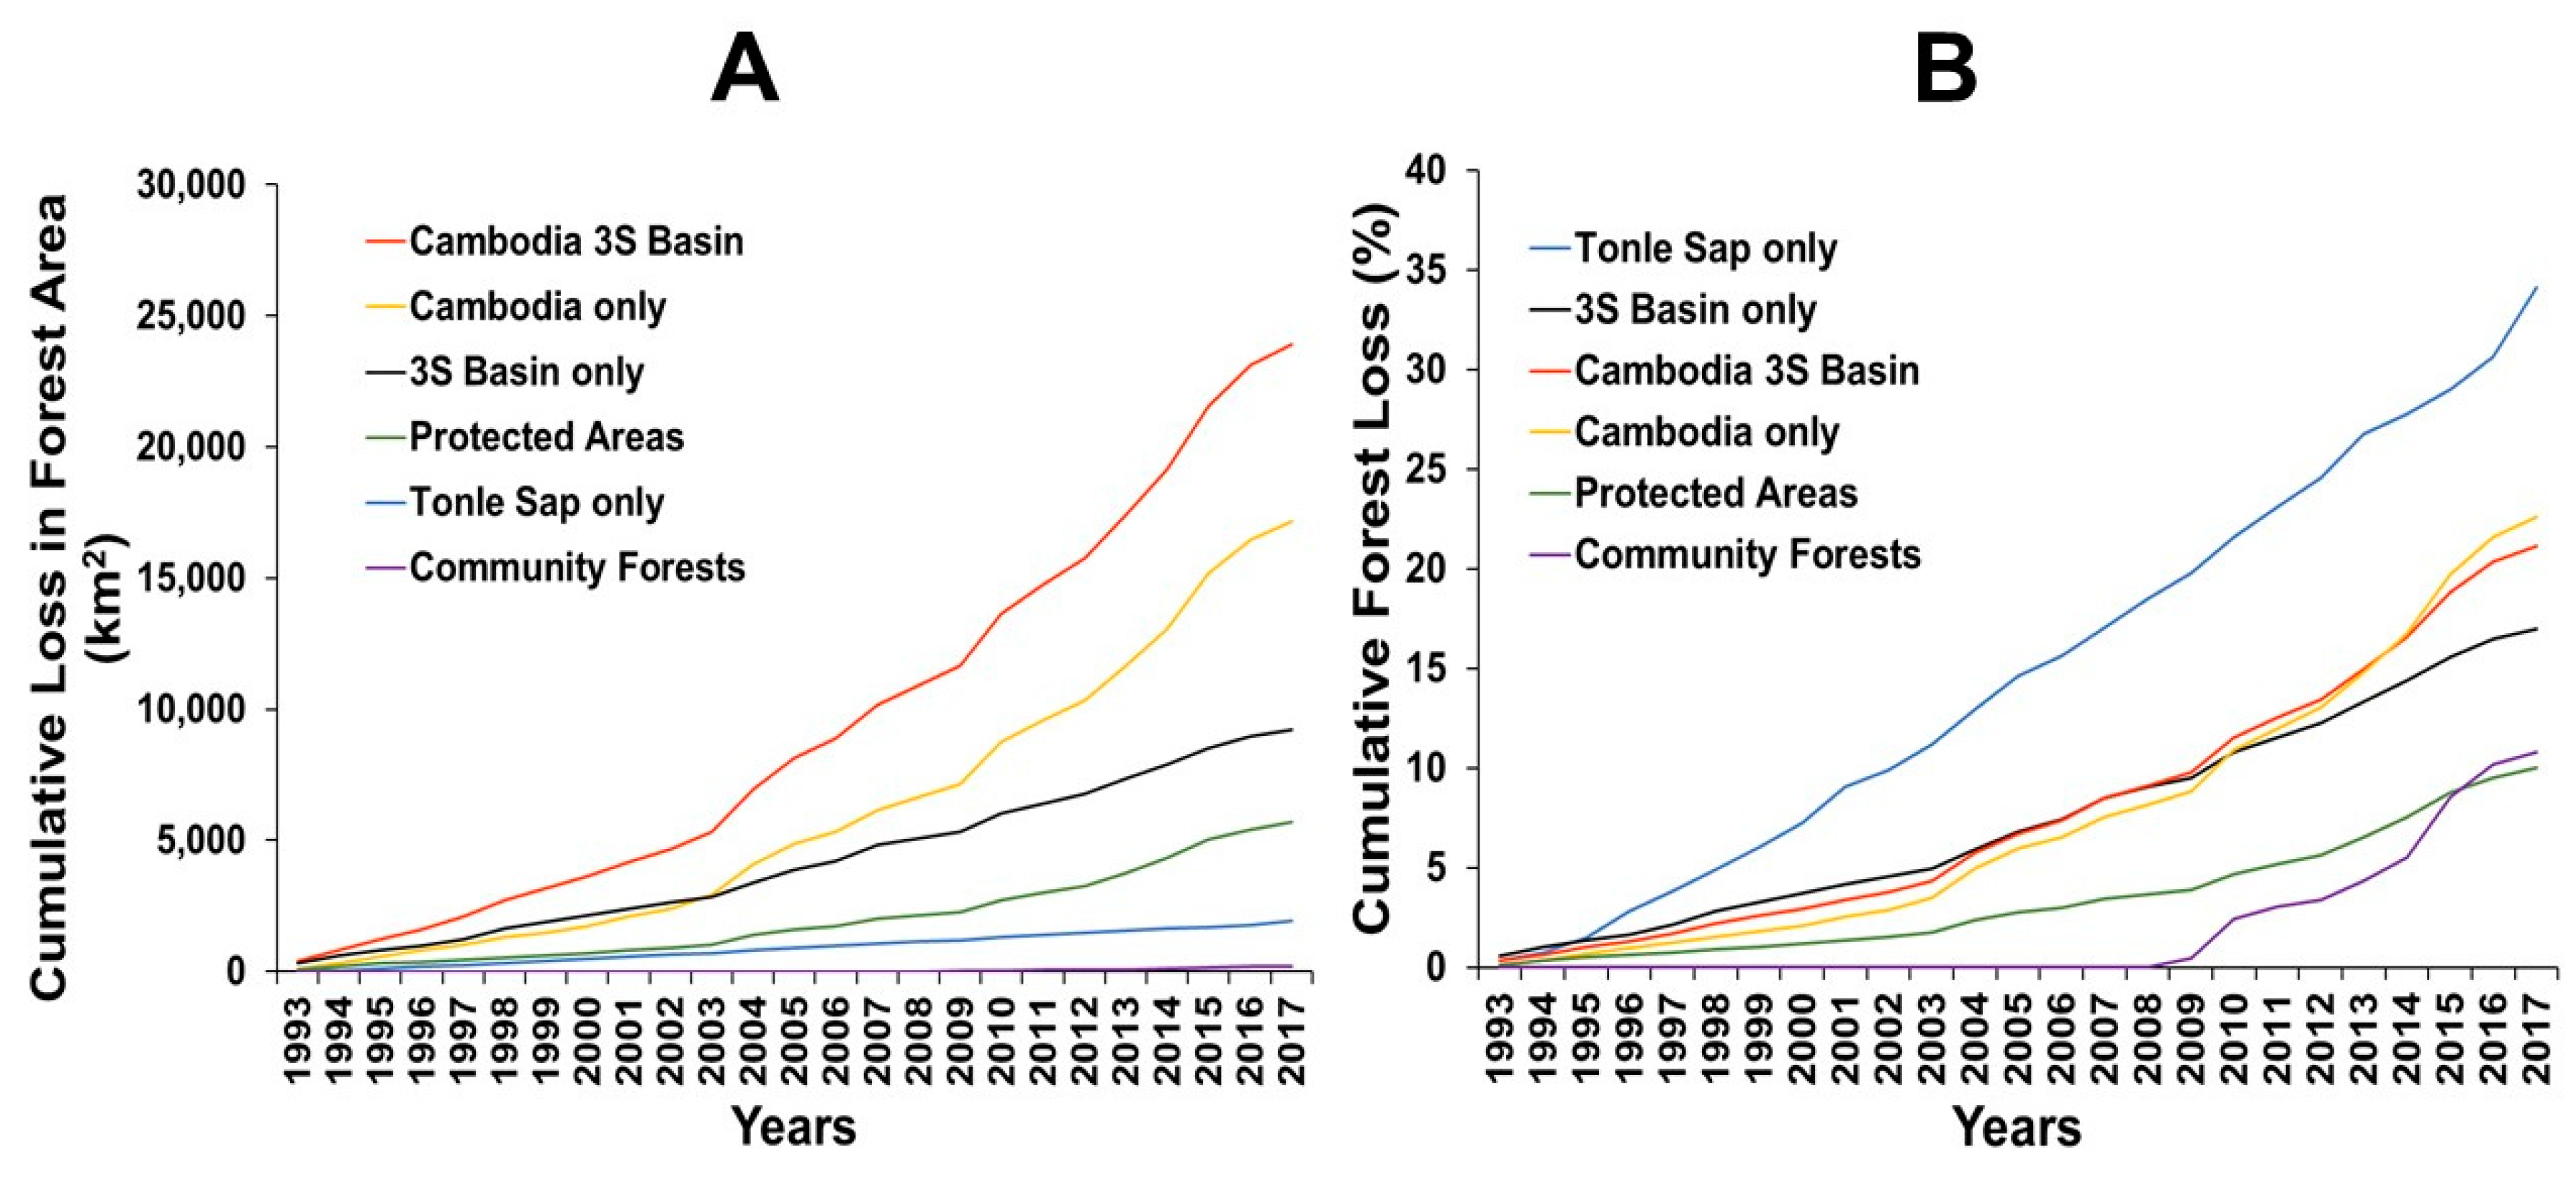
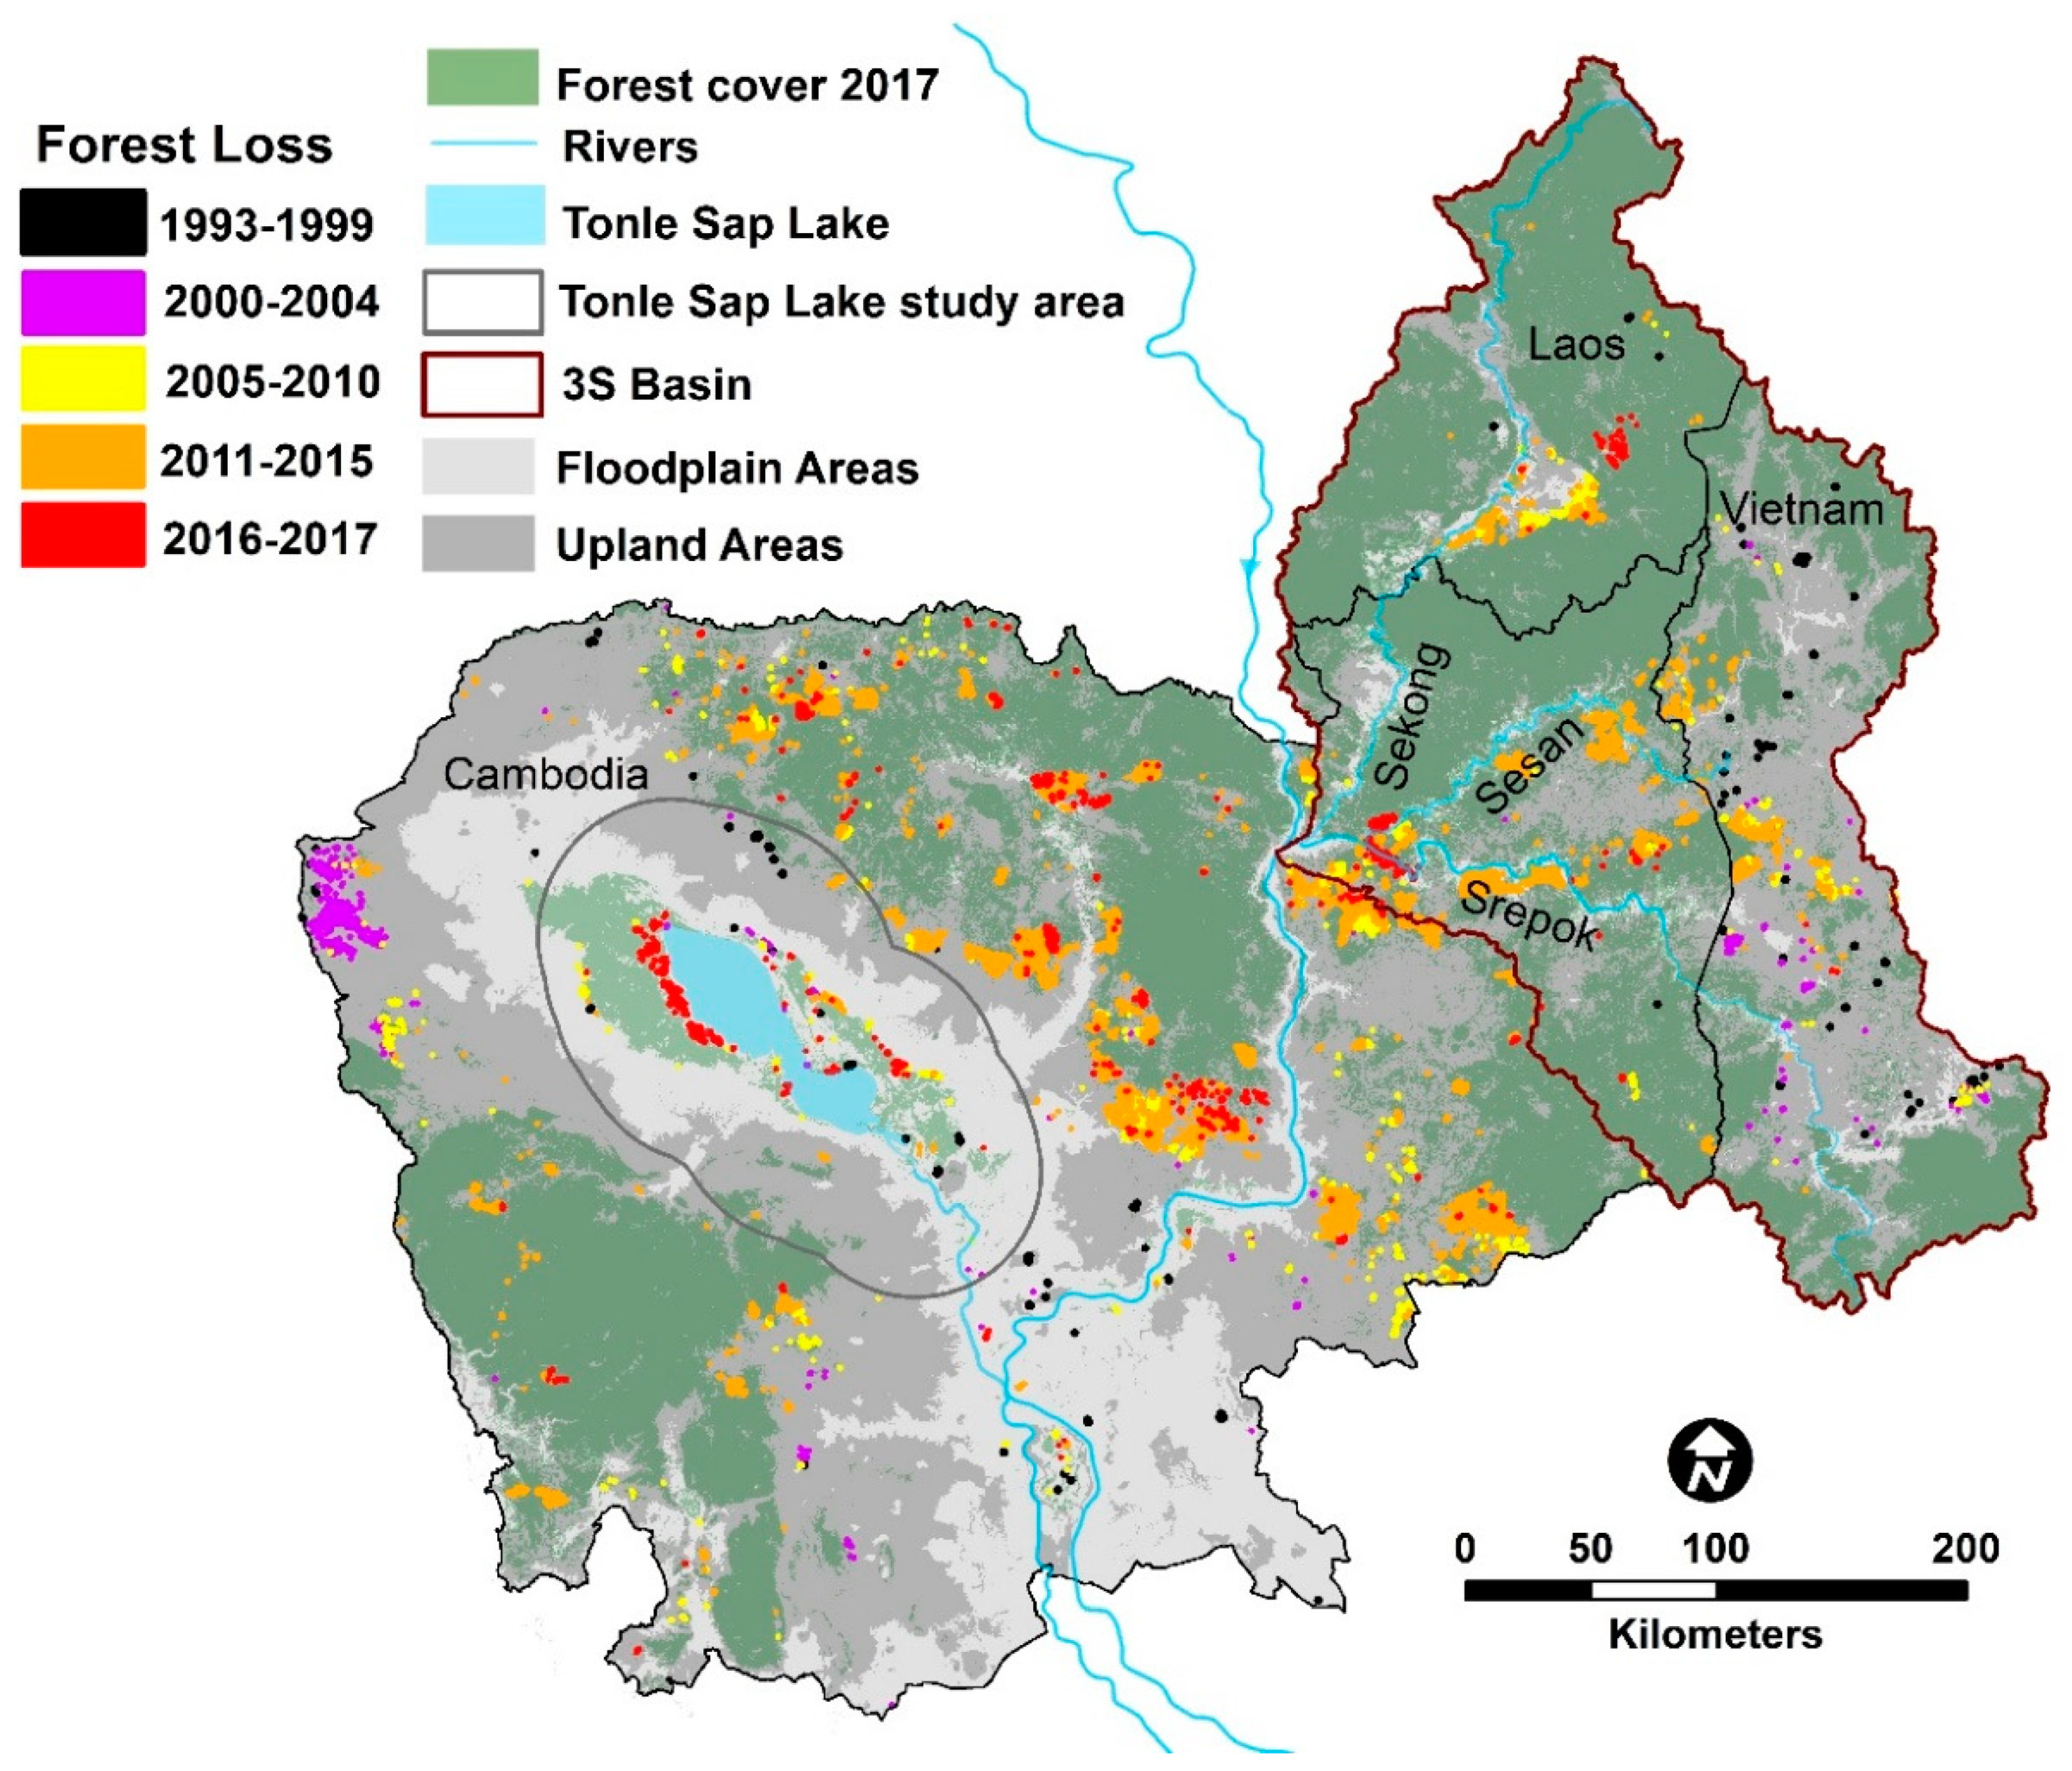
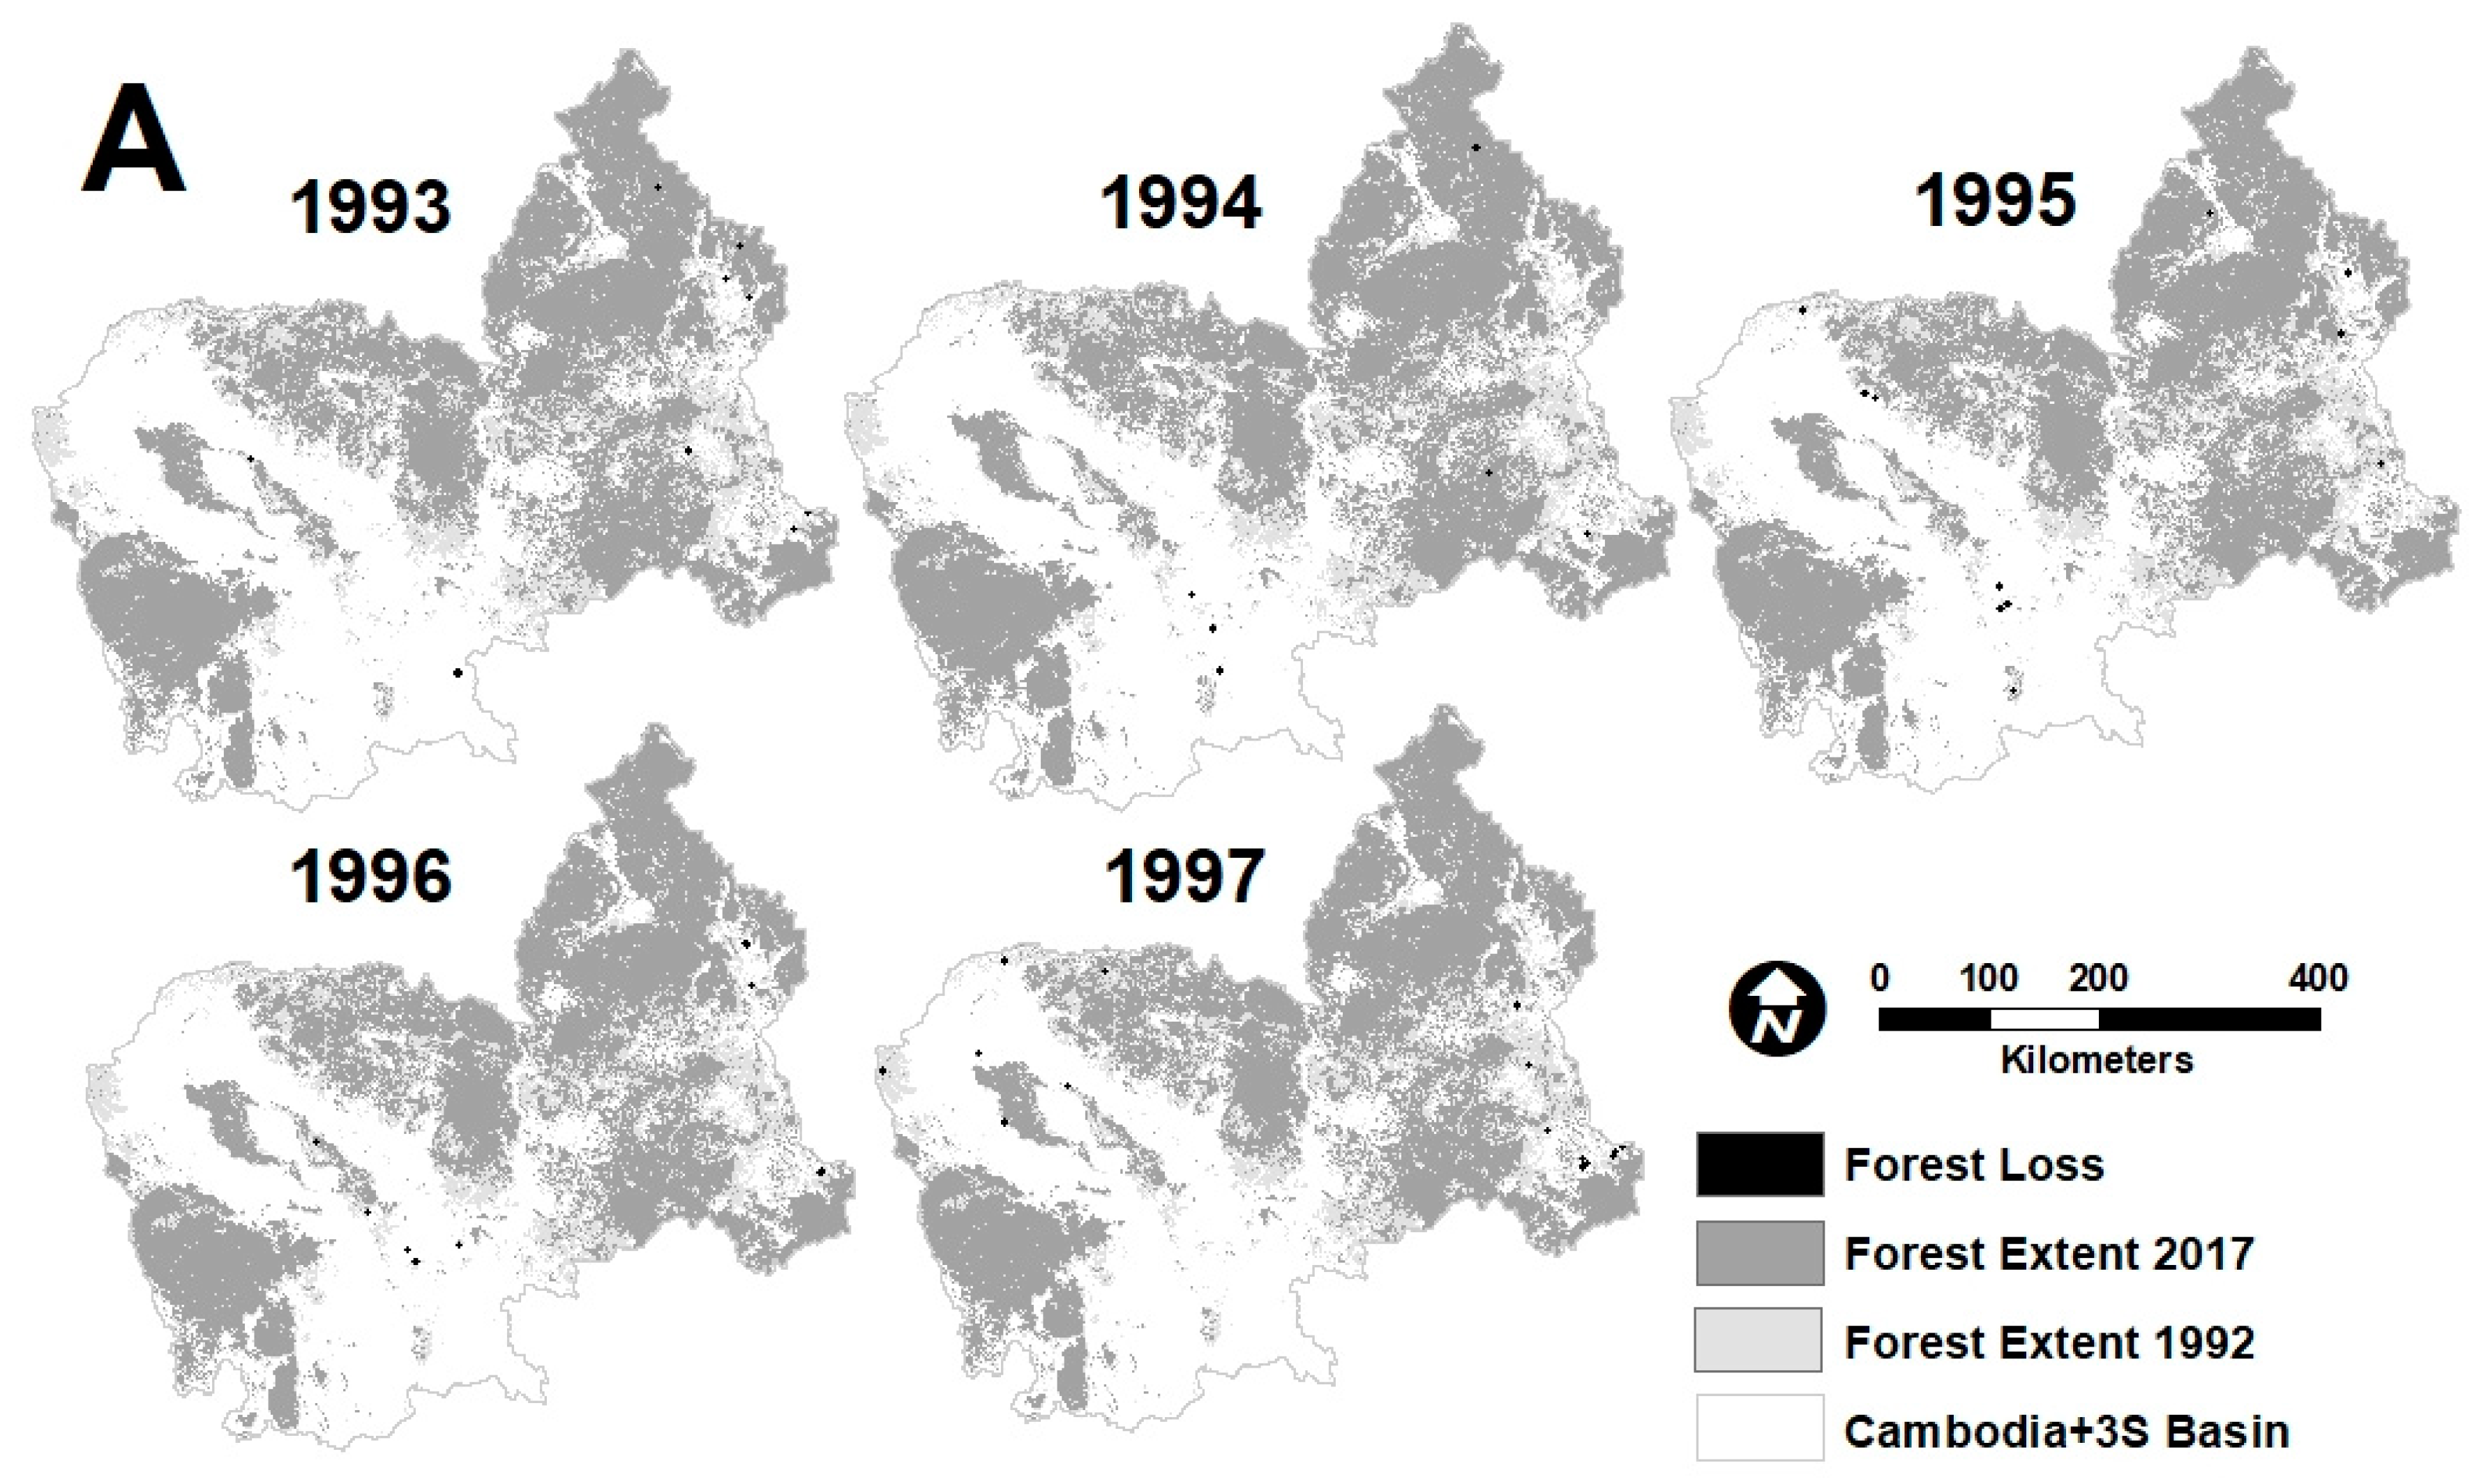
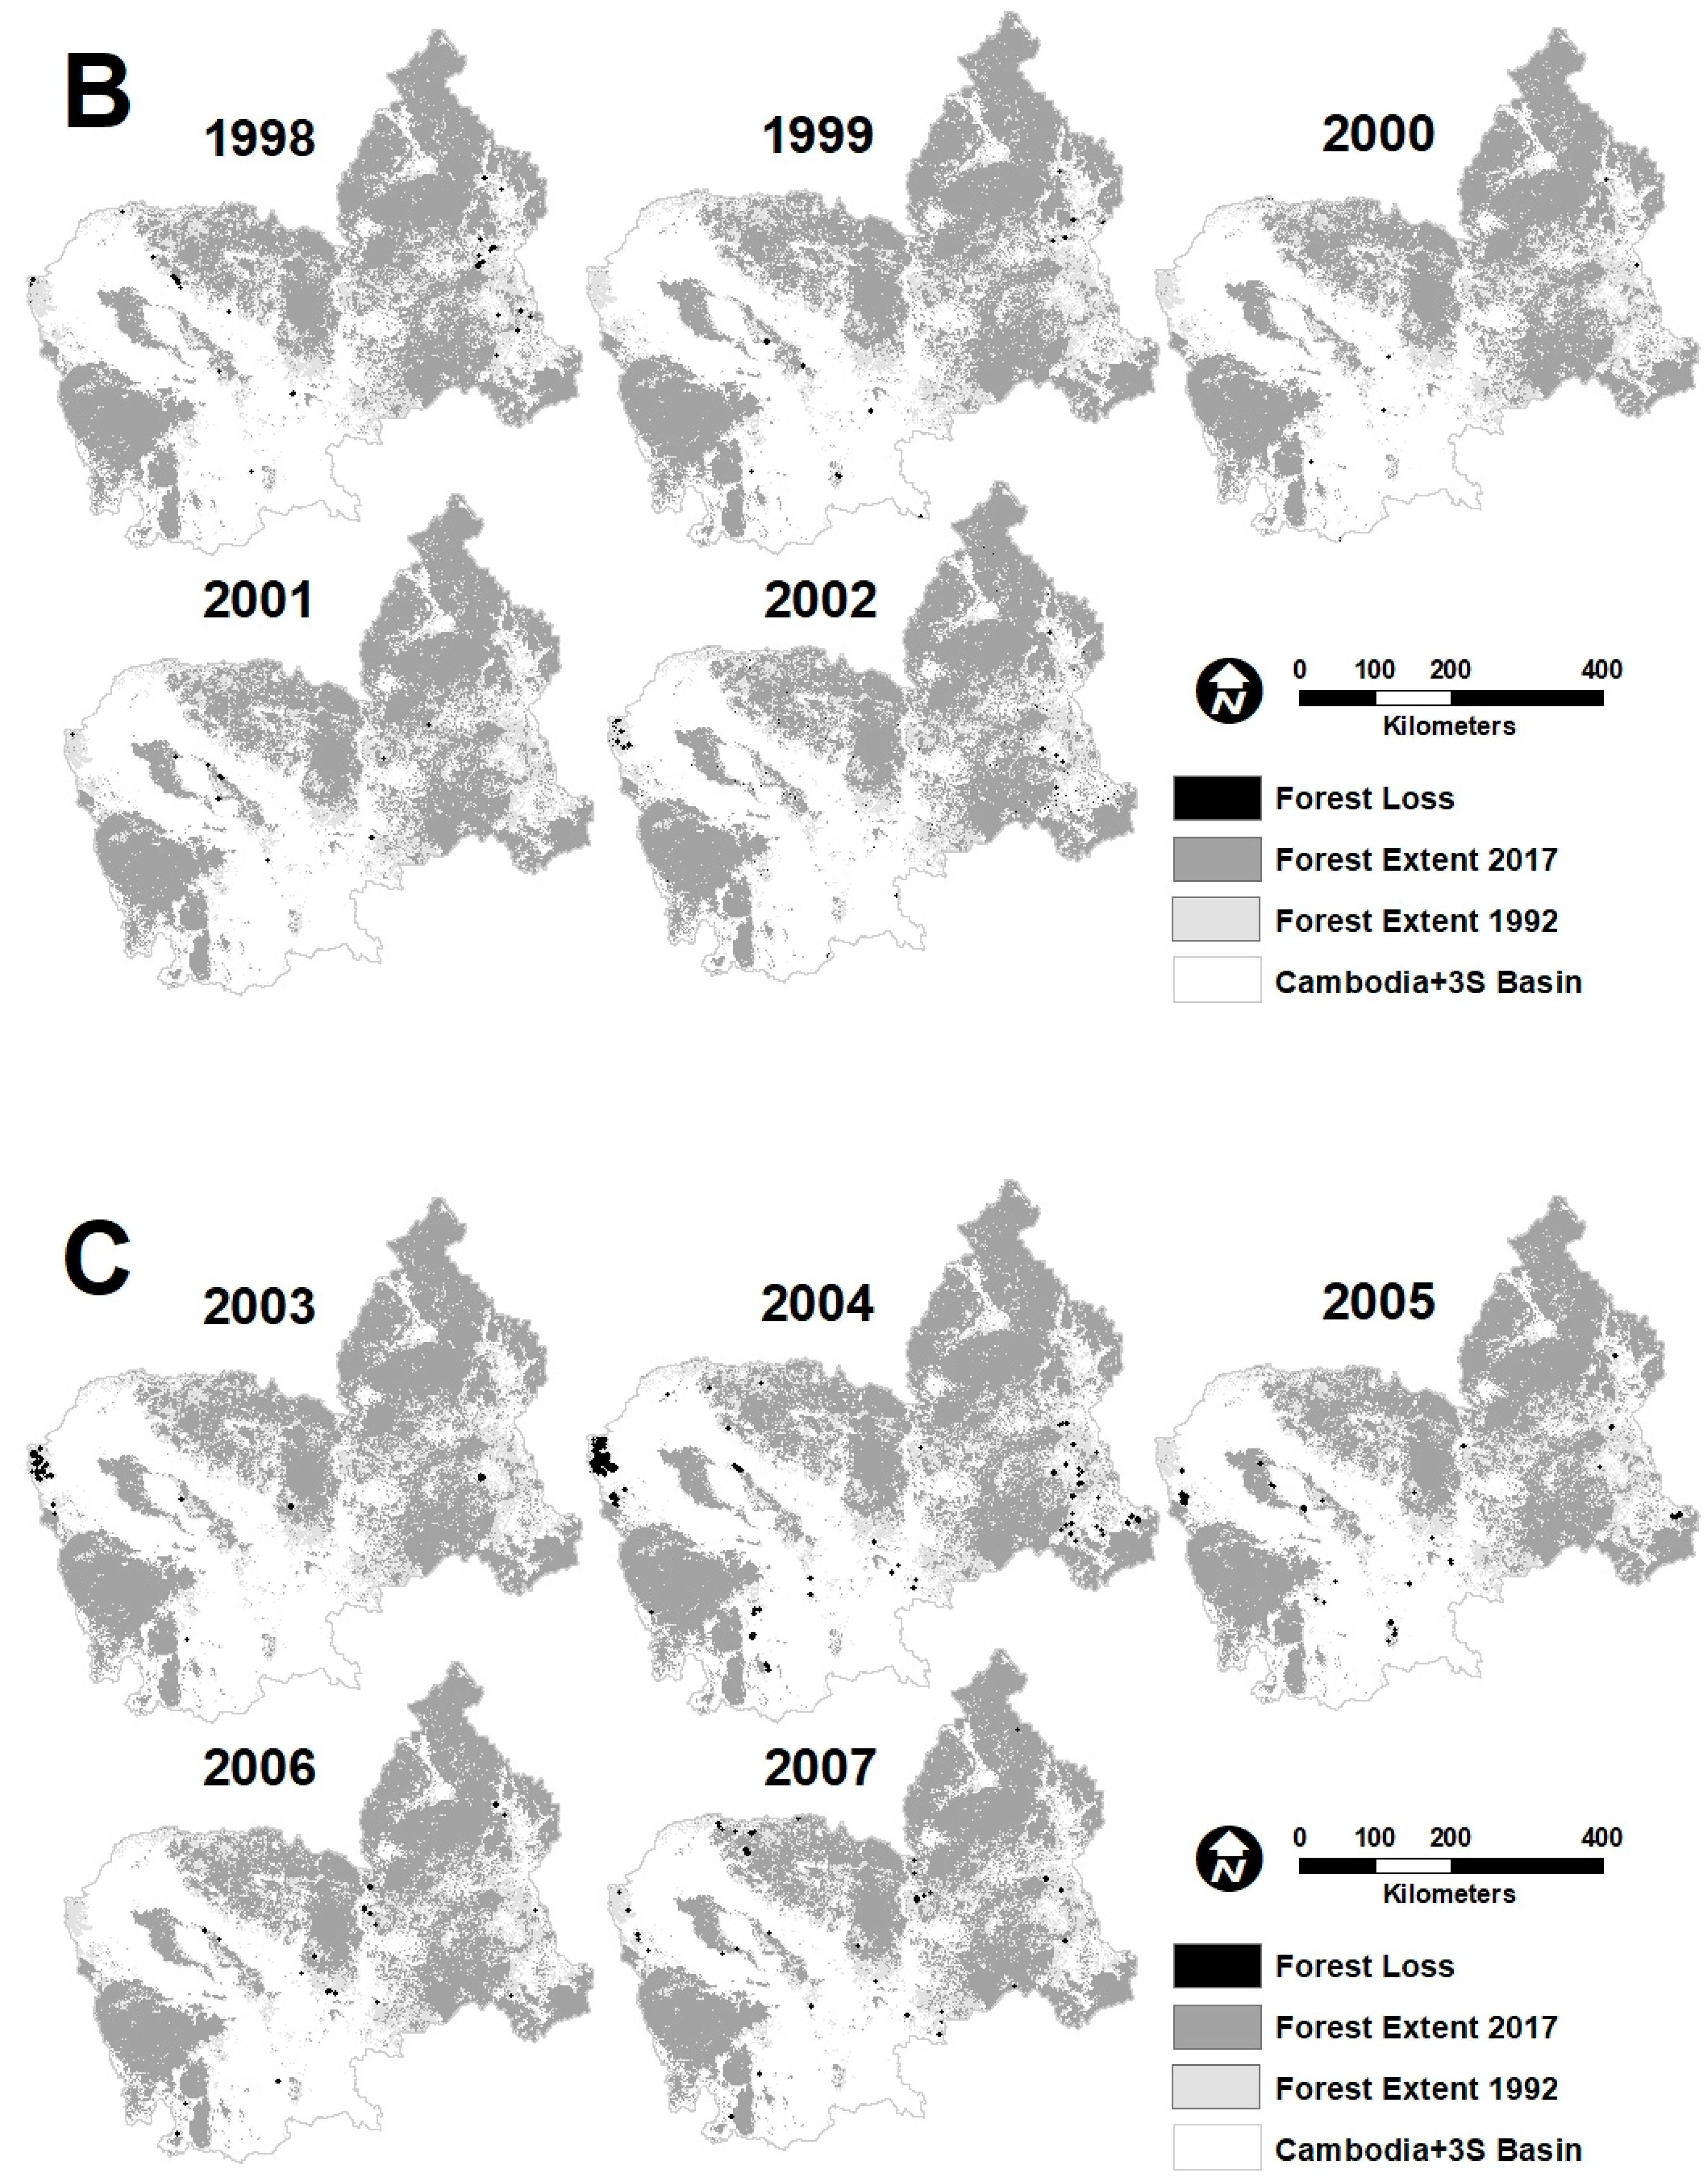
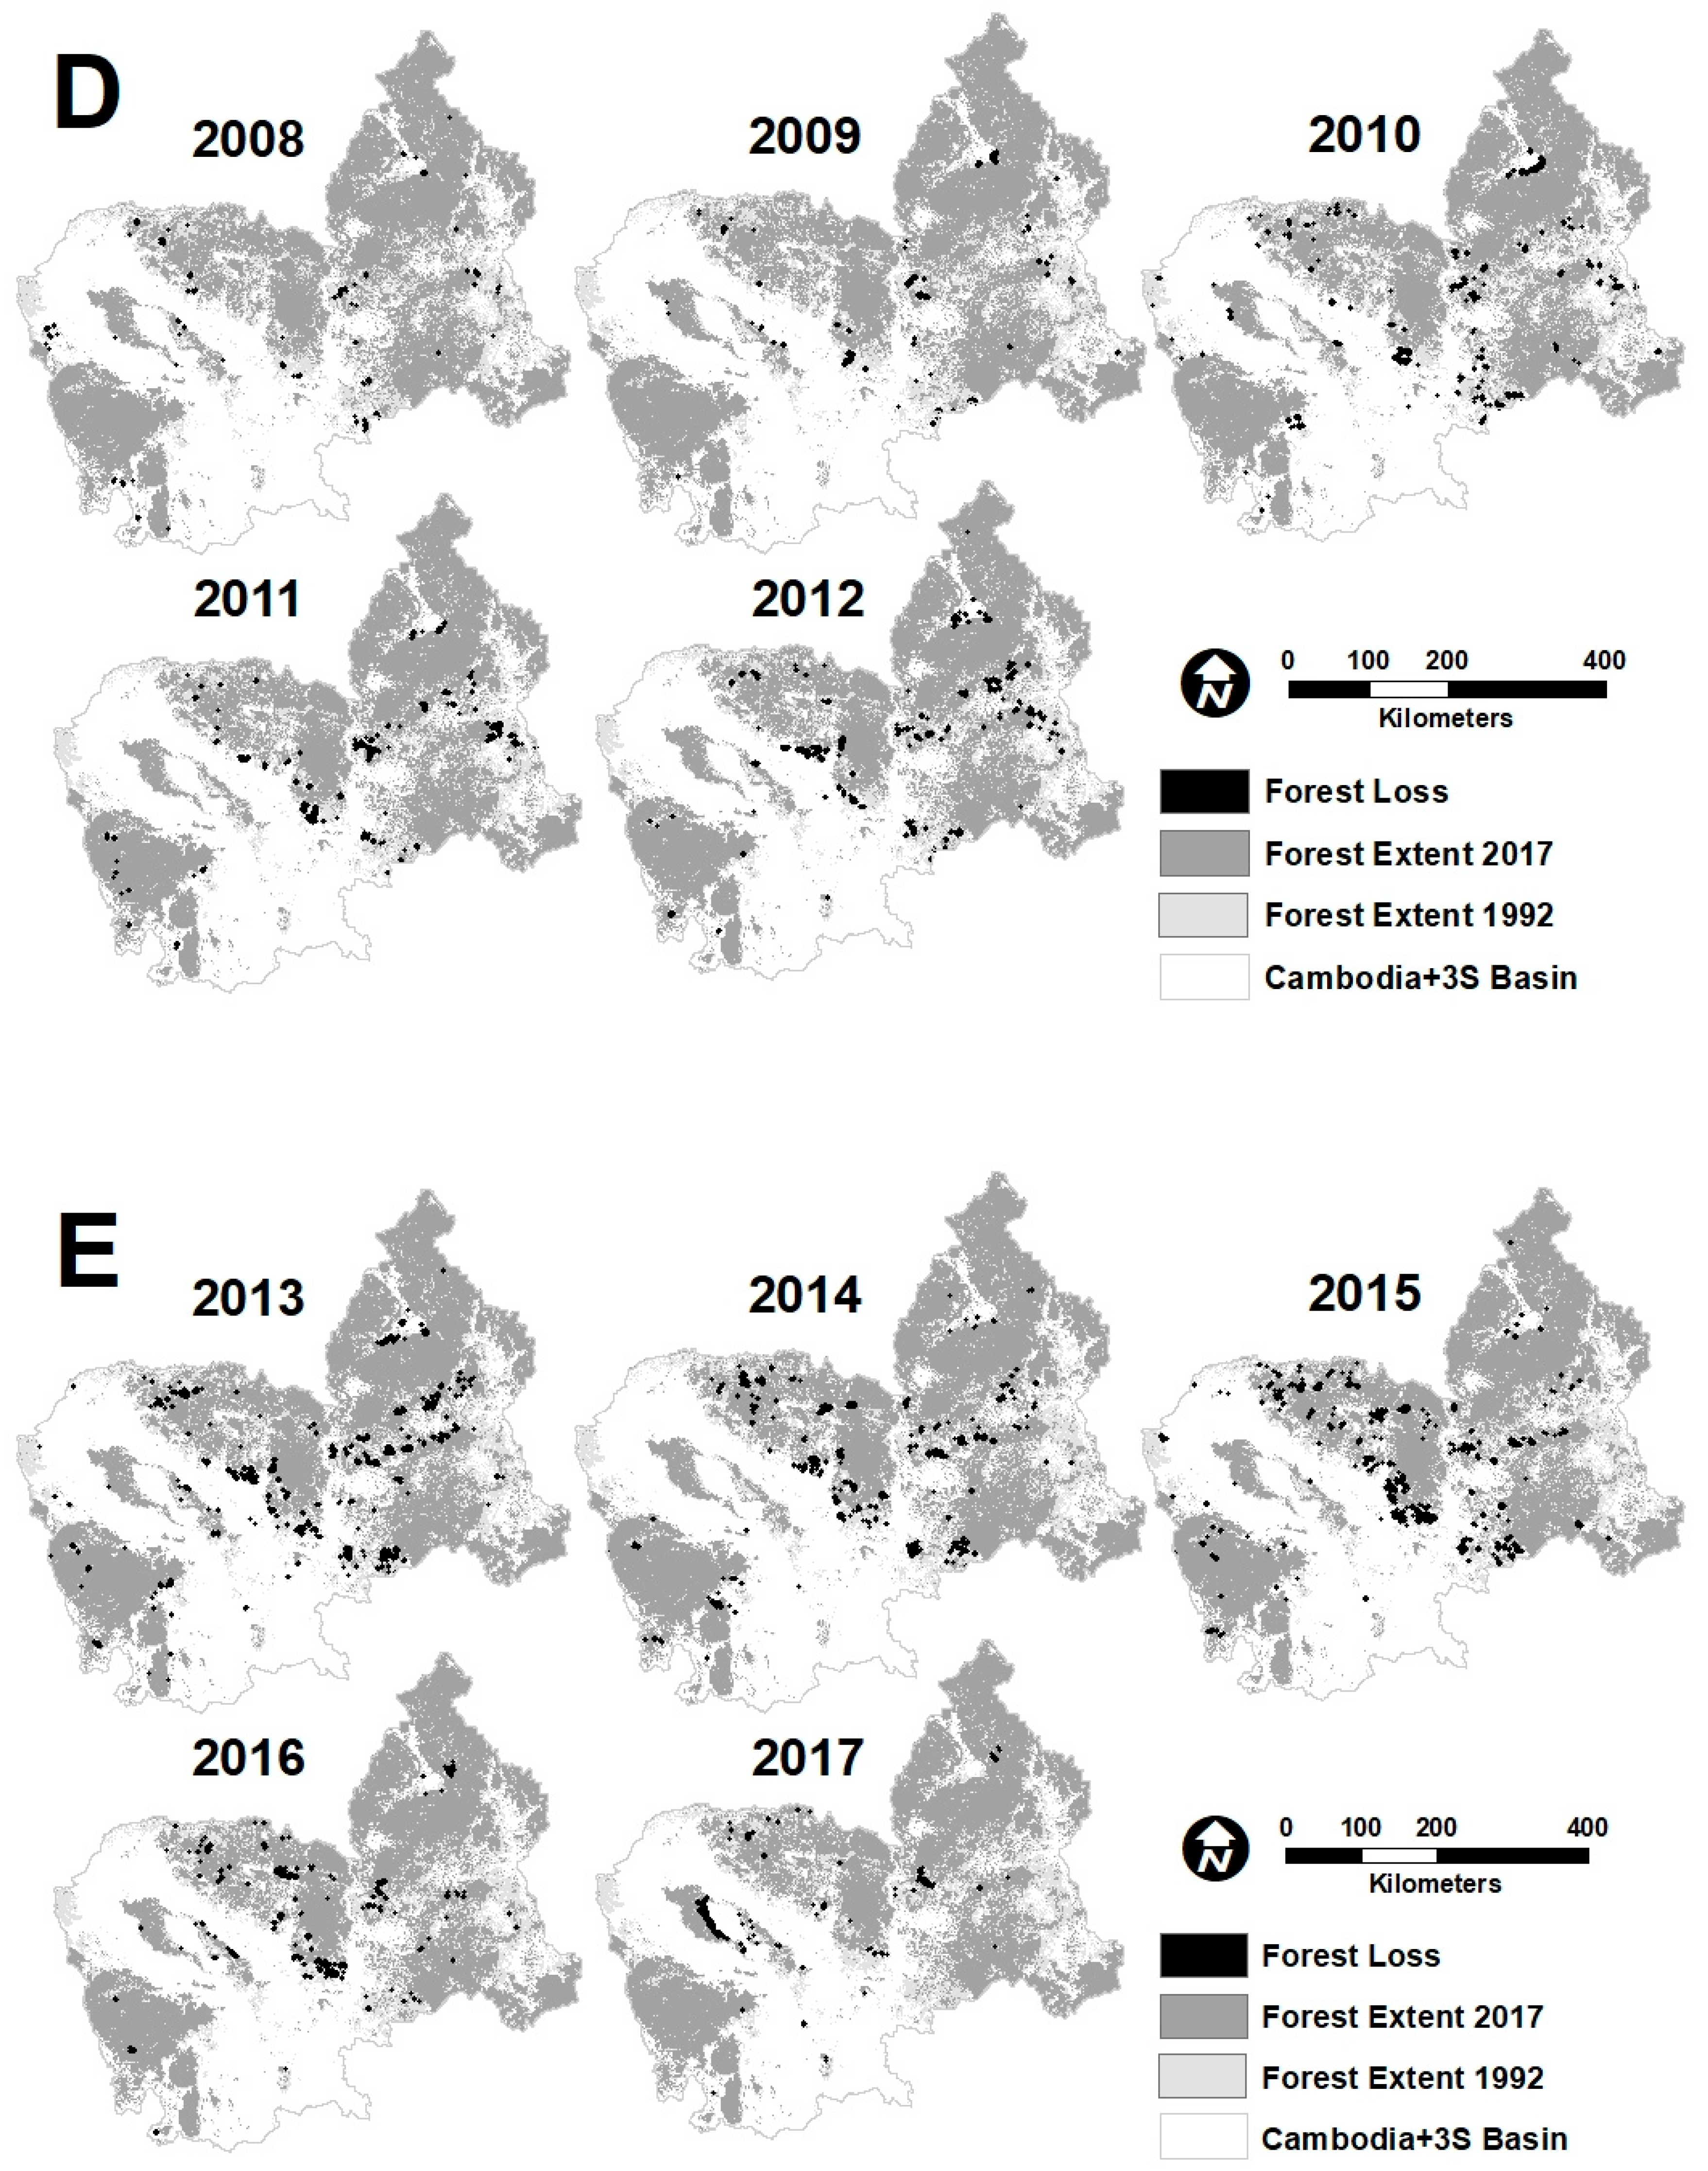
3.2. Deforestation Mapping (1993–2017)

Primary forest declined by 19% from 1993 to 2017 in Cambodia and the 3S Basin (Figure 4), totaling 23,923 km2 of forest loss. Forest-loss rates for Cambodia and the 3S Basin ranged from 0.3% to 2.3% annually. Inflection points in annual loss rates were observed in 2003 and 2010. Primary forest loss within the national boundaries of Cambodia totaled 17,150 km2 and occurred at a slightly higher rate compared to Cambodia and the 3S region. Forest-loss rates appeared to accelerate in Cambodia compared to Cambodia and the 3S region starting around 2010 (Figure 4).
Forest loss in the 3S Basin totaled 9227 km2 and was similar to Cambodia-only and Cambodia and the 3S when measured as a percentage of total forest. Forest-loss rates varied from 0.3% to 1.3% and almost the same inflection points of 2004 and 2010 were evident in the 3S cumulative loss curve but at a lesser rate than in Cambodia or Cambodia and 3S. Forest loss in Tonle Sap was low in terms of total area at 1944 km2, but was the highest of all study regions when examined as a percentage of total forest. Forest as a percentage of land cover in the Tonle Sap was lower than for the Cambodia and 3S region as a whole (26 versus 53%). Loss rates across the Tonle Sap region appeared to be relatively high and constant at 1.2% and the 2003 and 2010 inflection points that were evident for Cambodia and the 3S regions were not evident for the Tonle Sap region.
Forest losses for protected areas and community forests were lower when measured in terms of overall area (5696 and 190 km2, respectively) and relative percentages (9 and 10%, respectively). Forest-loss rates in the protected areas shown the 2004 and 2010 inflection points that were apparent for the other regions. In contrast, forest loss in community forests prior to 2010 was very low but increased to 3% per year after 2010.
Geographic patterns of forest loss differed across the different regions and through time (Figure 5; Figure A2). The Vietnam portion of the 3S region had high deforestation rates in the 1990s (0.9% per year), slowing in the 2000s somewhat (0.7% per year). Of the three countries making up the 3S Basin, Laos had the most intact forest but showed concentrated areas of loss mostly occurring between 2005 and 2010. Cambodia has 62% intact forest but appeared to show accelerating loss rates with many losses occurring after 2010. Areas of concentrated forest loss were adjacent to the Srepok River.
Forest loss in the Tonle Sap region appeared to occur throughout the 25-year time period and predominantly occurred in small patches. After 2010, deforested areas have coalesced into larger patches. The western region of Cambodia has many large patches of forest loss centered on highland regions, such as the Cardamom Mountains. The northwest region of Cambodia along the border with Thailand shows a concentrated area of forest loss that occurred in the early 2000s and abated only after nearly all remaining primary forests were lost.

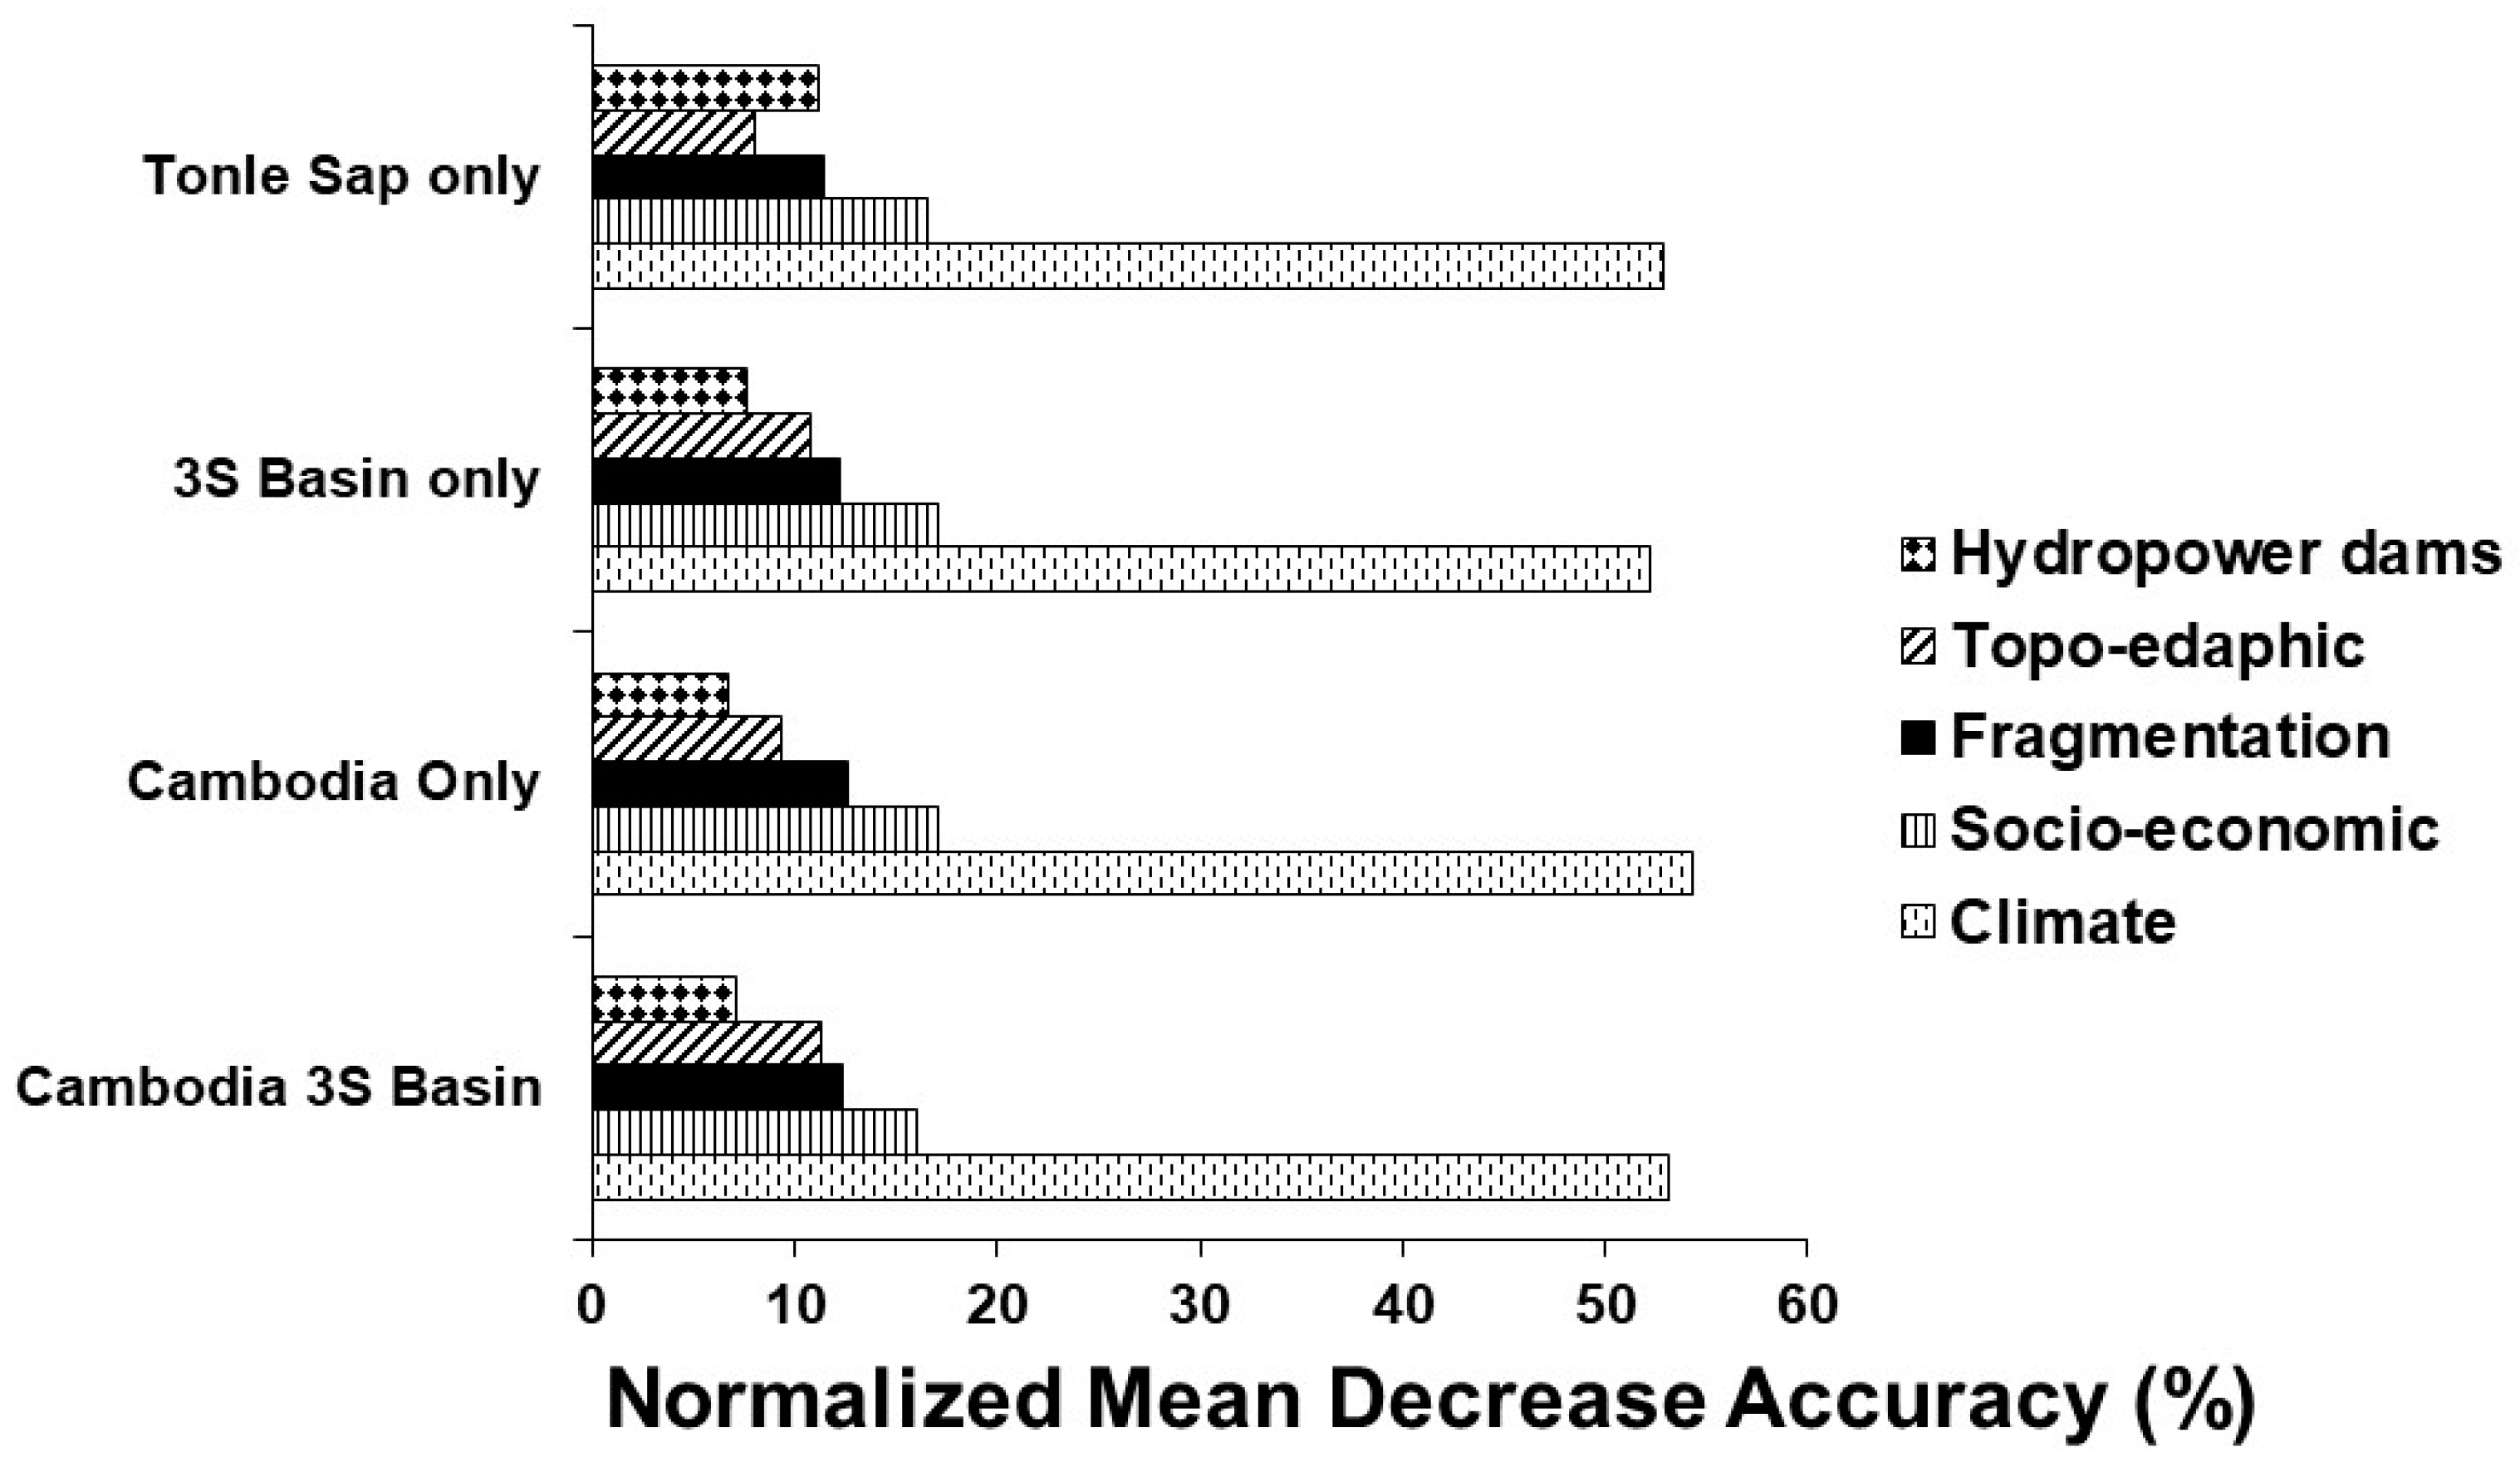
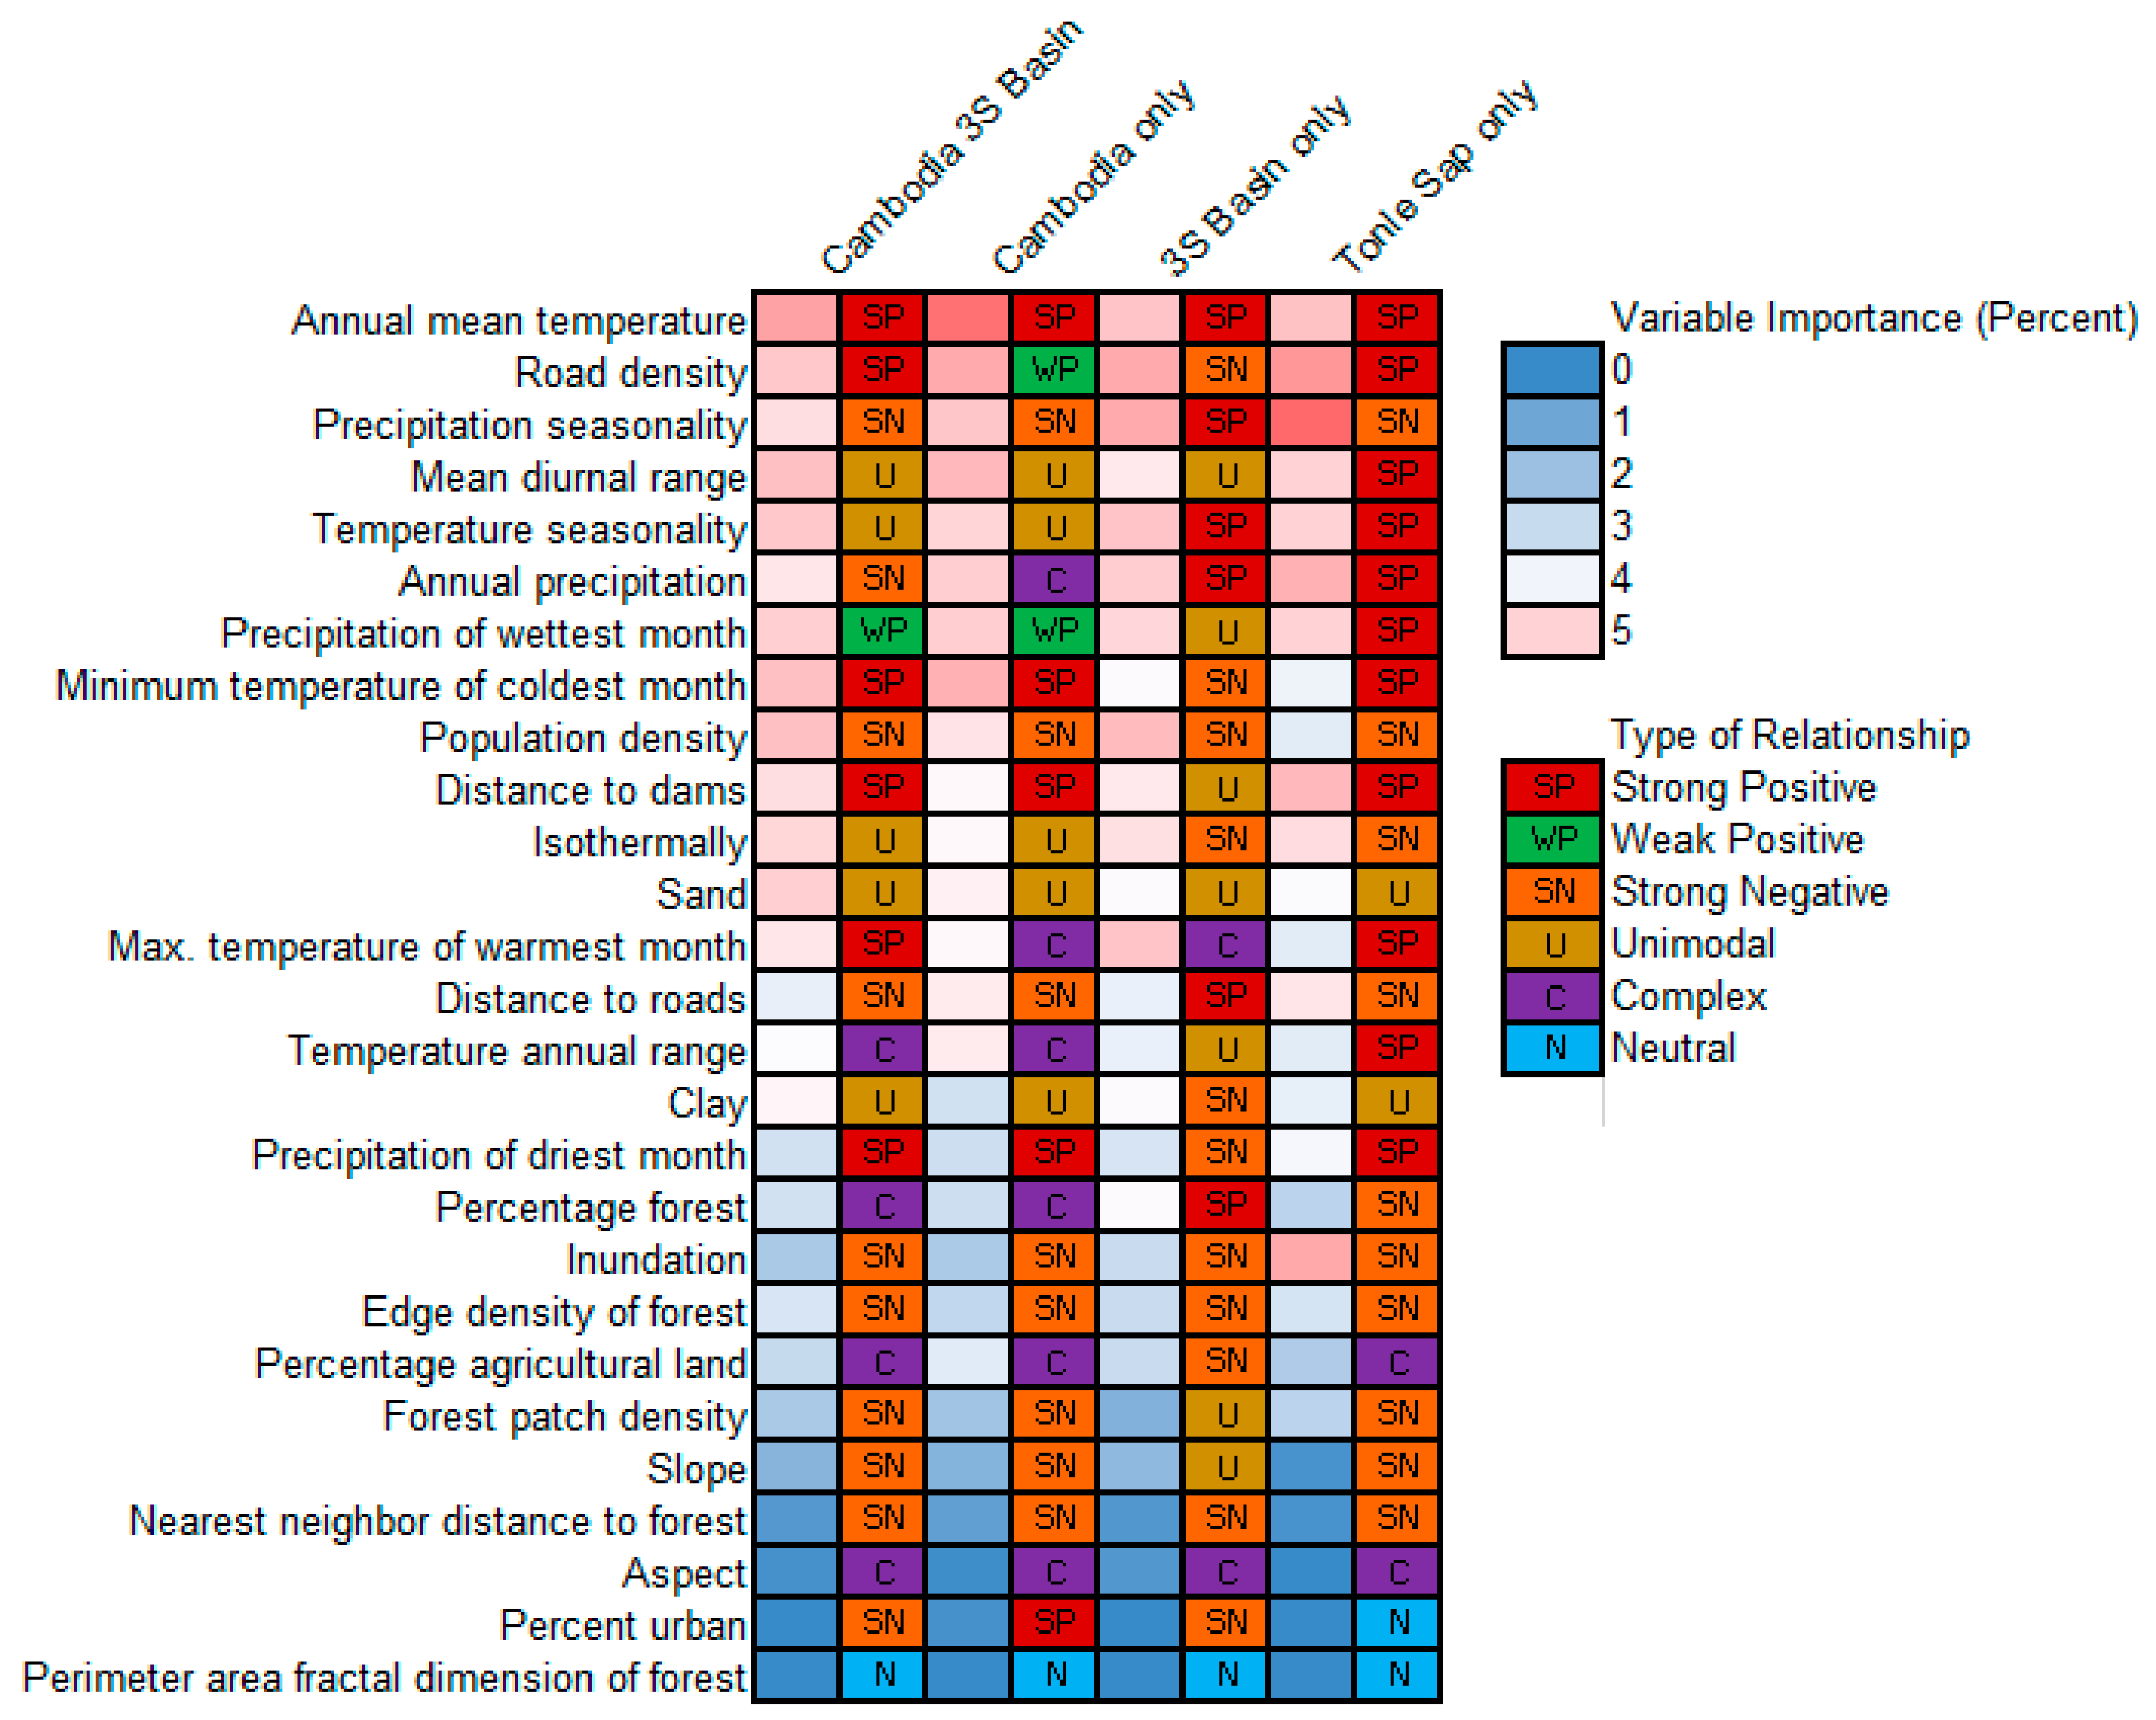
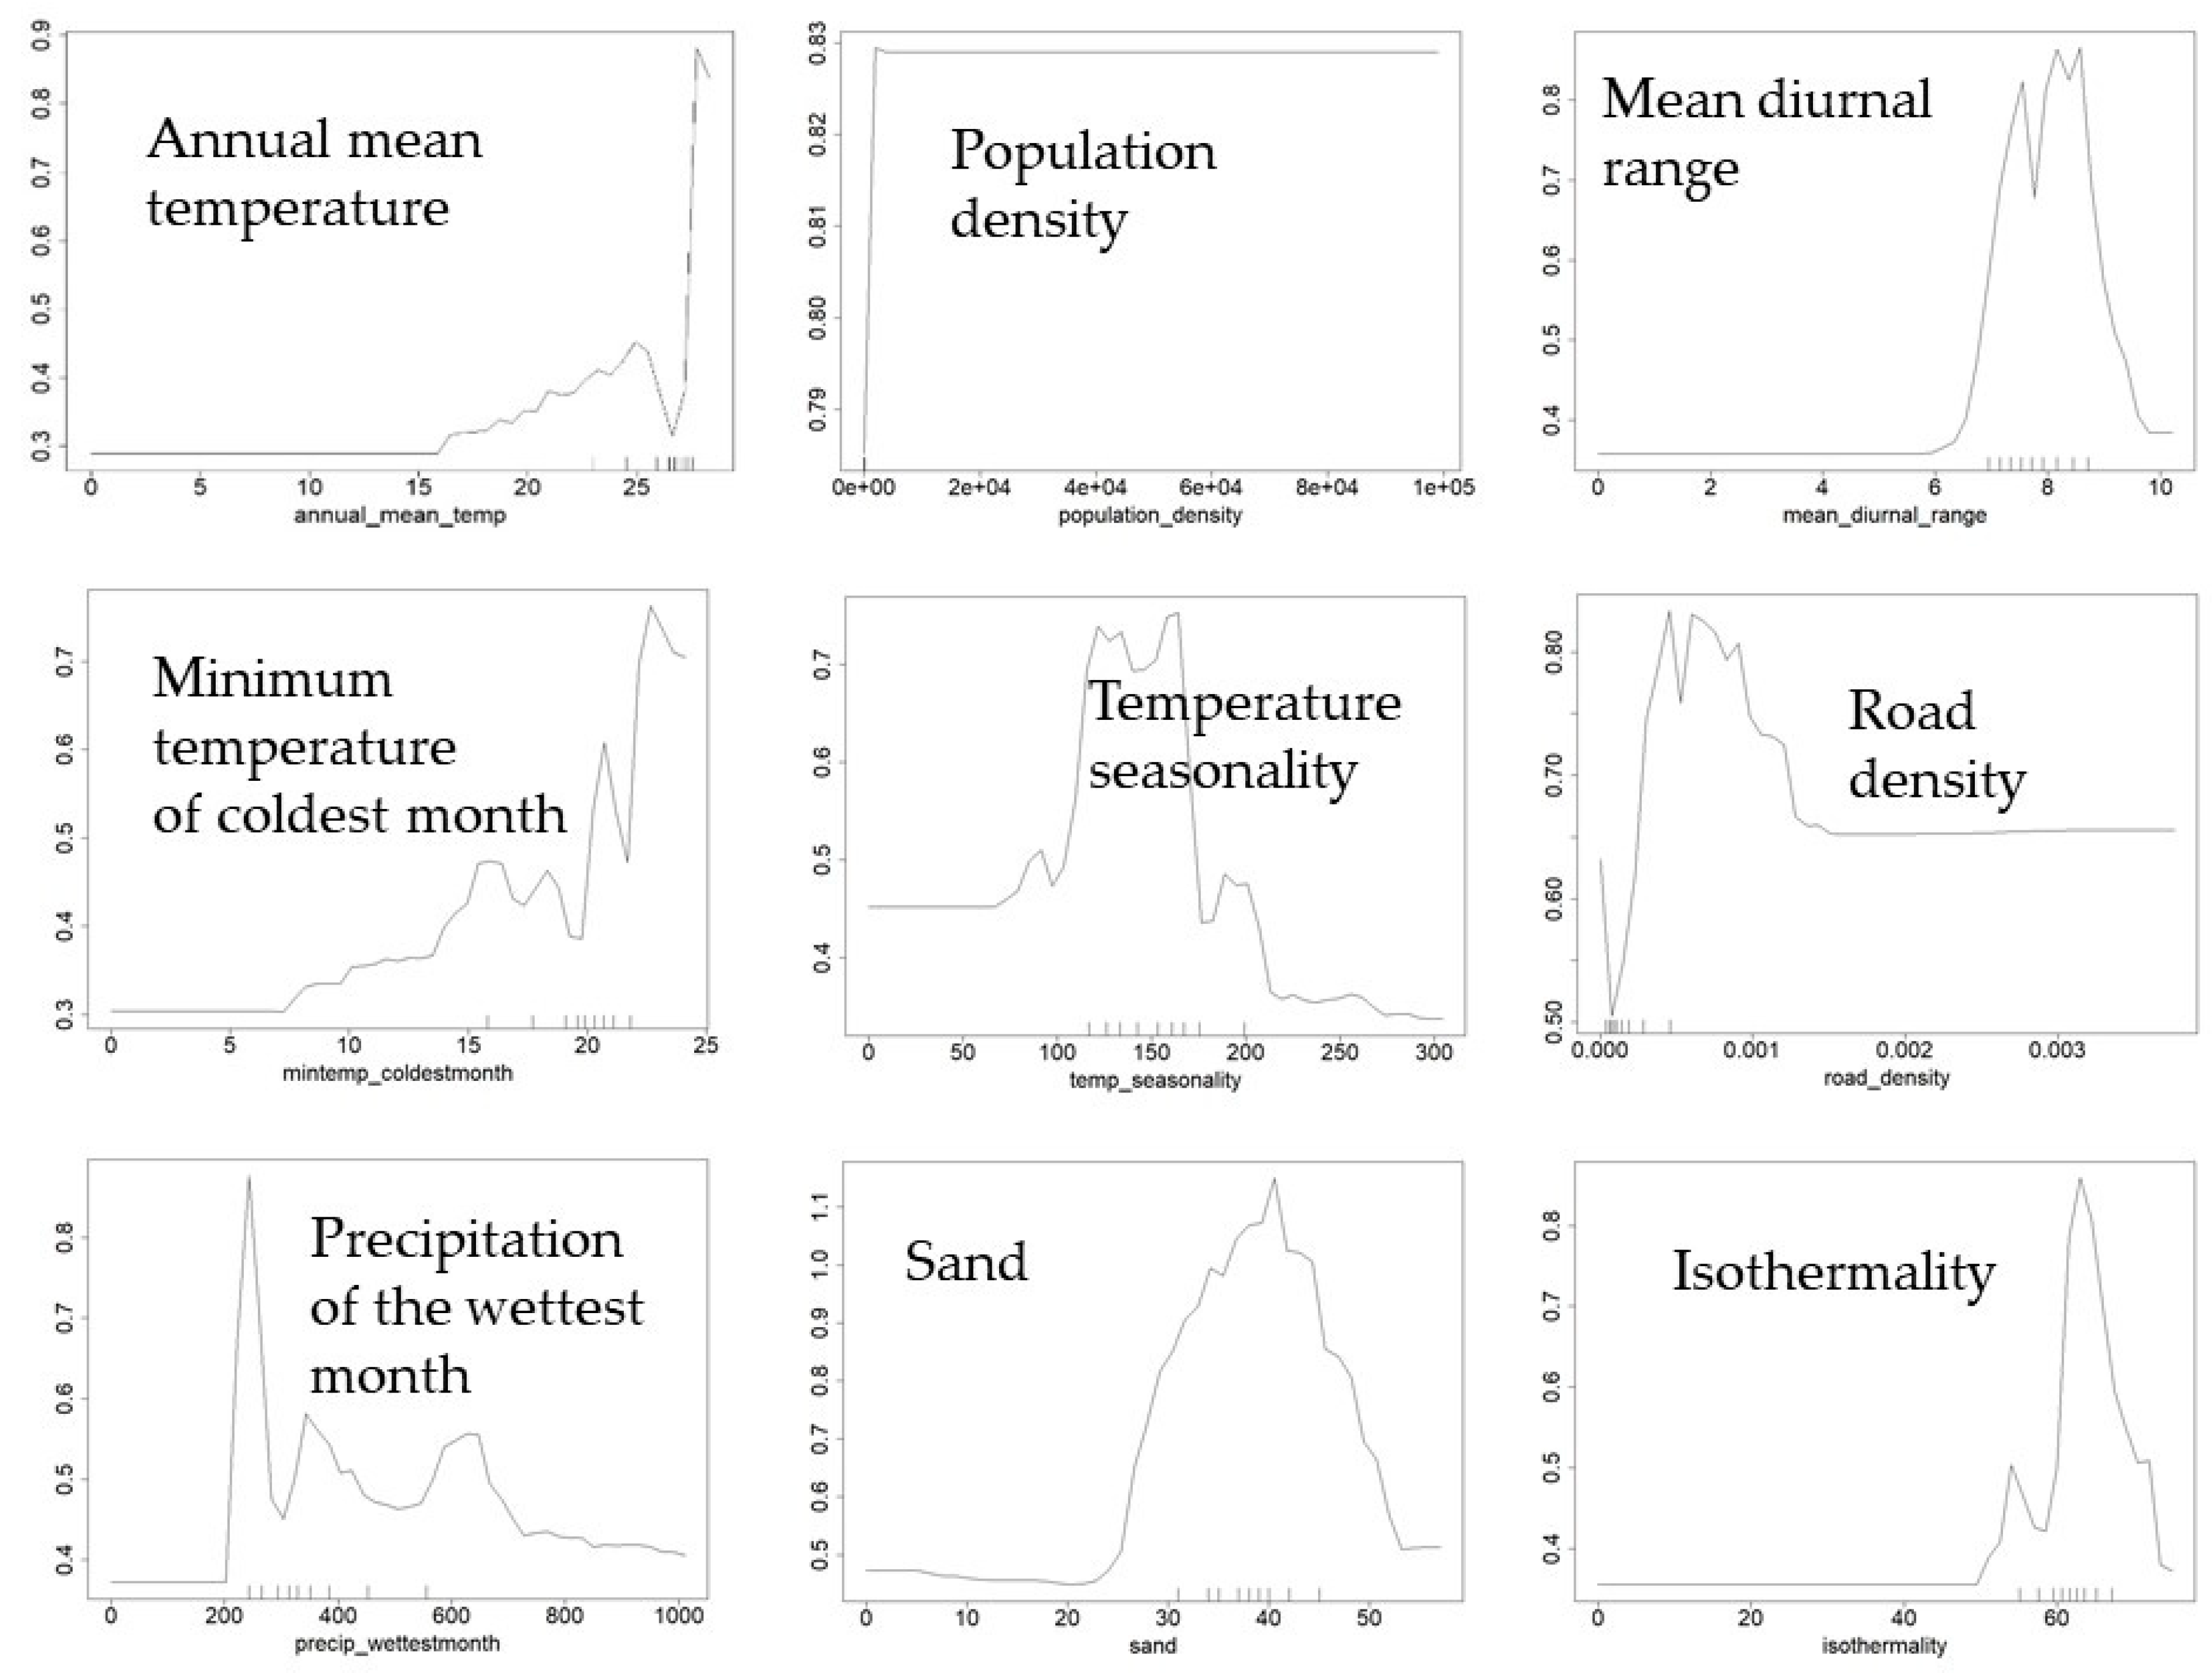
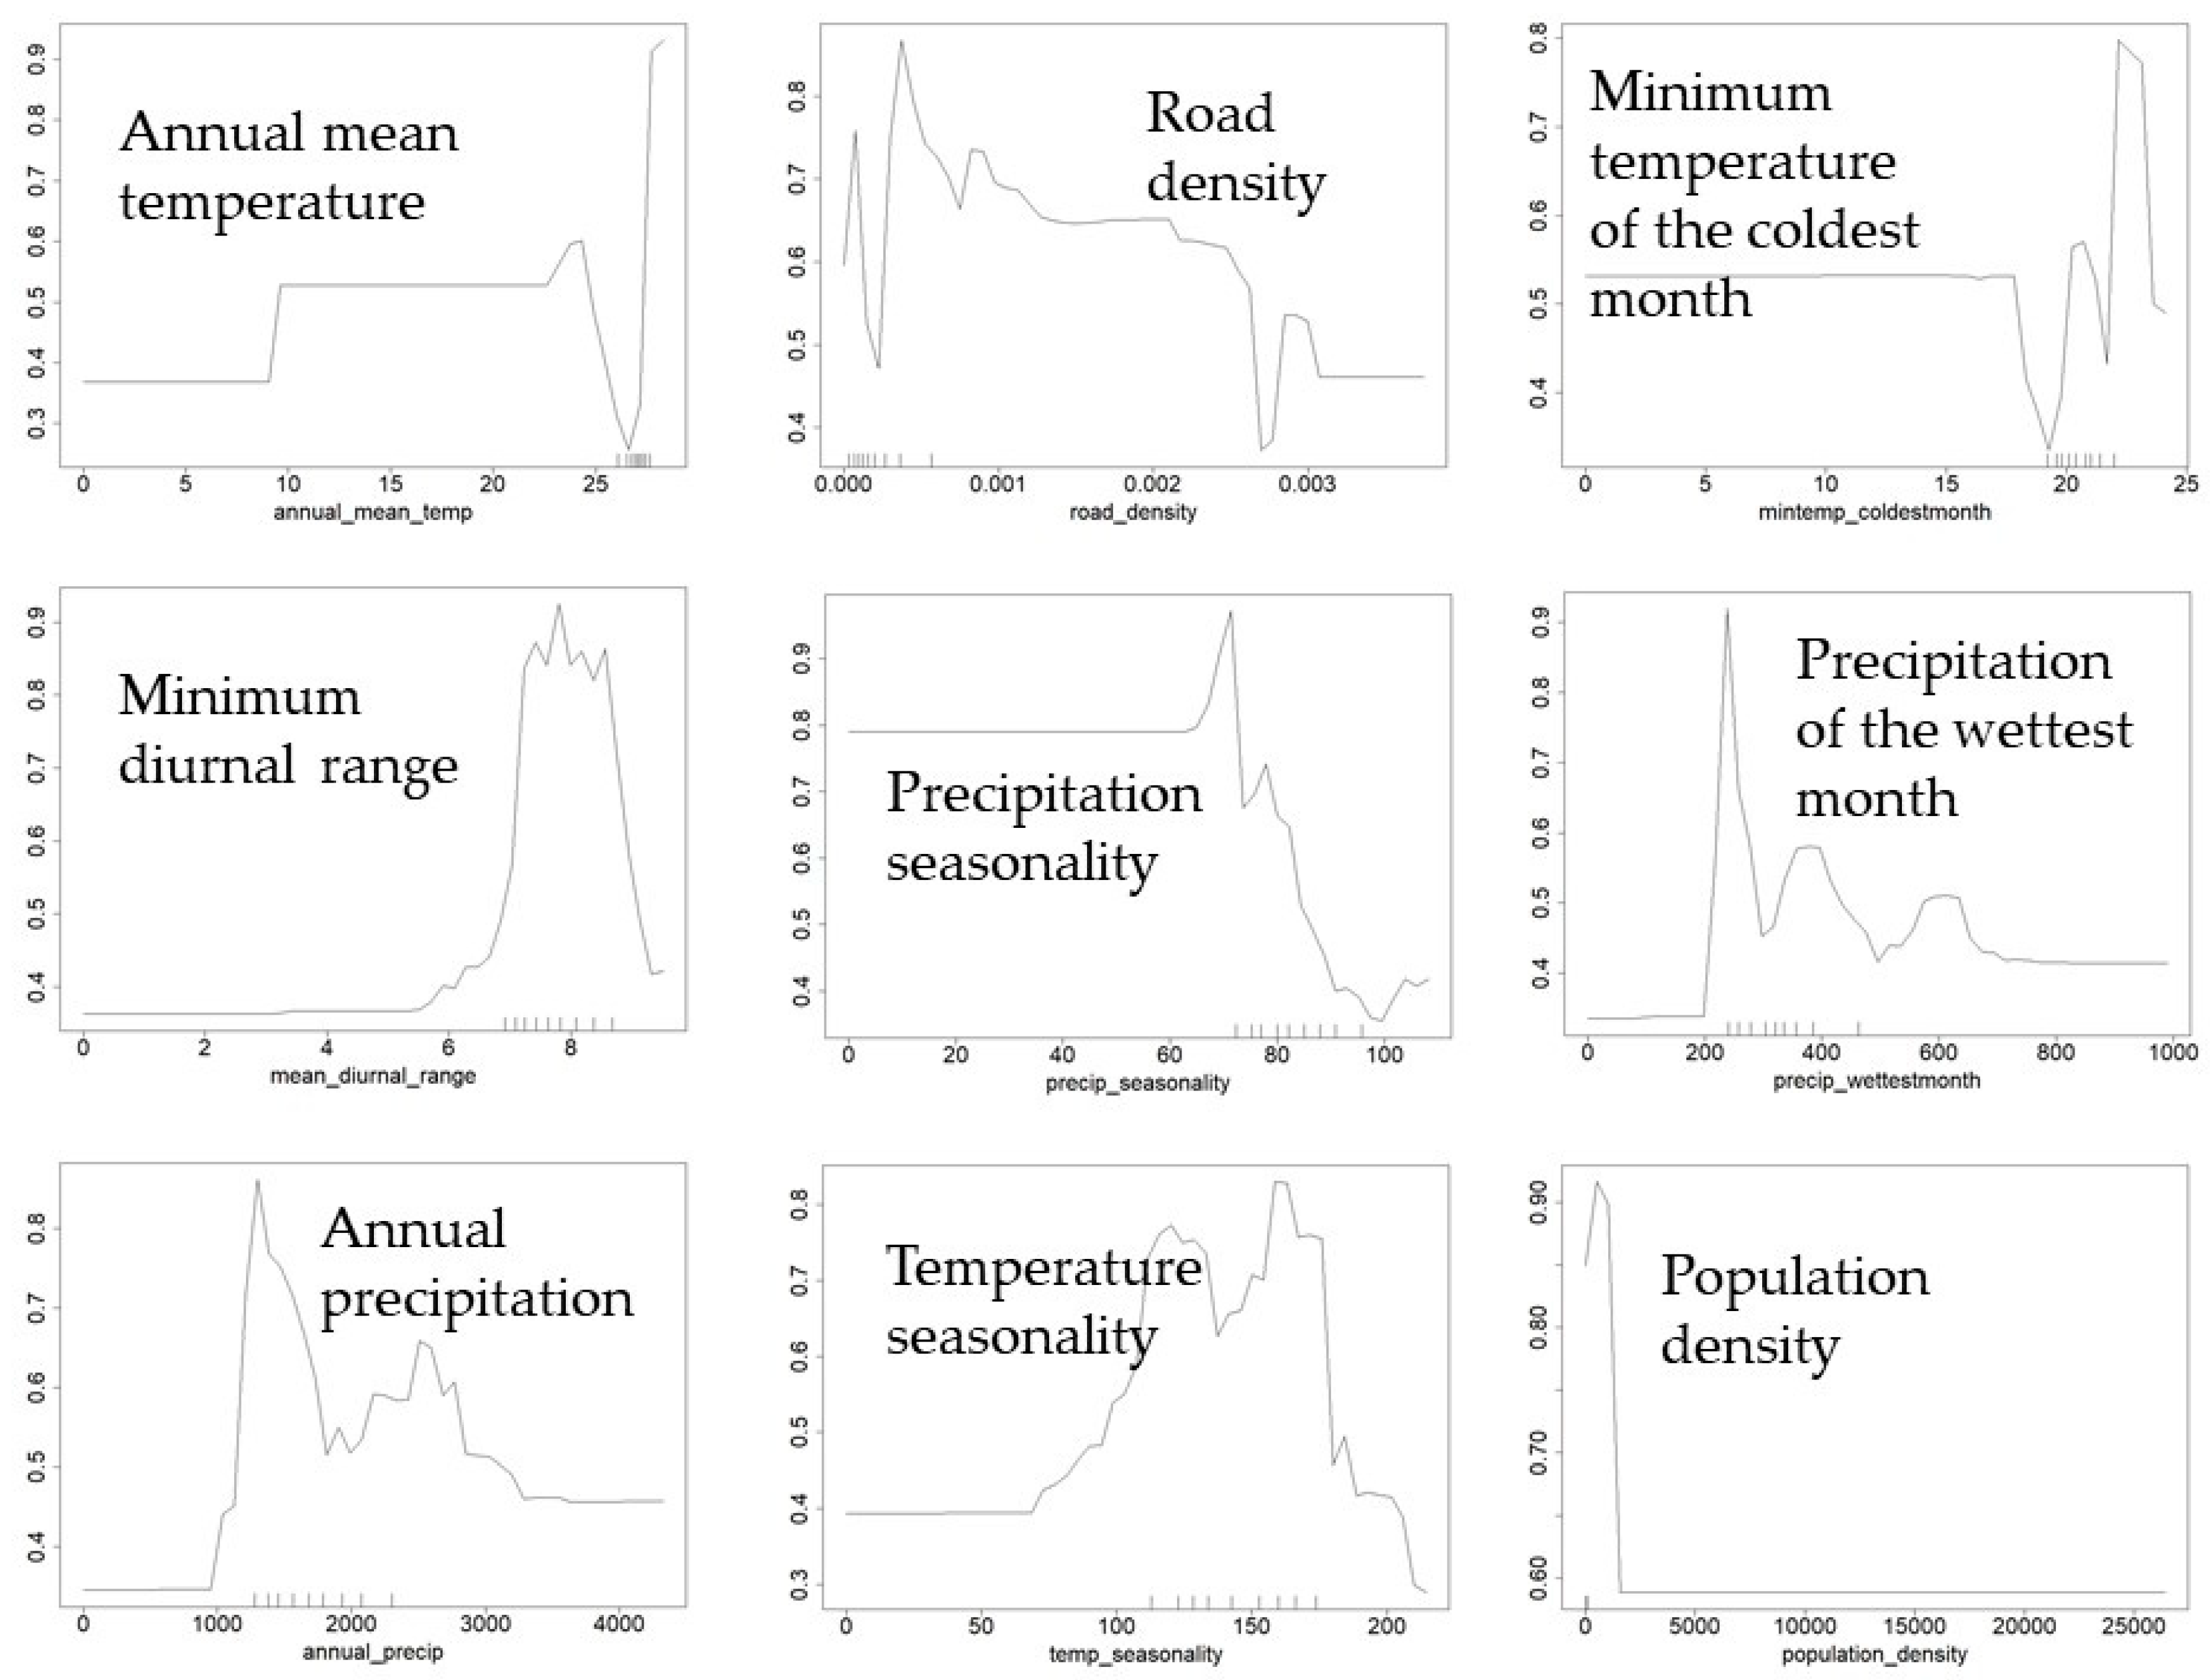
3.3. Statistical Modeling of Deforestation

Statistical models of deforestation predicted more than 70% of the variance in all the study areas (Table 3), as measured using 2000 randomly selected independent validation points. The model for the Tonle Sap was the most accurate at 78% overall accuracy and a kappa value of 0.58. The Tonle Sap model had a specificity (true negative rate) of 82% and a sensitivity (true positive rate) of 75%. Overall accuracy for the Cambodia-only, 3S, and Cambodia + 3S models ranged from 70 to 72%, and kappa ranged from 0.34 to 0.40 for those three regions. All three regions had higher sensitivity (true positive rate ranging from 79 to 81%) than specificity (true negative rate ranging from 53 to 60%).
Climatic variables were the most influential drivers of deforestation in our study areas (52–54% of variable importance) followed by socio-economic parameters (16–17%), the landscape fragmentation metrics (11–13%), topo-edaphic variables (8–11%), and finally hydropower dams (7–11%) (Figure 6).
While the relative influences of predictor groups were strikingly similar across the regions, different individual variables were important in each region (Figure 7). The Cambodia + 3S and Cambodia-only models tended to be the most similar, sharing seven of the top nine variables and the patterns of the predictor variables generally being similar. The Cambodia + 3S and Cambodia-only models also overlapped spatially by 77%. The 3S region and Tonle Sap models shared six and five variables out of the top nine variables with the Cambodia + 3S model and overlapped spatially 33% and 11% respectively with the Cambodia + 3S model. Generally, the Tonle Sap model compared to the 3S region model exhibited partial response curves with more similar patterns to the Cambodia + 3S model despite the fact that it represented a smaller subset of the larger study area (Figure 7; Figure A3, Figure A4, Figure A5 and Figure A6).
Annual mean temperature was the most influential predictor for forest loss in Cambodia + 3S Basin and Cambodia-only models, the fifth most important variable in the 3S model, and the sixth most important variable in the Tonle Sap model (Figure 7). In the Cambodia + 3S Basin, Cambodia-only, and the Tonle Sap models there was a strong positive relationship between mean annual temperature and forest loss, which potentially pointed to more forest loss in floodplains (Figure A3, Figure A4, Figure A5 and Figure A6). Other important climatic predictors included precipitation seasonality, mean diurnal range, temperature seasonality, and annual precipitation. Precipitation seasonality generally showed a negative relationship with forest loss with the exception of the 3S region, in which it showed a positive response (Figure A5). Forest loss had a unimodal relationship with mean diurnal range with the exception of the Tonle Sap region. The relationship between forest loss and temperature seasonality was unimodal for the Cambodia + 3S and Cambodia-only models but was positive for the Tonle Sap 3S models. Forest loss and annual precipitation generally had positive relationships. Our complex models did not screen for multicollinearity and therefore if two variables exhibited similar spatial patterns it is possible that one variable may replace the other variable showing a much higher variable importance.
Road density was the most important land use variable followed by population density. Road density was the most important predictor in the 3S model, the second most important predictor in the Tonle Sap and Cambodia-only models, and the sixth most important predictor in the Cambodia + 3S model. The Cambodia + 3S, Cambodia-only, and Tonle Sap models generally had similar relationships between forest loss and road density with higher levels of forest loss being associated with a greater density of roads (Figure 7; Figure A3, Figure A4, Figure A5 and Figure A6). In contrast, the 3S region showed a strong negative relationship between forest loss and road density suggesting that forest loss is likely occurring in less developed areas in the 3S region compared to Cambodia as a while. Population density was the third most important predictor in the 3S model, the second most important predictor in the Cambodia + 3S model, ninth most important for the Cambodia-only model, but only the fourteenth most important predictor for the Tonle Sap model. Population density was one of the most skewed variables with large urban areas, such as Phnom Penh and Siem Reap, having very high values, while much of the remaining parts of Cambodia and the 3S region have much lower population densities. In the Cambodia + 3S and Cambodia-only models, there was a maximum at low, but not the lowest, population densities, suggesting that forest loss was likely to occur in areas with a low population density, but perhaps not in the most remote areas. In contrast, the relationship between forest loss and population density in the 3S region suggest that forest loss is most likely to occur at the lowest population densities (Figure A5). Inundation was one of the top three variables influencing deforestation in Tonle Sap region. Distance to dams was the fifth most important predictor in the Tonle Sap and the tenth most important predictor in the 3S model.
Among the landscape metrics, the 1-km spatial scale was the most predictive and is reported in all subsequent results. No single landscape metric accounted for 5% of total variable importance, but among the landscape metrics, forest edge density, percent forest, and percent agricultural land were the most important metrics. Percent forest was the most influential landscape metric in the 3S Basin, and percent of urban landscape was the most influential in Cambodia only. Landscape metrics related to agricultural land were influential in the Cambodia + 3S, Cambodia only and Tonle Sap only. Topographic variables were relatively unimportant, but percent sand consistently was 4 to 5% of variable importance. The relationship between forest loss and percent sand had a unimodal relationship across all four study regions, possibly indicating that forest loss on medium-textured soils was more likely than on coarse or fine-texture soils (not overly high or low in sand). Distance to hydropower dams accounted for 4 to 5% of variable importance across all four models. Across the four study regions, direct conversion of primary forest to reservoirs accounted for 1.3% in Cambodia + 3S, 1.0% in Cambodia, 2.9% in the 3S, and 0.0% in the Tonle Sap.

4. Discussion

Our study differs from other deforestation studies using remote sensing in the region because it encompasses a larger time span (25 years) and it includes annual-resolution deforestation events. In contrast, other recent studies have typically looked at time periods encompassing ten [6], twelve [3,70], or seventeen [11] years. This is significant because it allows us to compare rates of deforestation over time more accurately than other studies. Our study also examines a wide range of climatic, topographic, and land-cover drivers that are associated with forest-cover change in different geographical regions. This adds to the urgency to identify drivers of ecosystem change in the region [8,12] and is novel study to identify the spatial variation of important drivers of forest loss in the region.

4.1. Deforestation Patterns over Time

Our results suggest that deforestation rates in Cambodia are accelerating and, if left unchecked, may result in the widespread loss of primary forests in Cambodia and the Lower Mekong River Basin, with accompanying losses of biodiversity, habitat connectivity, and ecosystem services. Annual deforestation rates ranged from 0.3% to 2.3%, with an average annual deforestation across the 25-year time period of about 0.8% per year. We identified three distinct time periods with different deforestation rates. 1993 to 2003 had a deforestation rate that was around 0.5%, 2004 to 2010 had a rate of 0.9%, and 2011 to 2017 had an annual deforestation rate of 1.8%. Cambodia has a unique recent human history among Southeast Asian countries, with Pol Pot and the Khmer Rouge fighting to regain support throughout Cambodia until 1997. Political strife and the vestiges of Cambodia’s civil war likely decreased deforestation relative to neighboring countries such as Vietnam and Thailand. In their global analysis of forest loss from 2000 to 2012, Hansen [3] identified Cambodia as the tropical nation with the fourth highest forest loss at 0.6% per year following Malaysia (1.2%), Indonesia (0.8%), and Guatemala (0.7%). In a more recent analysis, Potapov [11] found an annual deforestation rate in Cambodia that was around 1.2% for the time period from 2000 to 2017. Our findings corroborate the findings of [3,11] and suggest higher deforestation rates in recent years compared to the 1990s. Rapid acceleration in deforestation rates in Cambodia are in strong contrast to other tropical countries, such as Brazil, that have been slowing deforestation rates in recent decades [3].
Other authors have noted that deforestation rates in Cambodia (3.8% per year) are currently much higher than in neighboring Vietnam (2.5% per year) or Thailand, where reforestation and conservation efforts have been more successful [70]. Deforestation rates tracked rubber prices in both nations. Although our study did not analyze the Vietnamese portion of the 3S region distinct from the 3S region as a whole, we note that deforestation in the Vietnamese portion of the 3S was more evident in the 1990s compared to the 2000s (Figure 5). The reverse was true on the Cambodian side of the 3S Basin, possibly suggesting that either the Vietnamese government has been more successful at slowing deforestation or preventing illegal logging than the Cambodian government or presumably Vietnam did not have much forest left to protect.

4.2. Forest Loss in Protected Areas and Community Forests

Protected areas and community forests have been suggested as potential forest conservation strategies; however, establishing these areas without enforcement can result in forest loss from illegal logging and illegal settlement and has been noted to be a major problem in Cambodia [29]. Lack of effective enforcement and challenges caused by illegal activities led to the downgrading and loss of 120 protected areas totaling 5915 km2 [71]. Remote sensing has the potential to monitor the efficacy of forest policies in protected areas. Our findings suggest that protected areas had lower rates of forest loss than non-protected areas; however, cumulative forest loss in protected areas still approached 20%, suggesting that protected area enforcement continues to be a major problem. Globally, Wade et al. [28] estimated that between 2001 and 2019 there was an annual loss of approximately 0.2% per year of forest area within protected areas worldwide. In contrast, we estimate a forest-loss rate of 0.5% per year within protected areas from 1993 to 2017. Wade et al. [28] found Cambodia and Côte d’Ivoire to be the two tropical countries with the highest rate of forest loss within protected areas in the world. In our study, the largest forest losses from protected areas occurred in 2004 and 2010. Similar inflection points of forest loss for protected areas as for the Cambodia + 3S model suggests that similar events occurring around 2004 and 2010 that led to the increases in deforestation overall may also be playing a role in deforestation of protected areas.
Protected areas constitute a core habitat for a variety of critically endangered species, including Asian elephants (Elephas maximus) [72], clouded leopard (Neofelis nebulosa) [73], the sun bear (Helarctos malayanus), Mekong giant catfish (Pangasianodon gigas) and giant barb (Catlocarpio siamensis) [74]. Protected areas account for 26% of Cambodia’s total area [27], so forest losses will become more ecologically harmful as the total forest area continues to shrink. Given forest fragmentation in the Lower Mekong Basin and the increasing isolation of remaining forest patches, management of Cambodia’s forests should focus on maintaining protected areas as core wildlife habitat while creating corridors that allow for movement into smaller more isolated forest patches. Minimizing forest edges, invasions by exotic species, and hunting of keystone species may be critical goals for protected areas in the Mekong Basin. Although beyond the scope of our current study, Landsat and Sentinel imagery offer tremendous potential for monitoring individual protected areas and providing land managers with maps that can identify areas of recent forest loss, which may help direct on-the-ground monitoring and policing.
Community forests were not established with the same strict conservation mandate as protected areas but provide an alternative method for enhancing forest biodiversity while providing sustainable forest use [32]. Community forests and protected areas lost, respectively, about 10% and 20% of their total forest; however, the temporal patterns were different. The vast majority of community forest loss occurred in 2009 and 2015, and the large forest reductions in protected areas occurred in 2004 and 2010. Although community forests only cover 0.7% of Cambodia [32] and do not have a stated goal of zero harvest, recent forest loss may warrant monitoring. Thi et al. [75] noted that some community forests resemble a “hollow drum”, with extensive forest harvesting toward their centers but appearing pristine to authorities on the outside. When combined with socio-economic data, remote sensing can serve as a valuable tool for measuring forest loss and identifying factors that may lead to some community forests to be more vulnerable to deforestation.

4.3. Forest Loss in Floodplains

The Mekong–Tonle Sap floodplain is unique because the Asian monsoon causes substantial seasonal flooding, which reverses streamflow in the Tonle Sap River and supports some of the most extensive freshwater flooded forests in the world. The flooded forest, in turn, provides terrestrial inputs into aquatic systems in the form of leaf litter and other organic material [76], creating rearing and hiding habitat for a wide diversity of fish species. Past studies show a strong relationship between the annual extent of flooded forest and fish production of the industrial fisheries along the Tonle Sap River [77]. The Tonle Sap study area that we analyzed was 26% forest, the lowest percentage of forest compared to our other study areas, which were 53% forest for Cambodia and the 3S Basin, 46% forest in Cambodia, and 74% forest in the 3S Basin. Eighty-three percent of the forest in the Tonle Sap consisted of flooded forest. Forest loss was nearly constant throughout our 25-year time period, which contrasted with our other three study areas that showed accelerating deforestation.
Of the four regions that we analyzed; Tonle Sap may have the greatest legacy of past deforestation. The French colonials created a system of agricultural concessions around Tonle Sap Lake [78]. Further losses of flooded forest continued under Pol Pot in the form of slash and burn agriculture. The Vietnamese Army encouraged further destruction of the flooded forest to reduce hiding spots for the Khmer Rouge. About one half of the flooded forest were thought to have been lost by 1993 [78]. Hence, modern flooded forest loss continues amidst a historic backdrop of deforestation. In addition to forest loss due to direct land-use conversion, anthropogenic climate change is increasingly leading to forest losses due to wildfire. This is particularly concerning for the flooded forest of the Tonle Sap, which has not seen widespread forest fires in recent decades and may be vulnerable to species shifts under novel fire regimes [79], and MODIS burn records [80] show an increase in the annual burned area in Tonle Sap flooded forests from 2 to 6% from 2000 to 2017. In particular, 2016 was an El Niño-driven large fire year that resulted in wildfires consuming 13% of flooded forests, including the loss of 8000 Ha in the Prek Toal Protected Area [79]. Both the constant rate of forest loss due to deforestation and the episodic rate of forest loss due to wildfire in the Tonle Sap region is concerning because of the link between flooded forests and fish productivity, in a country where fish is a major food and protein source. The loss of flooded forest, combined with anticipated changes to hydrology [81] and overfishing [82], may affect aquatic food webs non-linearly. Given the extraordinary importance of flooded forest as an integral part of the aquatic food chain and the extreme rarity of the remaining flooded forest, conservation of flooded forest should be a key conservation strategy.

4.4. Spatial Drivers of Deforestation

Climatic variables were important drivers of forest loss in all four study areas. Response curve patterns in the four study areas suggest that there was increase in forest loss in warmer regions of all four study areas, which tended to include more flooded forests. Predictor variables showing less development such as road density, population density, and fragmentation were more influential in the 3S basin, which was just opposite in the other three study regions. In the 3S region, two of the three most important variables in the model predicting deforestation were road density and population density. In contrast, road density and population density were relatively less important in the Cambodia and 3S Basin, Cambodia-only, and Tonle Sap regions and exhibited different relationships with deforestation because forest loss in the 3S was more likely in areas of much lower road densities. Our study treated climatic variables as static variables based on a 30-year average rather than dynamic variables, which helps identify geographic regions in which certain climatic regimes may be predictive of forest loss. Future studies may benefit from dynamic climatic variables which would increase the complexity of models but also help identify finer-scale climatic events that may be more associated with forest loss. Comprehensive datasets of wildfire occurrence would be tremendously beneficial for assessing the interacting role of wildfire and human land use. The existing MODIS burn products cannot distinguish between wildfire and anthropogenic fires, such as those associated with forest loss or agricultural burning [80].
Among the landscape metrics, variables related to percent forest, percent agricultural land, fragmented forests and agricultural lands were important variables to predict forest loss suggesting that land cover composition, rather than configuration, may play a stronger role in determining which areas are prone to deforestation at this broad spatial scale. We expect that the relative importance of land-cover composition versus configuration to be dependent on both spatial scale and context of the study. Of our four study areas forest variables were more influential in the 3S Basin, while landscape variables associated with agricultural lands were significant in Tonle Sap and Cambodia. Forests fragments closer to agricultural lands and settlements were more prone to future loss. Our use of variables quantifying the distance to different land cover types may have reduced the importance of landscape metrics as many landscape metrics are based on proximity. Though landscape metrics did not rank as one of the top-ten important drivers of deforestation in this study, Cushman et al. [10] has concluded that forest-loss risk prediction in the tropics could be improved by incorporating these variables in the prediction model.
Our use of annual-resolution data allowed us to identify two primary inflection points around 2003/2004 and 2011 that mark changes in the rate of deforestation, possibly related to socio-economic and market drivers, such as global rubber prices [83], oil palm plantations [5] and changes in economic land concessions [84]. Milne [7] identified tree-plantations to be a leading cause of deforestation in Southeast Asian countries. Easy access due to new logging roads increased deforestation in the tropical forests of Sumatra [39]. Our results support studies [8] suggesting that deforestation is triggered by socio-economic drivers that are usually hard to isolate; however, the incorporation of the socio-economic variables is important to reduce overestimation by deforestation models [36]. Dezécache et al. [36] concluded that deforestation models coupled with socio-economic variables, rather than deforestation models based on spatial environmental variables, were more significant in identifying locations needing conservation actions.
Hydropower dams are being developed at an unprecedented rate in the Lower Mekong River. Up to 134 new dams have been proposed for the Mekong River and its tributaries [85]. Although the location of hydropower dams and reservoirs are highly concentrated in the 3S region, hydrological modeling shows that existing hydropower development has reduced high flows by 15% and increased dry season low flows by 70% and that hydropower development had a much greater impact on flow than either climate change or irrigation [86]. Hydropower dams can lead to forest fragmentation through multiple pathways, including reservoir inundation, road building, increases in settlements, or logging [22,87]. In the 3S Basin, forest loss due to direct replacement by reservoirs was 3%, the highest of any of the four study regions that we analyzed. However, the construction of the Lower Sesan 2 dam was officially completed in 2018, which was after our study ended. Additional anthropogenic developments spurred by the dam and displacement of people to new areas may have long-lasting effects that cannot fully be captured by this study. In addition to impacting biodiversity, deforestation in watersheds with reservoirs can have serious implications on water quality and sedimentation of the reservoir. In a recent modeling study, extensive deforestation in the vicinity of reservoirs could reduce the lifespan of the reservoir by 60 to 100% [87]. Based on the spatial variation of the predictor variables, areas with increasing human encroachment are at a higher risk of being deforested in the near future.

5. Conclusions

Our study using Landsat imagery to map the loss of primary forests suggests that deforestation in the Lower Mekong Basin, and in Cambodia in particular, is rapidly accelerating and is among the highest on Earth. Forest-loss rates since 2011 are twice as high as loss rates between 2004 and 2011. Current deforestation rates are over three times as high as deforestation rates during the 1990s, which is cause for concern because of the potential for tremendous loss of ecological productivity and biodiversity in both terrestrial and aquatic systems. Deforestation occurs within protected areas (0.4% in protected areas vs. 0.85% in unprotected areas) and within community-managed forests (1.2% in community forests vs. 1.29% outside community forests), although at slower rates. Forest loss within flooded forest along the Tonle Sap occurred at steady high rates (1.2%) within the 25-year time period, but without the inflection points noticeable in the other regions. Dams and reservoirs resulted in a direct forest loss of 3% in the Sekong–Sesan–Srepok Basin where 16% of the primary forest was lost in 25 years period. Climatic variables were the most influential among others confirming more loss in the upland forests in the 3S region and more loss in the warmer flood plain forests in the other regions. Indicators of human presence, such as road and population density were more important in the 3S model compared to the other three study areas, though the relationship was negative in the 3S region, showing more deforestation in remote upland forests. Hydropower dams were a major emerging variable influencing deforestation in the 3S and the Tonle Sap region. Given the extremely high rate of deforestation in the Lower Mekong Basin and the potential for both terrestrial and aquatic biodiversity loss influenced by a rapidly growing population and economy coupled with extreme poverty, stronger preventive measures, such as increased enforcement in protected areas and community forests, additional protected status for flooded forests, and economic incentives that encourage land owners to retain land for carbon sequestration and biodiversity rather than to exploit it for resource extraction, need to be taken to slow deforestation rates. Improvements in monitoring protected areas and community forests using high-resolution imagery are urgently needed.

Author Contributions

Conceptualization, S.L., T.E.D., P.J.W.; methodology, S.L., T.E.D., P.J.W.; software, S.L., T.E.D., P.J.W.; validation, S.L., T.E.D., P.J.W., S.E.N., Z.S.H.; formal analysis, S.L., T.E.D., P.J.W.; investigation, S.L., T.E.D., P.J.W., S.E.N., Z.S.H.; resources, S.L., T.E.D., P.J.W., S.E.N., Z.S.H.; data curation, S.L., T.E.D.; writing—original draft preparation, S.L., T.E.D.; writing—review and editing, S.L., T.E.D., P.J.W., S.E.N., Z.S.H.; visualization, S.L., T.E.D.; supervision, T.E.D., P.J.W., S.E.N., Z.S.H.; project administration P.J.W., S.E.N., Z.S.H.; funding acquisition, P.J.W., S.E.N., Z.S.H. All authors have read and agreed to the published version of the manuscript.

Funding

This research was funded through the USAID’s ‘Wonders of the Mekong’ Cooperative Agreement No: AID-OAA-A-16-00057.

Conflicts of Interest

The authors declare no conflict of interest.

Appendix A

Figure A1. Box plots showing the Landsat spectral bands and vegetation indices used for deforestation mapping for both forest loss and non-loss validation points using random forest as the classifier.
Water 12 02191 g0a1
Figure A2. Forest loss in Cambodia and the 3S Basin for individual years from 1993–1997 (A), 1998–2002 (B), 2003–2007 (C), 2008–2012 (D), and 2013–2017 (E).
Water 12 02191 g0a2aWater 12 02191 g0a2bWater 12 02191 g0a2c
Figure A3. Top nine predictor variables for the Cambodia + 3S model make up 47% of the variable contribution. Note the small vertical lines on the x axis (rug) that indicate where the majority of the data points are located.
Water 12 02191 g0a3
Figure A4. Top nine predictor variables for the Cambodia-only model make up 48% of the variable contribution. Note the small vertical lines on the x axis (rug) that indicate where the majority of the data points are located.
Water 12 02191 g0a4
Figure A5. Top nine predictor variables for the 3S region (Sekong-Srepok-Sesan river basins) model make up 47% of the variable contribution. Note the small vertical lines on the x axis (rug) that indicate where the majority of the data points are located.
Water 12 02191 g0a5
Figure A6. Top nine predictor variables for the Tonle Sap model make up 50% of the variable contribution. Note the small vertical lines on the x axis (rug) that indicate where the majority of the data points are located.
Water 12 02191 g0a6

References

  1. Intergovernmental Panel on Climate Change [IPCC]. Fourth Assessment Report. 2007. Available online: https://www.ipcc.ch/site/assets/uploads/2018/02/ar4_syr_full_report.pdf (accessed on 16 October 2018).
  2. Food and Agricultural Organization. Global Forest Resources Assessment 2005. Progress towards Sustainable Forest Management; FAO Forestry Paper 147; Food and Agricultural Organization: Rome, Italy, 2006; p. 320. [Google Scholar]
  3. Hansen, M.C.; Potapov, P.V.; Moore, R.; Hancher, M.; Turubanova, S.A.; Tyukavina, A.; Thau, D.; Stehman, S.V.; Goetz, S.J.; Loveland, T.R.; et al. High-resolution global maps of 21st-century forest cover change. Science 2013, 342, 850–853. [Google Scholar] [CrossRef] [PubMed] [Green Version]
  4. Hughes, A.C. Understanding the drivers of Southeast Asian biodiversity loss. Ecosphere 2017, 8, 1–33. [Google Scholar] [CrossRef]
  5. Stibig, H.-J.; Achard, F.; Carboni, S.; Rasi, R.; Miettinen, J. Change in tropical forest cover of Southeast Asia from 1990 to 2010. Biogeosciences 2013, 10, 12625–12653. [Google Scholar] [CrossRef]
  6. Miettinen, J.; Shi, C.; Liew, S.C. Deforestation rates in insular Southeast Asia between 2000 and 2010. Glob. Change Biol. 2011, 17, 2261–2270. [Google Scholar] [CrossRef]
  7. Milne, S. Cambodia’s unofficial regime of extraction: Illicit logging in the shadow of transnational governance and investment. Crit. Asian Stud. 2015, 47, 200–228. [Google Scholar] [CrossRef]
  8. Geist, H.J.; Lambin, E.F. Proximate causes and underlying driving forces of tropical deforestation. BioScience 2002, 52, 143–150. [Google Scholar] [CrossRef]
  9. Hirsch, P. Underlying Causes of Deforestation in the Mekong Region; Australian Mekong Resource Centre: Sydney, NSW, Australia, 2000. [Google Scholar]
  10. Cushman, S.A.; Macdonald, E.A.; Landguth, E.L.; Malhi, Y.; Macdonald, D.W. Multiple-scale prediction of forest loss risk across Borneo. Landsc. Ecol. 2017, 32, 1581–1598. [Google Scholar] [CrossRef] [Green Version]
  11. Potapov, P.; Tyukavina, A.; Turubanova, S.; Talero, Y.; Hernandez-Serna, A.; Hansen, M.C.; Saah, D.; Tenneson, K.; Poortinga, A.; Aekakkararungroj, A.; et al. Annual continuous fields of woody vegetation structure in the Lower Mekong region from 2000-2017 Landsat time-series. Remote Sens. Environ. 2019, 232, 111278. [Google Scholar] [CrossRef]
  12. WWF Greater Mekong. Ecosystems in the Greater Mekong: Past trends, Current Status, Possible Futures. 2013. Available online: http//:wwf.panda.org/greatermekong (accessed on 6 July 2018).
  13. MRC. Mekong Research Commission. State of the Basin Report 2010; Mekong River Commission: Vientiane, Laos, 2010. [Google Scholar]
  14. Michinaka, T.; Miyamoto, M.; Yokota, Y.; Sokh, H.; Lao, S.; Ma, V. Factors affecting forest area changes in Cambodia: An econometric approach. J. Sustain. Dev. 2013, 6, 12–25. [Google Scholar] [CrossRef]
  15. Bruijnzeel, L.A. Hydrological functions of tropical forests: Not seeing the soil for the trees? Agric. Ecosyst. Environ. 2004, 104, 185–228. [Google Scholar] [CrossRef]
  16. Rufin, P.; Gollnow, F.; Müller, D.; Hostert, P. Synthesizing dam-induced land system change. Ambio 2019, 1–12. [Google Scholar] [CrossRef] [PubMed]
  17. Shrestha, B.; Cochrane, T.A.; Caruso, B.S.; Arias, M.E.; Piman, T. Uncertainty in flow and sediment projections due to future climate scenarios for the 3S rivers in the Mekong Basin. J. Hydrol. 2016, 540, 1088–1104. [Google Scholar] [CrossRef]
  18. Ngo, L.A.; Masih, I.; Jiang, Y.; Douven, W. Impact of reservoir operation and climate change on the hydrological regime of the Sesan and Srepok Rivers in the Lower Mekong Basin. Clim. Chang. 2018, 149, 107–119. [Google Scholar] [CrossRef]
  19. Shrestha, B.; Maskey, S.; Babel, M.S.; Griensven, A.V.; Uhlenbrook, S. Sediment related impacts of climate change and reservoir development in the Lower Mekong River basin: A case study of the Nam Ou Basin, Lao PDR. Clim. Chang. 2018, 149, 13–27. [Google Scholar] [CrossRef]
  20. Souza, C.M.; Kirchhoff, F.T.; Oliveira, B.C.; Ribeiro, J.G.; Sales, M.H. Long-term annual surface water change in the brazilian amazon biome: Potential links with deforestation, infrastructure development and climate change. Water 2019, 11, 566. [Google Scholar] [CrossRef] [Green Version]
  21. Kummu, M.; Sarkkula, J. Impact of the Mekong river flow alteration on the Tonle Sap flood pulse. Ambio 2008, 37, 185–192. [Google Scholar] [CrossRef]
  22. Arias, M.E.; Cochrane, T.A.; Piman, T.; Kummu, M.; Caruso, B.S.; Killeen, T.J. Quantifying changes in flooding and habitats in the Tonle Sap Lake (Cambodia) caused by water infrastructure development and climate change in the Mekong Basin. J. Environ. Manag. 2012, 112, 53–66. [Google Scholar] [CrossRef]
  23. Schmitt, R.J.P.; Bizzi, S.; Castelletti, A.; Kondolf, G.M. Improved trade-offs of hydropower and sand connectivity by strategic dam planning in the Mekong. Nat. Sustain. 2018, 1, 96–104. [Google Scholar] [CrossRef]
  24. Visconti, P.; Butchart, S.H.M.; Brooks, T.M.; Langhammer, P.F.; Marnewick, D.; Vergara, S.; Yanosky, A.; Watson, J.E.M. Protected area targets post-2020. Science 2019, 364, 239–241. [Google Scholar] [CrossRef] [Green Version]
  25. Brown, J.A.; Lockwood, J.L.; Avery, J.D.; Burkhalter, J.C.; Aagaard, K.; Fenn, K.H. Evaluating the long-term effectiveness of terrestrial protected areas: A 40-year look at forest bird diversity. Biodivers. Conserv. 2019, 28, 811–826. [Google Scholar] [CrossRef]
  26. Déry, S.; Dubé, L.; Chanthavong, B. Protected areas and the integration process of mountainous areas in mainland Southeast Asia: The case of Luang Nam Tha, Lao PDR. In Rural Areas between Regional Needs and Global Challenges Perspectives on Geographical Marginality; Leimgruber, W., Chang, C., Eds.; Springer: Cham, Switzerland, 2019; Volume 4. [Google Scholar]
  27. Soueter, N.J.; Simpson, V.; Mould, A.; Eames, J.C.; Gray, T.N.E.; Sinclair, R.; Farrell, T.; Jurgens, J.A.; Billingsley, A. Will the recent changes in protected area management and the creation of five new protected areas improve biodiversity conservation in Cambodia? Cambodian J. Nat. Hist. 2016, 1, 5–8. [Google Scholar]
  28. Wade, C.M.; Austin, K.G.; Cajka, J.; Lapidus, D.; Everett, K.H.; Galperin, D.; Maynard, R.; Sobel, A. What is Threatening Forests in Protected Areas? A Global Assessment of Deforestation in Protected Areas, 2001–2018. Forests 2020, 11, 539. [Google Scholar] [CrossRef]
  29. Riggs, R.A.; Langston, J.D.; Sayer, J.; Sloan, S.; Laurance, W.F. Learning from local perceptions for strategic road development in Cambodia’s protected forests. Trop. Conserv. Sci. 2020, 13, 1940082920903183. [Google Scholar] [CrossRef]
  30. Lambrick, F.H.; Brown, N.D.; Lawrence, A.; Bebber, D.P. Effectiveness of community forestry in Prey Long Forest, Cambodia. Conserv. Biol. 2013, 28, 372–381. [Google Scholar] [CrossRef]
  31. Lawrence, A.; Paudel, K.; Barnes, R.; Malla, Y. Adaptive value of participatory biodiversity monitoring in community forestry. Environ. Conserv. 2006, 33, 325–334. [Google Scholar] [CrossRef] [Green Version]
  32. Sunderlin, W.D. Poverty alleviation through community forestry in Cambodia, Laos, and Vietnam: An assessment of the potential. Forest Policy Econ. 2006, 8, 386–396. [Google Scholar] [CrossRef]
  33. Persson, J.; Prowse, M. Collective action on forest governance: An institutional analysis of the Cambodian community forest system. Forest Policy Econ. 2017, 83, 70–79. [Google Scholar] [CrossRef] [Green Version]
  34. Bowler, D.; Buyung-Ali, L.; Healey, J.R.; Jones, J.P.G.; Knight, T.; Pullin, A.S. The Evidence Base for Community Forest Management as a Mechanism for Supplying Global Environmental Benefits and Improving Local Welfare: A STAP Advisory Document. Prepared on Behalf of the Scientific and Technical Advisory Panel (STAP) of the Global Environment Facility (GEF). 2010. Available online: https://www.thegef.org/sites/default/files/publications/STAP_CFM_2010_1.pdf (accessed on 11 March 2019).
  35. Heino, M.; Kummu, M.; Makkonen, M.; Mulligan, M.; Verburg, P.H.; Jalava, M.; Rasanen, T.A. Forest loss in protected areas and intact forest landscapes: A global analysis. PLoS ONE 2015, 10, e0138918. [Google Scholar] [CrossRef]
  36. Dezécache, C.; Salles, J.-M.; Vieilledent, G.; Hérault, B. Moving forward socio-economically focused models of deforestation. Glob. Chang. Biol. 2017, 23, 3484–3500. [Google Scholar] [CrossRef]
  37. Potapov, P.; Yaroshenko, A.; Turubanova, S.; Dubinin, M.; Laestadius, L.; Thies, C.; Aksenov, D.; Egorov, A.; Yesipova, Y.; Glushkov, I.; et al. Mapping the world’s intact forest landscapes by remote sensing. Ecol. Soc. 2008, 13, 51. [Google Scholar] [CrossRef] [Green Version]
  38. Grinand, C.; Rakotomalala, F.; Gond, V.; Vaudry, R.; Bernoux, M.; Vieilledent, G. Estimating deforestation in tropical humid and dry forests in Madagascar from 2000 to 2010 using multi-date Landsat satellite images and the random forests classifier. Remote Sens. Environ. 2013, 139, 68–80. [Google Scholar] [CrossRef]
  39. Linkie, M.; Smith, R.J.; Leader-Williams, N. Mapping and predicting deforestation patterns in the lowlands of Sumatra. Biodivers. Conserv. 2004, 13, 1809–1818. [Google Scholar] [CrossRef]
  40. Vieilledent, G.; Grinand, C.; Rakotomalala, F.A.; Ranaivosoa, R.; Rakotoarijaona, J.-R.; Allnutt, T.F.; Achard, F. Combining global tree cover loss data with historical national forest-cover maps to look at six decades of deforestation and forest fragmentation in Madagascar. Biol. Conserv. 2018, 222, 189–197. [Google Scholar] [CrossRef]
  41. Heinimann, A.; Messerli, P.; Schmidt-Vogt, D.; Wiesmann, U. The dynamics of secondary forest landscapes in the lower Mekong Basin: A regional-scale analysis. Mt. Res. Dev. 2007, 27, 232–241. [Google Scholar] [CrossRef] [Green Version]
  42. Diamond, J.; Robinson, J.A. Natural Experiments of History; Harvard University Press: Cambridge, MA, USA, 2010. [Google Scholar]
  43. National Institute of Statistics [NIS]. Ministry of Planning, Cambodia. General Population Census of Cambodia 2008. Phnom Penh, Cambodia. 2009. Available online: http://nada-nis.gov.kh/index.php/catalog/1 (accessed on 18 December 2019).
  44. Nguyen, T.T.; Do, T.L.; Buhler, D.; Hartje, R.; Grote, U. Rural livelihoods and environmental resource dependence in Cambodia. Ecol. Econ. 2015, 120, 282–295. [Google Scholar] [CrossRef]
  45. Sok, S.; Yu, Y. Adaptation, resilience and sustainable livelihoods in the communities of the Lower Mekong Basin, Cambodia. Int. J. Water Resour. Dev. 2015, 31, 575–588. [Google Scholar] [CrossRef]
  46. Ruangpanit, N. Tropical seasonal forests in monsoon Asia: With emphasis on continental Southeast Asia. Vegetatio 1995, 121, 31–40. [Google Scholar] [CrossRef]
  47. Saenz, L.; Farrell, T.; Olsson, A.; Turner, W.; Mulligan, M.; Acero, N.; Neugarten, R.; Wright, M.; McKinnon, M.; Ruiz, C.; et al. Mapping potential freshwater services, and their representation within Protected Areas (PAs), under conditions of sparse data. Pilot implementation for Cambodia. Glob. Ecol. Conserv. 2016, 7, 107–121. [Google Scholar] [CrossRef] [Green Version]
  48. Broich, M.; Hansen, M.C.; Potapov, P.; Adusei, B.; Lindquist, E.; Stehman, S.V. Time-series analysis of multi-resolution optical imagery for quantifying forest cover loss in Sumatra and Kalimantan, Indonesia. Int. J. Appl. Earth Obs. Geoinf. 2011, 13, 277–291. [Google Scholar] [CrossRef]
  49. Brehm, J.; Matos, A. Google Earth Engine Landsat Compositor Javascript code for Google Earth Engine. University of Nevada Reno. 2019. Available online: https://code.earthengine.google.com/a86bca4669160b79b3bb60eec08556cc (accessed on 16 April 2019).
  50. Vermote, E.; Justice, C.; Claverie, M.; Franch, B. Preliminary analysis of the performance of the Landsat 8/OLI land surface reflectance product. Remote Sens. Environ. 2016, 185, 46–56. [Google Scholar] [CrossRef]
  51. Zhu, Z.; Wang, S.; Woodcock, C.E. Improvement and expansion of the Fmask algorithm: Cloud, cloud shadow, and snow detection for Landsats 4–7, 8, and Sentinel 2 images. Remote Sens. Environ. 2015, 159, 269–277. [Google Scholar] [CrossRef]
  52. Tucker, C.J. Red and photographic infrared linear combinations for monitoring vegetation. Remote Sens. Environ. 1979, 8, 127–150. [Google Scholar] [CrossRef] [Green Version]
  53. Qi, J.; Chehbouni, A.; Huete, A.R.; Kerr, Y.H.; Sorooshian, S. A modified soil adjusted vegetation index. Remote Sens. Environ. 1994, 48, 119–126. [Google Scholar] [CrossRef]
  54. Huete, A.; Didan, K.; Miura, T.; Rodriguez, E.P.; Gao, X.; Ferreira, L.G. Overview of the radiometric and biophysical performance of the MODIS vegetation indices. Remote Sens. Environ. 2002, 83, 195–213. [Google Scholar] [CrossRef]
  55. Jiang, Z.; Huete, A.R.; Didan, K.; Miura, T. Development of a two-band enhanced vegetation index without a blue band. Remote Sens. Environ. 2008, 112, 3833–3845. [Google Scholar] [CrossRef]
  56. Breiman, L. Random forests. Mach. Learn. 2001, 45, 5–32. [Google Scholar] [CrossRef] [Green Version]
  57. Kennedy, R.E.; Yang, Z.; Cohen, W.B. Detecting trends in forest disturbance and recovery using yearly Landsat time series: 1. LandTrendr—Temporal segmentation algorithms. Remote Sens. Environ. 2010, 114, 2897–2910. [Google Scholar] [CrossRef]
  58. Margono, B.A.; Potapov, P.V.; Turubanova, S.; Stolle, F.; Hansen, M.C. Primary forest cover loss in Indonesia over 2000–2012. Nat. Clim. Chang. 2014, 4, 730–735. [Google Scholar] [CrossRef]
  59. Nobre, A.D.; Cuartas, L.A.; Hodnett, M.; Rennó, C.D.; Rodrigues, G.; Silveira, A.; Waterloo, M.; Saleska, S. Height above the nearest drainage—A hydrologically relevant new terrain model. J. Hydrol. 2011, 404, 13–29. [Google Scholar] [CrossRef] [Green Version]
  60. Farr, T.G.; Rosen, P.A.; Caro, E.; Crippen, R.; Duren, R.; Hensley, S.; Kobrick, M.; Paller, M.; Rodriguez, E.; Roth, L.; et al. The shuttle radar topography mission. Rev. Geophys. 2007, 45. [Google Scholar] [CrossRef] [Green Version]
  61. Open Development Cambodia. Community Forestry in Cambodia 2008–2014. 2014. Available online: https://data.opendevelopmentcambodia.net/dataset/community-forestry-2008-2014 (accessed on 28 January 2019).
  62. Open Development Cambodia. Protected Areas and Forests 2013. 2015. Available online: https://data.opendevelopmentcambodia.net/dataset/protected-areas-and-forests-2013 (accessed on 28 January 2019).
  63. Open Development Vietnam. National protected areas of Vietnam 2016. 2016. Available online: https://data.opendevelopmentcambodia.net/dataset/national-protected-areas-in-vietnam (accessed on 28 January 2019).
  64. Open Development Laos. Laos Protected Areas and Heritage Sites 2015. 2018. Available online: https://data.opendevelopmentcambodia.net/dataset/laos-protected-areas-and-heritage-sites (accessed on 28 January 2019).
  65. ESRI. ArcGIS Desktop Spatial Analyst Extension: Release 10.6.1.; Environmental Systems Research Institute: Redlands, CA, USA, 2016. [Google Scholar]
  66. Beers, T.W.; Dress, P.E.; Wensel, L.C. Notes and observations: Aspect transformation in site productivity research. J. For. 1966, 64, 691–692. [Google Scholar]
  67. Hengl, T.; de Jesus, J.M.; MacMillan, R.A.; Batjes, N.H.; Heuvelink, G.B.M.; Ribeiro, E.; Samuel-Rosa, A.; Kempen, B.; Leenaars, J.G.B.; Walsh, M.G.; et al. SoilGrids1km—Global Soil Information Based on Automated Mapping. PLoS ONE 2014, 9, e105992. [Google Scholar] [CrossRef] [PubMed] [Green Version]
  68. Pekel, J.F.; Cottam, A.; Gorelick, N.; Belward, A.S. High-resolution mapping of global surface water and its long-term changes. Nature 2016, 540, 418–422. [Google Scholar] [CrossRef] [PubMed]
  69. McGarigal, K.; Cushman, S.A.; Ene, E. FRAGSTATS v4: Spatial Pattern Analysis Program for Categorical and Continuous Maps. Computer Software Program Produced by the Authors at the University of Massachusetts, Amherst. 2012. Available online: http://www.umass.edu/landeco/research/fragstats/fragstats.html (accessed on 28 June 2019).
  70. Grogan, K.; Pflugmacher, D.; Hostert, P.; Kennedy, R.; Fensholt, R. Cross-border forest disturbance and the role of natural rubber in mainland Southeast Asia using annual Landsat time series. Remote Sens. Environ. 2015, 169, 438–453. [Google Scholar] [CrossRef]
  71. Kroner, R.E.G.; Qin, S.; Cook, C.N.; Krithivasan, R.; Pack, S.M.; Bonilla, O.D.; Cort-Kansinally, K.A.; Coutinho, B.; Feng, M.; Garcia, M.I.M.; et al. The uncertain future of protected lands and waters. Science 2019, 364, 881–886. [Google Scholar] [CrossRef] [PubMed]
  72. Gray, T.N.; Vidya, T.N.C.; Potdar, S.; Bharti, D.K.; Sovanna, P. Population size estimation of an Asian elephant population in eastern Cambodia through non-invasive mark-recapture sampling. Conserv. Genet. 2014, 15, 803–810. [Google Scholar] [CrossRef]
  73. Gray, T.N.E.; Prum, S. Leopard density in post-conflict landscape, Cambodia: Evidence from spatially explicit capture–recapture. J. Wildl. Manag. 2012, 76, 163–169. [Google Scholar] [CrossRef]
  74. Gray, T.N.E.; Billingsley, A.; Crudge, B.; Frechette, J.L.; Grosu, R.; Herranz-Muñoz, V.; Holden, J.; Keo, O.; Kong, K.; Macdonald, D.; et al. Status and conservation significance of ground-dwelling mammals in the Cardamom Rainforest Landscape, southwestern Cambodia. Cambodian J. Nat. Hist. 2017, 2017, 38–48. [Google Scholar]
  75. Thi, S.; Lee, Y.T.; Gaw, L.Y.F.; Grundy-Warr, C.; Souter, N.J. The hollow drum: Impacts of human use on the Tonle. Cambodian J. Nat. Hist. 2017, 2017, 179. [Google Scholar]
  76. Baird, I.G. Fishes and forests: The importance of seasonally flooded riverine habitat for Mekong River fish feeding. Nat. Hist. Bull. Siam Soc. 2007, 55, 121–148. [Google Scholar]
  77. Baran, E.; Zalinge, V.N.; Ngor, P.B.; Baird, I.G.; Coates, D. Fish Resource and Hydrobiological Modelling Approaches in the Mekong Basin; ICLARM, Penang, Malaysia and the Mekong River Commission Secretariat: Phnom Penh, Cambodia, 2001; p. 60. [Google Scholar]
  78. Eyler, B. Last Days of the Mighty Mekong; Zed Books Ltd.: London, UK, 2019. [Google Scholar]
  79. Arias, M.E.; Holtgrieve, G.W.; Ngor, P.B.; Dang, T.D.; Piman, T. Maintaining perspective of ongoing environmental change in the Mekong floodplains. Curr. Opin. Environ. Sustain. 2019, 37, 1–7. [Google Scholar] [CrossRef]
  80. Giglio, L.; Boschetti, L.; Roy, D.P.; Humber, M.L.; Justice, C.O. The Collection 6 MODIS burned area mapping algorithm and product. Remote Sens. Environ. 2018, 217, 72–85. [Google Scholar] [CrossRef] [PubMed]
  81. Baran, E.; Myschowoda, C. Dams and fisheries in the Mekong Basin. Aquat. Ecosyst. Health Manag. 2009, 12, 227–234. [Google Scholar] [CrossRef]
  82. Ou, C.; Montaña, C.G.; Winemiller, K.O. Body size–trophic position relationships among fishes of the lower Mekong basin. R. Soc. Open Sci. 2017, 4, 160645. [Google Scholar] [CrossRef] [PubMed] [Green Version]
  83. Grogan, K.; Pflugmacher, D.; Hostert, P.; Mertz, O.; Fensholt, R. Unravelling the link between global rubber price and tropical deforestation in Cambodia. Nat. Plants 2019, 5, 47–53. [Google Scholar] [CrossRef] [PubMed]
  84. Davis, K.F.; Yu, K.; Rulli, M.C.; Pichdara, L.; D’Odorico, P. Accelerated deforestation driven by large-scale land acquisitions in Cambodia. Nat. Geosci. 2015, 8, 772–775. [Google Scholar] [CrossRef] [Green Version]
  85. Wild, T.B.; Loucks, D.P. Managing flow, sediment, and hydropower regimes in the Sre Pok, Se San, and Se Kong Rivers of the Mekong basin. Water Resour. Res. 2014, 50, 5141–5157. [Google Scholar] [CrossRef]
  86. Hoang, L.P.; van Vliet, M.T.; Kummu, M.; Lauri, H.; Koponen, J.; Supit, I.; Leemans, R.; Kabat, P.; Ludwig, F. The Mekong’s future flows under multiple drivers: How climate change, hydropower developments and irrigation expansions drive hydrological changes. Sci. Total Environ. 2019, 649, 601–609. [Google Scholar] [CrossRef]
  87. Kaura, M.; Arias, M.E.; Benjamin, J.A.; Oeurng, C.; Cochrane, T.A. Benefits of forest conservation on riverine sediment and hydropower in the Tonle Sap Basin, Cambodia. Ecosyst. Serv. 2019, 39, 101003. [Google Scholar] [CrossRef]
Figure 1. Study area including Cambodia and the Srepok, Sesan, and Sekong River watersheds, which include portions of Vietnam and Laos.
Water 12 02191 g001
Figure 2. Diagram showing the methodology used in this study.
Water 12 02191 g002
Figure 3. Observed versus predicted tree-cover validation for the 50% randomly withheld validation data (A), randomly selected independent validation data from 2005 (B), randomly selected independent validation data from 2010 (C), and randomly selected independent validation data from 2010 (D).
Water 12 02191 g003
Figure 4. Cumulative loss of primary forest through time in Cambodia and the 3S Basin showing both the raw totals in km2 (A) and the proportion of the forest loss based on the 1993 levels (B) for each region.
Water 12 02191 g004
Figure 5. Forest loss in Cambodia and the 3S Basin from 1993 to 2017.
Water 12 02191 g005
Figure 6. Drivers of deforestation in the Cambodia 3S Basin, Cambodia-only, 3S-Basin-only, and Tonle-Sap-only models.
Water 12 02191 g006
Figure 7. Variable importance calculated from mean decrease accuracy and normalized to 100%. Red colors indicate a greater variable importance and blue colors indicate a lower variable importance. The form of the relationship between variables and the response is shown using seven categories: strongly positive (SP: red), weakly positive (WP: green), strongly negative (SN: orange), unimodal (U: brown), complex (C: purple), and neutral (N: cyan). Strongly positive, weakly positive, and strongly negative relationships could be either linear or non-linear. Complex relationships typically were bimodal or multimodal.
Water 12 02191 g007
Table 1. Predictor variables, descriptions, rationale, and data sources.
Variable GroupVariable NameVariable DescriptionData Source
Socio-economicPopulation densityTotal number of people per grid-cell (worldpop)Worldpop data after 2000, and SEDAC data for the 1990s
RoadsEuclidean Distance to roadsOpen Development Cambodia (ODC)
Roads-density
Land coverUrbanSERVIR Mekong
Agricultural LandSERVIR Mekong
Protected AreasODC
Topo-edaphicTopographySlopeDEM derived from shuttle radar topography mission (SRTM) at approximately 90-m resolution
Aspect
SoilClay (0–2 micrometer mass fraction in % at 1 m depth 1 m)[67]
Sand (0–2 micrometer mass fraction in % at 1 m depth)[67]
ClimaticBioclimatic variablesAnnual mean temperatureGlobal Climate Data
Mean Diurnal rangeGlobal Climate Data
IsothermalityGlobal Climate Data
Temperature seasonalityGlobal Climate Data
Maximum temperature of warmest monthGlobal Climate Data
Minimum temperature of coldest monthGlobal Climate Data
Temperature annual rangeGlobal Climate Data
Annual precipitationGlobal Climate Data
Precipitation of wettest monthGlobal Climate Data
Precipitation of driest monthGlobal Climate Data
Precipitation seasonalityGlobal Climate Data
Hydropower DevelopmentHydropower DamsEuclidean Distance to damsODC & [23]
Inundation layerInundation (Yes/No)Global Surface water website
FragmentationLandscape metricsPercentage of landscapes (PLAND)FRAGSTATS
Perimeter-area fractal dimension (PAFRAC)FRAGSTATS
Edge density (ED)FRAGSTATS
Euclidean nearest neighbor distance (ENN_MN)FRAGSTATS
Patch density (PD)FRAGSTATS
Interspersion juxtaposition index (IJI) FRAGSTATS
Proportion of like adjacencies (PLADJ)FRAGSTATS
Aggregation index (AI)FRAGSTATS
Clumpiness (CLUMPY)FRAGSTATS
Table 2. Validation statistics for predictive tree cover model for the years 2005, 2010, and 2015 (N = 1000).
Statistic50% Withheld Data200520102015
Root Mean Square Error (RMSE in %)18.2927.8320.0626.12
Percent Bias (PBIAS)1.10−11.30−13.4−5.5
Pearson Correlation (r)0.900.750.880.78
R-squared0.800.560.770.61
Slope of the linear model0.810.660.790.72
Table 3. Validation statistics for statistical predictive models of drivers of forest loss.
MetricsCambodia 3S BasinCambodia Only3S Basin OnlyTonle Sap Only
Accuracy (%)71727078
Kappa value0.360.400.340.58
Sensitivity0.810.790.810.75
Specificity0.540.600.530.82

