Interaction Analysis of Urban Blue-Green Space and Built-Up Area Based on Coupling Model—A Case Study of Wuhan Central City

Department of Urban and Rural Planning, School of Urban Design, Wuhan University, Wuhan 430072, China
*
Author to whom correspondence should be addressed.
Water 2020, 12(8), 2185; https://doi.org/10.3390/w12082185
Submission received: 30 June 2020
/
Accepted: 13 July 2020
/
Published: 3 August 2020
(This article belongs to the Section Urban Water Management)
Abstract
:Urban “blue-green” space is the basic element of urban natural ecological space. The rapid urbanization process has a significant impact on the pattern of urban blue-green space and seriously threatens the urban ecological environment. It is of great significance for urban ecological protection and sustainable development to study the change in characteristics of blue and green space during urban expansion. In this paper, a comprehensive method of remote sensing image, landscape pattern analysis, sector analysis, and coupling analysis is applied to analyze the spatio-temporal evolution characteristics and coordinated development level of the blue-green space and built-up area in central Wuhan from 1987 to 2018. The results showed that the land use and landscape pattern in the central city of Wuhan underwent a drastic change process, and the dominant change was the occupation of blue-green space by urban built-up areas, which led to the increase of landscape fragmentation and the decrease of heterogeneity. Urban green space is gradually marginalized and concentrated in local areas. The blue space has an obvious blocking effect on the expansion of the built-up area, and its spatial pattern tends to be stable gradually. In addition, the coupling degree between urban blue-green space and urban built area presents an inverted U-shape, and the coordinated development level among the three has entered a stage of moderate imbalance. It is urgent to strengthen the protection of blue-green space, curb the disorderly expansion of cities, and improve the quality of urban development.
1. Introduction
Urban landscape pattern is the macroscopic spatial distribution of landscape patches and the overall urban layout that changes dynamically with urban expansion under the influence of many factors, the core of which is the blue-green space [1]. On the macro level, blue-green space is the sum of blue space and green space, including all water and green space, constituting the overall landscape pattern of the city [2]. Among them, “green space” includes mountain, forest land, farmland, grassland, and ecological corridor, as well as large green space, belt green space, protective green belt, public open space, and green roof in the city [3,4]. “Blue space” includes linear water bodies such as rivers and planar water bodies such as reservoirs and wetlands [5,6]. Urban blue-green space is a controlling factor closely related to urban sustainable development and residents’ life, and an inseparable “organic aggregation” of urban ecological framework [7,8]. Increasing the proportion of blue and green space is an important way and means to achieve urban ecological security and system integrity, improve urban functions and charm characteristics, and ensure high-quality urban development [9].
In the past few decades, the concentration of population and socio-economic activities around the world has led to rapid urban expansion, significantly changing the urban landscape pattern [10]. The development of urbanization is usually accompanied by the fragmentation of landscape patches, the shrinking and breaking of blue-green space, and other dynamic changes [11,12]. China’s urbanization is considered to be the fastest and most extensive, with the urbanization rate rising from 25.32% in 1987 to 60.60% in 2019 [13]. The rapid growth of urban population makes urban construction land increasingly scarce, and a large number of farmland and forest land around the city have been embezzled [14]. According to statistics, from 1992 to 2015, China’s construction land increased by nearly five times, almost 2.5 times the global average, and more than 10% of cultivated land has been converted to other land use types [15]. The huge change of land use and the high intensity of human activities pose a severe challenge to the urban ecological environment. In addition, conflicts between different types of land use and their negative impact on urban social and economic development also appear gradually [16]. At present, the Chinese government attaches great importance to space policy, aiming to achieve sustainable development of regional land space through comprehensive measures such as land space development, resource and environmental protection, land consolidation and improvement, and security systems [17].
Human economic activities usually accelerate the speed of land use change, which is the main cause of ecological environment deterioration and habitat destruction [18]. The study of urban land use change can not only reveal the spatial and temporal characteristics of urban expansion and land use dynamics, but also provide support and evidence for ecological environment problems that threaten the sustainable development of cities [19]. At present, such studies mainly focus on spatial and temporal change of land use [20,21], the relationship between land use change and its driving force [22,23], simulation of land use change [24,25], and the impact of land use change [26,27], etc. With the development of remote sensing and geographic information technology, it becomes easier to characterize landscapes and quantify their structural changes. Remote sensing data has become the most important data source due to its large area coverage, high accuracy, and timeliness [28]. Landscape index analysis is widely used to analyze land use change characteristics that cannot be observed with the naked eye, and measure the specific spatial characteristics of patches, patch types, or the whole landscape from the perspectives of area, shape, aggregation, and diversity [29,30].
Many previous studies have mostly carried out macroscopic qualitative analysis from the perspective of the impact of land use change on landscape pattern in rapidly urbanized areas, and have found that in these regions, green space and water area are transformed into construction land, which is prone to form extremely scattered landscapes, but the extent of such impact has not been quantified [31,32,33]. Most of the research lacks conjecture verification and two-step coupling quantitative analysis and evaluation [34,35], or just start from a single aspect of urban green space or blue space, where static studies are conducted on social attributes of space such as public health welfare [36], social equity [37,38], physical attributes such as urban flood [39,40], urban landscape [41,42], and other aspects such as economic development [43]. Relatively few studies analyze the dynamic changes of blue-green space and landscape pattern from the perspective of long time series and multiple nodes, and quantitatively analyze the relationship between urban expansion and blue-green space.
The present study addresses the shortcomings of the above studies. First, long-term serial remote sensing images from 1987 to 2018 were interpreted and analyzed to explain the spatial evolution of blue-green space and urban built-up areas in the center of Wuhan, and then using the transfer matrix of land use and landscape pattern index and urban expansion intensity to explore its changing characteristics in depth. Sector analysis and gradient direction analysis were used to reveal the spatial impact of urban expansion on blue-green space. Finally, on the basis of the physical coupling model, the coordination degree model quantitatively analyzed the level of coordinated development between blue-green space and urban built-up areas.
The objective of this study lies in the analysis of the evolution path and interaction mechanism between blue-green space and urban built-up areas under the background of rapid urbanization, and the combination with the evolution and implementation of urban policies to explore better protection approaches for urban blue-green space. Protecting and improving the quality of blue-green spaces are important means to achieve urban ecological security and system integrity, enhance urban functions and charm characteristics, and ensure green and high-quality development. As a typical city with abundant water, Wuhan has long been actively exploring the ecological, green, sustainable, urban development concept. With a good natural ecological foundation, Wuhan has the conditions to explore a development path featuring blue-green integration and ecological sustainability.
2. Study Area and Data Source
2.1. Study Area
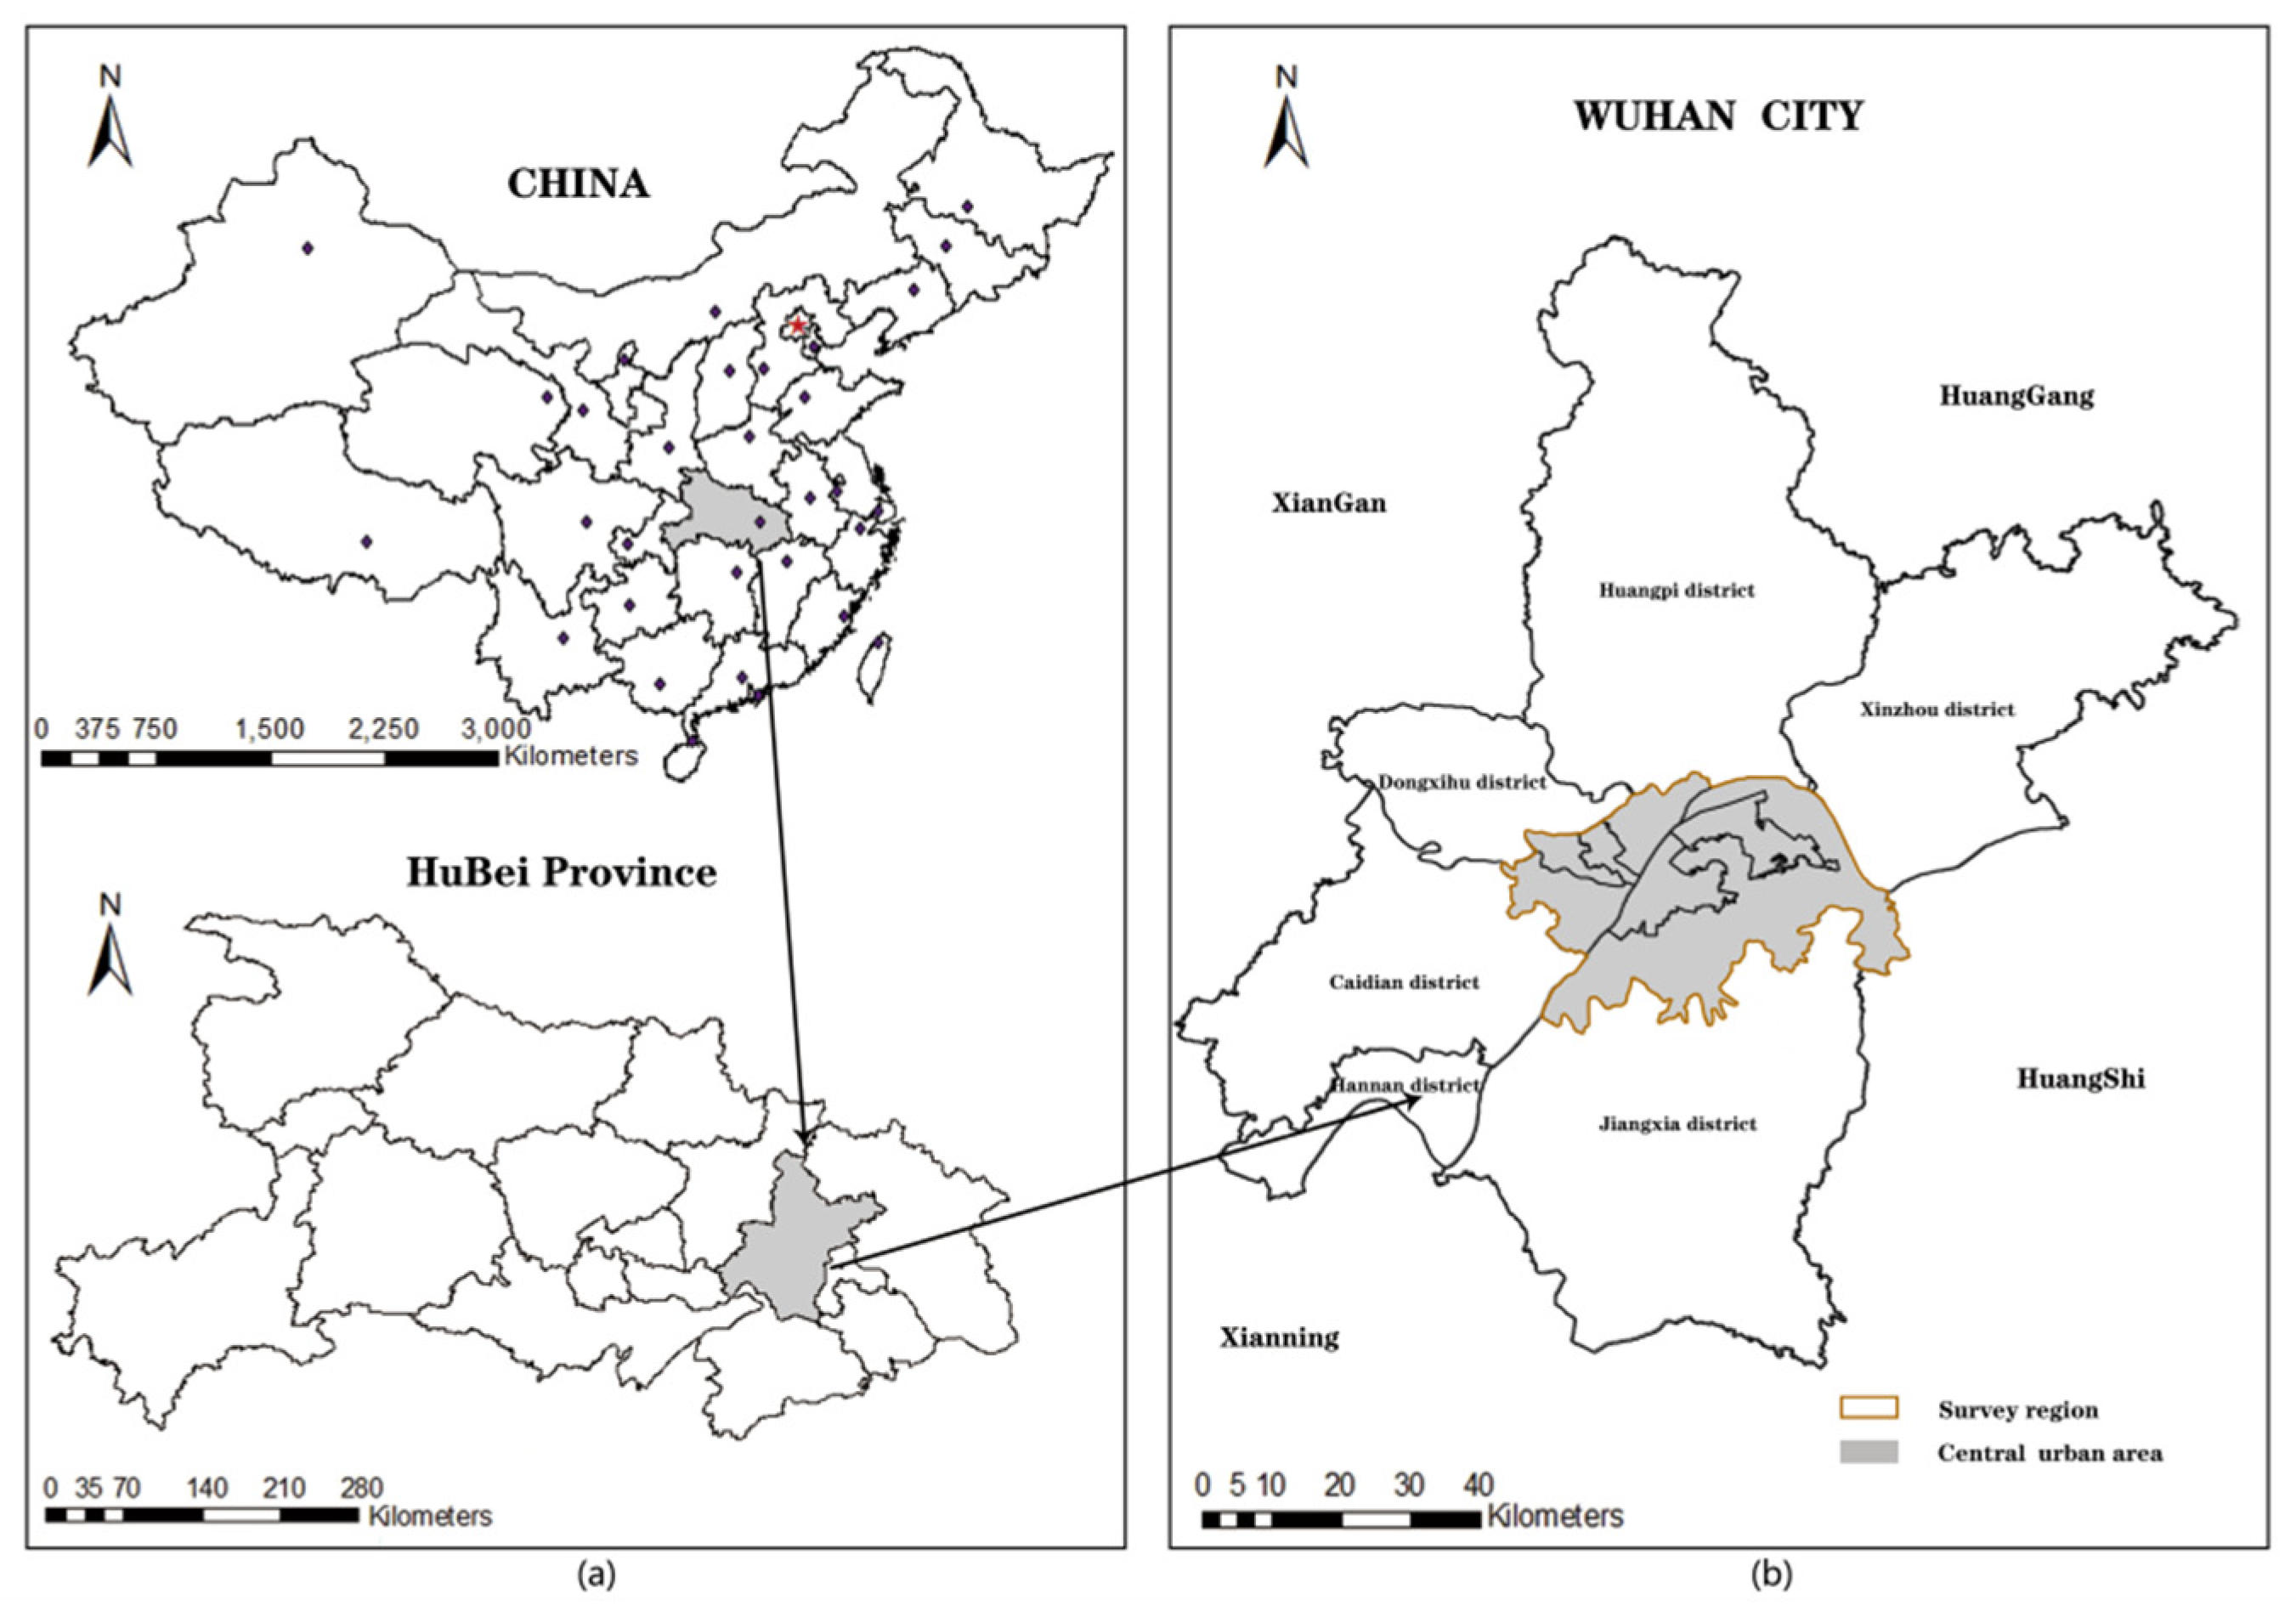
Wuhan is located at 113°41′–115°05′ east longitude and 22°29′–31°58′ north latitude. It is located in the eastern part of the Jianghan Plain in the hinterland of China and has a total area of 8494.40 km2. Wuhan is the capital of Hubei Province and is a “1 + 8 city circle.” The central city is an experimental area for comprehensive reform of the construction of a resource-saving and environment-friendly society. Many water systems are found in the city, and the water area accounts for one-fourth of the total area of the city. Hence, Wuhan is called “the city of a thousand lakes” [44]. The world’s third longest river, the Yangtze River, and its largest tributary, the Han River, converge in the center of Wuhan, forming a spatial pattern of cities on three sides of the strait.
We selected seven central urban areas in Wuhan as the study areas: Jiang’an District, Hongshan District, Jianghan District, Tongkou District, Hanyang District, Wuchang District, and Qingshan District (Figure 1 and Table 1). The core area of the city has a high level of urbanization. In the past 30 years, Wuhan has been one of the fastest growing cities in China, with a population growth from 6.29 million in 1987 to 9.79 million in 2018. The central city of Wuhan is densely populated. The built-up area is expanding rapidly, whereas the blue-green space has a large range of change, making the central city of Wuhan representative as a research area. The land cover types in the six remote urban areas of Dongxihu, Xinzhou, Huangpi, Hannan, Caidian, and Jiangxia are mainly composed of cultivated land, forest land, and waters. They are less affected by rapid urbanization, and the blue-green space changes are not obvious. Therefore, these six areas are outside the scope of this study.
2.2. Data Sources
In the acquisition of remote sensing data, factors such as acquisition time, coverage, cloud cover, and resolution were considered. To minimize the negative impact of weather on the analysis, images with zero cloud cover in the study area were selected. This study selected remote sensing images from 1987, 1992, 1996, 2001, 2005, 2009, 2013, and 2018 as data sets. All these remote sensing images were obtained from Landsat satellites, and the images were downloaded from the China Geospatial Data Cloud Website (Http://www.gscloud.cn/). Table 2 shows the image data.
We performed preliminary processing of the data. First, we used ENVI5.3 software (ITT Visual Information Solutions, New York, NY, USA) to preprocess the images (radiation calibration, atmospheric correction, fusion, and cutting). We then performed image fusion, which is a combination of different digital images to create a new image by using an algorithm. Image fusion uses high spatial resolution and spectral information to effectively visualize and interpret images. Image fusion is implemented to fully utilize remote sensing images spatial information [45]. The Alberts Conical Equal Area is used as the reprojection coordinate system. The image was resized to a resolution of 15 × 15 m to obtain the minimum plot unit of urban land area of 225 m2. These steps will improve the precision of the subsequent data processing work.
3. Methods
3.1. Land Use Mapping and Analysis
3.1.1. Classification of Land Use Types
We use the normalized differential vegetation index (NDVI) to extract urban green space, NDVI is the best indicator of vegetation growth status and vegetation coverage and is widely used in detecting vegetation growth status, vegetation coverage, and eliminating partial radiation errors [46]. NDVI can partially eliminate the influence of radiation changes related to atmospheric conditions, such as solar altitude Angle, satellite observation Angle, topography, and cloud shadow, etc. The result is limited to (−1, 1), avoiding the inconvenience of using too much or too little data.
On the basis of the spectral characteristics of weak absorption of water in the green-wave band and strong absorption in the near-infrared band, Mcfeeters first proposed the most representative normalized difference water index (NDWI) [47]. However, the spectral characteristics of buildings and soil in the green light and near-infrared bands are similar to water bodies. When the NDWI is used to extract water bodies in cities, buildings and water bodies are easily confused. Aiming at this problem, Xu Hanqiu proposed an improved normalized differential water index (MNDWI) [48]. This step enhances the difference between water bodies and buildings, and improves the accuracy of water body extraction in cities. We refer to this method when we extract urban blue space.
The normalized difference barren index (NDBI) is the most commonly used index for extracting construction land, and it is created on the basis of the characteristic that the reflectivity of construction land in the mid-infrared band is greater than that in the near-infrared band [49]. First, using the NDBI index to perform band calculation on the image after the water mask to separate building from vegetation. Second, removing the bare land information from the construction land information. The reflectance of buildings and bare land in the NIR band is less than that in the mid-infrared band. Therefore, using the NDBI index to enhance the construction land information also enhances the bare land information. The normalized differential impervious surface index (NDISI) enhances only the surface impervious surfaces of buildings and roads [50]. The bands based on the NDISI index are used in the image extracted by the NDBI index to effectively remove the mixed bare land in the construction land.
3.1.2. Accuracy Evaluation
Obfuscation matrix is a standard format for accuracy evaluation, in which columns represent the reference image information and rows represent the classification result information of the evaluated image. It can clearly see the number of correctly classified and misclassified categories and numbers for each feature [51]. However, the classification accuracy of the confusion matrix cannot be intuitively seen, so various classification accuracy indexes are derived from the confusion matrix, among which overall accuracy (OA) and Kappa coefficients are the most widely used. The overall classification accuracy indicates the probability that the results of the classification are consistent with the actual type of the corresponding region of the reference data. Kappa coefficient represents the ratio of error reduction between classification and completely random classification. Kappa coefficient is between –1 and 1, and the higher the value is, the more accurate the classification result will be. Annual land use type verification samples were extracted from Google Earth images and Landsat images by visual interpretation, and the annual images included 500 randomly selected points.
3.2. Blue-Green Space Landscape Pattern Index
Landscape pattern generally refers to spatial pattern, that is, the spatial arrangement and combination of landscape elements with different sizes and shapes, including the type, number, and spatial distribution and configuration of landscape constituent units. For example, different types of patches can be used in space. Landscape pattern is distributed randomly, uniformly, or in a clustered manner. It is a concrete manifestation of landscape heterogeneity and the result of various ecological processes at different scales. Landscape patterns are usually analyzed using landscape indicators. All metrics are divided into three levels of patch, patch type, and landscape, which quantify the fragmentation, heterogeneity, and connectivity of landscape patterns [52].
In this study, the number of patches, patch density, edge density, area weighted average patch area, area weighted shape index, and area weighted average fractal dimension were selected to quantify the landscape pattern of blue-green space. The number of patches is the total number of patches contained in a landscape type; the patch density and edge density are the sum of the number and perimeter of patches per unit area respectively, which can be used to evaluate the fragmentation degree of landscape. The area-weighted shape index is equal to the sum of the perimeter and area ratio of each patch in a certain patch type multiplied by their respective area weights. The fractal dimension of area-weighted average is used to measure the spatial shape complexity of patches and landscapes. The larger the value of these two indicators is, the more complex the patch shape is. To some extent, it also reflects the degree of influence of human activities on the landscape pattern. All metrics are calculated in FRAGSTATS 4.2 (Manufactured by LandEco, OR, USA).
3.3. Urban Expansion Intensity
In the study, we selected the Urban Expansion Intensity Index (UEll) to identify urban expansion. UEll represents the annual spatial change of the land area of a city unit area [53,54]. Urban expansion intensity refers to the percentage of urban land use expansion area in the total land area of a certain space unit in a certain period. The equation is as follows:
where ULAt1 and ULAt2 are the urban built-up area at t1 and t2, respectively; TLA is the total area of the study area; and Δt is the time interval (in years) during the study period.
Seto et al. converted the urban expansion rate into a standard measure to remove the urban land use scale effect, which can accurately reflect the rate of urban expansion and also facilitate comparison between different periods [55]. The equation is as follows:
In the formula, ULAt1 and ULAt2 are the area of urban built-up area at t1 and t2, respectively; Δt is the time interval (in years) during the study period.
3.4. Sector Analysis and Gradient Direction Analysis
Sector analysis can effectively describe the spatial distribution of different land use types with respect to the direction of a predefined city center [56]. In this study, we used sector analysis to analyze the spatial changes of urban expansion. First, the center points in Wuhan’s downtown area (Wuhan Municipal People’s Government) were identified by extending rays from each center at 10° intervals. A total of 36 sectors were drawn, and sector analysis was performed by calculating the area of each fan’s built-up area [57].
Gradient direction analysis is an upgrade process used to summarize the spatial-temporal changes in land use patterns [58]. This method first draws several concentric rings at a certain interval using the center point of Wuhan’s downtown area as the center of the circle, and the range of the largest concentric ring should cover the entire study area. Next, 36 fans were mapped by extending rays from the city center at 10-degree intervals, with concentric rings intersecting those fans to create a series of segmented areas. Finally, each segmented area is represented by the largest proportion of land use types.
3.5. Coupling Analysis
3.5.1. Data Standardization
Data standardization (normalization) is a basic process in data mining. Different evaluation indicators often have different dimensions and dimensional units. After data is standardized, all indicators are in the same order of magnitude, which is suitable for comprehensive comparative evaluation [59]. All indicators can be divided into positive and negative categories. The larger the positive indicator, the more beneficial it is to the system, negative indicators are on the contrary. For example, the greater the patch density and edge density, the more fragmented the landscape and the more unfavorable the system development. The data are mapped in the 0–1 range through data standardization. The equation is as follows:
In the formula, xi and x’i respectively represent the values before and after the data are normalized, and xmin and xmax respectively represent the minimum and maximum values in the sample data.
3.5.2. System Development Level Measurement
The entropy method determines the weight by the amount of information passed to the decision maker by the indicator, which can reflect the utility of the indicator entropy more deeply [60]. In this article, it is used to determine the weight of each indicator in the blue-green spatial change system. The calculation steps are as follows:
In the formula, Pij is the ratio of the index j in the ith year; rij is the standardized value of the index j in the ith year; and n is the number of years.
In the formula, Hj is the entropy value of the index j, which represents the total contribution of all evaluation objects to the index j; Pij is the ratio of the index j in the ith year; and n is the number of years.
In the formula, Fj is the difference coefficient, which indicates the degree of inconsistency of the contribution of each evaluation object under the index j, and Hj is the entropy value of the index j.
In the formula, Ψj is the weight of index j; Fj is the difference coefficient, and n is the number of years.
In the formula, Ui is the comprehensive evaluation index of a system in the ith year; Ψj is the weight of the index j; rij is the standardized value of index j in the ith year; and n is the number of years.
3.5.3. Coupling Model
The concept of coupling originates from the field of physics and refers to the process of energy transmission from one medium (such as a metal wire or optical fiber) to another medium [61]. Coupling describes the phenomenon in which two or more systems interact with each other through an interaction mechanism [62]. We use the coupling model to analyze the internal relationship between urban blue space, green space, and urban built-up areas, and quantitatively evaluate the coordination level of the three in different development stages to make up for the deficiency of spatial analysis. The coupling equation is
where C is the coupling degree among n systems; Ui (i = 1, 2, …, n), Uj (j = 1, 2, …, n) represents the comprehensive evaluation index. However, this model cannot assess whether the coupling is benign, that is, when the comprehensive development level of multiple systems is low, a high degree of coupling can still be obtained. To avoid this deficiency, this study introduces a coupling coordination degree model that objectively reflects the coordinated development level of multiple systems [63]. The model expression is as follows:
where D is the degree of coupling and coordination among n systems; T is the comprehensive coordination index; and is the undetermined coefficient, which represents the contribution of the ith system to the integrated system. When n = 2, takes the value of 0.5; when n = 3, takes the value of 1/3.
4. Results
4.1. Results of Land Use Change
4.1.1. Accuracy Assessment of Land Classification
Overall accuracy and Kappa coefficients were used to evaluate the accuracy of land classification. The verification samples were randomly extracted from Google Earth images and Landsat images in 1987, 1992, 1996, 2001, 2005, 2009, 2013, and 2018. As shown in Table 4, OA value of all classification results was higher than 90% and Kappa coefficient was greater than 0.9, indicating that the classification results of land use were highly accurate and could meet the needs of this study.
4.1.2. Dynamic Changes of Blue-Green Space and Urban Built-Up Area
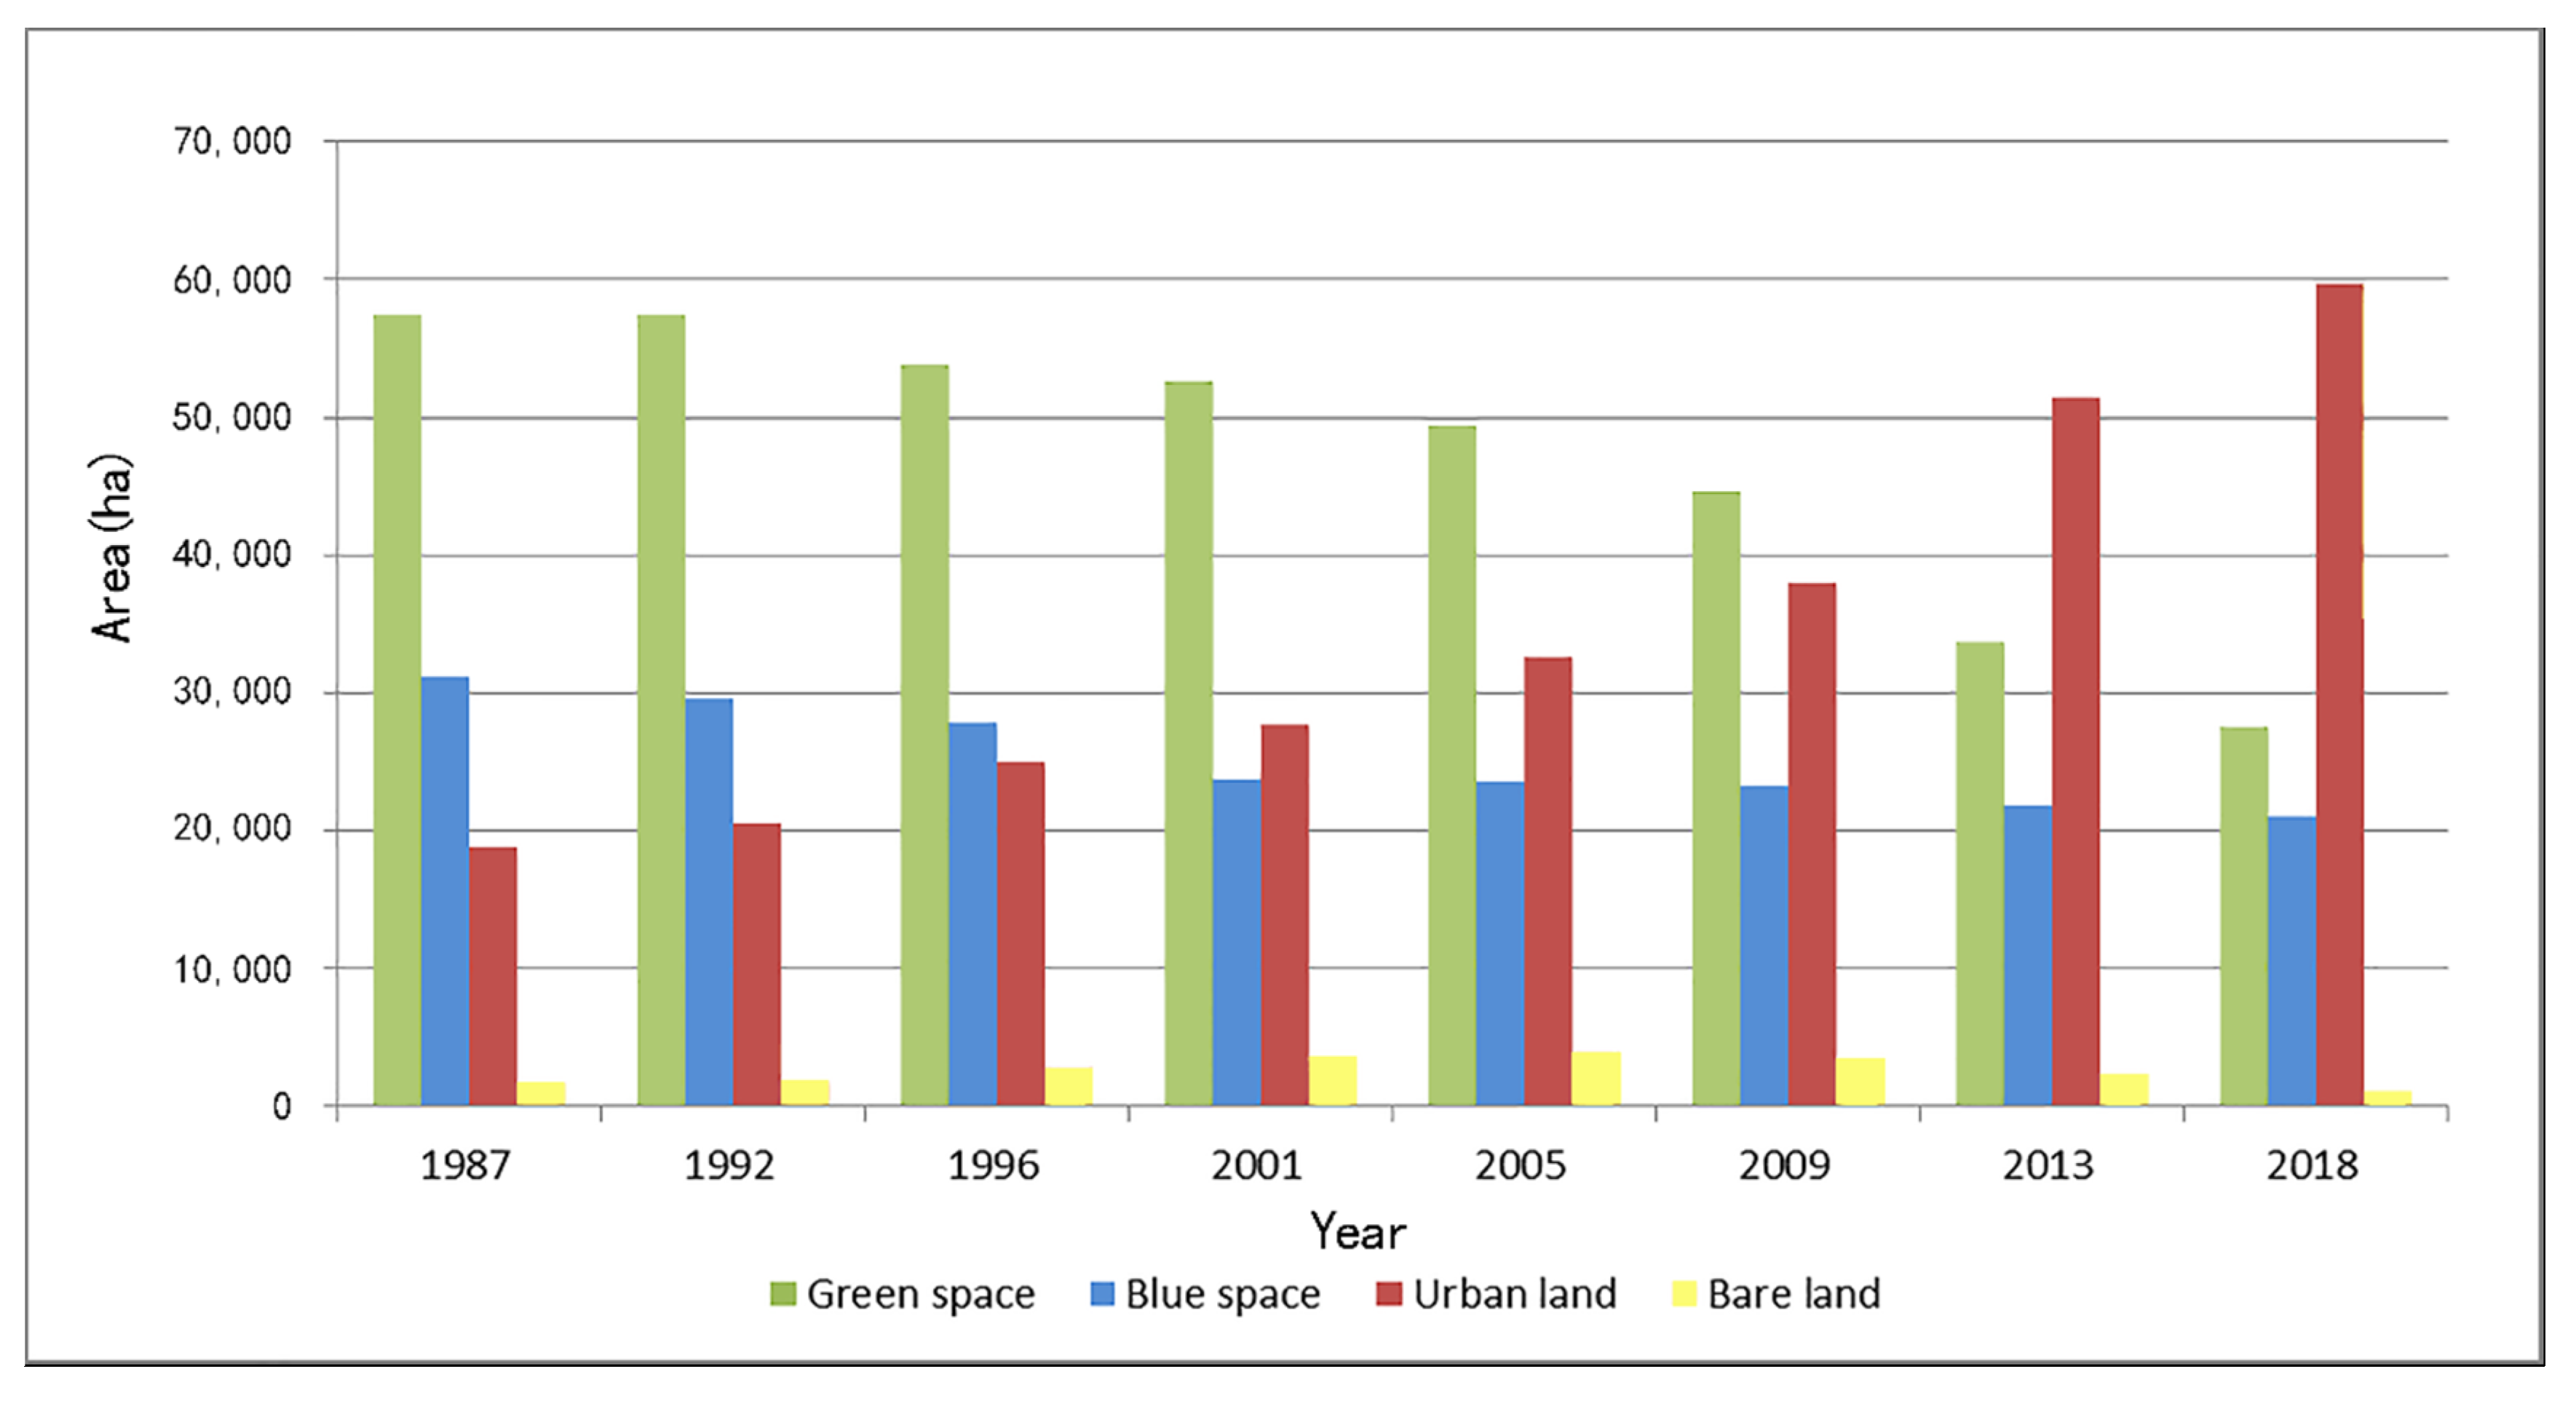
From the remote sensing images, land use maps of eight periods in 1987, 1992, 1996, 2001, 2005, 2009, 2013, and 2018 were obtained (Figure 2), and the area changes of various types of land were calculated (Figure 3). The results show that the green space in the central urban area of Wuhan has been continuously occupied, which has been reduced by half in the past 30 years to 29,958 hectares, accounting for 27.44% of the total area of the central urban area. Before 2001, the water area in the northern part of the Yangtze River was greatly reduced. Later, the blue space pattern gradually stabilized, with a total decrease of 10,108 hectares, accounting for 9.26% of the total area of the central urban area. At the same time, urban built-up areas have expanded dramatically, adding a total of 41,010 hectares. Before 2009, the increase of construction land in the initial construction stage was relatively small. Since 2009, with the support of national policies, the construction land of development zones has increased significantly, which is the peak period of its increase. By 2018, the construction land of the central urban area has reached saturation.
In 1987, blue space, green space and urban built-up areas accounted for 28.51%, 52.74%, and 17.19% of the total area of the central urban area, respectively. At that time, the city was still weak and mainly concentrated at the intersection of the Yangtze River and the Han River. In 2018, blue space, green space and urban built-up areas accounted for 19.20%, 25.21%, and 54.72% of the total area of the central urban area, respectively. On the whole, the central urban area of Wuhan shows typical characteristics of land use reconstruction in the process of rapid urbanization—construction land occupies a large number of agricultural and forestry land to obtain rapid urbanization expansion, and the blue and green space is shrinking.
4.2. Analysis of Land Use Transfer Results
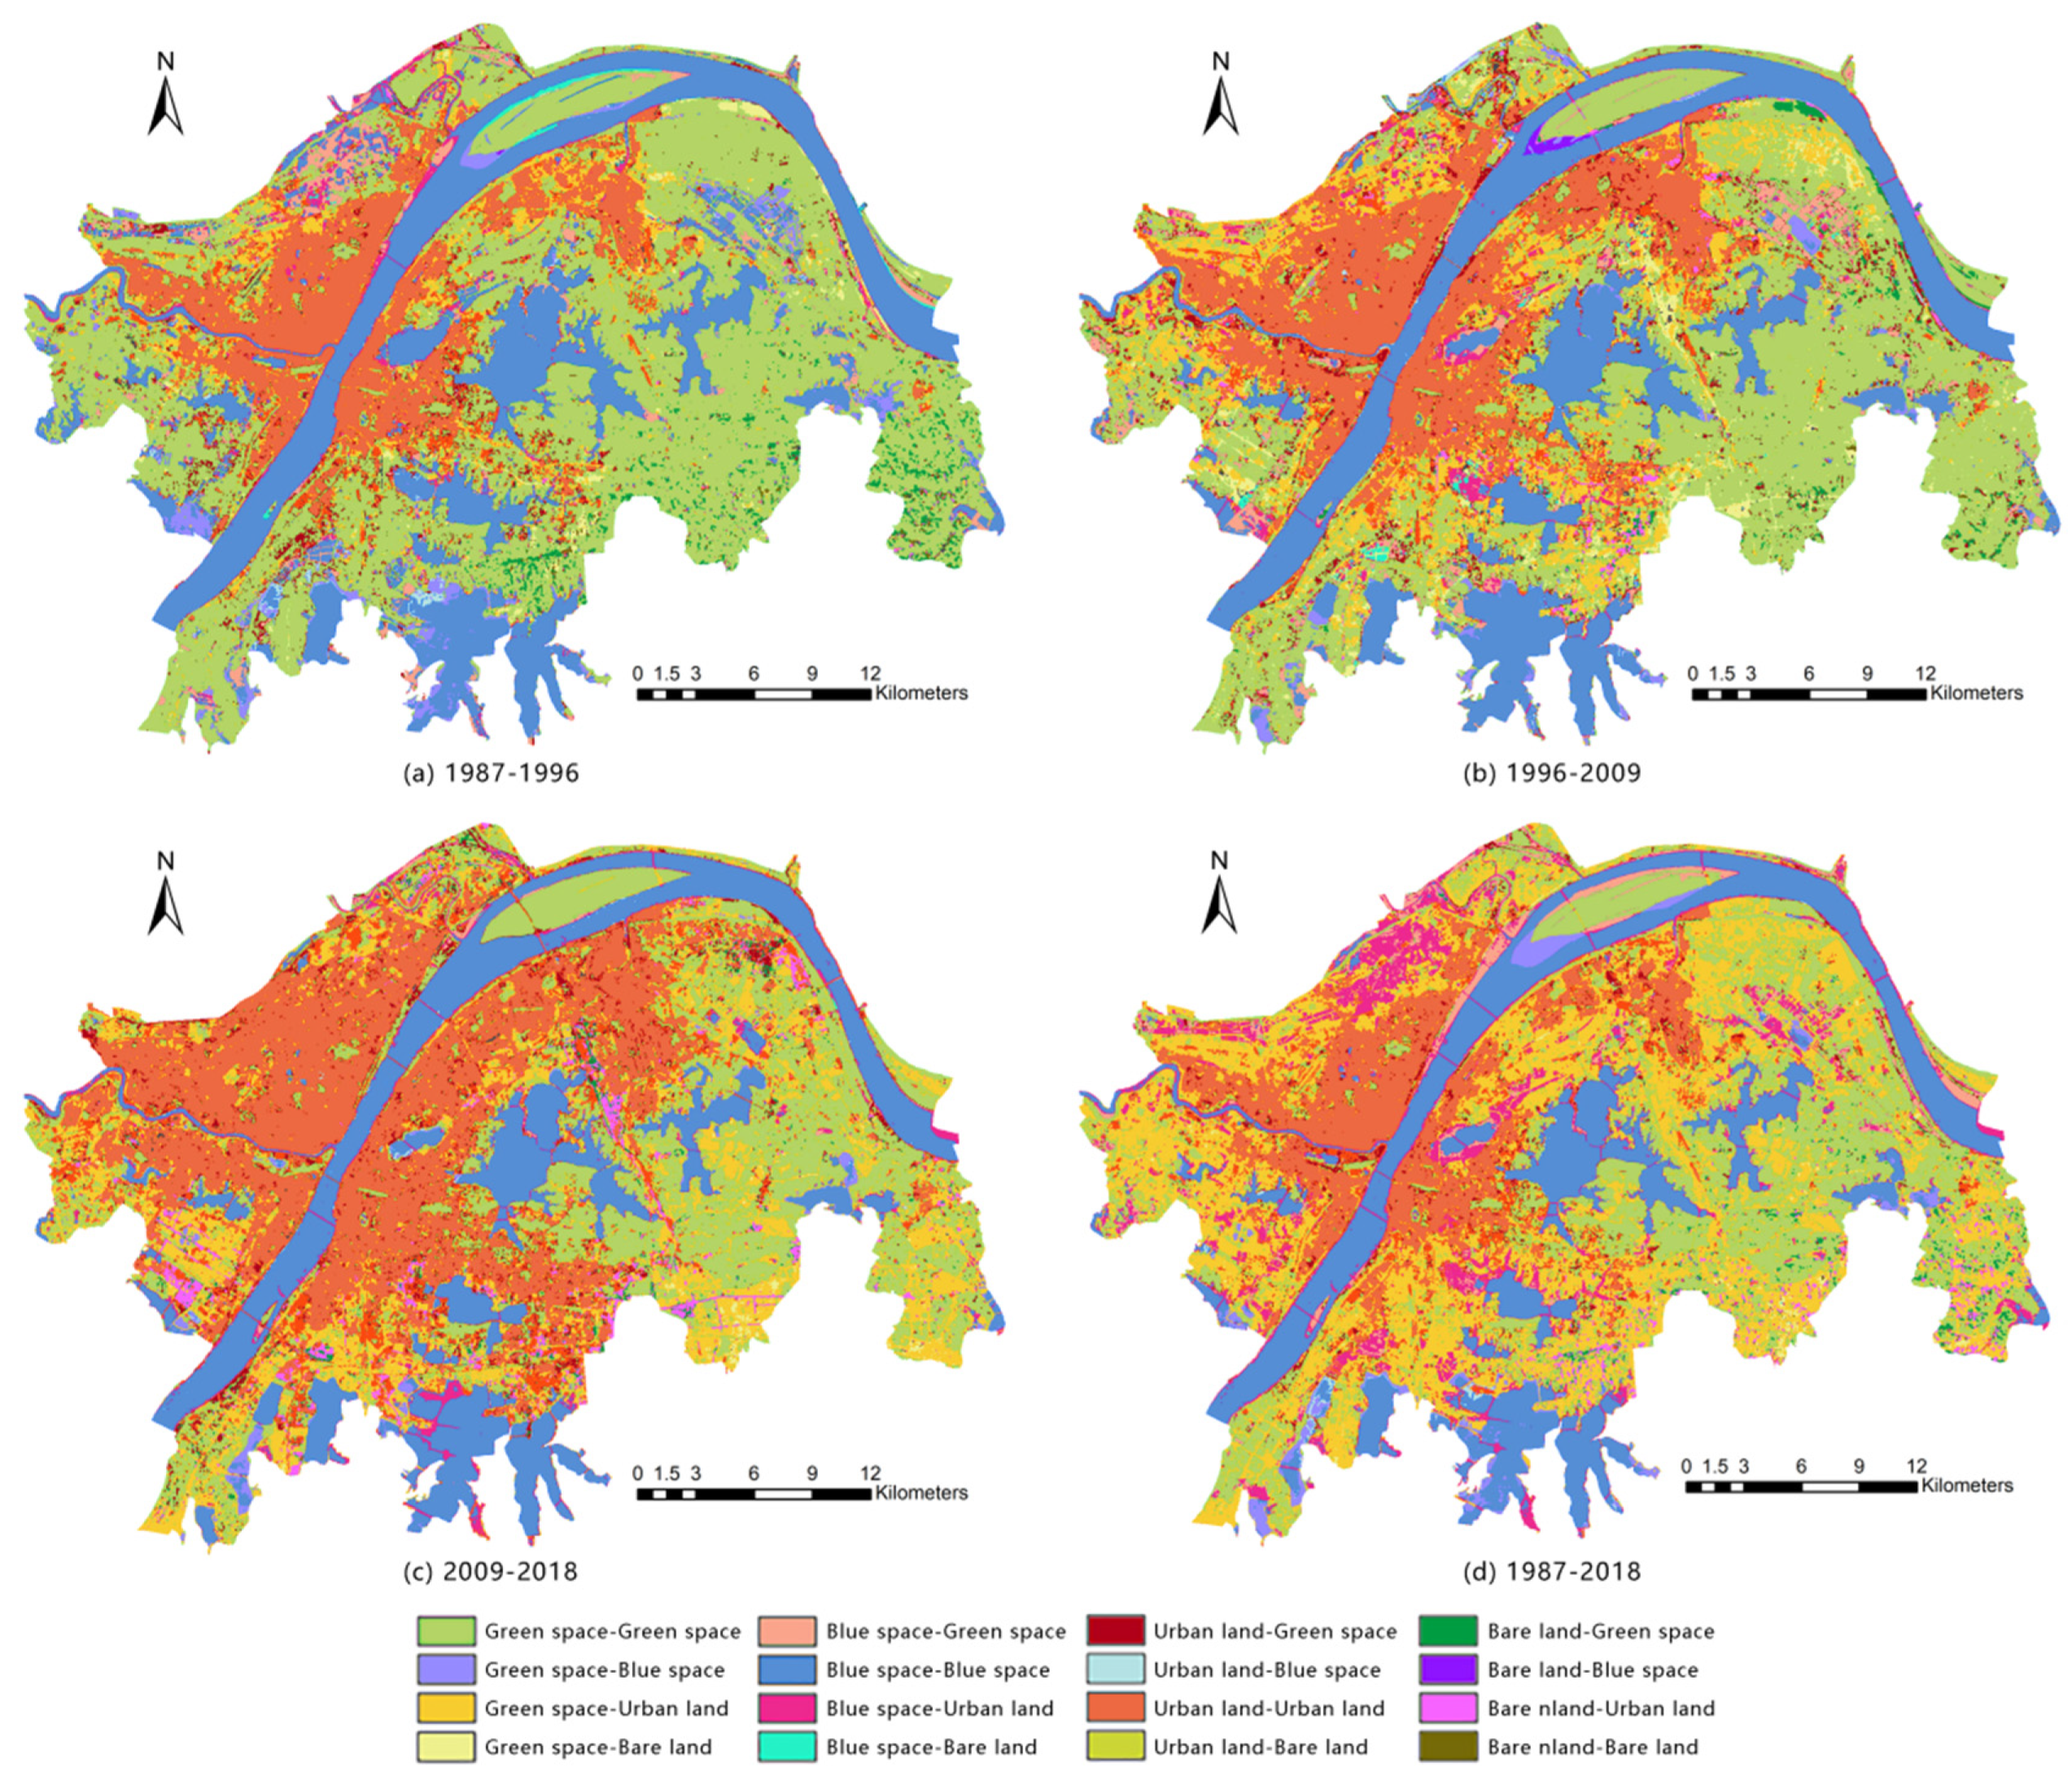
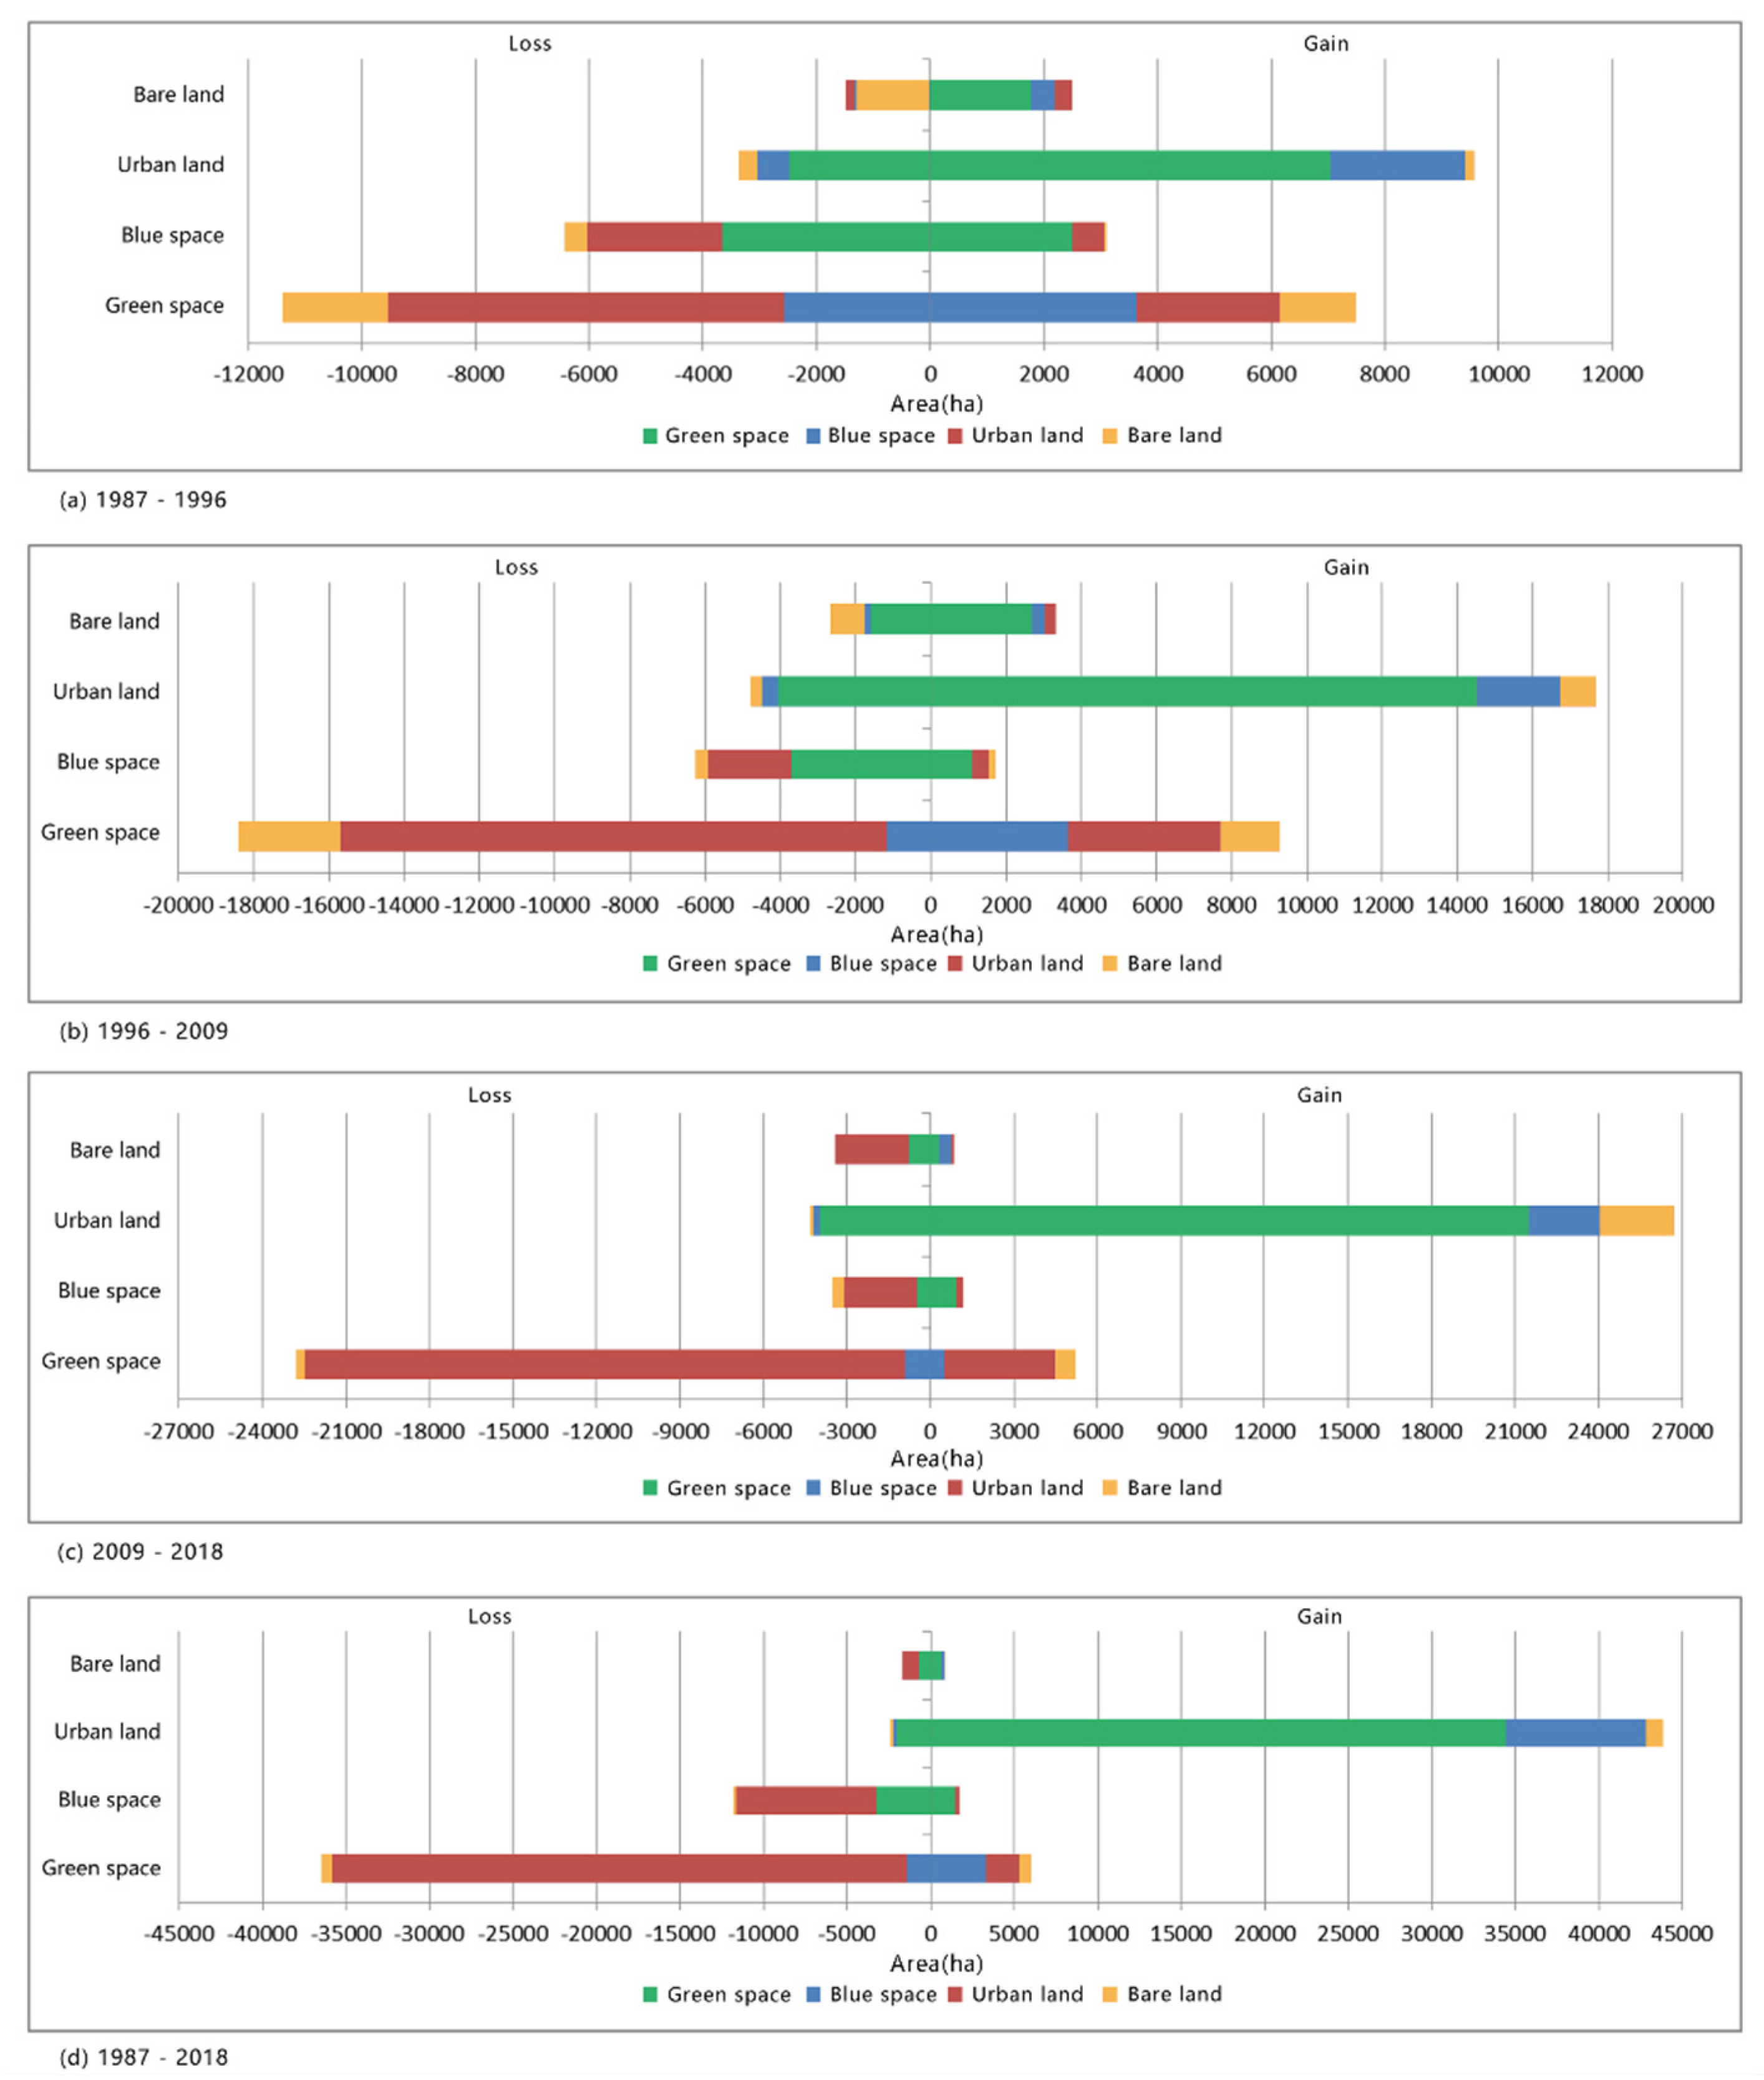
To further clarify the interactions between various land use types in the process of rapid urbanization, the land use maps of two years were superimposed using ArcGIS, and obtained visualizations for 1987–1996, 1996–2009, 2009–2018, and 1987–2018 (Figure 4). The mutual conversion area between the four land use types is calculated to obtain the land use transfer matrix (Figure 5). The results show:
During the 30 years, 47.91% of the land types in the central urban area of Wuhan have changed. From 1987 to 1996, the land use change was not significant, mainly occurring at the edge of the city, and the distribution was relatively scattered. The characteristics of land use transfer from 1996 to 2009 and from 2009 to 2018 are similar, with intensified land use change and obvious suburban urbanization. Land conversion takes place almost between every two types of land use, among which the most significant feature is the transformation from urban green space to built-up area. In the three periods, 6947 hectares of green space, 14,545 hectares of green space, and 21,505 hectares of green space are transformed into built-up area, respectively. A total of 34,458 hectares of green space was transformed into urban built-up areas during the whole study period, accounting for 65.86% of the total change area. This shows that the expansion of urban space mainly depends on the encroachment of green space in the process of rapid urbanization. In addition, 8345 hectares of blue space have been transformed into urban built-up areas, accounting for 15.95% of the total area of change. The transformation is mainly concentrated in the first two periods. In the last decade, the protection of urban blue space policy has increased significantly. A total of 3313 hectares of blue space were transformed into green space, accounting for 6.33% of the total change area, mainly due to the phenomenon of lake filling and farmland formation in the early stage.
4.3. Analysis of Blue-Green Space Landscape Pattern
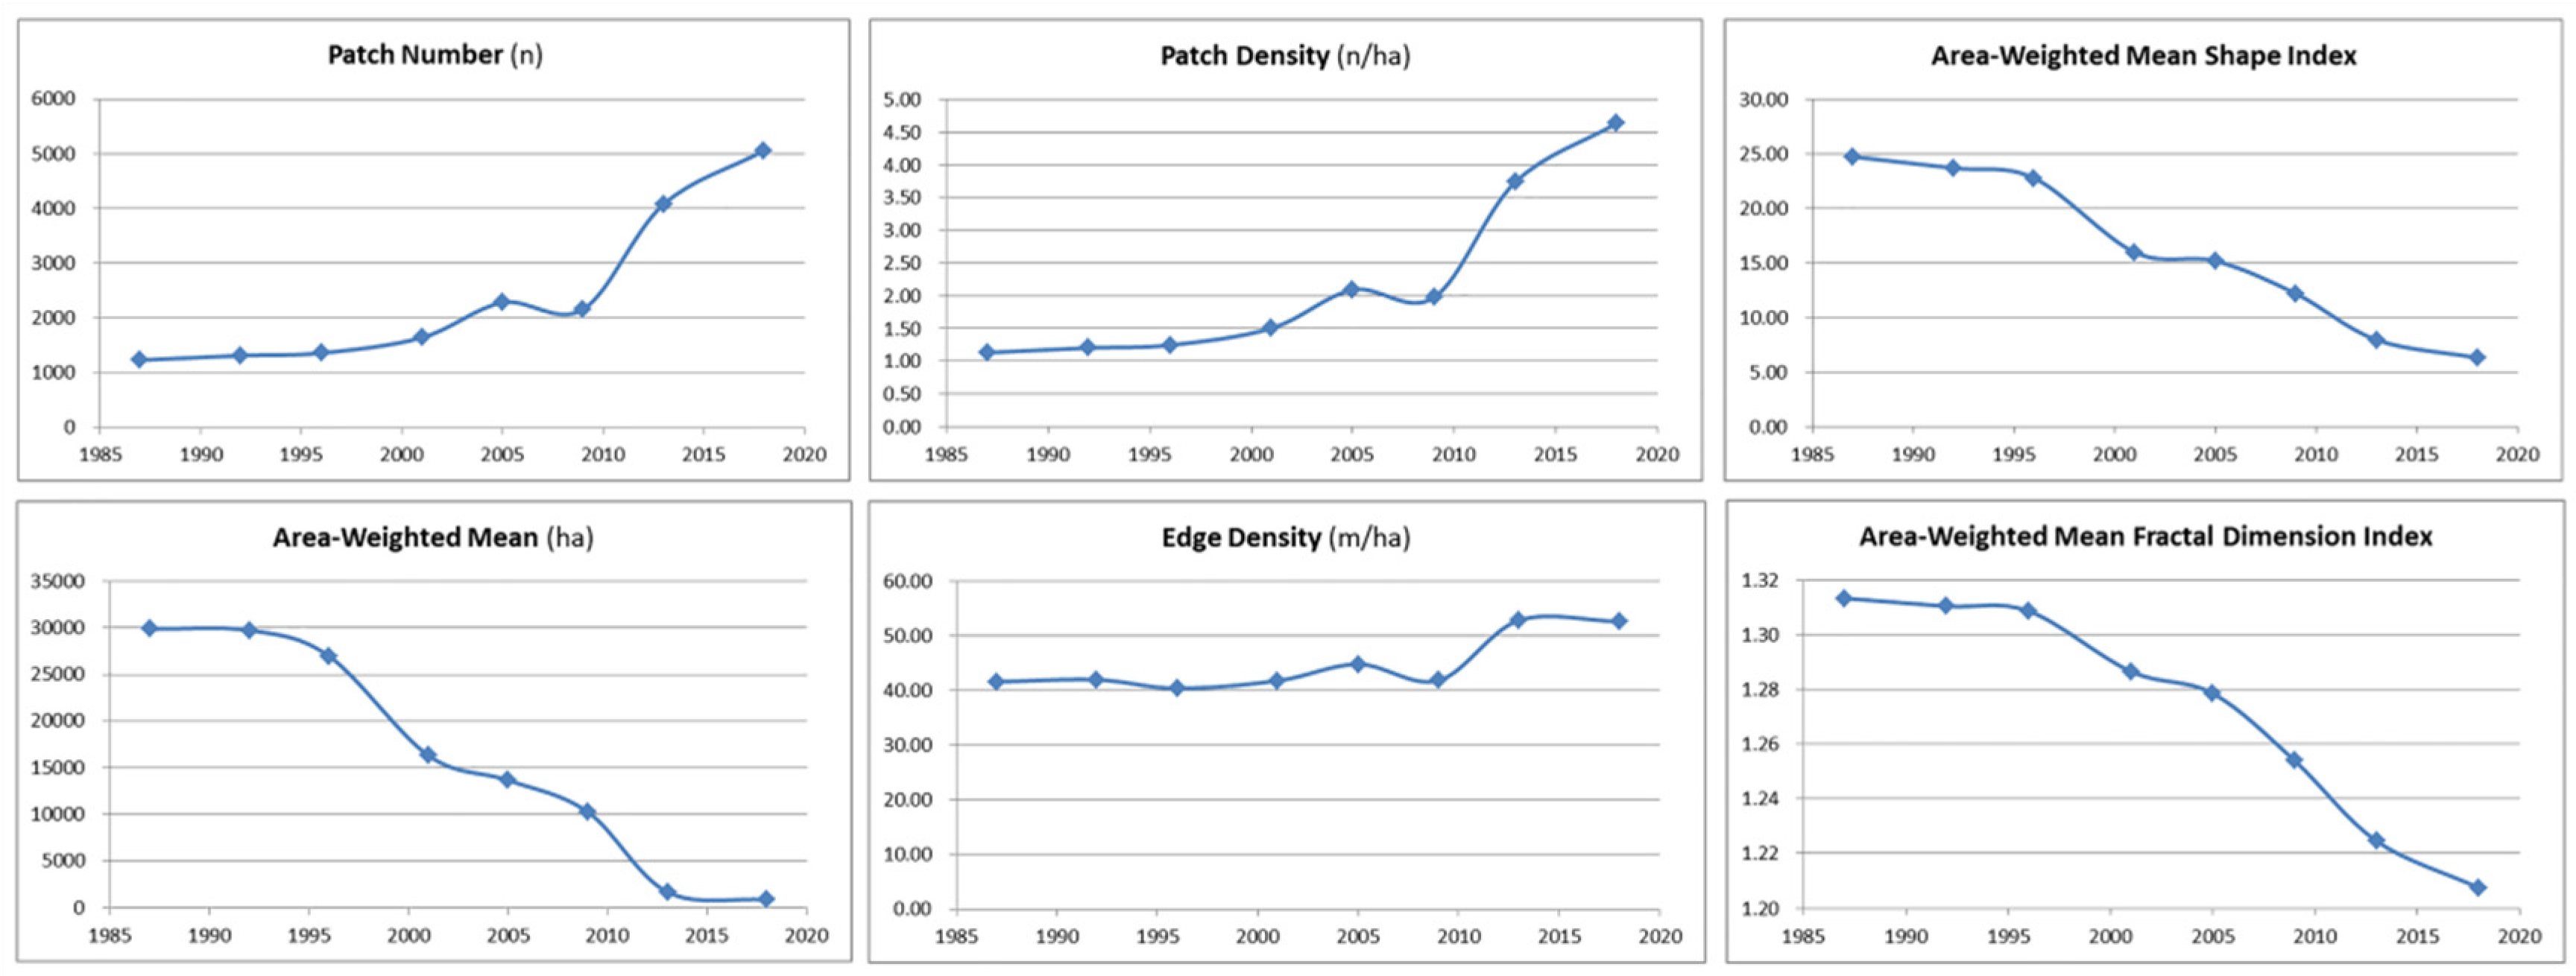
On the basis of the land use classification results, the landscape pattern of the blue-green space in the study area was analyzed using six selected landscape indicators. Figure 6 show the landscape pattern index of the green space. The changes in the number and density of green space plaques in central Wuhan can be divided into two stages: from 1987 to 2009, both of them rose slowly and their curves were almost horizontal; from 2009 to 2018, the two increased sharply, indicating that urban expansion and human activities have aggravated the damage to urban green space and the green space has become increasingly fragmented. Although the area of green space is gradually shrinking, the edge density does not change much due to the increasing number of patches. Both the area-weighted shape index and the area-weighted average fractal dimension of green space show a decreasing trend, which means that the patch shape of green space is becoming more and more regular, and the complexity of the patch edge is decreasing, which also indicates that the green space has been greatly disturbed by human activities.
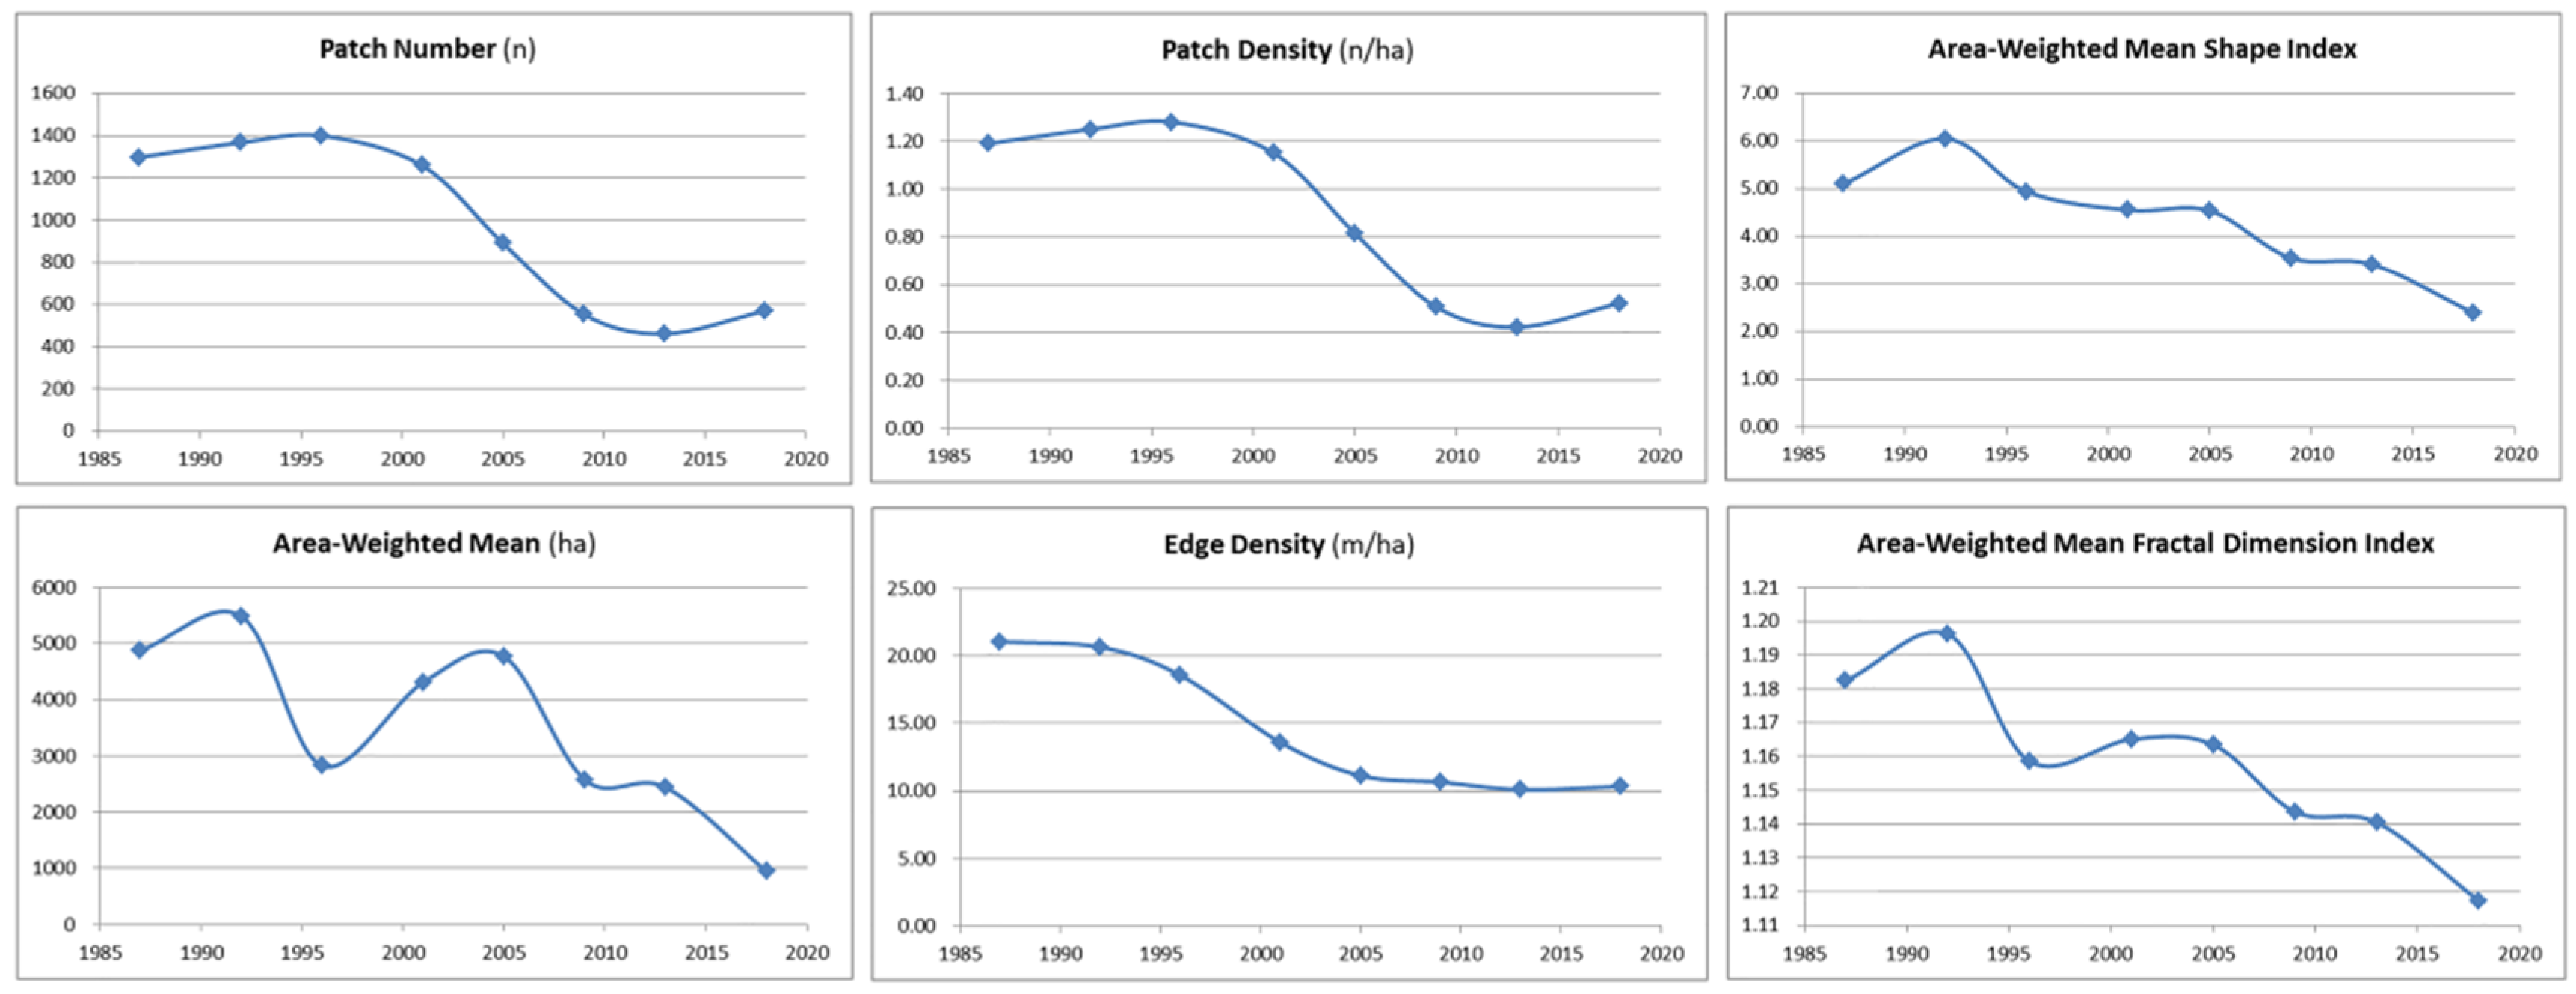
Figure 7 show the landscape pattern index of Blue Space. The change of patch quantity, patch density, and edge density in central Wuhan can be divided into three stages: from 1987 to 1996, the three almost fluctuated horizontally; from 1996 to 2009, the three decreased sharply, indicating that urban expansion and human activities aggravated the damage to the urban blue space. The fragmentation of the blue space continued to decrease, mainly due to the disappearance of small lakes and branches of large lakes. From 2009 to 2018, the three returned to the state of horizontal fluctuation. During this period, the Wuhan Municipal Government strengthened the protection of urban lakes, achieving remarkable results. The blue space area-weighted shape index and area-weighted average fractal dimension show a decreasing trend. The main reason is that the shape of urban waters becomes more and more regular due to the influence of agricultural and commercial activities such as reclamation of farmland and development of real estate.
4.4. Analysis of Urban Expansion
4.4.1. Urban Expansion Intensity
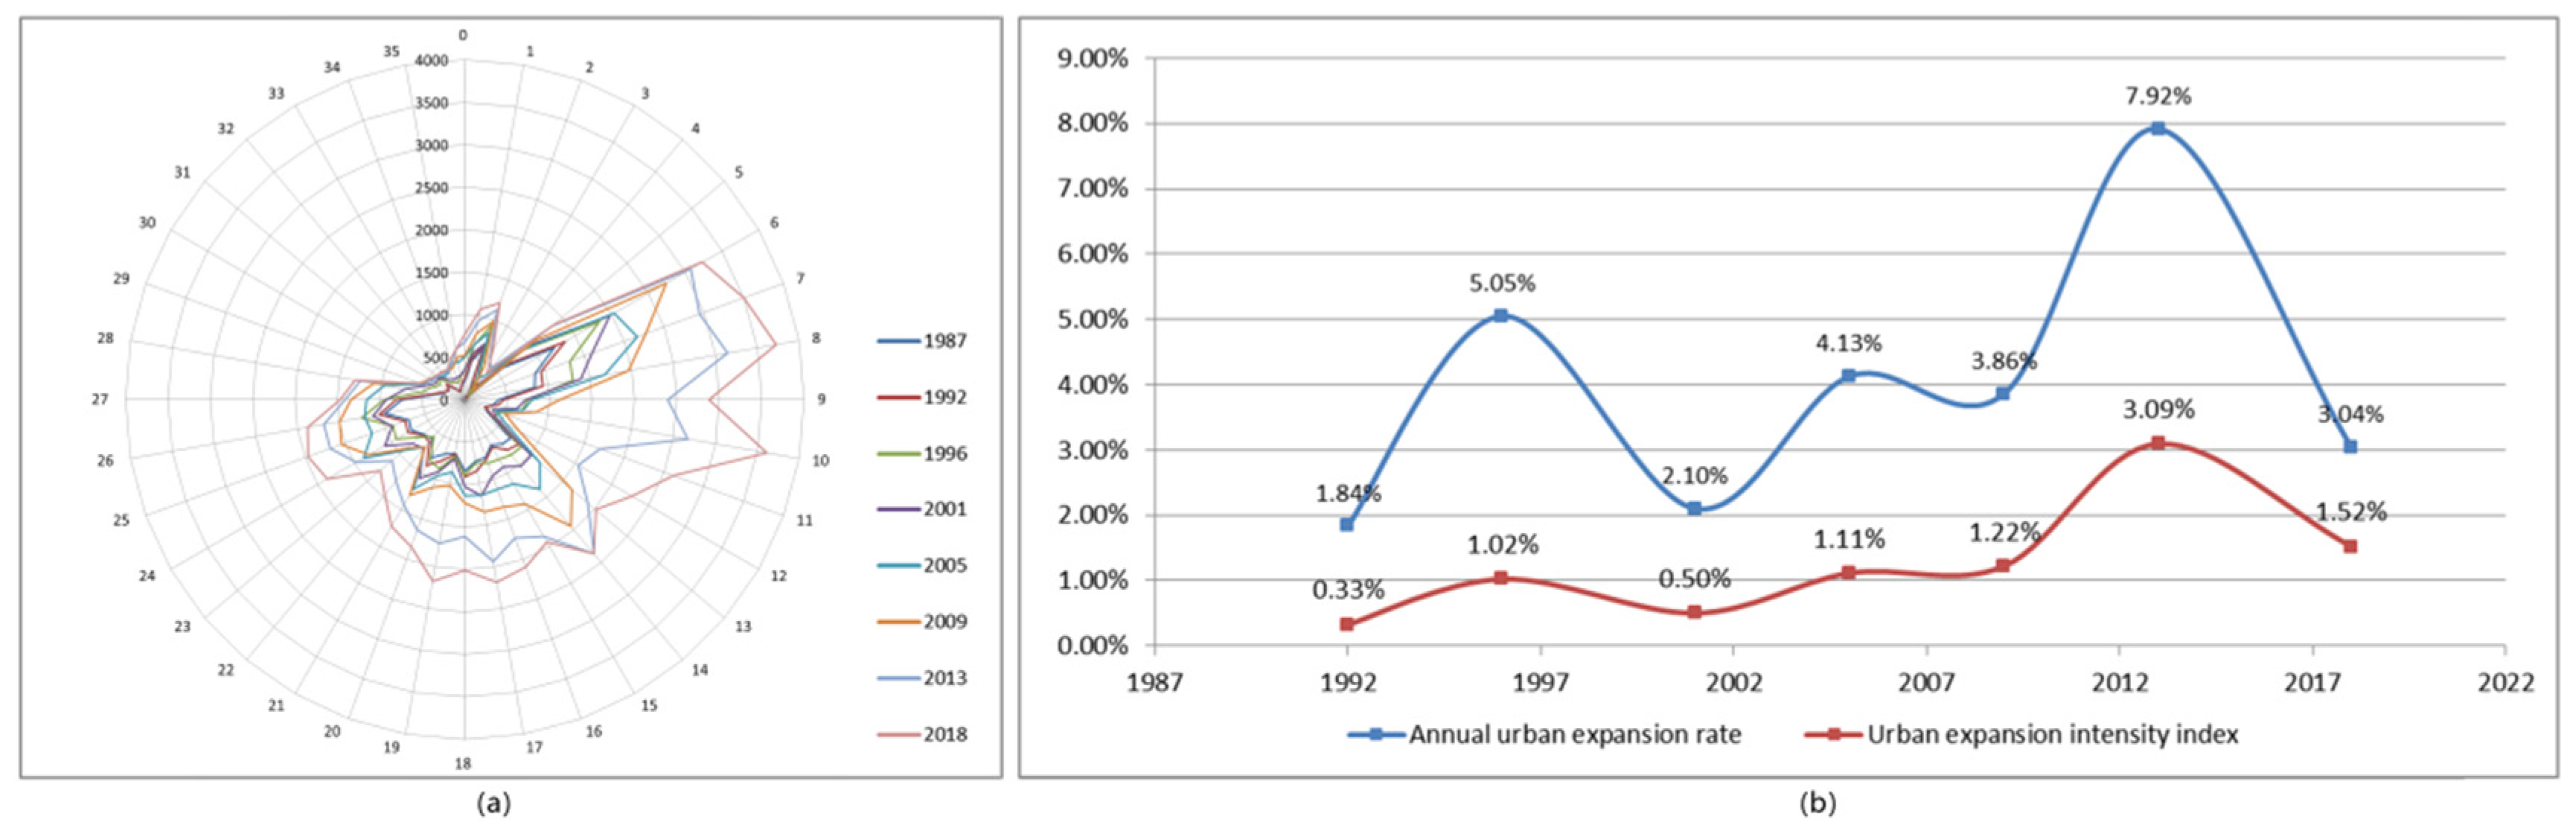
On the basis of the land use classification results, with the Wuhan Municipal People’s Government as the center point, the expansion direction map of the built-up area of the central city from 1987 to 2018 (Figure 8a) and the annual expansion intensity were calculated (Figure 8b). The ratio curve between the area and the total area of the central urban area is relatively flat, and the ratio curve between the annual expansion area and the total area of the built-up area in the previous year fluctuates greatly. The results show that:
From 1987 to 2009, the urban built-up area grew slowly and fluctuatingly, with the growth rate always below 1.25%. The urban expansion direction is basically the same, mainly with southeast, west, and northeast expansion, and the northern region of the Yangtze River gradually saturated. The effect of urban lake on the expansion of built-up area is obvious. Due to the presence of East Lake, the urban built-up area is blocked from expanding to the east, and a depression appears in the eastern area. The presence of South Lake delays the expansion rate of built-up area to the south. From 2009 to 2013, the urban expansion rate increased rapidly, among which the eastern region expanded the most rapidly. The urban built-up area gradually surrounded the East Lake, which became an urban lake. Urban built-up areas in the southern region gradually cross the barrier of Nanhu Lake and continue to expand outward to the vicinity of Tangxun Lake, encountering new development obstacles. From 2013 to 2018, urban built-up areas still maintained a relatively fast growth rate, but the growth rate continued to decline. Due to the abundant development space in the eastern region, there is still a violent urban expansion. The southern and western regions have limited development space, and the expansion of built-up areas is mainly occupied scattered green space, and the expansion speed is relatively slow.
4.4.2. Effect of Urban Expansion on Blue-Green Space
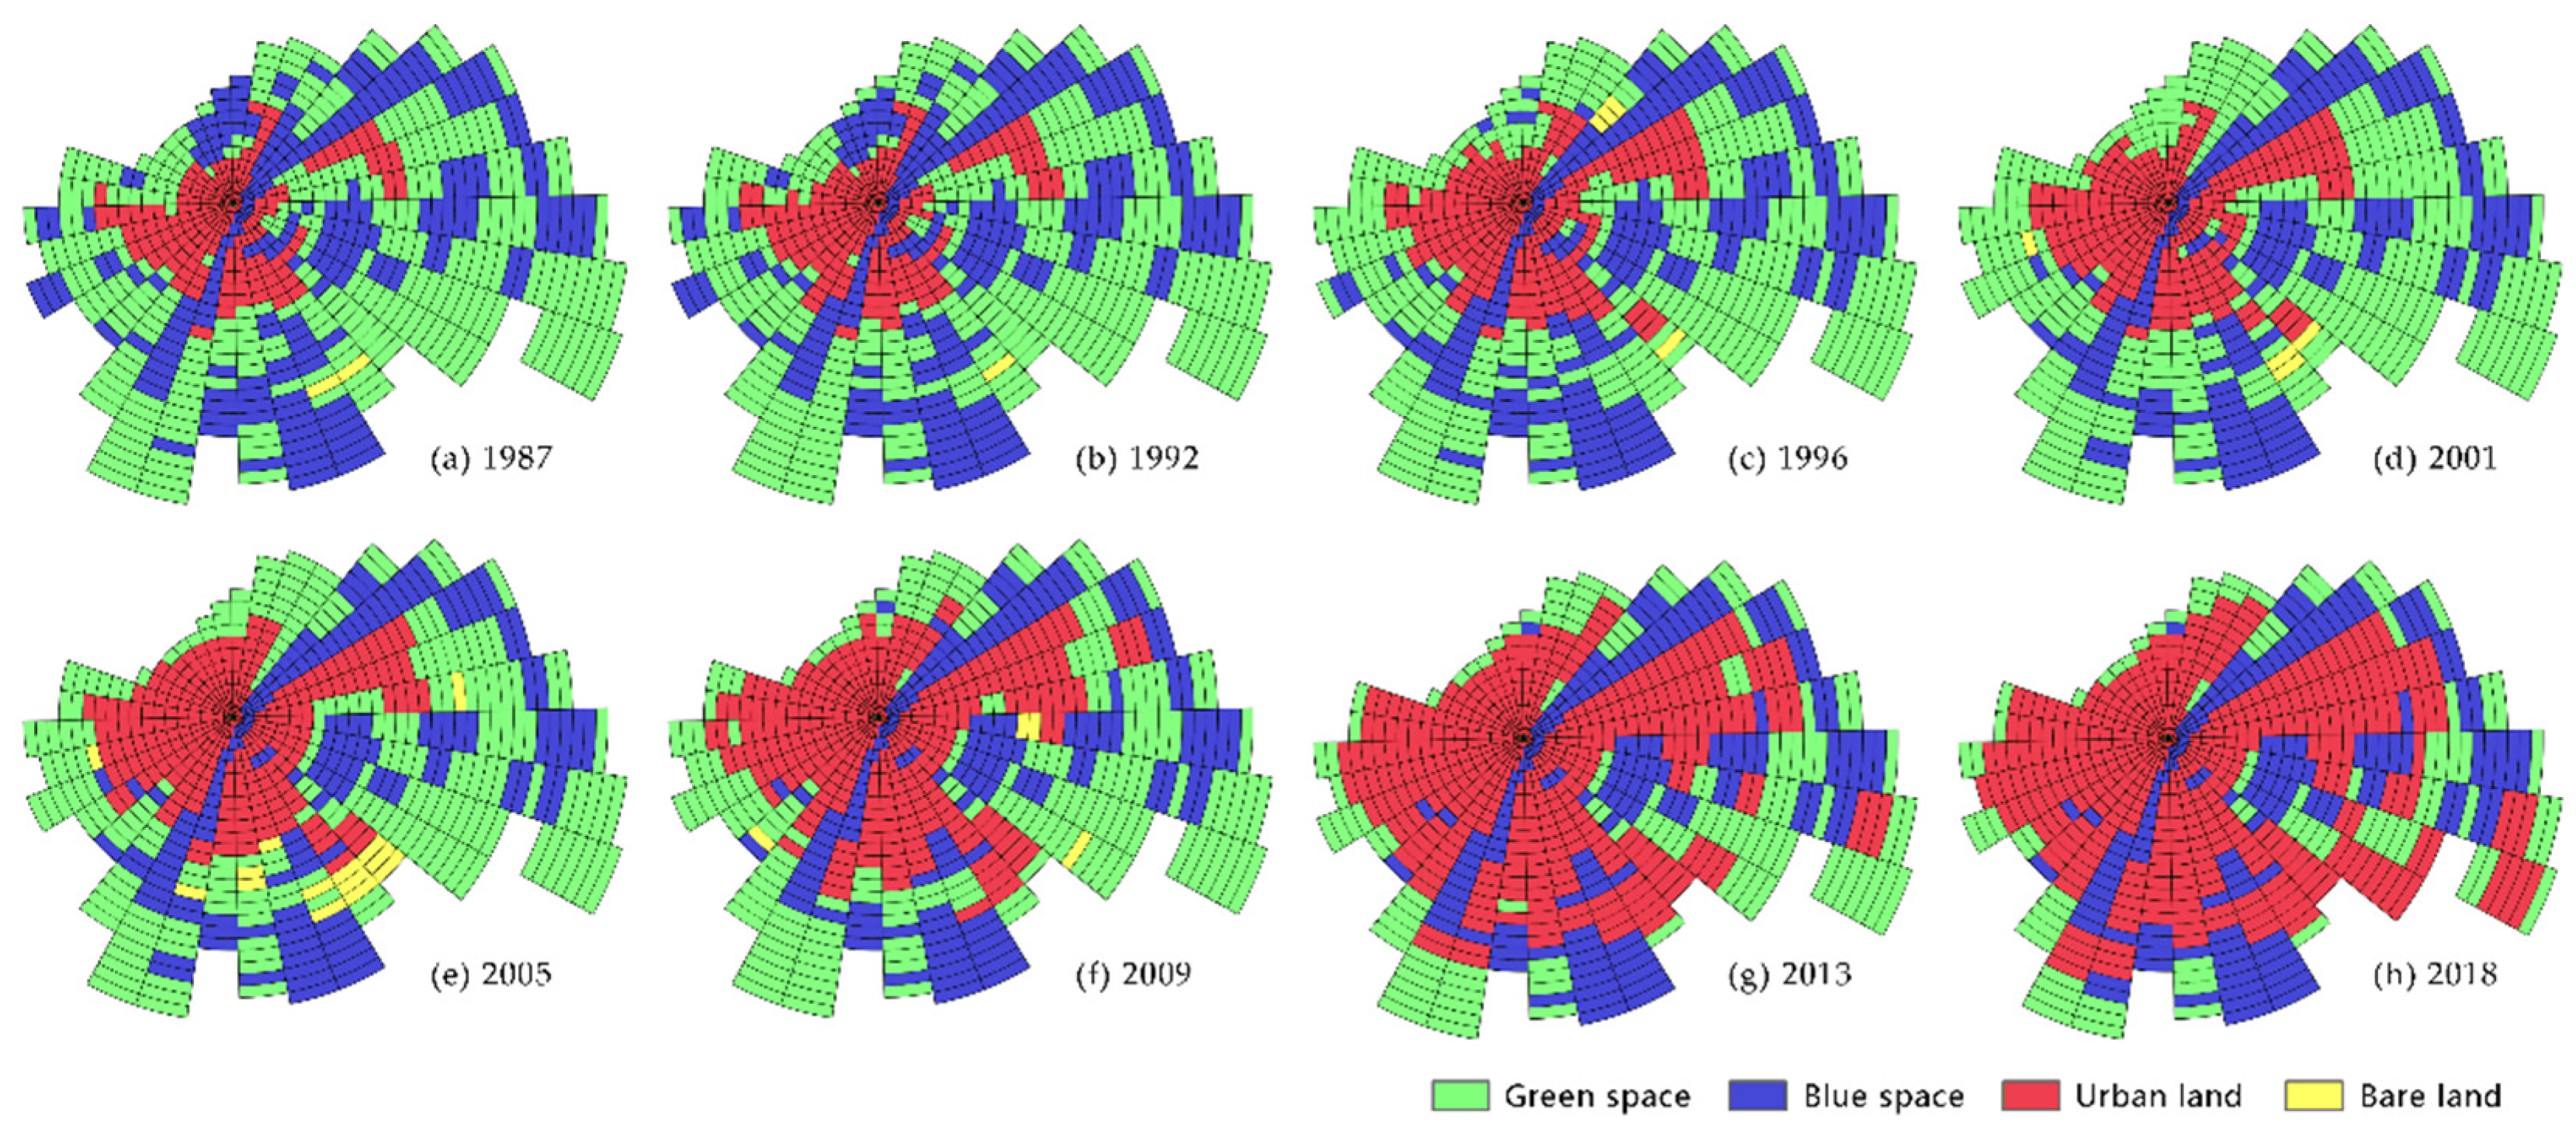
The gradient direction analysis helps visualize and analyze how the blue-green space changes with the expansion of the city. On the basis of the land use classification results, the Wuhan Municipal People’s Government is the center on which the gradient direction map of Wuhan’s central city from 1987 to 2018 will be drawn (Figure 9).
In the early period, the urban built-up areas were mainly distributed in the northwest of the central urban area, surrounded by the green space of the city, and the blue space was scattered throughout the entire study area. With the Yangtze River as the dividing line, the number of lakes in the south is greater and the area is larger, while in the north is mainly small lakes of less than 5 km2. By 1996, the northward expansion of the city caused a significant reduction in the northern waters. The northeast urban area and the main urban area were connected to break the green space. The southern urban built-up area uses the green space between the East Lake and the South Lake to expand outward. By 2005, the waters in the northern region had completely disappeared, and parts of the waters in the west and east had been transformed into green land by landfill. In the southern region, due to land reclamation for urban construction, a large amount of bare land emerged. After that, the built-up area of the city gradually expanded to the edge of the central urban area in the west, to the west bank of the Yangtze River in the east, and to the Tangxun Lake in the south. The South Lake, Ink Lake, and Longyang Lake were completely reduced to the inner lake of the city, and the built-up area eventually exceeded the green space area. In the past five years, the trend of urban built-up area expansion to the southeast is obvious, which gradually crosses the obstacles of East Lake and Yanxi Lake. Green space is gradually oppressed to the edge of the city, becoming more and more broken.
Thus, the blue-green space change in the central urban area of Wuhan in the past 30 years is characterized by the continuous expansion of the city. On the one hand, urban areas gradually occupied the green space, making it marginal and fragmented. On the other hand, urban areas continued to destroy the urban blue space and make small lakes gradually disappear and the big lakes into urban inner lakes.
4.5. Coupling Analysis Results of Blue-Green Space and City
4.5.1. Measurement of Blue-Green Space Development Level
The above analysis reveals the spatial effect of urban expansion on the blue-green space. Below, we use a coupled analysis model to quantitatively analyze the level of coordinated development between blue-green space and urban built-up areas. First, an index model is established to measure the comprehensive development level of the blue-green space in central urban Wuhan. The model includes two main indicators and seven secondary indicators. The total area, the number of patches, the area-weighted average patch area, the area-weighted shape index, and the area-weighted average fractal dimension are used to evaluate the blue space. The change index of the green space, the patchiness index, and the edge density are used to evaluate the fragmentation index of the blue-green space, and the weight of each index in the blue-green space change system is calculated using the entropy method (Table 5).
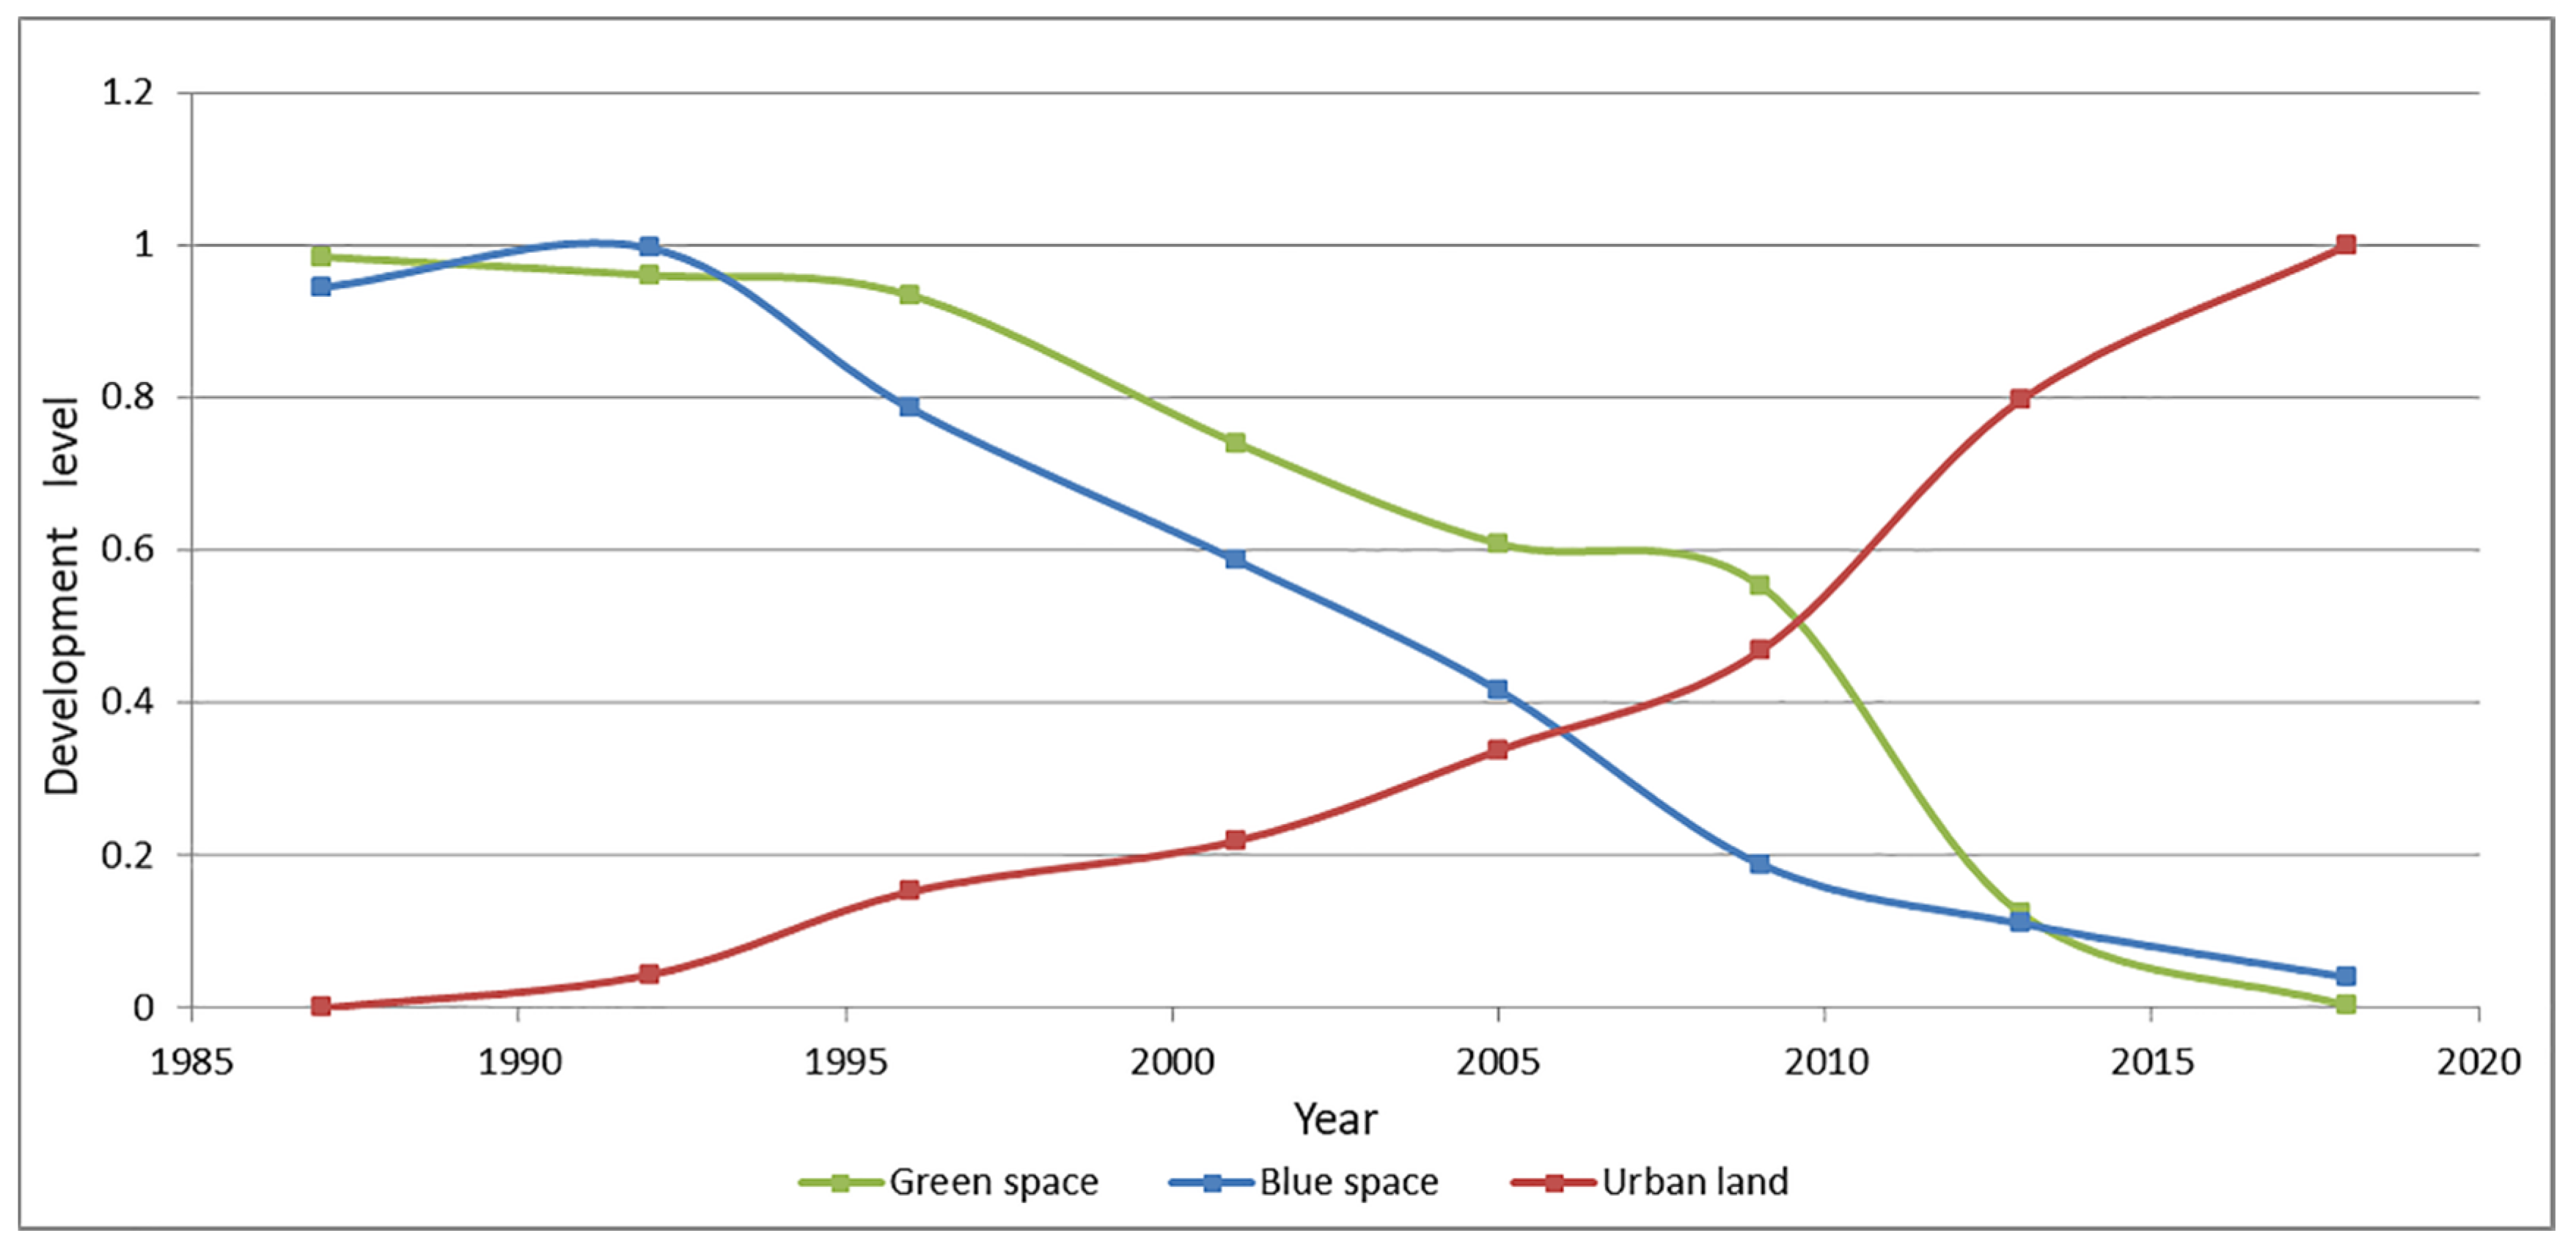
After standardizing the evaluation indicators, using the above weights for weighted summation, we obtained the comprehensive development level measurement values of the blue-green space over the years. We used the standardized data of the urban built-up area to evaluate the level of urban expansion, as shown in Figure 10. The value is in the range of 0–1. The larger the value, the higher the level of system development.
The evolution of green space development can be divided into four stages: From 1987 to 1996, the development level of green space changed very little, mainly because the urban expansion was still very slow, and almost all indexes such as area, patch, shape, and degree of fragmentation fluctuated horizontally. From 1996 to 2009, the development level of green space declined slowly with the expansion of the city. The number and density of plaques increased slowly, but the average patch area decreased rapidly, and the shape index dropped significantly, indicating that the city was increasingly disturbed by urban construction and human activities. From 2009 to 2013, the rapid urban expansion led to the severe destruction of green space in a short period of time and a sharp decline in the development level. From 2013 to 2018, the decline rate of the development level of green space had slowed down significantly, but the urban expansion rate was still very fast, which to some extent indicates that the green space had been seriously damaged and had reached the point of no retreat.
The evolution of blue space development can be divided into three stages: from 1987 to 1992, blue space was not destroyed but slightly improved. The number, density, and average area of the plaques increased slightly, and the shape index increased significantly. Human activities did not affect the blue space. From 1992 to 2009, the blue space was continuously broken and the development level continued to decline. Its area, patch, shape, and other indexes all show a downward trend, but the decline rate was basically slowing down. This indicates that the blue space was damaged by urban construction activities and protected to an increasing extent. From 2009 to 2018, the development level of blue space slowed down significantly, which is greatly related to the completion of the demarcation of the lake water area control line in the city.
4.5.2. Coupling Results
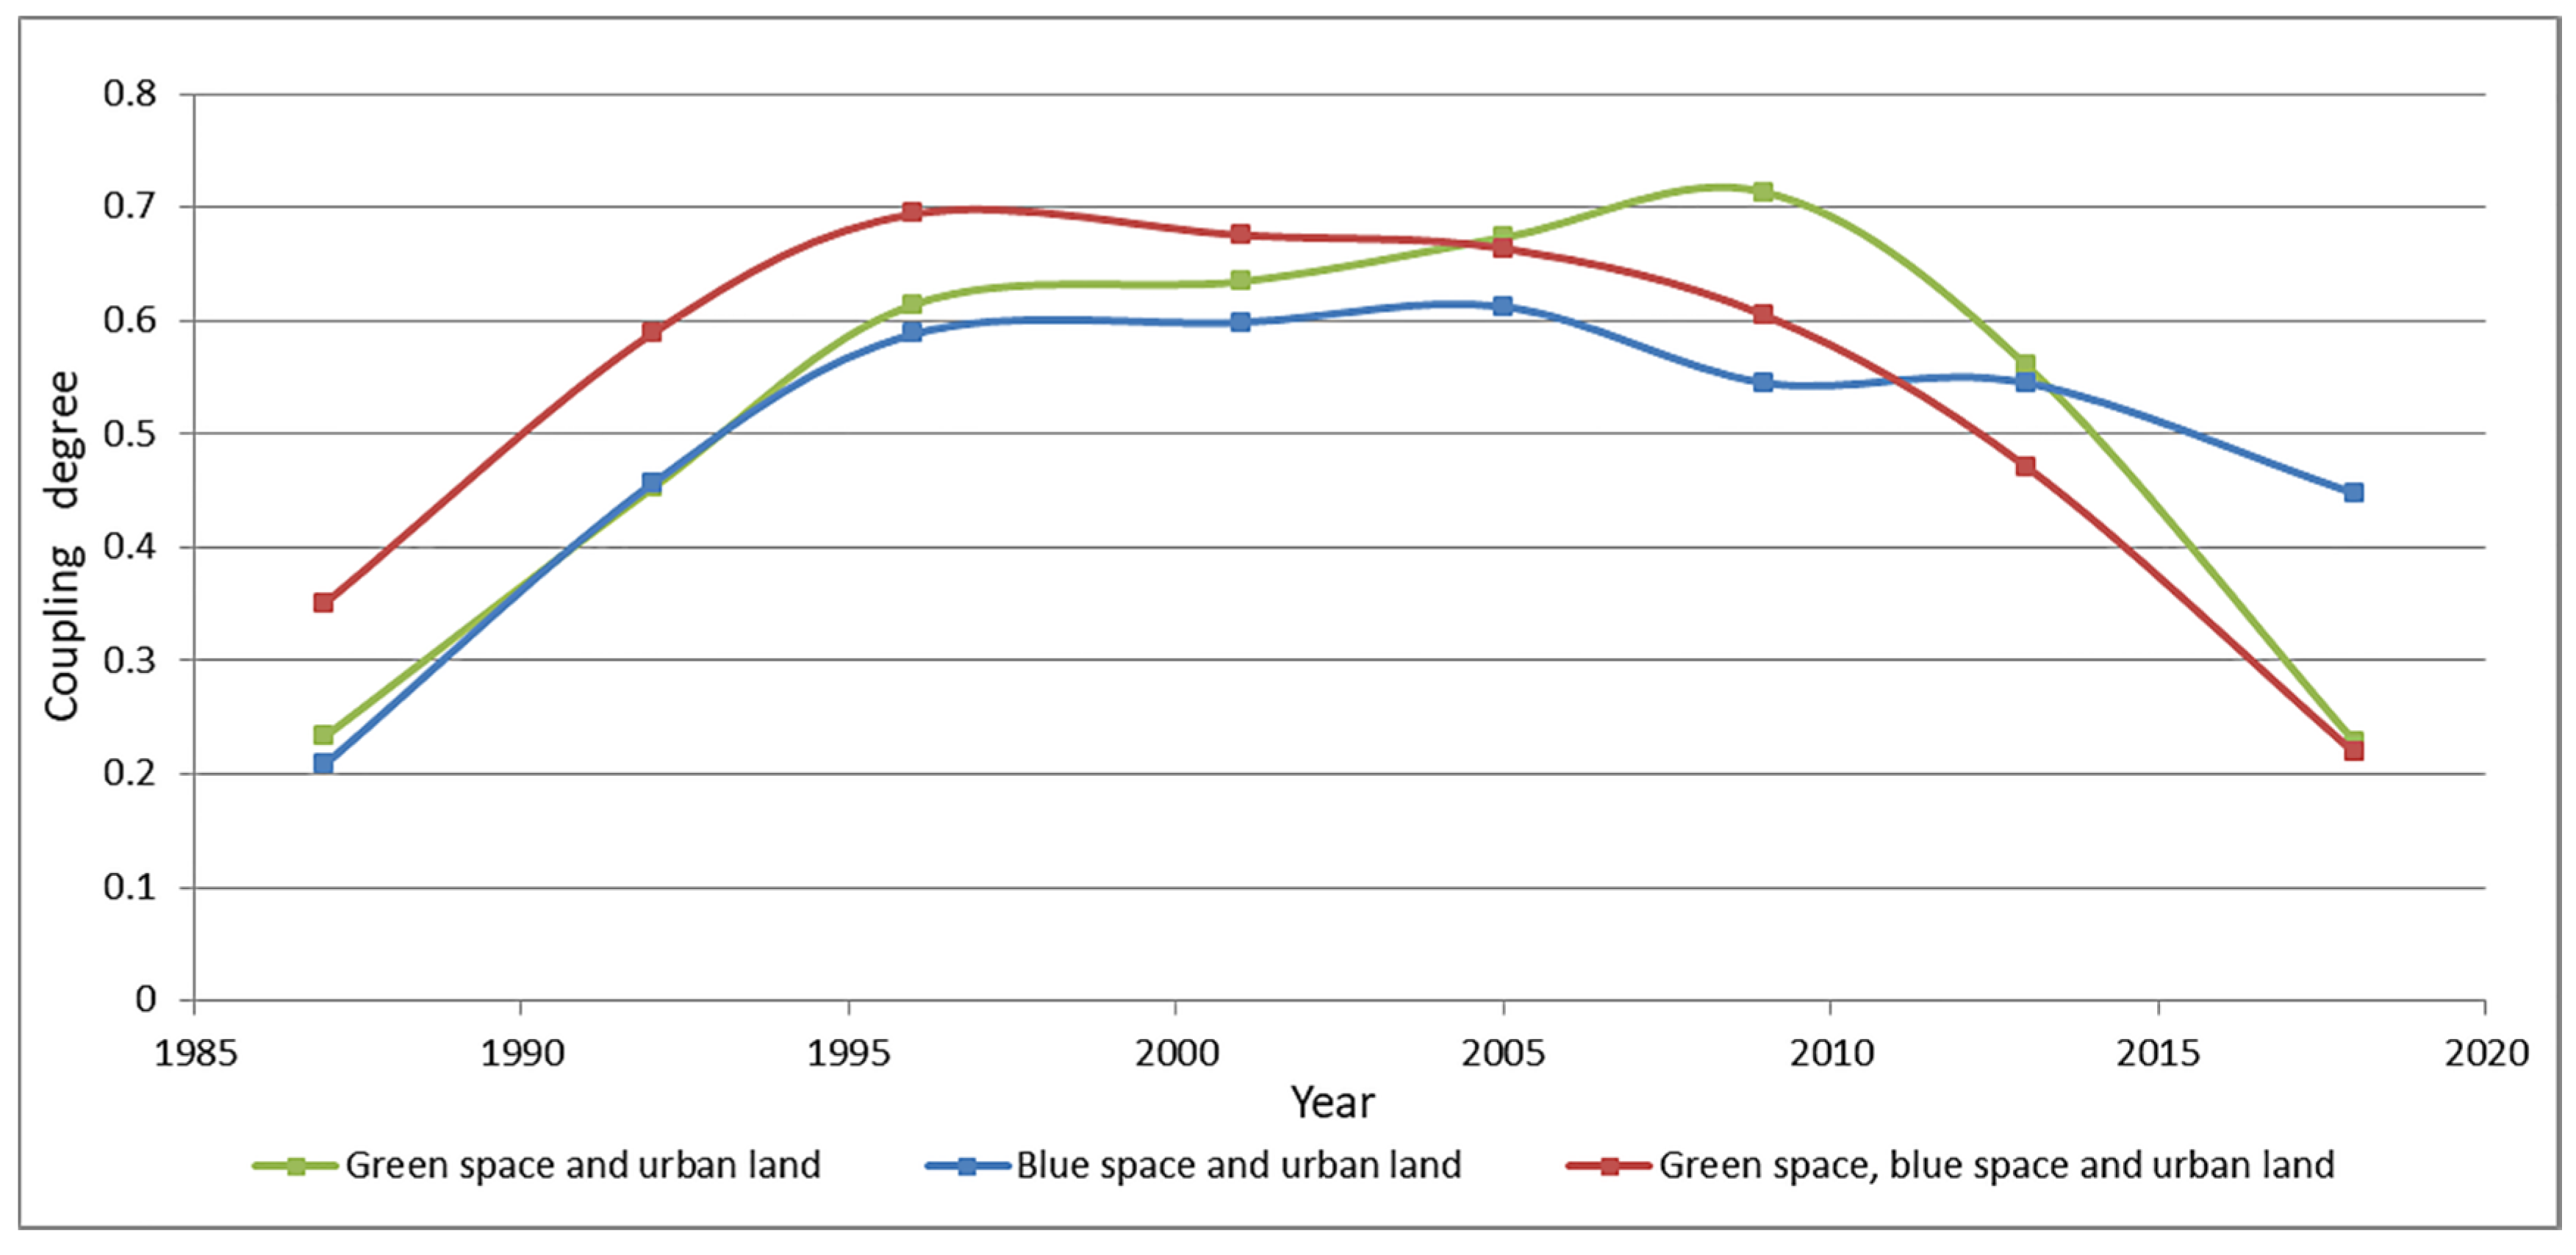
Using the blue-green space and the urban development area development level measurement values, the coupling analysis model was used to calculate the coupling changes of green space, blue space, and urban expansion (Figure 11), so as to quantitatively analyze the coordinated development level of the three. The results are as follows:
The change curve of coupling degree between green space and urban expansion in central Wuhan shows an inverted U-shape and turns to the left. In 1987, there was a moderate imbalance between the two, mainly because the urban built-up areas were too weak. Subsequently, the coupling degree of the two groups increased rapidly and gradually entered the primary coordination stage. After that, the two groups maintained at this level for a long time. In 2009 or so, the two groups entered the optimal development state and reached the intermediate coordination level. From then to 2018, the rapid expansion of the city seriously damaged the green space, and the coupling degree of the two entered a period of rapid decline, and finally entered a stage of moderate imbalance again.
The coupling between blue space and urban expansion in central Wuhan can be divided into three stages: from 1987 to 1996, the coupling increased rapidly and gradually reached the primary coordination level from the moderate imbalance level, and it remained at that level for as long as a decade; from 2005 to 2018, the coupling degree of the two entered a period of slow decline, and the development of blue space and built-up area in central Wuhan entered a stage of near imbalance.
The coupling curves of blue space, green space, and urban expansion in central Wuhan also show an inverted U-shape, but to the right. In 1987, the coupling degree of the three was slightly unbalanced. In the following ten years, the coupling degree of the three was rapidly improved. Finally, the three entered the primary stage of coordinated development and maintained this level for a long time. From 2009 to 2018, the rapid expansion of the city led to a rapid decline in the coupling degree of the three, and finally, to a stage of moderate imbalance.
5. Discussion and Conclusions
5.1. Discussion
5.1.1. Urban Built-Up Area
Urbanization and original ecological protection are a pair of contradictory relations. The birth of a city is at the cost of consuming or damaging forest green space, river and lake water, and the water ecological environment. The destruction and pollution of green space and lake are the result of the constant competition between urban blue and green space and urban development. In the 1990s, affected by the dual effects of market economy system reform and social and political system reform, Wuhan expanded rapidly outward, and the central city was fully urbanized, and gradually developed into a “ring + radiation” urban spatial structure. After 2000, Wuhan has vigorously promoted the integrated development of urban and rural areas. The suburban–urban integration area has become a hot area for planning. Various industrial parks and real estate development and construction have been successively developed, which have damaged the reserve land resources and excellent lake resources for urban development and caused the disordered expansion of built-up areas in suburban cities. In 2014, Wuhan began a new type of urbanization process, the urban pattern basically formed, and the speed of urban expansion began to slow down. Various urban development concepts, such as ecological cities and sponge cities, will be gradually introduced to make future urban development sustainable. At present, it is necessary to guide the rational development of cities through rational planning and layout, determine the boundaries of urban development, and focus on optimizing urban structure, rather than encouraging the continuous expansion of urban scale. In addition, the government can appropriately carry out the transformation of the old city, tap the potential of urban internal land storage space, and improve the efficiency of space utilization.
5.1.2. Urban Green Space
Regarding the protection of urban green space, Wuhan City proposed the construction goal of “Landscape Garden City” in 1997. To this end, the “Comprehensive Planning Outline for the Creation of a Landscape Garden City in Wuhan” was compiled and completed [65]. A systematic and comprehensive plan was developed for near-term construction actions for the construction of gardens and green spaces. Under the guidance of this plan, until around 2000, Wuhan’s riverside and lakeside greening construction achieved outstanding results, and a number of urban parks, street amusement parks, and urban road greening construction achieved significant results. The greening level in the main urban area significantly improved. In December 2003, Wuhan Urban Green Space System Planning (2003–2020) [66] was officially approved by the municipal government. The plan for the first time detailed layout of the green space system according to the three levels of the city area, urban planning area, and main urban area. In November 2011, the “two-line and three-zone” space management model was proposed. The model sets the growth boundary and ecological bottom line of the city, and proposed a centralized construction area, ecological development area, and ecological bottom line area. Wuhan completed the delineation of the basic ecological control line for the whole region in five years. Moreover, urban arable land has not been well received. More than half of the large amount of land occupied by urban expansion is cultivated land. From the existing land property rights system, the ambiguity of property rights is one of the biggest reasons for the poor protection of cultivated land in the rural–urban fringe. Farmers actually only have the right to use the land and income rights; they have no right to dispose of the land. Since the new century, the government has requisitioned a large amount of cultivated land for urban construction. In 2014, the delimitation of permanent basic farmland in Wuhan started. The adoption of strong policies to protect farmland also strengthened the constraint of urban development boundary. Although the urban green space has been protected to some extent, the situation is still not optimistic. In the future, we should give priority to the protection of large green space, take corresponding measures for different types of green space, combine the green space construction with the construction of urban regional environment, and plan in combination with the natural base of urban mountains and water systems, so as to promote the rational layout of green space system.
5.1.3. Urban Blue Space
For urban blue space, since the 1990s, due to the rapid development of urban society and economy, population density has increased, and the pressure on lakes has increased. Moreover, coupled with land acquisition and lake reclamation, arbitrary sewage discharge has aggravated the damage to the lakes’ ecological environment. Lakes in Wuhan are mostly shallow, and their ecological environment is fragile and vulnerable to external interference. Since the end of the last century, the Wuhan Municipal Government has carried out a series of pollution prevention and treatment work on lakes, and has achieved results. The Wuhan Lake Protection Regulations [67], which were enacted in 2001 and implemented in 2002, played an important role in mitigating the reduction of lake area in Wuhan. Since then, Wuhan has formulated more than 20 local regulations for the protection and management of lakes. In 2011, the Wuhan Municipal Water Resources Protection Regulations was promulgated and implemented [68]. In 2013, the city completed the planning of 166 lake water control lines, greening control lines, building control lines, and “three lines and one road” around the lake, and determined the control system for protecting water bodies in lakes. However, various departments and administrative regions continue to erode and destroy lakes. Illegal lake reclamation and sewage have not been effectively curbed. The water quality of many lakes continues to deteriorate, and the struggle between protection and governance and erosion and destruction has never stopped. In the future, the government should continue to strictly control the development and utilization of lakes and the surrounding areas, eliminate any form of lake filling, especially engineering construction and real estate development, and further carry out the unified regulation of lakes.
5.2. Conclusions
This paper analyzes the dynamic gradient change characteristics of the blue and green space and urban built-up area in central Wuhan. It found that the rapid expansion of urban built-up areas and the sharp decrease of blue and green space are the main characteristics of land use change in the central urban area of Wuhan in the past 30 years. Urban green space is becoming more and more fragmented, whereas for blue space is the opposite. The patch shapes of both are becoming more and more regular due to the interference of urban construction and human activities.
By analyzing the change of urban built-up area’s expansion intensity and its spatial effect on the blue-green space, it was found that the urban built-up area’s expansion from 1987 to 2009 was relatively slow, and the expansion rate obviously accelerated in recent ten years. On the one hand, the continuous expansion of cities gradually encroached on the green space, and marginalized and fragmented it; on the other hand, it constantly destroyed the urban blue space, making small lakes gradually disappear and large lakes become urban internal lakes. In addition, the urban lakes have obvious hindering effect on the expansion of built-up areas.
The coupling analysis model was used to quantitatively analyze the coordinated development level between the blue-green space and the urban built-up area in central Wuhan, and it found that the change curve of the coupling degree among the three presented an inverted U-shape. From a mild maladjustment stage gradually into the primary stage of coordinated development, and it maintained this level for a long time. The rapid expansion of the city in recent ten years has led to the rapid decline of the coupling degree of the three, and it has finally entered the stage of moderate imbalance.
This study reveals the development and evolution of the blue-green space and built-up area in central Wuhan, evaluates the interaction and coordinated development level of the three in the space, and provides a valuable reference for the protection of blue-green space in the process of urban development. However, our research still needs to be further improved with the development of future technologies, such as the improvement of remote sensing image accuracy and refinement of land classification. We will also continue to focus on the blue-green space in Wuhan and other cities in China, and study the characteristics of blue-green space changes in the context of urban development in the new era.
Author Contributions
Conceptualization, J.W.; Data curation, J.W., S.Y. and X.Z.; Formal analysis, S.Y. and X.Z.; Funding acquisition, J.W.; Methodology, J.W. and S.Y.; Resources, X.Z.; Software, S.Y.; Supervision, J.W.; Validation, S.Y.; Visualization, S.Y.; Writing—Original draft, S.Y. and X.Z.; Writing—Review & editing, J.W. All authors have read and agreed to the published version of the manuscript.
Funding
This research was funded by National Natural Science Foundation of China: 51808409; Natural Science Foundation of Hubei Province: 2019CFB477; Fundamental Research Funds for the Central Universities (Interdisciplinary Project): 2042019kf0211.
Conflicts of Interest
The authors declare no conflict of interest.
References
- Hashem, D.; Parviz, A.; Mahdis, M. Land use change, urbanization, and change in landscape pattern in a metropolitan area. Sci. Total Environ. 2019, 655, 707–719. [Google Scholar]
- Wu, Y.; He, X.S.; Yang, L. Compilation conception of special planning for blue and green space system at city and county level under the background of land space planning system. Landsc. Archit. 2020, 27, 30–34. [Google Scholar]
- Song, P.; Kim, G.; Mayer, A.; He, R.; Tian, G. Assessing the Ecosystem Services of Various Types of Urban Green Spaces Based on i-Tree Eco. Sustainability 2020, 12, 1630. [Google Scholar] [CrossRef] [Green Version]
- Yuliani, S.; Hardiman, G.; Setyowati, E. Green-Roof: The Role of Community in the Substitution of Green-Space toward Sustainable Development. Sustainability 2020, 12, 1429. [Google Scholar] [CrossRef] [Green Version]
- Schüle, S.A.; Hilz, L.K.; Dreger, S.; Bolte, G. Social Inequalities in Environmental Resources of Green and Blue Spaces: A Review of Evidence in the WHO European Region. Int. J. Environ. Res. Public Health 2019, 16, 1216. [Google Scholar] [CrossRef] [PubMed] [Green Version]
- Vaeztavakoli, A.; Lak, A.; Yigitcanlar, T. Blue and Green Spaces as Therapeutic Landscapes: Health Effects of Urban Water Canal Areas of Isfahan. Sustainability 2018, 10, 4010. [Google Scholar] [CrossRef] [Green Version]
- Caplat, P.; Lepart, J.; Marty, P. Landscape patterns and agriculture: Modelling the long-term effects of human practices on Pinus sylvestris spatial dynamics (Causse Mejean, France). Landsc. Ecol. 2006, 21, 657–670. [Google Scholar] [CrossRef]
- Geri, F.; Amici, V.; Rocchini, D. Human activity impact on the heterogeneity of Mediterranean landscape. Appl. Geogr. 2010, 30, 370–379. [Google Scholar] [CrossRef]
- Zhang, Q. Research on strategies of urban “blue and green” space construction from the perspective of green development concept—A case study of Wuhan [C]. Urban Ecol. Plan. 2019, 12, 1078–1090. [Google Scholar]
- Zhang, Q.; Su, S. Determinants of urban expansion and their relative importance: A comparative analysis of 30 major metropolitans in China. Habitat Int. 2016, 58, 89–107. [Google Scholar] [CrossRef]
- Wu, J.; Luo, J.M.; Tang, L. Coupling Relationship between Urban Expansion and Lake Change—A Case Study of Wuhan. Water 2019, 11, 1215. [Google Scholar] [CrossRef] [Green Version]
- Liu, H.; Ma, Y.; Liu, Q.; Song, Y. Decision-Making of Green Space Utilization and Protection in Urban Fringe Based on Biodiversity Trade-Off. Sustainability 2020, 12, 1373. [Google Scholar] [CrossRef] [Green Version]
- Liu, S.Q.; Yu, Q.; Chen, W. Spatial-Temporal Dynamic Analysis of Land Use and Landscape Pattern in Guangzhou, China: Exploring the Driving Forces from an Urban Sustainability Perspective. Sustainability 2019, 11, 6675. [Google Scholar] [CrossRef] [Green Version]
- He, J.; Wang, S.; Liu, Y. Examining the relationship between urbanization and the eco-environment using a coupling analysis: Case study of Shanghai, China. Ecol. Indic. 2017, 77, 185–193. [Google Scholar] [CrossRef]
- Xu, M.; He, C.Y.; Liu, Z.F.; Dou, Y.Y. How Did Urban Land Expand in China between 1992 and 2015? A Multi-Scale Landscape Analysis. PLoS ONE 2016, 11, e0154839. [Google Scholar] [CrossRef] [Green Version]
- Feng, Y.; Liu, Y.; Tong, X. Spatiotemporal variation of landscape patterns and their spatial determinants in Shanghai, China. Ecol. Indic. 2018, 87, 22–32. [Google Scholar] [CrossRef]
- Zhang, C.; Zhong, S.; Wang, X.; Shen, L.; Liu, L.; Liu, Y. Land Use Change in Coastal Cities during the Rapid Urbanization Period from 1990 to 2016: A Case Study in Ningbo City, China. Sustainability 2019, 11, 2122. [Google Scholar] [CrossRef] [Green Version]
- Wu, L.N.; Yang, S.T.; Liu, X.Y.; Luo, Y.; Zhou, X.; Zhao, H. Response of land use change to human activities in Beiluo River Basin since 1976. Acta Geogr. Sin. 2014, 69, 54–63. [Google Scholar]
- Su, S.; Xiao, R.; Jiang, Z.; Zhang, Y. Characterizing landscape pattern and ecosystem service value changes for urbanization impacts at an eco-regional scale. Appl. Geogr. 2012, 34, 295–305. [Google Scholar] [CrossRef]
- Hui, C.; Jian, L.; Chen, J.L.; Gao, J.; Wang, G.; Zhang, W. Spatiotemporal Patterns of Urban Land Use Change in Typical Cities in the Greater Mekong Subregion (GMS). Remote Sens. 2019, 11, 801. [Google Scholar]
- Mottet, A.; Ladet, S.; Coque, N.; Gibon, A. Agricultural land-use change and its drivers in mountain landscapes: A case study in the Pyrenees. Agric. Ecosyst. Environ. 2006, 114, 296–310. [Google Scholar] [CrossRef]
- Liu, J.Y.; Zhang, Z.X.; Xu, X.L.; Kuang, W.X.; Zhou, W.C. Analysis of spatial pattern and driving force of land use change in China in the early 21st century. J. Geogr. 2009, 64, 1411–1420. [Google Scholar]
- Mundia, C.N.; Aniya, M. Dynamics of land use/cover changes and degradation of Nairobi City, Kenya. Land Degrad. Dev. 2010, 17, 97–108. [Google Scholar] [CrossRef]
- Hamad, R.; Balzter, H.; Kolo, K. Predicting Land Use/Land Cover Changes Using a CA-Markov Model under Two Different Scenarios. Sustainability 2018, 10, 3421. [Google Scholar] [CrossRef] [Green Version]
- Twisa, S.; Kazumba, S.; Kurian, M.; Buchroithner, M.F. Evaluating and Predicting the Effects of Land Use Changes on Hydrology in Wami River Basin, Tanzania. Hydrology 2020, 7, 17. [Google Scholar] [CrossRef] [Green Version]
- Wang, Y.L.; Feng, J.M.; Gao, H. Numerical simulation of the impact of land cover change on regional climate in China. Theor. Appl. Climatol. 2014, 115, 141–152. [Google Scholar] [CrossRef]
- Yang, J.M.; Li, S.M.; Lu, H.C. Quantitative Influence of Land-Use Changes and Urban Expansion Intensity on Landscape Pattern in Qingdao, China: Implications for Urban Sustainability. Sustainability 2019, 11, 6174. [Google Scholar] [CrossRef] [Green Version]
- Zhang, W.; Tan, G.; Zheng, S.; Sun, C.; Kong, X.; Liu, Z. Land Cover Change Detection in Urban Lake Areas Using Multi-Temporary Very High Spatial Resolution Aerial Images. Water 2018, 10, 1. [Google Scholar] [CrossRef] [Green Version]
- O’Neill, R.V.; KrummelR, J.R.; Gardner, H.; Sugihara, G.; Jackson, B.; DeAngelis, D.L.; Milne, B.T.; Turner, M.G.; Zygmunt, B.; Christensen, S.W.; et al. Indices of landscape pattern. Landsc. Ecol. 1988, 1, 153–162. [Google Scholar] [CrossRef]
- Matsushita, B.; Xu, M.; Fukushima, T. Characterizing the changes in landscape structure in the Lake Kasumigaura Basin, Japan using a high-quality GIS dataset. Landsc. Urban Plan. 2006, 78, 241–250. [Google Scholar] [CrossRef]
- Weng, Y.C. Spatiotemporal changes of landscape pattern in response to urbanization. Landsc. Urban Plan. 2007, 81, 341–353. [Google Scholar] [CrossRef]
- Jiao, M.; Hu, M.; Xia, B. Spatiotemporal dynamic simulation of land-use and landscape-pattern in the Pearl River Delta, China. Sustain. Cities Soc. 2019, 49, 101581. [Google Scholar] [CrossRef]
- Hassan, M.M. Monitoring land use/land cover change, urban growth dynamics and landscape pattern analysis in five fastest urbanized cities in Bangladesh. Remote Sens. Appl. Soc. Environ. 2017, 7, 69–83. [Google Scholar] [CrossRef]
- Nana, L.; Chuanzhe, L.; Yufei, X. Examining the coordination between urbanization and eco-environment using coupling and spatial analyses: A case study in China. Ecol. Indic. 2018, 93, 1163–1175. [Google Scholar]
- Yu, S.; Yin, C.; Huixia, H. An empirical analysis of the coupling coordination among decomposed effects of urban infrastructure environment benefit: Case study of four Chinese autonomous municipalities. Math. Probl. Eng. 2016, 2016, 1–11. [Google Scholar]
- Gan, J.; Yang, w.g.; Wang, L. Spatial characteristics of urban green space under different health influence pathways. Landsc. Archit. 2020, 27, 95–100. [Google Scholar]
- Tan, C.D.; Tang, Y.H.; Wu, X.F. Evaluation of the Equity of Urban Park Green Space Based on Population Data Spatialization: A Case Study of a Central Area of Wuhan, China. Sensors 2019, 19, 2929. [Google Scholar] [CrossRef] [Green Version]
- Wu, J.; Yang, S.; Zhang, X. Evaluation of the Fairness of Urban Lakes’ Distribution Based on Spatialization of Population Data: A Case Study of Wuhan Urban Development Zone. Int. J. Environ. Res. Public Health 2019, 16, 4994. [Google Scholar] [CrossRef] [Green Version]
- Bai, T.; Mayer, A.L.; Shuster, W.D.; Tian, G. The Hydrologic Role of Urban Green Space in Mitigating Flooding (Luohe, China). Sustainability 2018, 10, 3584. [Google Scholar] [CrossRef] [Green Version]
- Kim, H.; Lee, D.K.; Sung, S. Effect of Urban Green Spaces and Flooded Area Type on Flooding Probability. Sustainability 2016, 8, 134. [Google Scholar] [CrossRef] [Green Version]
- Huang, X.L.; Chen, N.; Ye, W.T.; Zhang, M.M. Analysis of urban green space landscape pattern of xiamen island based on ALOS data. Geospat. Inf. 2020, 18, 86–89. [Google Scholar]
- Han, Y.W.; Li, Y.N.; Li, F.Z. Research on the influence of urban green landscape pattern on the quality of “core habitat”. Landsc. Archit. 2020, 27, 83–87. [Google Scholar]
- Cao, Y.Q.; Chen, Z.H.; Huang, G.L.; Chen, L.Y.; Jiang, Y.Q.; Zhang, Z.K.; Tu, X.Y.; Hua, Y.Y. Research progress on relationship between urban green space pattern and residents’ social and economic characteristics. J. Appl. Ecol. 2019, 30, 3303–3315. [Google Scholar]
- Li, Y.; Zhao, K.; Fang, J.Y.; Xie, P. Land use change in urban lake areas: A case study of East Lake in Wuhan. Resour. Environ. Yangtze River Basin 2004, 3, 229–233. [Google Scholar]
- Cheng, J.; Masser, I. Urban growth pattern modeling: A case study of Wuhan city, China. Landsc. Urban Plan. 2003, 12, 1231–1242. [Google Scholar] [CrossRef]
- Alejandro, C.S.; Jorge, L.B. Delineation of suitable areas for crops using a multi-criteria evaluation approach and land use/cover mapping: A case study in Central Mexico. Agric. Syst. 2003, 77, 117–136. [Google Scholar]
- Mcfeeters, S.K. The use of normalized difference water index (NDWI) in the delineation of open water features. Int. J. Remote Sens. 2005, 9, 589–595. [Google Scholar] [CrossRef]
- Xu, H.Q. Extraction of water information by improved normalized differential water index (MNDWI). J. Remote Sens. 2005, 9, 590–595. [Google Scholar]
- Chen, Z.Q.; Chen, J.F. Analysis and mapping of urban land image based on NDBI index. Geogr. Inf. Sci. 2006, 8, 137–140. [Google Scholar]
- Xu, H. Analysis of impervious surface and its impact on urban heat environment using the normalized difference impervious surface index (NDISI). Photogramm. Eng. Remote Sens. 2010, 76, 557–565. [Google Scholar] [CrossRef]
- He, L.H.; Tan, W.; Xu, X. Precision Comparison of different classification methods in land use information Extraction. Mod. Surv. Mapp. 2016, 41, 26–30. [Google Scholar]
- Cabral, A.I.R.; Costa, F.L. Land cover changes and landscape pattern dynamics in Senegal and Guinea Bissau borderland. Appl. Geogr. 2017, 82, 115–128. [Google Scholar] [CrossRef]
- Xu, X.; Min, X. Quantifying spatiotemporal patterns of urban expansion in China using remote sensing data. Cities 2013, 35, 104–113. [Google Scholar] [CrossRef]
- Li, S.; Liu, X.; Li, Z.; Wu, Z.; Yan, Z.; Chen, Y.; Gao, F. Spatial and Temporal Dynamics of Urban Expansion along the Guangzhou–Foshan Inter-City Rail Transit Corridor, China. Sustainability 2018, 10, 593. [Google Scholar] [CrossRef] [Green Version]
- Seto, K.C.; Fragkias, M.; Güneralp, B.; Reilly, M.K. A meta-analysis of global urban land expansion. PLoS ONE 2011, 6, e23777. [Google Scholar] [CrossRef]
- Xu, J.; Liao, B.; Shen, Q.; Zhang, F.; Mei, A. Urban spatial restructuring in transitional economy—Changing land use pattern in Shanghai. Chin. Geogr. Sci. 2007, 17, 19–27. [Google Scholar] [CrossRef] [Green Version]
- Chen, J.; Gao, J.; Chen, W. Urban land expansion and the transitional mechanisms in Nanjing, China. Habit. Int. 2016, 53, 274–283. [Google Scholar] [CrossRef]
- Cao, H.; Liu, J.; Fu, C.; Zhang, W.; Wang, G.; Yang, G.; Luo, L. Urban Expansion and Its Impact on the Land Use Pattern in Xishuangbanna since the Reform and Opening up of China. Remote Sens. 2017, 9, 137. [Google Scholar] [CrossRef] [Green Version]
- Hugh, S.; Mark, S.F. Homelessness and Open City Data: Addressing a Global Challenge. Open Cities Open Data 2019, 9, 29–55. [Google Scholar]
- Meng, D.; Shen, S.; Lu, Y. Coupling of county transportation superiority and regional economic space in central plains economic zone. Econ. Geogr. 2012, 32, 7–14. [Google Scholar]
- Liu, X.; Liang, X.; Li, X. A future land use simulation model (FLUS) for simulating multiple land use scenarios by coupling human and natural effects. Landsc. Urban Plan. 2017, 168, 94–116. [Google Scholar] [CrossRef]
- Zhang, L.; Peng, J.; Liu, Y. Coupling ecosystem services supply and human ecological demand to identify landscape ecological security pattern: A case study in Beijing–Tianjin–Hebei region, China. Urban Ecosyst. 2016, 20, 1–14. [Google Scholar] [CrossRef]
- Huang, M. Analysis of spatial-temporal characteristics of urbanization and socio-economic coupling and coordinated development degree—A case study of anhui province. Econ. Geogr. 2012, 32, 77–81. [Google Scholar]
- Liao, Z. Quantitative evaluation of coordinated development of environment and economy and its classification system—A case study of urban agglomeration in pearl river delta. Trop. Geogr. 1999, 19, 171–177. [Google Scholar]
- Liu, J. 70-year planning process of landscape and ecological space in Wuhan. Urban Rural Plan. 2019, 5, 94–102. [Google Scholar]
- Liu, H.; Yang, Z.; Zuo, H. Discussion on lake protection and management in Wuhan. Shandong Chem. Ind. 2008, 47, 149–150. [Google Scholar]
- Zhong, H. Study on the model of public participation in lakes protection in Wuhan, China—An Example of “Love Our 100 Lakes” Volunteer Action. Adv. Environ. Prot. 2018, 8, 1–12. [Google Scholar]
- Zhao, S.; Zhou, D.; Zhu, C. The pace and pattern of urban expansion in China’s 32 major cities over the past three decades. Landsc. Ecol. 2015, 30, 1541–1559. [Google Scholar] [CrossRef]
Figure 1.
Geographical location of the study area: (a) the location of Wuhan and (b) the location of Wuhan central city.
Figure 1.
Geographical location of the study area: (a) the location of Wuhan and (b) the location of Wuhan central city.

Figure 2.
1987–2018 land use map of Wuhan central city: (a) 1987, (b) 1992, (c) 1996, (d) 2001, (e) 2005, (f) 2009, (g) 2013, and (h) 2018.
Figure 2.
1987–2018 land use map of Wuhan central city: (a) 1987, (b) 1992, (c) 1996, (d) 2001, (e) 2005, (f) 2009, (g) 2013, and (h) 2018.

Figure 3.
1987–2018 area statistics of each land use type in Wuhan central city.

Figure 4.
Spatial distribution of land use transfer results of Wuhan central city in different periods: (a) 1987–1996, (b) 1996–2009, (c) 2009–2018, and (d) 1987–2018.
Figure 4.
Spatial distribution of land use transfer results of Wuhan central city in different periods: (a) 1987–1996, (b) 1996–2009, (c) 2009–2018, and (d) 1987–2018.

Figure 5.
Land use transfer matrix of Wuhan central city in different periods: (a) 1987–1996, (b) 1996–2009, (c) 2009–2018, and (d) 1987–2018.
Figure 5.
Land use transfer matrix of Wuhan central city in different periods: (a) 1987–1996, (b) 1996–2009, (c) 2009–2018, and (d) 1987–2018.

Figure 6.
1987–2018 landscape pattern index of green space in Wuhan central city.

Figure 7.
1987–2018 landscape pattern index of blue space in Wuhan central city.

Figure 8.
(a) Expansion direction of the built-up area in Wuhan central city; (b) Expansion intensity of the built-up area in Wuhan central city.
Figure 8.
(a) Expansion direction of the built-up area in Wuhan central city; (b) Expansion intensity of the built-up area in Wuhan central city.

Figure 9.
1987–2018 gradient pattern of Wuhan central city: (a) 1987, (b) 1992, (c) 1996, (d) 2001, (e) 2005, (f) 2009, (g) 2013, and (h) 2018.
Figure 9.
1987–2018 gradient pattern of Wuhan central city: (a) 1987, (b) 1992, (c) 1996, (d) 2001, (e) 2005, (f) 2009, (g) 2013, and (h) 2018.

Figure 10.
1987–2018 development trend of blue-green space and urban land in Wuhan central city.

Figure 11.
1987–2018 change trend of coupling degree between blue-green space and urban expansion system in Wuhan central city.
Figure 11.
1987–2018 change trend of coupling degree between blue-green space and urban expansion system in Wuhan central city.


Table 1.
Administrative divisions of the central and peripheral districts of Wuhan in 2019.
| Region | Name | Area (km2) | Permanent Residents | Household Registration Population |
|---|---|---|---|---|
| Central city | Jiang’an District | 64.24 | 895,635 | 659,192 |
| Jianghan District | 33.43 | 683,492 | 468,497 | |
| Tongkou District | 46.39 | 828,644 | 536,411 | |
| Hanyang District | 108.34 | 584,077 | 511,168 | |
| Wuchang District | 87.42 | 1,199,127 | 1,136,551 | |
| Hongshan District | 480.20 | 1,049,434 | 851,264 | |
| Qingshan District | 85.5 | 485,375 | 452,870 | |
| Peripheral city | Dongxihu District | 439.19 | 451,880 | 261,408 |
| Hannan District | 287.70 | 114,970 | 107,052 | |
| Caidian District | 1108.10 | 410,888 | 472,130 | |
| Jiangxia District | 2010.00 | 644,835 | 721,435 | |
| Huangpi District | 2261.00 | 874,938 | 1,118,474 | |
| Xinzhou District | 1500.00 | 848,760 | 985,685 | |
| Total | Wuhan | 8494.41 | 9,785,392 | 8,282,137 |
Table 2.
The remote sensing image data.
| Satellite | Sensor | Resolution | Data Identification | Date | Cloudiness |
|---|---|---|---|---|---|
| Landsat 5 | TM | 30 M | LT51230391987253BJC00 | 1987/9/10 | No |
| LT51230391992299BJC00 | 1992/10/25 | No | |||
| LT51230391996278CLT00 | 1996/9/2 | No | |||
| LT51230392001067BJC00 | 2001/916 | No | |||
| LT51230392005110BJC00 | 2005/9/11 | No | |||
| LT51230392009249BJC00 | 2009/9/6 | No | |||
| Landsat 8 | OLI | 30/15 M | LC81230392013260LGN01 | 2013/9/17 | No |
| LC81230392018098LGN0 | 2018/4/8 | No |
Table 3.
Coordination level classification criteria.
| Accidentally and Coordination Degree | Accidentally and Coordination Degree Level | Accidentally and Coordination Degree | Accidentally and Coordination Degree Level |
|---|---|---|---|
| 0.0000–0.1 | Extreme disorder | 0.5001–0.6 | Barely coordination |
| 0.1001–0.2 | Severe disorder | 0.6001–0.7 | Primary coordination |
| 0.2001–0.3 | Moderate disorder | 0.7001–0.8 | Intermediate coordination |
| 0.3001–0.4 | Mild disorder | 0.8001–0.9 | Good coordination |
| 0.4001–0.5 | On the verge of disorder | 0.9001–1.0 | Excellent coordination |
Table 4.
Accuracy assessment results of land classification in Wuhan central city.
| Date Year | Overall Accuracy (%) | Kappa Coefficient |
|---|---|---|
| 1987 | 93.57 | 0.9249 |
| 1992 | 93.46 | 0.9215 |
| 1996 | 92.84 | 0.9172 |
| 2001 | 94.61 | 0.9354 |
| 2005 | 92.78 | 0.9227 |
| 2009 | 95.12 | 0.9463 |
| 2013 | 94.27 | 0.9375 |
| 2018 | 93.34 | 0.9283 |
Table 5.
Weight of each index in the blue-green spatial change system.
| System | Primary | Weight (%) | Secondary Indicators | Weight (%) |
|---|---|---|---|---|
| Green space | Change index | 73.01 | Area | 12.01 |
| Patch number | 10.95 | |||
| Area weighted average patch area | 19.49 | |||
| Area weighted shape index | 17.04 | |||
| Area weighted average fractal dimension | 13.52 | |||
| Fragmentation index | 26.99 | Patch density | 10.95 | |
| Edge density | 16.04 | |||
| Blue space | Change index | 59.41 | Area | 16.51 |
| Patch number | 15.20 | |||
| Area weighted average patch area | 9.36 | |||
| Area weighted shape index | 9.15 | |||
| Area weighted average fractal dimension | 9.19 | |||
| Fragmentation index | 40.59 | patch density | 15.22 | |
| Edge density | 25.37 |
© 2020 by the authors. Licensee MDPI, Basel, Switzerland. This article is an open access article distributed under the terms and conditions of the Creative Commons Attribution (CC BY) license (http://creativecommons.org/licenses/by/4.0/).
Share and Cite
MDPI and ACS Style
Wu, J.; Yang, S.; Zhang, X. Interaction Analysis of Urban Blue-Green Space and Built-Up Area Based on Coupling Model—A Case Study of Wuhan Central City. Water 2020, 12, 2185. https://doi.org/10.3390/w12082185
AMA Style
Wu J, Yang S, Zhang X. Interaction Analysis of Urban Blue-Green Space and Built-Up Area Based on Coupling Model—A Case Study of Wuhan Central City. Water. 2020; 12(8):2185. https://doi.org/10.3390/w12082185
Chicago/Turabian StyleWu, Jing, Shen Yang, and Xu Zhang. 2020. "Interaction Analysis of Urban Blue-Green Space and Built-Up Area Based on Coupling Model—A Case Study of Wuhan Central City" Water 12, no. 8: 2185. https://doi.org/10.3390/w12082185
Note that from the first issue of 2016, this journal uses article numbers instead of page numbers. See further details here.