Lower Cretaceous Rodby and Palaeocene Lista Shales: Characterisation and Comparison of Top-Seal Mudstones at Two Planned CCS Sites, Offshore UK

 , , , and
Abstract
:
1. Introduction
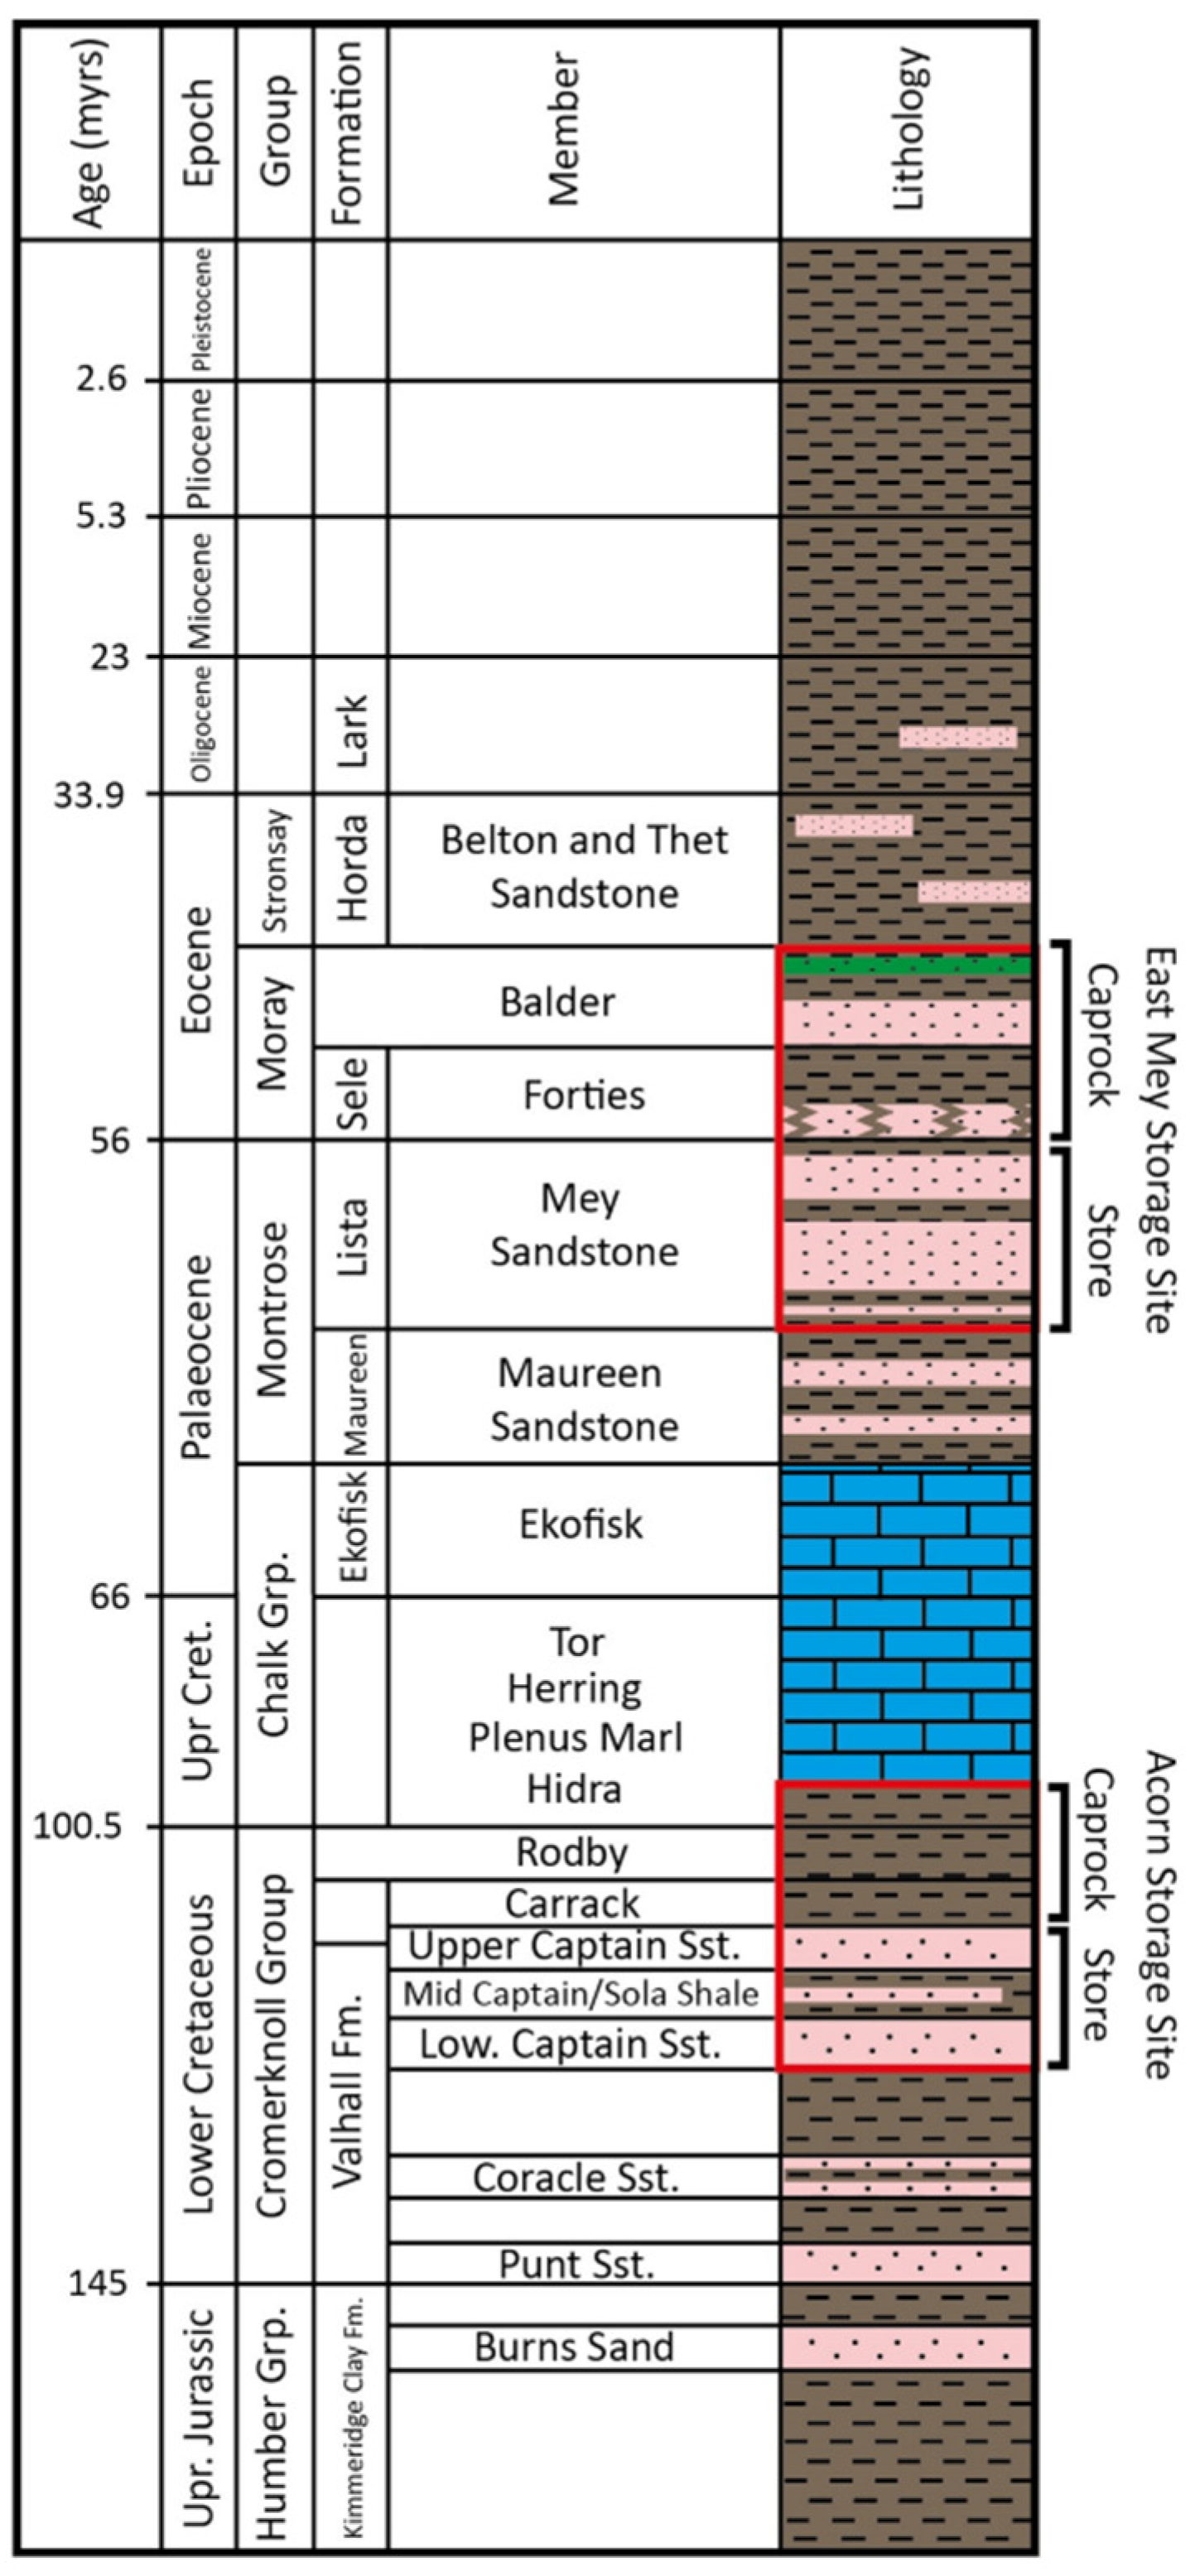
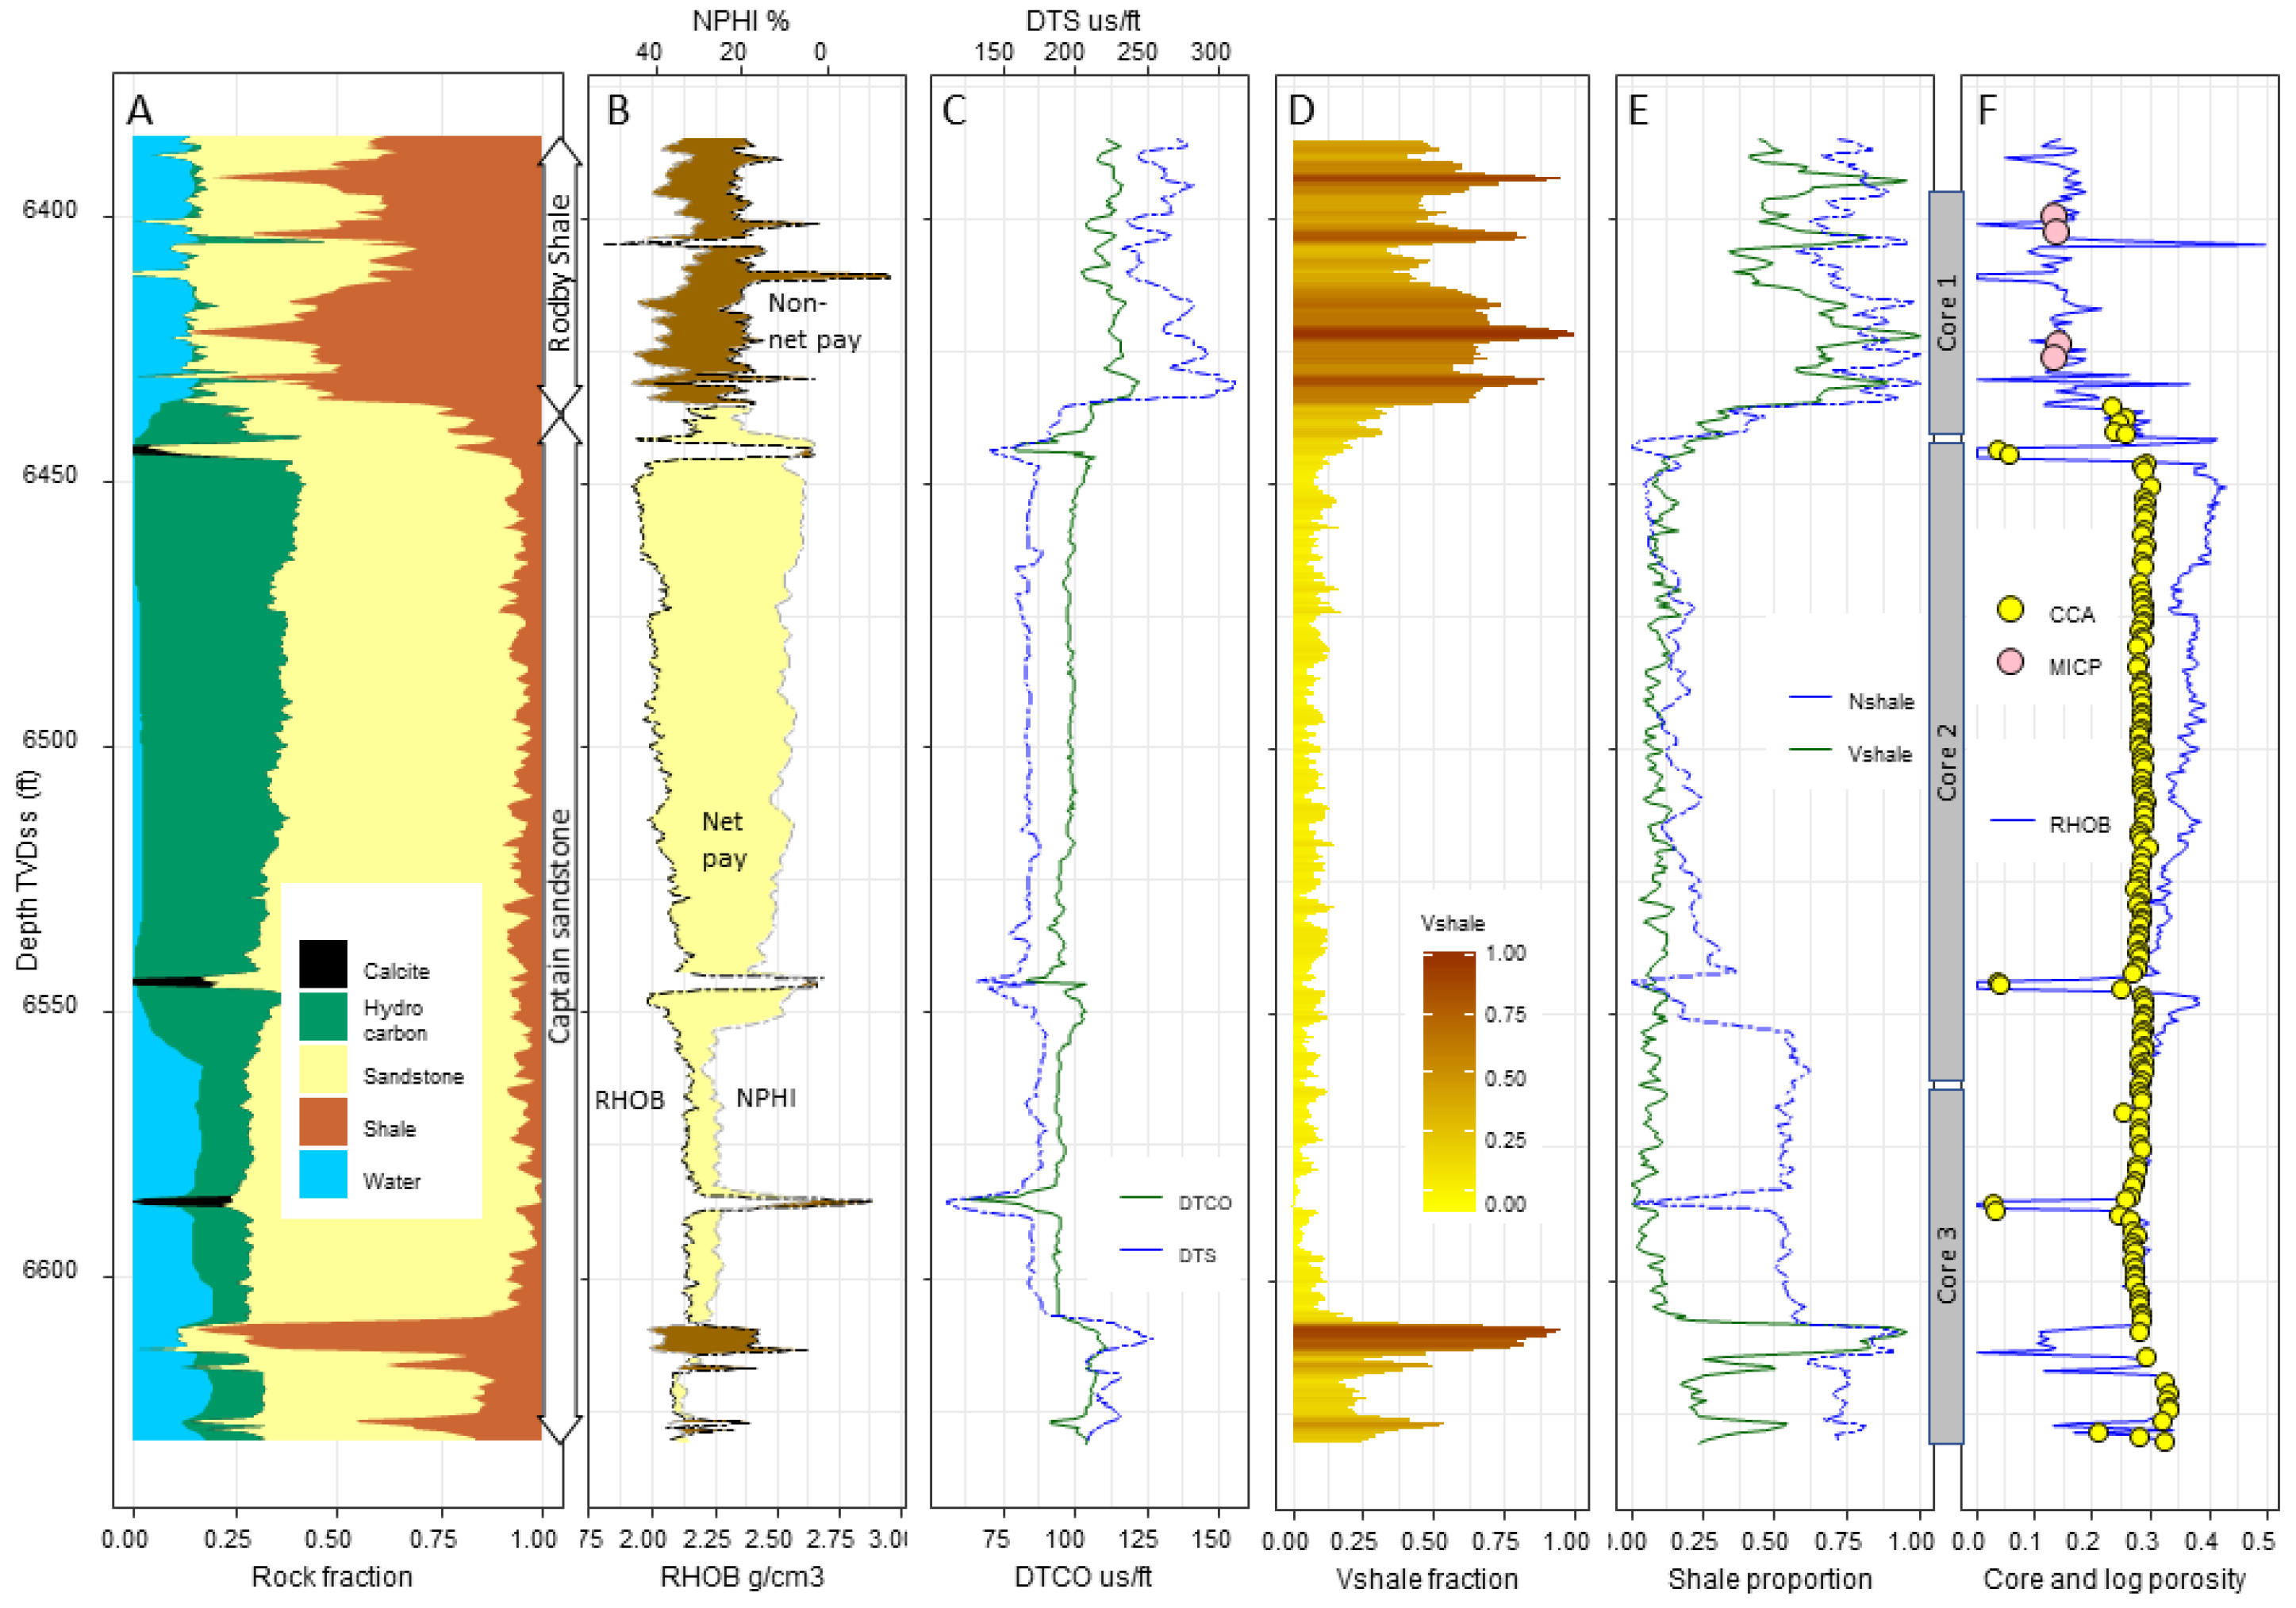
2. Background Geology
3. Methods
3.1. Samples and Data
3.2. Wireline Log Data
3.3. Petrography and Mineralogy
3.4. Mercury Intrusion Porosimetry
3.5. Splitting Tensile Strength
4. Results
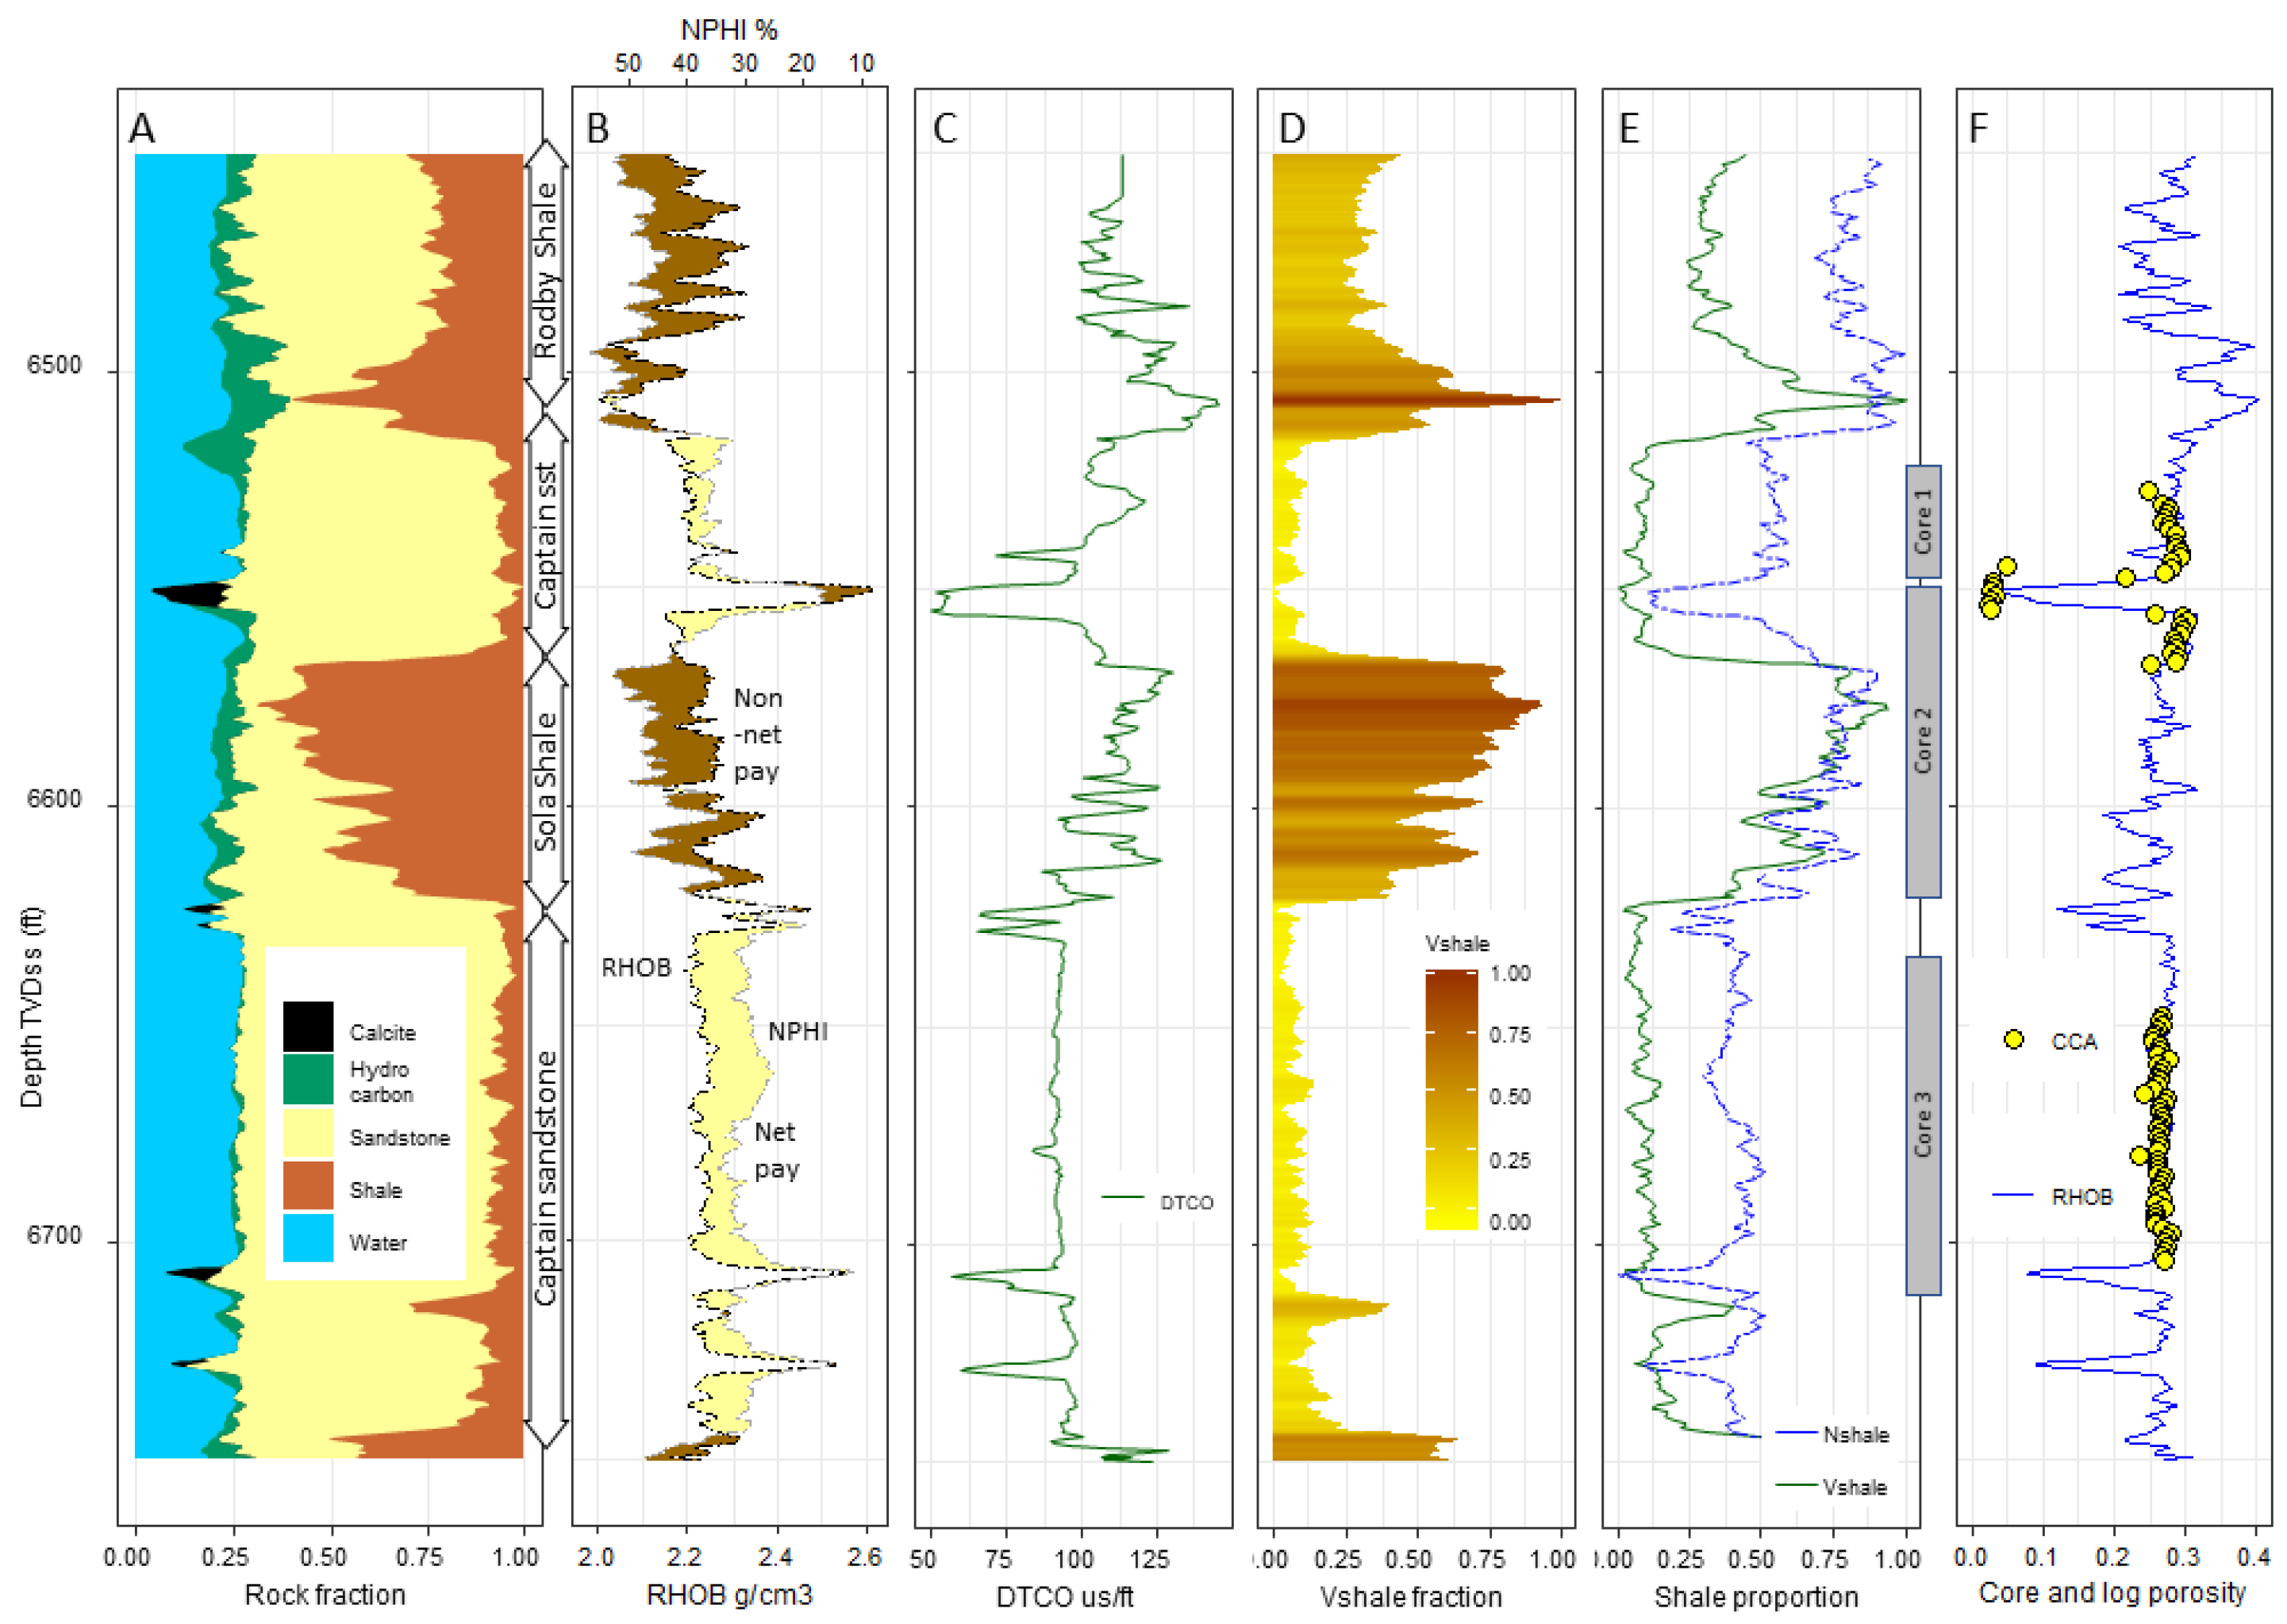
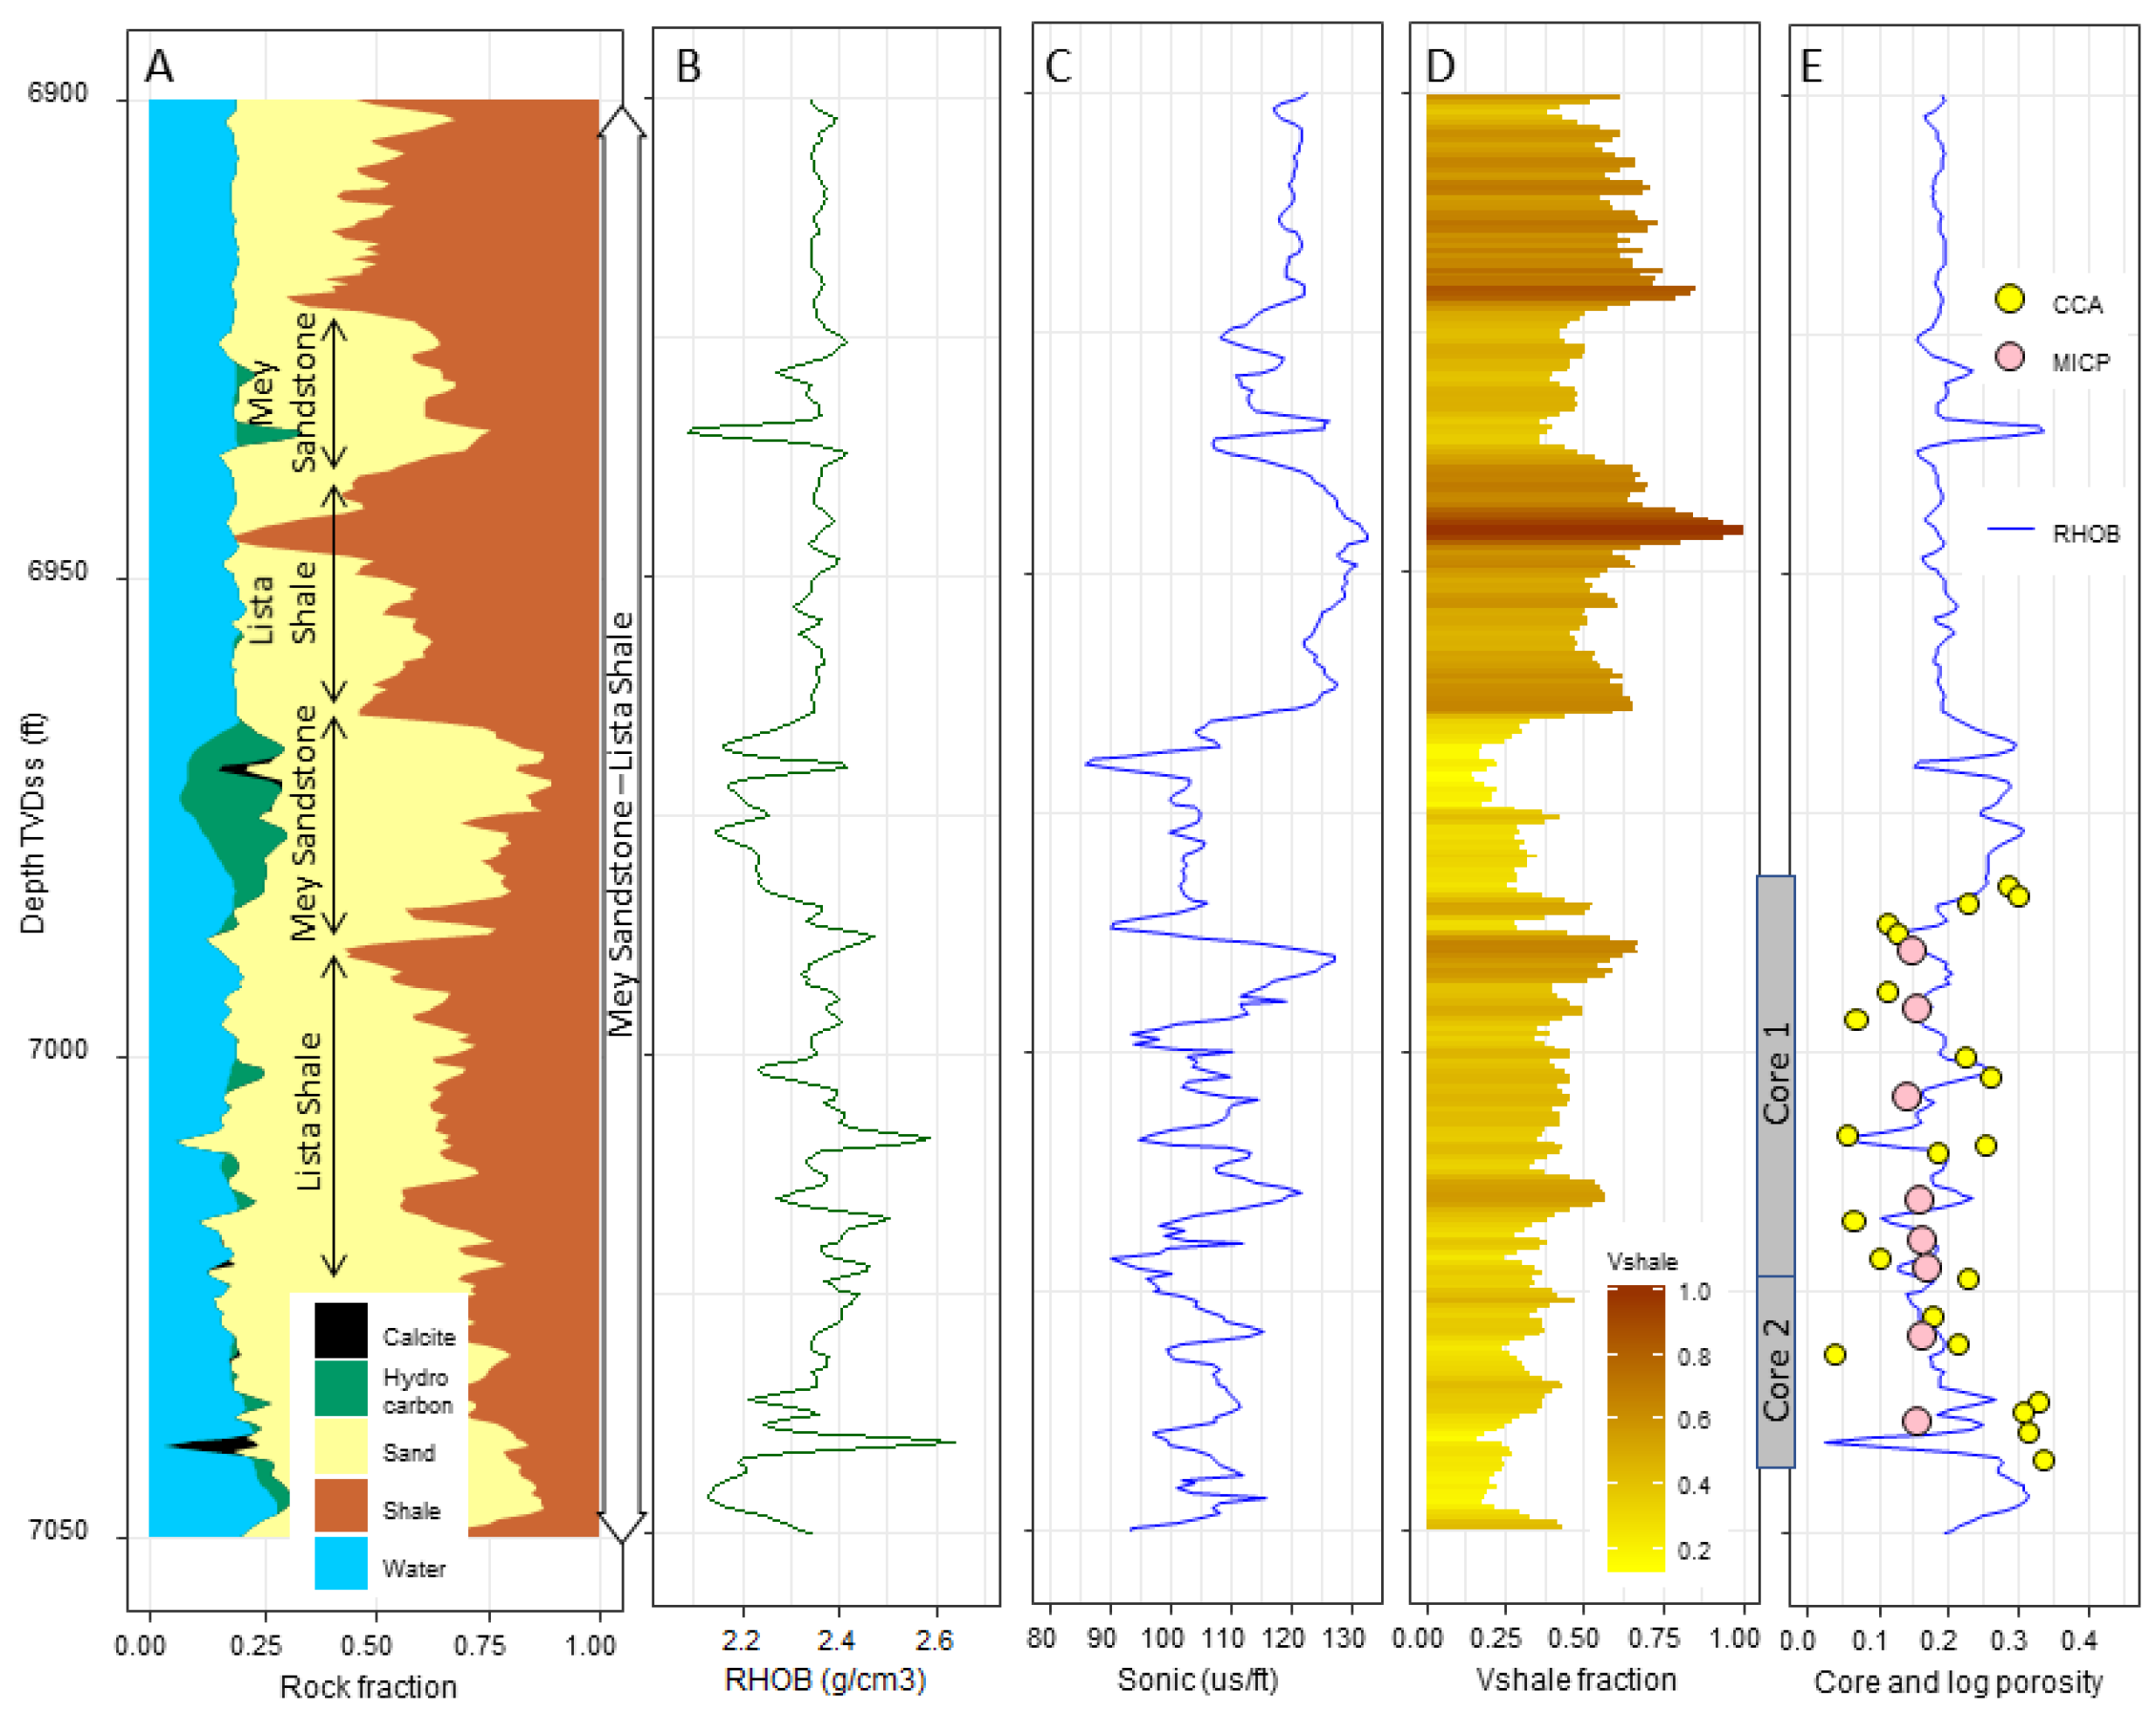
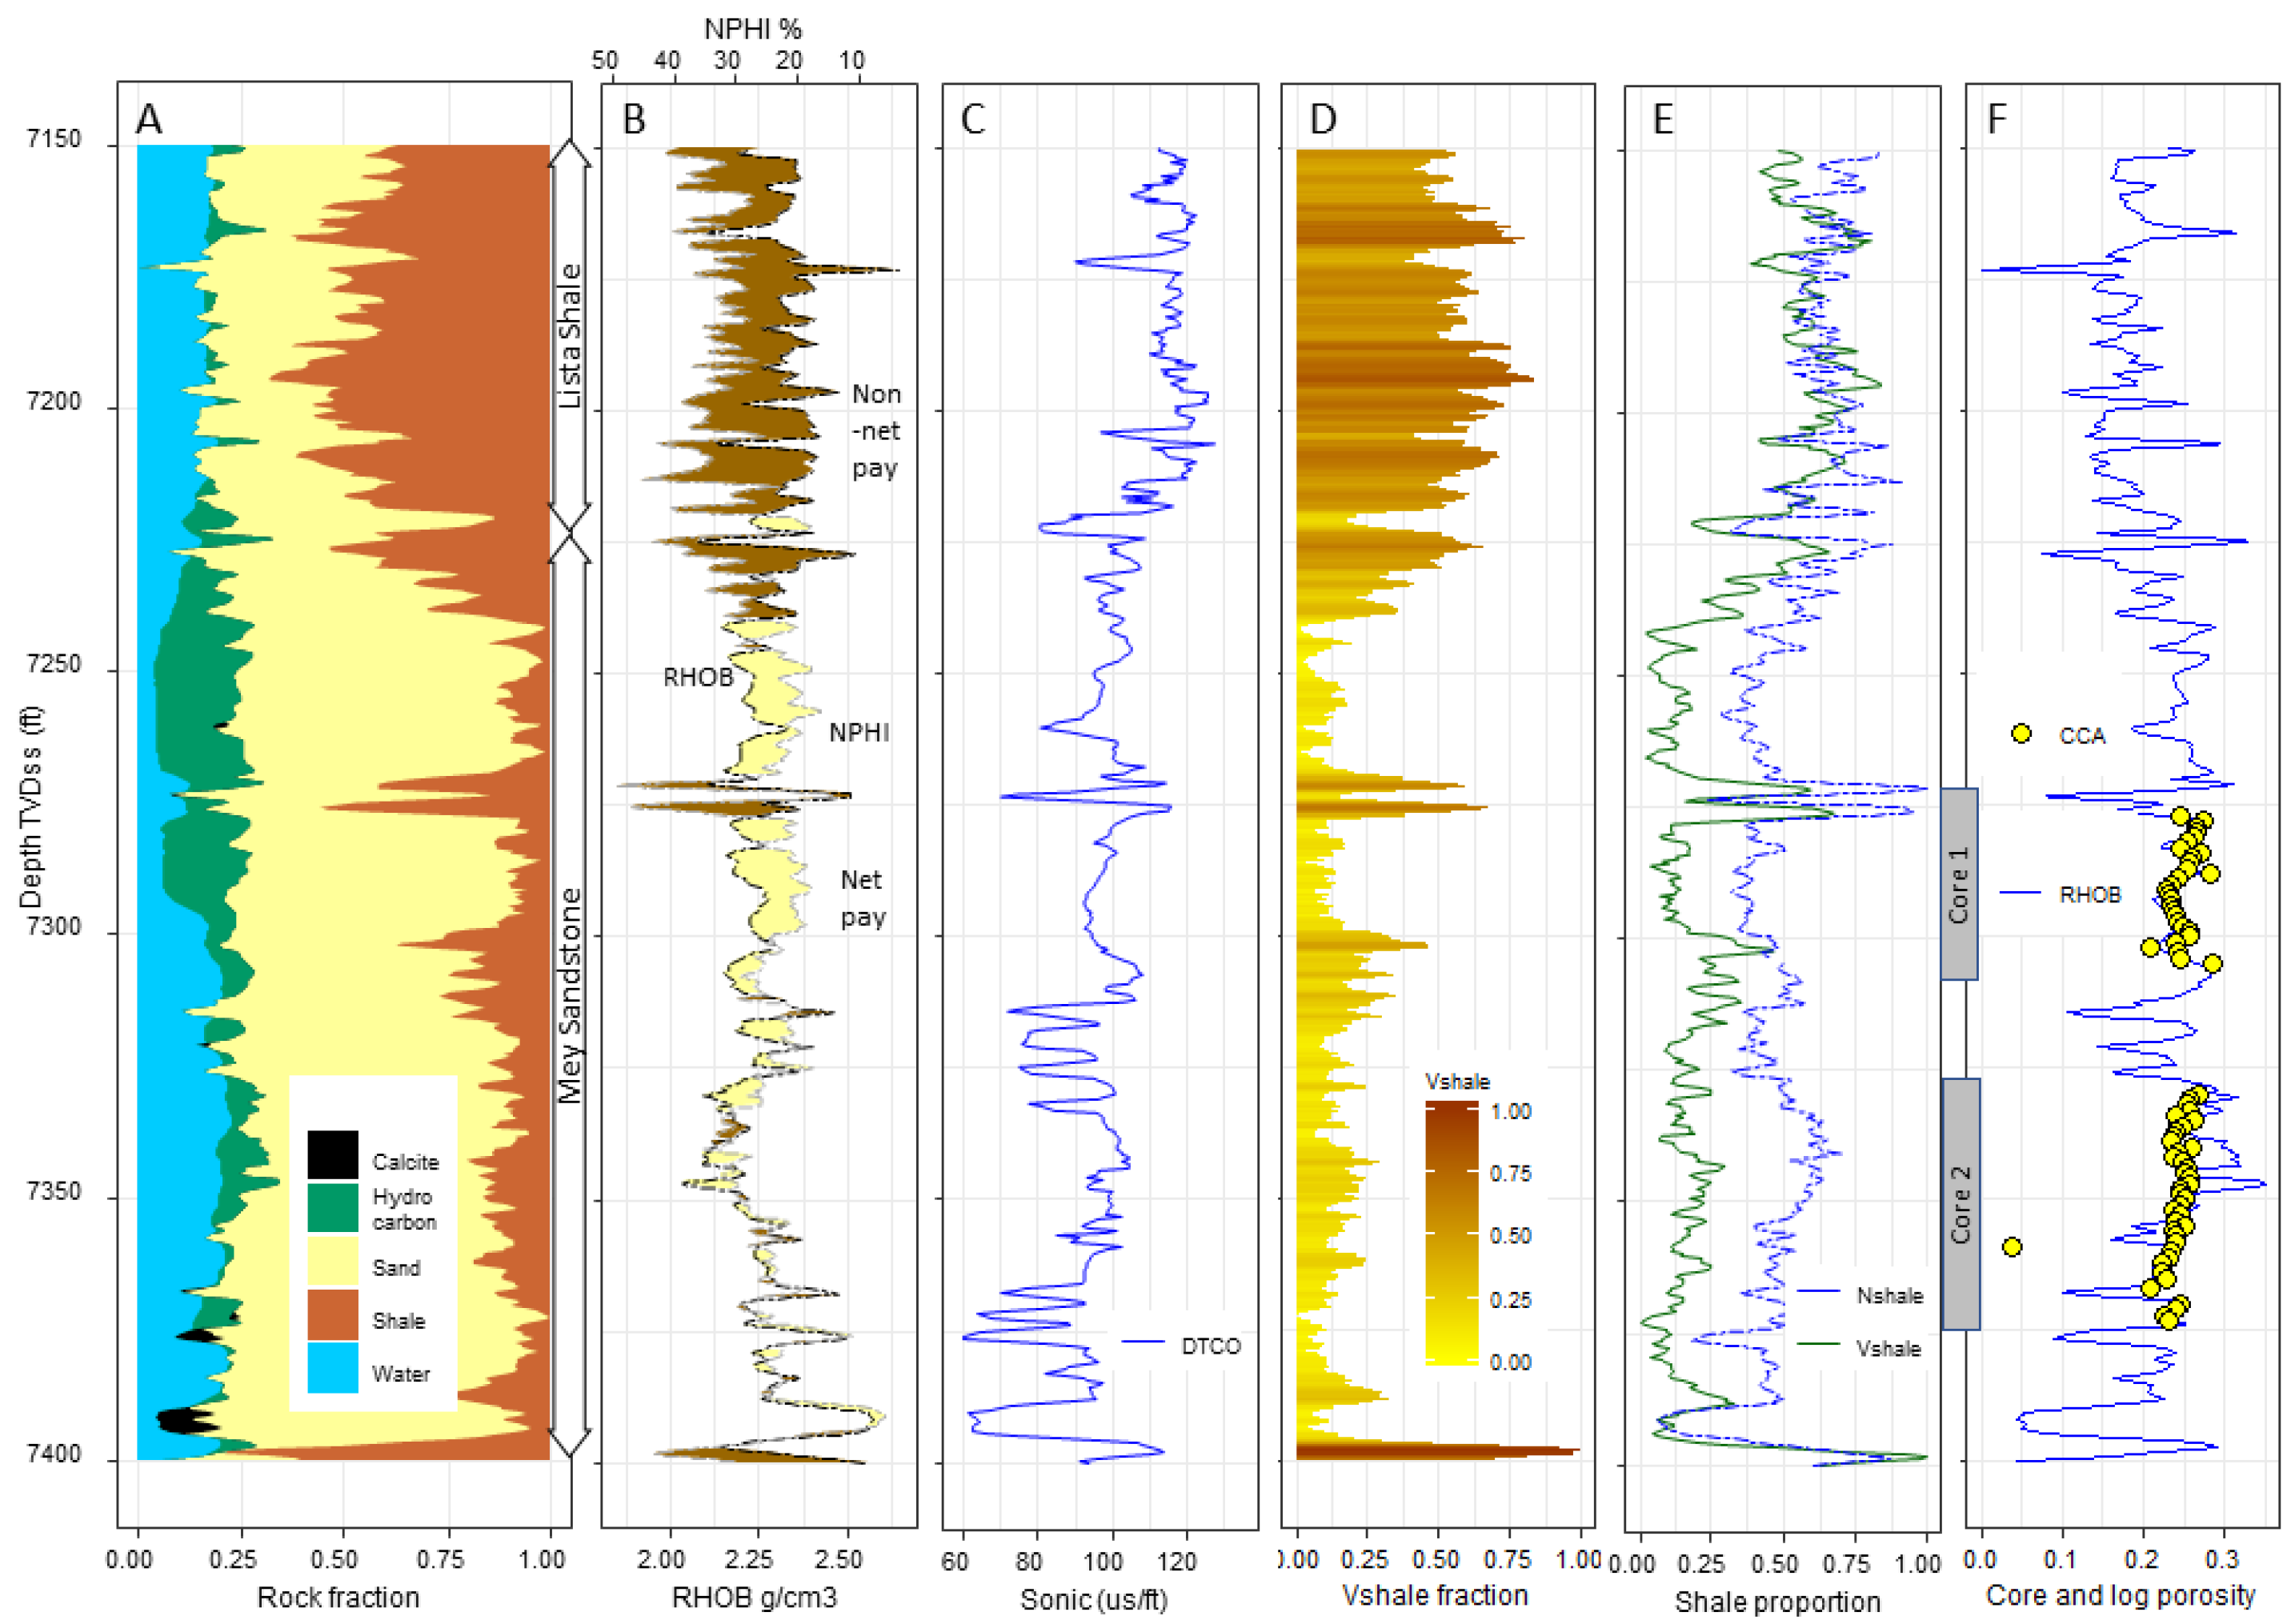
4.1. Wireline Log and Conventional Core Analysis Data
4.1.1. Acorn: Lower Cretaceous Rodby and Sola Shales
4.1.2. East Mey: Palaeocene Lista Shales
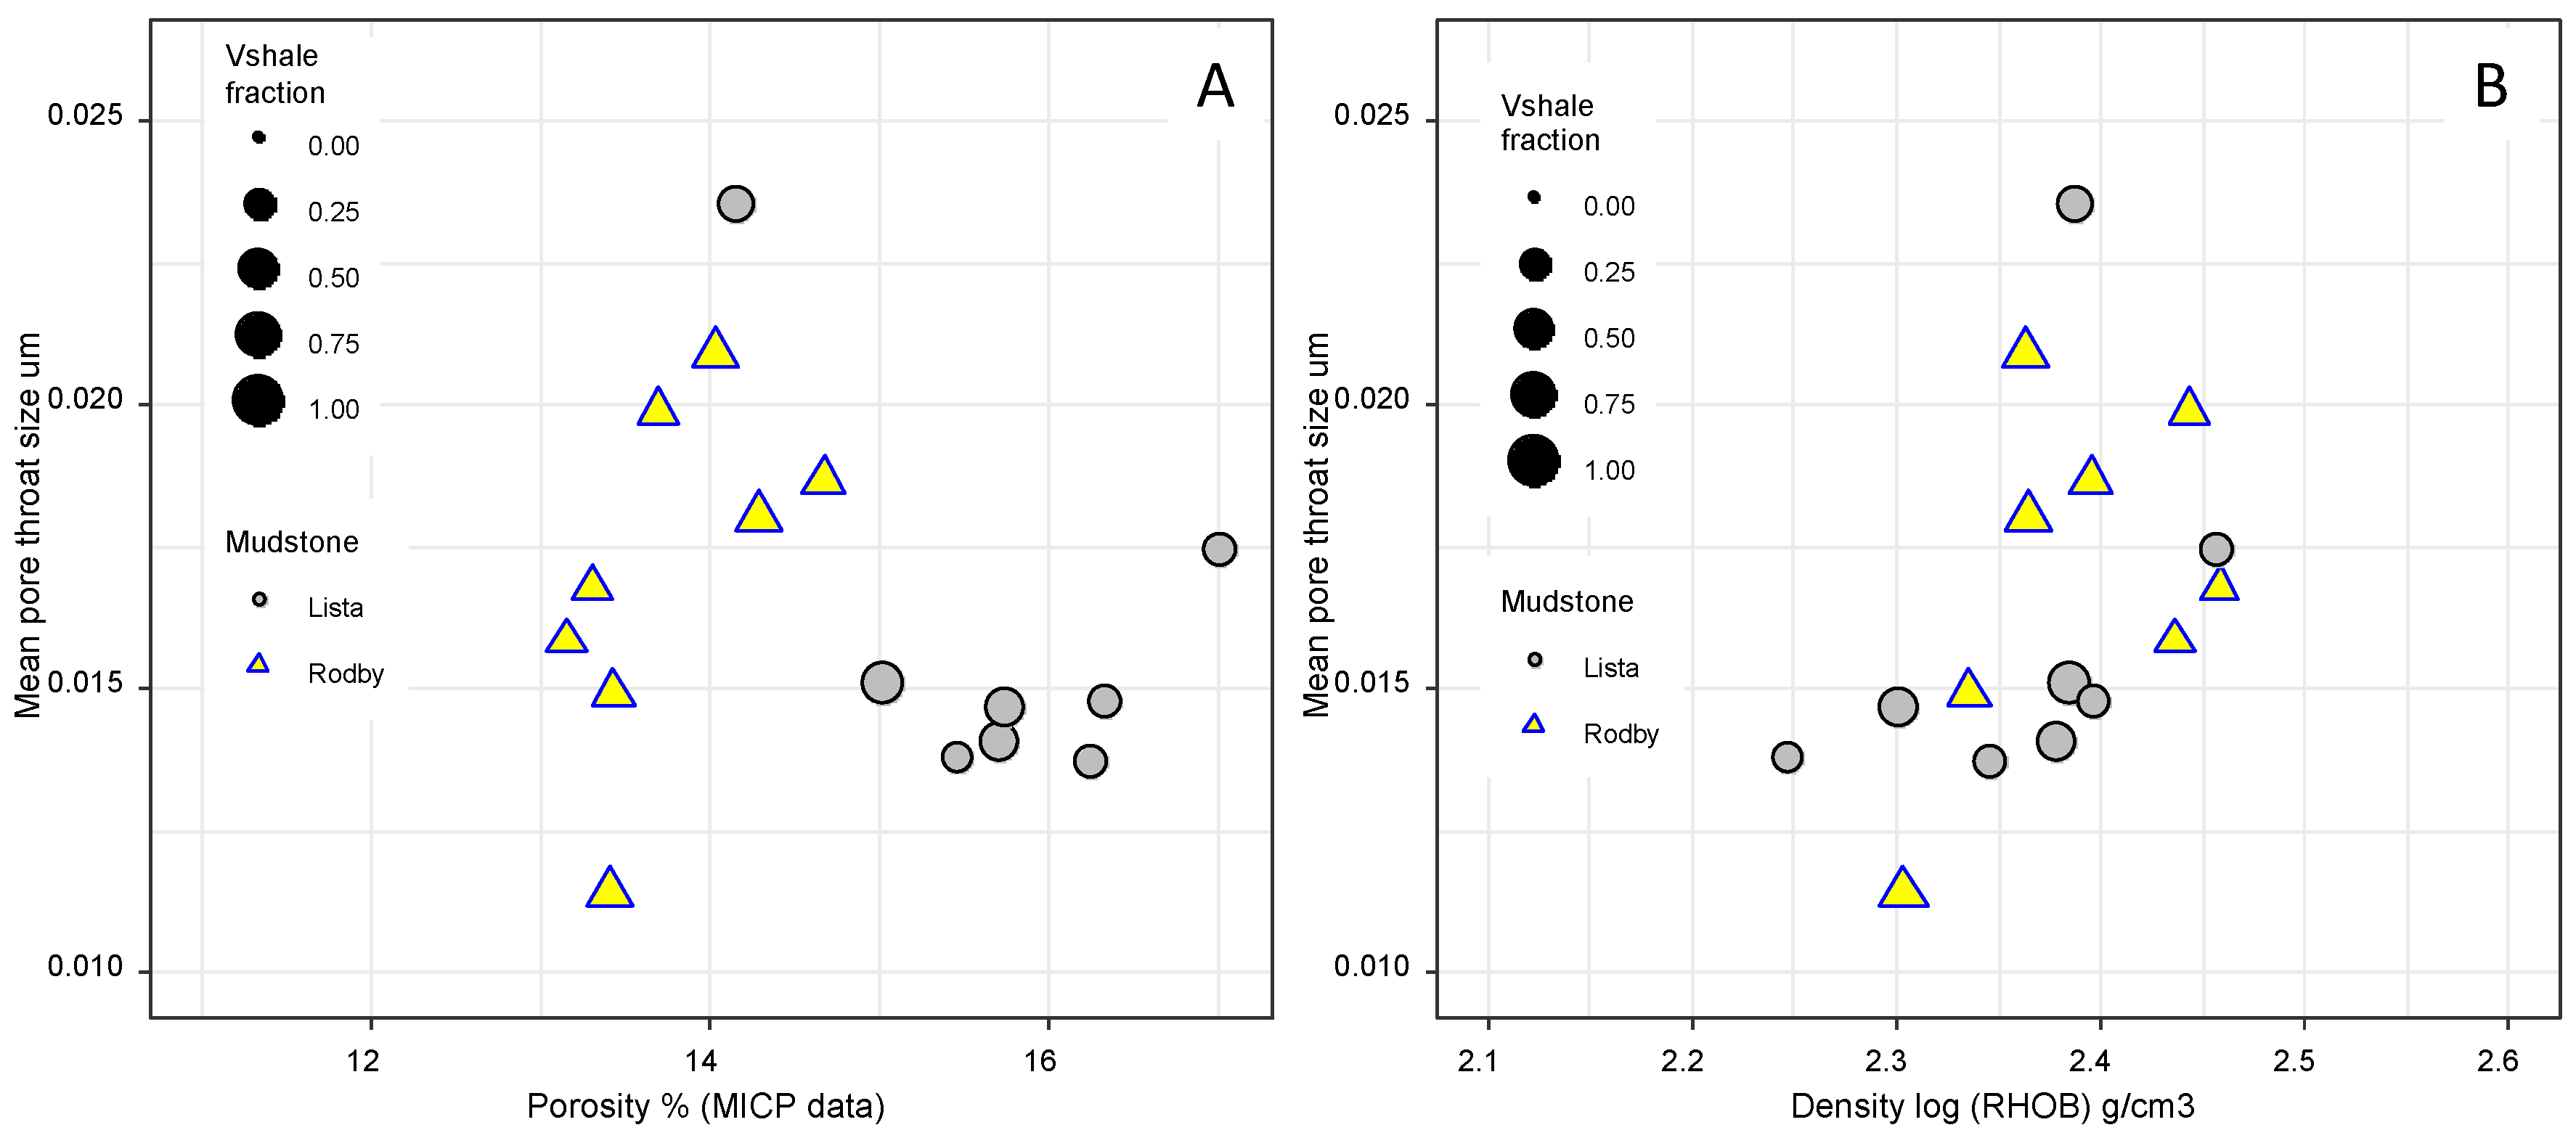
4.2. Mercury Intrusion Porosimetry
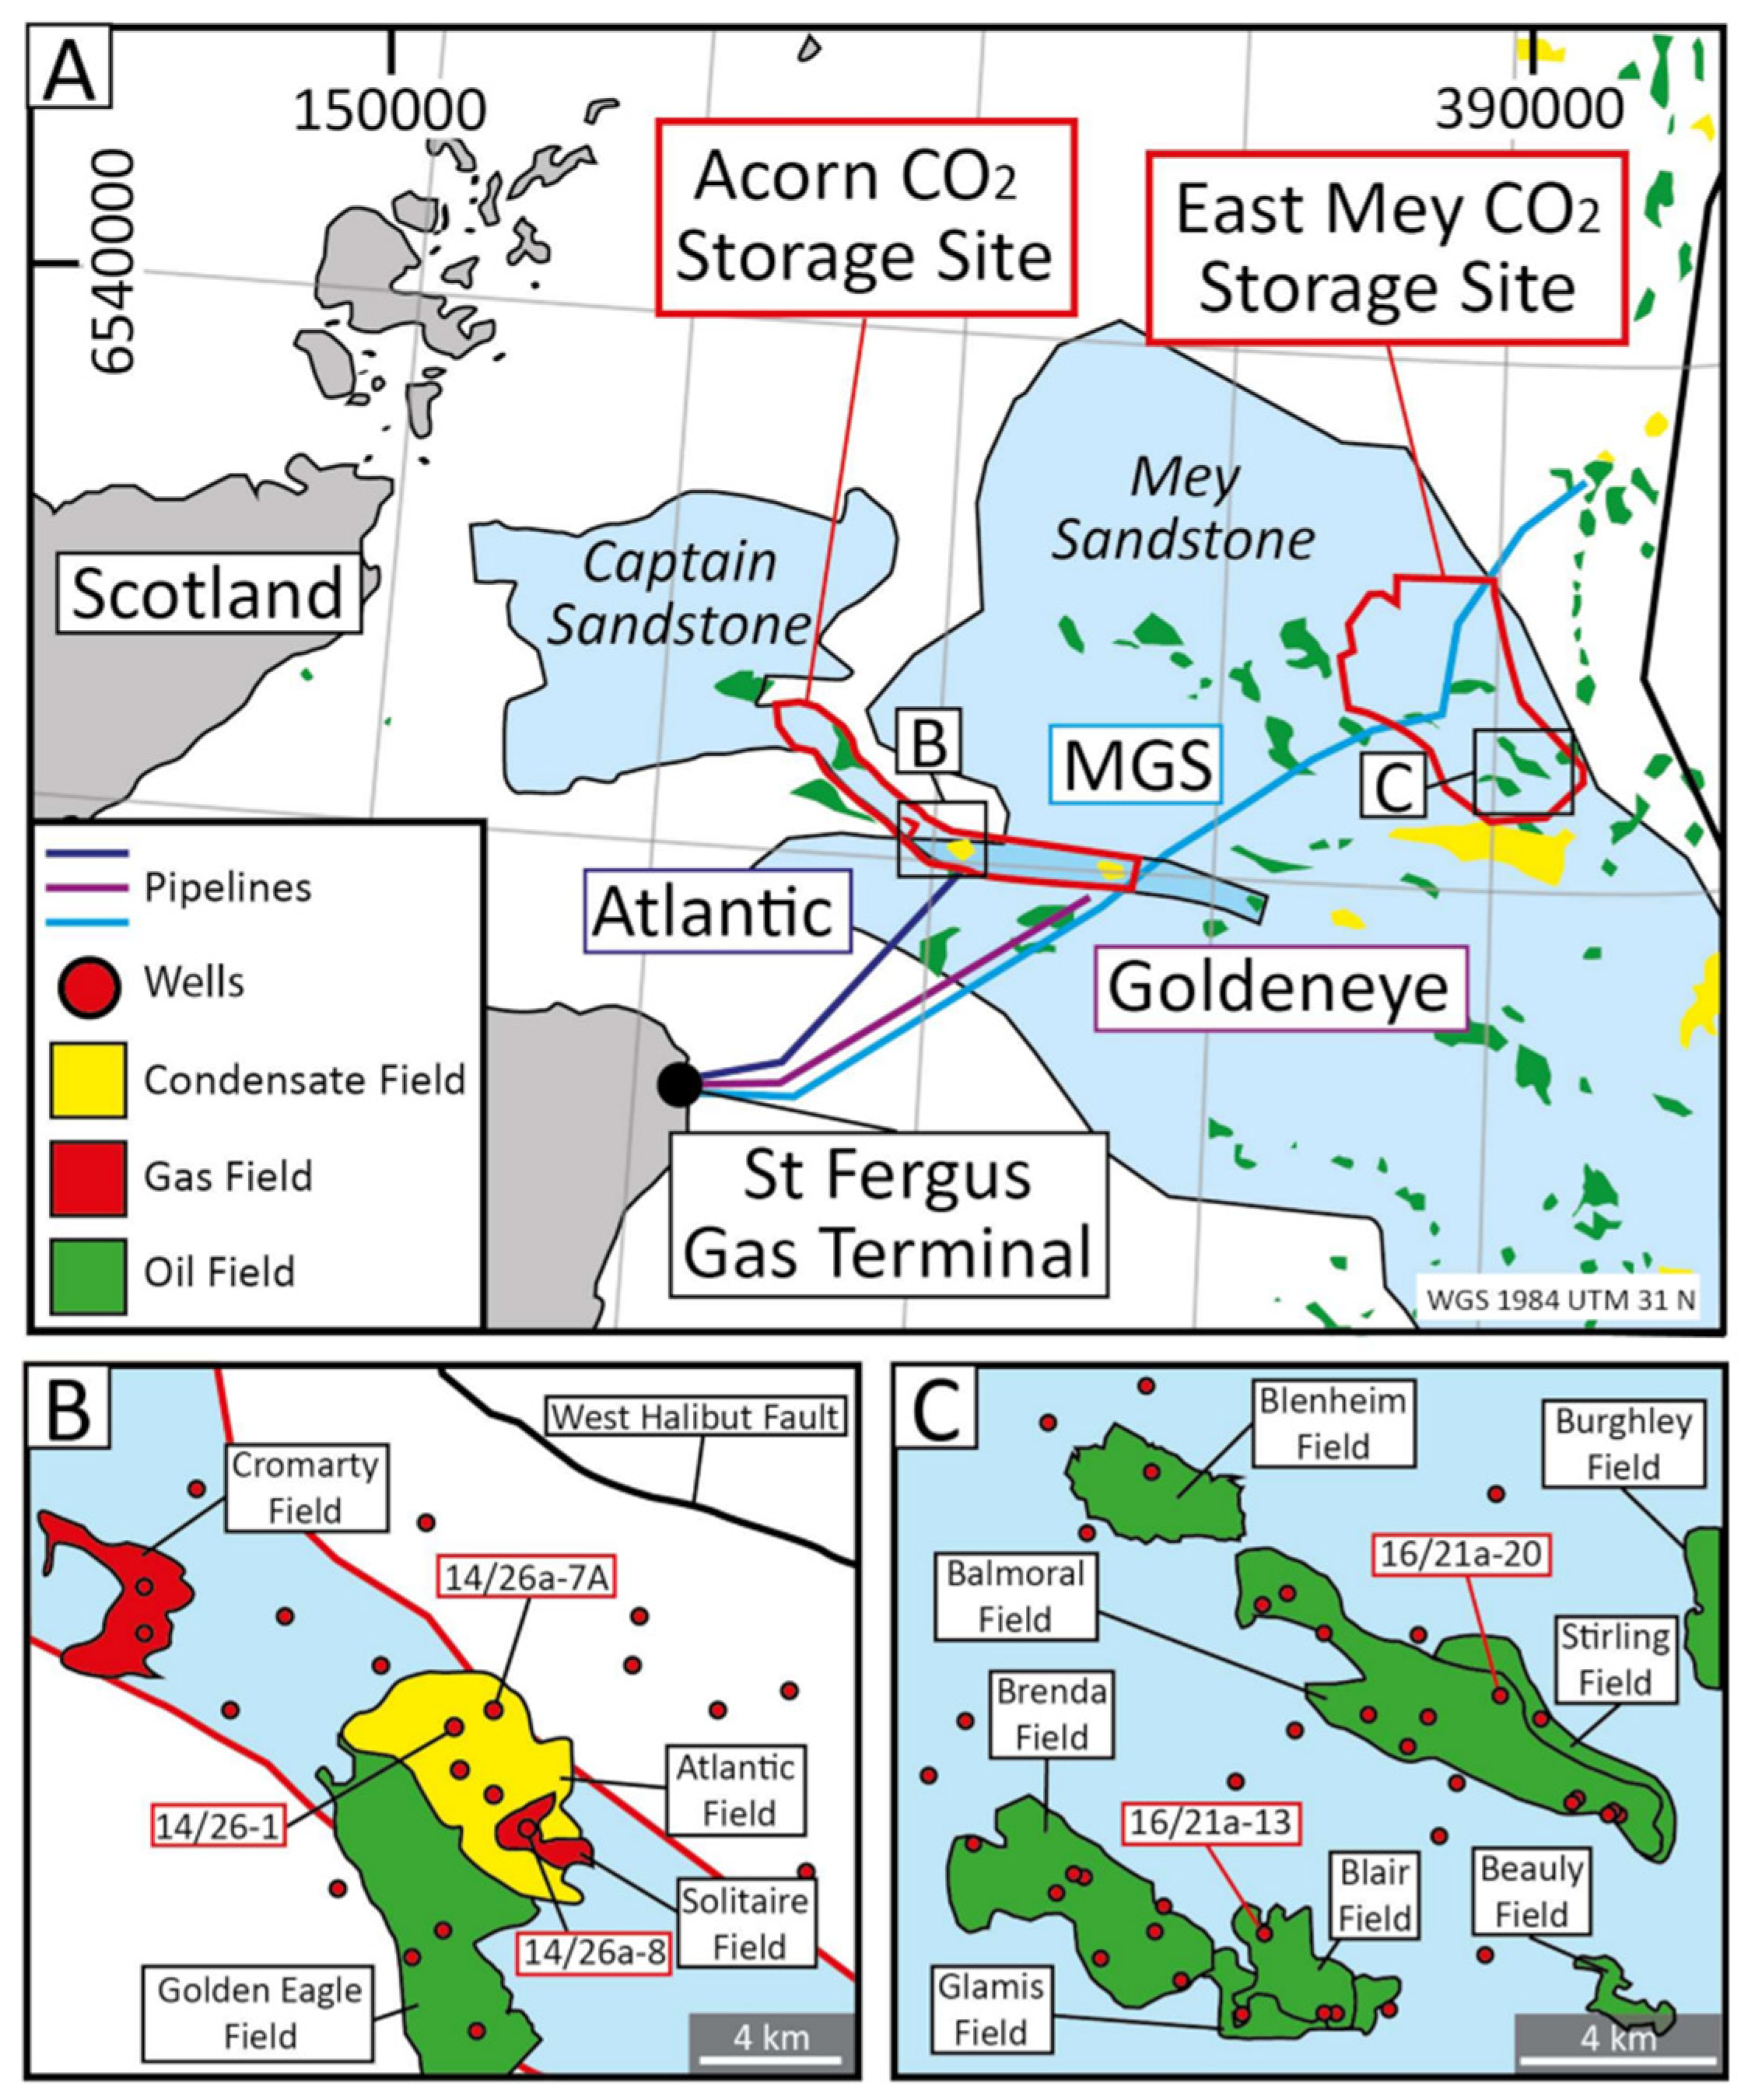
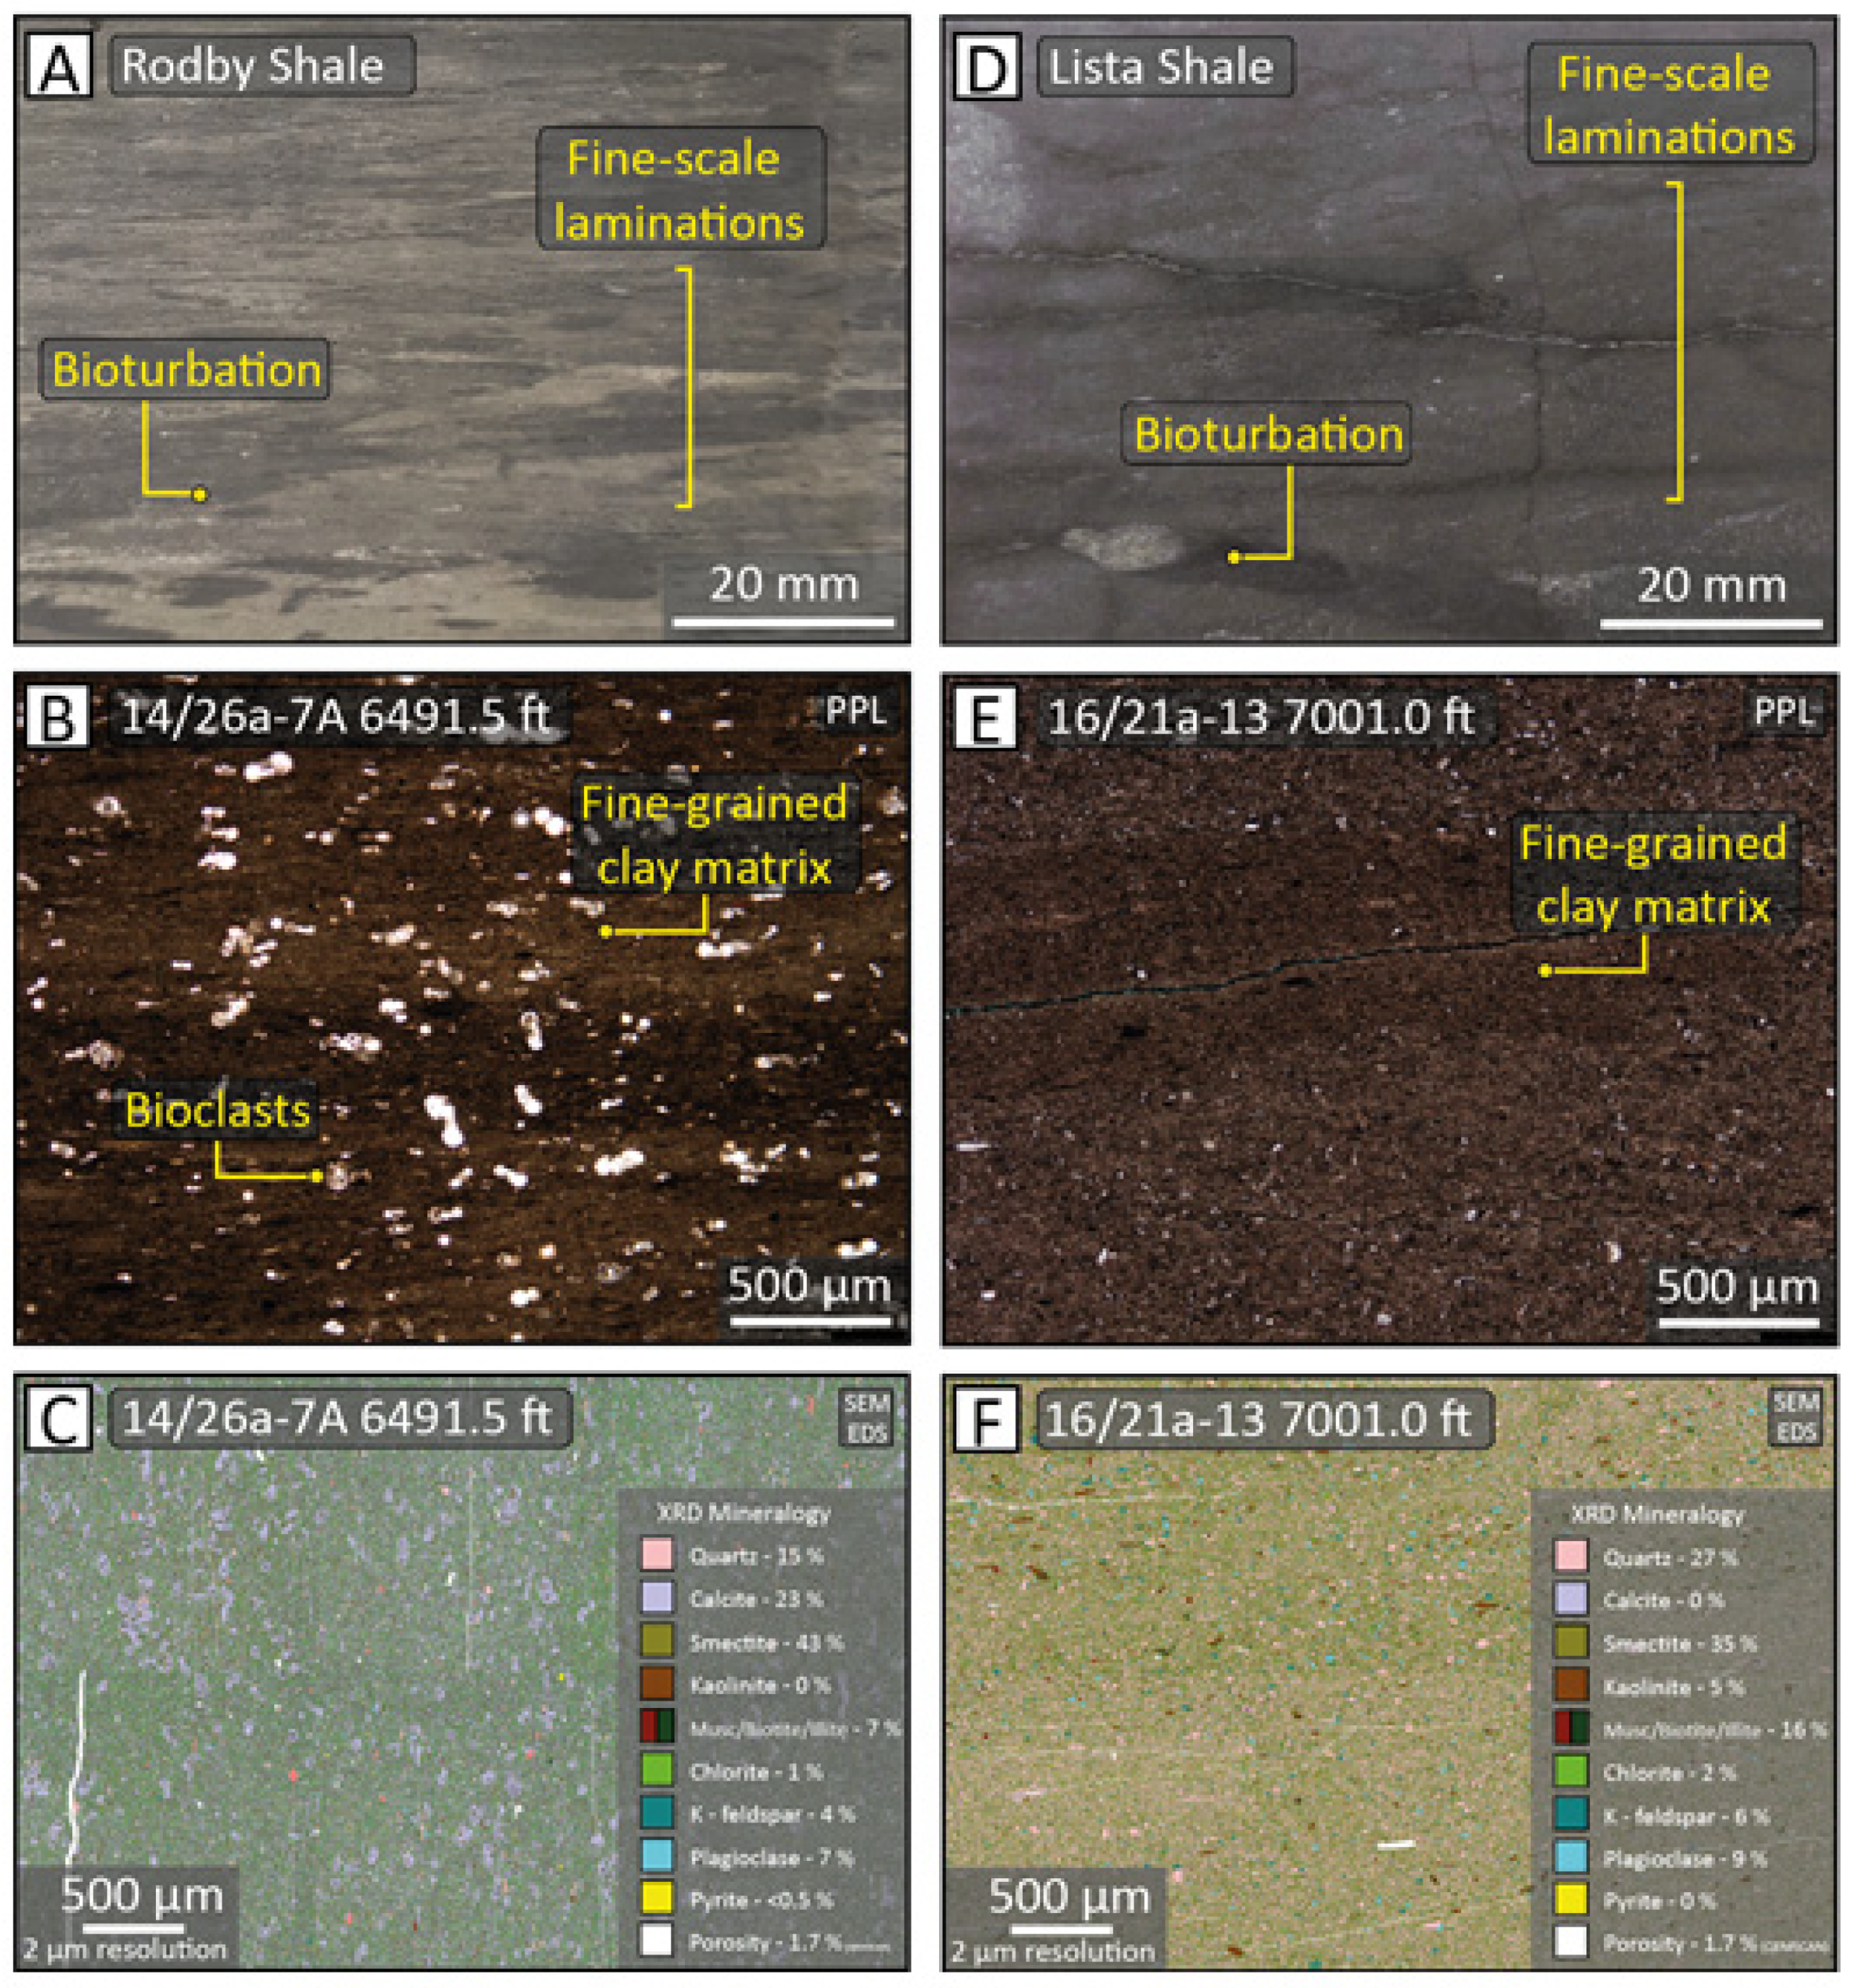
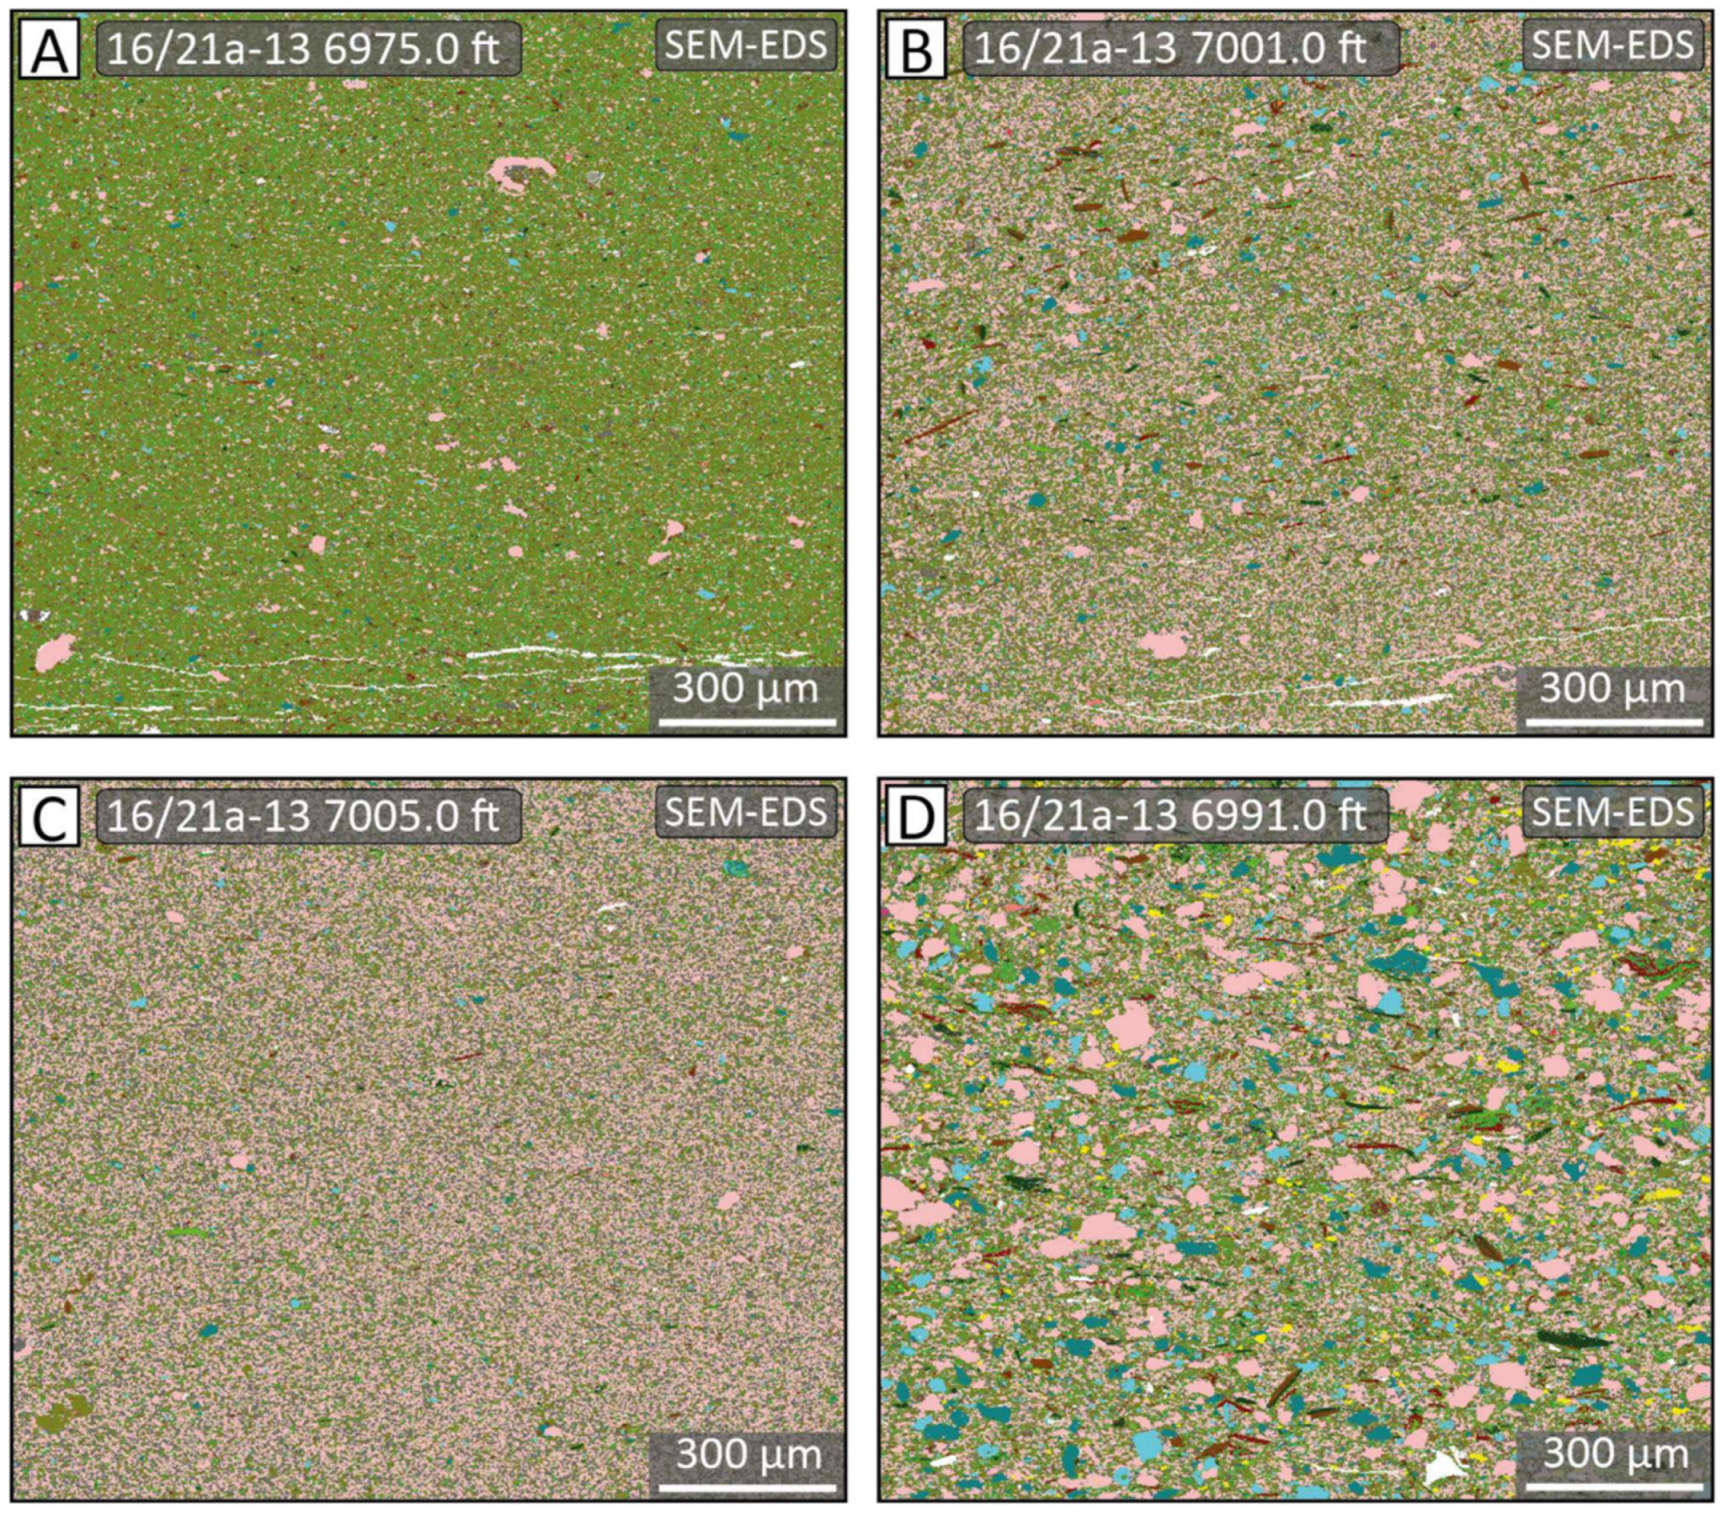
4.3. Core Description, Petrography and Mineralogy
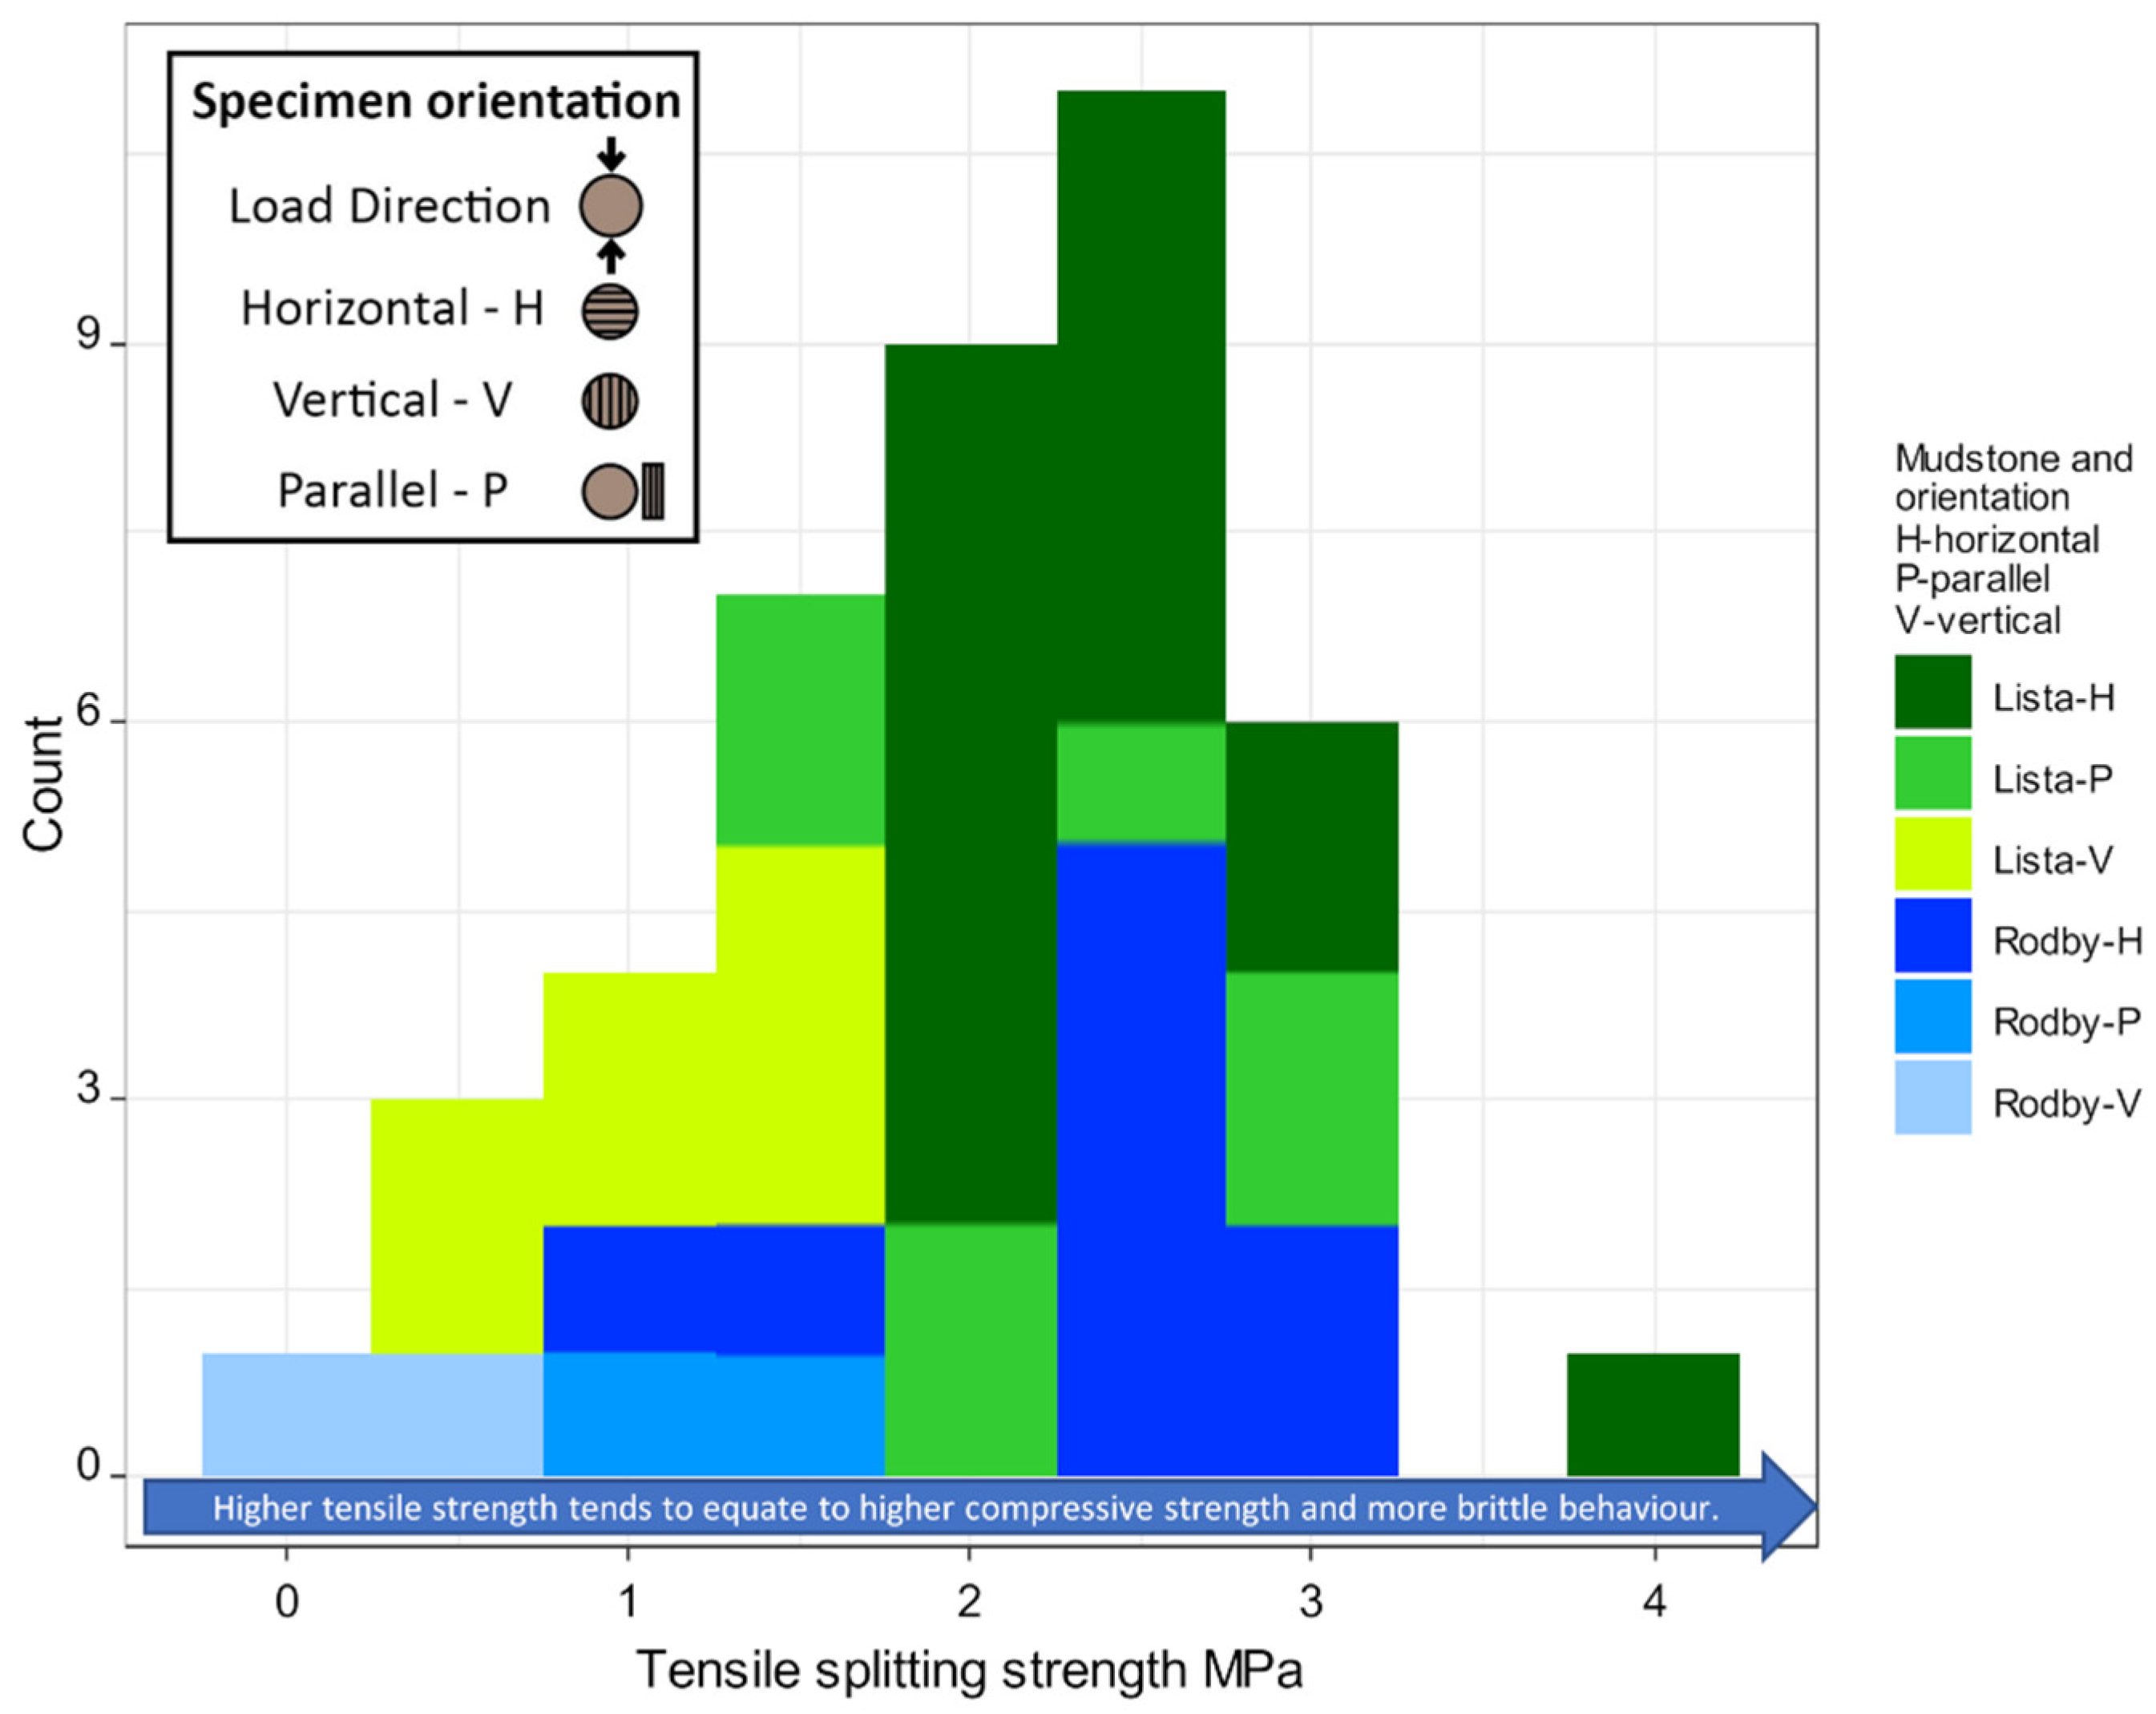
4.4. Splitting Tensile Strength
5. Interpretation and Comparison of Data Types
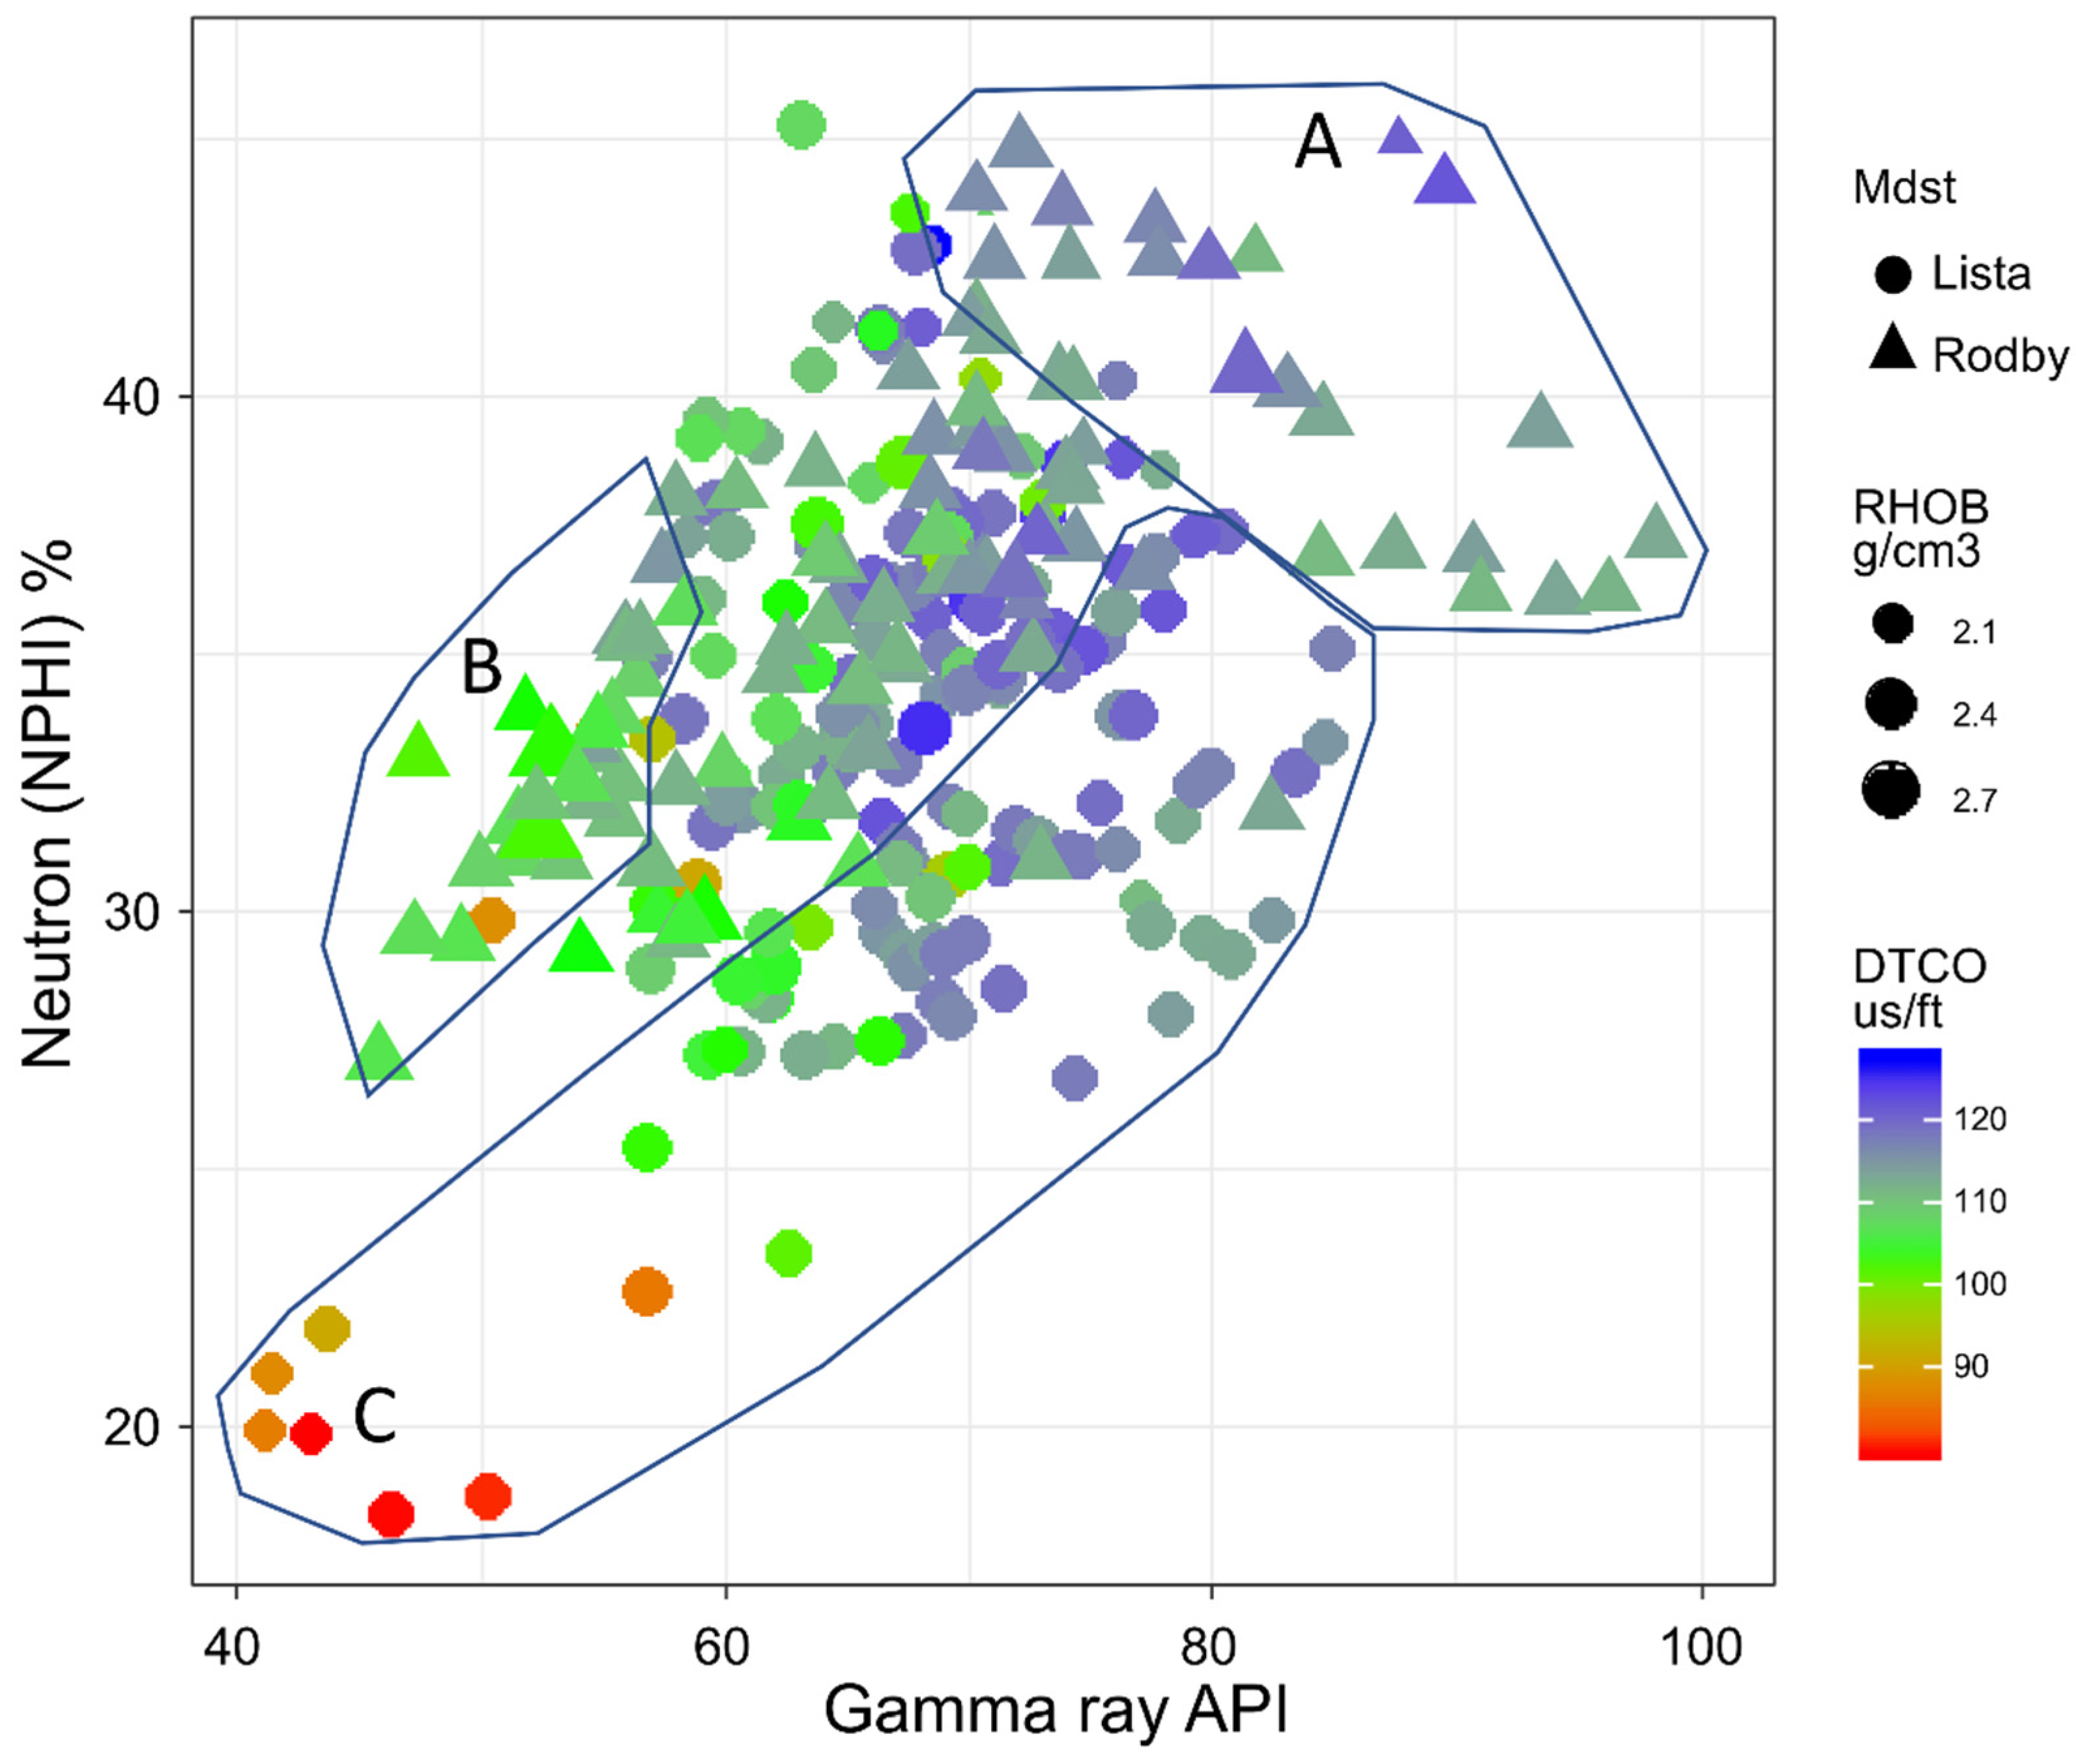
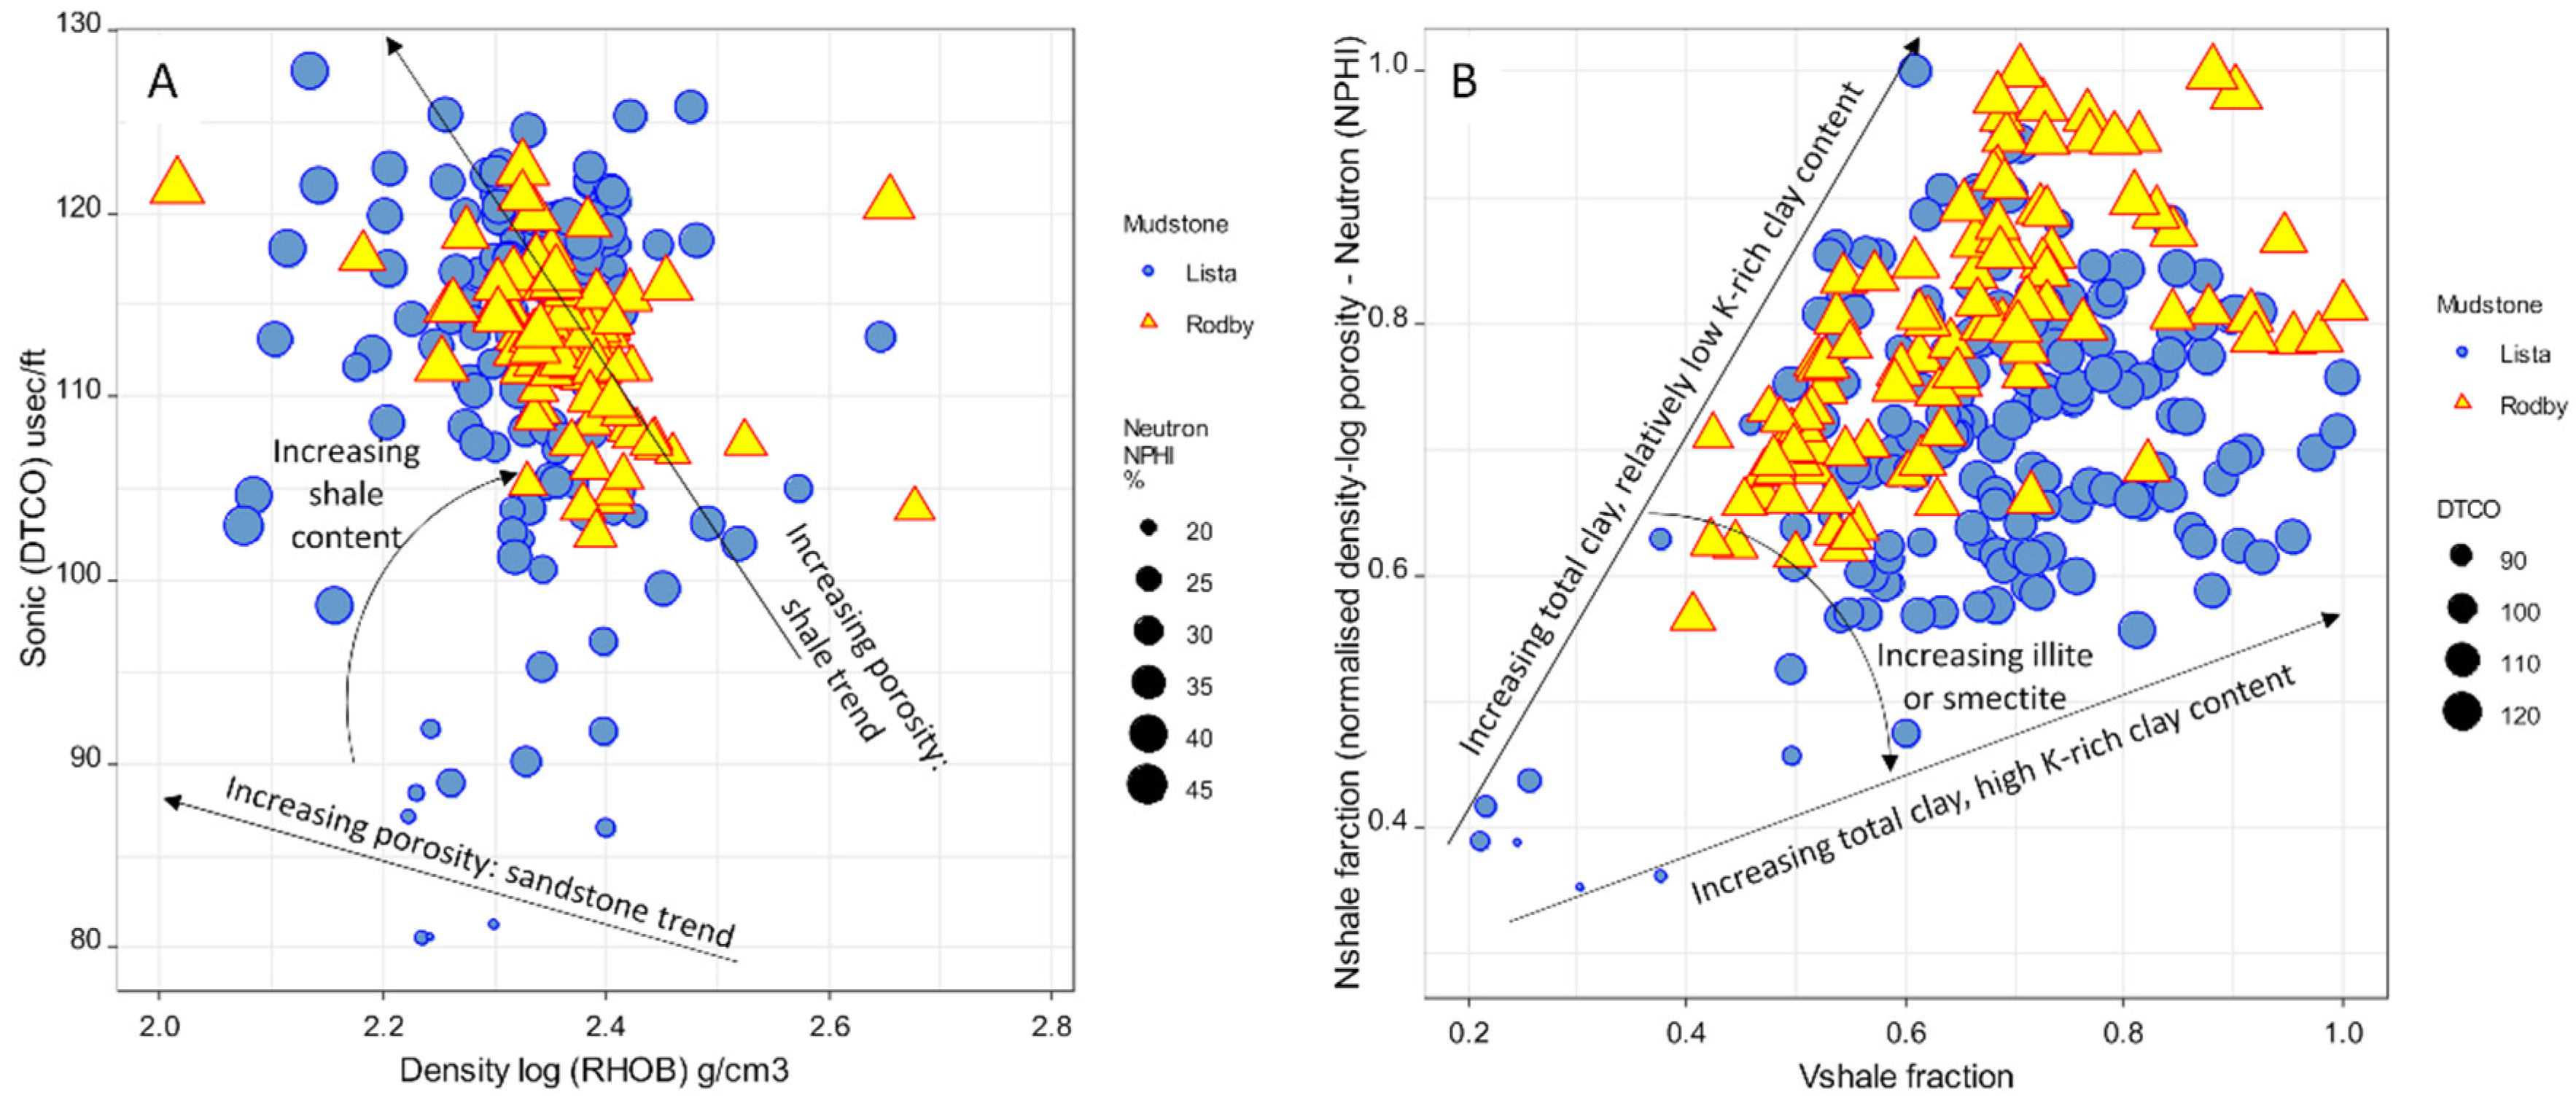
5.1. Comparison of Wireline Log Characteristics of the Rodby and Lista Shales
5.2. Comparison of Core Analysis (MICP) Characteristics of the Rodby and Lista Shales
5.2.1. Porosity
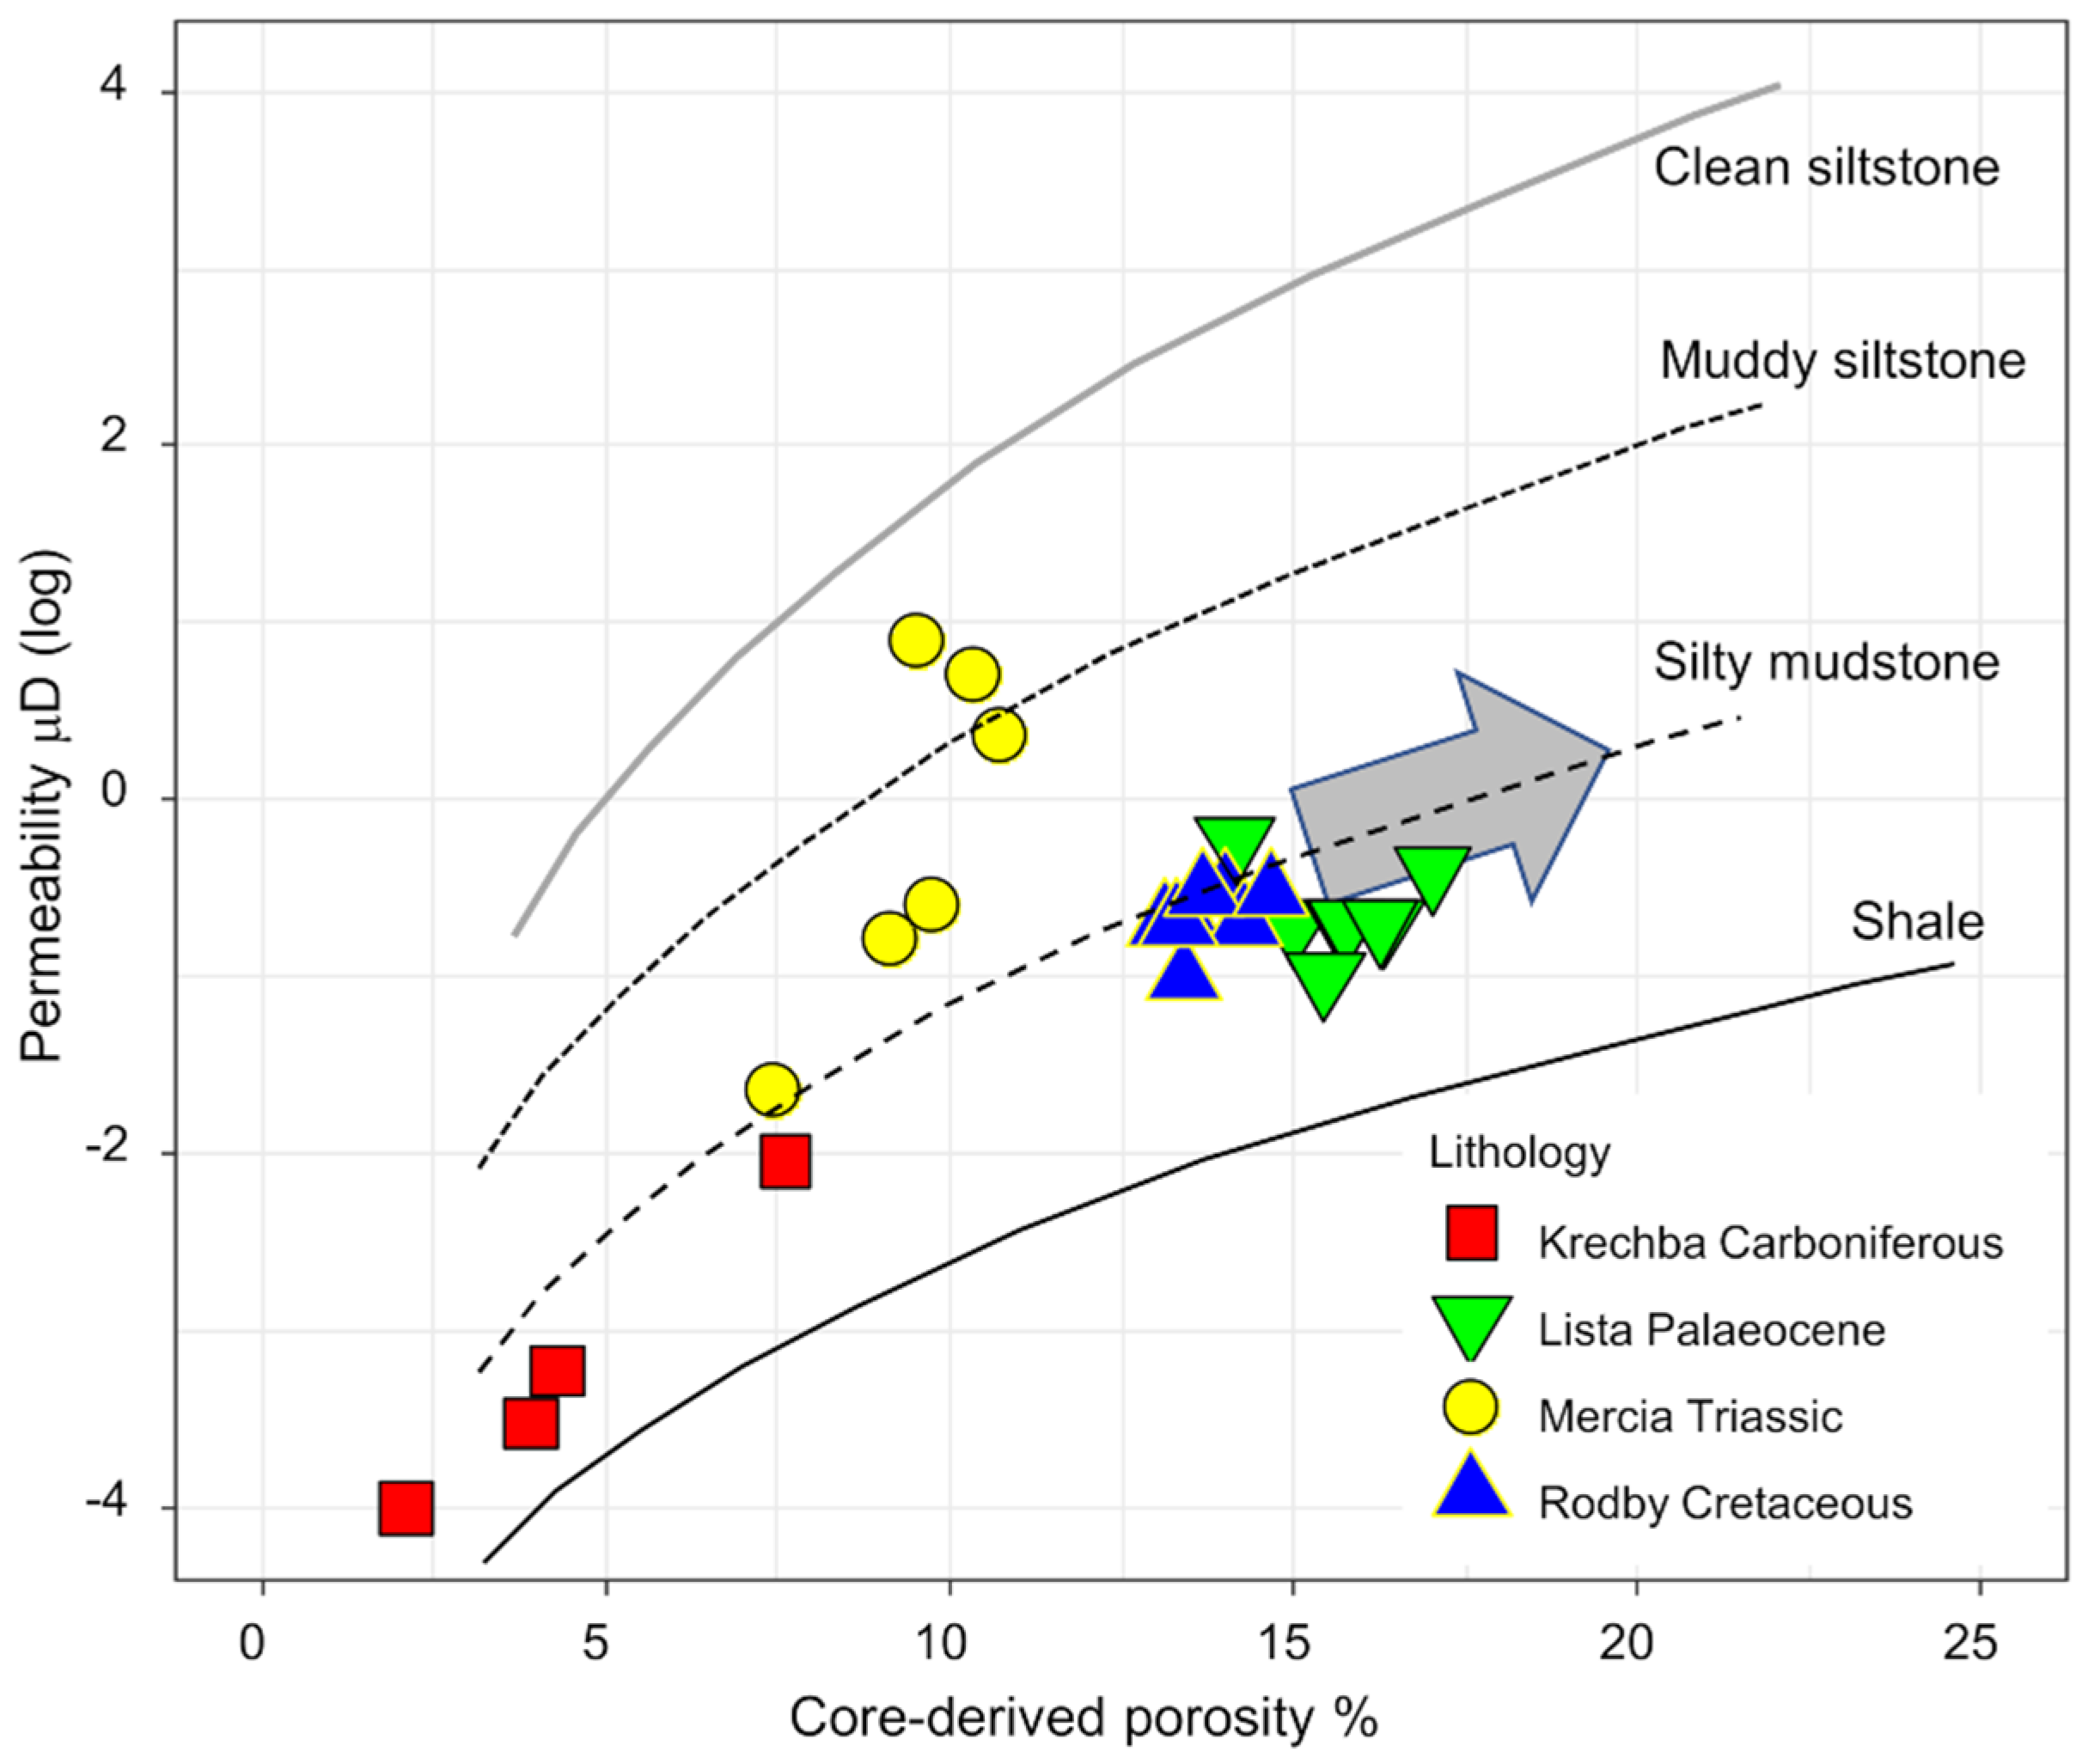
5.2.2. Permeability
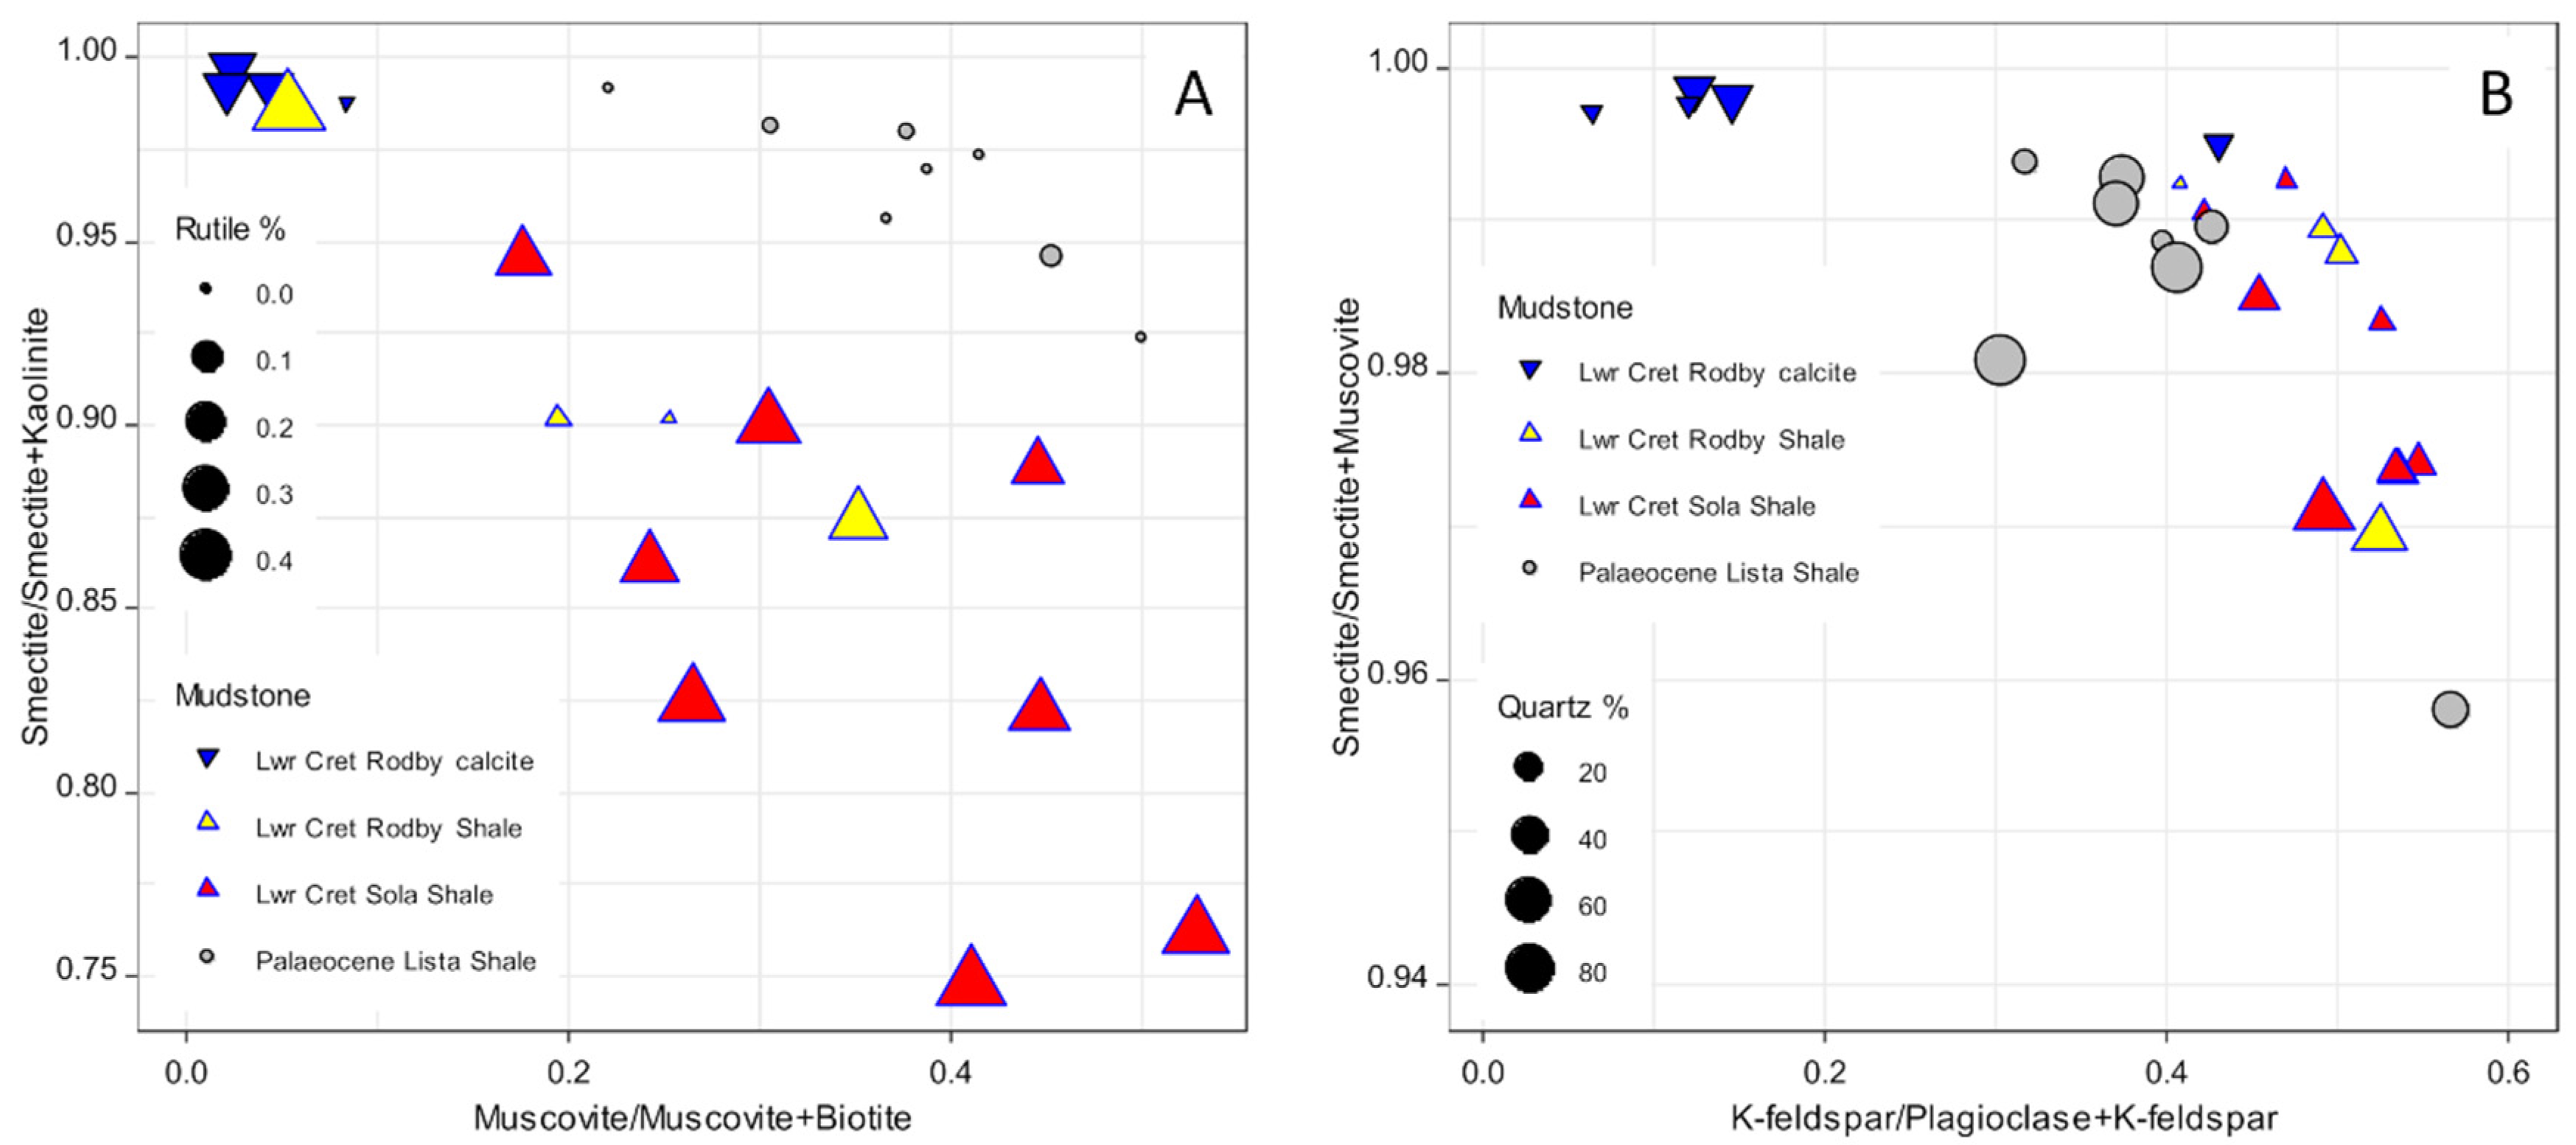
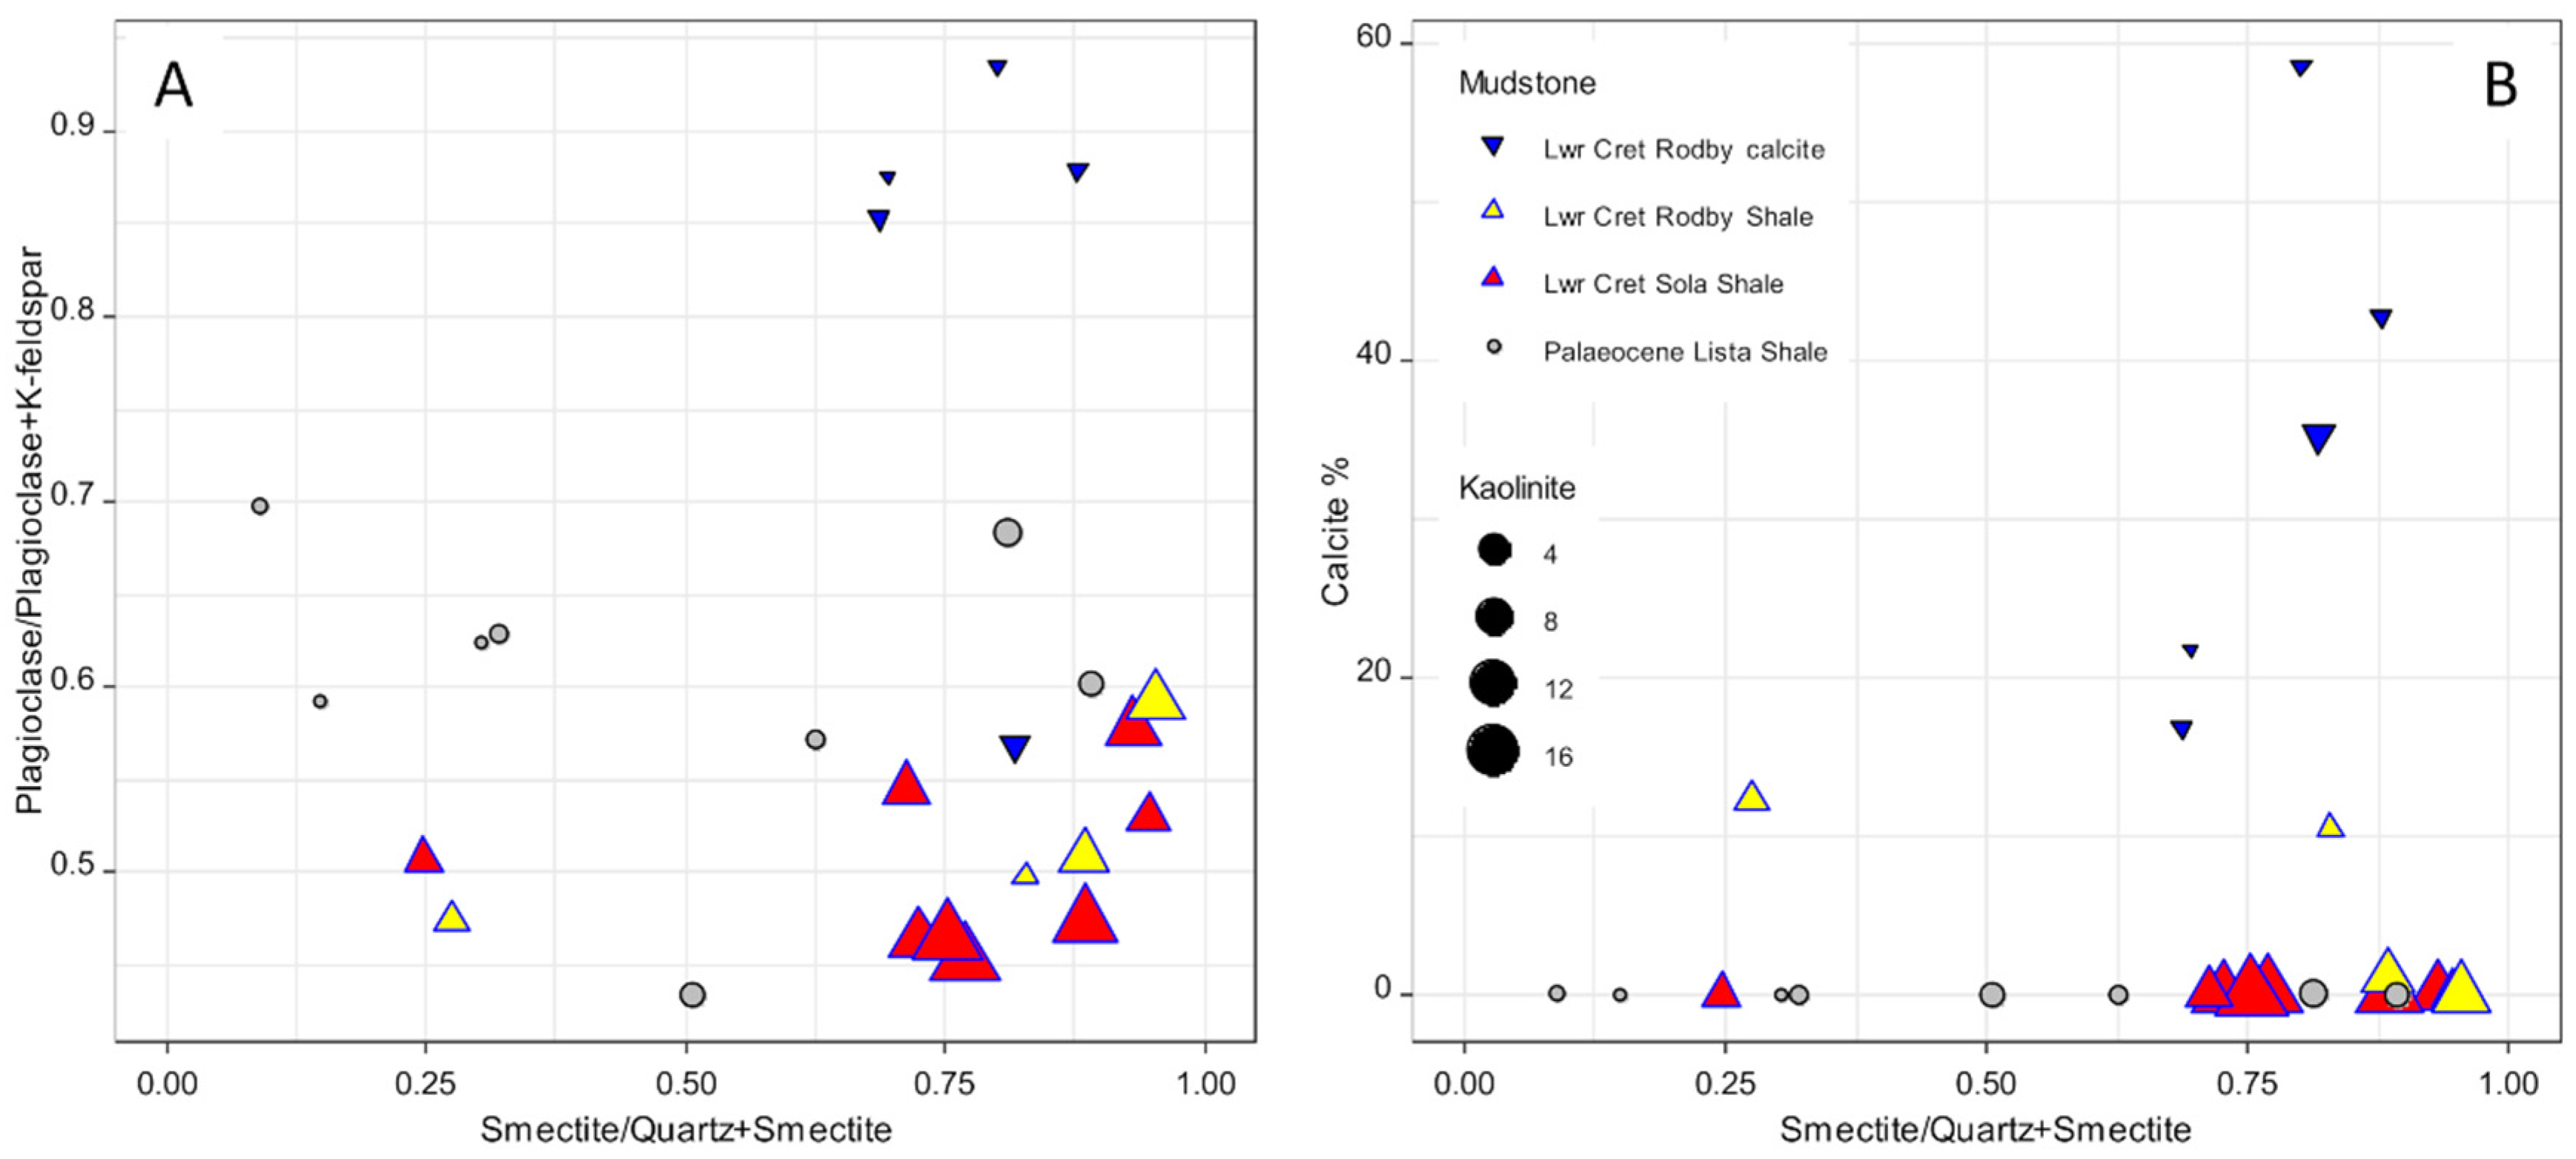
5.3. Comparison of the Mineralogy of the Rodby and Lista Shales and Relationships to Wireline Log Characteristics
5.4. Maximum CO2 Column Heights Possible under the Rodby and Lista Shale Top-Seals
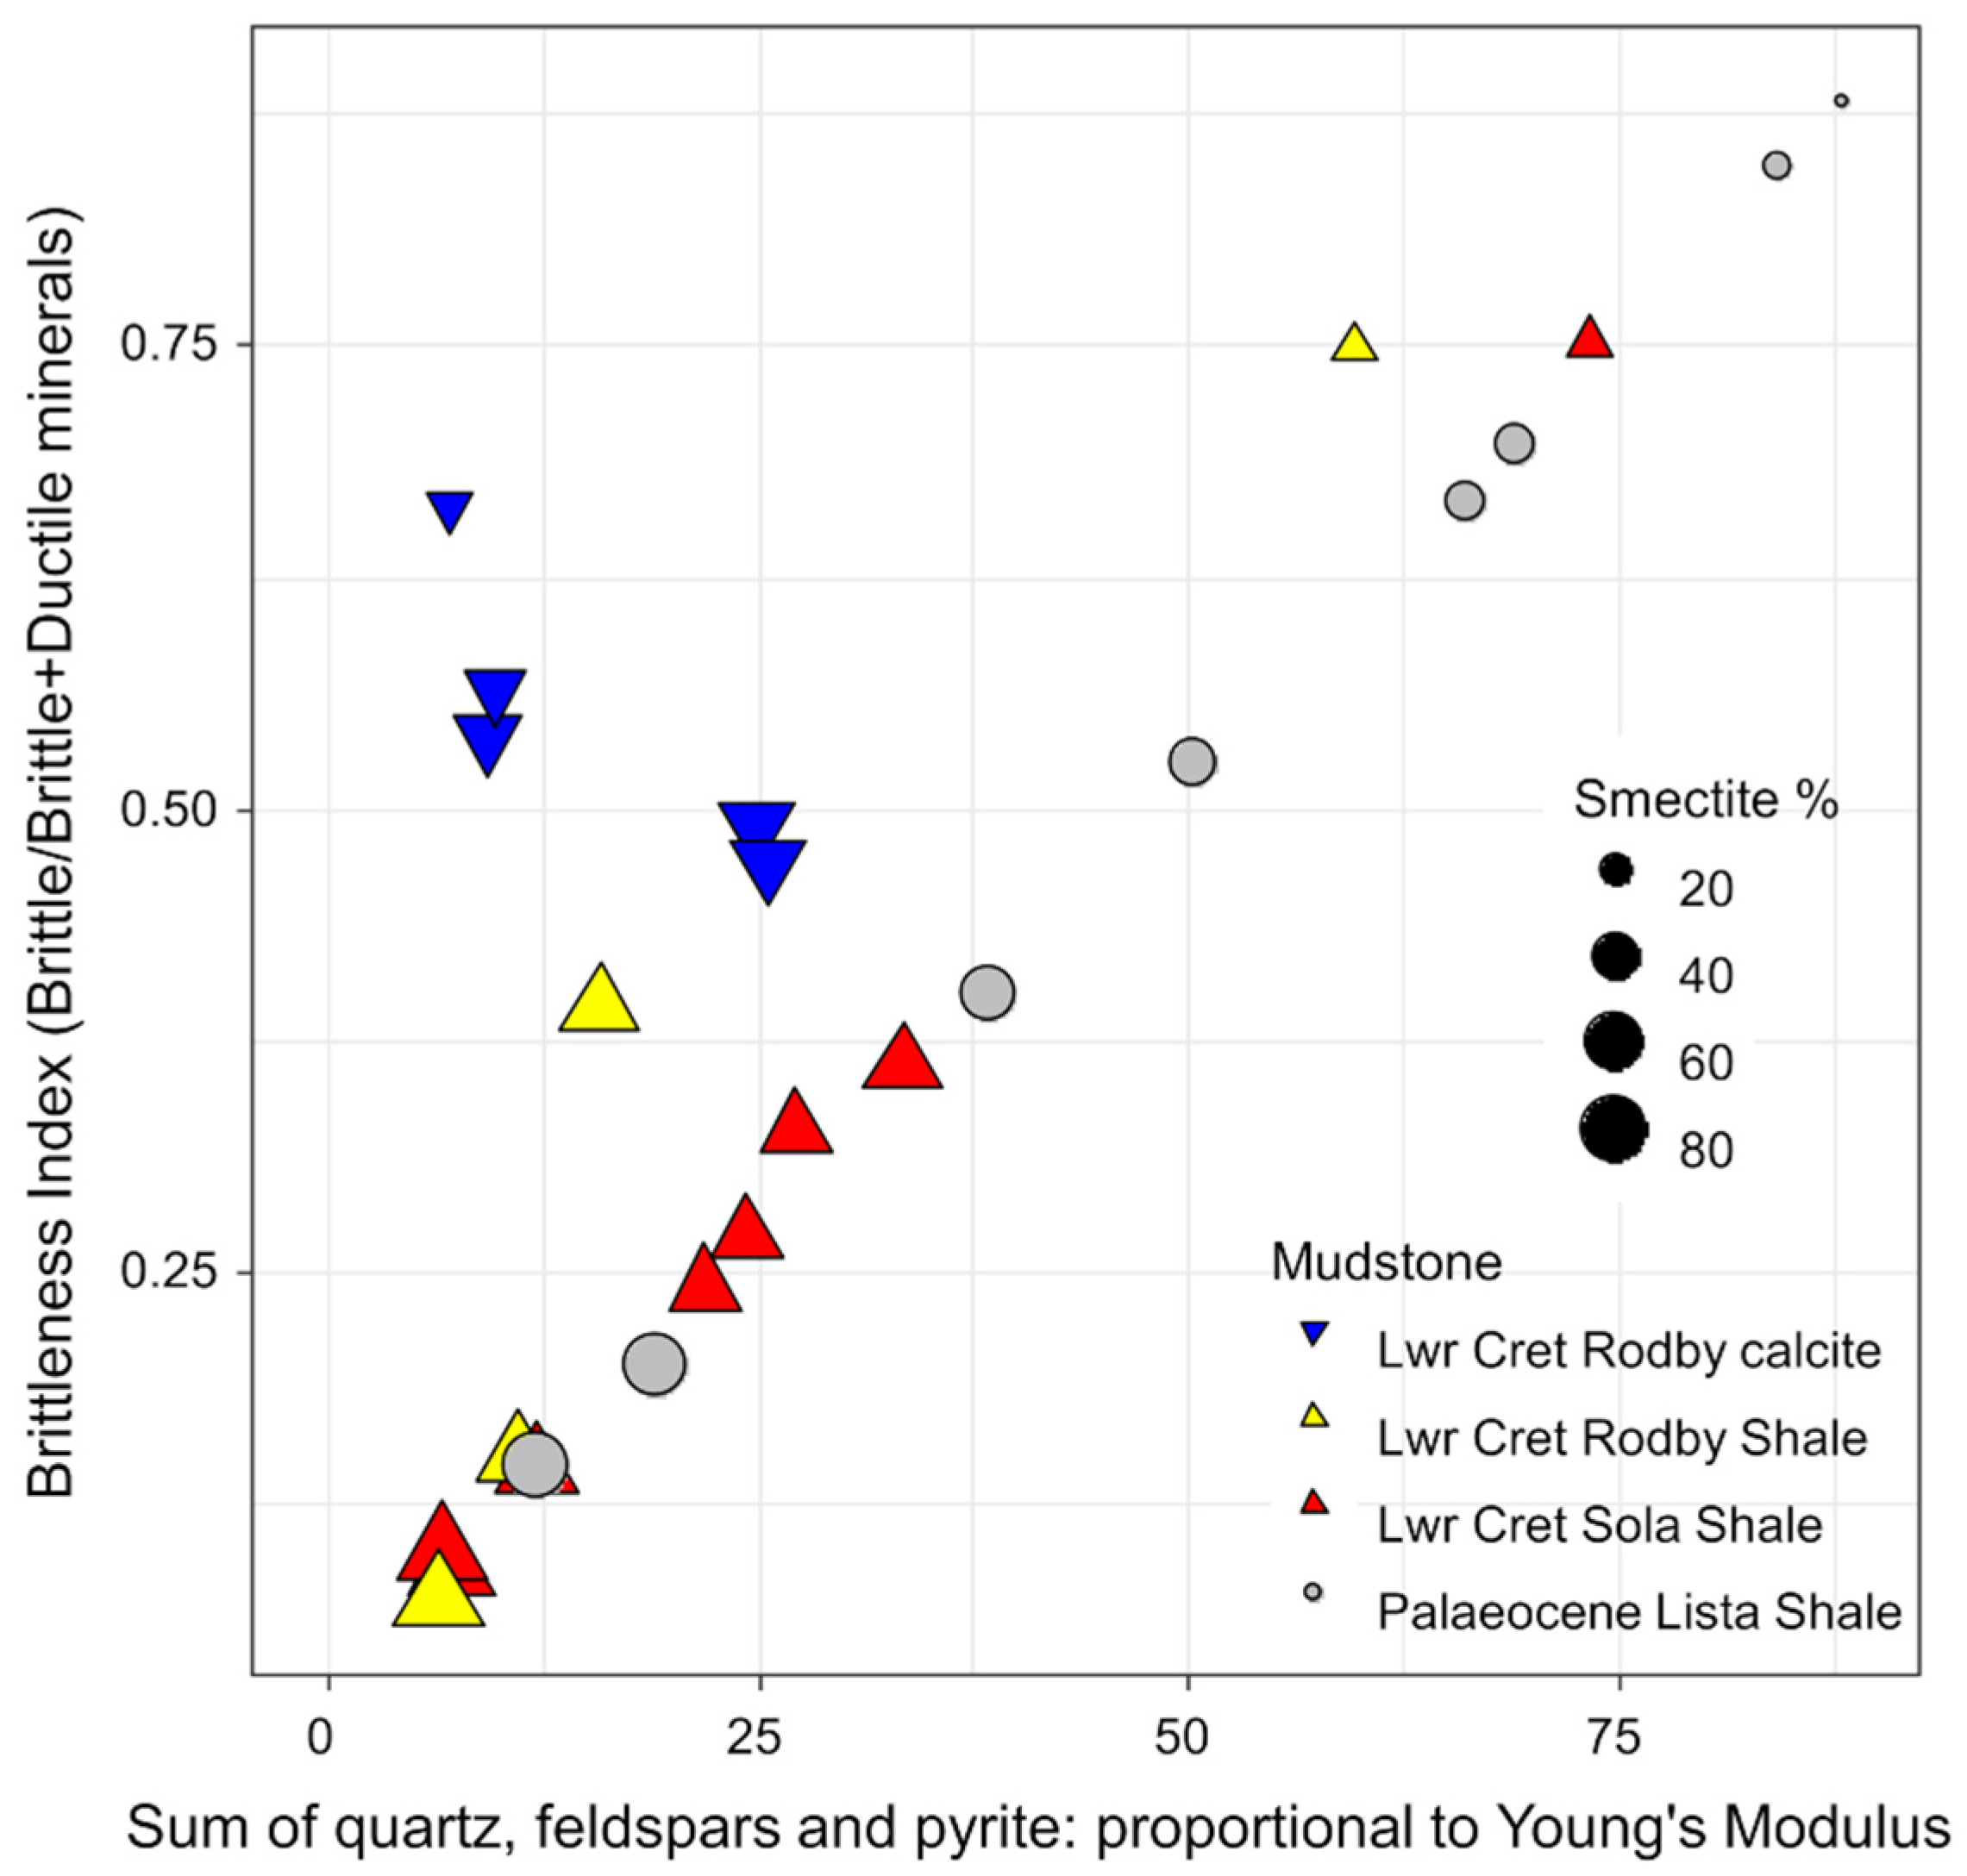
5.5. Mineralogical Rock Strength Indicators for the Rodby and Lista Shales
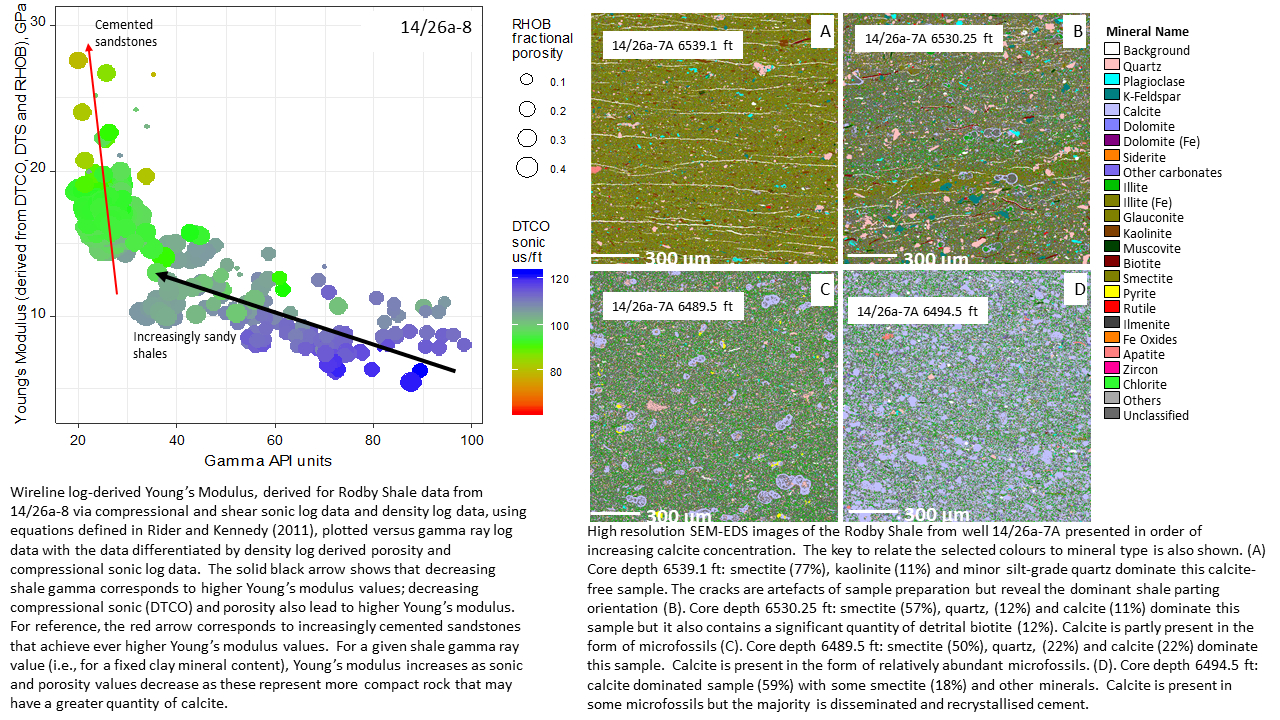
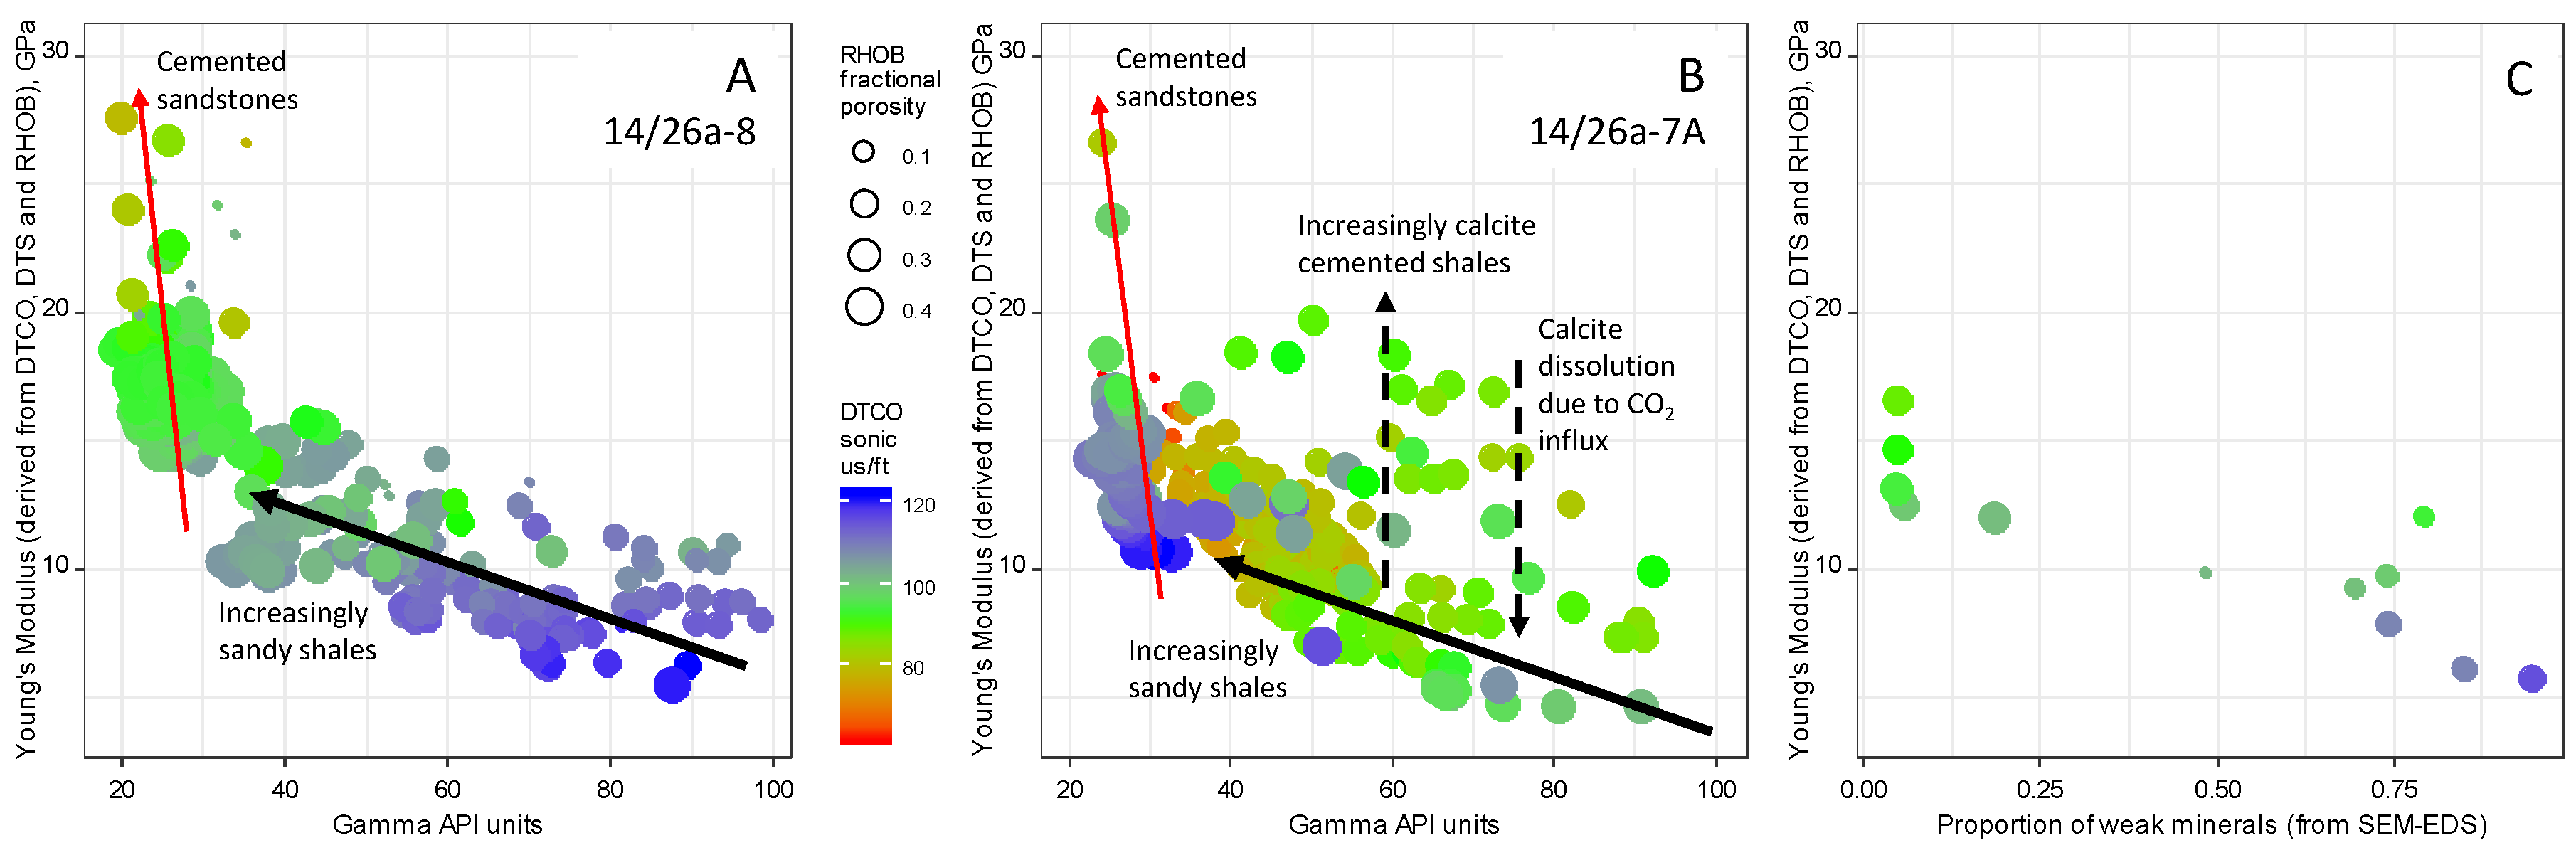
5.6. Log-Derived Rock Strength Indicators for the Rodby Shale
6. Synthesis
7. Conclusions
- The Lower Cretaceous Rodby Shale and Palaeocene Lista Shale are top-seals to planned Carbon Capture and Storage (CCS) sites, offshore NE Scotland, UK. Both have acted as effective top-seals to petroleum accumulations, offshore Scotland. The use of pore size distribution data resulting from mercury intrusion porosimetry suggests that both top-seals can successfully contain CO2 column heights of approximately 390 m.
- The Lower Cretaceous Rodby Shale at the Acorn CCS site has an overall porosity of approximately 14% and a suite of clay minerals dominated by smectite but also including non-radioactive clay minerals such as kaolinite. The Palaeocene Lista Shale at the East Mey CCS site has a higher overall porosity of approximately 16% and a suite of clay minerals dominated by smectite with only minor quantities of non-radioactive clay minerals such as kaolinite. Despite the difference in porosities, the Lista and Rodby Shales have similar permeabilities. Porosity-permeability values for both the Lista and Rodby Shales are typical of silty mudstone to shale lithologies.
- The dominant non-clay mineral in the Rodby Shale is calcite, with more than 50% calcite found in some samples. The calcite is composed of both intact microfossil tests and disseminated calcite patches, typically smaller than approximately 100 μm. In contrast, the dominant non-clay mineral in the Lista Shale is quartz; the Lista contains no calcite. The quartz is present as clay and silt-grade grains, typically smaller than approximately 10 μm but locally present up to 60 to 80 μm.
- Despite the difference in ages and mineralogy, the Rodby and Lista Shale seem to have similar mean pore throat radius values (approximately 18 nm) and have similar splitting tensile strength (approximately 2.5 MPa) and exhibit similar anisotropic values of splitting tensile strength. Conversion of mineral quantities into geomechanical attributes suggests that the Lower Cretaceous Rodby Shales may be less brittle and have a lower Young’s modulus than the Cenozoic Lista Shales.
- Elastic property analysis from wireline log data, here derived only for the Lower Cretaceous shales (as no shear sonic logs were available for the examined Cenozoic wells), reveals that Young’s modulus (rock stiffness) increases with decreasing gamma (lower smectite content) and with decreasing compressional sonic (greater quantity of lower transit time minerals such as calcite). Our work has shown that Young’s modulus may be predictable based on gamma, density logs and compressive sonic logs in wells where shear sonic logs were not collected.
- Four end-member shale types have here been proposed as a function of the reactivity of clay minerals to CO2 (chlorite can potentially dissolve in CO2-rich acidic pore waters) and the reactivity of the non-clay fraction (calcite can also potentially dissolve in CO2-rich acidic waters). The shale types can be classified by their susceptibility to develop fracture permeability, their susceptibility to react with CO2, and their susceptibility to decrease brittleness and increase matrix permeability following reaction with CO2. Based on this novel classification scheme, the Rodby Shale maybe locally reactive to CO2, increasing porosity but decreasing the risk of developing fracture permeability, because the quantity of brittle calcite may be locally reduced. The Lista Shale will be largely inert to CO2 on the basis of its smectite-quartz-dominated mineralogy.
Author Contributions
Funding
Conflicts of Interest
References
- Haszeldine, R.S. Carbon Capture and Storage: How Green Can Black Be? Science 2009, 325, 1647–1652. [Google Scholar] [CrossRef] [PubMed]
- Alcalde, J.; Flude, S.; Wilkinson, M.; Johnson, G.; Edlmann, K.; Bond, C.E.; Scott, V.; Gilfillan, S.M.V.; Ogaya, X.; Haszeldine, R.S. Estimating geological CO2 storage security to deliver on climate mitigation. Nat. Commun. 2018, 9. [Google Scholar] [CrossRef] [PubMed]
- Harding, F.C.; James, A.T.; Robertson, H.E. The engineering challenges of CO2 storage. Proc. Inst. Mech. Eng. Part A J. Power Energy 2018, 232, 17–26. [Google Scholar] [CrossRef] [Green Version]
- Krevor, S.; Blunt, M.J.; Benson, S.M.; Pentland, C.H.; Reynolds, C.; Al-Menhali, A.; Niu, B. Capillary trapping for geologic carbon dioxide storage—From pore scale physics to field scale implications. Int. J. Greenh. Gas Control 2015, 40, 221–237. [Google Scholar] [CrossRef] [Green Version]
- Full Chain Development Plan and Budget; Pale-Blue-Dot-Energy: Banchory, UK, 2018.
- Alcalde, J.; Heinemann, N.; Mabon, L.; Worden, R.H.; Maver, M.; Robertson, H.; Ghanbari, S.; Swennenhuis, F.; Mann, I.; Walker, T.; et al. Developing full-chain industrial carbon capture and storage in a resource- and infrastructure-rich hydrocarbon province. J. Clean. Prod. 2019, 233, 963–971. [Google Scholar] [CrossRef]
- Williams, J.D.O.; Fellgett, M.W.; Quinn, M.F. Carbon dioxide storage in the Captain Sandstone aquifer: Determination of in situ stresses and fault-stability analysis. Pet. Geosci. 2016, 22, 211–222. [Google Scholar] [CrossRef] [Green Version]
- Marshall, J.D.; Tucker, O.D.; Lovelock, C.E. Goldeneye: Modelling a depleted field for carbon capture—How much uncertainty is left? Pet. Geosci. 2016, 22, 37–45. [Google Scholar] [CrossRef]
- ACT Acorn D07 Acorn CO2 Storage Site Development Plan; Pale-Blue-Dot-Energy: Banchory, UK, 2018.
- ACT Acorn D08 East Mey Storage Site Development Plan; Pale-Blue-Dot-Energy: Banchory, UK, 2018.
- Copestake, P.; Sims, A.P.; Crittenden, S.; Hamar, G.P.; Ineson, J.R.; Rose, P.T.; Tringham, M.E. Lower Cretaceous. In The Millenium Atlas: Petroleum Geology of the Central and Northern North Sea; Evans, D., Graham, C., Armour, A., Bathurst, P., Eds.; Geological Society of London: London, UK, 2003; pp. 1211–1248. [Google Scholar]
- Ahmadi, Z.; Sawyers, M.; Kenyon-Roberts, S.; Stanworth, B.; Kugler, K.; Kristensen, J.; Fugelli, E. Paleocene. In The Millenium Atlas: Petroleum Geology of the Central and Northern North Sea; Evans, D., Graham, C., Armour, A., Bathurst, P., Eds.; Geological Society of London: London, UK, 2003; pp. 1411–1449. [Google Scholar]
- Jones, E.; Jones, B.; Ebdon, C.; Ewen, D.; Milner, P.; Plunkett, J.; Hudson, G.; Slater, P. Eocene. In The Millenium Atlas: Petroleum Geology of the Central and Northern North Sea; Evans, D., Graham, C., Armour, A., Bathurst, P., Eds.; Geological Society of London: London, UK, 2003; pp. 1511–1531. [Google Scholar]
- Fyfe, A.; Gregersen, U.; Jordt, H.; Rundberg, Y.; Eidvin, T.; Evans, D.; Stewart, D.; Hovland, M.; Andresen, P. Oligocene to Holocene; Geological Society of London: London, UK, 2003; pp. 1611–1632. [Google Scholar]
- Wickham, H. Ggplot2: Elegant Graphics for Data Analysis; Springer: Cham, Switzerland, 2016; p. 226. [Google Scholar]
- Rider, M.; Kennedy, M.J. The Geological Interpretation of Well Logs; Rider-French Consulting: Cambridge, UK, 2011. [Google Scholar]
- Warren, E.A.; Smalley, P.C. North Sea Formation Water Atlas; Geological Society: London, UK, 1994; Volume 15, p. 208. [Google Scholar]
- Armitage, P.J.; Worden, R.H.; Faulkner, D.R.; Aplin, A.C.; Butcher, A.R.; Iliffe, J. Diagenetic and sedimentary controls on porosity in Lower Carboniferous fine-grained lithologies, Krechba field, Algeria: A petrological study of a caprock to a carbon capture site. Mar. Pet. Geol. 2010, 27, 1395–1410. [Google Scholar] [CrossRef]
- Pirrie, D.; Butcher, A.R.; Power, M.R.; Gottlieb, P.; Miller, G.L. Rapid quantitative mineral and phase analysis using automated scanning electron microscopy (QemSCAN): Potential applications in forensic geoscience. In Forensic Geoscience: Principles, Techniques and Applications; Pye, K., Croft, D.J., Eds.; Geological Society: Bath, UK, 2004; Volume 232, pp. 123–136. [Google Scholar]
- Wooldridge, L.J.; Worden, R.H.; Griffiths, J.; Utley, J.E.P. The origin of clay-coated sand grains and sediment heterogeneity in tidal flats. Sediment. Geol. 2018, 373, 191–209. [Google Scholar] [CrossRef]
- Moore, D.M.; Reynolds, R.C., Jr. X-Ray Diffraction and the Identification and Analysis of Clay Minerals; Oxford University Press: Oxford, UK, 1997; p. 378. [Google Scholar]
- Hillier, S. Accurate quantitative analysis of clay and other minerals in sandstones by XRD: Comparison of a Rietveld and a reference intensity ratio (RIR) method and the importance of sample preparation. Clay Miner. 2000, 35, 291–302. [Google Scholar] [CrossRef]
- Zinszner, B.; Pellerin, F.-M. A Geoscientists Guide to Petrophysics; IFP Publications: Paris, Francis, 2007; p. 384. [Google Scholar]
- Tiab, D.; Donaldson, E.C. Petrophysics, 4th ed.; Elsevier: Amsterdam, The Netherlands, 2015; p. 894. [Google Scholar]
- Heling, D. Micro-fabrics of shales and their rearrangement by compaction. Sedimentology 1970, 17, 247–260. [Google Scholar] [CrossRef]
- Lohr, C.D.; Hackley, P.C. Using mercury injection pressure analyses to estimate sealing capacity of the Tuscaloosa marine shale in Mississippi, USA: Implications for carbon dioxide sequestration. Int. J. Greenh. Gas Control 2018, 78, 375–387. [Google Scholar] [CrossRef]
- Blackbourn, G.A. Cores and Core Logging for Geoscientists; Whittles Publishing: Dunbeath, UK, 2012. [Google Scholar]
- ASTM-D3967-16. Standard Test Method for Splitting Tensile Strength of Intact Rock Core Specimens; STM International: West Conshohocken, PA, USA, 2016.
- Allen, M.J.; Faulkner, D.R.; Worden, R.H.; Rice-Birchall, E.; Katirtsidis, N.; Utley, J.E.P. Geomechanical and petrographic assessment of a CO2 storage site: Application to the Acorn CO2 Storage Site, offshore United Kingdom. Int. J. Greenh. Gas Control 2020, 94, 102923. [Google Scholar] [CrossRef]
- Swanson, B.F. A simple correlation between permeabilities and mercury capillary pressures. J. Pet. Technol. 1981, 33, 2498–2504. [Google Scholar] [CrossRef]
- Salem, A.M.; Shedid, S.A. Variation of petrophysical properties due to carbon dioxide (CO2) storage in carbonate reservoirs. J. Pet. Gas Eng. 2013, 4, 91–102. [Google Scholar] [CrossRef]
- DeReuil, A.A.; Birgenheier, L.P.; McLennan, J. Effects of anisotropy and saturation on geomechanical behavior of mudstone. J. Geophys. Res. Solid Earth 2019, 124, 8101–8126. [Google Scholar] [CrossRef]
- Armitage, P.J.; Faulkner, D.R.; Worden, R.H. Caprock corrosion. Nature Geosci. 2013, 6, 79–80. [Google Scholar] [CrossRef]
- Allen, P.A.; Allen, J.R.L. Basin Analysis: Principles and Applications; Wiley-Blackwell: Chichester, UK, 2013. [Google Scholar]
- Peltonen, C.; Marcussen, O.; Bjørlykke, K.; Jahren, J. Clay mineral diagenesis and quartz cementation in mudstones: The effects of smectite to illite reaction on rock properties. Mar. Pet. Geol. 2009, 26, 887–898. [Google Scholar] [CrossRef]
- Armitage, P.J.; Faulkner, D.R.; Worden, R.H.; Aplin, A.C.; Butcher, A.R.; Iliffe, J. Experimental measurement of, and controls on, permeability and permeability anisotropy of caprocks from the CO2 storage project at the Krechba Field, Algeria. J. Geophys. Res. Solid Earth 2011, 116, B12208. [Google Scholar] [CrossRef]
- Armitage, P.J.; Worden, R.H.; Faulkner, D.R.; Butcher, A.R.; Espie, A.A. Permeability of the Mercia Mudstone: Suitability as caprock to carbon capture and storage sites. Geofluids 2016, 16, 26–42. [Google Scholar] [CrossRef]
- Neufelder, R.J.; Bowen, B.B.; Lahann, R.W.; Rupp, J.A. Lithologic, mineralogical, and petrophysical characteristics of the Eau Claire Formation: Complexities of a carbon storage system seal. Environ. Geosci. 2012, 19, 81–104. [Google Scholar] [CrossRef]
- Armitage, P.J.; Worden, R.H.; Faulkner, D.R.; Aplin, A.C.; Butcher, A.R.; Espie, A.A. Mercia Mudstone Formation caprock to carbon capture and storage sites: Petrology and petrophysical characteristics. J. Geol. Soc. 2013, 170, 119–132. [Google Scholar] [CrossRef]
- Wedepohl, H.K. The composition of the continental crust. Geochim. Cosmochim. Acta 1995, 59, 1217–1232. [Google Scholar] [CrossRef]
- Baines, S.J.; Worden, R.H. The long term fate of CO2 in the subsurface: Natural analogues for CO2 storage. In Geological Storage of Carbon Dioxide. Special Publication; Baines, S.J., Worden, R.H., Eds.; The Geological Society: London, UK, 2004; Volume 233, pp. 59–85. [Google Scholar]
- Baines, S.J.; Worden, R.H. Geological storage of carbon dioxide. In Geological Storage of Carbon Dioxide. Special Publication; Baines, S.J., Worden, R.H., Eds.; Geological Society: London, UK, 2004; Volume 233, pp. 1–6. [Google Scholar]
- Worden, R.H.; Smith, L.K. Geological sequestration of CO2 in the subsurface: Lessons from CO2 injection enhanced oil recovery projects in oilfields. In Geological Storage of Carbon Dioxide. Special Publication; Baines, S.J., Worden, R.H., Eds.; Geological Society: London, UK, 2004; Volume 233, pp. 211–224. [Google Scholar]
- Worden, R.H.; Morrall, G.; Kelly, S.; Mc Ardle, P.; Barshep, D.V. A renewed look at calcite cement in marine-deltaic sandstones: The Brent Reservoir, Heather Field, Northern North Sea, UK. In Application of Analytical Techniques to Petroleum Systems. Special Publication; Dowey, P.J., Osborne, M.J., Volk, H., Eds.; Geological Society: London, UK, 2019; Volume 484. [Google Scholar]
- Daniel, R.F.; Kaldi, J.G. Evaluating seal capacity of caprocks and intraformational barriers for CO2 containment. In Carbon Dioxide Sequestration in Geological Media-State of the Science: AAPG Studies in Geology; Grobe, M., Pashin, J.C., Dodge, R.L., Eds.; American Association of Petroleum Geologists: Tulsa, OK, USA, 2009; Volume 59, pp. 335–345. [Google Scholar]
- Kaldi, J.G.; Daniel, R.F.; Tenthorey, E.; Michael, K.; Schacht, U.; Nicol, A.; Underschultz, J.R.; Backe, G. Containment of CO2 in CCS: Role of Caprocks and Faults. Energy Procedia. 2013, 37, 5403–5410. [Google Scholar] [CrossRef]
- Dewhurst, D.N.; Jones, R.M.; Raven, M.D. Microstructural and petrophysical characterization of Muderong Shale: Application to top seal risking. Pet. Geosci. 2002, 8, 371–383. [Google Scholar] [CrossRef]
- Rybacki, E.; Reinicke, A.; Meier, T.; Makasi, M.; Dresen, G. What controls the mechanical properties of shale rocks?—Part I: Strength and Young’s modulus. J. Pet. Sci. Eng. 2015, 135, 702–722. [Google Scholar] [CrossRef]
- Rybacki, E.; Meier, T.; Dresen, G. What controls the mechanical properties of shale rocks?—Part II: Brittleness. J. Pet. Sci. Eng. 2016, 144, 39–58. [Google Scholar] [CrossRef] [Green Version]
- Jin, X.C.; Shah, S.N.; Roegiers, J.C.; Zhang, B. An integrated petrophysics and geomechanics approach for fracability evaluation in shale reservoirs. SPE J. 2015, 20, 518–526. [Google Scholar] [CrossRef]
- Hutcheon, I.; Shevalier, M.; Abercrombie, H.J. pH buffering by metastable mineral-fluid equilibria and evolution of carbon dioxide fugacity during burial diagenesis. Geochim. Cosmochim. Acta 1993, 57, 1017–1027. [Google Scholar] [CrossRef]
- Deer, W.A.; Howie, R.A.; Zussman, J. An Introduction to the Rock-Forming Minerals, 3rd ed.; The Mineralogical Society: London, UK, 2013; p. 498. [Google Scholar]
- Worden, R.H.; Griffiths, J.; Wooldridge, L.J.; Utley, J.E.P.; Lawan, A.Y.; Muhammed, D.D.; Simon, N.; Armitage, P.J. Chlorite in sandstones. Earth Sci. Rev. 2020, 204, 103105. [Google Scholar] [CrossRef]


| CCS Site | Log | Caliper | Spontaneous Potential | Gamma | Density | Near and Far RHOB Detector Difference | Sonic-Compressional | Sonic-Shear | Neutron | Spectral Gamma | Deep Resistivity |
|---|---|---|---|---|---|---|---|---|---|---|---|
| CAL | SP | GR | RHOB | DRHO | DTCO | DTS | NPHI | SGR | RD | ||
| Units | Inches | mV | API Units | g/cm3 | g/cm3 | us/ft | us/ft | % | ppm or % | ohm.m | |
| Lower Cretaceous Acorn CCS site | 14/26-1 | ✓ | ✓ | ✓ | ✓ | ✓ | ✓ | ✕ | ✓ | ✕ | ✓ |
| 14/26a-7A | ✓ | ✓ | ✓ | ✓ | ✓ | ✓ | ✓ | ✓ | ✓ | ✓ | |
| 14/26a-8 | ✓ | ✓ | ✓ | ✓ | ✕ | ✓ | ✓ | ✓ | ✓ | ✓ | |
| Palaeocene East Met CCS site | 16/21-13 | ✓ | ✕ | ✓ | ✓ | ✕ | ✓ | ✕ | ✕ | ✕ | ✓ |
| 16/21-20 | ✓ | ✕ | ✓ | ✓ | ✓ | ✓ | ✕ | ✓ | ✓ | ✓ |
| Well | Depth (ft) | Lithology | Mean Pore Throat Size (mm) | Log of Mean Pore Throat Size (mm) | Porosity (%) | Tortuosity | Derived Permeability (mD) | Hg-air Capillary Entry Pressure (psia) | Max CO2 Column Height (m) for 115° b-c Contact Angle | Max CO2 Column Height (m) for 110° b-c Contact Angle |
|---|---|---|---|---|---|---|---|---|---|---|
| 16/21a-13 | 6975.00 | Lista Shale | 0.0151 | −1.8210 | 15.01 | 3168 | 0.0002 | 10,044 | 395 | 320 |
| 16/21a-13 | 6981.00 | Lista Shale | 0.0141 | −1.8517 | 15.72 | 1308 | 0.0002 | 11,409 | 449 | 363 |
| 16/21a-13 | 6991.00 | Lista Shale | 0.0235 | −1.6284 | 14.15 | 2235 | 0.0006 | 4215 | 166 | 134 |
| 16/21a-13 | 7001.00 | Lista Shale | 0.0146 | −1.8345 | 15.75 | 1431 | 0.0002 | 10,911 | 430 | 348 |
| 16/21a-13 | 7005.00 | Lista Shale | 0.0147 | −1.8315 | 16.33 | 3974 | 0.0002 | 10,007 | 394 | 319 |
| 16/21a-13 | 7008.00 | Lista Shale | 0.0175 | −1.7580 | 17.02 | 2806 | 0.0004 | 8012 | 315 | 255 |
| 16/21a-13 | 7015.00 | Lista Shale | 0.0137 | −1.8639 | 16.25 | 3992 | 0.0002 | 11,968 | 471 | 381 |
| 16/21a-13 | 7024.60 | Lista Shale | 0.0138 | −1.8608 | 15.45 | 876 | 0.0001 | 11,750 | 463 | 374 |
| 14/26a-8 | 6393.10 | Rodby Shale | 0.0149 | −1.8256 | 13.43 | 2692 | 0.0002 | 11,418 | 450 | 364 |
| 14/26a-8 | 6396.00 | Rodby Shale | 0.0209 | −1.6792 | 14.03 | 3289 | 0.0003 | 7669 | 302 | 244 |
| 14/26a-8 | 6417.00 | Rodby Shale | 0.0180 | −1.7445 | 14.29 | 4530 | 0.0002 | 9166 | 361 | 292 |
| 14/26a-8 | 6420.00 | Rodby Shale | 0.0114 | −1.9427 | 13.41 | 2174 | 0.0001 | 14,800 | 583 | 472 |
| 14/26a-7A | 6492.50 | Rodby Shale | 0.0158 | −1.8002 | 13.15 | 2739 | 0.0002 | 10,666 | 420 | 340 |
| 14/26a-7A | 6494.50 | Rodby Shale | 0.0168 | −1.7755 | 13.31 | 5430 | 0.0002 | 10,565 | 416 | 337 |
| 14/26a-7A | 6512.20 | Rodby Shale | 0.0199 | −1.7014 | 13.70 | 2438 | 0.0003 | 7967 | 314 | 254 |
| 14/26a-7A | 6513.00 | Rodby Shale | 0.0187 | −1.7286 | 14.67 | 3269 | 0.0003 | 8169 | 322 | 260 |
| Site | Well | Depth (ft) | Lithology | Test Orientation | STS (MPa) | Site | Well | Depth (ft) | Lithology | Test Orientation | STS (MPa) |
|---|---|---|---|---|---|---|---|---|---|---|---|
| Acorn | 14/26a-7A | 6497.00 | Rodby | H—Horizontal | 2.76 | East Mey | 16/21a-13 | 6991.00 | Lista | H—Horizontal | 1.89 |
| Acorn | 14/26a-7A | 6497.00 | Rodby | H—Horizontal | 2.52 | East Mey | 16/21a-13 | 6991.00 | Lista | H—Horizontal | 2.06 |
| Acorn | 14/26a-7A | 6497.00 | Rodby | H—Horizontal | 1.15 | East Mey | 16/21a-13 | 6991.00 | Lista | H—Horizontal | 2.70 |
| Acorn | 14/26a-7A | 6497.00 | Rodby | P—Parallel | 1.13 | East Mey | 16/21a-13 | 6991.00 | Lista | H—Horizontal | 2.11 |
| Acorn | 14/26a-7A | 6497.00 | Rodby | P—Parallel | 1.31 | East Mey | 16/21a-13 | 6991.00 | Lista | H—Horizontal | 2.37 |
| Acorn | 14/26a-7A | 6515.50 | Rodby | H—Horizontal | 2.75 | East Mey | 16/21a-13 | 6991.00 | Lista | H—Horizontal | 2.07 |
| Acorn | 14/26a-7A | 6515.50 | Rodby | H—Horizontal | 1.55 | East Mey | 16/21a-13 | 6991.00 | Lista | H—Horizontal | 3.05 |
| Acorn | 14/26a-7A | 6515.50 | Rodby | H—Horizontal | 3.07 | East Mey | 16/21a-13 | 6991.00 | Lista | H—Horizontal | 2.54 |
| Acorn | 14/26a-7A | 6515.50 | Rodby | V—Vertical | 0.38 | East Mey | 16/21a-13 | 6991.00 | Lista | H—Horizontal | 2.20 |
| Acorn | 14/26a-8 | 6402.50 | Rodby | H—Horizontal | 2.65 | East Mey | 16/21a-13 | 6991.00 | Lista | P—Parallel | 3.00 |
| Acorn | 14/26a-8 | 6402.50 | Rodby | H—Horizontal | 2.35 | East Mey | 16/21a-13 | 6991.00 | Lista | P—Parallel | 2.00 |
| Acorn | 14/26a-8 | 6402.50 | Rodby | H—Horizontal | 2.71 | East Mey | 16/21a-13 | 6991.00 | Lista | P—Parallel | 2.64 |
| Acorn | 14/26a-8 | 6402.50 | Rodby | V—Vertical | 0.09 | East Mey | 16/21a-13 | 6991.00 | Lista | P—Parallel | 2.94 |
| East Mey | 16/21a-13 | 6981.00 | Lista | H—Horizontal | 3.05 | East Mey | 16/21a-13 | 6991.00 | Lista | P—Parallel | 2.14 |
| East Mey | 16/21a-13 | 6981.00 | Lista | H—Horizontal | 3.94 | East Mey | 16/21a-13 | 6991.00 | Lista | V—Vertical | 0.60 |
| East Mey | 16/21a-13 | 6981.00 | Lista | V—Vertical | 0.49 | East Mey | 16/21a-13 | 6991.00 | Lista | V—Vertical | 1.34 |
| East Mey | 16/21a-13 | 6981.00 | Lista | P—Parallel | 1.37 | East Mey | 16/21a-13 | 6991.00 | Lista | V—Vertical | 0.80 |
| East Mey | 16/21a-13 | 6981.00 | Lista | P—Parallel | 1.32 | East Mey | 16/21a-13 | 6991.00 | Lista | V—Vertical | 1.57 |
| East Mey | 16/21a-13 | 6991.00 | Lista | H—Horizontal | 2.37 | East Mey | 16/21a-13 | 6991.00 | Lista | V—Vertical | 0.94 |
| East Mey | 16/21a-13 | 6991.00 | Lista | H—Horizontal | 1.83 | East Mey | 16/21a-13 | 6991.00 | Lista | V—Vertical | 1.29 |
| East Mey | 16/21a-13 | 6991.00 | Lista | H—Horizontal | 1.94 | East Mey | 16/21a-13 | 7008.00 | Lista | H—Horizontal | 2.54 |
© 2020 by the authors. Licensee MDPI, Basel, Switzerland. This article is an open access article distributed under the terms and conditions of the Creative Commons Attribution (CC BY) license (http://creativecommons.org/licenses/by/4.0/).
Share and Cite
Worden, R.H.; Allen, M.J.; Faulkner, D.R.; Utley, J.E.P.; Bond, C.E.; Alcalde, J.; Heinemann, N.; Haszeldine, R.S.; Mackay, E.; Ghanbari, S. Lower Cretaceous Rodby and Palaeocene Lista Shales: Characterisation and Comparison of Top-Seal Mudstones at Two Planned CCS Sites, Offshore UK. Minerals 2020, 10, 691. https://doi.org/10.3390/min10080691
Worden RH, Allen MJ, Faulkner DR, Utley JEP, Bond CE, Alcalde J, Heinemann N, Haszeldine RS, Mackay E, Ghanbari S. Lower Cretaceous Rodby and Palaeocene Lista Shales: Characterisation and Comparison of Top-Seal Mudstones at Two Planned CCS Sites, Offshore UK. Minerals. 2020; 10(8):691. https://doi.org/10.3390/min10080691
Chicago/Turabian StyleWorden, Richard H., Michael J. Allen, Daniel R. Faulkner, James E. P. Utley, Clare E. Bond, Juan Alcalde, Niklas Heinemann, R. Stuart Haszeldine, Eric Mackay, and Saeed Ghanbari. 2020. "Lower Cretaceous Rodby and Palaeocene Lista Shales: Characterisation and Comparison of Top-Seal Mudstones at Two Planned CCS Sites, Offshore UK" Minerals 10, no. 8: 691. https://doi.org/10.3390/min10080691