Article

Temperature Dependence and Anisotropic Effects in the Thermal Properties of Hen Egg-White Lysozyme Crystals

1
Institute of Frontier Science and Technology, Okayama University of Science, 1-1 Ridai-cho, Okayama 700-0005, Japan
2
Department of Mechanical Engineering, National Institute of Technology, Akashi College, 679-3 Nishioka, Uozumi-cho, Akashi, Hyogo 674-8501, Japan
3
Center for Advanced High Magnetic Field Science, Graduate School of Science, Osaka University, Machikaneyama, Toyonaka, Osaka 560-0043, Japan
4
Cell Function Lab., Graduate School of Science, Osaka City University, 3-3-138 Sugimoto Sumiyoshi-ku, Osaka 558-8585, Japan
*
Author to whom correspondence should be addressed.
Symmetry 2020, 12(8), 1279; https://doi.org/10.3390/sym12081279
Submission received: 17 June 2020 / Revised: 24 July 2020 / Accepted: 24 July 2020 / Published: 2 August 2020

Abstract

:
We measured the thermal conductivity (λ) and thermal diffusivity (α) of tetragonal hen egg-white lysozyme (HEWL) crystals by the transient short-hot wire method. The crystals were grown by two different methods: Magnetically levitated crystals were realized with a superconducting magnet, the c-axis of which was perpendicularly orientated in the direction of the wire, and naturally grown crystals realized by the two-liquid method, grown randomly. We confirmed the temperature dependence in both the λ and α properties by measuring the variations in temperature and by statistical analysis. These properties differed slightly depending on the presence or absence of a magnetic field applied during the crystal growth. We hypothesize that the difference originated from the orientation of the crystals caused by the magnetic field. The statistical analyses demonstrated the possibility that asymmetric thermal conduction in the protein crystals provides anisotropic effects of the thermal properties.

1. Introduction

Biophysical researchers know from experience that the appropriate temperature control is one of the most dominant factors in realizing high-quality protein crystals. Thermophysical researchers are confident that the thermal control should be an approach in considering the crystallization process as a heat and mass transfer phenomena. We believe that the thermal properties of protein crystals would advance the understanding of crystal growth as a heat and mass transfer phenomena, and could provide guidance for engineered protein crystal applications. Unfortunately, most of the thermal properties of protein crystals have long remained unknown. This is attributed to various practical difficulties in the measurement of the crystals, which are characterized by smallness, fragility, and delicacy.
We recently succeeded in measuring the thermal conductivity λ (W/(mK)) and thermal diffusivity α (m2/s) of hen egg-white lysozyme (HEWL) crystals [1,2]. A key to this success is that we jointly utilized the transient short-hot wire method [3,4,5,6] and the technique of magneto-Archimedes levitation [7,8]. The thermal properties of λ and α can quantitatively clarify which of the crystals and the solution play a major role in the process of heat transfer at the solid-fluid interface of the crystals. The measurement of λ and α has the potential to open up new technologies for quality protein crystallization. In actuality, however, the magneto-Archimedes levitation requires the large apparatus of a superconducting magnet. In this paper, HEWL was crystallized not only by the trustworthy method of magnetic levitation, but also by a simpler two-liquid method. Here, we present the temperature dependencies of λ and α of HEWL crystals, and statistically analyze both results. We will refer to the effect of magnetic field on the thermal properties.

2. Equipment

2.1. Research Strategy

Protein crystallization has been conventionally carried out, in many cases, by the hanging-drop method or the sitting drop method, where the solution volume is only a few µL. Only small-sized crystals can be grown by these methods, and they are unsuitable for measurement by the transient short-hot wire method. Therefore, we adopted the batch method to produce large tetragonal HEWL crystals.
In order to grow the tetragonal HEWL crystals in the vicinity of the wire, we used two different methods: The magneto-Archimedes effect and the two-liquid method. The magneto-Archimedes effect [8] is a trustworthy method, and realizes a containerless condition [9,10,11,12,13,14]. Owing to the repulsive force between the HEWL crystals (diamagnetic subject) and the paramagnetic protein solution, the crystals levitate to the air-liquid interface of the solution, and grow with the crystal’s c-axis coinciding with the direction of magnetic field. These crystals shall be labeled as magnetically levitated crystals (MLC) in this paper. By precisely positioning the wire to the liquid-air or liquid-liquid interface, the MLC includes the wire into the crystals. This method is superior in the reproducibility of measurement. More detailed information about this method has been presented elsewhere [8,15].
In the other method, naturally grown crystals (NGC) were realized by the two-liquid method [16,17], which does not use a superconducting magnet. The principal of this method is very simple, only requiring the mounting of the lighter density of a protein solution on a higher density solution. The crystals grow randomly between the interface of the solutions. All that is needed is how to fix the wire in the vicinity of the interface. The experimental conditions of the MLC and NGC in the present study were the same, except for the application of the magnetic field.

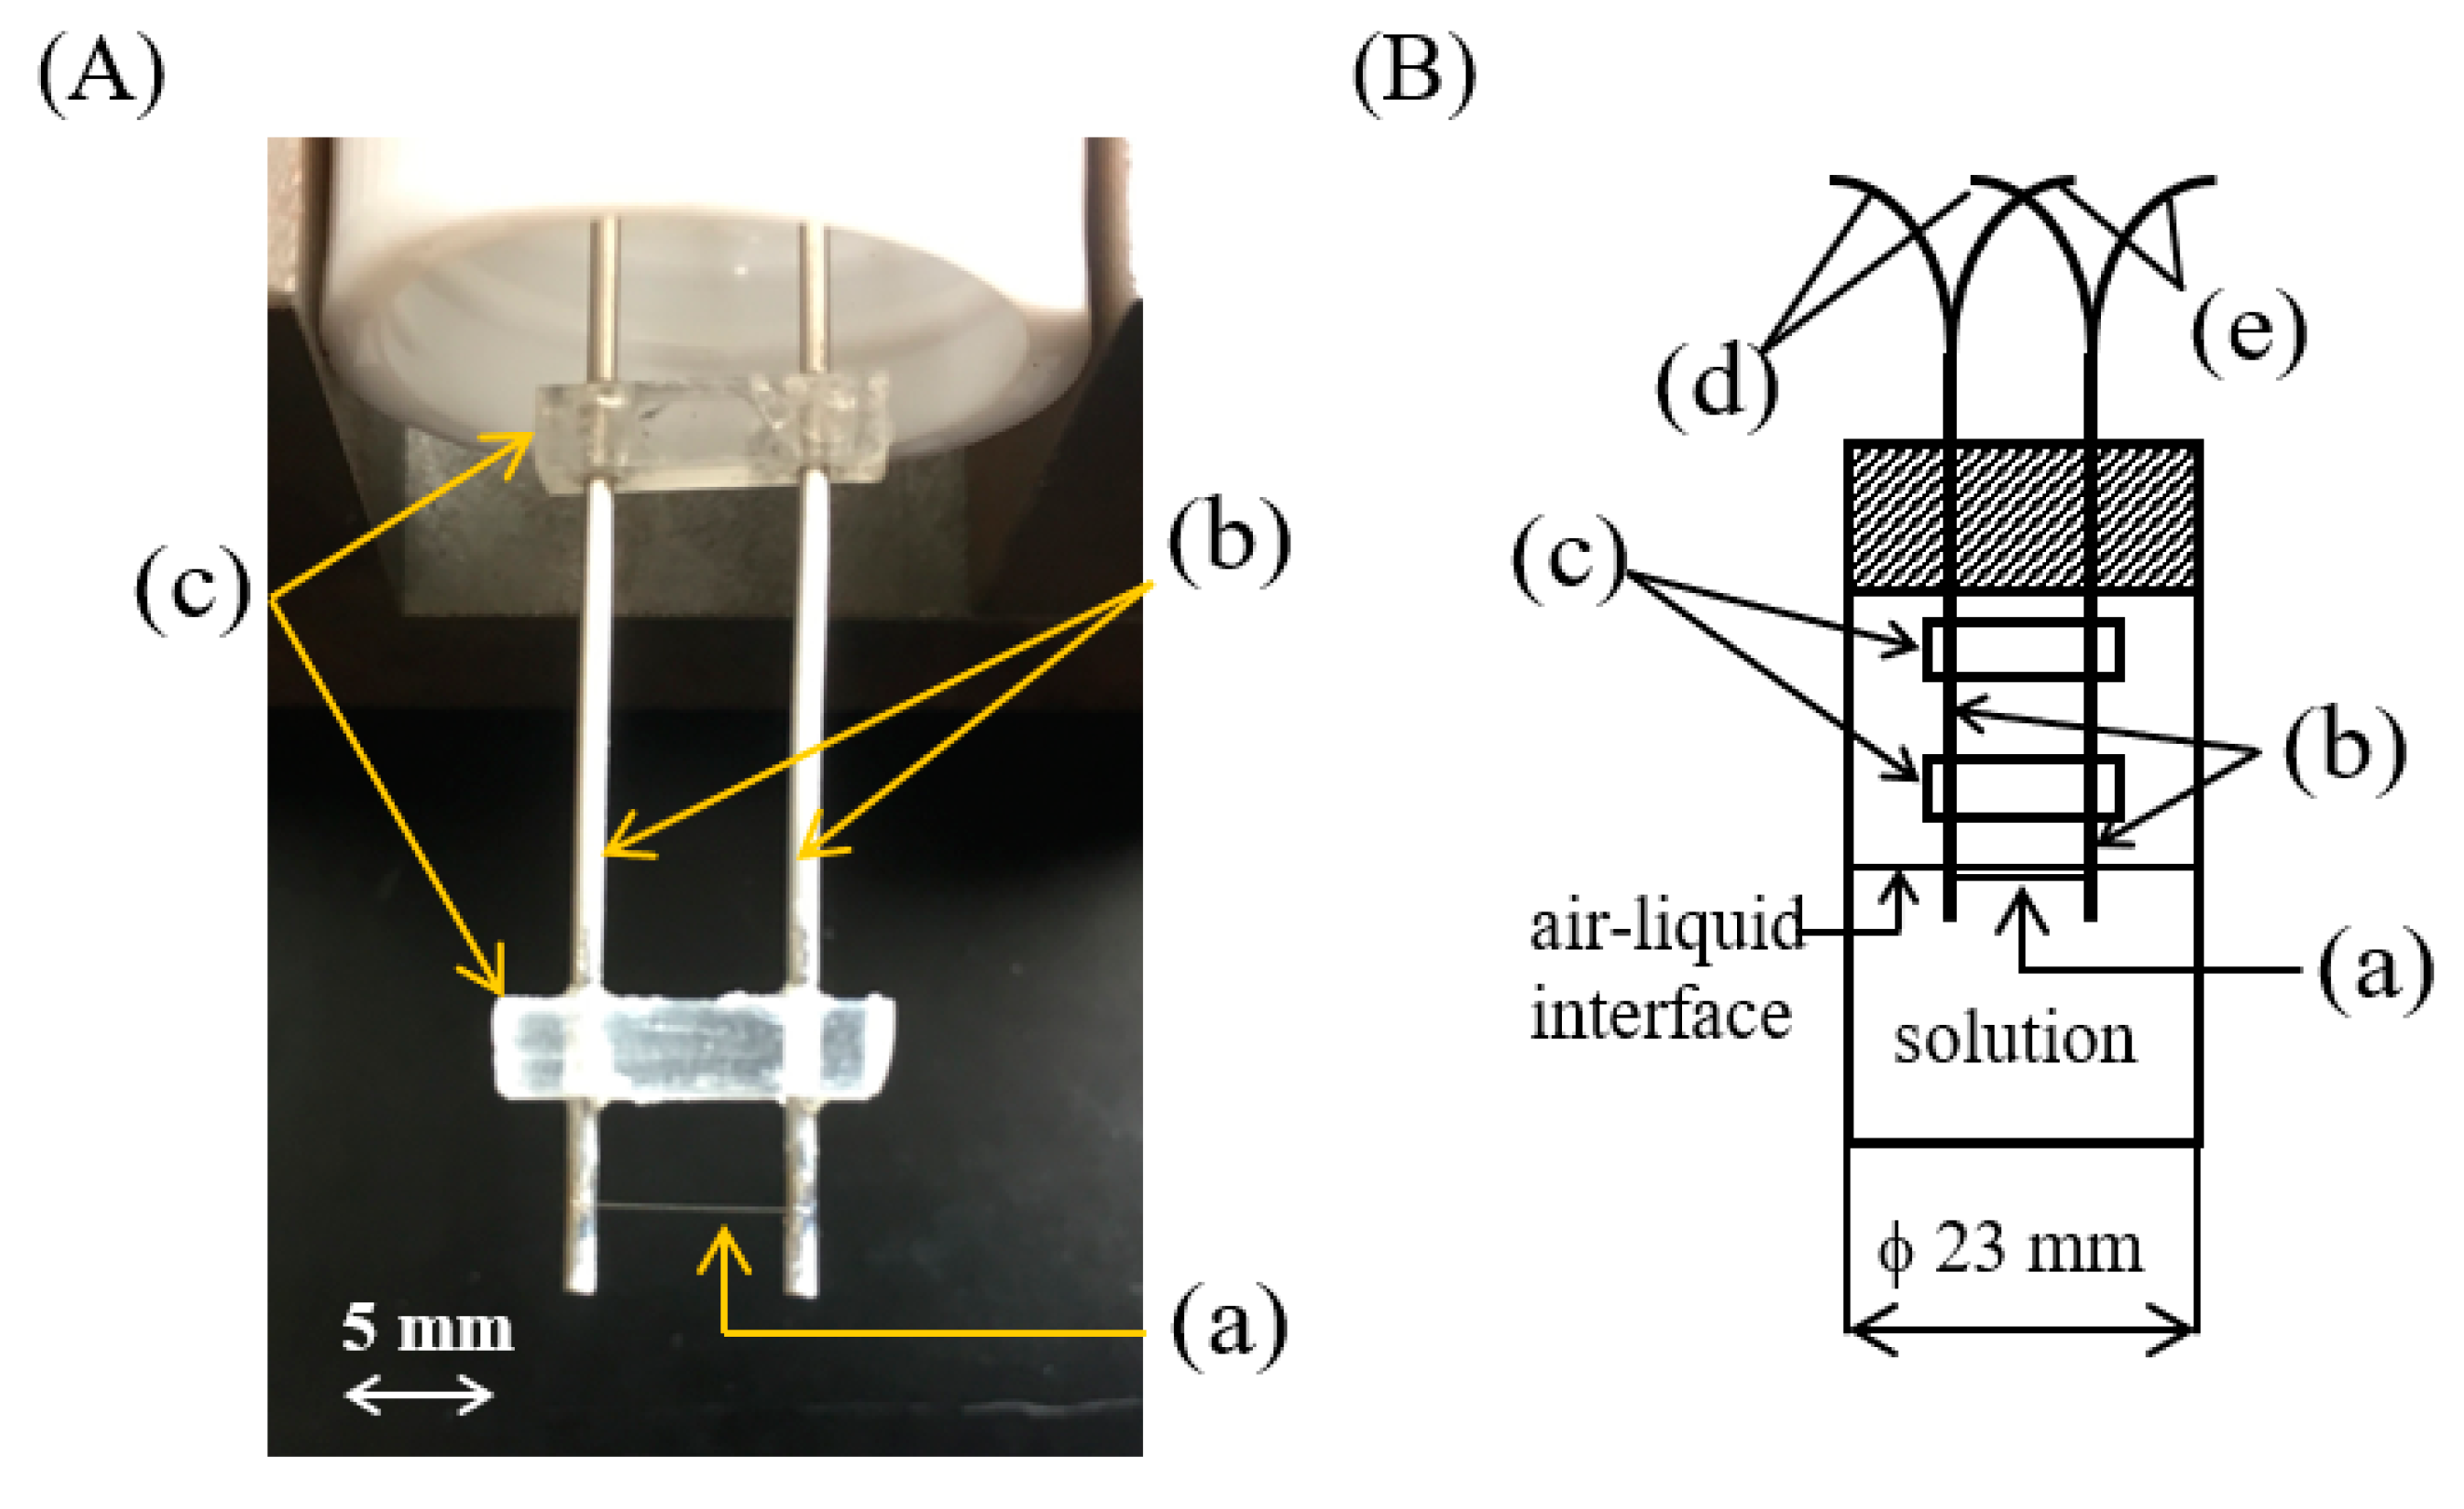
2.2. Transient Short-Hot Wire Probe

In previous studies [1,2], the probe was made of tungsten (W), but the W probe was so fragile that long-time use in measuring was almost impossible. In this study, the probe was made of platinum (Pt). Figure 1A is a photo of the new transient short-hot wire probe made of Pt. Figure 1B shows a schematic illustration of this probe. The diameter and the length of the Pt wire (a) were 41.4 µm and 7.1 mm, respectively. The diameter of the lead terminals was 1.0 mm. Both the short-hot wire and the lead terminals were made of the same Pt material; as a consequence, this prevents thermoelectric noise signals at the connection between the wire and the terminals from heating the short-hot wire during the measurement. The wire was horizontally fixed to the terminals (b), and the terminals were fastened with acrylic jigs (c). The responses of the current (d) and the voltage (e) were detected with high sensitivity.

2.3. A New Vessel for the Two-Liquid Method

Figure 2A is a photo of the crystallization vessel that was newly developed for the two-liquid method. Figure 2B shows the schematic illustration of the vessel. The inert solvent of fluorinert (FC-3283, 3M Japan, Co. Ltd., Tokyo, Japan.), with a density of 1830 kg/m3 at 298 K, was placed under the protein solution. The remarkable aspect of this vessel is that the level of the interface is adjustable by compressing a piston syringe connected to the vessel bottom. Owing to this system, the wire was completely buried into the crystals. The diameter and the length of the wire were 50 µm and 7.5 mm, respectively.

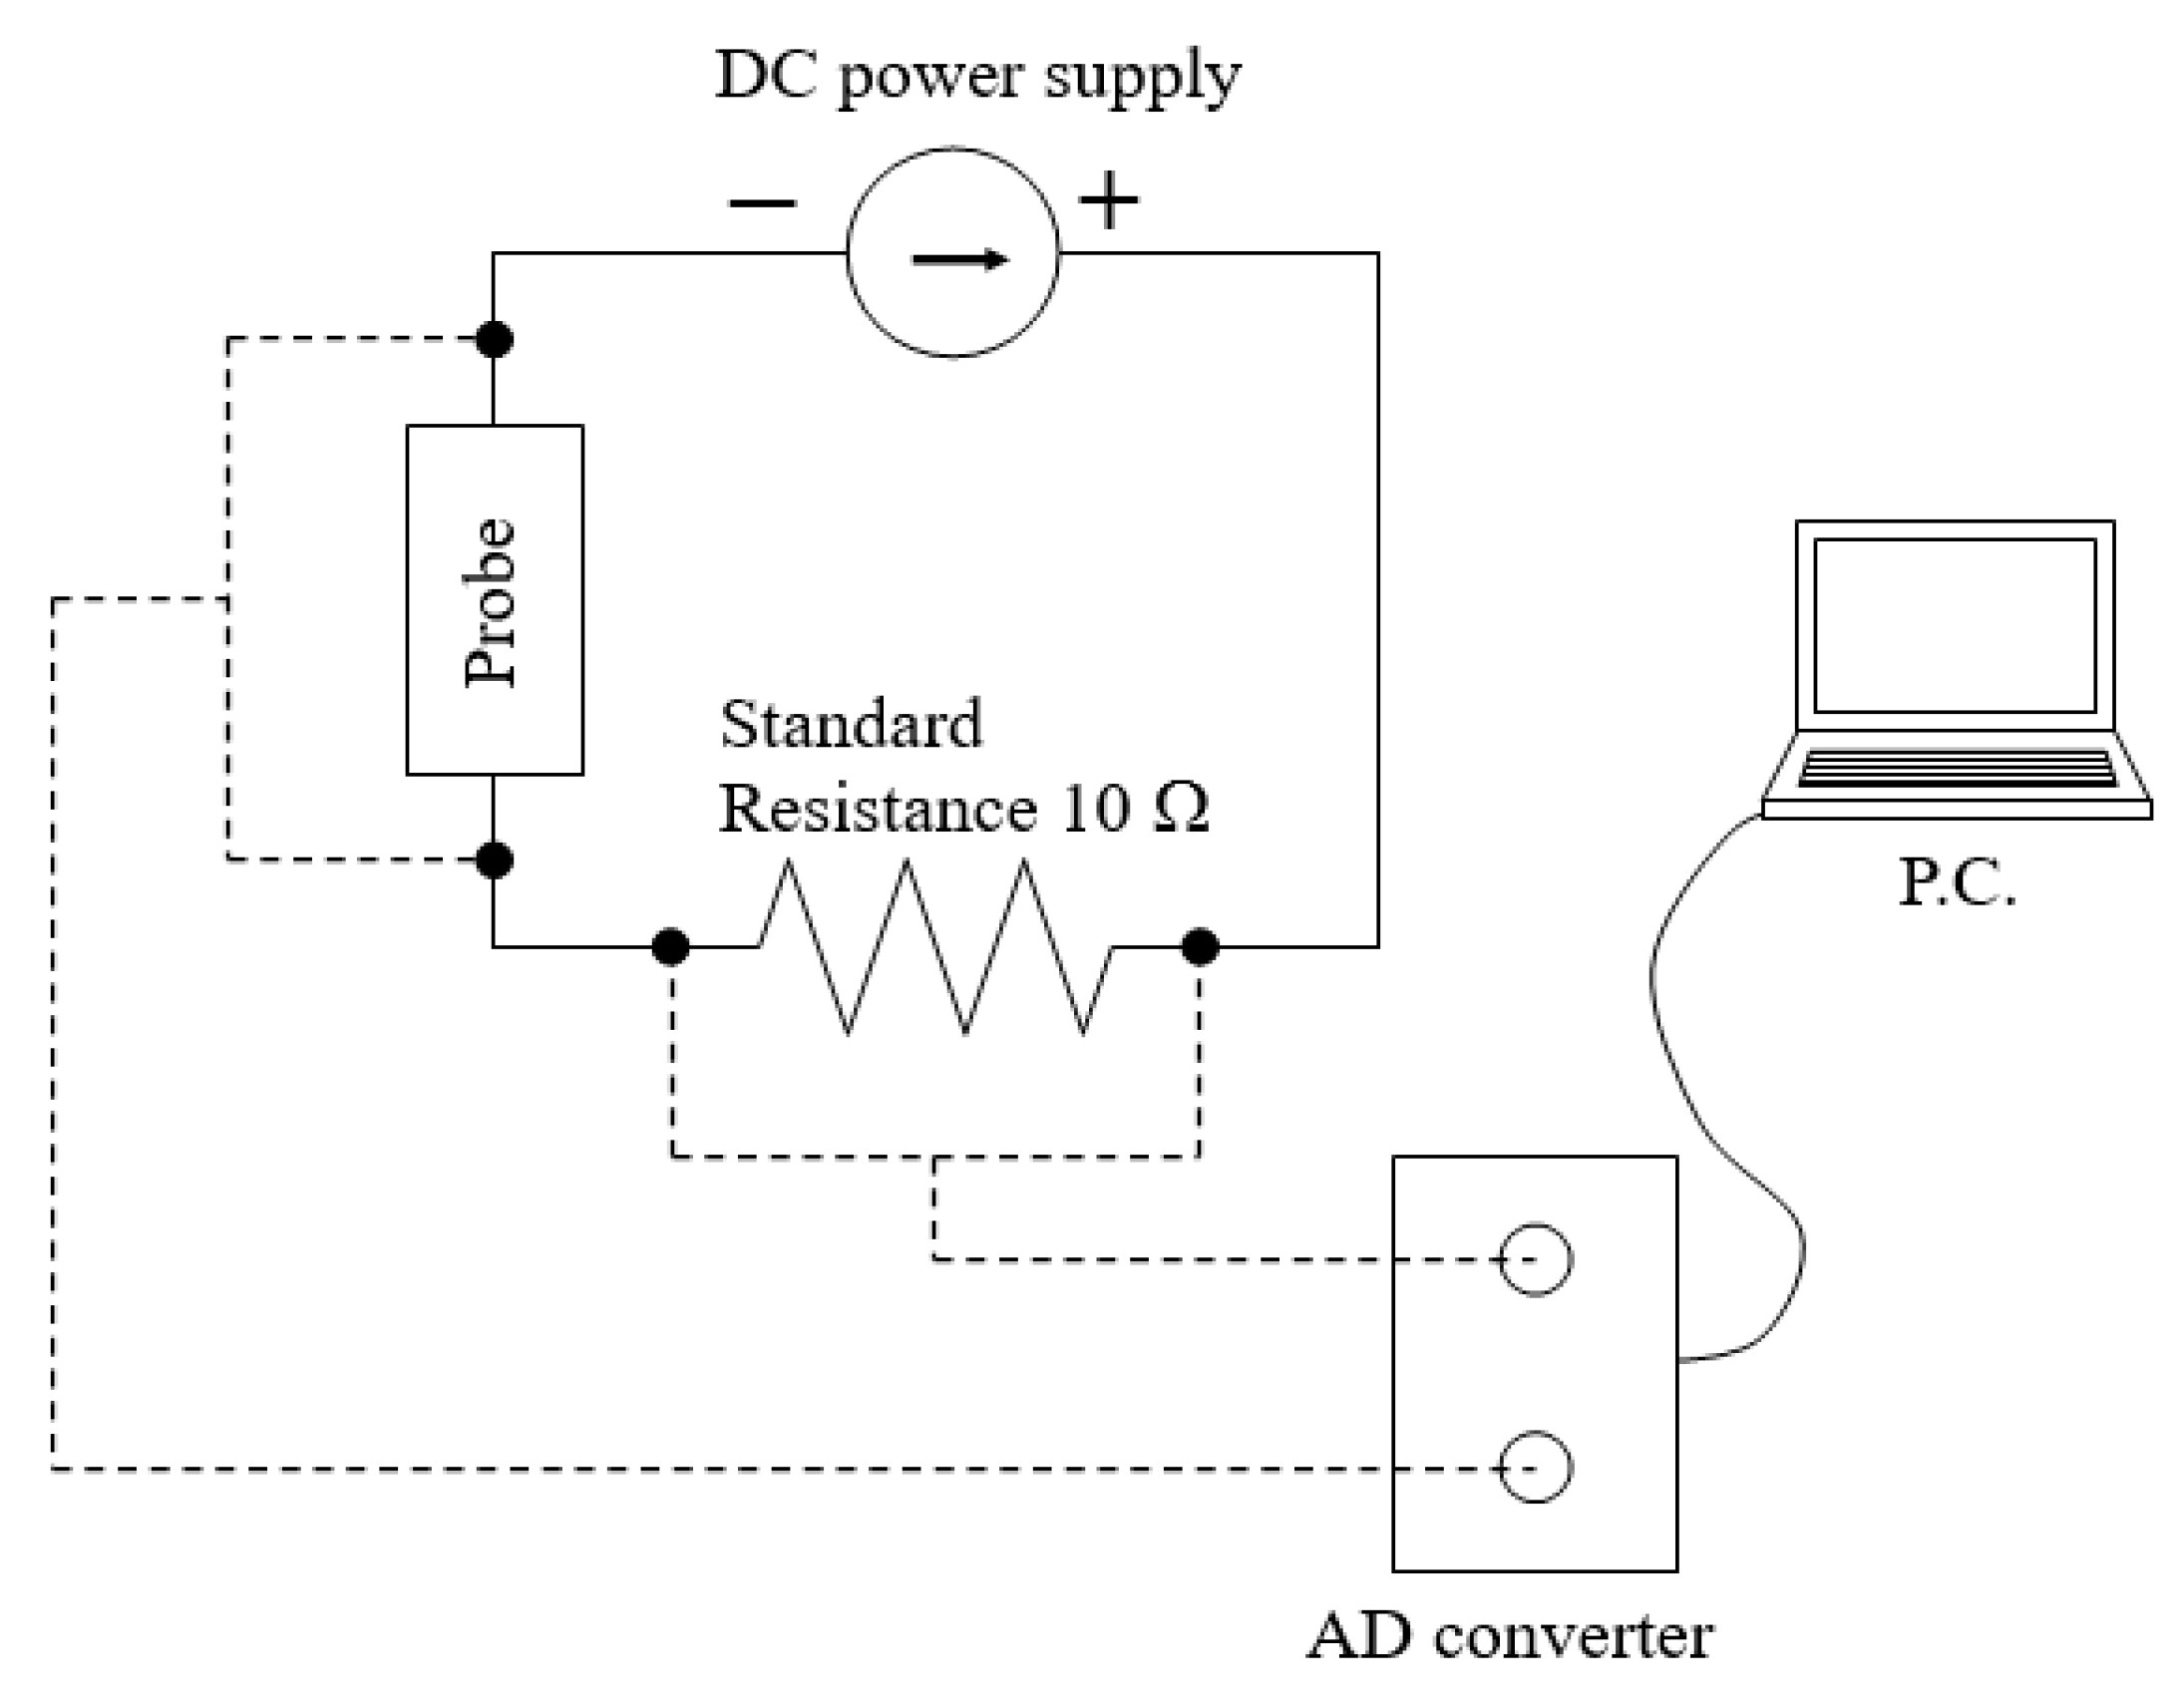
2.4. Electric Circuit System

Figure 3 shows a schematic illustration of the electric circuit system. The use of a new AD converter (USB-2408, Measurement Computing Co. Ltd., USA, (Japanese domestic agency is NT techno Commerce Co., Ltd., Yokohama, Japan)) made it simpler to control the operation of the electric heating wire than in the previous system. We also designed an automatic measurement system with the equipment, e.g., a DC power supply (6240B, ADCMT Co. Ltd., Saitama, Japan), and standard resistance (10 Ω, Yokogawa Test & Measurement Co. Ltd., Tokyo, Japan). These improvements enabled an excellent performance for long-term use.

2.5. Crystallization Conditions

Gadolinium chloride hexahydrate (GdCl3 6H2O, Wako Co. Ltd., Osaka, Japan) was used as a precipitant agent to make the protein solution paramagnetic. The concentrations of the GdCl3 and HEWL (MP Biomedicals, Inc., USA, (Japanese domestic agency is Yashima Pure Chemicals Co., Ltd., Osaka, Japan))) were 0.362 mol/kg and 6.53 wt%, respectively. The pH of the solution was adjusted to 3.30. These conditions were optimized so that both the magneto-Archimedes levitation and tetragonal HEWL crystallization could be simultaneously realized at 293 K. The binding site of the gadolinium atom in the lysozyme crystals has been clarified [18].

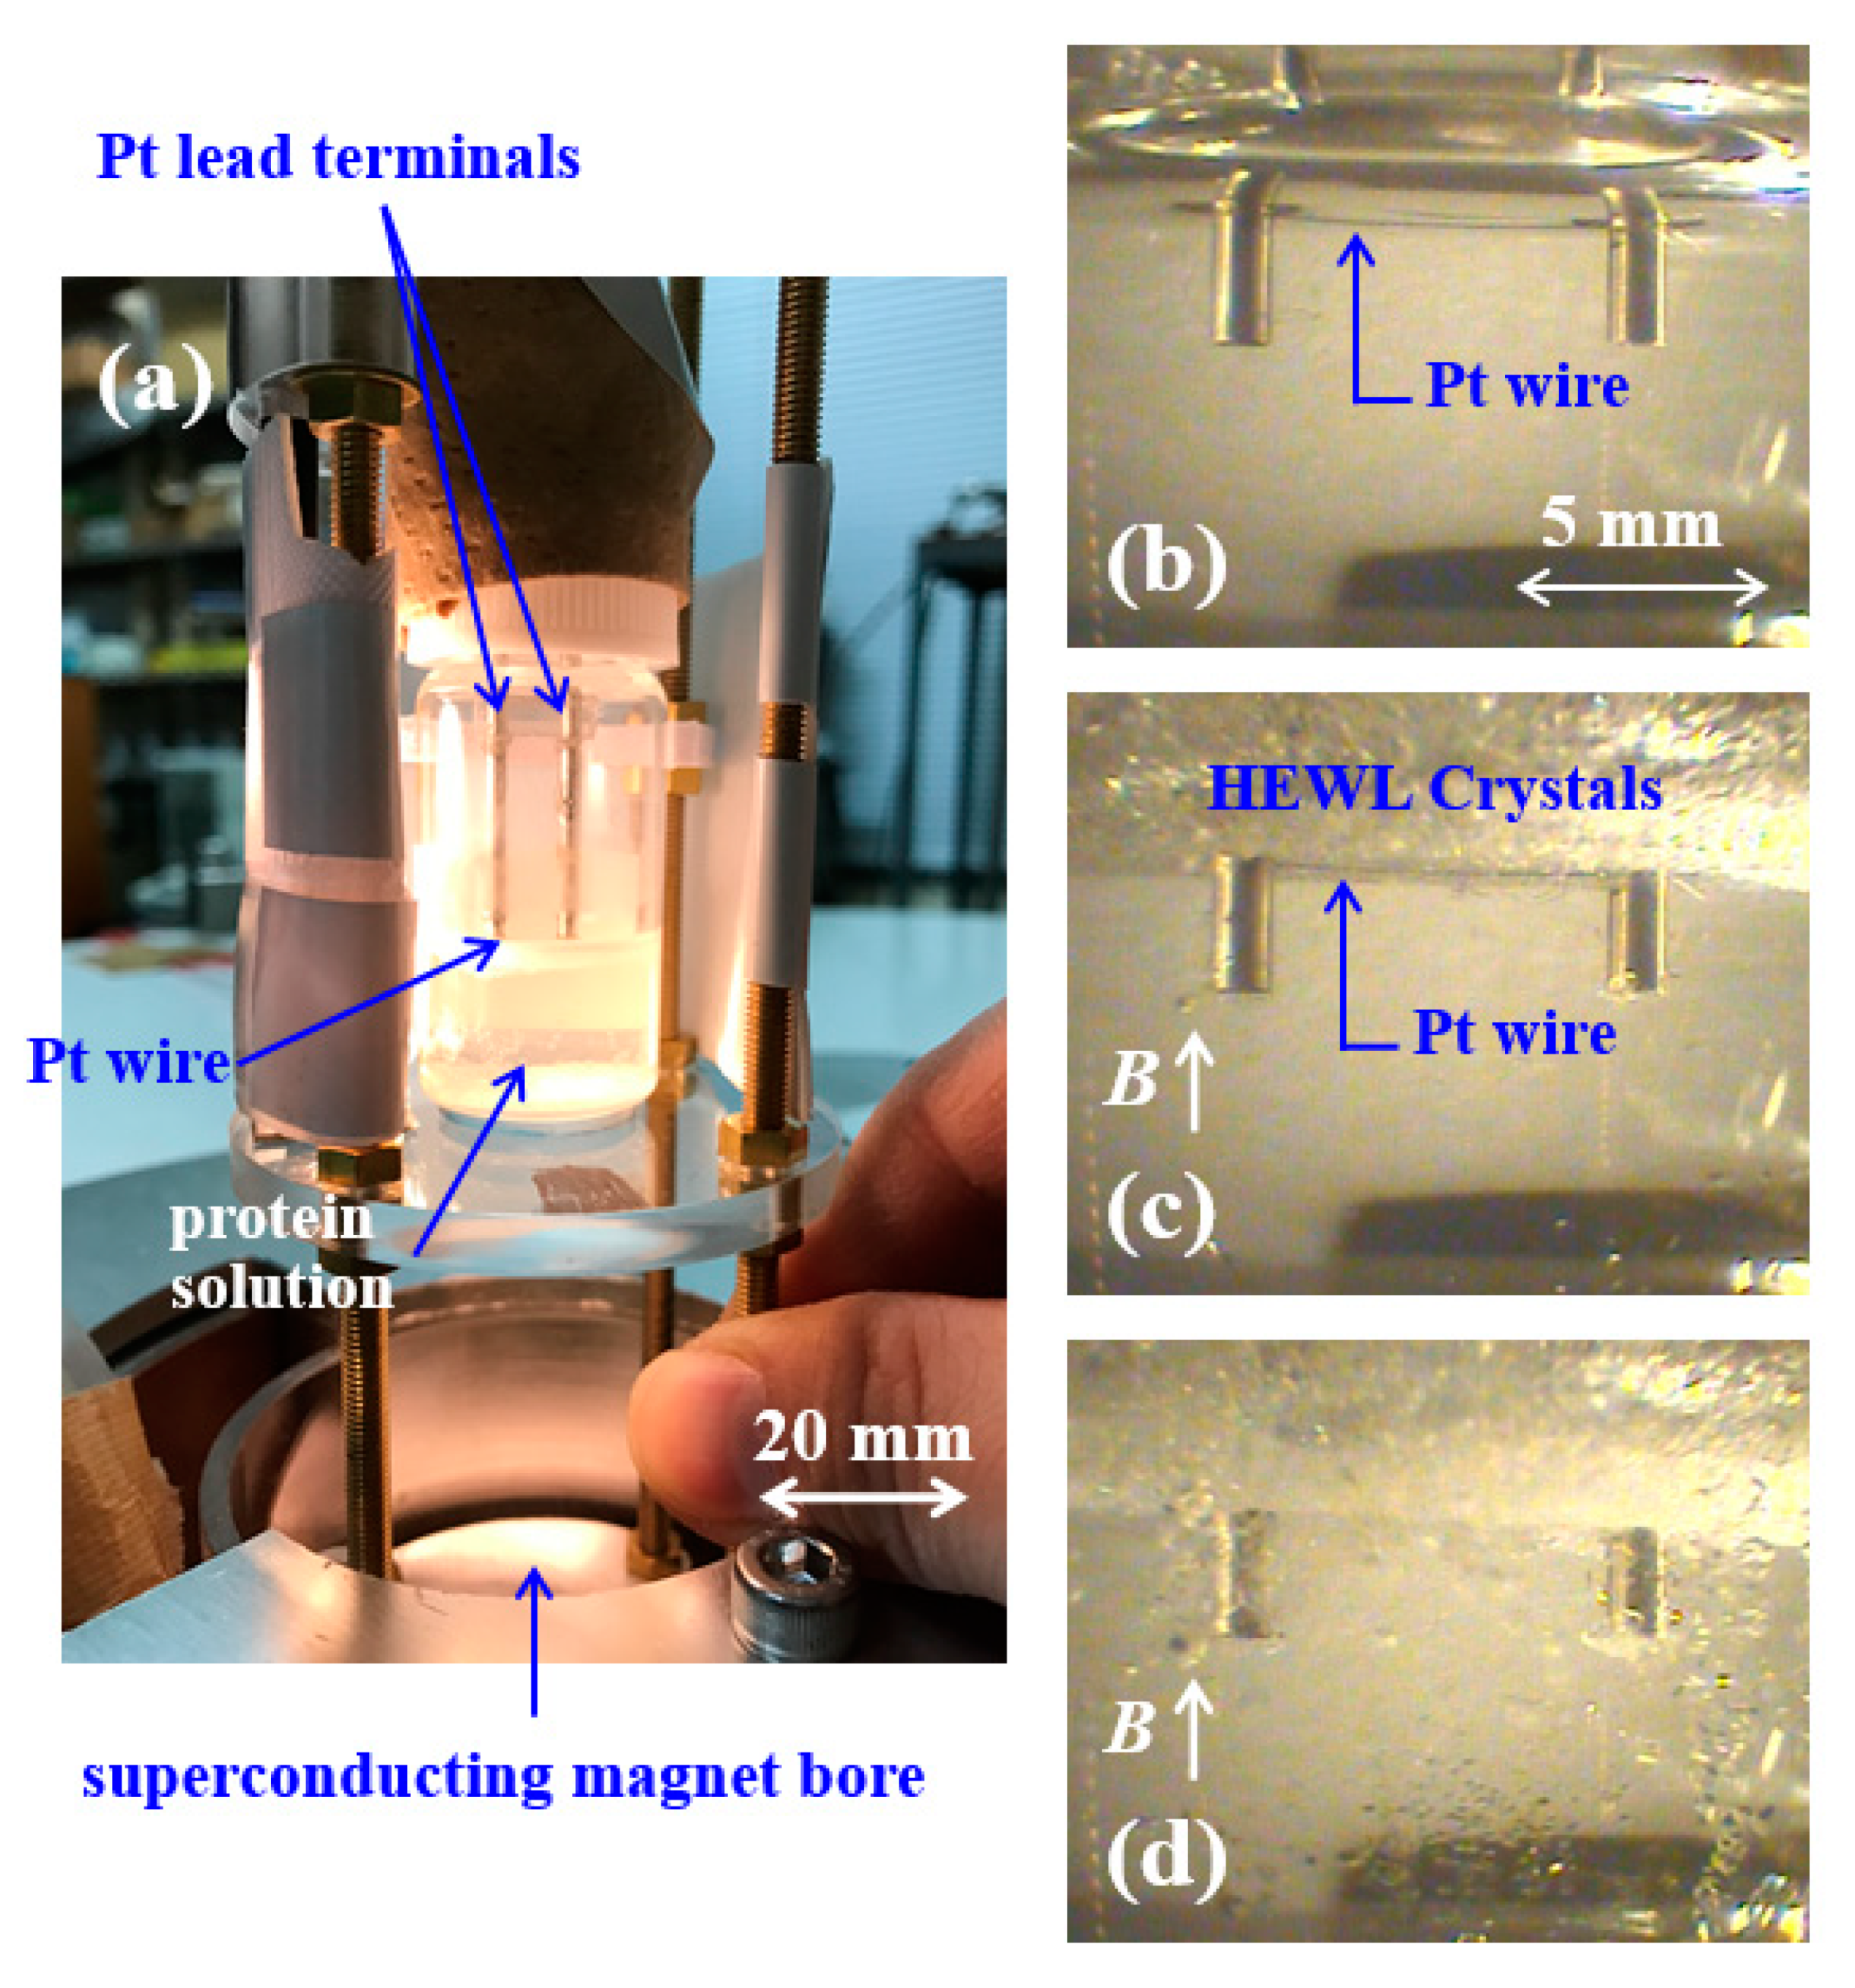
2.6. Magnetic Conditions

In the case of the MLC, the magnetic flux density (B) was set to 4.00 T at the center of the coil. The vertically upward magnitude of (B·∇)B became −148.1 T2 m−1 at the top surface of the protein solution, where the vertically maximum value of (B·∇)B was realized in a superconductive magnet (JMTD-6T100EF3, JASTEC SUPERCONDUCTOR Co., Ltd., Kobe, Japan). These conditions were the same as in previous studies [1,2]. When supplying the current in the measurement of the MLC, we briefly stopped applying the magnetic force to avoid the induction of the Lorentz force.

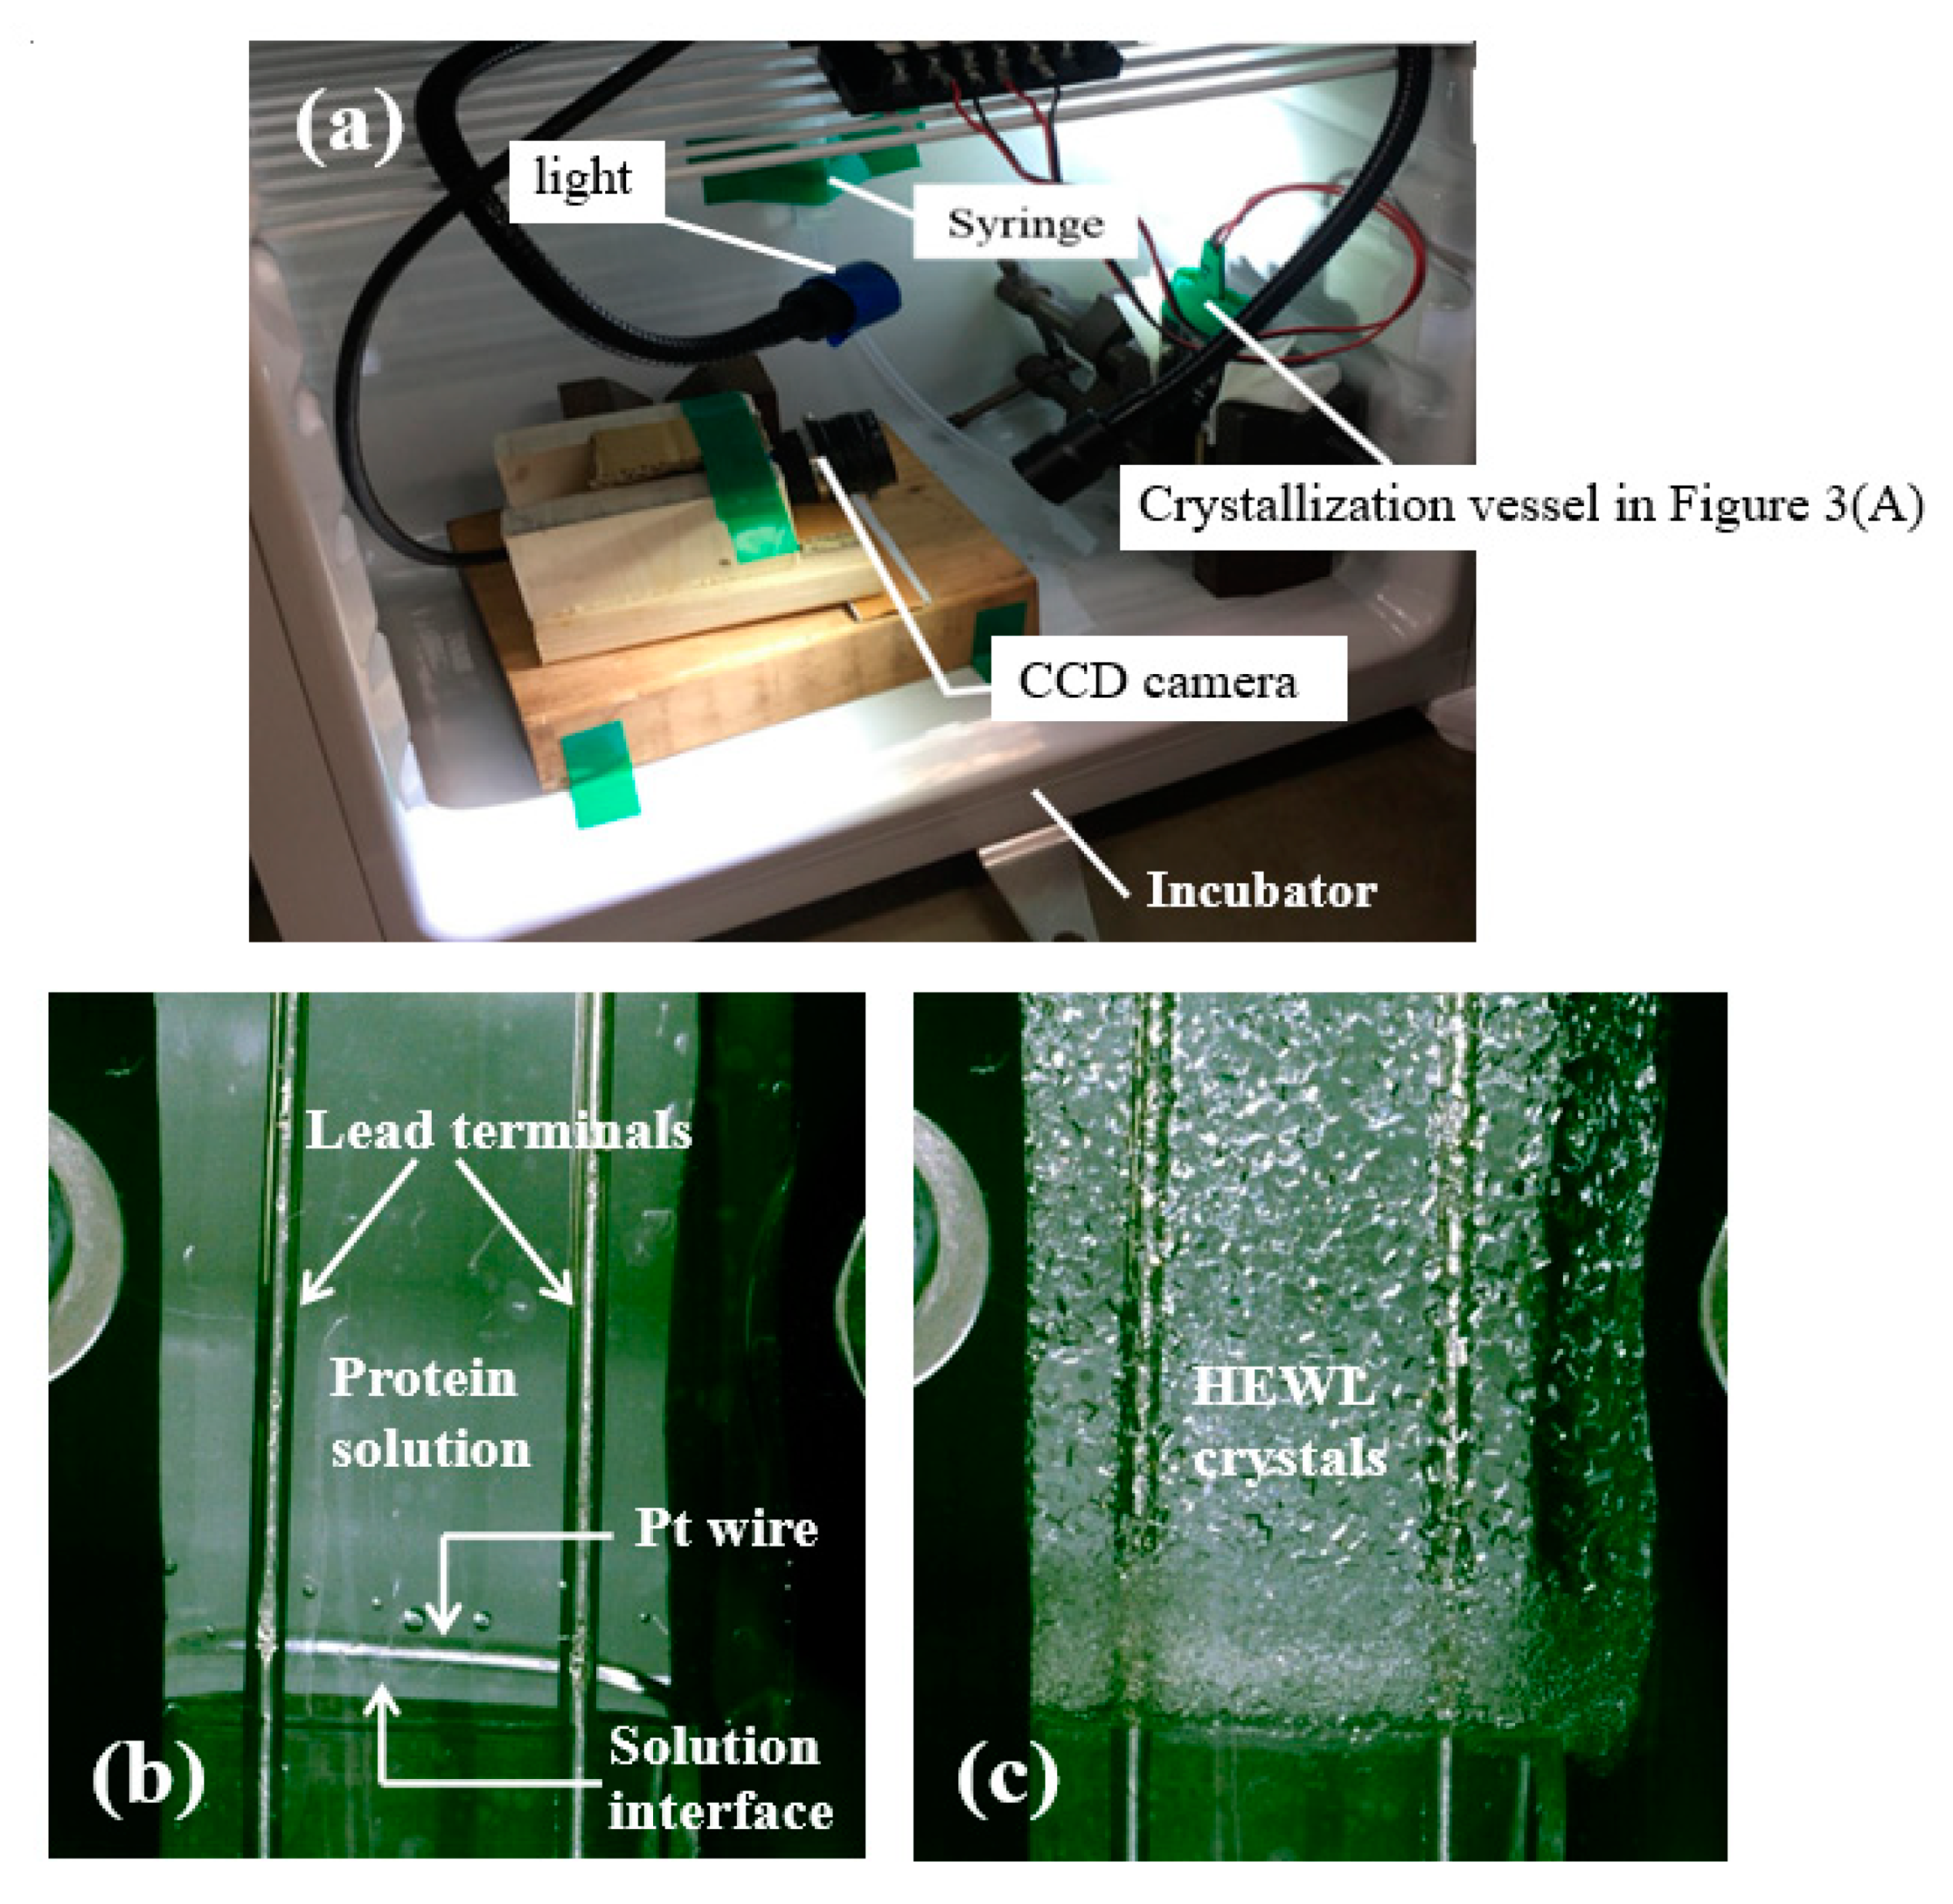
2.7. Visualization System

Prior to the measurements, we checked whether the short-hot wire was completely included into the crystals. Figure 4a shows the equipment used in monitoring the crystallization process in the magnet. In this photo, the vessel and other equipment were taken out from the superconducting magnet bore. In the normal setting, the crystallization can be observed from the side of the vessel by using a Charge-Coupled Device (CCD) camera (OH414, Olympus Co., Ltd., Tokyo, Japan) and a rigid scope (Industrial Rigid Scope Type 5, Olympus Co., Ltd., Tokyo, Japan). The crystal growth was automatically photographed every 15 min, using a dedicated software (Image Pro Express, Media Cybernetics Inc., USA).
Figure 4b–d is a series of photographs taken from the initial state of the solution. As can be seen in Figure 4b, the short-hot wire was located at a slightly lower position from the interface. Figure 4c is a photo taken at 15 h after the start. Many fine HEWL crystals appeared at the interface, and the wire was partially covered with crystals. At 48 h from the start (Figure 4d), the wire was completely included into the crystals, and measurement became possible.
Figure 5a shows the measurement system for the two-liquid method. Figure 5b is a photo at the initial state, and Figure 5c is a photo taken at three days after the start, respectively. As seen from these photos, many fine crystals appeared on the vessel sidewall.

3. Measurement

As the first step of the measurement, a low current (14 mA) was applied to the circuit to detect the temperature of the wire. Next, a large current was instantly supplied, and the probe was transiently heated. The magnitude of the current was optimized in advance so that only the wire was locally heated and the increase in temperature of the lead terminals became negligibly small. In this study, the electric current was set to 200 mA, and was maintained for 1.5 s to heat the wire. The wire temperature Tv against the current-flow time t was linearly approximated as follows:
T v T 0 = a ln t + b .
where T0 is the initial temperature of the wire. The coefficient a and the intercept b are determined by the least-squares (LSQ) fitting. In this study, the a and the b were decided by the data in the range of 0.1 to 0.6 s. Figure 6 shows an example of fitting the data to the above equation.
The heat transfer volume and the response were numerically estimated, and the following relation was arrived at [3].
θ v = A ln F o + B
where θv and Fo are the non-dimensional averaged temperature of the short-hot wire and the Fourier number, respectively. The θv and Fo are given by the following equation:
θ v = T v T 0 q v r i 2 / λ , F o = α t r i 2
where qv, ri, and t are the volumetric heat generation, the short-hot wire radius, and the current-flow time, respectively. The λ and α are the thermal conductivity and thermal diffusivity of the object surrounding the hot wire, respectively.
Finally, the λ and α of the protein crystals are obtained by solving Equations (1)–(3).
λ = q v r i 2 A a , α = r i 2 exp ( b a B A )
After the experiments, we removed the wire from the vessel and verified that the wire was thoroughly included into the HEWL crystals (data not shown).

4. Results

Measurements were carried out by varying the temperature of the MLC to 282.1, 287.2, 290.4, and 294.9 K, and varying the temperature of the NGC to 284.3 ± 0.1, 286.5 ± 0.6, 289.1, 291.5 ± 0.3, 293.2, and 295.2 K. All the measurements were repeated five times at regular intervals of 3–5 min.
The results of λ and α are summarized in Figure 7a,b, respectively. The data series of the MLC by the Pt wire are shown by the circles (O). The previous data of the MLC by the W wire [1,2] are shown by the squares (□). The data series of the NGC are shown by the triangles (∆). The thermal conductivities of the MLC and the NGC were expressed as λMLC and λNGC, respectively. Similarly, the thermal diffusivities of the MLC and the NGC were expressed as αMLC and αNGC, respectively. Since these results reflect the thermal properties of the crystals in the vicinity of the wire, the effects of the solution or the air conditions become small.
The thermal properties of the protein solution and the fluorinert are exhibited by the crosses (×) and the diamonds (◊), respectively. Both measurements were carried out with the Pt wire, and repeated five times at regular intervals of 3 min. The dash-dotted line indicates the reference data of water [19]. The bold broken line represents the reference data of fluorinert [20].

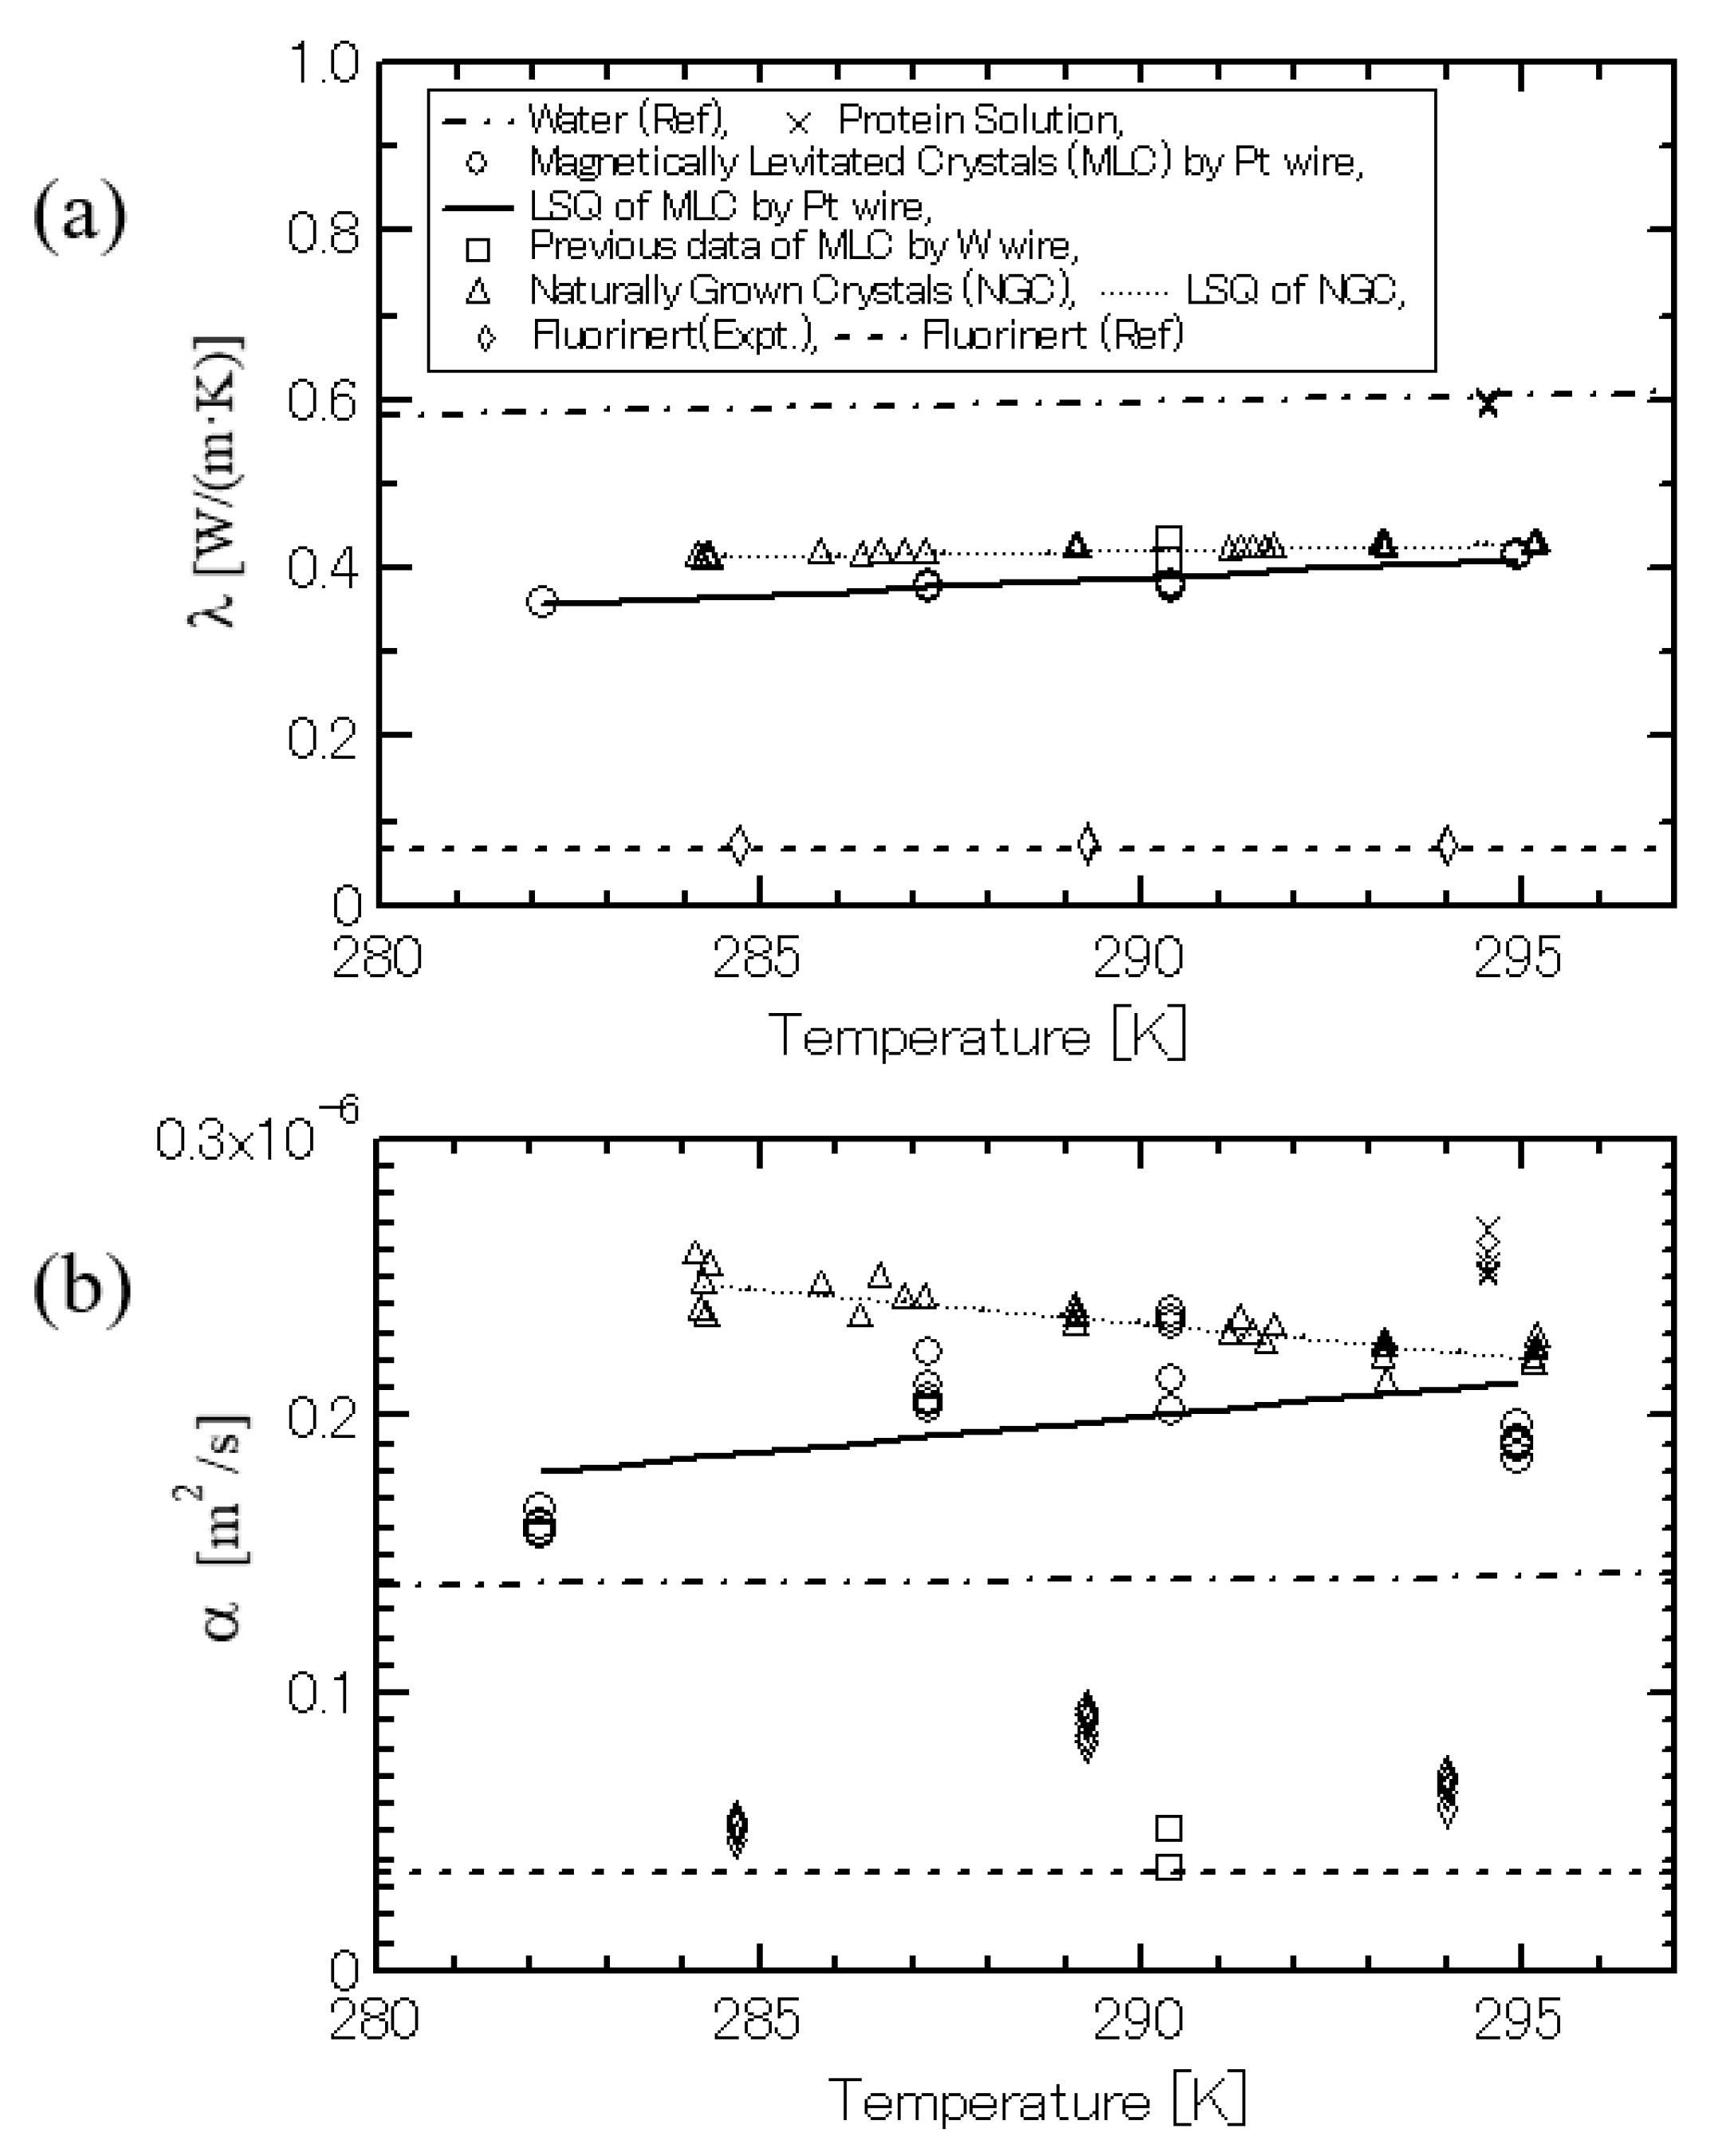
4.1. Thermal Conductivity

As shown in Figure 7a, the λMLC by the Pt wire was in accord with the previous results by the W wire within 4.8–12.0%, regardless of using a different material for the probe. This agreement represents the measurement reproducibility. The fluorinert shows almost equal values to the reference, demonstrating the advantages of our methods.
Another finding of great interest is that λMLC and λNGC increase linearly with the temperature. This characterizes the temperature dependence of the thermal conductivity of the HEWL crystals. These results will be analyzed in the Section 5.
Both λMLC and λNGC were smaller than those of water and the protein solution. The property of the protein solution was much closer to that of water than that of the crystals. This means that the heat on the crystal can be more easily dissipated to the solution than to the crystals. It is interesting that the thermal conductivity of the crystals was intermediate between the values of the fluorinert and the protein solution (or water).
The data points of λMLC and λNGC were approximated with the LSQ fitting in the range from 282.1 to 294.9 K. The λMLC and its R square value (R2λ_MLC) were presented as follows:
λMLC = 4.231 × 10⁻³ T − 0.8373,
R2fΙ_MLC = 0.903.
The LSQ fitting result of λMLC is displayed by a solid line in Figure 7a.
In a similar fashion, λNGC and its R square value (R2λ_NGC) in the range of 284.2 to 295.2 K were presented as follows:
λNGC = 1.356 × 10⁻³ T + 0.02764,
R2λ_NGC = 0.835.
The LSQ fitting result of λNGC is represented by the small dotted line in Figure 7a.
We are aware of the small difference between the data of λMLC and λNGC. This will be discussed later.

4.2. Thermal Diffusivity

There was a relative fluctuation in the data points of αMLC and αNGC because a small experimental error is likely to be magnified by the power term of the exponential function in Equation (4). Regardless of the fluctuation of the data, there were several findings. For example, the αMLC gradually increased by the temperature, whereas the αNGC slightly decreased. Both results indicate, at least, that the thermal diffusivity of the HEWL crystals changes by temperature.
The present results with a Pt wire were not the same as the previous results with a W wire, especially in the thermal diffusivity. We first suspected that small air bubbles were included into or between the crystals during the magneto-Archimedes levitation. However, since the results with the two-liquid method were close to those with the magneto-Archimedes levitation, the concern about the air bubbles was gone. In the present stage, there is little reliable data as to the thermophysical properties of protein crystals, e.g., HEWL. It was impossible for us to evaluate the accuracy of our results. Further research data is necessary to solve these problems.
The data series of αMLC and αNGC were approximated by the LSQ fitting method in the range of 282.1 to 294.9 K. The αMLC and its R square value (R2α_MLC) were presented as follows:
αMLC = 2.569 × 10⁻⁹ T − 5.451 × 10⁻⁷
R2fΩ_MLC = 0.227
The LSQ fitting result of αMLC is displayed by the solid line in Figure 7b.
In the temperature range of 284.2 to 295.2 K, the αNGC and its R square value (R2α_NGC) were presented as follows:
αNGC = −2.448 × 10⁻⁹ T + 9.432 × 10⁻⁷,
R2fΩ_NGC = 0.748
The LSQ fitting result of αNGC is shown by the small dotted line in Figure 7b.
The trends of αMLC and αNGC are statistically analyzed in the next section.

5. Discussion

5.1. Temperature Dependence

As for each data series of λMLC, λNGC, αMLC, and αNGC, the temperature dependence was statistically evaluated by the Kruskal-Wallis test [21]. All the analyses were performed by means of the SPSS ver.15.0, statistical software (SPSS Statics, IBM Co. Ltd., USA)
According to the analyses, the p-values of λMLC, λNGC, αMLC, and αNGC resulted in 8.84 × 10⁻⁴, 6.63 × 10⁻⁵, 8.73 × 10⁻⁴, and 1.40 × 10⁻⁴, respectively. These small values suggest that we should reject the null hypothesis that a temperature dependence does not exist. Hence, we decide to adopt the alternative hypothesis that tetragonal HEWL crystals are dependent on temperature in both properties of thermal conductivity and thermal diffusivity.
On the other hand, we do not know why λ increased with temperature and only the data of αNGC decreased. Except for the data of αMLC at 282 K, the trend of αMLC decreases with temperature in common with that of αNGC. With regards to the temperature trend of α, further measurements are necessary.

5.2. Magnetic Effect in the Thermal Properties

As shown in Figure 7, the LSQ fitting lines of λMLC and λNGC were slightly different from each other. Similarly, the LSQ fitting lines of αMLC and αNGC were not in accord. We suspect that the difference in these may be derived from the application of the magnetic field in the crystal growth. In order to clarify the magnetic effect in the properties, the difference between the data of λMLC and λNGC were statistically investigated by using the analysis of covariance [22]. The difference between the data of αMLC and αNGC was also examined in a similar way. In practice, the thermal properties (λ or α) were defined as dependent variables, and the temperatures were used as independent variables (covariates). The magnetic field was the factor to characterize the properties of the MLC and NGC.
According to the analyses, the p-value between the data of λMLC and λNGC was 8.46 × 10⁻¹². Such a small value suggests that we should reject the null hypothesis that the temperature change of the λMLC is regarded as similar to that of λNGC. Similarly, the p-value between the data of αMLC and αNGC was 1.54 × 10⁻⁵, also making it valid to reject the null hypothesis. These results support the possibility that the thermal properties of HEWL crystals were affected by the application of the magnetic field.

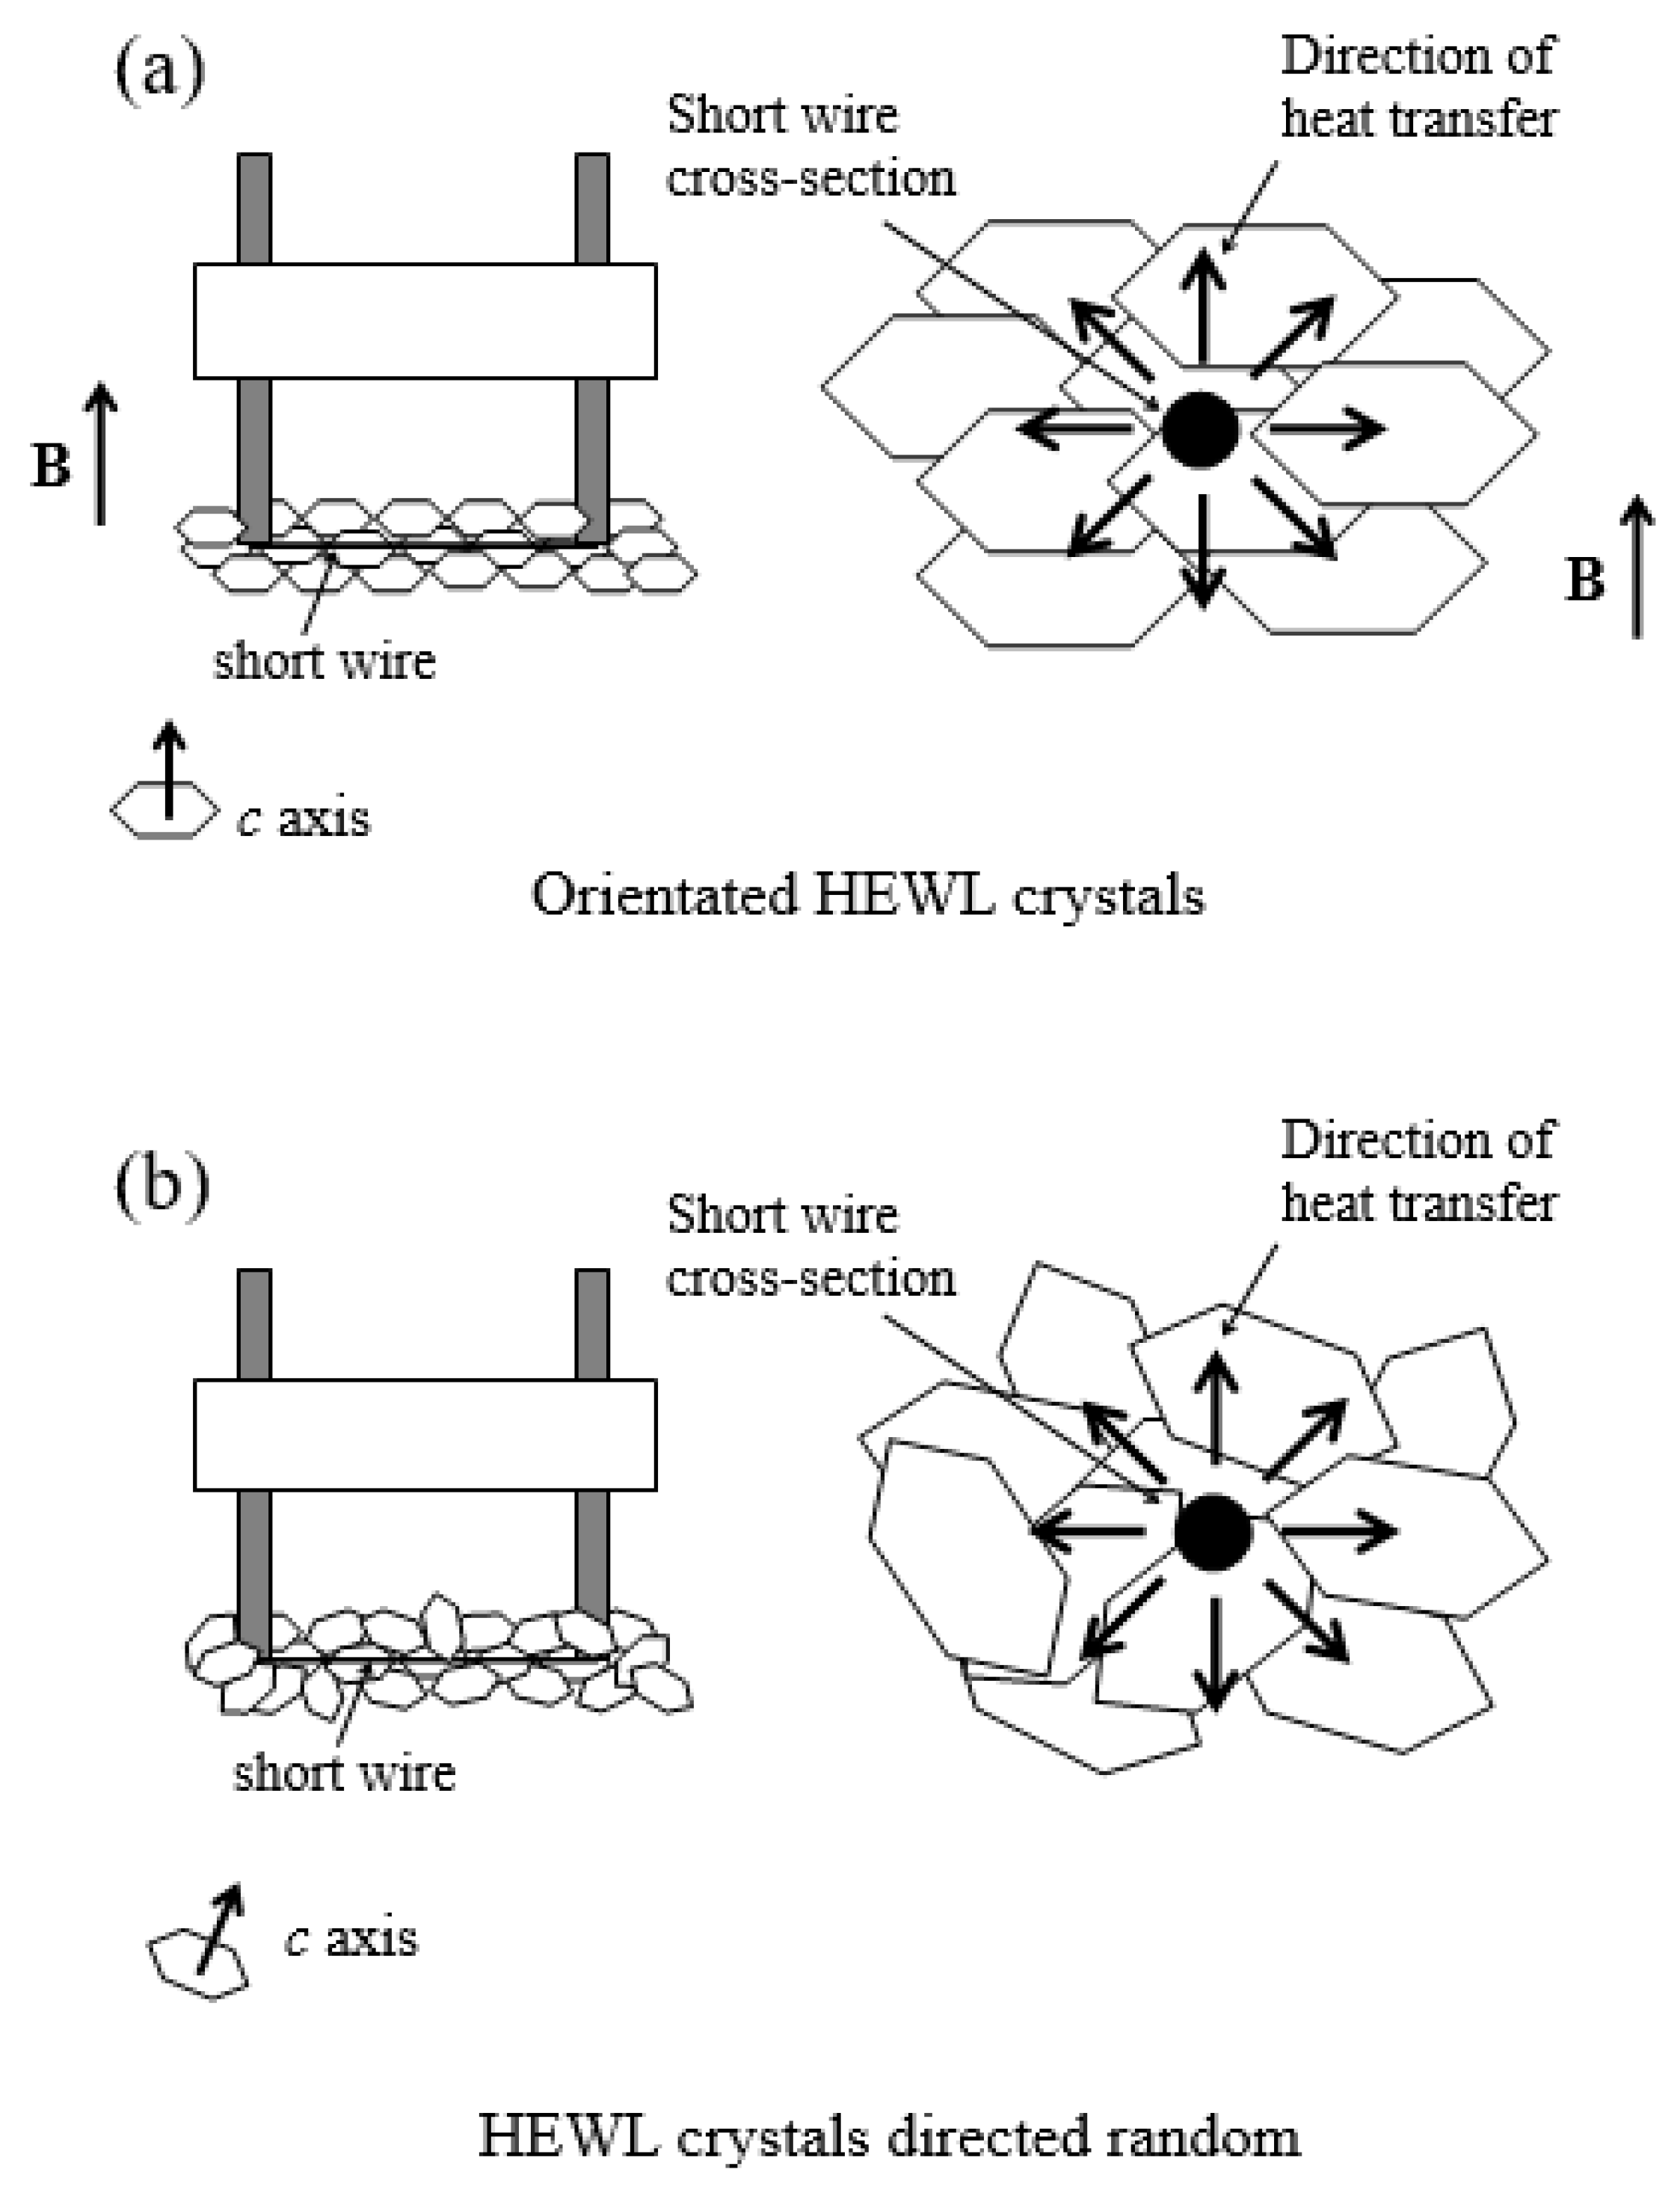
5.3. Is There Anisotropy in the Thermal Properties?

We will discuss why the thermal properties of the HEWL crystals were changed simply by the application of the magnetic field. Figure 8 shows levitating tetragonal HEWL crystals viewed from the top, grown in the same crystallization conditions as the magnetic induction of 4.00 T. As can be seen, the crystals are magnetically orientated along the c-axes of the crystals, being vertical to the paper surface, at the air-liquid interface of the solution [23,24]. The radiating arrows in Figure 9 schematically illustrate the heat transfer process from the wire to the crystals when the wire is heated instantly. The c-axes of the MLC are perpendicular to the direction of the wire (see Figure 9a); in contrast, the NGC grow randomly (see Figure 9b). Considering that the three-dimensional geometries of protein molecules are asymmetric, it is no wonder that the thermal conduction process of MLC was different from that of NGC. If the differences in the thermal properties originated in the macroscopic phenomena of the crystal orientation by the magnetic field, an anisotropic effect in the thermal properties may be considered. Further study is in progress to ensure more comprehensive evidence about the anisotropy of protein crystals.

6. Conclusions

The thermal conductivity and thermal diffusivity of tetragonal HEWL crystals were measured by means of the transient short-hot wire method. The crystals were grown by two different methods. The magnetically levitated crystals were realized by a superconducting magnet, the c-axis of which was perpendicularly orientated to the direction of the wire. In contrast, naturally grown crystals were realized by the two-liquid method, grown randomly. The temperature dependence in the thermal properties was confirmed by varying the temperature for the measurements. The statistical analyses also demonstrated the possibility that protein crystals may provide anisotropic effects in the thermal properties. In a future study, the anisotropy will be proven by a measurement where the c-axis of the HEWL crystals is orientated parallel to the direction of the wire. We will present an account of these related matters in our next report.

Author Contributions

Conceptualization, S.M., S.F.; Methodology, S.M., S.F., S.T., T.A.; Software, S.M., S.F., S.T.; Validation, S.M., S.F., S.T., M.H.; Formal analysis, S.M., S.F., S.T.; Investigation, S.M., S.F., S.T., E.E., M.K., K.H., Y.I., R.M.; Resources, S.M., S.F., S.T., M.H., T.A.; Data curation, S.M., S.F., S.T., E.E., M.K., K.H., Y.I., R.M.; Writing—original draft preparation, S.M.; Writing—review and editing, S.M., S.F., S.T., M.H.; Visualization, S.M., S.T.; Supervision, S.M., S.F.; Project administration, S.M., M.H.; Funding acquisition, S.M., S.F., S.T. All authors have read and agreed to the published version of the manuscript.

Funding

This research was funded by many grants of MEXT/JSPS, KAKENHI (grant number JP15K04669, JP17K06215, JP17K14612, JP20K04335), and the Science Research Promotion Fund (2018), the Promotion and Mutual Aid Corporation for Private Schools of Japan.

Acknowledgments

The measurements were carried out at the Center for Advanced High Magnetic Field Science in Osaka University under the Visiting Researcher’s Program of the Institute for Solid State Physics, the University of Tokyo. The superconducting magnet in this work belongs to Satoshi Tomita, Quantum Material Science Laboratory, Graduate School of Material Science, Nara Institute of Science and Technology. Thanks to this support, we could introduce many innovative crystallization techniques (i.e., magneto-Archimedes effect) and original equipment (i.e., a new probe made of Pt, a new vessel to realize a two-liquid method). We received valuable advice from Yoshifumi Tanimoto and Noritake Yasuoka. We would like to express our deepest gratitude for all this support.

Conflicts of Interest

The authors declare no conflict of interest.

Abbreviations

The following abbreviations are utilized in this manuscript.
MLCmagnetically levitated crystals
NGCnaturally grown crystals
LSQleast-squares

References

  1. Maki, S.; Fujiwara, S.; Maekawa, R.; Tanaka, S.; Hagiwara, M. Simultaneous Measurements of Thermal Conductivity and Diffusivity of Hen Egg-White Lysozyme Crystals Using a Transient Short Hot Wire Method and Magneto-Archimedes Effect. Netsu Bussei 2016, 30, 131–139. [Google Scholar] [CrossRef] [Green Version]
  2. Fujiwara, S.; Maki, S.; Maekawa, R.; Tanaka, S.; Hagiwara, M. Measurements of Thermal Conductivity and Thermal Diffusivity of Hen Egg-White Lysozyme Crystals and Its Solution Using the Transient Short Hot Wire Method. Int. J. Thermophys. 2017, 38, 123. [Google Scholar] [CrossRef]
  3. Fujii, M.; Zhang, X.; Imaishi, N.; Fujiwara, S.; Sakamoto, T. Simultaneous measurements of thermal conductivity and thermal diffusivity of liquids under microgravity conditions. Int. J. Thermophys. 1997, 18, 327–339. [Google Scholar] [CrossRef]
  4. Zhang, X.; Fujii, M. Measurements of the thermal conductivity and thermal diffusivity of polymers. Polym. Eng. Sci. 2003, 43, 1755–1764. [Google Scholar] [CrossRef]
  5. Tomimura, T.; Maki, S.; Zhang, X.; Fujii, M. Measurements of thermal conductivity and thermal diffusivity of alternative refrigerants in liquid phase with a transient short-hot-wire method. Heat Transf.-Asian Res. 2004, 33, 540–552. [Google Scholar] [CrossRef]
  6. Zhang, X.; Wicaksono, H.; Fujiwara, S.; Fujii, M. Accurate measurements of thermal conductivity and thermal diffusivity of molten carbonates. High Temp. Press. 2002, 34, 617–625. [Google Scholar] [CrossRef] [Green Version]
  7. Ikezoe, Y.; Hirota, N.; Nakagawa, J.; Kitazawa, K. Making water levitate. Nature 1998, 393, 749–750. [Google Scholar] [CrossRef]
  8. Maki, S.; Oda, Y.; Ataka, M. High-quality crystallization of lysozyme by magneto-Archimedes levitation in a superconducting magnet. J. Cryst. Growth 2004, 261, 557–565. [Google Scholar] [CrossRef]
  9. Rhim, W.-K.; Chung, S.K. Containerless protein crystal growth method. J. Cryst. Growth 1991, 110, 293–301. [Google Scholar] [CrossRef]
  10. Lorber, B.; Giegé, R. Containerless protein crystallization in floating drops: Application to crystal growth monitoring under reduced nucleation conditions. J. Cryst. Growth 1996, 168, 204–215. [Google Scholar] [CrossRef]
  11. Chung, S.K.; Trinh, E.H. Containerless protein crystal growth in rotating levitated drops. J. Cryst. Growth 1998, 194, 384–397. [Google Scholar] [CrossRef]
  12. García-Ruiz, J.M.; González-Ramírez, L.A.; Gavira, J.A.; Otálora, F. Granada Crystallisation Box: A new device for protein crystallisation by counter-diffusion techniques. Acta Crystallogr. Sect. D Biol. Crystallogr. 2002, 58, 1638–1642. [Google Scholar] [CrossRef] [Green Version]
  13. Vergara, A.; Lorber, B.; Zagari, A.; Giegé, R. Physical aspects of protein crystal growth investigated with the Advanced Protein Crystallization Facility in reduced-gravity environments. Acta Crystallogr. Sect. D Biol. Crystallogr. 2002, 59, 2–15. [Google Scholar] [CrossRef] [Green Version]
  14. Santesson, S.; Cedergren-Zeppezauer, E.S.; Johansson, T.; Laurell, T.; Nilsson, J.; Nilsson, S. Screening of Nucleation Conditions Using Levitated Drops for Protein Crystallization. Anal. Chem. 2003, 75, 1733–1740. [Google Scholar] [CrossRef]
  15. Ataka, M.; Maki, S. The containerless crystal growth method. Japan Patent No. 4273222, 12 December 2002. (patent application data). [Google Scholar]
  16. Chayen, N.E. A novel technique for containerless protein crystallization. Protein Eng. Des. Sel. 1996, 9, 927–929. [Google Scholar] [CrossRef] [Green Version]
  17. Adachi, H.; Watanabe, T.; Yoshimura, M.; Mori, Y.; Sasaki, T. Growth of Protein Crystal at Interface between Two Liquids Using Slow Cooling Method. Jpn. J. Appl. Phys. 2002, 41, L726–L728. [Google Scholar] [CrossRef]
  18. Girard, E.; Chantalat, L.; Vicat, J.; Kahn, R. Gd-HPDO3A, a complex to obtain high-phasing-power heavy-atom derivatives for SAD and MAD experiments: Results with tetragonal hen egg-white lysozyme. Acta Crystallogr. Sect. D Biol. Crystallogr. 2001, 58, 1–9. [Google Scholar] [CrossRef]
  19. Japan Society of Thermophysical Properties. Thermophysical Properties Handbook; Yokendo: Tokyo, Japan, 2008. (In Japanese) [Google Scholar]
  20. Web. archive org., 3M Japan Co. Ltd. “3M Fluorinert Inert Liquids”. Available online: https://multimedia.3m.com/mws/media/989150O/ems-198.pdf (accessed on 16 June 2020).
  21. Kruskal, W.H.; Wallis, W.A. Use of ranks in one-criterion variance analysis. J. Am. Stat. Assoc. 1952, 47, 583–621. [Google Scholar] [CrossRef]
  22. Chamberlain, G. Analysis of covariance with qualitative data. Rev. Econ. Stud. 1980, 47, 225–238. [Google Scholar] [CrossRef] [Green Version]
  23. Ataka, M.; Katoh, E.; Wakayama, N.I. Magnetic orientation as a tool to study the initial stage of crystallization of lysozyme. J. Cryst. Growth 1997, 173, 592–596. [Google Scholar] [CrossRef]
  24. Yanagiya, S.-I.; Sazaki, G.; Durbin, S.D.; Miyashita, S.; Nakada, T.; Komatsu, H.; Watanabe, K.; Motokawa, M. Effect of a magnetic field on the orientation of hen egg-white lysozyme crystals. J. Cryst. Growth 1999, 196, 319–324. [Google Scholar] [CrossRef]
Figure 1. Transient short-hot wire probe. (A) A photo of a new transient short-hot wire probe made of Pt. (B) Schematic illustration of the probe. (a) The hot wire made of platinum (Pt) with a diameter of 41.4 μm and a length of 7.1 mm, (b) Pt lead terminals (diameter 1.0 mm), (c) acrylic jigs, (d) a current lead wire for supplying the electric current, and (e) a lead wire for measuring the voltage.
Symmetry 12 01279 g001
Figure 2. Crystallization vessel newly developed for the two-liquid method; (A) The vessel photo, and (B) its schematic illustration. The interface is adjustable by compressing the piston syringe connected to the vessel bottom.
Symmetry 12 01279 g002
Figure 3. Schematic illustration of the circuit.
Symmetry 12 01279 g003
Figure 4. Crystallization vessel, probe, and the growing process of the magnetically levitated crystals. (a) The vessel and other equipment taken out from the superconducting magnet bore. (b) The initial state (B = 0 T). The short-hot wire was fixed at a slightly lower position from the interface. (c) After 15 h (B = 4.0 T). (d) After 48 h. The crystals are growing at the air-liquid interface of the protein solution.
Symmetry 12 01279 g004
Figure 5. The measurement system by the two-liquid method and the crystallization process. (a) All the system, e.g., the crystallization vessel, the light, CCD camera, and other equipment, are installed in the incubator. (b) Initial state, (c) three days after the crystallization. Many crystals appeared on the vessel sidewall.
Symmetry 12 01279 g005
Figure 6. A response of the wire temperature (Tv) by the transient short-hot wire method. The gradient a and the interception b are obtained by using the data in the range of 0.1 to 0.6 s, as referring to Equation (5). The response is presented by the broken plots, and the least-squares (LSQ) lines are shown by the solid lines.
Symmetry 12 01279 g006
Figure 7. Measurement data of tetragonal hen egg-white lysozyme (HEWL) crystals. (a) Thermal conductivity. (b) Thermal diffusivity. The magnetically levitated crystals (MLC) by the Pt wire are shown by the circles (O). The previous data of MLC by the W wire is shown by the squares (□). The naturally grown crystals (NGC) are shown by the triangles (∆). The results of the protein solution and the fluorinert are shown by the crosses (×) and the diamonds (◊), respectively.
Symmetry 12 01279 g007
Figure 8. The levitating tetragonal HEWL crystals, viewed from the top. The crystals were grown with the same crystallization conditions as the magnetic induction of 4.00 T. The crystals are magnetically orientated along the c-axis of the crystal, being vertical to the paper surface, at the air-liquid interface of the solution.
Symmetry 12 01279 g008
Figure 9. Schematic illustration of the heat transfer process when the wire is heated instantly. (a) Magnetically levitated crystals (MLC). (b) Naturally grown crystals (NGC). The direction of heat transfer from the wire to the crystals is schematically shown by radiating arrows. The c-axes of the MLCs are perpendicular to the direction of the wire, and those of the NGCs direct randomly. The heat conduction of the MLCs is realized through the orientated crystals, whereas that of NGCs is done without considering the orientation.
Symmetry 12 01279 g009

