Article

Treatment of Cheese Whey Wastewater Using an Expanded Granular Sludge Bed (EGSB) Bioreactor with Biomethane Production

by
Abumalé Cruz-Salomón
1,2,*,
Edna Ríos-Valdovinos
3,*,
Francisco Pola-Albores
3,
Selene Lagunas-Rivera
4,
Rosa Isela Cruz-Rodríguez
5,
Kelly del Carmen Cruz-Salomón
5,
Jesús Mauricio Ernesto Hernández-Méndez
1,2 and
María Emperatriz Domínguez-Espinosa
2,6
1
Escuela de Ciencias Químicas, Sede Ocozocoautla, Universidad Autónoma de Chiapas (UNACH), Carretera Panamericana Ocozocoautla—Cintalapa Km. 2.5, Ocozocoautla de Espinosa 29140, Mexico
2
Departamento de Químicos Farmacobiólogos, Universidad Pablo Guardado Chávez (UPGCH), Libramiento Norte Oriente No. 3450, Tuxtla Gutiérrez 29040, Mexico
3
Instituto de Investigación e Innovación en Energías Renovables, Universidad de Ciencias y Artes de Chiapas (UNICACH), Libramiento Norte Poniente No.1150, Lajas Maciel, Tuxtla Gutiérrez 29039, Mexico
4
Catedrática CONACyt-Departamento de Química, DCNyE, Universidad de Guanajuato, Noria Alta s/n, Guanajuato 36050, Mexico
5
Departamento de Ingeniería Química y Bioquímica, Tecnológico Nacional de México-Instituto Tecnológico de Tuxtla Gutiérrez, Carretera Panamericana Km 1080, Tuxtla Gutiérrez 29050, Mexico
6
Facultad de Ciencias de la Nutrición y Alimentos, Universidad de Ciencias y Artes de Chiapas (UNICACH), Libramiento Norte Poniente No.1150, Lajas Maciel, Tuxtla Gutiérrez 29039, Mexico
*
Authors to whom correspondence should be addressed.
Processes 2020, 8(8), 931; https://doi.org/10.3390/pr8080931
Submission received: 29 June 2020 / Revised: 28 July 2020 / Accepted: 31 July 2020 / Published: 2 August 2020
(This article belongs to the Special Issue Control and Optimization of Wastewater Treatment Technology)

Abstract

:
Cheese whey wastewater (CWW) is the major by-product of the dairy industry. CWW is produced in large quantities, has varied characteristics and is usually disposed of. The disposal of CWW causes a negative impact on the environment of different agroindustrial areas due to the physic-chemical composition that significantly increases its high organic load and nutrients. For this reason, the aim of this work was to carry out an evaluation of the anaerobic treatability of an Expanded Granular Sludge Bed (EGSB) bioreactor as a new sustainable alternative for treatment of these effluents with bioenergy production. In this study, the bioreactor was operated under stable conditions (i.e., buffer index of 0.23 ± 0.1, pH 7.22 ± 0.4 and temperature 26.6 ± 1.4 °C) for 201 days. During evaluation the hydraulic retention time (HRT) was 6 and 8 days, and it was buffered with NaHCO3. At these conditions, the COD removal rate and biochemical methane potential (BMP) were 90, 92%; and 334, 328 mLCH4/gCOD, respectively. The evidence found in this study highlighted that the CWW is a viable substrate to be treated in the EGSB bioreactor as long as it keeps buffered. Furthermore, the process to treat the CWW in an EGSB bioreactor can be a sustainable alternative to simultaneously solve the environmental pollution that this agro-industry confronts and produce renewable and environmentally-friendly bioenergy.

Graphical Abstract

1. Introduction

Cheese is one of the main agricultural products in the world, and more than 18 million tons are produced annually, according to the Food and Agriculture Organization of the United Nations (FAO). The production of this food is higher compared to the production of coffee beans, tea leaves, cocoa beans and tobacco together. Europe and Northern America account for more than 75% of the world’s cheese production.
In Mexico, the dairy agro-industry (cheese factories and dairy farms) was the most dynamic within the agri-food sector. It participated with 10% of the total value of the sector and contributed 0.6% to the Gross Domestic Product (GDP). This placed it within the most important agro-industries in the country and a contributor to a considerable share of the Mexico’s economy [1,2].
This agro-industry offers the market very diverse products; nevertheless, the most popular for many years has been cheese [3]. There are many varieties of cheese produced around the world, and they are all made with different recipes, techniques, and manufacturing processes [4,5]. However, all the different cheeses have the same basic manufacturing process (Figure 1).
This manufacturing process begins with the reception of milk at the cheese factory. Subsequently, conditioning (thermization, skimming and homogenization) is carried out [5,6,7,8], followed by coagulation achieved by adding rennet or acids for the formation of the curd [9]. Once the curd has the perfect texture, cheese whey is drained. In this stage the largest amount of cheese whey wastewater (CWW) is produced (up to 9 L for each kilogram of cheese generated). Then pressing is carried out for a greater and better extraction of the whey (additional CWW is generated). Once the pressing time has ended [10], the cheese is salted and is put to maturing [5,10].
Due to high CWW production, currently, this agro-industry faces a real problem with its effluents. It generates millions of tons of CWW characterized by high biochemical oxygen demand (BOD5), chemical oxygen demand (COD) up to 100 g COD/L concentrations representing their high organic content. Also, it has a high biodegradability index (~98%) [11,12], low alkalinity (2500 mg/L as CaCO3) content [13], carbohydrates (4–5%), lactose (4.5–5%), proteins (0.6–1%), lipids (0.4–0.5%), and lactic acid less than 1% [14,15,16] all of which are totally unexploited and, in some cases, they are dangerous for the environment [5,11,17].
For this reason, the entities responsible for monitoring the proper functioning and use of natural resources have generated policies which seek to reduce the contamination of water bodies by liquid discharges through the collection of the remuneration rate [18]. However, if the CWW were given a sustainable use that takes advantage of its potential, and generates additional income for companies, it would be possible to reduce its contaminating impact more effectively. This would contribute to the achievement of improvements or modifications in the production process, so that it is more efficient and profitable, thus generating greater benefits for the company and the environment.
In this sense, intensive studies have been carried out in the last decades and several green technologies have been extensively reviewed. Anaerobic digestion (AD) is a predominant technology for the treatment of high-strength wastewater with biogas production. This technology converts pollutants into methane and other products under the joint effort of various microbial groups, very different and closely dependent, in a series and parallel symbiotic reactions systems [5]. It is a complex multi-stage process (Figure 2), which is carried out in the absence of an electron acceptor such as oxygen. This process is described below.
In the first stage of AD, the hydrolysis of complex biopolymers (polysaccharides, proteins, lipids) are cracked into basic monomers, by exoenzymes (hydrolase) of hydrolytic microorganisms of the genus Bacteroides, Bifidobacterium, Clostridium, Eubacterium, Lactobacillus, Megasphaera, Paenibacillus, Pectococcus, Propionibacterium, Ruminococcus, Sphingomonas, Sporobacterium, Staphylococcus and Streptococcus [5,19].
The monomers formed in the hydrolytic phase are taken up by different facultative and obligatorily anaerobic bacteria (e.g., Bacteroides, Bifidobacterium, Butyrivibrio, Clostridium, Cytophaga, Flavobacterium, Lactobacillus, Ruminococcus, Paenibacillus, Propionibacterium and Streptococcus) and are degraded in the second, the acidogenic stage, to short-chain organic acids, alcohols, hydrogen, and carbon dioxide [19]. The products from the acidogenic stage are transformed into acetate and hydrogen by obligate H2-producing (Syntrophobacter, Syntrophomonas, Syntrophus, Syntrophococcus and Desulfovibrio) and homoacetogenic (Acetoanaerobium, Acetobacterium, Acetogenium, Butyribacterium, Clostridium, Eubacterium and Pelobacter) bacteria in the acetogenic stage [20]. In the fourth stage, the methane formation takes place under strictly anaerobic conditions, from acetic acid (acetoclastic route by methanogenic archaea such as Methanosarcina and Methanosaeta), and from hydrogen and carbon dioxide (hydrogenotrophic route by methanogenic archaea such as Methanobacterium, Methanospirillum, Methanogenium, Methanococcus and Methanobrevibacter). Nevertheless, only 27–30% of the methane arises from the reduction, while 70% arises from acetate during methanation [5,19].
Even though in the literature there are already many laboratory and pilot-scale studies on the anaerobic treatment of CWW [12,21,22], most of the studies deal with diluted (or deproteinated) whey in first and second-generation bioreactors, which is much simpler to treat. Consequently, the application of a biotechnological process, such as anaerobic treatment in the Expanded Granular Sludge Bed (EGSB) bioreactor (third generation bioreactors), could be a sustainable alternative, reliable and low-cost for CWW treatment with potential to renewable and environmentally friendly bioenergy production. This type of bioreactor has several advantages, including design simplicity, usage of unsophisticated equipment, low anaerobic granular sludge (AGS) production, low operating costs, low power consumption (no O2 transfer required), low nutrients and chemicals requirement, compact design (suitable for small spaces), high treatment efficiency from up to 90% similar to aerobic treatments, operates at an ultra-high organic loading rate (OLR) up to 40 kg COD/m3day, low hydraulic retention time (HRT) from 0.2 to 2 days for low-strength wastewater (in such a situation effluent recirculation is not needed), up to 10 days for high-strength wastewater (like vinasse, coffee processing wastewater, among others), and start-up times between 30 to 60 days. Also, the design of this bioreactor offers maximum efficiency, stability and flexibility to treat various types of wastewater, thanks to its external recirculation, a feature that allows efficient internal mixing and optimal contact between AGS and wastewater. Thus, because it is a completely closed system, with zero emission of odors, this bioreactor has a high potential to generate renewable energy in the form of biogas, biomethane or biohydrogen [23]. Therefore, the aim of this work was to carry out the evaluation of the anaerobic treatability of an expanded granular sludge bed (EGSB) bioreactor as a new sustainable alternative for treatment of CWW with bioenergy (i.e., biomethane) production.

2. Materials and Methods

2.1. Cheese Whey Wastewater (CWW)

The CWW used in this investigation was obtained from a cheese-processing factory located in Ocozocoautla de Espinosa, Chiapas, Mexico (latitude 16°45′41.26″ N and longitude, 93°22′32.35″ W). The samples were collected and stored at −20 °C until used. The CWW was analyzed according to the Standard Methods for Examination of Water and Wastewater [24]. The parameters measured were: pH, COD, BOD5, settleable solids, total solids (TS), total volatile solids (TVS), floating matter, electrical conductivity (EC), color, turbidity, acidity, alkalinity, total nitrogen (TN), total phosphorus (TP), sulfates, and fats, oil and grease (FOG). The moisture and ash content were determined according to the Association of Official Analytical Chemists [25]. The total organic carbon (TOC) was determined by the method of Walkley and Black, [26]. The pH, EC, color, turbidity, viscosity and density were measured using a digital potentiometer (Hach SenSion 3, Hach, Loveland, CO, USA), colorimeter (Hach DR900), turbidimeter (Hach 2100Q01) and viscometer (SVM 300, Anton Paar, Graz, Austria), respectively. All the tests were performed in triplicate.
The biodegradability index (BI), the competitiveness index (CI) and the FOG-wastewater index (FWI) were then calculated by using Equations (1)–(3), respectively [23]:
BI   = BOD 5 COD
CI   = COD [ SO 4 2 ]
FWI   = FOG COD

2.2. AGS Acclimatization

Before evaluation of the EGSB bioreactor, an AGS was acclimated in a lab-scale batch bioreactor of 5 L. The AGS was obtained from a full-scale upflow anaerobic sludge bed (UASB) bioreactor that operated under mesophilic conditions located at the wastewater treatment plant of the soft drink industry in Chiapa de Corzo, Chiapas, Mexico (latitude 16°42′30″ N and longitude 93°1′1″ W). The AGS was regular and spherical in shape (∅, c. 0.5–1 mm), brown-grey color with TS, TSS and TVS concentrations of 75.2 g/L, 45.9 g/L and 29.5 g/L, respectively; TVS/TS ratio of 0.39, sludge volume index (SVI) of 16.3 mL/gTSS and density of 1.043 g/mL.
AGS acclimatization was performed using the fixed efficiency strategy [27,28], gradually increasing the CWW concentration. This process consisted of feeding the AGS into a batch bioreactor with diluted CWW (pH 7 and to room temperature) from 30% (22 gCOD/L) up to 50% (45 gCOD/L) v/v the time necessary until reaching the COD removal efficiency of 90%. Once the efficiency was reached, the used CWW was drained from the batch bioreactor to subsequently restart a new cycle of operation. The AGS acclimatization was carried out in a period of 92 days with six operating cycles. During acclimatization, the pH, alkaline factor, and COD were monitored in each operation cycle.

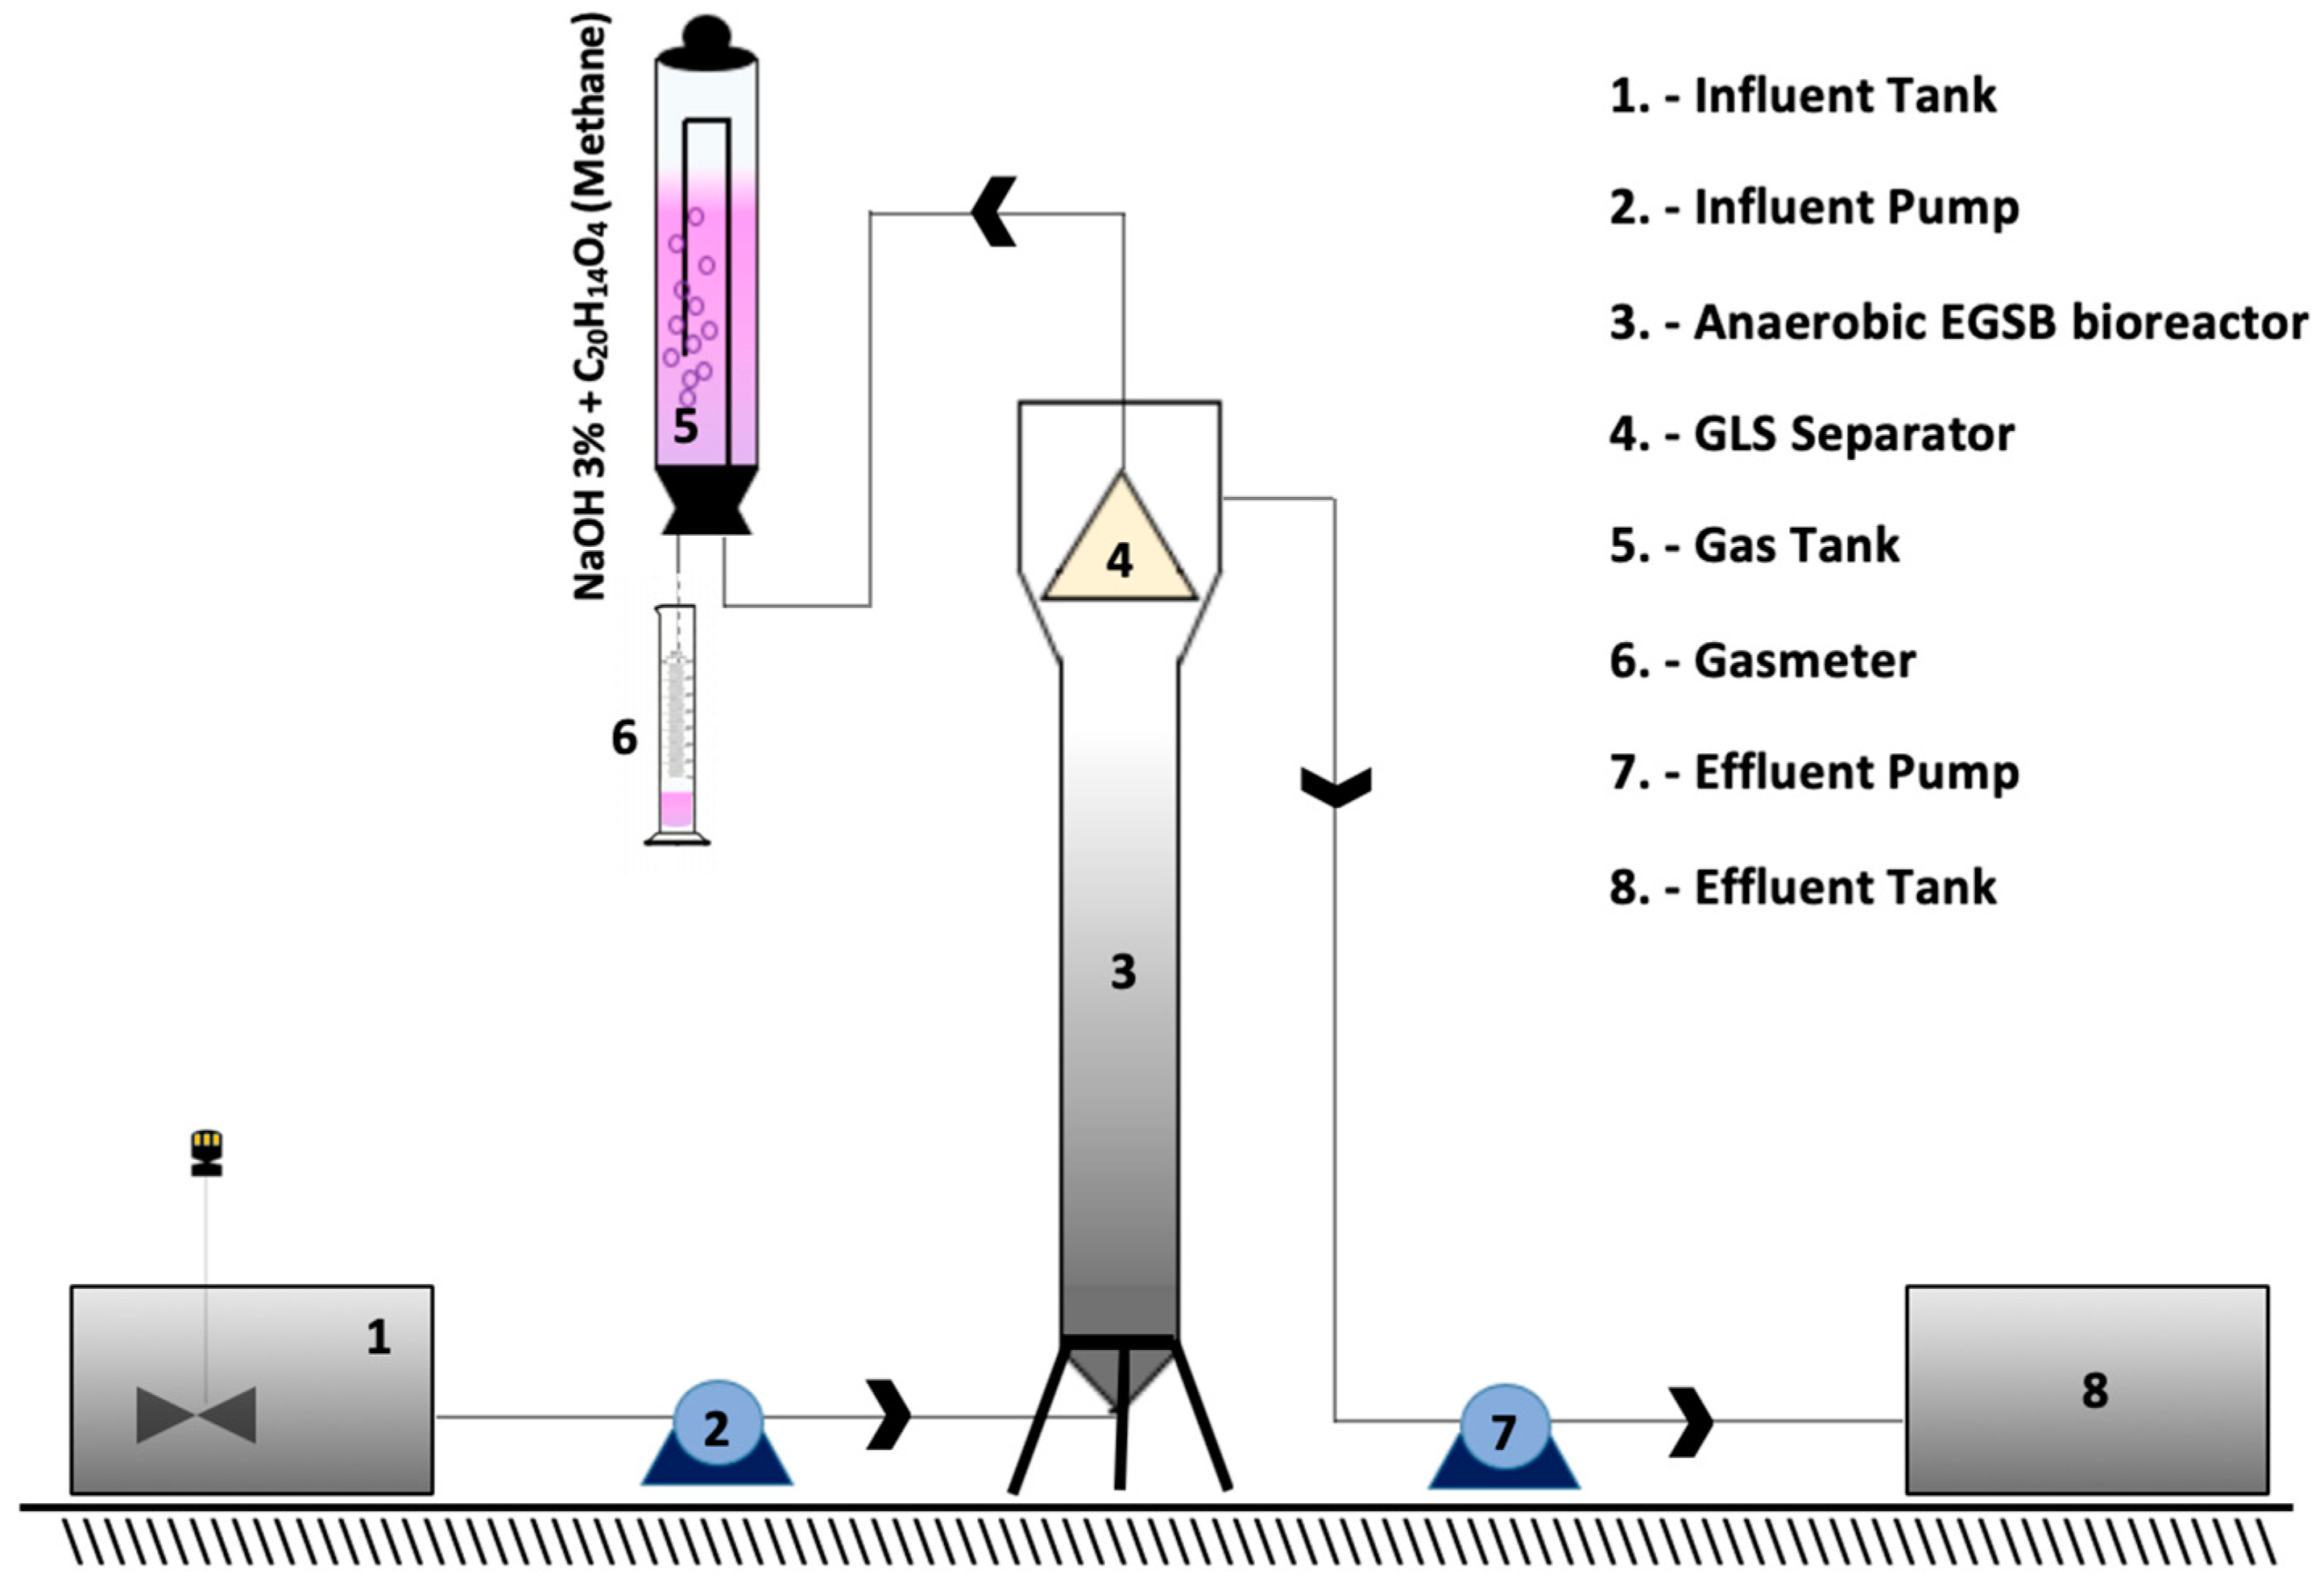
2.3. Experimental Set Up

The experimental unit consisted of a fiberglass laboratory-scale EGSB bioreactor of capacity 3.3 L (Figure 3). The bioreactor was 95 cm high and had an internal diameter (ID) of 6 cm with a height/diameter ratio of 15.8. An inverted, funnel-shaped gas–liquid-solids (GLS) separator was used at the top of the column to allow for separation of the solids and biogas from the liquid phase, and to conduct it to the gas tank. The polyethylene terephthalate gas tank was cylindrical, 50 cm high and ID of 5 cm. The EGSB bioreactor was automatically fed using a peristaltic pump (Master Flex model 7534-04) (Cole-Parmer, Vernon Hills, IL, USA) connected to a tank (polyethylene) of 1.5 L that stored the CWW (influent). The treated CWW (effluent) was also collected in a 1.5 L tank (polyethylene).

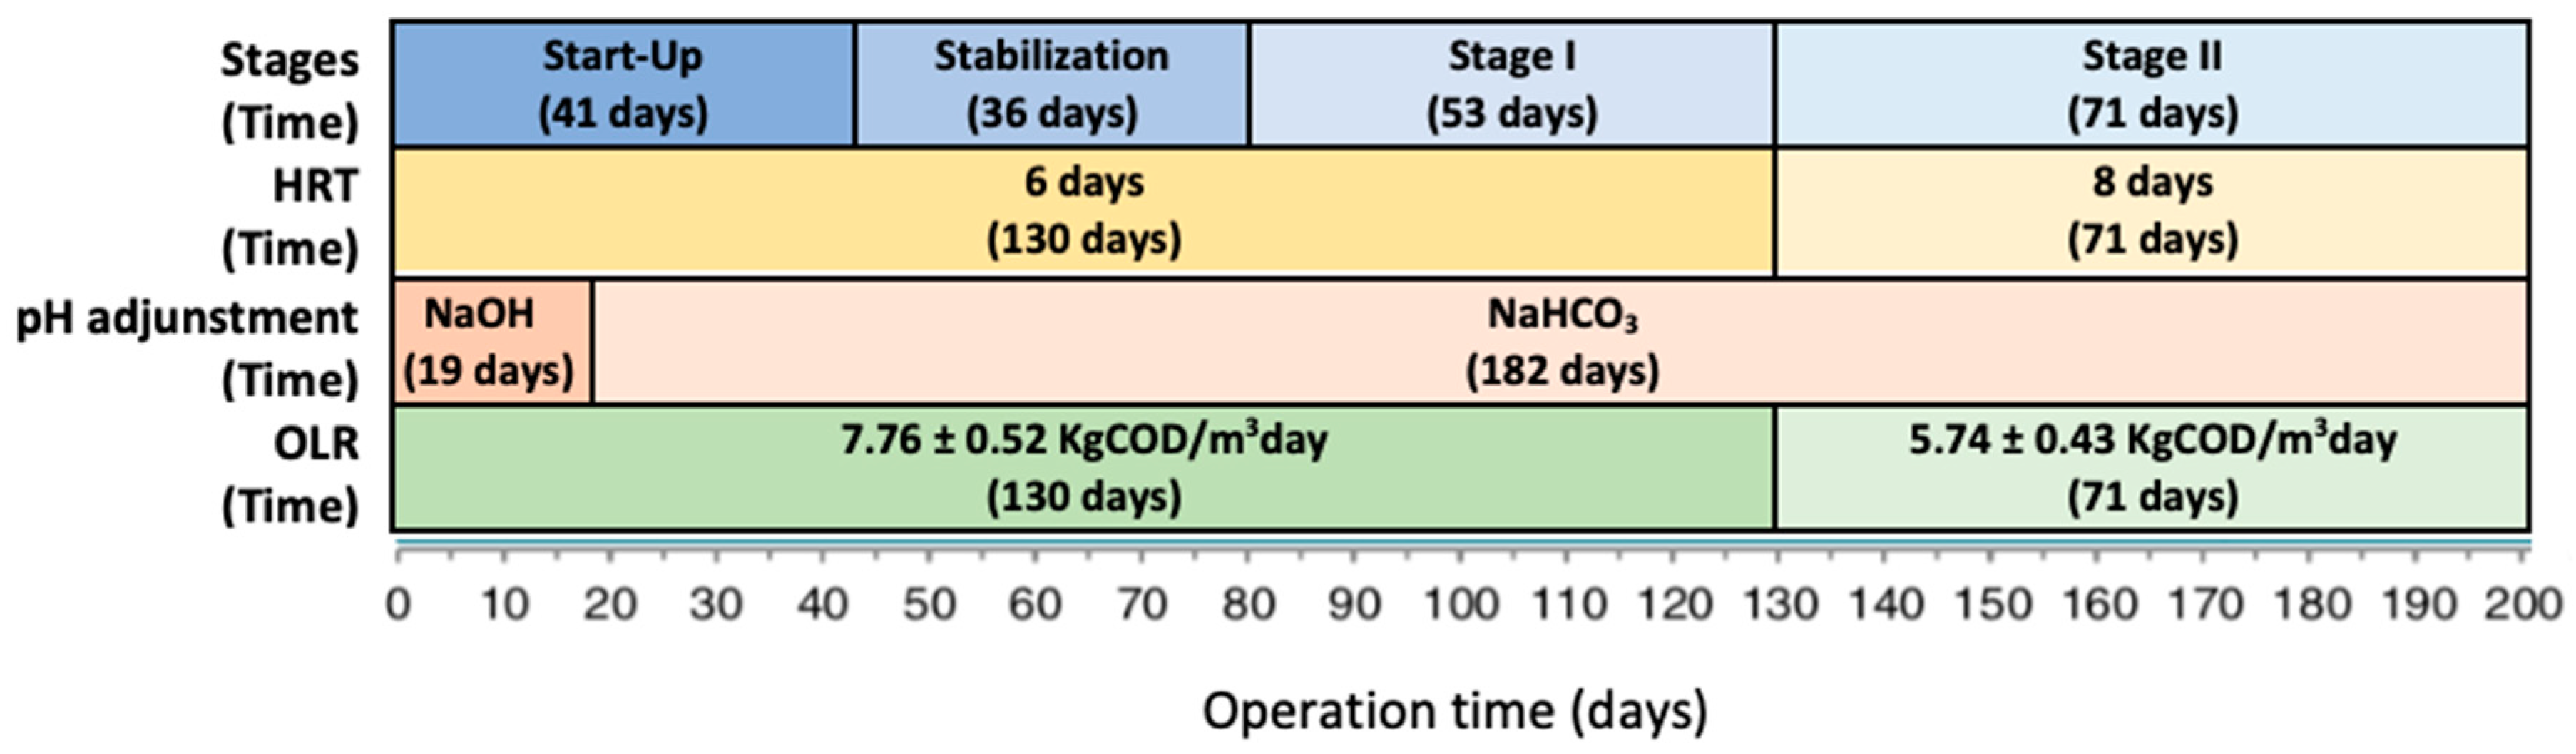
2.4. Reactor Operation

The EGSB bioreactor was inoculated with AGS (30% of bioreactor working volume) previously adapted in a batch bioreactor. It was operated under mesophilic conditions (26.6 ± 1.4 °C) for 201 days, at an HRT of 6 and 8 days, and OLR of 7.76 ± 0.52 and 5.74 ± 0.43 kg COD/m3day (Figure 4). Throughout the study the CWW (influent) concentration was 46.3 ± 3.2 g/L; and it was buffered to pH 7 with NaOH and NaHCO3.

2.5. Analytical Methods

Table 1 shows the physical and chemical examinations and determination methods adopted for the samples of influents, effluents, and biomethane of the bioreactor. The frequency and bibliographic references of the methodologies used are also listed in the table. The daily volume of methane produced in the reactors was corrected to standard temperature and pressure (273 K and 1 atm) (STP).

3. Results and Discussion

3.1. CWW Characterization

The physicochemical characterization of the CWW (as a wastewater discharge), is described in Table 2. From the data presented, we observed that all the analyzed parameters exceeded the maximum limits allowed by the World Health Organization (WHO) [33] and NOM-001-SERMARNAT-1996 (Official Mexican Environmental Regulations) [34]. As a result, the polluting potential of these agro-industries is enormous. Therefore, a risk analysis of these effluents is presented.
CWW effluents exhibit COD values of 91,600 mg/L, BOD values of 90,083 mg/L and TOC values of 33,400 mg/L, leading to a high consumption of dissolved oxygen in water bodies. With their very high concentration of organic matter, these effluents may create serious problems of organic burden on the local municipal sewage treatment systems [17] or the environment. This effluent has a high concentration of nutrients as TN (2200 mg/L) and TP (707 mg/L). Due to the elevated TP and TN contents, CWW pose a considerable risk of eutrophication in receiving waters [16], particularly in lakes and slow-moving rivers. Eutrophication leads to many water quality problems, including generating blooms of toxic or tainting phytoplankton forms; increasing plant/algal biomass production; occurrence of blooms of micro-algae which may be a nuisance and cause aesthetic pollution; along with a decline or disappearance of certain perennial plants, often replaced by annual, fast growing opportunistic species such as foliose or filamentous green algae. Additional problems include reduced diversity of the flora (and associated fauna); changes to photic regime through shading, increase in microbial community and thus oxygen depletion, leading to hypoxic processes such as H2S and CH4 production; development of opportunistic macrobenthic populations; poor water quality, especially water column oxygen depletion, thus affecting fishes and zooplankton; and the mortality of higher organisms through effects of neuro-toxins [5,11,28,31,35,36,37]. Furthermore, a low pH (4.33) can encourage the solubility of heavy metals. As the level of hydrogen ions increases, metal cations such as aluminum, lead, copper and cadmium are released into the water instead of being absorbed into the sediment. As the concentrations of heavy metals increase, their toxicity also increases. In addition, mobilized metals can be taken in by organisms, causing physiological damage and even increasing mortality rates [5,38,39]. For all the above-mentioned reason, it can be considered as an aggressive effluent, whose direct discharge to water bodies can cause a serious environmental impact, as well as severe health problems for the population.
On the other hand, with the data obtained by the National Institute of Statistics and Geography (INEGI); Secretariat of Agriculture, Livestock, Rural Development, Fisheries and Food (SAGARPA); Secretariat of the Economy (SE), Federal Commission for Protection Against Sanitary Risk (COFEPRIS), and the physicochemical characterization presented in this investigation, an analysis was carried out in order to measure the impact that these wastewaters cause to the environment. The amount of wastewater generated by an average person is 135 L/day with a concentration of 220 mgDBO5/L. Therefore, a person generates a daily contribution of organic matter of 29,700 mgDBO5/day, and the amount of CWW generated in the state of Chiapas is 510,000 L/day [40] with an organic load 90,083 mgDBO5/L (value determined in the physicochemical analysis). The dairy agro-industry in the state of Chiapas generates a daily contribution of organic matter of 4.60 × 10¹⁰ mgDBO5/day. Therefore, this agro-industry generates pollution similar to that produced by 1,546,880 inhabitants (comparable to the pollution generated by 27% of the population of the state of Chiapas).
However, according to the physical-chemical profile, the CWW has great potential to be treated in anaerobic EGSB bioreactor, since it presents a high BI (0.98) > 0.3, FWI (0.056) < 0.2, IC (5388) > 10, and a C/N relationship (1/15). These values suggest the suitability of biological process application according to the report by Cruz-Salomón et al. [23]. Hence, CWW can be a suitable substrate for the anaerobic treatment in EGSB bioreactor with high biomethane production.

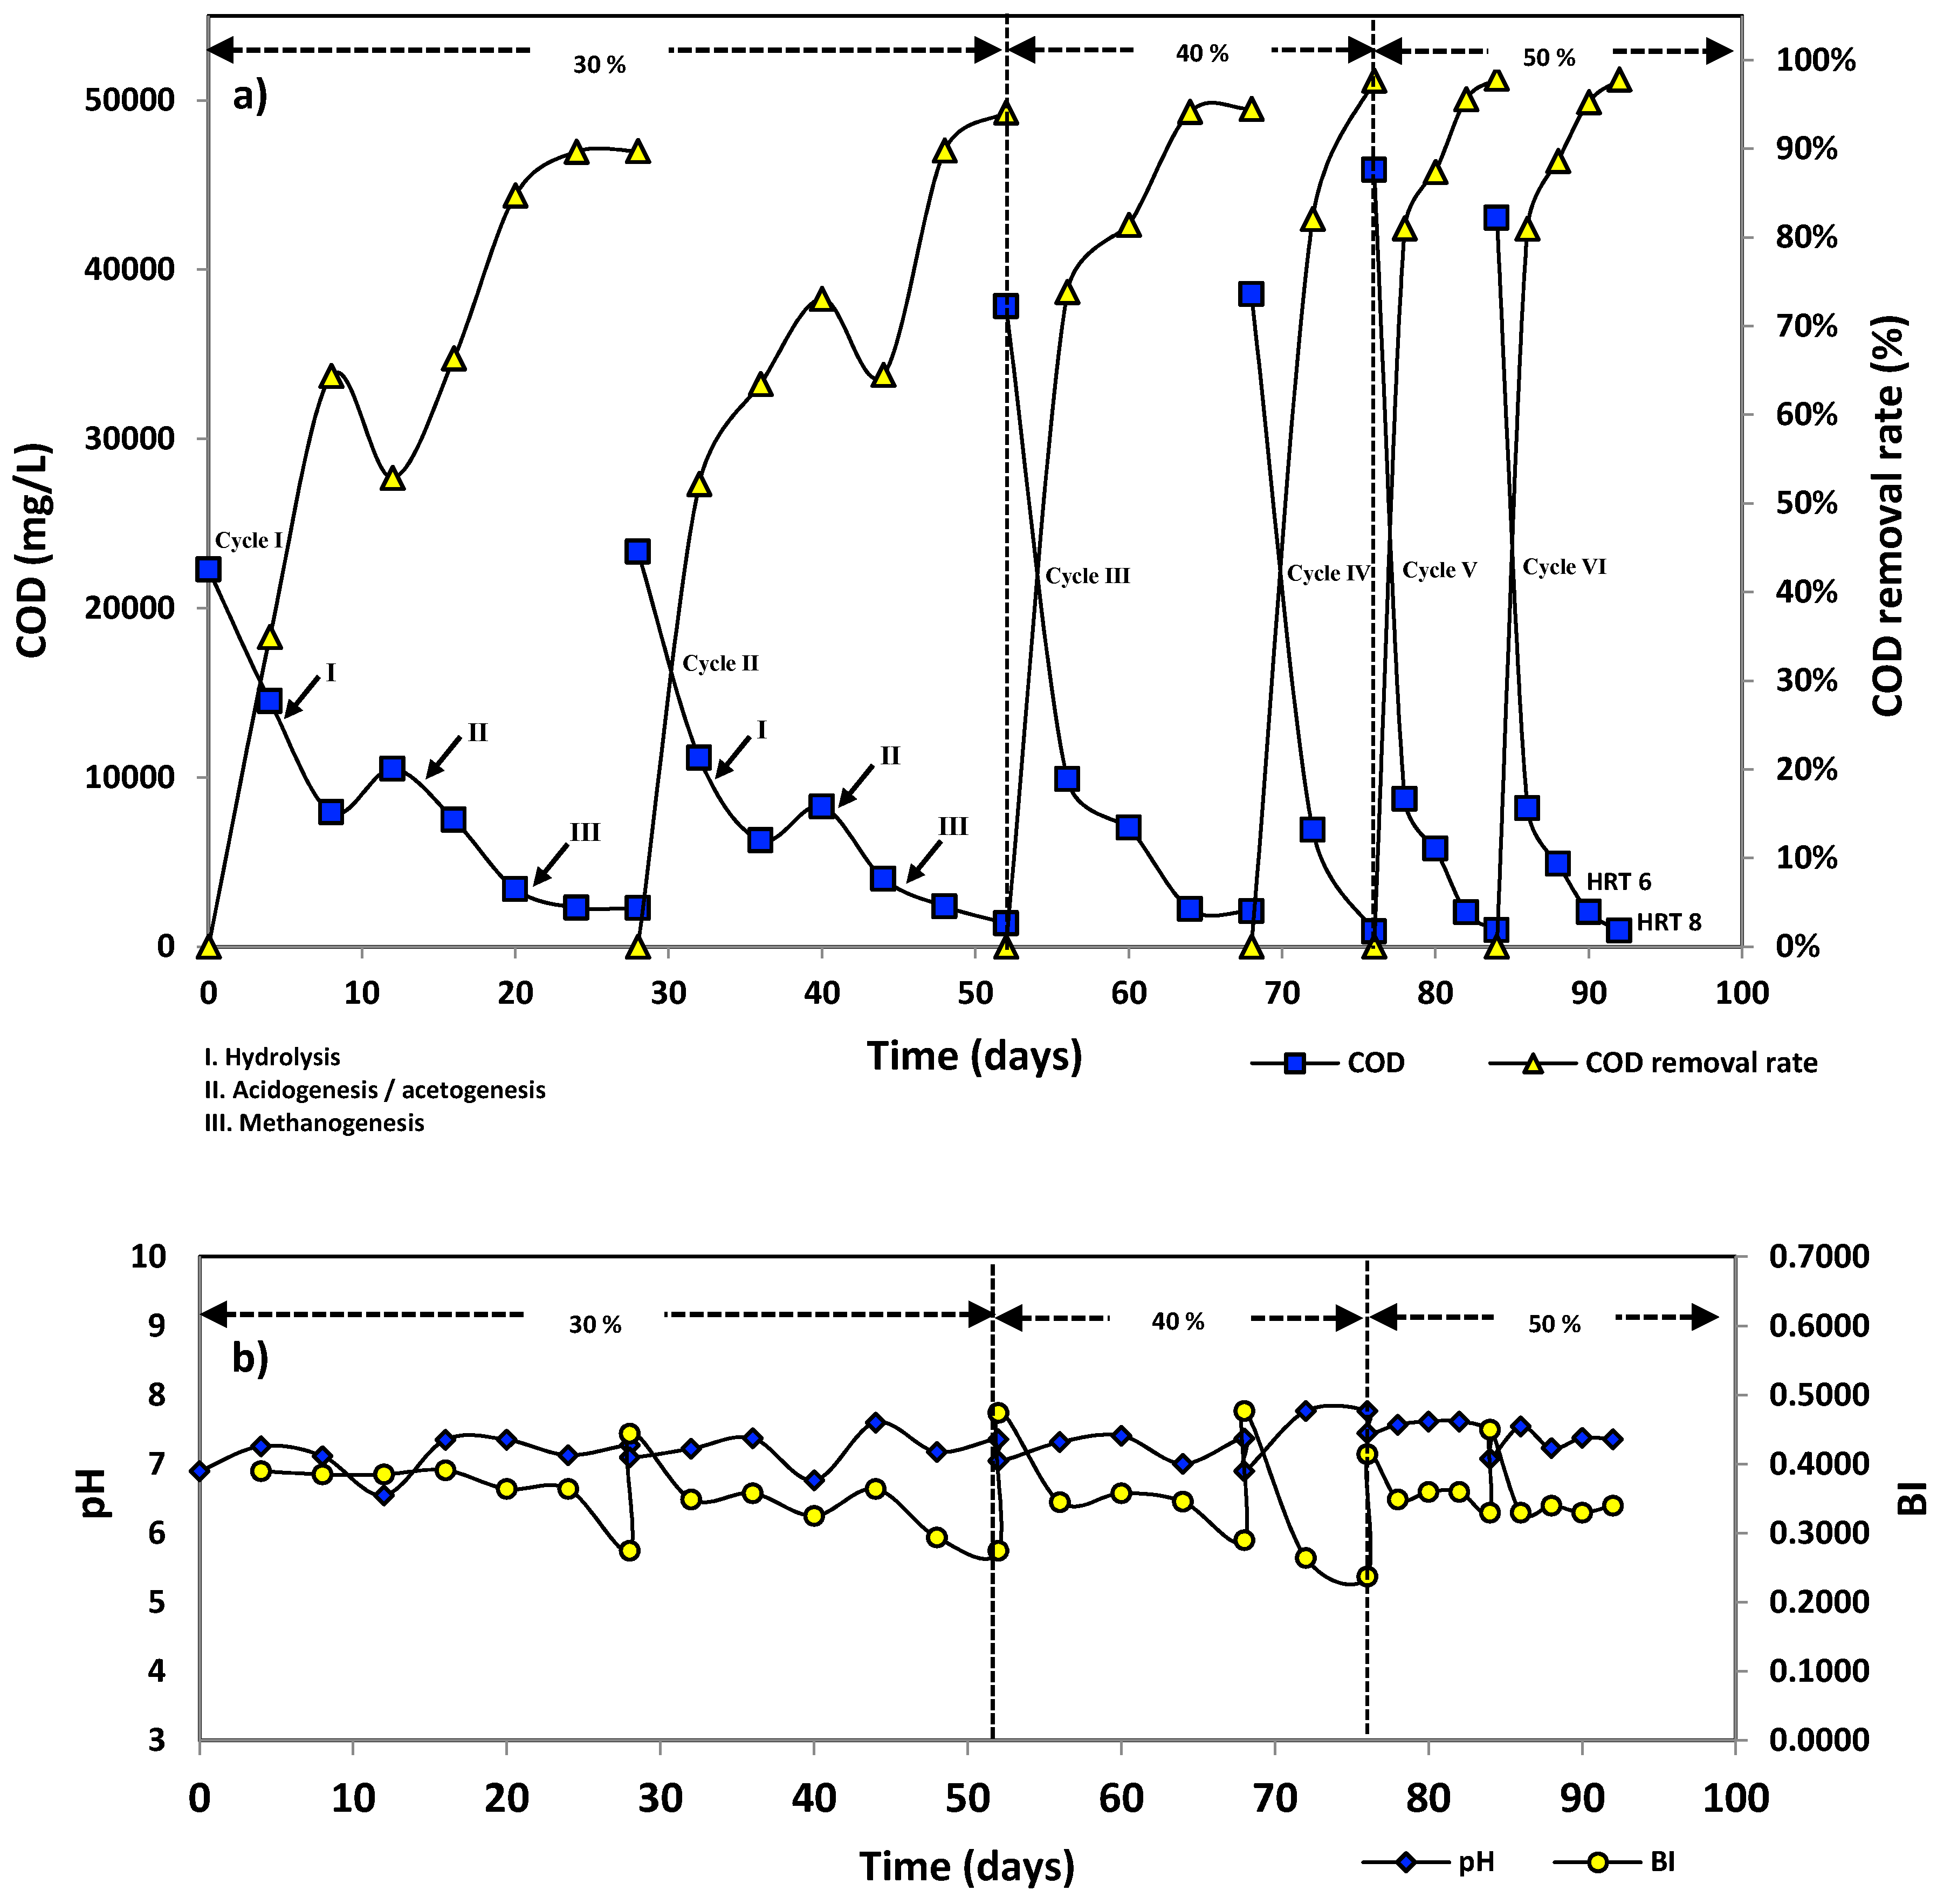
3.2. AGS Acclimatization

The first step to increase the efficiency of the anaerobic bioreactor is the acclimatization of microorganisms (anaerobic granular sludge). This process may occur when microorganisms are contacted with new substrates in a favorable environment [41]. Because of this reason, Figure 5a shows the kinetic AGS acclimatization in the batch reactor favoring their environmental conditions. Six cycles at different dilutions (30 to 50% v/v) were made. During acclimatization, the relationship between the number of cycles and HRT was inversely proportional. This is because the time that the microorganisms invest in the degradation of organic matter decreases even though the concentration increases with each cycle. This phenomenon is due to the fact that in the AGS, there is selection and multiplication of specialized microorganisms during this phase. In addition, there may be physiological changes in the metabolic system of microorganisms, i.e., alterations in regulation and enzymatic production, and mutations [27,42,43]. In this study, the acclimatization of the AGS was achieved in 92 days and HRT decreased from 28 days (cycle I) to 6 days (cycle VI).
Furthermore, in cycle I and II (first 52 days) the anaerobic digestion stages can be observed. During the first 8 days (cycle I) and 28–36 days (cycle II) the hydrolysis stage can be seen with the rapid decrease in COD. Between days 8–16 (cycle I) and 36–44 (cycle II), the acidogenesis/acetogenesis stages can be seen, with the increase or maintenance of COD value, since at this stage the microorganisms release short-chain acids into the medium, which are detected in the COD analysis. And finally, on days 16–32 (cycle I) and 44–52 (cycle II) the methanogenesis stage is observed with a new decrease in COD, since methanogenic microorganisms consume short-chain organic acids, releasing them from the liquid matrix in the form of CH4 and CO2 [44]. However, the phenomenon described above, becomes undetectable with the passing of the cycles (according to the degree of acclimatization of the microorganisms), as can be seen in cycle IV, V and VI, where HRT for COD removal over 90% was 6 days.
On the other hand, in order to favor the acclimatization of the AGS, environmental conditions such as temperature and pH were controlled [41], in addition to monitoring the buffer index (Figure 5b). The results showed that the batch bioreactor operated in a stable condition (BI of 0.35 ± 0.05 and pH of 7.29 ± 0.3) according to the report by Perez and Torres, [45] and Mao et al. [46], thus allowing adequate acclimatization.

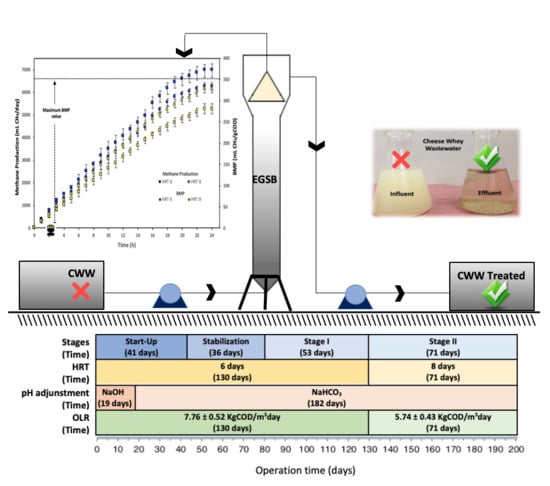
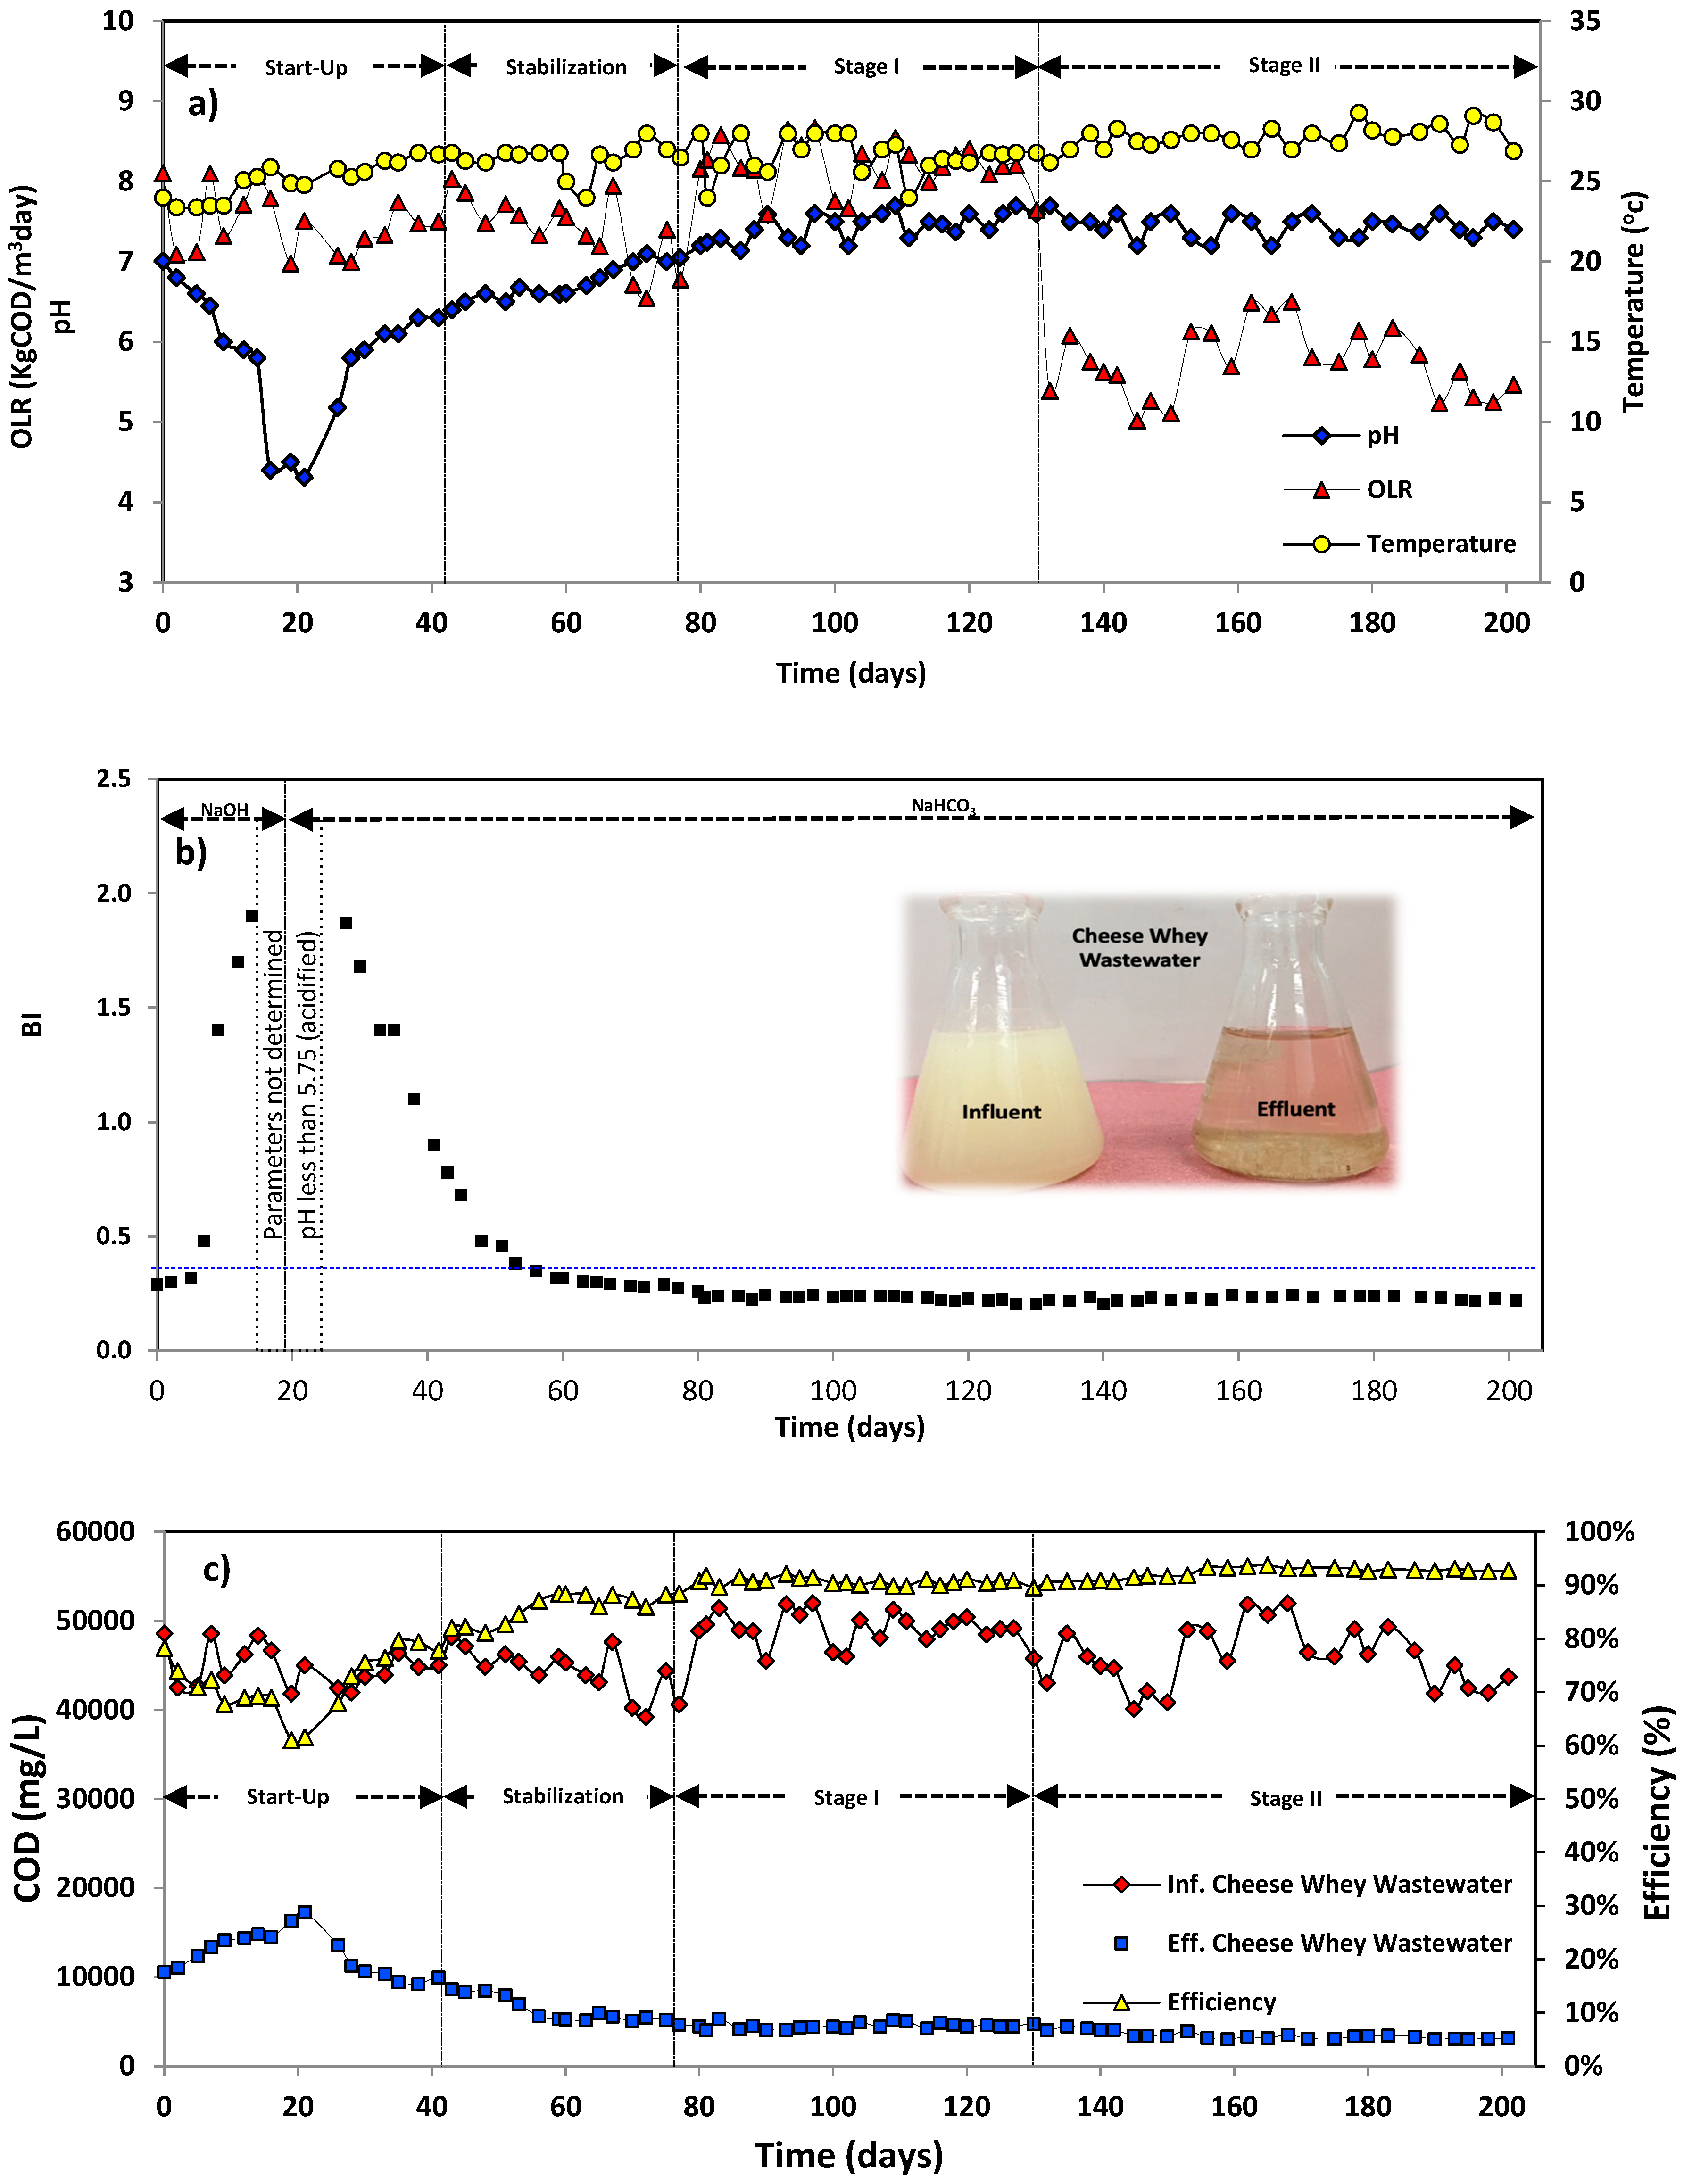
3.3. EGSB Bioreactor Operation Analysis

The results obtained from the start-up, stabilization, stage I and II of the EGSB bioreactor are presented below (Figure 6). The EGSB bioreactor was operated over 201 days at mesophilic range (26.6 ± 1.4 °C) and pH of 7.22 ± 0.40.
Figure 6a shows that although the influents were conditioned at a pH of 7 with NaOH, it can be observed that in the first 19 days (start-up), the pH of the EGSB bioreactor decreased to reach a pH of 4.4 (i.e., it underwent acidification). This caused disturbances similar to those reported by Malaspina et al. [47], like acidification and production of an excess of viscous extracellular polymeric materials. This phenomenon is probably due to the over-production of exopolysaccharides of bacterial origin; their synthesis uses mono- and disaccharides, glucosamines and uronic acids as substrates, and is favoured by high concentrations of sugars and by high C/N ratios.
In order to solve this problem, the NaOH was replaced by NaHCO3 from the 21st day, after which the pH increased gradually until reaching an average pH of 7.22 ± 0.40, which is favorable to carry out anaerobic digestion as reported by Mao et al. [46].
Thus, the NaHCO3 generated a greater alkalinity of the EGSB bioreactor, because this chemical compound is a very effective buffer and the HCO3/H2CO3 ratio is very high, which supposes an elevated capacity to buffer acids. The bicarbonate ion (HCO3) can combine with a proton (H+) to form carbonic acid (H2CO3), thus absorbing protons from the CWW. This raised the pH of the system and decreased the production of viscous extracellular polymeric materials, which allowed the EGSB bioreactor to operate properly during the entire evaluation (stabilization, stage I and II).
On the other hand, the buffer index (BI) is a simple and reliable control parameter to monitor the stability of the process in an anaerobic bioreactor such as EGSB, since it allows measurement of the relationship between alkalinity due to volatile fatty acids (VFAs) and total alkalinity. Its adequate variation is in the range of 0.2–0.4, which indicates that at least 60% of the total alkalinity of the system must be in the form of bicarbonate alkalinity. Lower values indicate undernourishment and higher values indicate acidification principles [45].
Figure 6b shows the behavior of this parameter (BI) throughout the period of the bioreactor evaluation. In this figure it is observed that during the first 41 days (start-up) the bioreactor presents instability since it shows BI values outside the range reported by Rojas, [48]. This was corroborated with the rapid decrease in pH (Figure 6a), which is indicative of the fact that the bioreactor had low bicarbonate alkalinity, and therefore it was operating unstably (presenting acidification). To avoid this behavior, it was decided to change NaOH for NaHCO3 to increase alkalinity in the bioreactor. This compound is considered to be the main bicarbonate alkalinity supplement and is the only product which gently changes the balance of the medium to achieve a desired value, without altering the physical-chemical balance of the delicate biological community. After the change, the pH began to increase until reaching stability, according to what was reported by Mao et al. [46], and the BI began to decrease until reaching values of 0.23 ± 0.1 (values within the range reported by Perez and Torres, [45]). This indicated that the bioreactor operated stably throughout the evaluation (stages I and II).
An important parameter to measure the efficiency of organic matter removal in an anaerobic bioreactor is COD. Figure 6c presents the evaluation of COD removal efficiency, where it can be seen that in the first days (start-up), the efficiency was low, because acidification caused by unfavorable conditions in the bioreactor occurred. This phenomenon was produced by the lack of bicarbonate alkalinity and high production of VFAs (BI > 0.4), because VFAs were not consumed at the same rate as they were produced by acidogenic bacteria, causing their accumulation in the system. Free acids that cannot be neutralized caused a rapid decrease in available alkalinity with the consequent decrease in pH to values of 4.4. This phenomenon was similar to that reported by Rodgers et al. [49], where he recommends alkali supplementation during the start-up period or during the process to avoid acidification of the CWW-fed bioreactor. Therefore, when using NaHCO3, a rapid recovery of the pH was observed maintaining values of 7.22 ± 0.4 and BI values of 0.23 ± 0.1, which resulted in a greater elimination of COD because the bioreactor was operating in favorable conditions. On average, the efficiency of the COD removal rates for stage I and II was 90 and 92%, respectively (without significant statistical difference). These COD removal efficiencies obtained with the EGSB bioreactor are better than those reported by other researchers who have treated the CWW with other reactors such as a continuously stirred tank reactor (CSTR), Up-flow anaerobic filter (UAF), downflow fixed-film reactor, rotating biological contactor (RBC) reactor, anaerobic sequencing batch reactor (ASBR), anaerobic batch reactor, among others; they have report COD removal efficiencies of 60 up to 90% using diluted CWW (COD up to 31 g/L) [16,21,22].
However, even when the removal percentage was high (Table 3), effluents were generated with high concentrations of COD, BOD5, TS, TN, color and Turbidity. Therefore, these effluents cannot yet be discharged to the sewage system or to surface water bodies (for example, rivers, lakes, etc.), since it still does not comply with environmental regulations [34]. It is recommended to increase the HRT, add an effluent recirculation, a second anaerobic treatment or an aerobic treatment combined with another method.

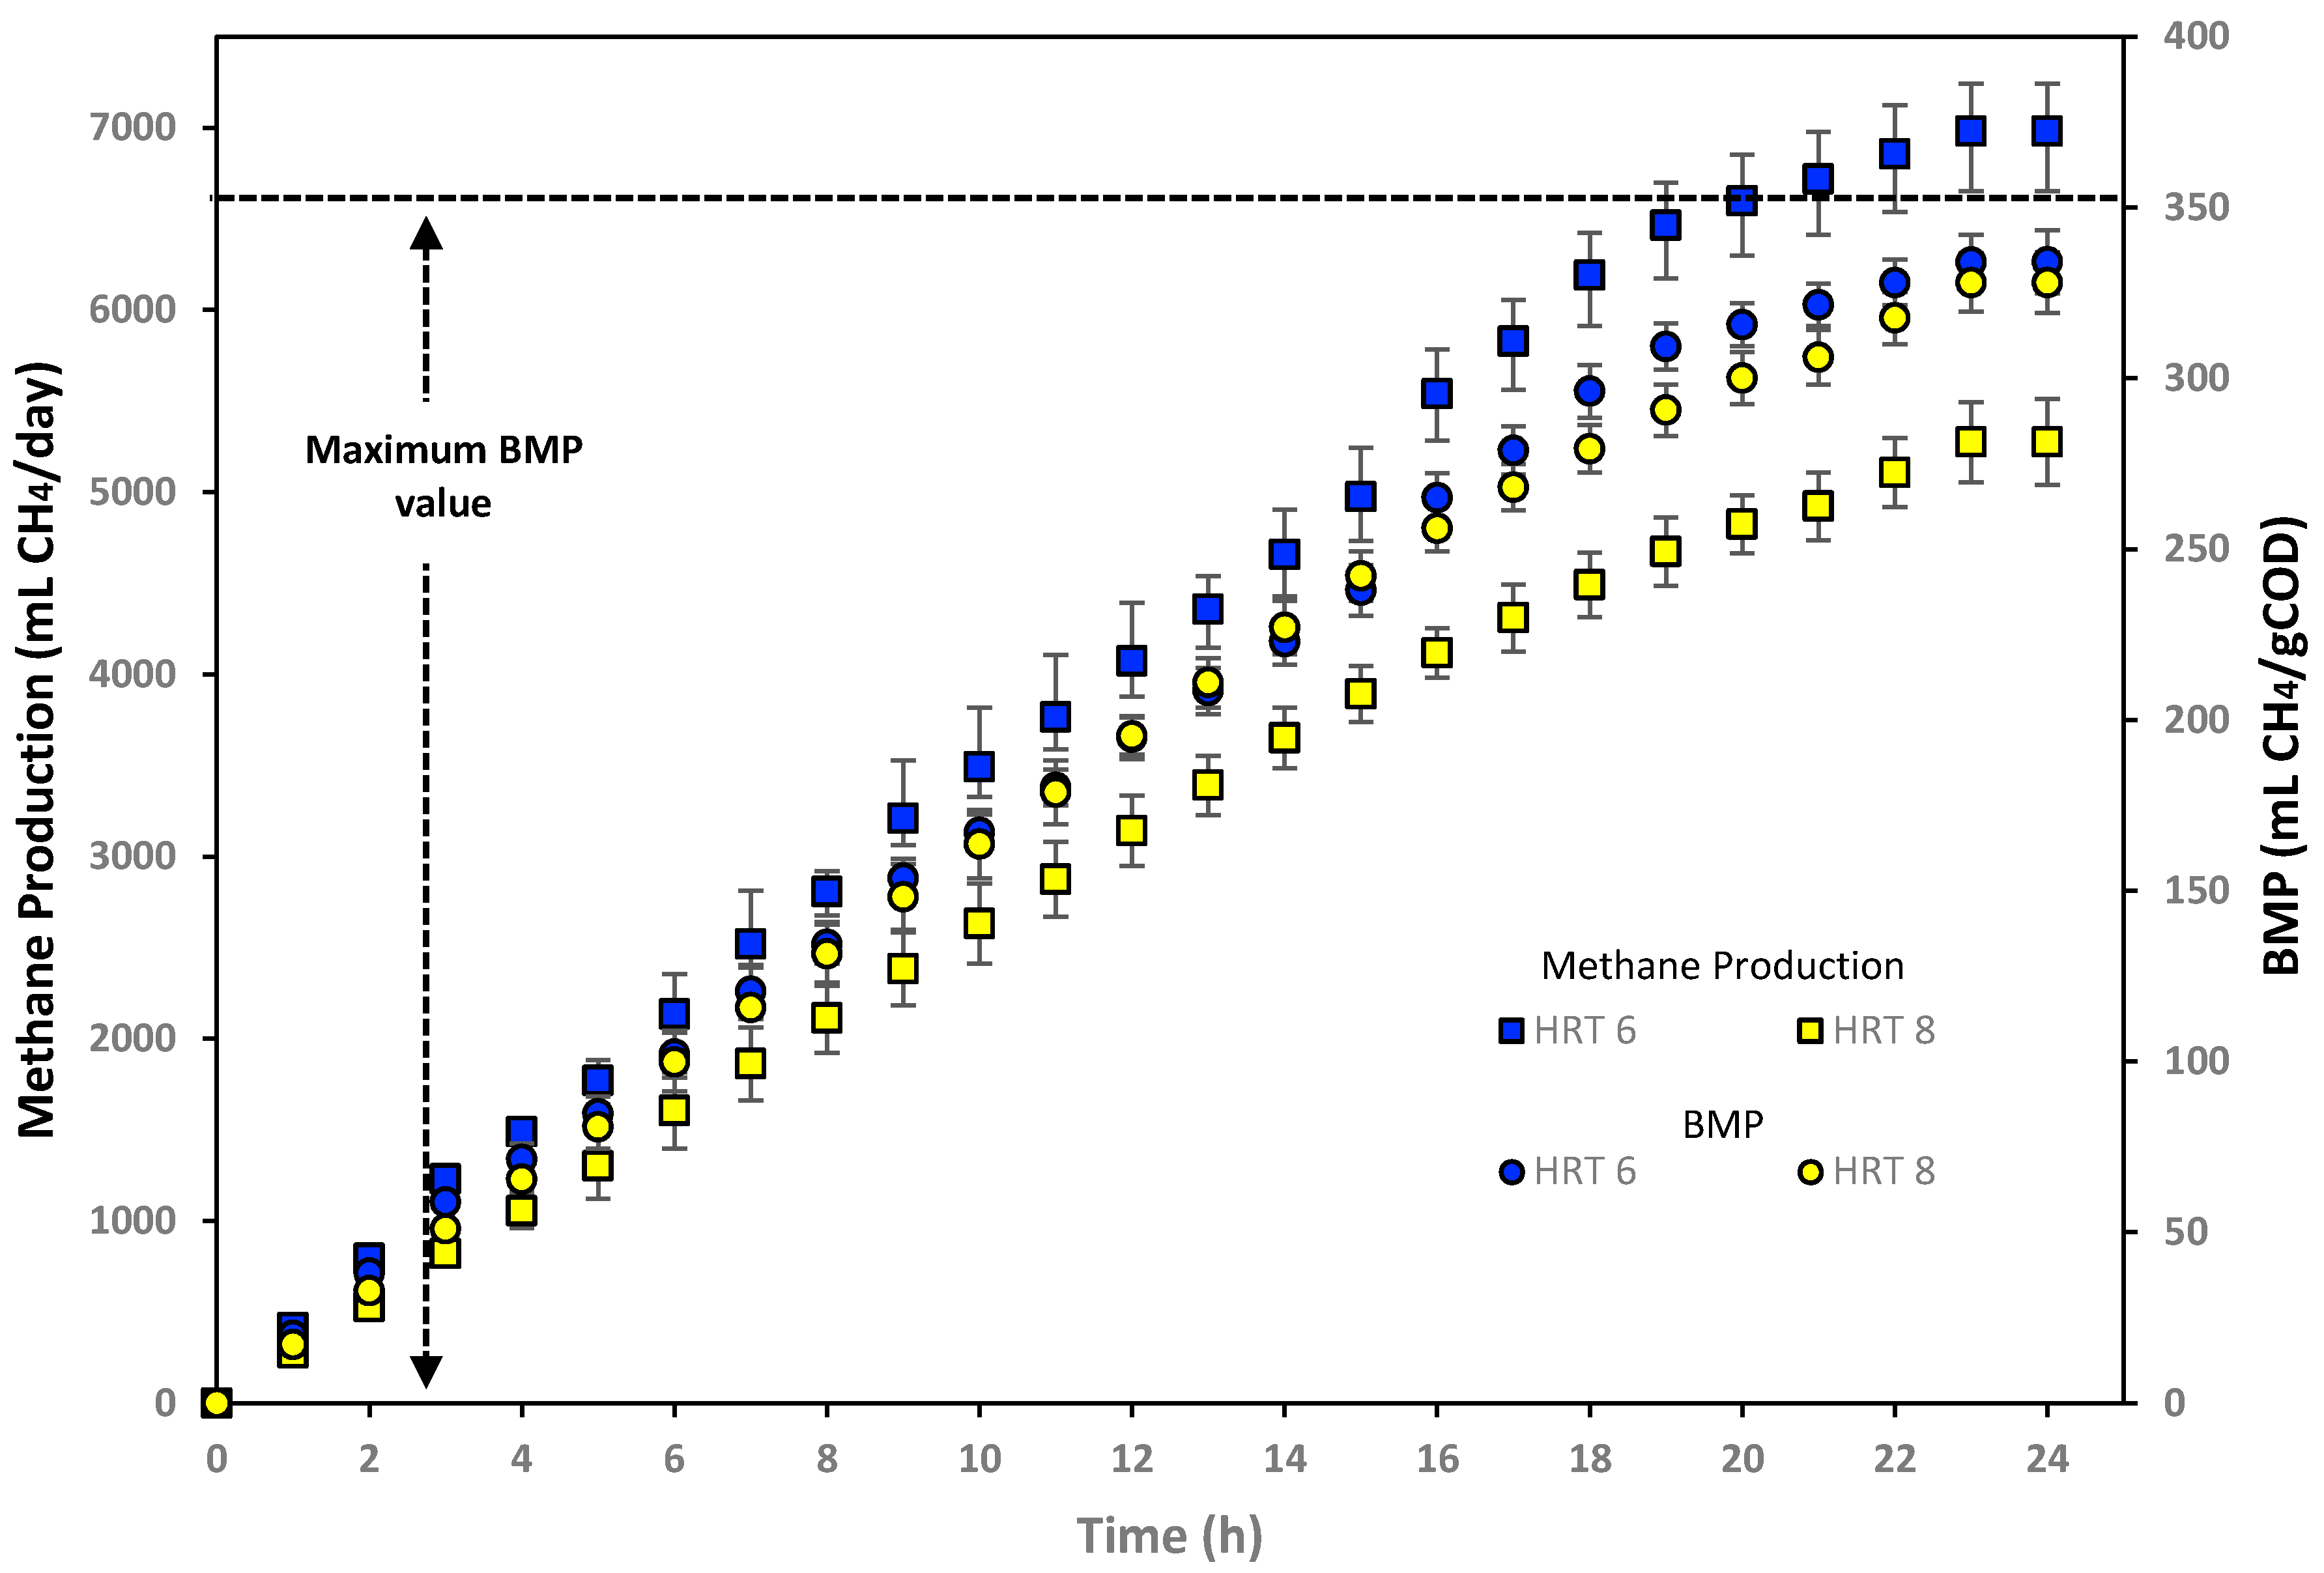
3.4. Biomethane Production

Biomethane is a type of renewable natural gas obtained from anaerobic fermentation of waste (like wastewaters) under controlled conditions. This gas is similar to natural gas found in nature and can therefore be substituted for it. It is bio because it is produced from the degradation of organic waste. It has the same properties and advantages, so it can be used as fuel or for the production of heat or electricity. Therefore, it is an energy alternative that contributes significantly to the reduction of greenhouse gas (GHG) emissions. During stage I and II of the evaluation of the EGSB bioreactor, biomethane production (Figure 7) and biomethane production rates (MPR) were measured. The values obtained were 6981 mL CH4/day and 2.327 mL CH4/cm3 of bioreactor per day; 5274 mL CH4/day and 1.758 mL CH4/cm3 of bioreactor per day, respectively. The biomethane production and MPR showed a statistically significant difference (p < 0.05) for each HRT. This phenomenon was expected because there is a greater quantity of substrate in stage I than in stage II, therefore the microbial consortium generates more biomethane in stage I than II. The higher biomethane production generated is attributed to the fact that CWW is a highly biodegradable substrate, as shown in its BI in Table 2.
On the other hand, BMP is defined as the amount of methane produced for a given quantity of organic matter removed, is the result of the activity of the anaerobic consortium (i.e., catabolism) and depends on the fraction of the biodegradable matter [50] and the nature of the compounds [51,52]. That is, maximum BMP value is 350 mL CH4/gCOD removal [28,32,53] when the anaerobic ecosystem uses carbon for anaerobic respiration, growth and maintenance only. In this investigation, the BMP (Figure 6) values obtained were 334 and 328 mLCH4/gCOD, respectively. These values were similar because the same substrate-AGS-bioreactor was used, and therefore the values did not show significant statistical difference (p < 0.05), despite having modified the HRT in the stage I and II. Many authors have measured this parameter for CWW in bioreactors under steady conditions, and they obtained similar results [5,11,54,55].
In addition, the energy balance was performed to estimate the energy produced and the number of homes that could be powered by taking all the CWW generated in the state of Chiapas. For this calculation, the values obtained from BMP, COD concentration of CWW and COD removal efficiency of the EGSB bioreactor were used. As mentioned previously in the analysis of the environmental impact caused by the CWW, the dairy agro-industry in Chiapas produces around 510,000 L/day [40] with an organic load of 91,600 mgCOD/L (Table 2); therefore, this agro-industry generates a daily contribution of organic matter of 4.67 × 10¹⁰ mgCOD/day. However, if all these effluents were treated in an EGSB bioreactor with a COD removal efficiency of 90% and a BMP of 334 mLCH4/gCOD, such as those obtained in this investigation, it would generate around 14 × 103 m3 CH4/day.
Taking into account that the calorific value of 100% methane is 8560 Kcal/m3 [56], the use of the EGSB bioreactor in this agro-industry could generate around 120 × 106 Kcal/day equivalent to 139,560 kWh (with an efficiency of 100%). Knowing that the average consumption of electrical energy registered in a home is 250 kWh/month (8.33 kWh/day), it is concluded that this technology can satisfy the energy needs of 16,754 homes.

4. Conclusions

The evidence found in this study has highlighted that CWW is a viable substrate to be treated in the EGSB bioreactor as long as it is buffered with NaHCO3 (because the major problem associated with the EGSB bioreactor is the easy acidification of the CWW substrate is used). The efficiency of COD (>90%), BOD (>90%), TS (>70%) and TN (>87%) removal were high as the EGSB bioreactor operated under stable conditions of temperature (26.6 ± 1.4 °C), pH (7.22 ± 0.4) and BI (0.23 ± 0.1). However, these values can be improved by increasing the HRT or adding an effluent recirculation.
Also, based on biomethane production (6981 and 5274 mL CH4/day), BMP (334 and 328 mL CH4/gCOD), MPR (2.327 and 1.758 mL CH4/cm3 of bioreactor per day) and BI (0.98), this CWW treated in an EGSB bioreactor shows high potential for bioenergy production. Thus, an anaerobic EGSB bioreactor, in addition to reducing the environmental impact, helps reduce external energy dependence, with positive effects for the economy. So, this technology can be a sustainable alternative to simultaneously solve the environmental pollution that this agro-industry confronts and produce renewable and environmentally friendly bioenergy.
In addition, with this investigation we can shift the paradigm of wastewater management from treatment and disposal to beneficial utilization.

Author Contributions

A.C.-S. and E.R.-V. conceptualized and experiment designed; A.C.-S. was involved in analysis the data; A.C.-S. performed the experiments, analyzed all the samples and wrote—original draft preparation; E.R.-V., F.P.-A., S.L.-R., R.I.C.-R., M.E.D.-E. contributed reagents/materials/analysis tools; K.d.C.C.-S. and J.M.E.H.-M. contributed visualization; E.R.-V. supervise the project. All authors have read and agreed to the published version of the manuscript.

Funding

This research received no external funding.

Acknowledgments

We give thank for the access granted to the laboratories of the Instituto de Investigación e Innovación en Energías Renovables and the Facultad de Ciencias de la Nutrición y Alimentos of the Universidad de Ciencias y Artes de Chiapas, and the Polo Tecnológico Nacional para el Desarrollo de Investigación y Pruebas Analíticas en Biocombustibles of Tecnológico Nacional de México/Instituto Tecnológico de Tuxtla Gutiérrez. Also, to the laboratory of the Facultad de Ciencias Químicas of the Universidad Autónoma de Chiapas, and Consejo Nacional de Ciencia y Tecnología (CONACYT).

Conflicts of Interest

The authors declare no conflict of interest.

References

  1. Aguilar, C. Tipología de las cadenas industriales y la calidad de la leche en los Altos de Jalisco. Temas Ciencia Tecnología 2003, 7, 13–23. [Google Scholar]
  2. Castañeda-Martínez, T.; Boucher, F.; Sánchez-Vera, E.; Espinoza-Ortega, A. La concentración de agroindustrias rurales de producción de quesos en el noroeste del Estado de México: Un estudio de caracterización. Estudios Sociales 2008, 17, 75–109. [Google Scholar]
  3. Bello, J.M.L.; Lizeldi, B.V.; González, E.V.; Manzo, A.S.; Nochebuena, X.P.; Quiñones-Ramírez, E.I.; Vázquez-Salinas, C. Productos Lácteos: La ruta de la metamorfosis. Rev. Digit. Univ. 2004, 5, 1–14. [Google Scholar]
  4. Varnam, A.H.; Sutherland, J.P. Leche y Productos Lácteos, Ciencia y Tecnología de los Alimentos; Acribia: Zaragoza, España, 1995. [Google Scholar]
  5. Cruz-Salomón, A. Design and Evaluation of EGSB Bioreactors for the Treatment of Agro-Industrial Wastewaters of the State of Chiapas. Ph.D. Thesis, UNICACH, Chiapas, Mexico, 2018. [Google Scholar]
  6. Siciliano, M. Estudio de la Vida útil de Queso Crema Utilizando Microbiología Predictiva. Master’s Thesis, Universidad Tecnológica Nacional, Buenos Aires, Argentina, 2010. [Google Scholar]
  7. Gandolfo, C. Tecnología de la Elaboración de la Nata: Procesos Comunes. Available online: https://www.agroterra.com/blog/profesionales/tecnologia-de-la-elaboracion-de-la-nata-procesos-comunes/75849/ (accessed on 10 May 2020).
  8. Banks, W. Dairy products: Technology. J. Soc. Dairy Technol. 1993, 46, 83–86. [Google Scholar] [CrossRef]
  9. Sinigaglia, M.; Bevilacqua, A.M.; Corbo, M.R.; Pati, S.; Del Nobile, M.A. Use of active compounds for prolonging the shelf life of mozzarella cheese. Int. Dairy J. 2007, 18, 624–630. [Google Scholar] [CrossRef]
  10. Poncelet. Poncelet: La Enciclopedia del Queso. Available online: www.poncelet.es (accessed on 10 May 2020).
  11. Cruz-Salomón, A.; Ríos-Valdovinos, E.; Pola-Albores, F.; Meza-Gordillo, R.; Lagunas-Rivera, S.; Ruíz-Valdiviezo, V.M. Anaerobic treatment of agro-industrial wastewater for COD removal in expanded granular sludge bed bioreactor. Biofuel Res. J. 2017, 16, 715–720. [Google Scholar] [CrossRef]
  12. Ergúder, T.H.; Tezel, U.; Gúven, E.; Demirer, G.N. Anaerobic biotransformation and methane generation potential of cheese whey in batch and UASB reactors. Waste Manag. 2001, 21, 643–650. [Google Scholar] [CrossRef]
  13. Mawson, A.J. Bioconversion for whey utilization and waste abatement. Biores. Technol. 1994, 47, 195–203. [Google Scholar] [CrossRef]
  14. Gelegenis, J.; Georgakakis, D.; Angelidaki, I.; Mavris, V. Optimization of biogas production by co-digesting whey with diluted poultry manure. Renew. Energy 2007, 32, 2147–2160. [Google Scholar] [CrossRef]
  15. Panesar, P.S.; Kennedy, J.F.; Gandhi, D.N.; Bunko, K. Bioutilisation of whey for lactic acid production. Food Chem. 2007, 105, 1–14. [Google Scholar] [CrossRef]
  16. Prazeres, A.R.; Carvalho, F.; Rivas, J. Cheese whey management: A review. J. Environ. Manag. 2012, 110, 48–68. [Google Scholar] [CrossRef] [PubMed]
  17. Janczukowicz, W.; Zielinski, M.; Dębowski, M. Biodegradability evaluation of dairy effluents originated in selected sections of dairy production. Bioresour. Technol. 2008, 99, 4199–4205. [Google Scholar] [CrossRef] [PubMed]
  18. Diario Oficial de la Federación (DOF). Programa Nacional Hídrico 2014–2018. Available online: http://www.dof.gob.mx/nota_detalle.php?codigo=5339732&fecha=08/04/2014 (accessed on 19 May 2020).
  19. Deublein, D.; Steinhauser, A. Biogas from Waste and Renewable Resources. An Introduction; WILEY-VCH Verlag GmbH & Co. KGaA: Weinheim, Germany, 2008. [Google Scholar]
  20. Borja, R.; Rincón, B. Biogas Production. Ref. Modul. Life Sci. 2017, 1–24. [Google Scholar] [CrossRef]
  21. Fernández-Rodríguez, C.; Martínez-Torres, E.J.; Morán-Palao, A.; Gómez-Barrios, X. Procesos biológicos para el tratamiento de lactosuero con producción de biogás e hidrógeno. Revisión Bibliográfica Revion 2016, 29, 47–62. [Google Scholar] [CrossRef] [Green Version]
  22. Demirel, B.; Yenigun, O.; Onay, T.T. Anaerobic treatment of dairy wastewaters: A review. Process Biochem. 2005, 40, 2583–2595. [Google Scholar] [CrossRef]
  23. Cruz-Salomón, A.; Ríos-Valdovinos, E.; Pola-Albores, F.; Lagunas-Rivera, S.; Meza-Gordillo, R.; Ruíz-Valdiviezo, V.M.; Cruz-Salomón, K.C. Expanded granular sludge bed bioreactor in wastewater treatment. Glob. J. Environ. Sci. Manag. 2019, 5, 119–138. [Google Scholar]
  24. American Public Health Association (APHA). Standard Methods for the Examination of Water and Wastewater, 20th ed.; American Public Health Association/American Water Works Association/Water Environment Federation: Washington, DC, USA, 2005. [Google Scholar]
  25. Association of Official Analytical Chemists (AOAC). Official Methods of Analysis, 21th ed.; Association of Analytical Chemists: Arlington, VA, USA, 2019. [Google Scholar]
  26. Walkley, A.; Black, I. An examination of the Degtjareff method for determining organic carbon in soils: Effect of variations in digestion conditions and of inorganic soil constituents. Soil Sci. 2006, 63, 251–263. [Google Scholar] [CrossRef]
  27. Moreno-Andrade, I.; Buitrón, G. Variation of the microbial activity during the acclimation phase of an SBR system degrading 4-chlorophenol. Water Sci. Technol. 2004, 5, 251–258. [Google Scholar] [CrossRef]
  28. Ramos-Vaquerizo, F.; Cruz-Salomón, A.; Ríos-Valdovinos, E.; Pola- Albores, F.; Lagunas-Rivera, S.; Ruíz-Valdiviezo, V.M.; Simuta-Champo, R.; Moreira-Acosta, J. Anaerobic treatment of vinasse from sugarcane ethanol production in expanded granular sludge bed bioreactor. J. Chem. Eng. Process. Technol. 2018, 9, 375. [Google Scholar]
  29. Normas Mexicanas (NMX-AA-045-SCFI-2001). Análisis de Agua-Determinación de Color Platino Cobalto en Aguas Naturales, Residuales y Residuales Tratadas. Available online: https://www.gob.mx/cms/uploads/attachment/file/166781/NMX-AA-045-SCFI-2001.pdf (accessed on 19 May 2020).
  30. Norma Mexicana (NMX-AA-026-SCFI-2010). Análisis de Agua-Determinación de Nitrógeno Total Kjeldahl en Aguas Naturales, Residuales y Residuales Tratadas. Available online: https://www.gob.mx/cms/uploads/attachment/file/166772/NMX-AA-026-SCFI-2010.pdf (accessed on 19 May 2020).
  31. Cruz-Salomón, A.; Ríos-Valdovinos, E.; Pola-Albores, F.; Lagunas-Rivera, S.; Meza-Gordillo, R.; Ruíz-Valdiviezo, V.M. Evaluation of hydraulic retention time on treatment of coffee processing wastewater (CPWW) in EGSB bioreactor. Sustainability 2018, 10, 83. [Google Scholar] [CrossRef] [Green Version]
  32. Cruz-Salomón, A.; Meza-Gordillo, R.; Rosales-Quintero, A.; Ventura-Canseco, C.; Lagunas-Rivera, S.; Carrasco-Cervantes, J. Biogas production from a native beverage vinasse using a modified UASB bioreactor. Fuel 2017, 198, 170–174. [Google Scholar] [CrossRef]
  33. World Health Organization (WHO). Guideline for Discharge of Industrial Effluent Characteristics; WHO: Geneva, Switzerland, 1995; Volume 3, pp. 231–236. [Google Scholar]
  34. Official Mexican Environmental Regulations. NOM-001- SEMARNAT-1996; Comisión Nacional del Agua: Ciudad de México, México, 2015.
  35. Elliott, M.; Jonge, V.N. The management of nutrients and potential eutrophication in estuaries and other restricted water bodies. Hydrobiologia 2002, 475, 513–524. [Google Scholar] [CrossRef]
  36. Prazeres, A.R.; Carvalho, F.; Rivas, J. Fenton-like application to pretreated cheese whey wastewater. J. Environ. Manag. 2013, 129, 199–205. [Google Scholar] [CrossRef] [PubMed]
  37. Osorio-González, C.S.; Sandoval-Salas, F.; Hernández-Rosas, F.; Hidalgo-Contreras, J.V.; Gómez-Merino, F.C.; Ávalos de la Cruz, D.A. Potential for the use of cheese whey in Mexico. Agroproductividad 2018, 11, 101–106. [Google Scholar]
  38. Eze, V.C.; Onwuakor, C.E.; Orok, F.E. Microbiological and Physicochemical Characteristics of Soil Contaminated With Used Petroleum Products in Umuahia, Abia State, Nigeria. J. Appl. Environ. Microbiol. 2014, 2, 281–286. [Google Scholar]
  39. Lükewille, A.; Jeffries, D.; Johannessen, M.; Raddum, G.; Stoddard, J.; Traaen, T. Transboundary Air Pollution. International Cooperative Programmed on Assessment and Monitoring of Acidification of Rivers and Lakes. The Nine-Year Report: Acidification of Surface Water in Europe and North America–Long-Term Developments (1980s and 1990s); NIVA-Report n° 3637–97:168; ICP Waters: Oslo, Norway, 2003. [Google Scholar]
  40. Vázquez-Esnoval, C.O.; Pinto-Ruiz, R.; Rodríguez-Hernández, R.; Carmona de la Torre, J.; Gómez de Jesús, A. Use, production and nutritional quality of whey milk in the central region of Chiapas. Avances Investigación Agropecuaria 2017, 21, 65–75. [Google Scholar]
  41. Aelion, C.M.; Dobbins, D.C.; Pfaender, F.K. Adaptation of aquifer microbial communities to the biodegradation of xenobiotic compounds: Influence substrate concentration and preexposure. Environ. Toxicol. Chem. 1989, 8, 75–86. [Google Scholar] [CrossRef]
  42. Buitrón, G.; Moreno, J. Modeling of the acclimation/deacclimation processes of a mixed culture degrading 4-chlorophenol. Water Sci. Technol. 2004, 49, 79–86. [Google Scholar] [CrossRef]
  43. Wiggings, B.A.; Jones, S.H.; Alexander, M.A. Explanations for the acclimation period preceding the mineralization of organic chemicals in aquatic environments. App. Environ. Microbiol. 1987, 53, 791–796. [Google Scholar] [CrossRef] [Green Version]
  44. Gavala, H.N.; Angelidaki, I.; Birgitte, K. Kinetics and Modeling of Anaerobic Digestion Process. Adv. Biochem. Eng. Biotechnol. 2003, 81, 58–93. [Google Scholar]
  45. Pérez, A.; Torres, P. Alkalinity indices for control of anaerobic treatment of readily acidifiable wastewaters. Ingeniería Competitividad 2008, 10, 41–45. [Google Scholar]
  46. Mao, C.; Feng, Y.; Wang, X.; Ren, G. Review on research achievements of biogas from anaerobic digestion. Renew. Sustain. Energy Rev. 2015, 45, 540–555. [Google Scholar] [CrossRef]
  47. Malaspina, F.; Stante, L.; Cellamare, C.M.; Tilche, A. Cheese whey and cheese factory wastewater treatment with a biological anaerobic–aerobic process. Water Sci. Technol. 1995, 32, 59–72. [Google Scholar] [CrossRef]
  48. Rojas, O. La Alcalinidad Como Parámetro de Control de los Ácidos Grasos Volátiles en Digestores UASB; Curso Sobre Tratamiento Anaerobio de Aguas Residuales, Programa de Posgrado en Ingeniería Sanitaria y Ambiental, Universidad del Valle: Cali, Colombia, 2004; pp. 101–105. [Google Scholar]
  49. Rodgers, M.; Xin-Min, Z.; Dolan, B. Mixing characteristics and whey wastewater treatment of a novel moving anaerobic biofilm reactor. J. Environ. Sci. Health Part A Toxic/Hazard Subst. Environ. Eng. 2004, 39, 2183–2193. [Google Scholar] [CrossRef]
  50. Borja, R.; Martin, A.; Luque, M.; Alonso, V. Kinetics of methane production from wine distillery wastewater in an immobilised cell bioreactor using sepiolite as support medium. Resour. Conserv. Recycl. 1994, 10, 317–327. [Google Scholar] [CrossRef]
  51. Van den Berg, L. High rate reactors for methane production. In Biotechnology and Renewable Energy; Moo-Young, M., Ed.; Elsevier: Amsterdam, The Netherlands, 1986; pp. 268–275. [Google Scholar]
  52. Michaud, S.; Berneta, N.; Buffiére, P.; Roustan, M.; Moletta, R. Methane yield as a monitoring parameter for the start-up of anaerobic fixed film reactors. Water Res. 2002, 36, 1385–1391. [Google Scholar] [CrossRef]
  53. Jennett, J.C.; Dennis, N.D. Anaerobic filter treatment of pharmaceutical waste. J. Water Pollut. Control Fed. 1975, 45, 104–121. [Google Scholar]
  54. Labatut, R.A.; Largus, T.A.; Norman, R.S. Biochemical methane potential and biodegradability of complex organic substrates. Bioresour. Technol. 2011, 102, 2255–2264. [Google Scholar] [CrossRef]
  55. Mainardis, M.; Cabbai, V.; Zannier, G.; Visintini, D.; Goi, D. Characterization and BMP Tests of Liquid Substrates for High-rate Anaerobic Digestion Chem. Biochem. Eng. Q. 2017, 31, 509–518. [Google Scholar] [CrossRef]
  56. Salunkhe, D.B.; Rai, R.K.; Borkar, R.P. Biogas technology. Int. J. Eng. Sci. Technol. 2012, 5, 4934–4940. [Google Scholar]
Figure 1. General diagram of the cheese manufacturing process.
Processes 08 00931 g001
Figure 2. Schematic representation of anaerobic digestion process.
Processes 08 00931 g002
Figure 3. Schematic representation of the treatment system with expanded granular sludge bed (EGSB) bioreactor.
Processes 08 00931 g003
Figure 4. Schematic diagram with the operating conditions of HRT, OLR, and buffers for CWW treatment.
Processes 08 00931 g004
Figure 5. Kinetic AGS acclimatization in batch reactor. (a) Monitoring of COD degradation and (b) Monitoring of pH and alkalinity factor.
Processes 08 00931 g005
Figure 6. Evolution of the performance EGSB bioreactor under continuous CWW supply. (a) OLR, pH and temperature, (b) Buffer index (BI) monitoring and (c) The variations on COD concentration and removal efficiency.
Processes 08 00931 g006
Figure 7. Methane production and BMP in the EGSB bioreactor at HRT of 6 and 8 days. The values shown are the media average with their standard deviations.
Processes 08 00931 g007
Table 1. Determination and examination, frequency and bibliographic reference of the methodologies used for influent, effluent, and biomethane.
Examination and DeterminationFrequencyReference
Influent and Effluent
pHD(Method 4500-H+–B) [23]
TemperatureD(Method 2550–B) [23]
CODT(Method 5220–D) [23]
BOD5M(Method 5210–B) [23]
TSW(Method 2540–B) [23]
ColorM(NMX-AA-045-SCFI-2001) [29]
TurbidityM(Method 2130–B) [23]
TNM(NMX-AA-026-SCFI-2010) [30]
Buffer Index (BI)T(Titrimetric Method) [11]
COD removal efficiencyTMathematical Equation [31]
Biomethane
Biomethane ProductionT(Volumetric Method) [32]
Biochemical methane potential (BMP)T(Volumetric Method) [28]
Biomethane production rate (MPR)T(Volumetric Method) [5]
Frequency (D: Daily; T: Three times a week; W: Weekly; M: Monthly).
Table 2. Physicochemical characterization of CWW.
ParameterValuesPermissible Limits
WHOMexico *
pH4.33 ± 0.216.5–8.55–10
Moisture (%)95.23 ± 1.35--
Ash (%)3.75 ± 0.3--
Density (g/mL)1.137 ± 0.02--
Viscosity (mPa·s)0.986 ± 0.01--
Color (Pt-Co)9366 ± 328--
Turbidity (NTU)426 ± 245-
EC (mS/cm)8.5 ± 0.3--
Floating matterPresent-Absent
Settleable solids (mL/L)13 ± 1-2
TS (mg/L)47,643 ± 1358650-
TVS (mg/L)42,873 ± 3433--
TSS (mg/L)-20012–5
Acidity (mg CaCO3/L)3379 ± 610--
Alkalinity (mg CaCO3/L)ND--
FOG (mg/L)5495 ± 480--
COD (mgO2/L)91,600 ± 7950300-
BOD5 (mgO2/L)90,083 ± 6742100150
TOC (mg/L)33,400 ± 2742--
TP (mg/L)707 ± 91-30
TN (mg/L)2200 ± 185-60
Sulfates (mg/L)17 ± 0.84250-
BI0.98 ± 0.01--
CI5388 ± 259--
FWI0.056 ± 0.002--
C/N15/1--
ND = not detected, * NOM-001-SEMARNAT-1996 (Water discharged in rivers).
Table 3. General analysis of the influent and effluent of the EGSB bioreactor.
ParametersInfluentEffluentE (%)Permissible Limits
Stage IStage IIStage IStage IIWHOMexico *
COD (mg O2/L)46,348 ± 32004548 ± 3463468 ± 4399092300-
BOD5 (mg O2/L)45,421 ± 30364080 ± 2642971 ± 2149193100150
TS (mg/L)19,558 ± 13505661 ± 5534843 ± 4817175650-
TN (mg/L)1090.8138 ± 22119 ± 188789-60
Color (Pt-Co)46832547 ± 1452389 ± 1284649--
Turbidity (NTU)277121 ± 27116 ± 1956585-
E (%) = Removal Efficiency, * NOM-001-SEMARNAT-1996 (Water discharged in rivers).

