Analysis of Power Input of an In-Line Rotor-Stator Mixer for Viscoplastic Fluids


Department of Process Engineering, Czech Technical University in Prague, 16600 Prague, Czech Republic
*
Author to whom correspondence should be addressed.
Processes 2020, 8(8), 916; https://doi.org/10.3390/pr8080916
Submission received: 26 June 2020
/
Revised: 10 July 2020
/
Accepted: 15 July 2020
/
Published: 1 August 2020
(This article belongs to the Special Issue Advances in the Chemical Mixing Process)
Abstract
:In this work, the power draw and shear profile of a novel in-line rotor-stator mixer were studied experimentally and the laminar flow regime was simulated. The power draw of the rotor-stator mixer was investigated experimentally using viscoplastic shear-thinning fluid and the results of the obtained power consumptions were verified through simulations. The power draw constant and Otto-Metzner coefficient were determined from the result of experimental data and through simulations. A new method is suggested for the determination of the Otto-Metzner coefficient for the Herschel–Bulkley model and the term efficiency is introduced. It was shown that the proposed method can be applied successfully for the prediction of the Otto-Metzner coefficient for the mixing of viscoplastic shear-thinning fluids. The effect of geometry and rotor speed on power consumption and shear rate profile in the investigated mixer is discussed from the results of the simulations. It was found that numerical methods are a convenient tool and can predict the power draw of the in-line rotor-stator mixer successfully.
1. Introduction
Rotor-stator mixers are widely employed for the mixing of various fluids in the polymer, food, and pharmaceutical industries for the preparation of dispersions and homogenization or emulsification processes and can be used in the laminar and turbulent flow regimes and for batch or continuous (in-line) systems [1,2,3,4,5]. Rotor-stator mixers ensure a more efficient mixing process than conventionally used stirred vessels since the high rotor tip speed and a small clearance between the rotor and stator provide a high shear rate and energy dissipation rate, which improves the physical processes [1,6,7,8].
Regardless of the type of the mixer, the mixing of non-Newtonian fluids is usually carried out under the laminar flow regime due to the high viscosity of the non-Newtonian fluids. Poor mixing efficiency is considered in the laminar regime since the fluid flow is predominately caused by viscous force [9,10,11,12]. Particularly, the mixing of viscoplastic fluids results in the formation of the well-mixed region (caverns) in the vicinity of the impeller and dead zones next to the wall of the mixer and that leads to poor mixing. For an ideal mixing process, the flow (shear rate) created by impellers should be ensured in the large part of the fluid, and dead zones should be eliminated. The mixing is not feasible by conventional mixers particularly for the viscoplastic fluids [10,13,14]. Kowalski [15] indicated that the power consumption of an in-line rotor-stator mixer is the sum of the power required to rotate the rotor (), the power of the flow of liquid in the gap (), and mechanical losses [7,15,16]. Cooke et al. [7] stated that the contribution of liquid flow term on the power consumption is negligible in the laminar regime at low rotational speeds of the rotor and Cheng et al. [17] pointed out that the pumping capacity of the in-line rotor-stator mixers is weak at a low rotational speed of the rotor. Vial et al., Zhang et al., and Wu et al. [10,16,18] studied various in-line rotor-stator mixers in the laminar regime for non-Newtonian power-law and viscous Newtonian fluids through simulations. It was stated that numerical methods can predict the power draw constant and Metzner-Otto coefficient of the in-line rotor-stator mixers in the laminar regime successfully and it was indicated that Metzner-Otto coefficient is independent of fluids rheology and varies with geometrical ratios.
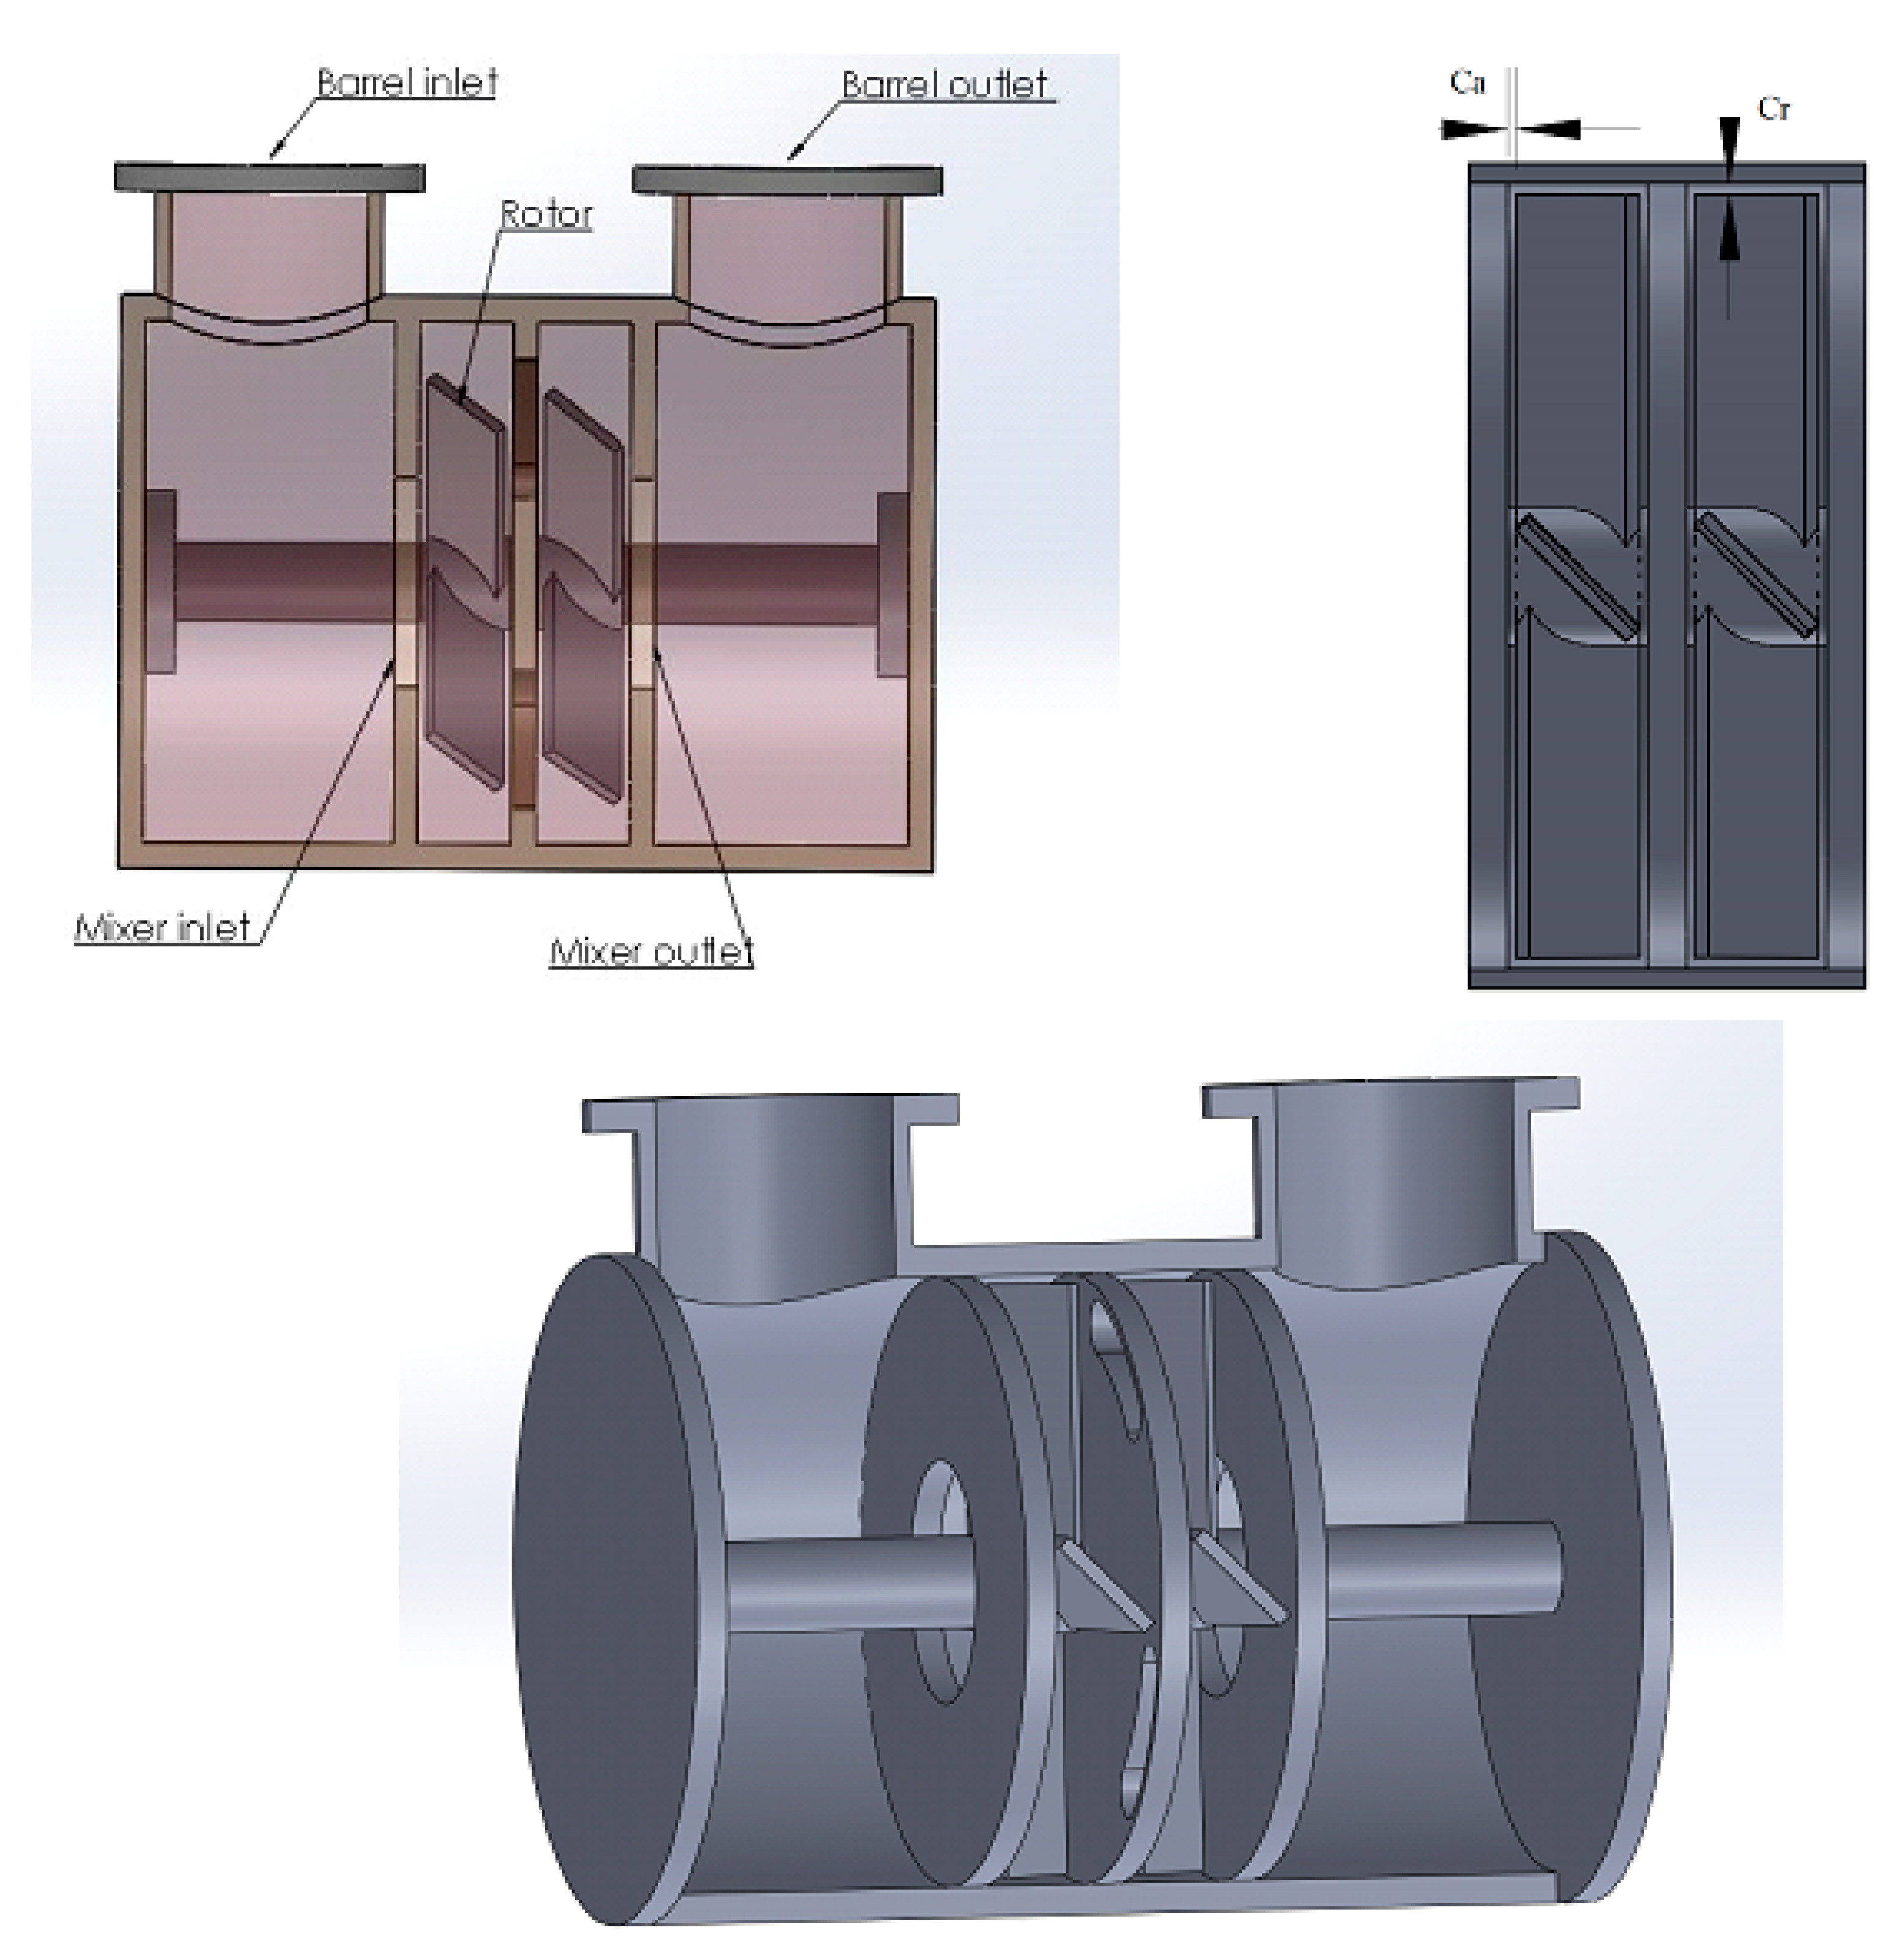
In this work, a novel in-line rotor-stator mixer with blades was investigated. The mixer was designed with the intent of providing an efficient mixing process particularly for the viscoplastic fluids with high yield stresses. The geometry of the mixer is shown in Figure 1. The designed mixer [19] consists of two serially connected mixing heads (assembly of rotor and stator [1]) placed in a cylindrical barrel. The stator has a cylindrical shape with a radius of 200 mm and the lateral surface of the stator is the wall of the barrel. Two 45° pitched blade impellers with a radius of 194 mm were employed as the rotor (blade) and were mounted on the same shaft. The vertical walls of the stator are composed of three discs, which can move in the axial direction; hence, the clearance in the axial direction () between the rotor and wall of the stator is adjustable depending on process requirements. Hollow discs are used at the inlet and outlet sections of the mixer and shaft of the mixer is located at the center of them. The disc in the middle section has four slots and the passage of fluid between heads are provided by those slots. The clearance in the radial direction () between the rotor and stator is 3 mm constant.
The aim of the present study is the investigation of the power draw of the newly designed rotor-stator mixer. The investigation is performed by experiments under the laminar flow regime using viscoplastic fluid and for the various values. Then, experimentally obtained power draw values are validated using commercial CFD codes ANSYS FLUENT 15. A new method is introduced for the determination of the Metzner-Otto coefficient. Finally, from the result of simulations, the flow field, and shear profile in the mixer is analyzed and the effect of geometry on the flow field and power draw is discussed.
2. Material and Methods
2.1. Theory
For an in-line rotor-stator mixer, the total power draw is the sum of power created by the rotor , power of fluid flow () between the inlet and outlet of the mixing head of the mixer, and mechanical losses () as stated earlier. Except for the mechanical losses, the total power is [7,11,16]:
In Equation (1), the term corresponds to the power draw of a rotor in the stirred vessel [7,11], and the power draw of a rotor in dimensionless form is defined by power number (), which is given as follows:
Dividing each term in Equation (1) by , the total power number for an in-line rotor-stator mixer is [8]:
where is flow power constant and is the flow number:
In case of mixing in laminar regime, the effect of is negligible [6,16], hence, Equation (3) reduces to:
In mixing calculations, is characterized by Reynolds number (). In the turbulent regime, is independent of the Reynolds number and in the laminar flow regime, the value of varies with . The relationship between and in the laminar regime for Newtonian fluids is given by [21]:
and the Reynolds number is:
In Equation (6), is the power coefficient and is the only function of the type of the rotor. There is an inverse proportion between and in the laminar regime. For non-Newtonian fluids, the mixing Reynolds number is expressed using apparent viscosity replacing the dynamic viscosity in Equations (6) and (7) [21], which is the function of the shear rate. Apparent viscosities for power-law, Bingham, and Herschel–Bulkley models are given in Table 1. In the mixing calculations, apparent viscosity is expressed in terms of effective shear rate () given by:
In Equation (8), is the rotational speed of the rotor and is Metzner-Otto coefficient. Usually, is regarded as the only function of the rotor and geometrical ratios of the mixing system [22,23]. Introducing effective shear rate, the Reynolds number can be written for the power-law model by Equation (9) [22]:
where is the Reynolds number according to Metzner and Otto [22] and relationship is:
Rieger and Novak [23] revisited Equation (10) and they proposed a simpler method by suggesting a new Reynolds number, :
Equation (11) can be written for as follows:
Equation (12) provides to calculate Reynolds number independently of and a very convenient method for the evaluation of Reynolds number, if value of the investigated mixer is unknown. According to the Rieger and Novak [23], log versus curve is a linear and from the slope of this curve, can be determined easily.
Similarly, for Bingham fluids, is given by:
According to Equation (13), for Bingham fluids is:
Bertrand et al. [24] defined Reynolds number independently of , similar to the approach of Rieger and Novak for Bingham plastic as follows:
and introducing Bingham () number:
Hence, - relationship according to Equation (15) can be written as [24]:
From Equation (17), the is alternatively stated as follows:
The first term on the right side of Equation (18) represents the power necessary to exceed the yield stress and initiating flow (yield power number, ), the second term indicates the power for the shear generated by the rotor (shear power number, ) [24]. The Herschel–Bulkley model is a frequently used rheological model for viscoplastic shear-thinning fluids and again it introduces the apparent viscosity in terms of the effective shear rate. is written for the Herschel–Bulkley model as [14]:
and - relationship for the Herschel–Bulkley model:
Equation (20) can be written more simply by introducing and can be expressed similarly to the method proposed by Bertrand et al. [24] such that:
where is the Bingham number for the Herschel–Bulkley model [14]:
From Equation (21) it can be seen clearly that the plot of versus for a given fluid at various rotational speeds should represent a linear curve and the slope of that curve is equal to . Hence, the value of the mixer can be calculated easily. Moreover, according to Equation (21), yield power number and shear power number is given by:
For an efficient mixing process of viscoplastic fluids in the laminar regime, should be high enough since mixing efficiency is proportional to the created shear in the mixer and indicated by . On the other hand, implies wasted power to overcome yield stress. Hence, the mixing process efficiency for the mixing of viscoplastic fluids in laminar regime can be defined as:
Moreover, it is obvious that the term efficiency increases with increasing values of the rotational speed of the rotor and values.
2.2. Experiment
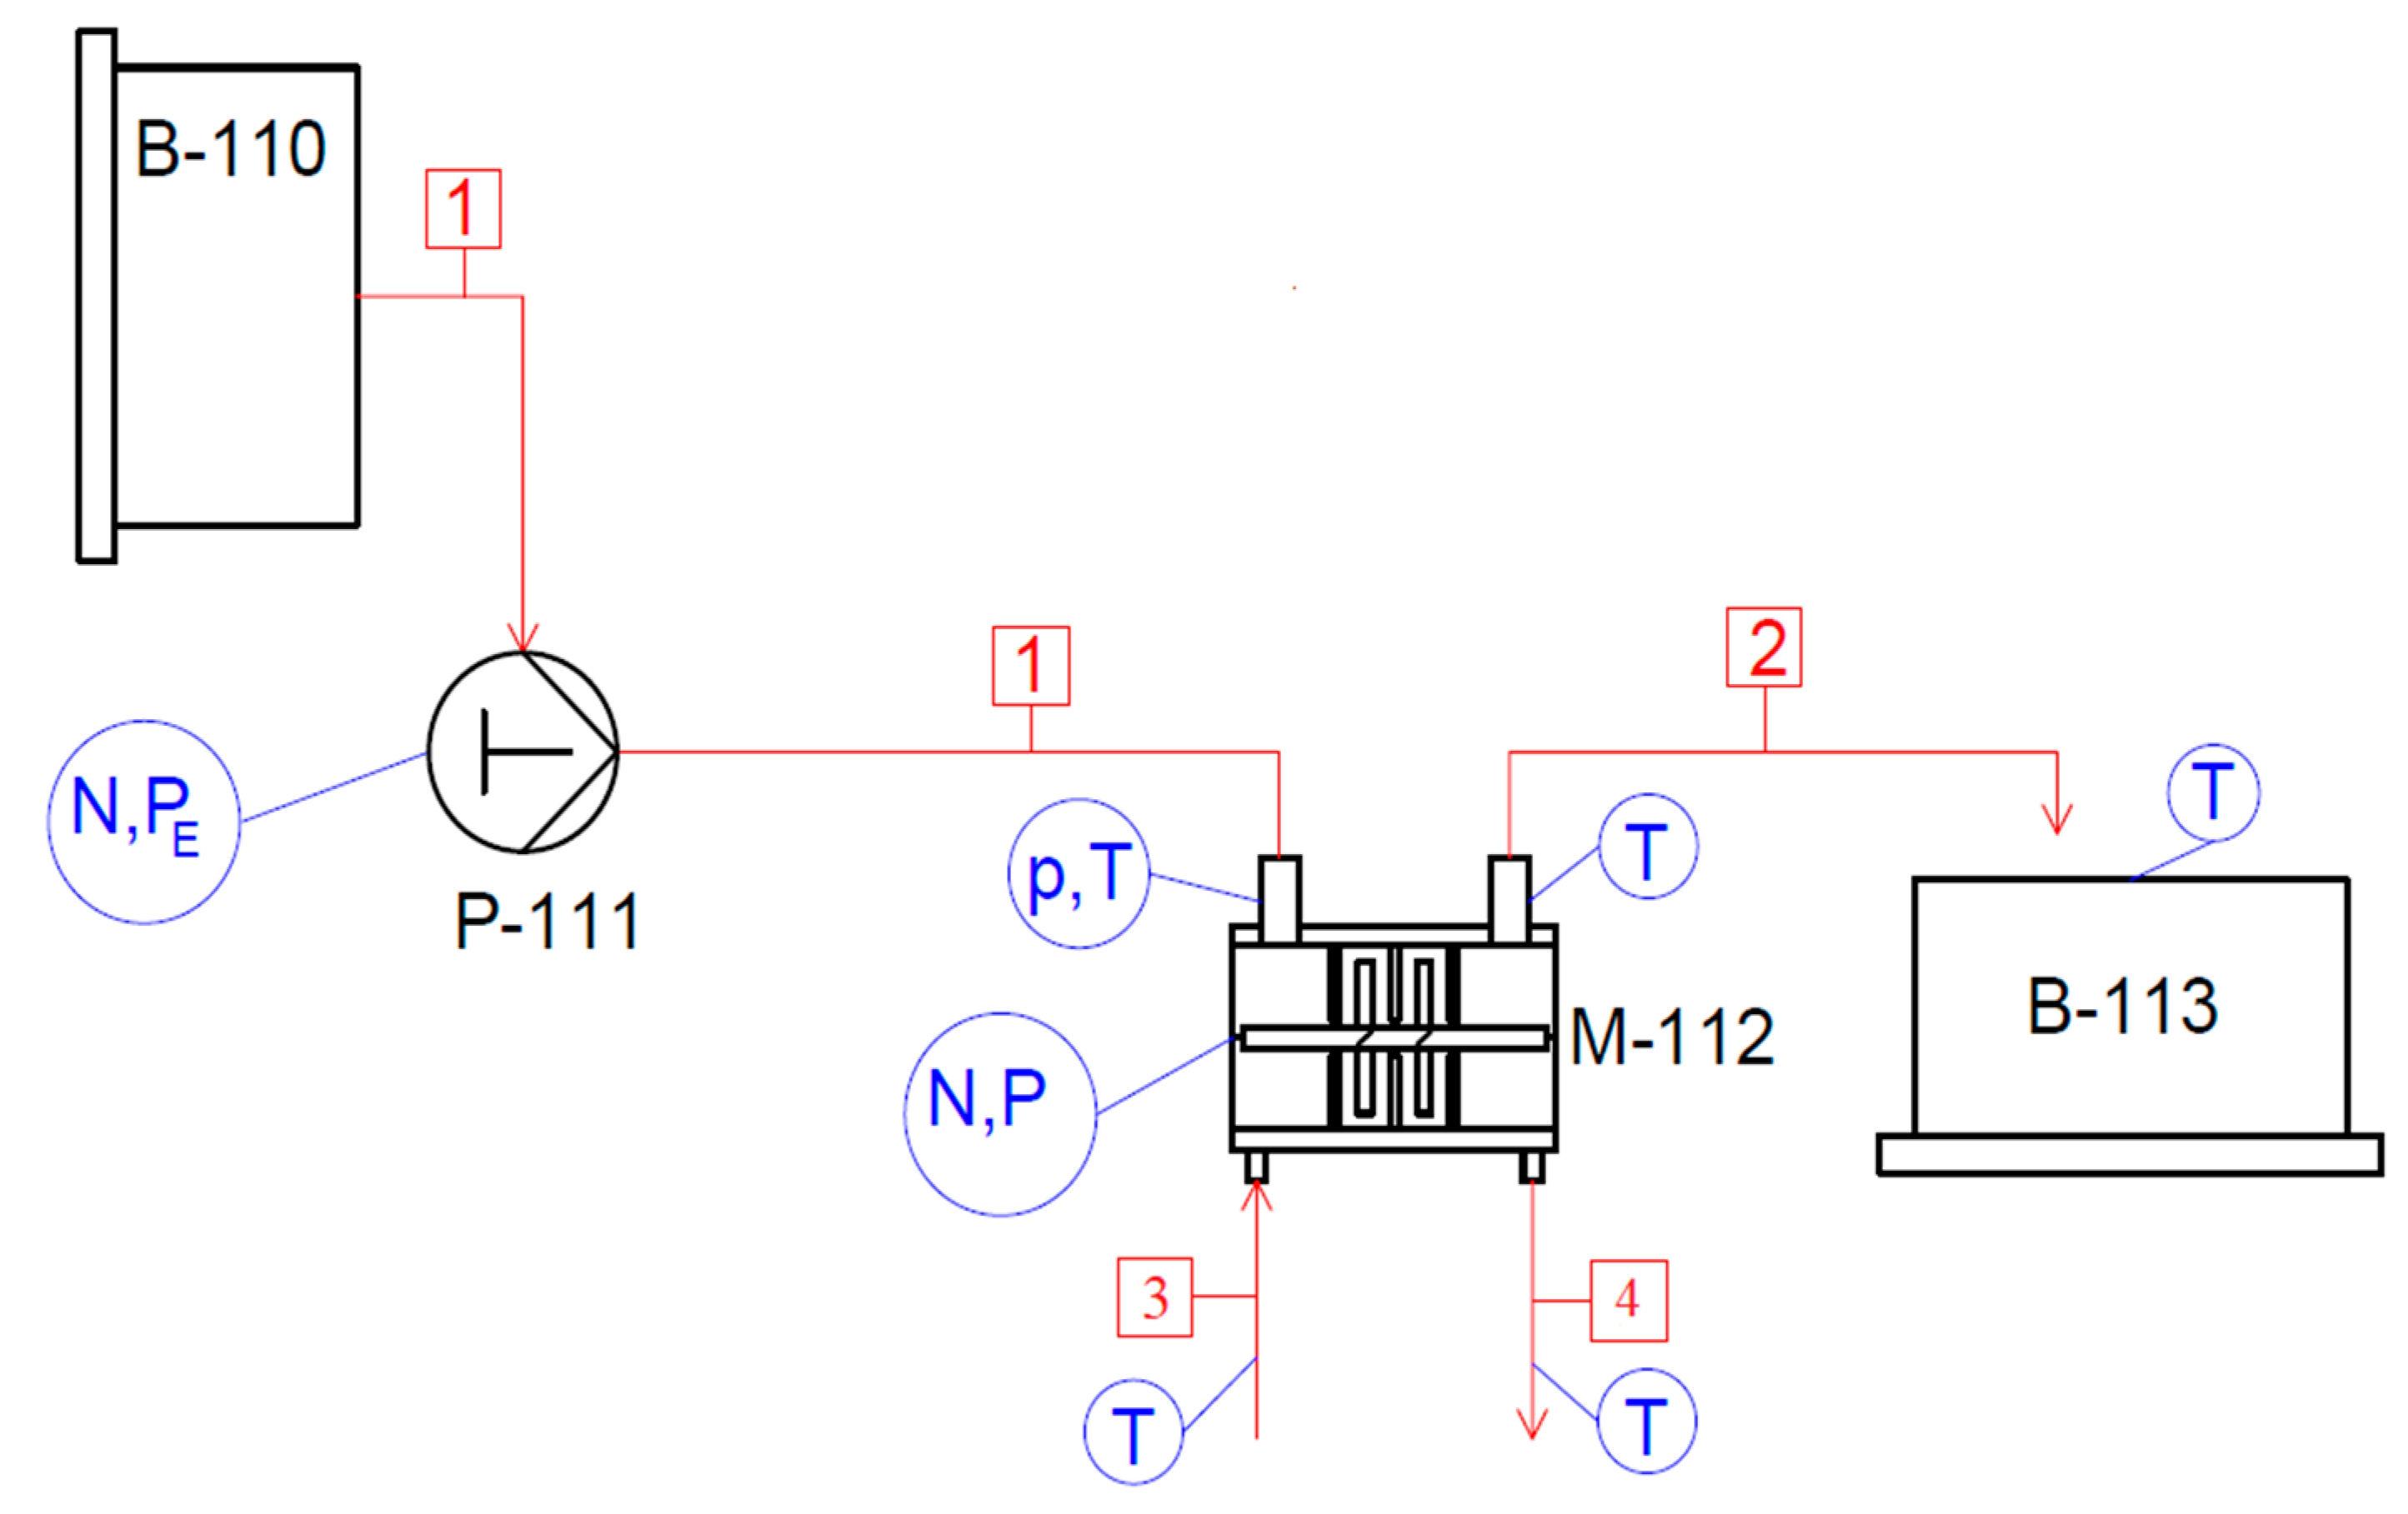
The experiment was carried [19] out primarily to measure the power consumption of the novel in-line rotor-stator mixer using viscoplastic fluids and experimental set-up is shown in Figure 2. The water solution of the bovine collagen with a mass fraction of 7.7% and density of 1100 kg/m3 was utilized as a test material. The rheological properties of the fluid were acquired by a capillary rheometer and rheological properties were found for the Herschel–Bulkley model as Pa, K = 420 Pa·sn, n = 0.34 [25]. Since the material possesses very high yield stress, a positive displacement pump (P-111) was used to discharge material from the reservoir (B-110) and feeding the mixer (M-112) with a mass flow rate of 0.1 kg/s (stream 1). The mass flow rate of the fluid was obtained from the hydraulic characteristics of the positive displacement pump. Processed material was collected in a reservoir (B-133) (stream 2). Rotation of the rotor was ensured by an electric motor with a maximum power of 5.5 kW and a maximum speed of 1000 RPM. The power draw of the rotor-stator mixer was obtained from the measured torque on the shaft () for values of 1 mm, 2 mm, and 3 mm and for the rotor speeds of 150, 300, and 500 RPM and the power was determined by Equation (26):
The impact of the rotor speed and axial clearance on the temperature variation of stirred fluid was examined since the tested fluid is a biomaterial and temperature increase by viscous heat dissipation that should be investigated. Therefore, the temperature of the fluid was measured at the inlet and outlet sections of the barrel. For keeping the temperature of the fluid in a certain range during the mixing process, mixing heads were surrounded by the cooling jacket, and iced water was used as a coolant (streams 3, 4). The fluid pressure was measured by a diaphragm manometer with a maximum capacity of 40 bar, which was placed at the inlet of the barrel and the outlet; the pressure of the fluid was considered to be a zero-gauge pressure.
2.3. Simulations
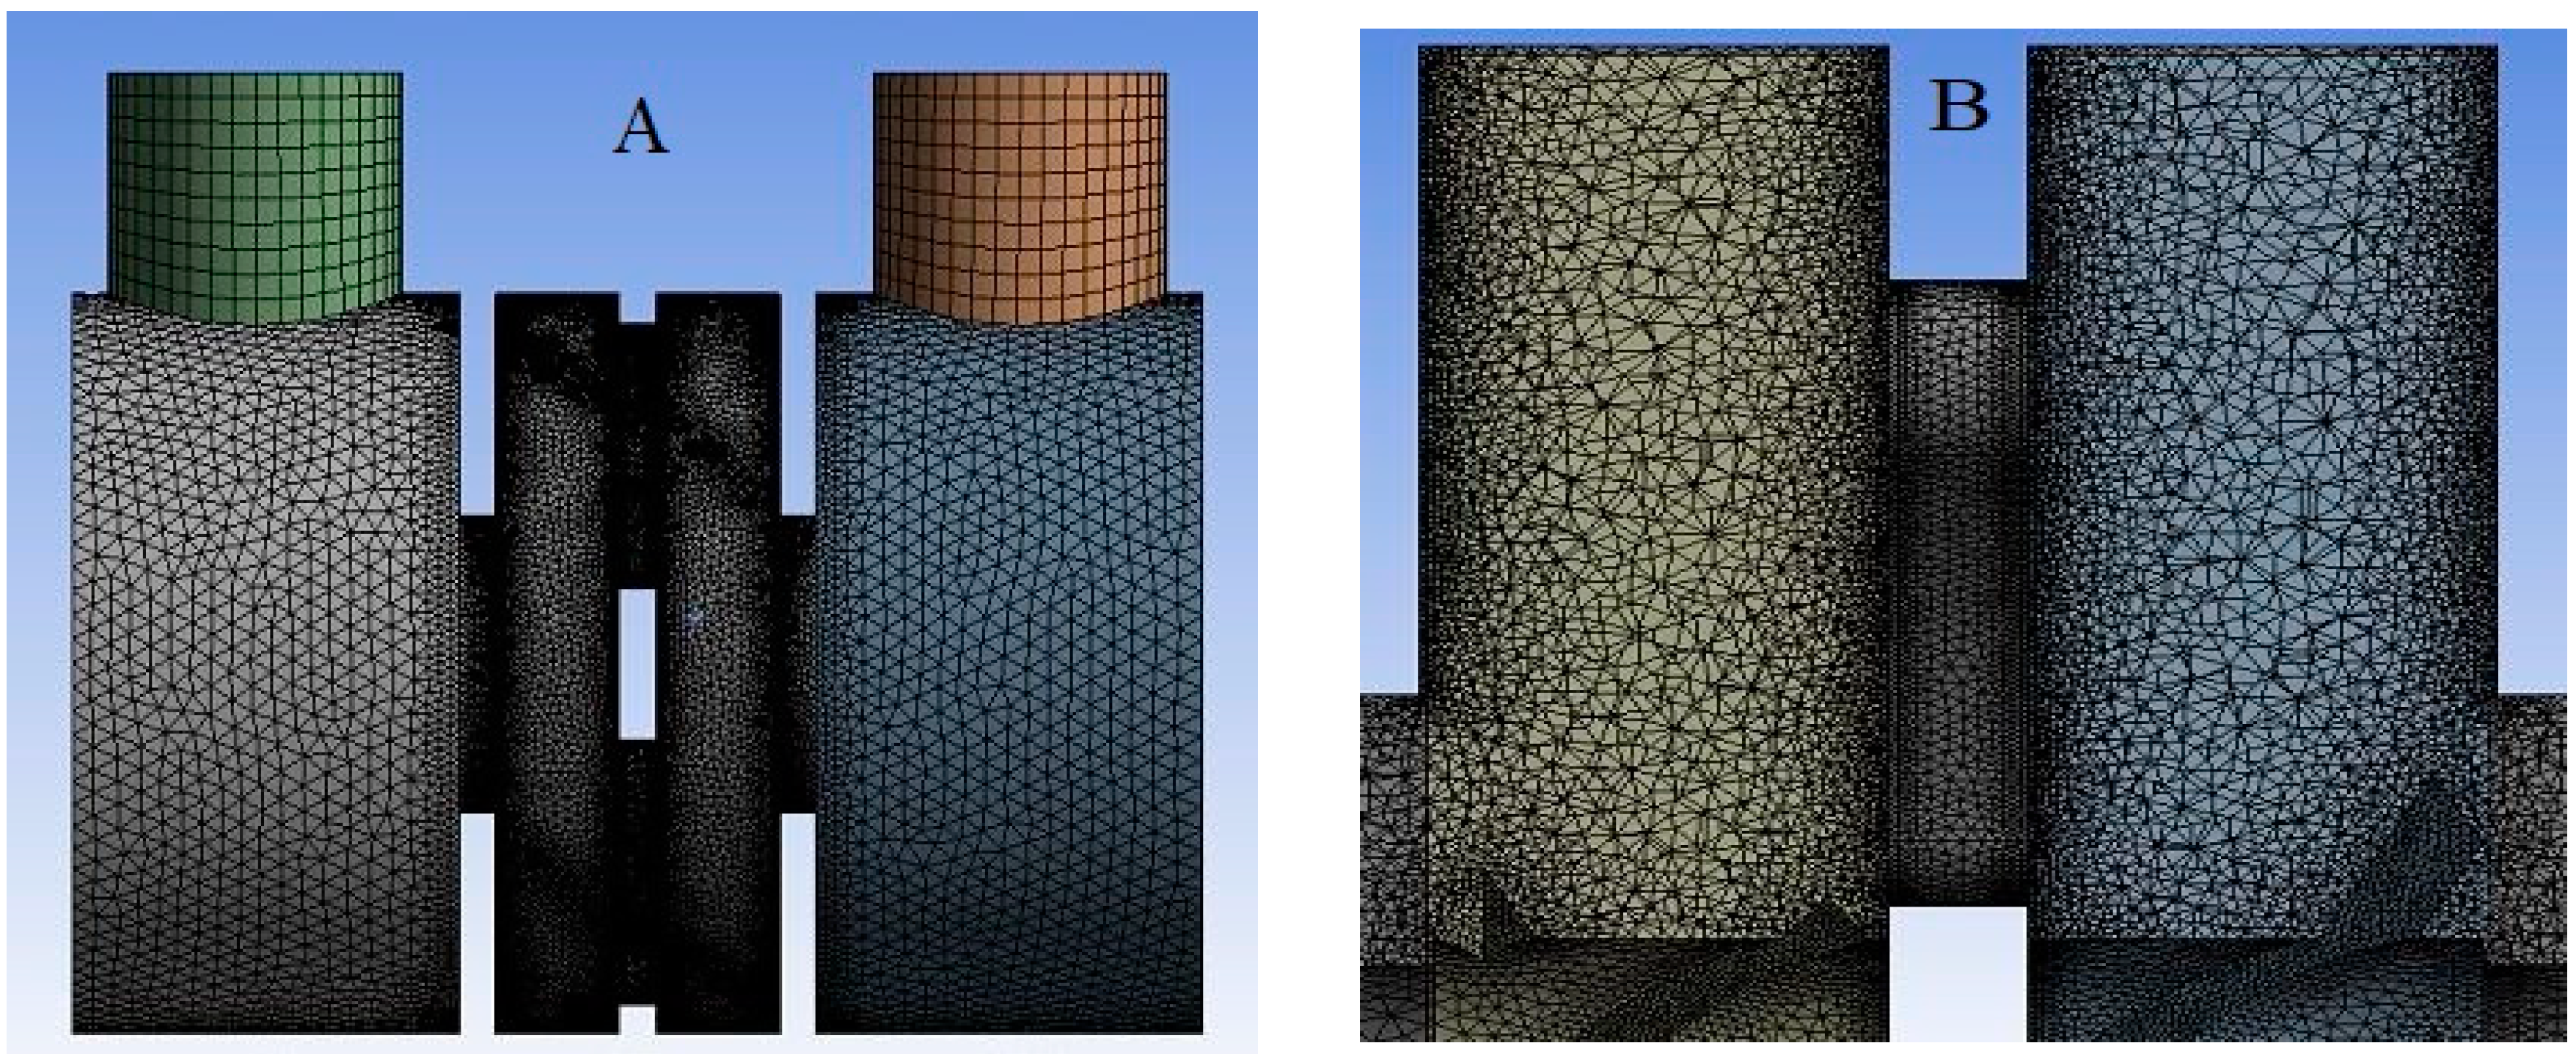
Three-dimensional numerical simulations were carried out to verify experimental data, for the determination of the power draw coefficient and shear profile within the mixing heads. For the simulations, unstructured grids were created. Especially, to capture velocity and shear profile successfully, fine tetrahedral mesh elements were generated at the vicinity of the rotor and in the clearance between rotor and stator. Grid independence analysis was performed for mm according to the method suggested by Celik et al. [26] and 2.8 million mesh elements were created (see Figure 3) for all investigated geometries.
The simulations of the in-line rotor-stator mixer were implemented for the steady-state flow case, for the laminar flow regime, and isothermal case. The rotation of the rotor has been modeled according to the multiple reference frame (MRF) method. The simulations have been performed for the Herschel–Bulkley, power-law models, and the Newtonian flow case. Simulations were conducted for the Herschel–Bulkley model with the rotor speed of 150, 300, and 500 RPM for = 1 and = 3 mm and 500 RPM for = 2 mm. For the Newtonian case simulations, the viscosity of the fluid was chosen as 10 Pa·s and simulations were performed for the rotor speed ranged from 30 RPM to 150 RPM. For the power-law fluids, simulation is conducted for the rotor speed of 60 RPM using power-law fluids with flow indexes between 0.2 and 0.6.
Regarding boundary conditions, the inlet of the barrel is assigned as a mass flow inlet, and the outlet of the barrel is a pressure outlet. Shaft and rotor are selected as moving no-slip walls. The SIMPLE scheme was applied for the pressure-velocity coupling, and second-order pressure and second-order upwind velocity schemes were used. Convergence criteria for the continuity is below the 10−9 for the Herschel–Bulkley model and 10−7 for the power-law model and the Newtonian case.
3. Results and Discussions
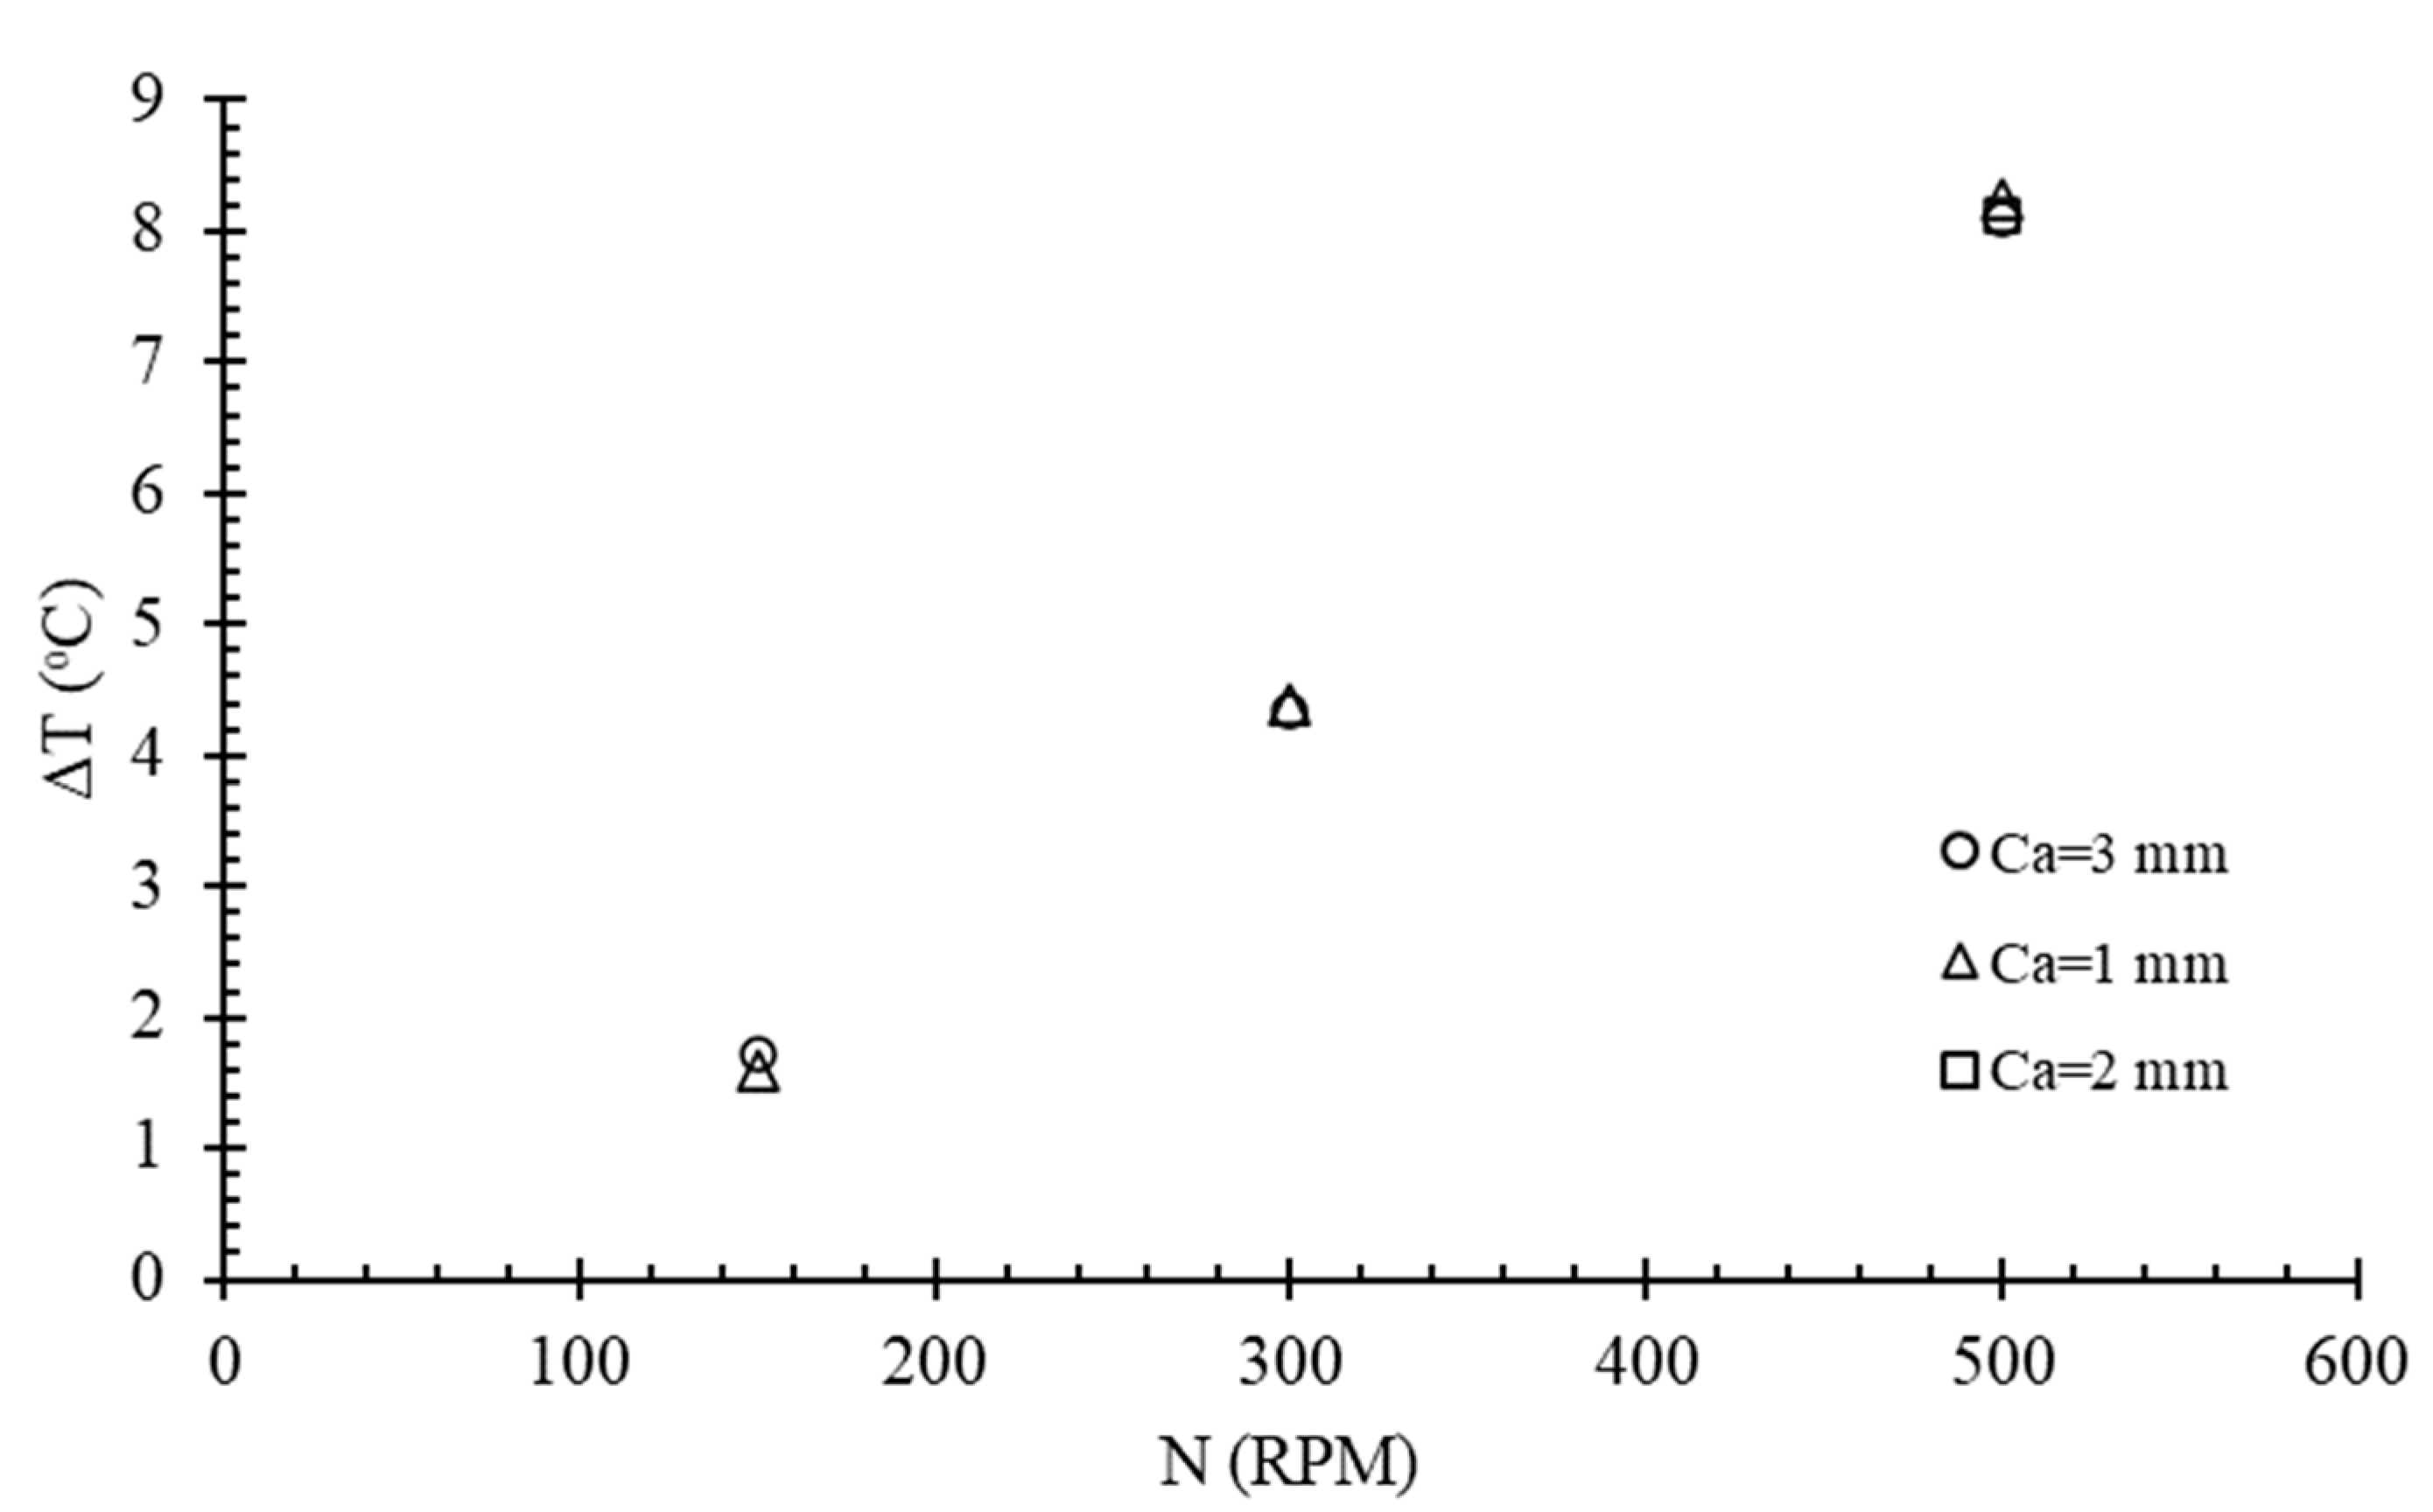
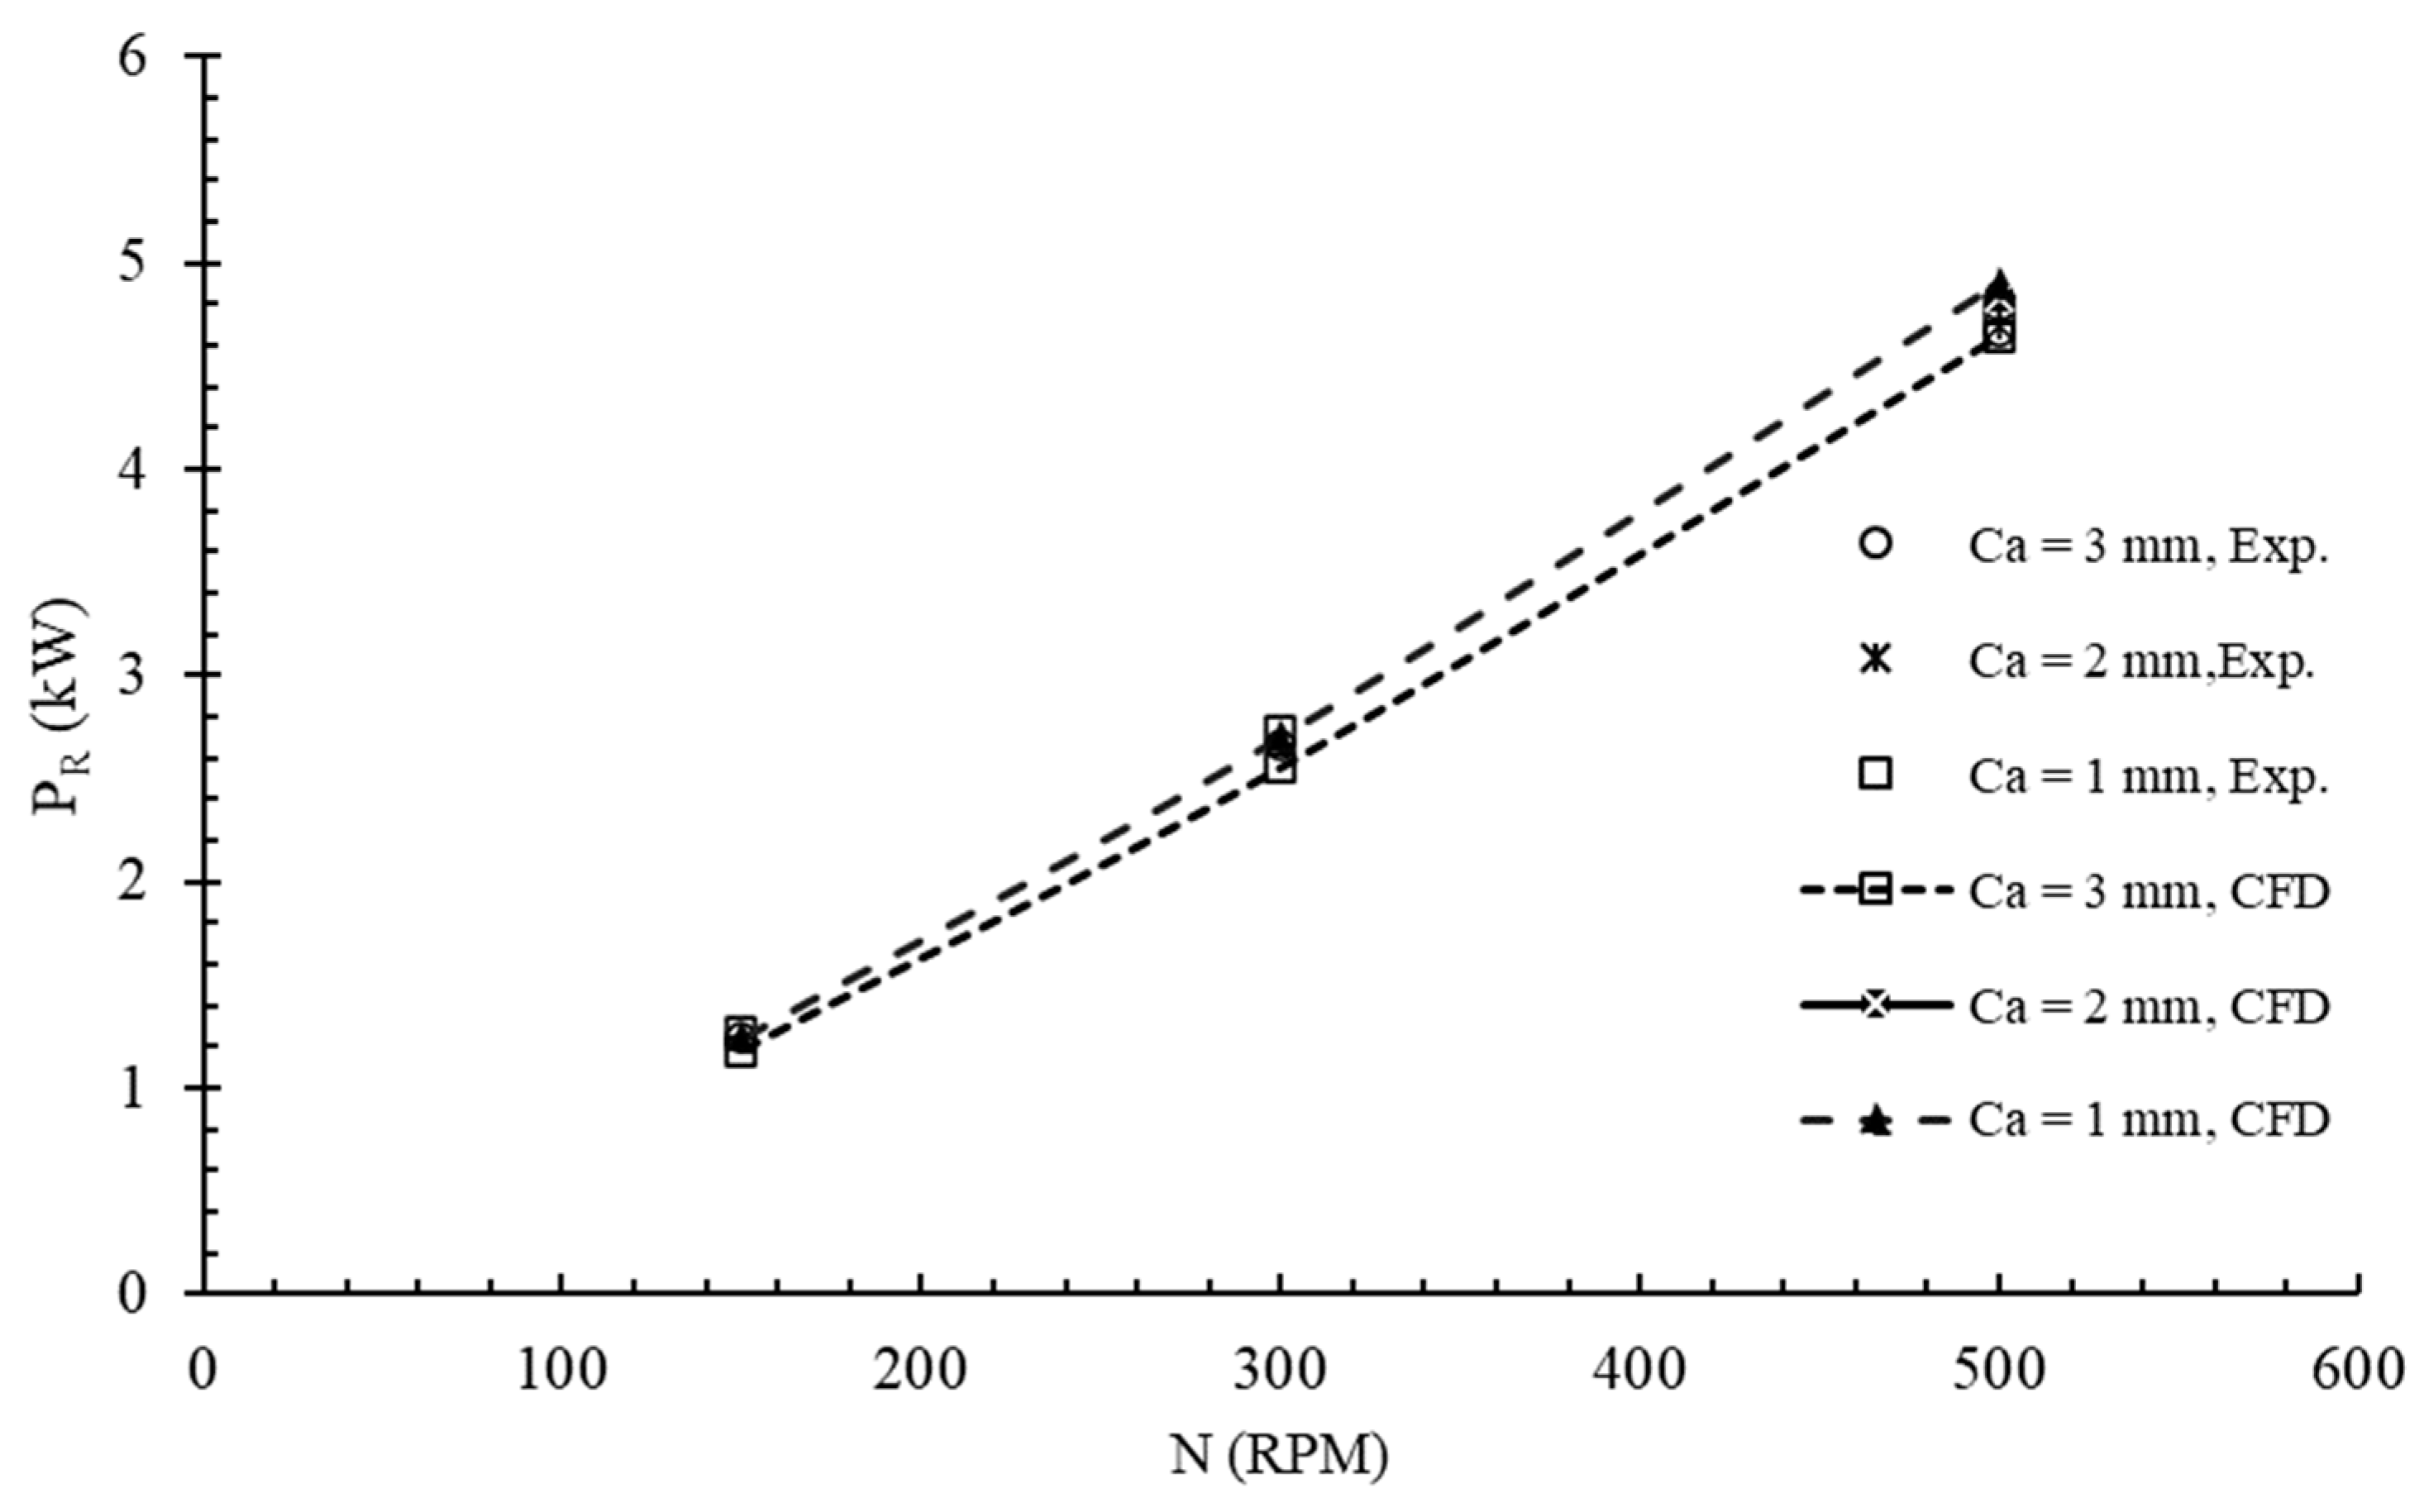
The result of the experimentally measured power draw values is given in Figure 4. As seen from the Figure, the impact of on the power draw of the rotor-stator mixer is almost negligible. The power draw of the mixer increases with the rotor speed and shows approximately a linear trend owing to the very high yield stress of the fluid.
The effect of the rotor speed on temperature variation is given in Figure 5 and results indicate that there is an approximate linear proportion between the rotor speed and temperature increment, which is parallel with the power draw curve. The obtained maximum temperature difference was found at 8.2 °C for 500 RPM, which is at an acceptable level for investigated material. From the measurement of the pressure, the value of power consumption arising from flow of fluid between inlet and outlet of the barrel () was found as 46 W maximum which is much lower than , and this result confirms the suggestion by Cooke at al. [7].
The results of obtained power draw values through simulations of the investigated mixer and a comparison with experimental data is given in Figure 6. The deviation between numerically and experimentally obtained power draw values is less than 6% which is in an acceptable range.
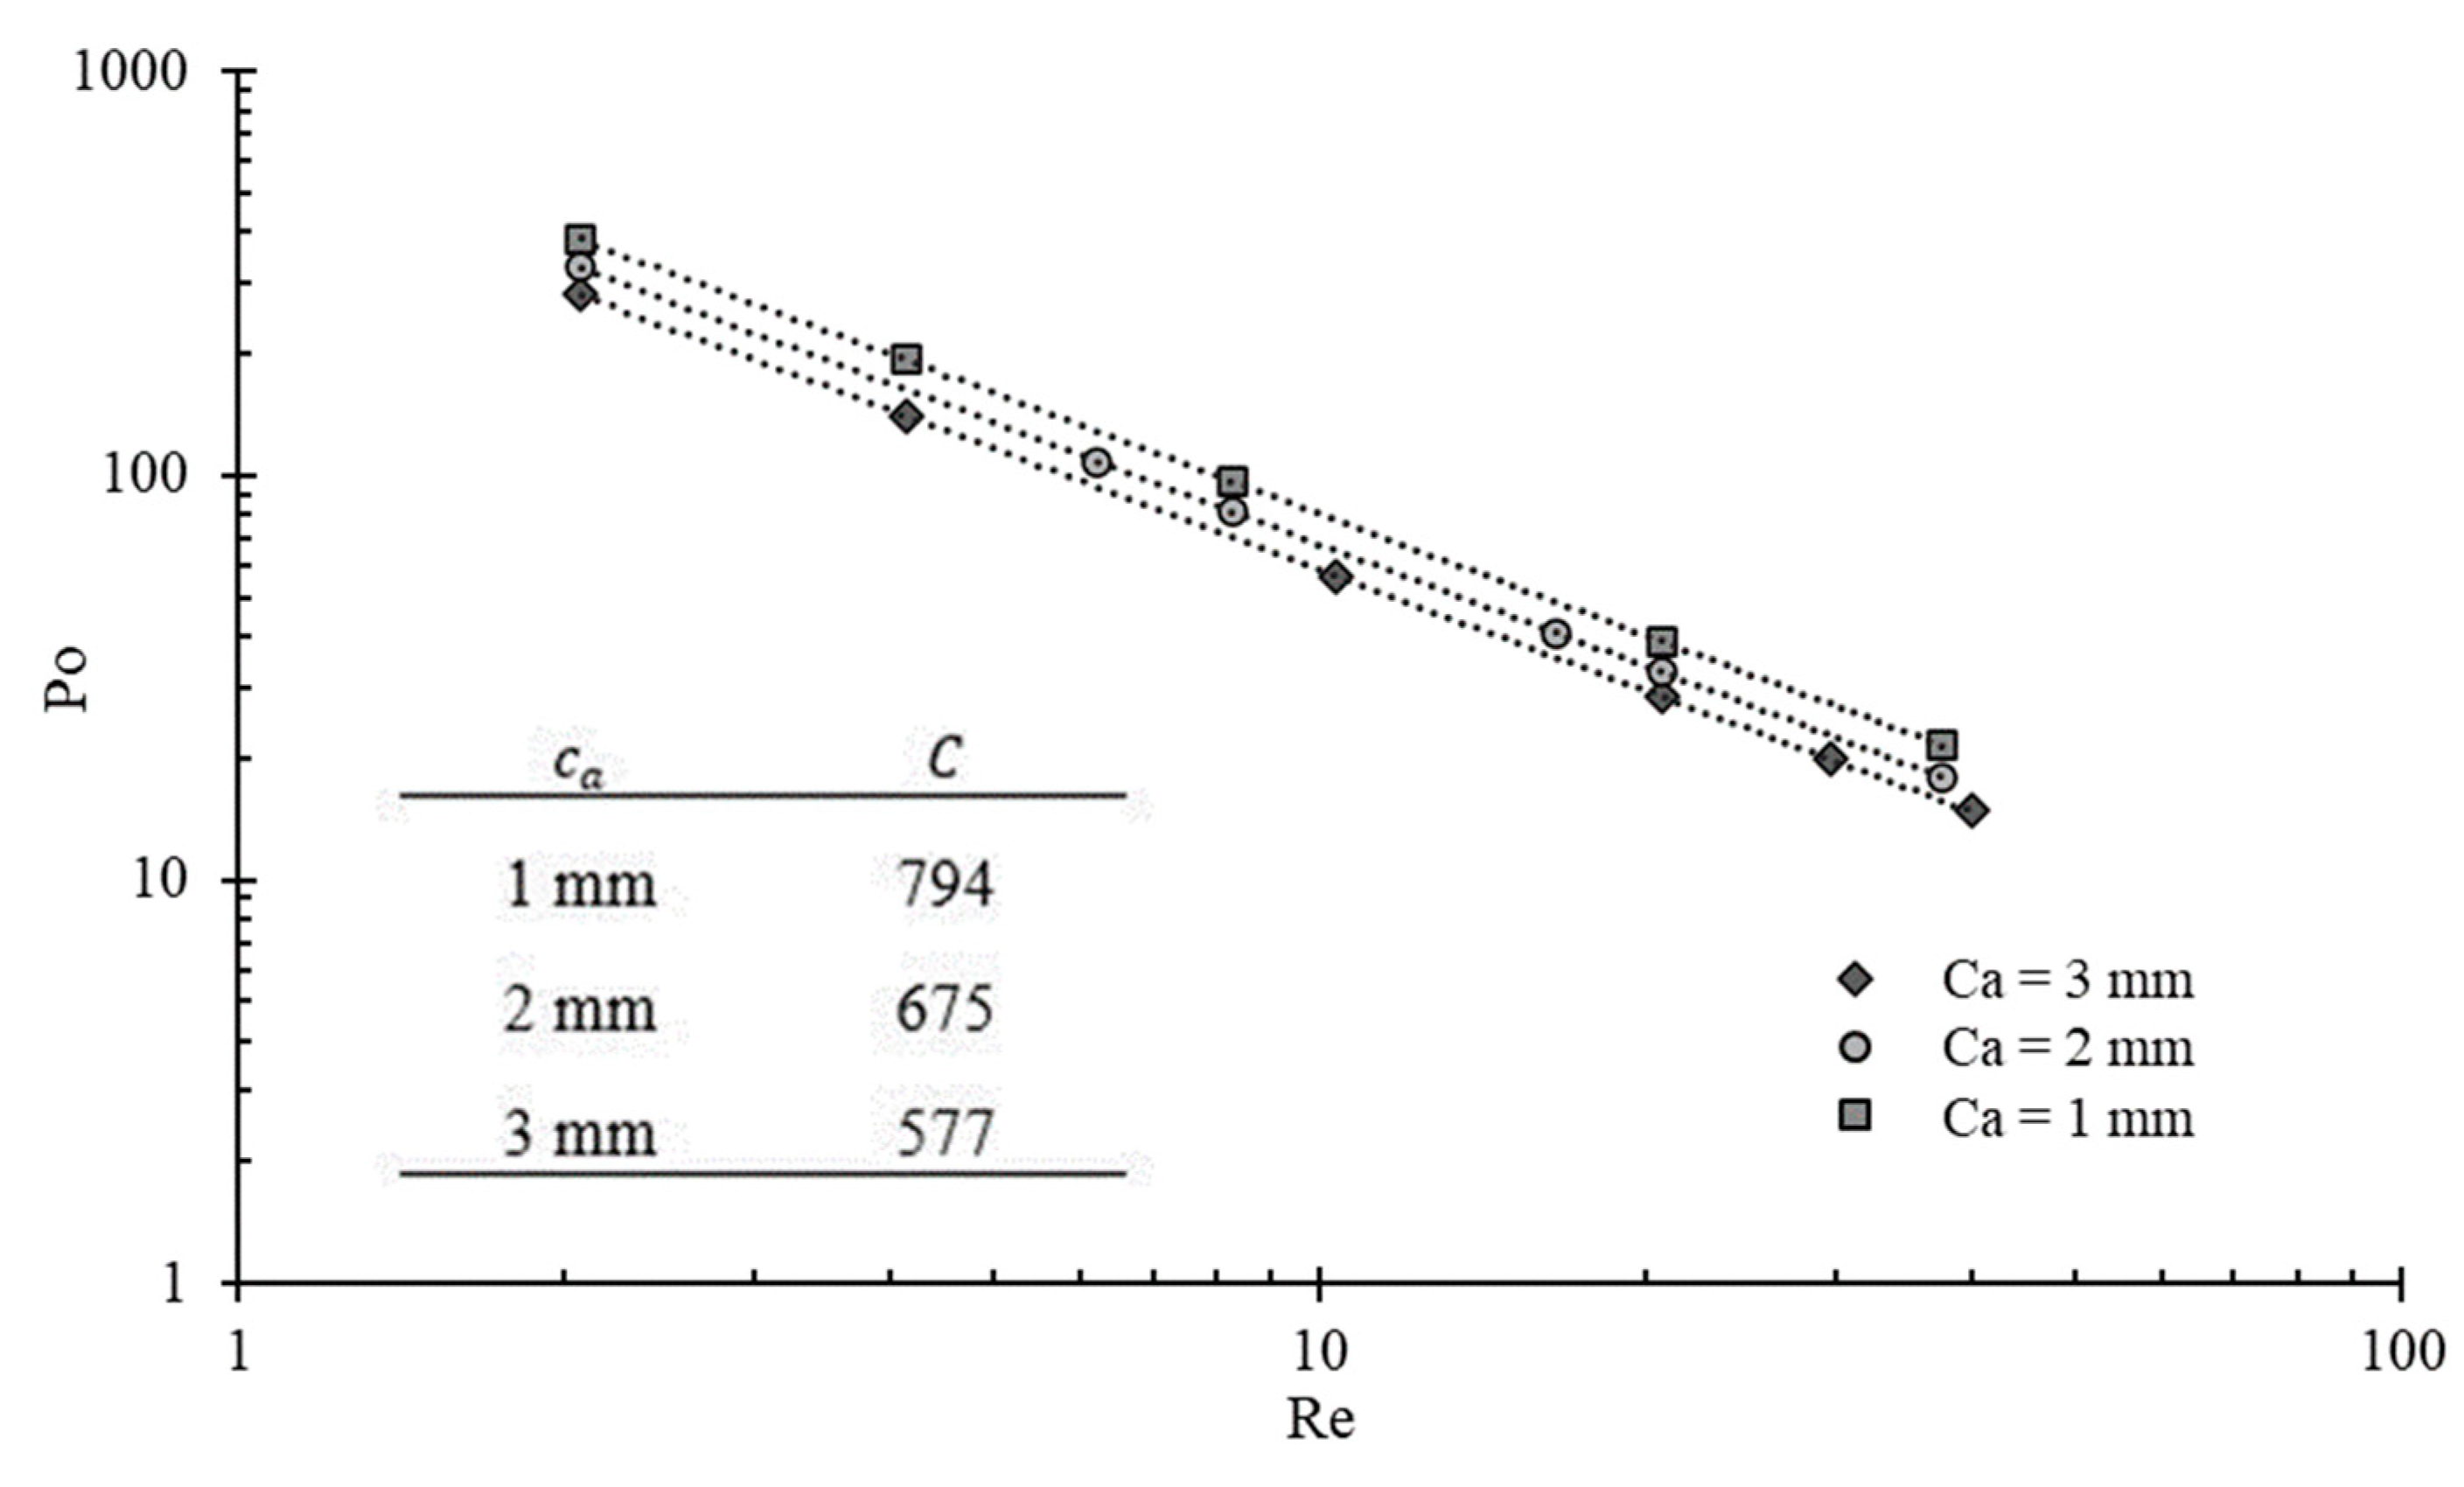
The power draw constant has been obtained for each value by conducting simulations for the Newtonian case, in the laminar regime for the Reynolds numbers, ranged from 2 to 50. From the result of simulations, the acquired power number versus the Reynolds number curve is shown in Figure 7. A linear relationship exists between the power number and Reynolds number with a slope of −1. Determined values are given in Figure 7.
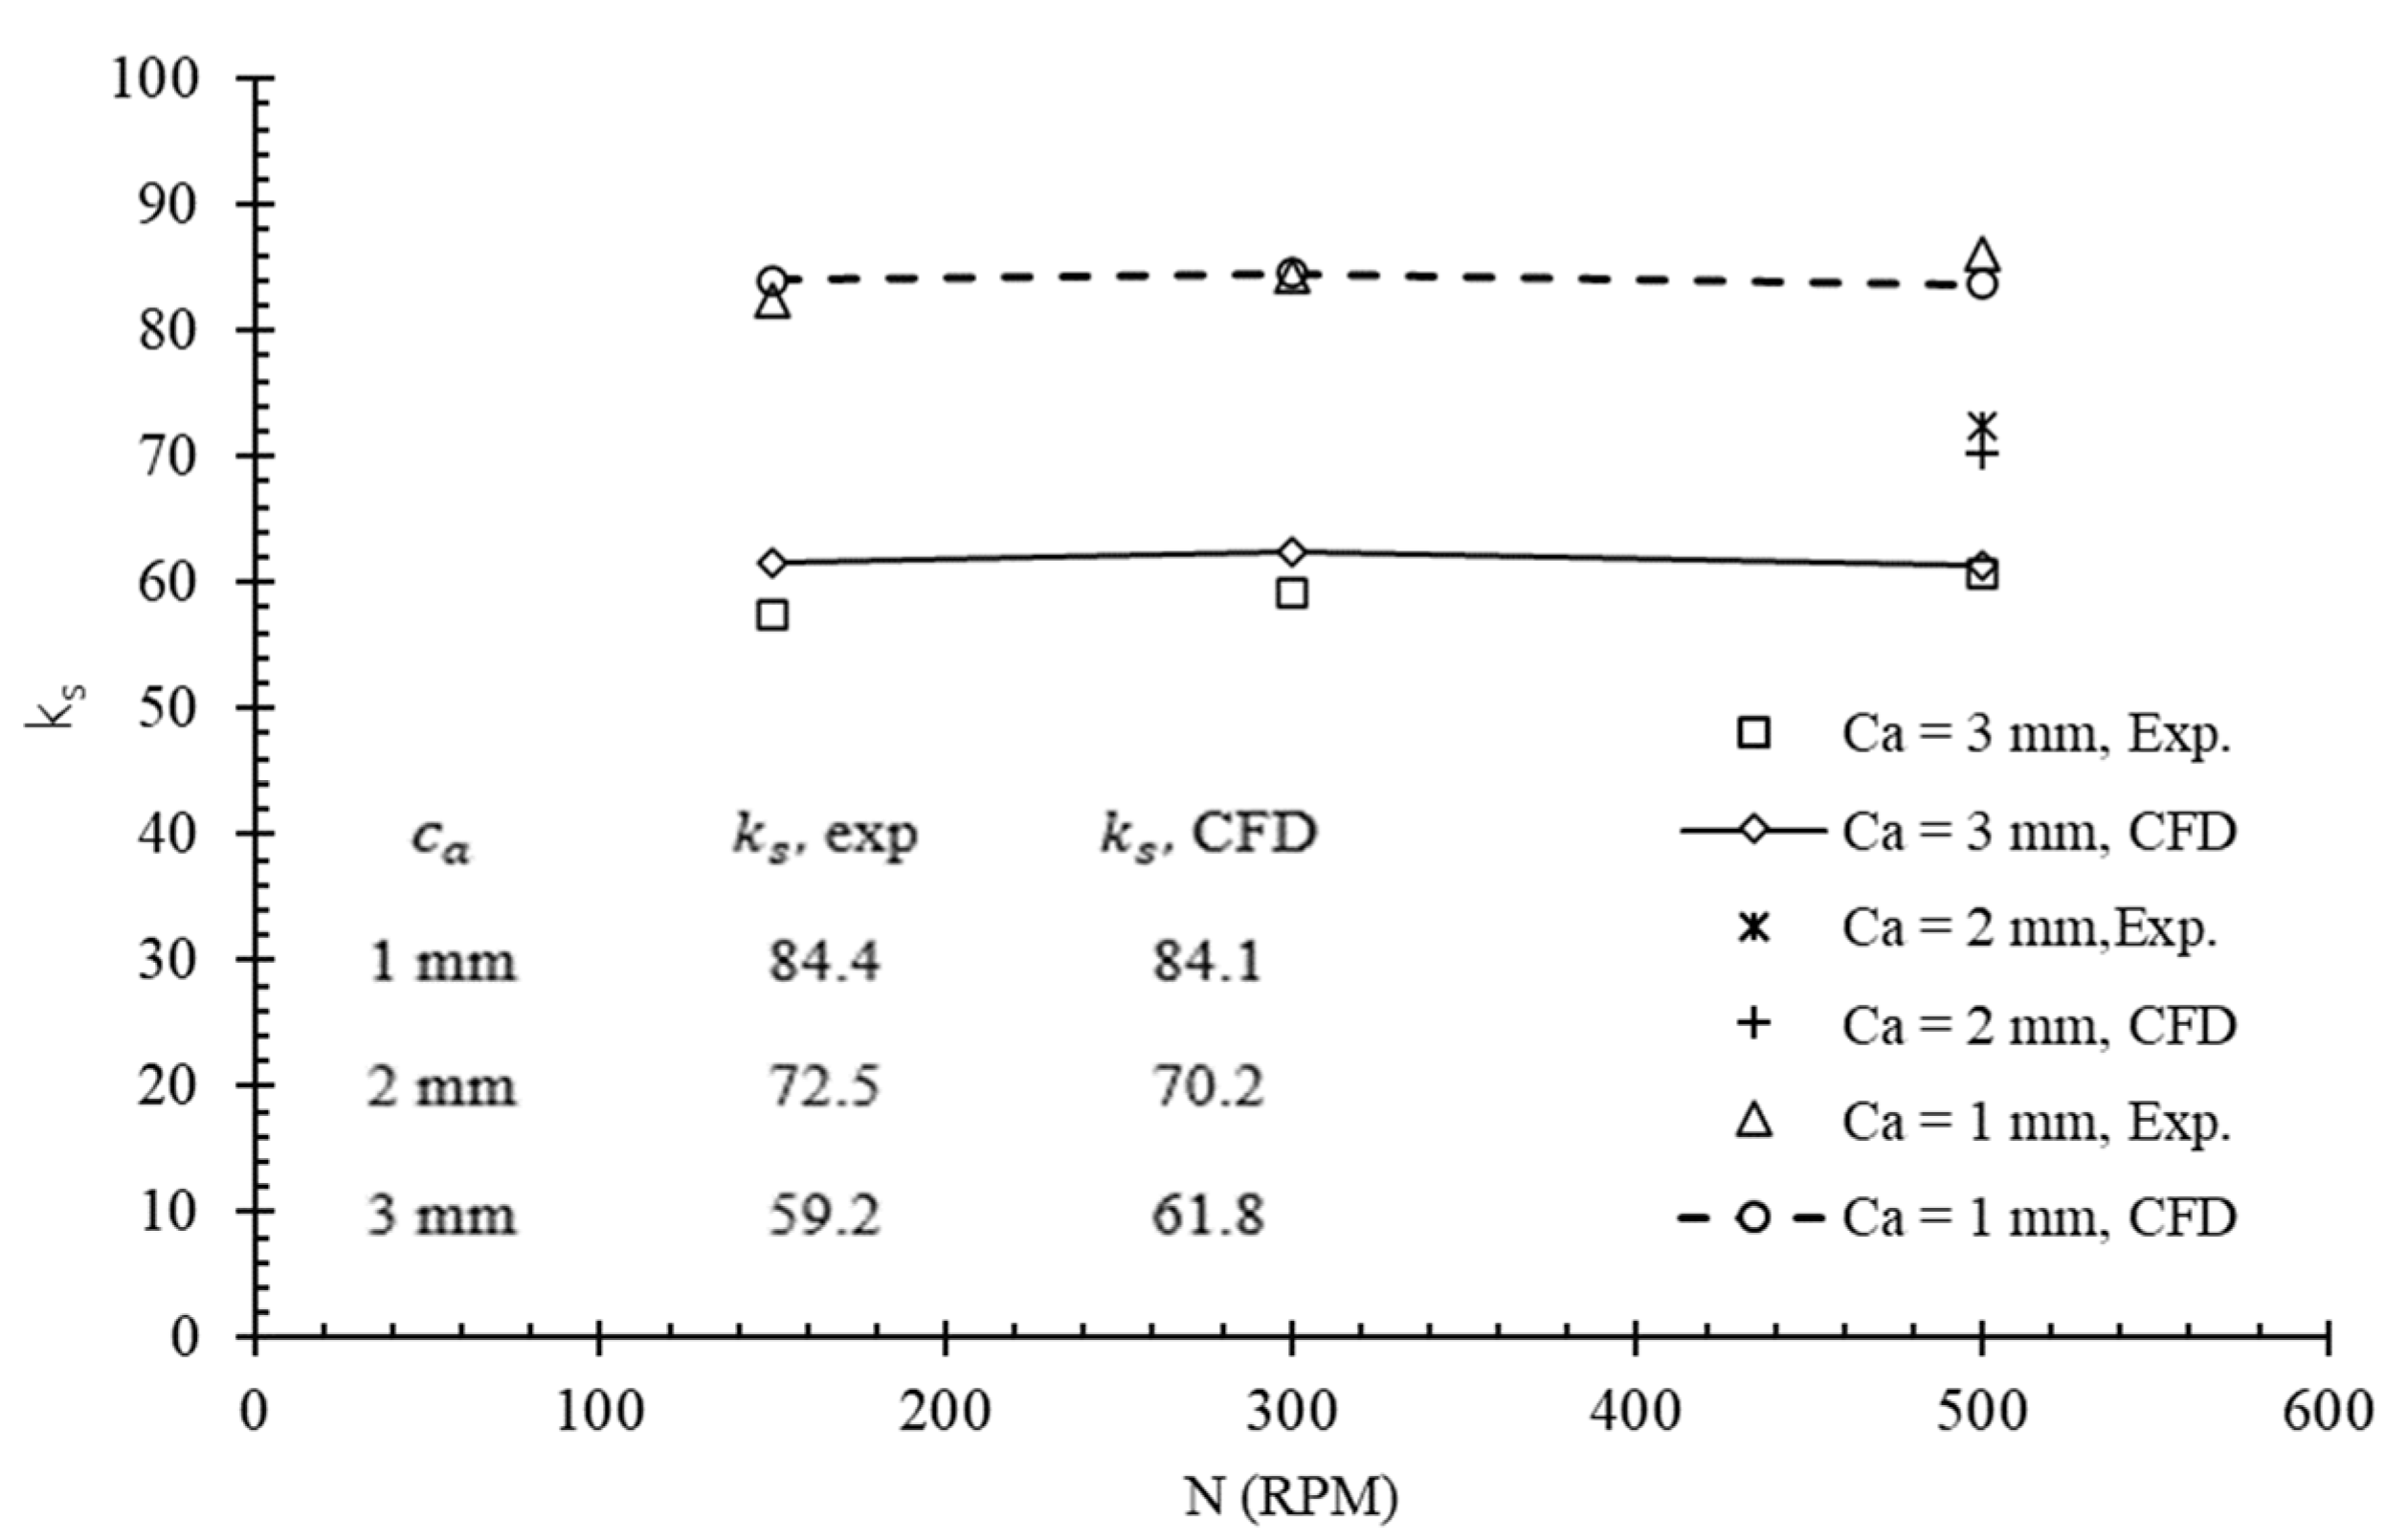
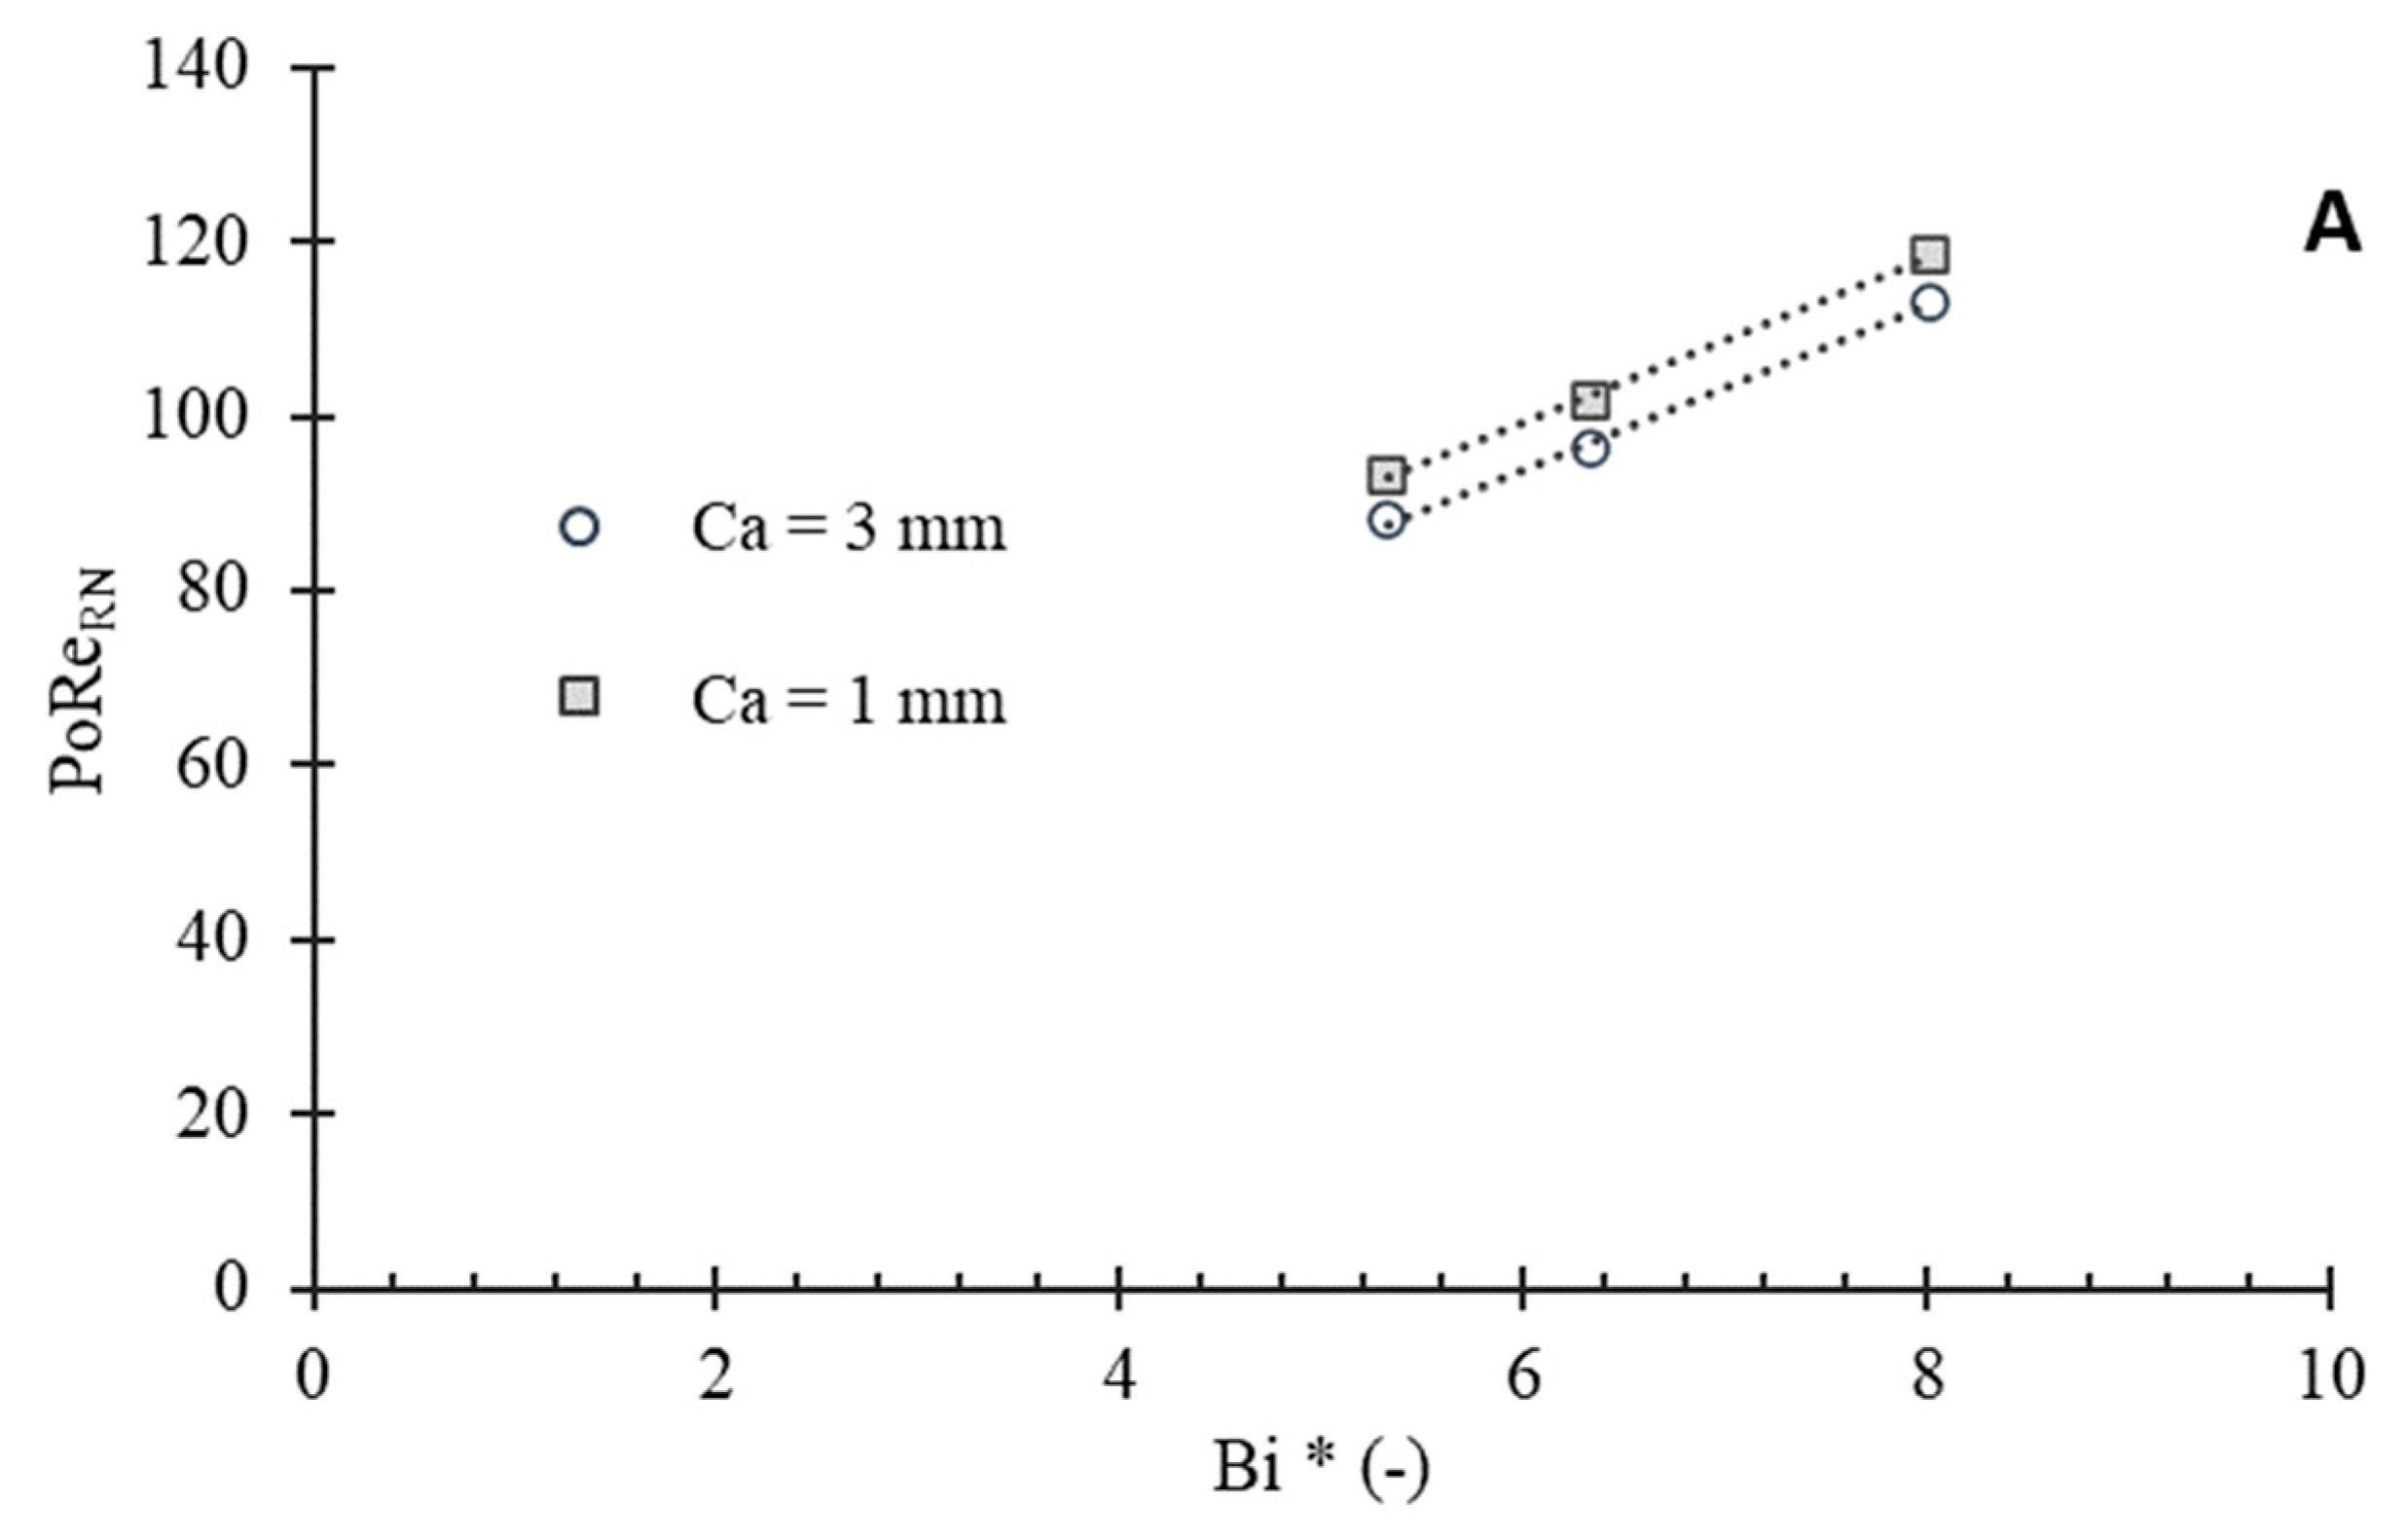
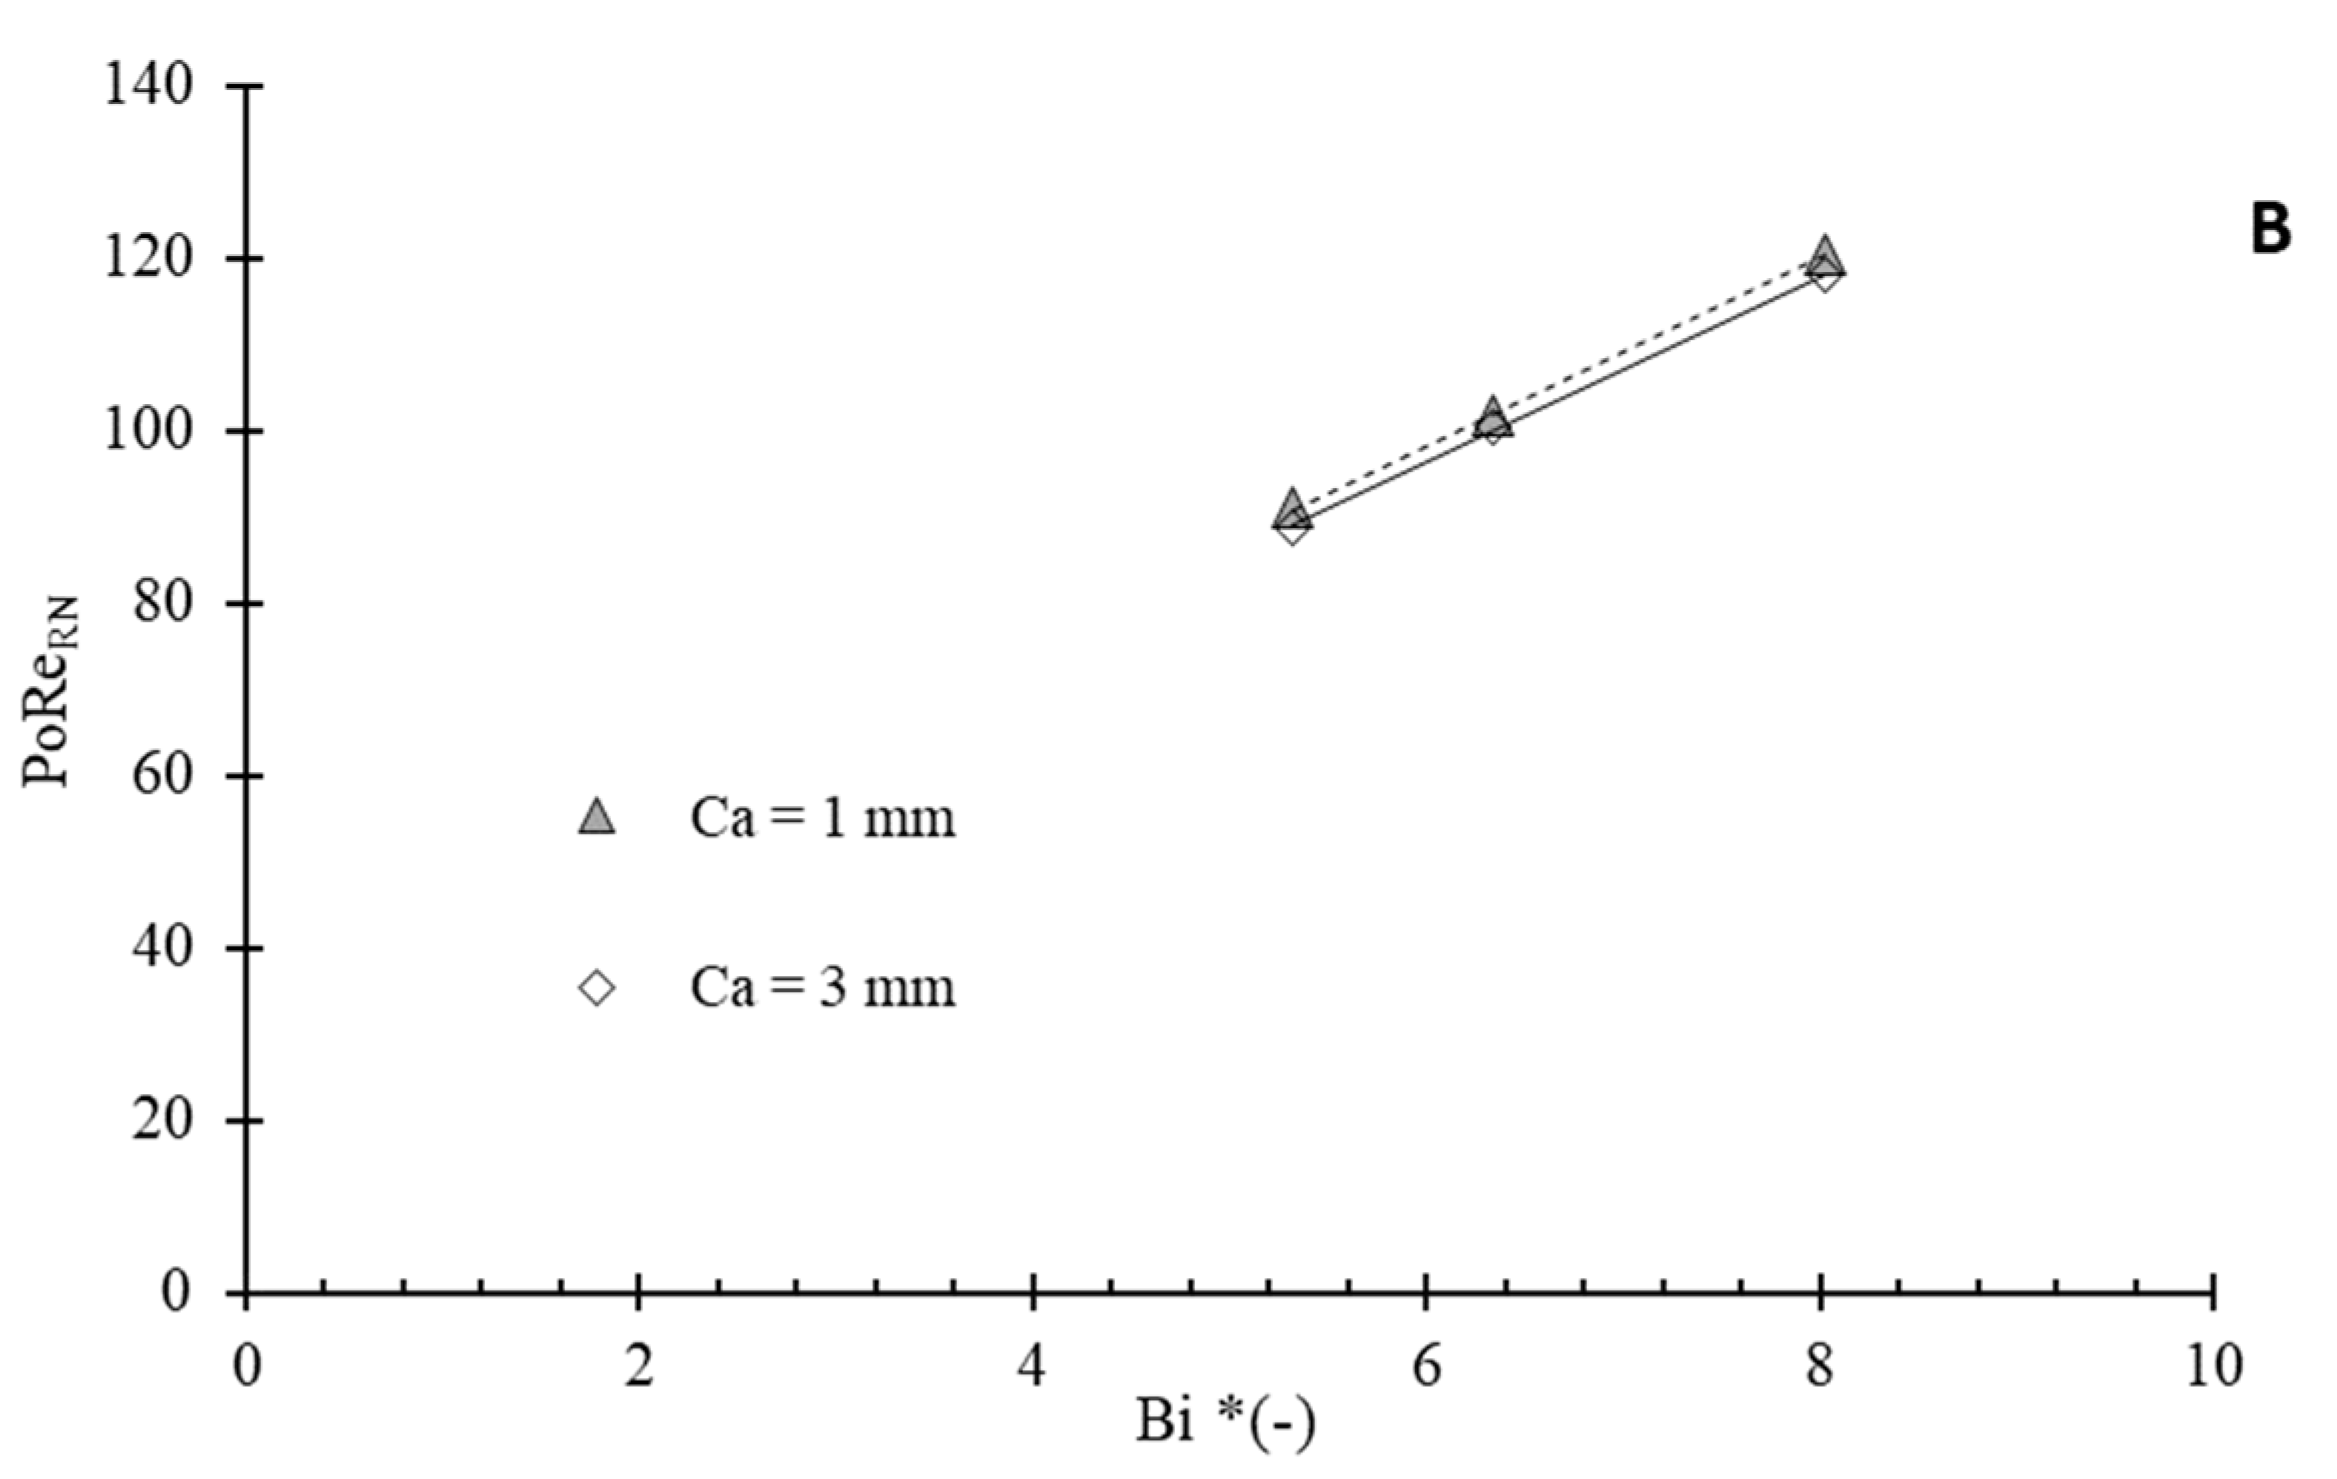
Using the values obtained from the simulations, the Metzner-Otto coefficient has been determined for the experimentally and numerically obtained power draw values, which are given in Figure 8. Determined values from the experimental data slightly deviate with rotor speed, whereas obtained values from the simulations are approximately constant and from Figure 8 one can conclude that can be considered as a function of geometry. Moreover, values alternatively have been determined from the slope of versus curves according to Equation (21), using obtained values by simulating values that were calculated for values of 1 mm and 3 mm, since this method requires minimum power draw values for three speeds of the rotor-stator mixer. As seen in Figure 9, versus curves exhibit a linear characteristic with a coefficient of determination (R2) greater than 0.99.
From the result of the simulation, values were found to be 84.4 and 61.8 for a of 1 mm and 3 mm, respectively, which are identical to the obtained results from the direct method given in Figure 9. On the other hand, from the experimental results, values were determined to be 73 and 53.4 for the axial clearances of 1 mm and 3 mm, respectively. There is a 9% deviation for mm and 13% deviation for mm, which shows reasonable agreement with the obtained value from the direct method.
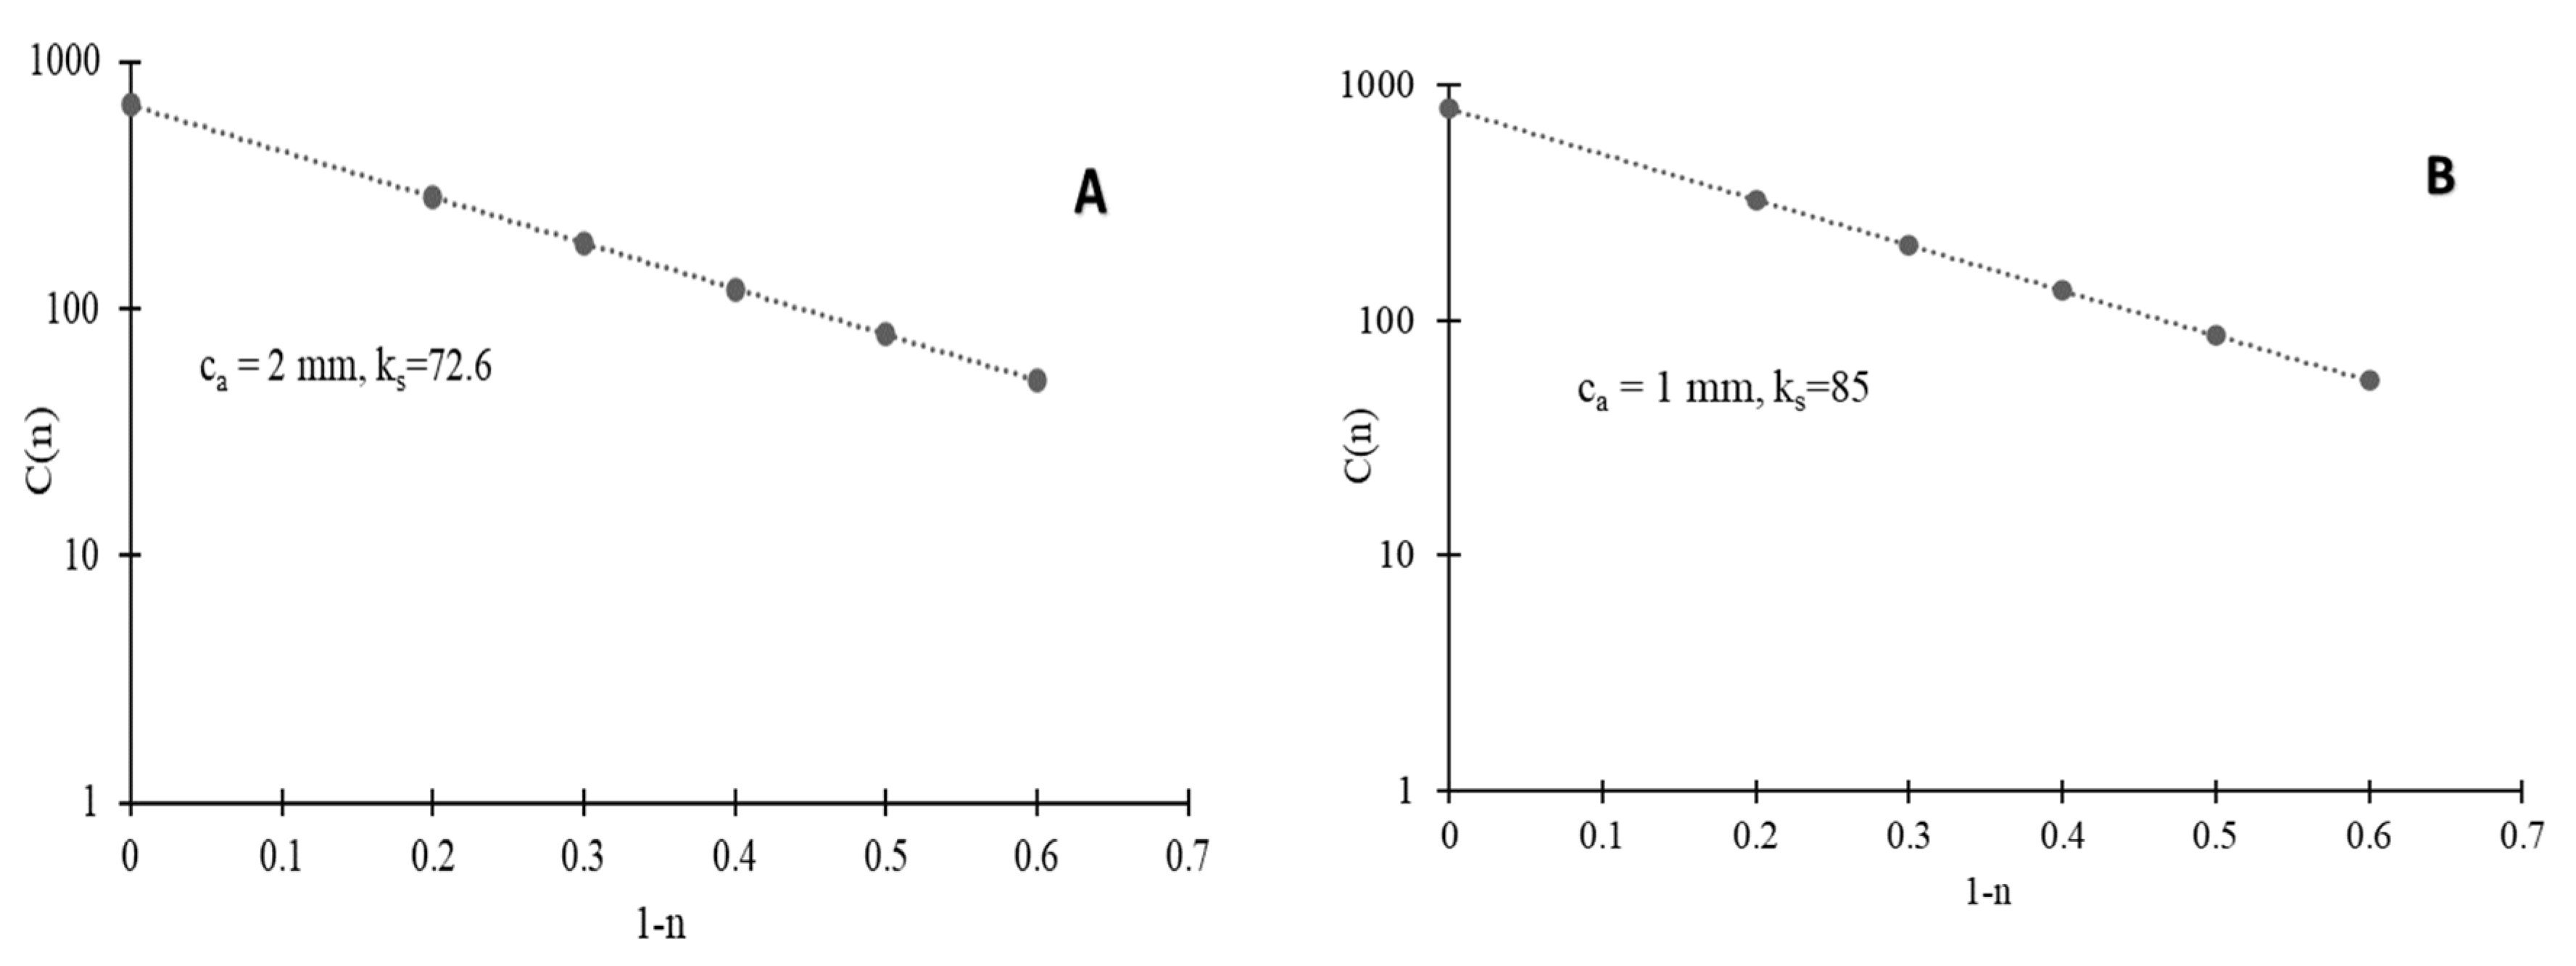
In addition to the Herschel–Bulkley model, further simulations have been carried out for the power-law model with the flow indexes ranged from 0.2 to 0.6 to examine the effect of the rheological model on for the investigated rotor-stator mixer with alue of the investigated mixeuation (12), acquired C(n) versus (1−n) curves are depicted in Figure 10. The results of the simulations indicate that evaluated values from the power-law model are approximately equal to the values obtained from the Herschel–Bulkley model and independent of the flow indexes, which confirms the conclusions of Vial et al., Zhang et al., and Wu et al. [10,16,18].
The suggested term efficiency , defined in Equation (25), is analyzed from the acquired power draw values from the simulation and experiment for the Herschel–Bulkley model. A comparison is given in Table 2. As seen, the efficiency increases with the increasing speed of the rotor and decreases with descending values of the axial clearance. However, it is clear from the table that the clearance has a weak effect on the defined efficiency and significantly varies with rotor speed.
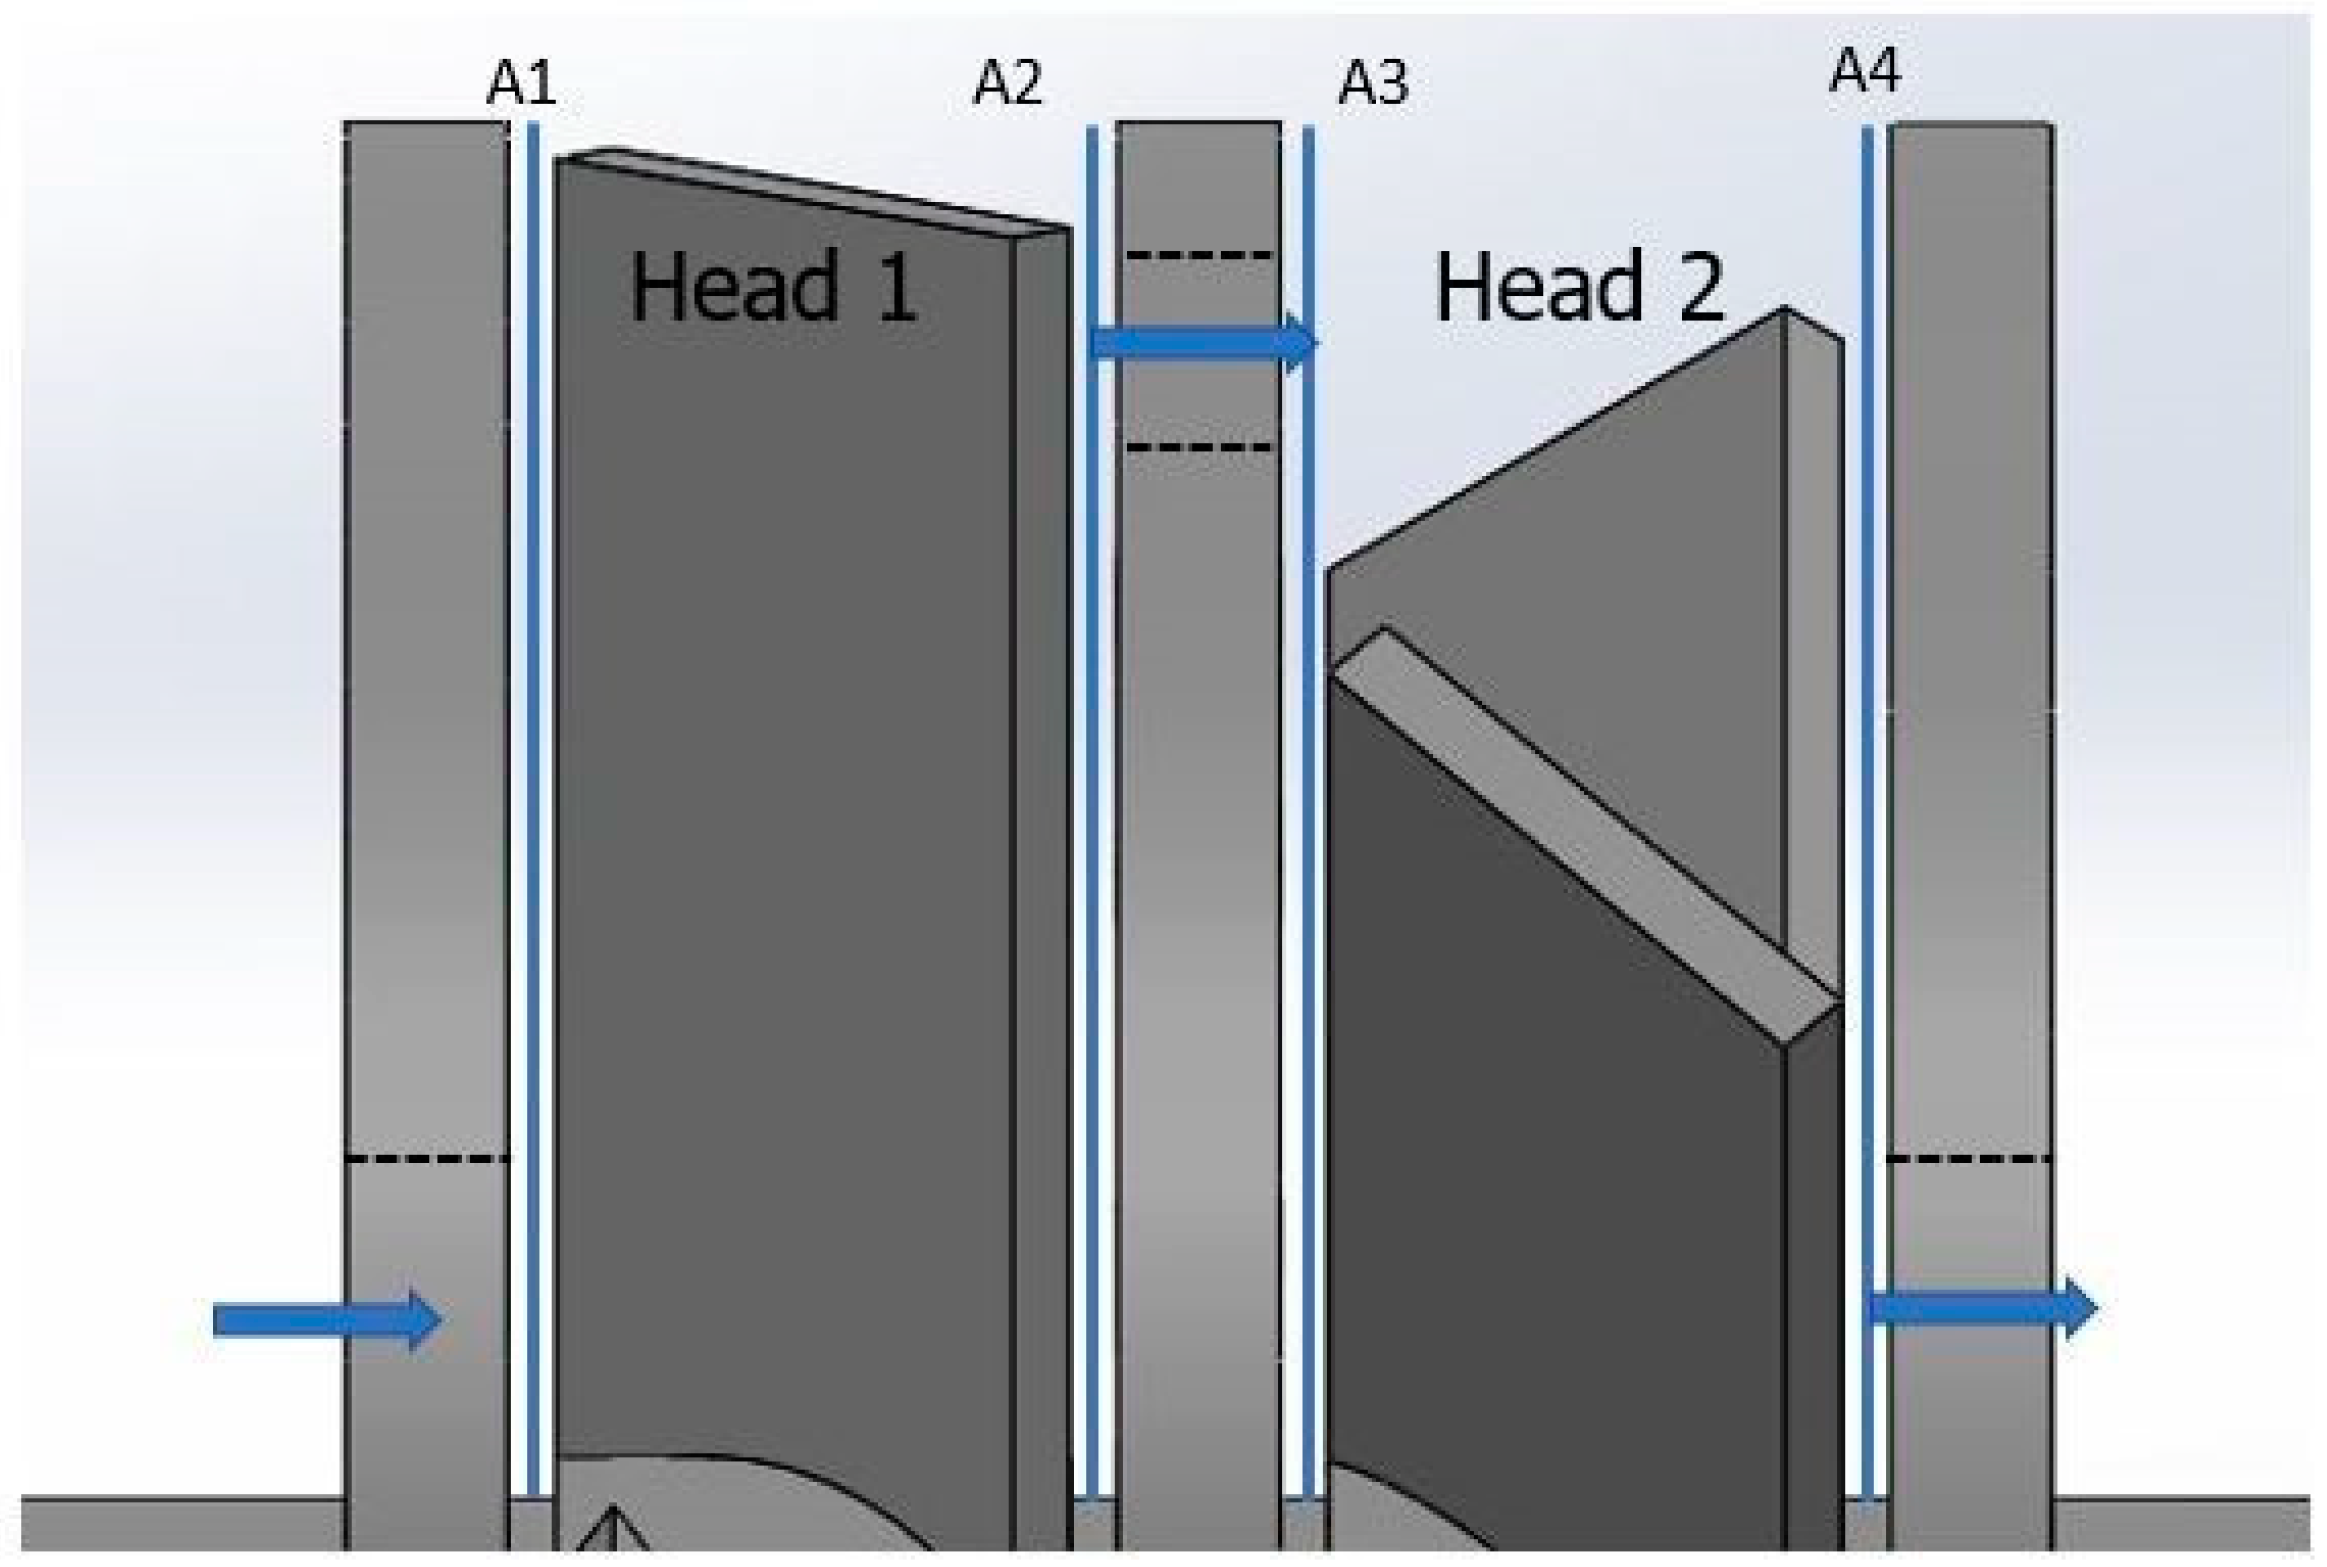
Generated shear by the rotor is one of the most important features of the rotor-stator mixers and required for the efficient mixing process. Hence, shear rate distribution in the midplanes between the rotor and stator is analyzed from the result of the simulation. The effect of on the shear rate distribution was investigated. The created planes (A1, A2, A3, A4) in the vertical direction is depicted in Figure 11. From the result of the simulation, it was found that the obtained shear rate profiles in the mixing heads are approximately the same due to the symmetry; hence, only the results of mixing head 1 are given as a non-dimensional form by:
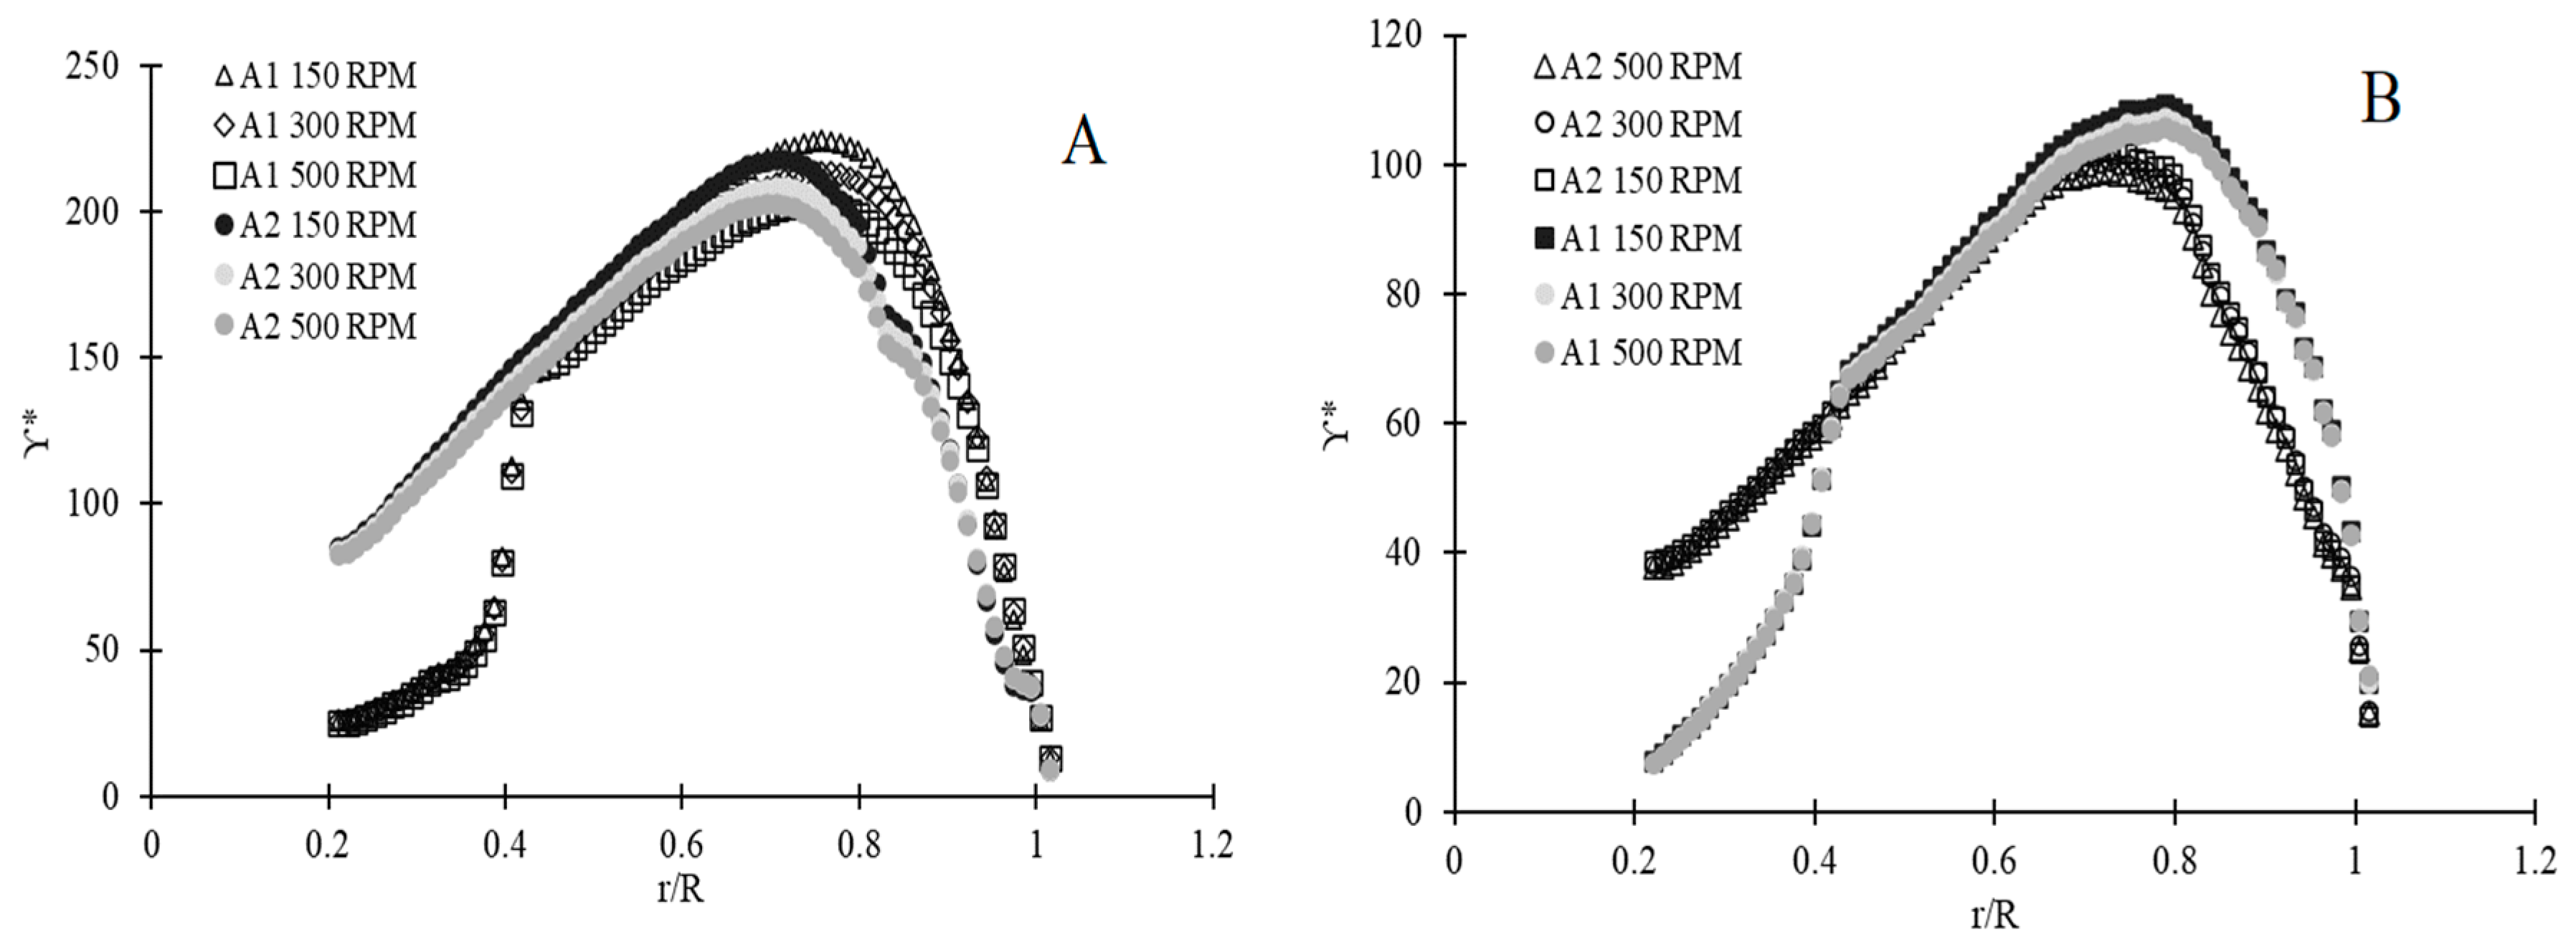
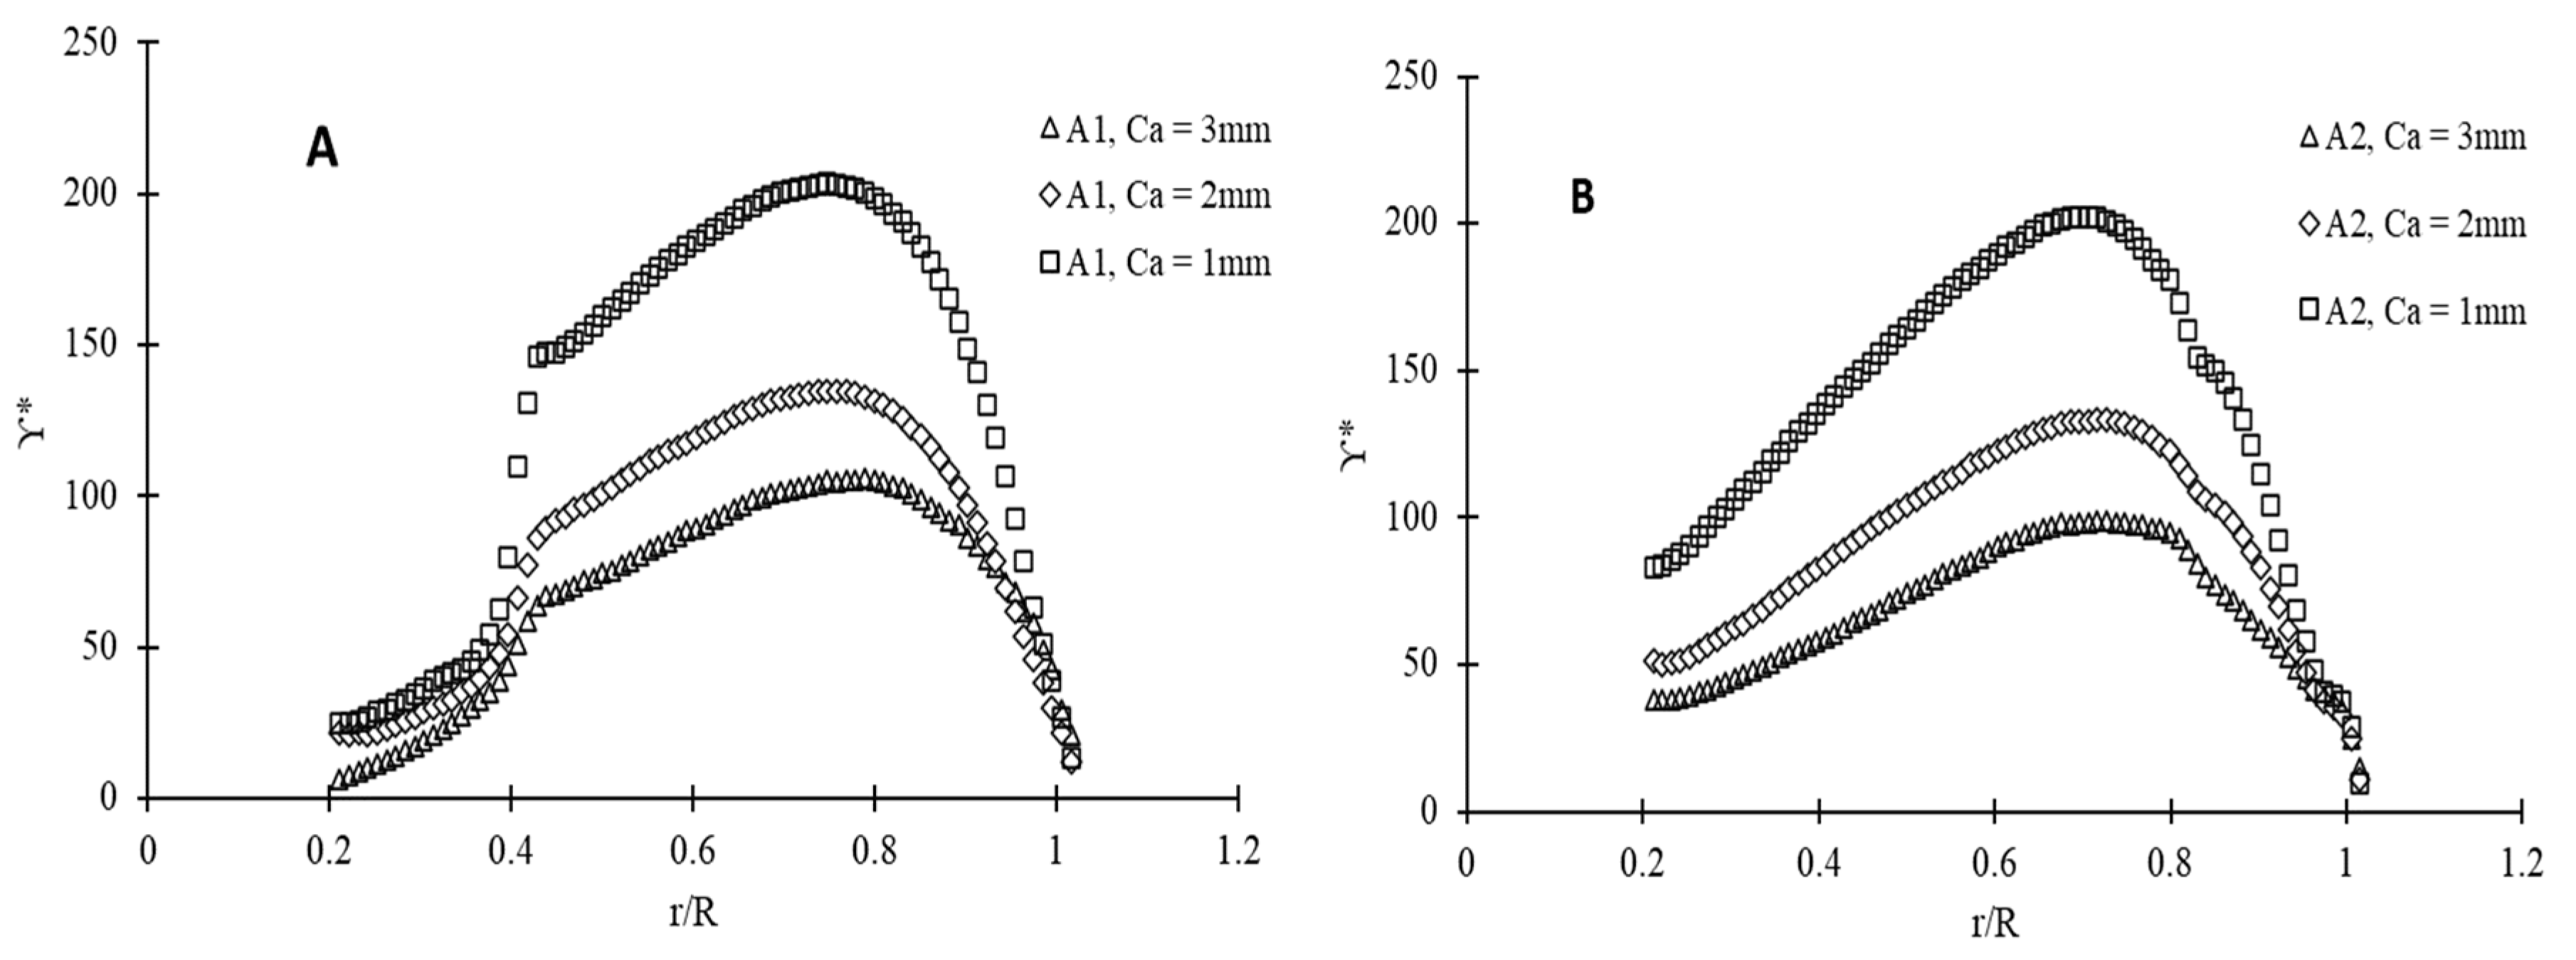
The non-dimensional shear rate profiles are shown in Figure 12. From the curves, one can conclude that obtained dimensionless shear rate profiles are independent of rotor speed and affected only by geometry. It is also clear that fully sheared flow is ensured in the investigated planes and for the three rotational speeds of the rotors, there are no dead zones (the region corresponds to the shaft of the mixer). The obtained non-dimensional shear rate (γ*) values in the A2 plane are almost two times higher than in the A2 plane for 0.2 < r/R < 0.4 due to the effect of the inlet section, and the shear rate suddenly increases at the wall of the inlet section (r/R = 0.4) in the A1 plane. The non-dimensional shear rate profiles are coincident for 0.4 < r/R < 0.8 in both planes. For , non-dimensional shear rate values are higher in plane A1 owing to the effect of the section in head 1, and the difference increases with the value.
Variation of dimensionless shear rate concerning axial clearances of 1 mm, 2 mm, and 3 mm for N = 500 RPM is given in Figure 13. The curves indicate that decreasing results in a higher shear profile and that provides a better mixing. From Figure 13, it can be deduced that the shear profile can be improved by changing the geometry between rotor and stator in the axial direction or the geometry of the inlet and outlet section. Especially the inlet and outlet sections give rise to decrease shear rates significantly, and therefore, a better shear profile can be acquired by decreasing the cross-sectional area of the inlet and outlet region.
In general, the created shear rate by the rotor is proportional to the power draw of the mixer. The dimensionless shear rate profiles indicate that has a strong effect on shear rate, whereas the effect of on the power draw, which is given in Figure 6, is almost negligible. Those results reveal that a big portion of the power is consumed to exceeding yield stresses and initiating flow. The result of the efficiency calculation proves that case.
4. Conclusions
In this work, the power draw and shear rate profile of a novel in-line rotor-stator mixer have been studied experimentally and through simulations. Experiments were conducted for the three rotational speed of the rotor and three axial clearances of the mixer using a viscoplastic shear-thinning fluid. From the obtained power draw values of the experiment, the effect of axial clearance and rotor speed on power consumption is discussed. From the measured pressure of the fluid, the contribution of the fluid flow on total power was calculated. It was found that the power arising from the flow of fluid has a negligible effect on the total power draw of the rotor-stator mixer.
Several simulations were carried out to verify the power consumption of the rotor-stator mixer for the Herschel–Bulkley model, and good agreements were obtained. Then, the power draw constant and were determined from the power draw values acquired from the experiment and simulations and a good agreement was found. Results of the simulations from the Herschel–Bulkley and power-law model indicate that is independent of the rheological model. Moreover, a new method has been proposed to determine for the Herschel–Bulkley model. From the result of the simulations, determined values from the direct and suggested methods are the same, but a maximum 13% deviation was found from the result of experimental power. The effect of axial clearances on and the dimensionless shear rate profile was studied. It was found that values and generated shear rate are inversely proportional to and the shear rate profile can be improved by decreasing clearances and geometric ratios. It was shown that fully sheared flow provided within the mixing heads for the examined rotor speed and power draw of the mixer significantly varied with the rotor speed owing to the effect of high yield stress.
Author Contributions
Conceptualization M.A., J.S., and T.J.; theoretical analysis, writing of article, simulations, M.A.; designing the experimental set-up and conducting experiments, evaluating the experimental data, interpreting the results, T.J. and J.S.; conducting experiments, simulations, J.S.; review and editing, T.J. and J.S. All authors have read and agreed to the published version of the manuscript.
Funding
The work presented here was supported by the Grant Agency of the Czech Technical University in Prague within the framework of grant number SGS18/129/OHK2/2T/12.
Conflicts of Interest
The authors declare no conflict of interest.
Nomenclature
| Power coefficient (-) | |
| Clearance in the axial direction (m) | |
| Clearance in radial direction | |
| Diameter of the rotor (m) | |
| Consistency (Pa· sn) | |
| k | Flow power constant |
| Metzner-Otto coefficient (-) | |
| Flow index (-) | |
| Rotational speed (1/rev) | |
| Power (W) | |
| r | Radius (m) |
| R | Radius of the rotor (m) |
| Density (kg/m3) | |
| Shear rate (1/s) | |
| Dimensionless shear rate | |
| Effective shear rate, given in Equation (2) | |
| Viscosity (Pa·s) | |
| Apparent viscosity (Pa·s) | |
| Yield stress (Pa) | |
| Bingham number for Bingham model (-) | |
| Bingham number for Herschel–Bulkley model (-) | |
| Flow number (-) | |
| Po | Power number (-) |
| Shear power number (-) | |
| Yield power number (-) | |
| Re | Reynolds number (-) |
| Reynolds number defined by Metzner and Otto (-) | |
| Reynolds number defined by Rieger and Novak (-) |
References
- Atiemo-Obeng, V.A.; Calabrese, R.V. Rotor-stator mixing devices. In Handbook of Industrial Mixing; Wiley: Hoboken, NJ, USA, 2004; pp. 479–505. [Google Scholar]
- Håkansson, A. Rotor-Stator Mixers: From Batch to Continuous Mode of Operation—A Review. Processes 2018, 6, 32. [Google Scholar] [CrossRef] [Green Version]
- Rodgers, T.L.; Cooke, M. Rotor-stator devices: The role of shear and the stator. Chem. Eng. Res. Des. 2012, 90, 323–327. [Google Scholar] [CrossRef]
- Hall, S.; Cooke, M.; El-Hamouz, A.; Kowalski, A.J. Droplet break-up by in-line Silverson rotor-stator mixer. Chem. Eng. Sci. 2011, 66, 2068–2079. [Google Scholar] [CrossRef]
- John, T.P.; Panesar, J.S.; Kowalski, A.; Rodgersa, T.L.; Fonte, C.P. Linking power and flow in rotor-stator mixers. Chem. Eng. Sci. 2019, 207, 504–515. [Google Scholar] [CrossRef]
- Minnick, B.A.; Kim, J.W.; Ko, D.I.; Calabrese, R.V. Flow, and power characteristics of an axialdischarge rotor-stator mixer. Chem. Eng. Res. Des. 2018, 136, 477–490. [Google Scholar] [CrossRef]
- Cooke, M.; Rodgers, T.L.; Kowalski, A.J. Power Consumption Characteristics of an In-Line Silverson High Shear Mixer. AIChE J. 2012, 58, 1683–1692. [Google Scholar] [CrossRef]
- James, J.; Cooke, M.; Trinh, L.; Hou, R.; Martin, P.; Kowalski, A.; Rodgers, T.L. Scale-up of batch rotor-stator mixers. Part 1–Power constants. Chem. Eng. Res. Des. 2017, 124, 313–320. [Google Scholar] [CrossRef]
- Chhabra, R.P.; Richardson, J.F. Liquid mixing. In Non-Newtonian Flow and Applied Rheology, 2nd ed.; Butterworth-Heinemann: Oxford, UK, 2008; pp. 376–471. [Google Scholar]
- Wu, H.; Shu, S.; Yang, N.; Lian, G.; Zhu, S.; Liu, M. Modeling of power characteristics for multistage rotor-stator mixers of shear-thinning fluids. Chem. Eng. Sci. 2014, 117, 173–182. [Google Scholar] [CrossRef]
- Ayas, M.; Skocilas, J.; Jirout, T. The friction factor of shear-thinning fluids in non-circular ducts—A simplified approach for rapid engineering calculation. Chem. Eng. Commun. 2020. [Google Scholar] [CrossRef]
- Ayas, M.; Skocilas, J.; Jirout, T. A practical method for predicting the friction factor of power-law fluids in a rectangular duct. Chem. Eng. Commun. 2019, 206, 1310–1316. [Google Scholar] [CrossRef]
- Skocilas, J.; Ayas, M.; Skocilasova, B.; Jirout, T. Effect of rotation direction of helical-ribbon agitator on circulation of high viscous batch. In Proceedings of the AIP Conference Proceedings, Usti nad Labem, Czech Republic, 9–11 October 2019. [Google Scholar]
- Archard, A.D.; Marouche, M.; Boisson, H.C. Hydrodynamics, and Metzner–Otto correlation in stirred vessels for yield stress fluids. Chem. Eng. Sci. 2006, 125, 15–24. [Google Scholar] [CrossRef] [Green Version]
- Kowalski, A.J. An expression for the power consumption of in-line rotor-stator devices. Chem. Eng. Process. 2009, 48, 581–585. [Google Scholar] [CrossRef]
- Vial, C.; Stiriba, Y.; Trad, Z. CFD Simulation of Flow and Mixing in In-line Rotor-Stator Mixers with Complex Fluids. Can. J. Chem. Eng. 2015, 93, 391–403. [Google Scholar] [CrossRef]
- Cheng, Q.; Xu, S.; Shi, J.; Li, W.; Zhang, J. Pump Capacity and Power Consumption of Two Commercial In-line High Shear Mixers. Ind. Eng. Chem. 2013, 52, 525–537. [Google Scholar] [CrossRef]
- Zhang, C.; Gu, J.; Qin, H.; Xu, Q.; Li, W.; Jia, X.; Zhang, J. CFD analysis of flow pattern and power consumption for viscous fluids in in-line highs hear mixers. Chem. Eng. Res. Des. 2017, 117, 190–214. [Google Scholar] [CrossRef]
- Ayas, M.; Skocilas, J.; Jirout, T. Mixing of a viscoplastic fluid in an in-line mixer. In Proceedings of the AIP Conference Proceedings, Zlin, Czech Republic, 30–31 July 2019. [Google Scholar]
- Kratky, L.; Moravec, J.; Jirout, T. Návrh Hnětače pro Přípravu Kolagenní Hmoty v Kontinuálním Režimu (Technical Report); ČVUT v Praze, Fakulta Strojní, Ústav Procesní a Zpracovatelské Techniky: Praha, Czech Republic, 2014. [Google Scholar]
- Netusil, J.; Rieger, F. Power consumption of screw and helical ribbon agitators in highly viscous pseudoplastic fluids. Chem. Eng. 1992, 52, 9–12. [Google Scholar] [CrossRef]
- Metzner, A.B.; Reed, J.C. Flow of non-Newtonian Fluids—Correlations of the laminar, transition and turbulent flow regions. AlChe J. 1955, 1, 434–440. [Google Scholar] [CrossRef]
- Rieger, F.; Novak, V. Power consumption of agitators in highly viscous non-Newtonian fluids. Trans. Inst. Chem. Eng. 1973, 51, 105–111. [Google Scholar]
- Bertrand, F.; Tanguy, P.A.; Fuente, E.B. A new perspective for the mixing of yield stress fluids with anchor impellers. J. Chem. Eng. Jpn. 1996, 29, 51–58. [Google Scholar] [CrossRef] [Green Version]
- Skočilas, J.; Žitny, R.; Štancl, J.; Dostal, M.; Landfeld, A.; Houška, M. Rheological Properties of Collagen Matter Predicted Using an Extrusion Rheometer. Texture Stud. 2016, 47, 514–522. [Google Scholar] [CrossRef]
- Celik, I.B.; Ghia, U.; Roache, P.J.; Freitas, C.J. Procedure for estimation and reporting of uncertainty due to discretization in CFD applications. J. Fluids Eng. 2008, 130, 1–4. [Google Scholar]

Figure 2.
Experimental set-up. Measured quantities: N—rotational speed, p—pressure, T—temperature, P—power.
Figure 2.
Experimental set-up. Measured quantities: N—rotational speed, p—pressure, T—temperature, P—power.

Figure 3.
Created grids for the simulations (A)—overall view, (B)—Cross-sectional view.

Figure 4.
Result of experimentally obtained power values.

Figure 5.
The values of temperature gradients due to viscous energy dissipation.

Figure 6.
Comparison of experimentally and numerically obtained power draw values.

Figure 7.
Numerically obtained Po-Re curve and C values for the Newtonian case.

Figure 8.
Calculated ks values from the experiments and simulations.

Figure 9.
versus Bi* curves, (A)—CFD, (B)—Experiment.


Figure 10.
Determined ks values for the power-law case through simulations; (A)— mm, (B)— mm.

Figure 11.
Location of investigated vertical planes.

Figure 12.
Distribution of dimensionless shear rates (A)—
mm, (B)— mm.

Figure 13.
Effect of axial clearance on the dimensionless shear rate for N = 500 RPM, (A)—Plane A1, (B)—Plane A2.
Figure 13.
Effect of axial clearance on the dimensionless shear rate for N = 500 RPM, (A)—Plane A1, (B)—Plane A2.


Table 1.
Investigated rheological models and apparent viscosities.
| Rheological Model | Apparent Viscosity |
|---|---|
| Power-law model | |
| Bingham model | |
| Herschel–Bulkley |
Table 2.
, , and values.
| 3 | 150 | 266 | 178.3 | 88.2 | 0.33 | 250.8 | 166.5 | 84.3 | 0.34 |
| 3 | 300 | 70.4 | 43.3 | 27.4 | 0.39 | 67.5 | 41.1 | 26.4 | 0.39 |
| 3 | 500 | 26.7 | 15.2 | 11.5 | 0.43 | 26.5 | 15.1 | 11.5 | 0.43 |
| 2 | 500 | 26.9 | 14.9 | 12.0 | 0.45 | 27.6 | 14.9 | 12.0 | 0.43 |
| 1 | 150 | 266.78 | 171.1 | 95.6 | 0.36 | 262.6 | 168.1 | 94.5 | 0.36 |
| 1 | 300 | 71.5 | 41.7 | 30.5 | 0.41 | 71.6 | 41.8 | 29.8 | 0.42 |
| 1 | 500 | 27.3 | 14.7 | 12.5 | 0.46 | 28.0 | 15.2 | 12.8 | 0.46 |
© 2020 by the authors. Licensee MDPI, Basel, Switzerland. This article is an open access article distributed under the terms and conditions of the Creative Commons Attribution (CC BY) license (http://creativecommons.org/licenses/by/4.0/).
Share and Cite
MDPI and ACS Style
Ayas, M.; Skocilas, J.; Jirout, T. Analysis of Power Input of an In-Line Rotor-Stator Mixer for Viscoplastic Fluids. Processes 2020, 8, 916. https://doi.org/10.3390/pr8080916
AMA Style
Ayas M, Skocilas J, Jirout T. Analysis of Power Input of an In-Line Rotor-Stator Mixer for Viscoplastic Fluids. Processes. 2020; 8(8):916. https://doi.org/10.3390/pr8080916
Chicago/Turabian StyleAyas, Mehmet, Jan Skocilas, and Tomas Jirout. 2020. "Analysis of Power Input of an In-Line Rotor-Stator Mixer for Viscoplastic Fluids" Processes 8, no. 8: 916. https://doi.org/10.3390/pr8080916
Note that from the first issue of 2016, this journal uses article numbers instead of page numbers. See further details here.