In Situ 3D-µ-Tomography on Particle-Reinforced Light Metal Matrix Composite Materials under Creep Conditions


Chair of Metallic Materials, Institute of Materials Sciences and Technology, Faculty III–Process Sciences, Technische Universität Berlin, Sekr. BH18, Ernst-Reuter-Platz 1, 10587 Berlin, Germany
*
Author to whom correspondence should be addressed.
Metals 2020, 10(8), 1034; https://doi.org/10.3390/met10081034
Submission received: 19 June 2020
/
Revised: 14 July 2020
/
Accepted: 30 July 2020
/
Published: 1 August 2020
(This article belongs to the Special Issue Selected Papers from LightMat 2019)
Abstract
:In transportation light metal matrix composites (L-MMCs) are used increasingly due to their improved creep resistance even at higher application temperatures. Therefore, the creep behavior and failure mechanisms of creep loaded particle reinforced L-MMCs have been investigated intensively. Until now, creep damage analyses are usually performed ex situ by means of interrupted creep experiments. However, ex situ methods do not provide sufficient information about the evolution of creep damage. Hence, in situ synchrotron X-ray 3D-µ-tomography investigations were carried out enabling time and space resolved studies of the damage mechanisms in particle-reinforced titanium- and aluminum-based metal matrix composites (MMCs) during creep. The 3D-data were visualized and existing models were applied, specifying the phenomenology of the damage in the early and late creep stages. During the early stages of creep, the damage is determined by surface diffusion in the matrix or reinforcement fracture, both evolving proportionally to the macroscopic creep curve. In the late creep stages the damage mechanisms are quite different: In the Al-MMC, the identified mechanisms persist proportional to creep strain. In contrast, in the titanium-MMC, a changeover to the mechanism of dislocation creep evolving super-proportionally to creep strain occurs.
1. Introduction
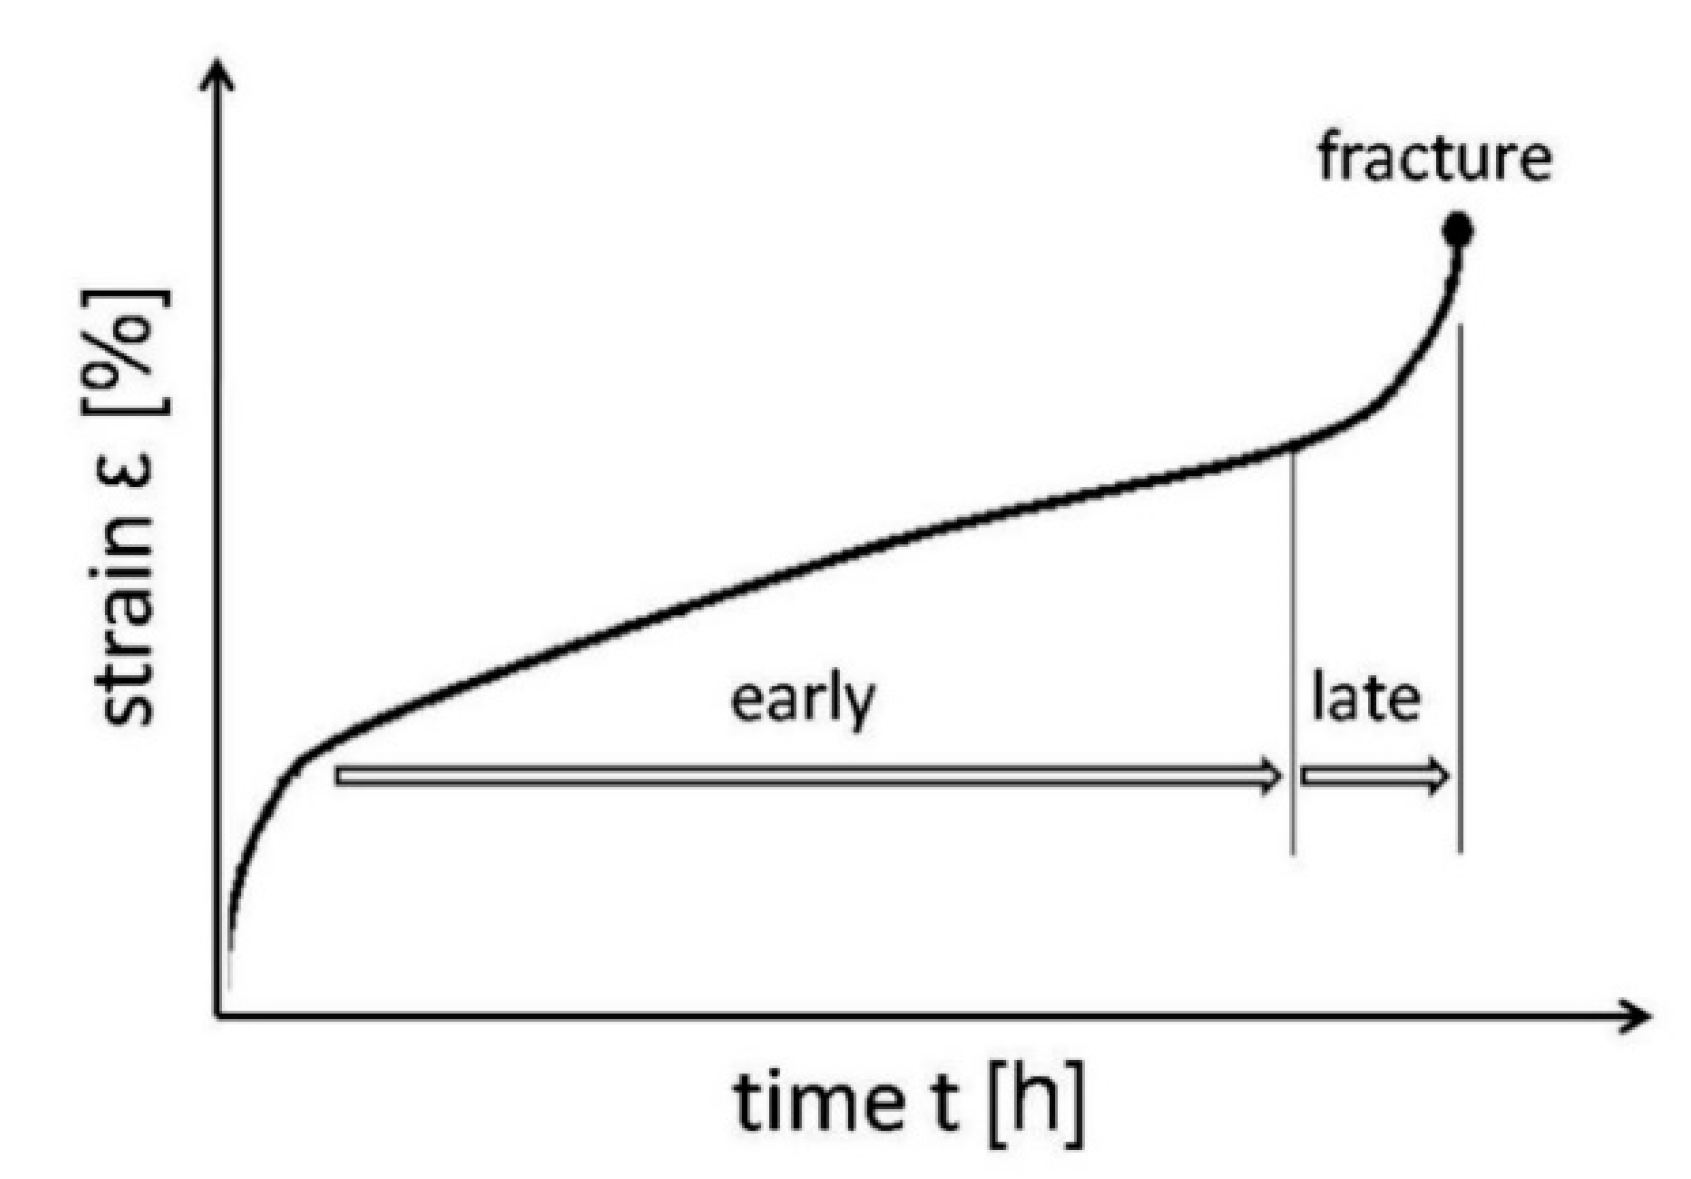
Since their first application in the middle of 1970s in the space shuttle-program, metal matrix composites (MMCs) are commercially used in transport, e.g., automotive and aircraft applications, especially in engine and turbine parts [1,2,3]. In this field, the materials are exposed to high mechanical and thermal loads leading to creep [4]. Due to their lower thermal expansion and good thermal conductivity, lightweight-MMCs are well-suited for use at creep conditions and particulate reinforced aluminum- and titanium-based MMCs are frequently investigated until today, e.g., by [5,6,7,8,9,10,11,12]. Creep occurs at constant stress below the yield point and at constant elevated temperatures above 0.3–0.4 , with being the homologous temperature calculated from the applied temperature divided by the melting temperature () [13]. The time-dependent evolution of the strain is usually shown in a creep curve exhibiting three different creep stages labeled as primary, secondary, and tertiary creep stages. The different creep stages are defined by the creep rate, which can be determined by many physical mechanisms, the fundamentals of which are described in, e.g., [14,15,16,17,18,19,20]. Here, the creep stages are labeled as “early” and “late”. These terms refer to the investigated microstructural mechanisms of void formation and void growth taking place as well as their coincide with the creep strain (Figure 1) and in this context follow the designation of Greenwood [21].
The formation and development of creep damage in the context of metals is synonymous to cavitation, whereas in metal matrix composites, additional creep damage like delamination of the matrix at the interface to the ceramic phases, fracture of particles, as well as growth of pores, which are due to the manufacturing process, can occur [22]. However, the curve progression of the particular creep curves is essentially similar, e.g., in [22,23,24]. In the case of the unreinforced metals, the relationship of cavitation to the creep curve is well known and described in [17,18]. From this literature it is further known that in the early stage, the creep damage is determined by void formation and the later creep stage by void growth. The void formation is related to the number of voids and is a function of the strain , whereas the void growth is related to the void size, respectively, the void volume , and is a function of the strain multiplied by time [21].
Void formation:
Void growth:
Isaac et al. show that with increasing creep time, the number of voids decreases, whereas the volume of the voids increases [25]. The investigations and analysis were carried out on a brass alloy, Cu–40Zn–2Pb containing three phases: α-brass, β-brass, and a Pb-rich phase, taking time-dependent evolution of shape, number, volume, and spatial orientation of voids into account. Spherical, ellipsoid, and rod-shaped voids as well as complex shape were divided, whereas the complex shape was identified to have the main influence on the creep damage regarding void number and size. Additionally, time-dependent changes of the spatial orientation to the loading axis of all void shapes from parallel at the beginning to perpendicular at the end of the creep test were found. This was assumed to be related to enhanced void growth, but without identifying the dedicated mechanism.
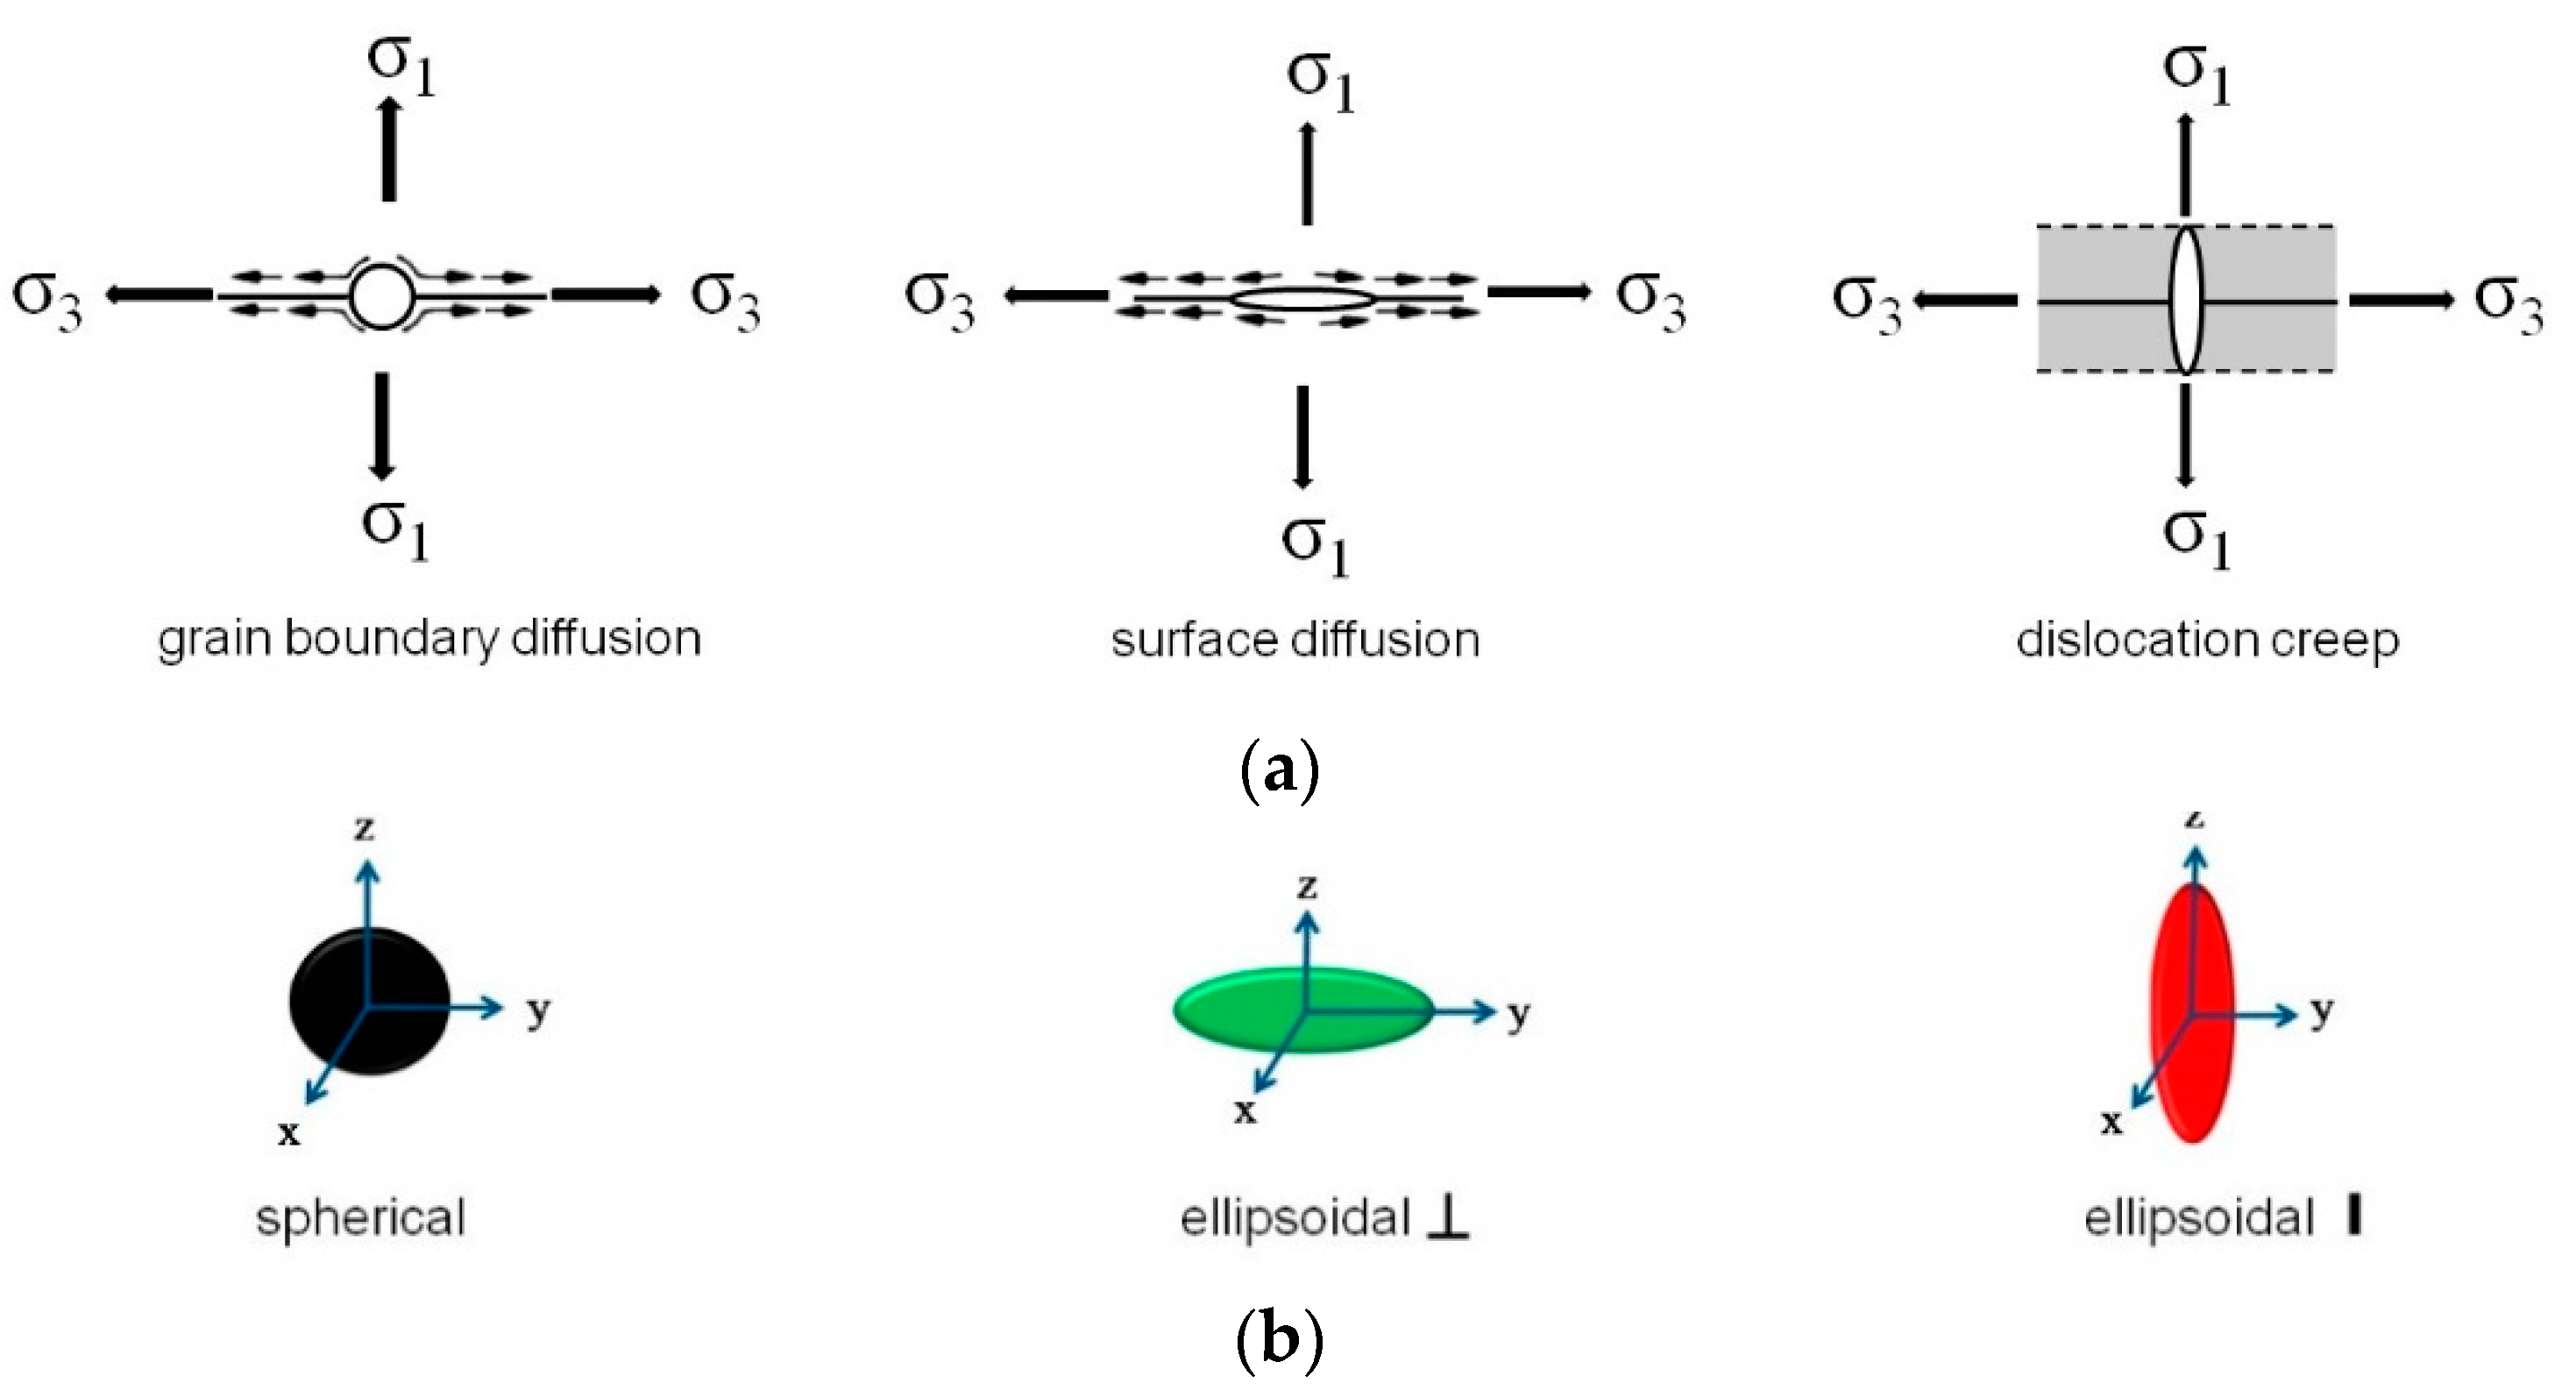
The morphology of the voids, however, is caused by formation and growth mechanisms. Cocks and Ashby defined the three creep mechanisms of grain boundary diffusion, surface diffusion, and dislocation creep [18]. The mechanism of grain boundary diffusion is specified as related to spherical void shape, the surface diffusion is corresponding to an ellipsoidal void shape with the longest axis oriented perpendicular to the load axis, and the dislocation creep is associated to an ellipsoidal void shape with the longest axis oriented parallel to the load axis (Figure 2).
In situ micro-tomography focusing on the investigation of the phenomenon of creep damage in MMCs provide a new insight into the internal material processes under mechanical and/or thermal loading [26,27,28,29,30,31].
In this study, time-resolved in situ 3D-analyses by synchrotron X-ray µ-tomography were carried out to analyze the formation and growth of the cavitation based on the number and the volume as well as the morphology of the voids during creep to approach the creep mechanisms behind in the early and late creep stages.
2. Materials and Methods
2.1. Materials
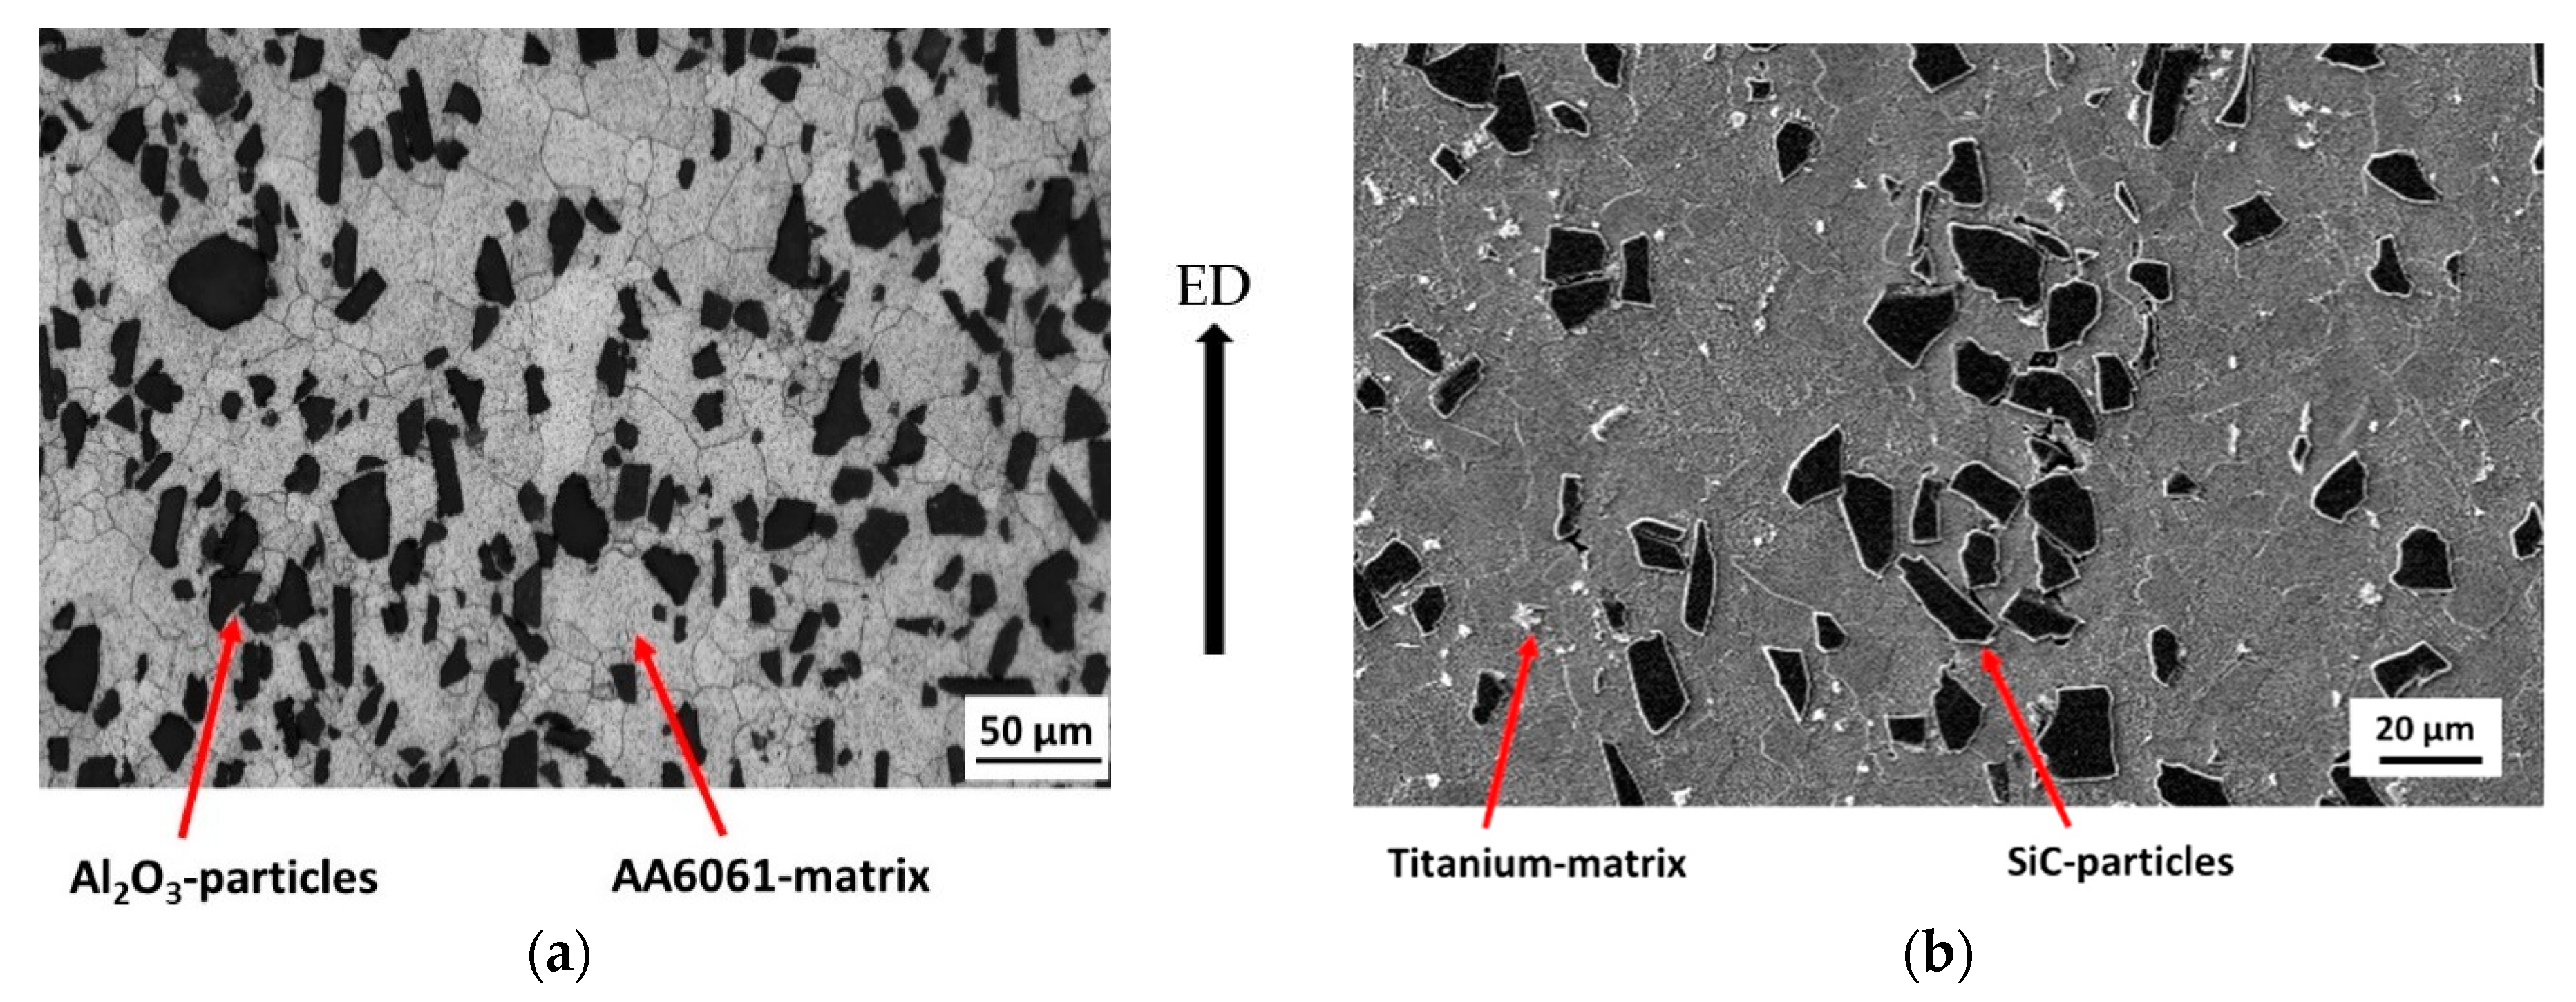
Discontinuously particle-reinforced metal matrix composites (MMC) based on lightweight metal matrices of an aluminum-alloy and commercially pure (cp) titanium were investigated (Table 1). The matrix of the aluminum-based material is a precipitation hardening alloy of the 6xxx-series, AA6061, reinforced by 22% Al2O3-particles (further referred to as Al-MMC) manufactured by casting, subsequently followed by hot extrusion and a T6-heat treatment in the overaged condition to prevent changes of the material during creep. The T6-heat treatment was carried out by a solution heat treatment at 560 °C for 30 min and quenched in water, followed by an aging at room temperature for 93 h, a subsequently aging at 160 °C for 8 h and overaging at 300 °C for 2 h as described in detail by Requena et al. in [23,32,33]. The titanium-MMC is based on a cp-titanium matrix (99.5%) reinforced by 15% SiC-particles (further referred to as Ti-MMC) manufactured by powder metallurgy and subsequently hot extruded as described in [34].
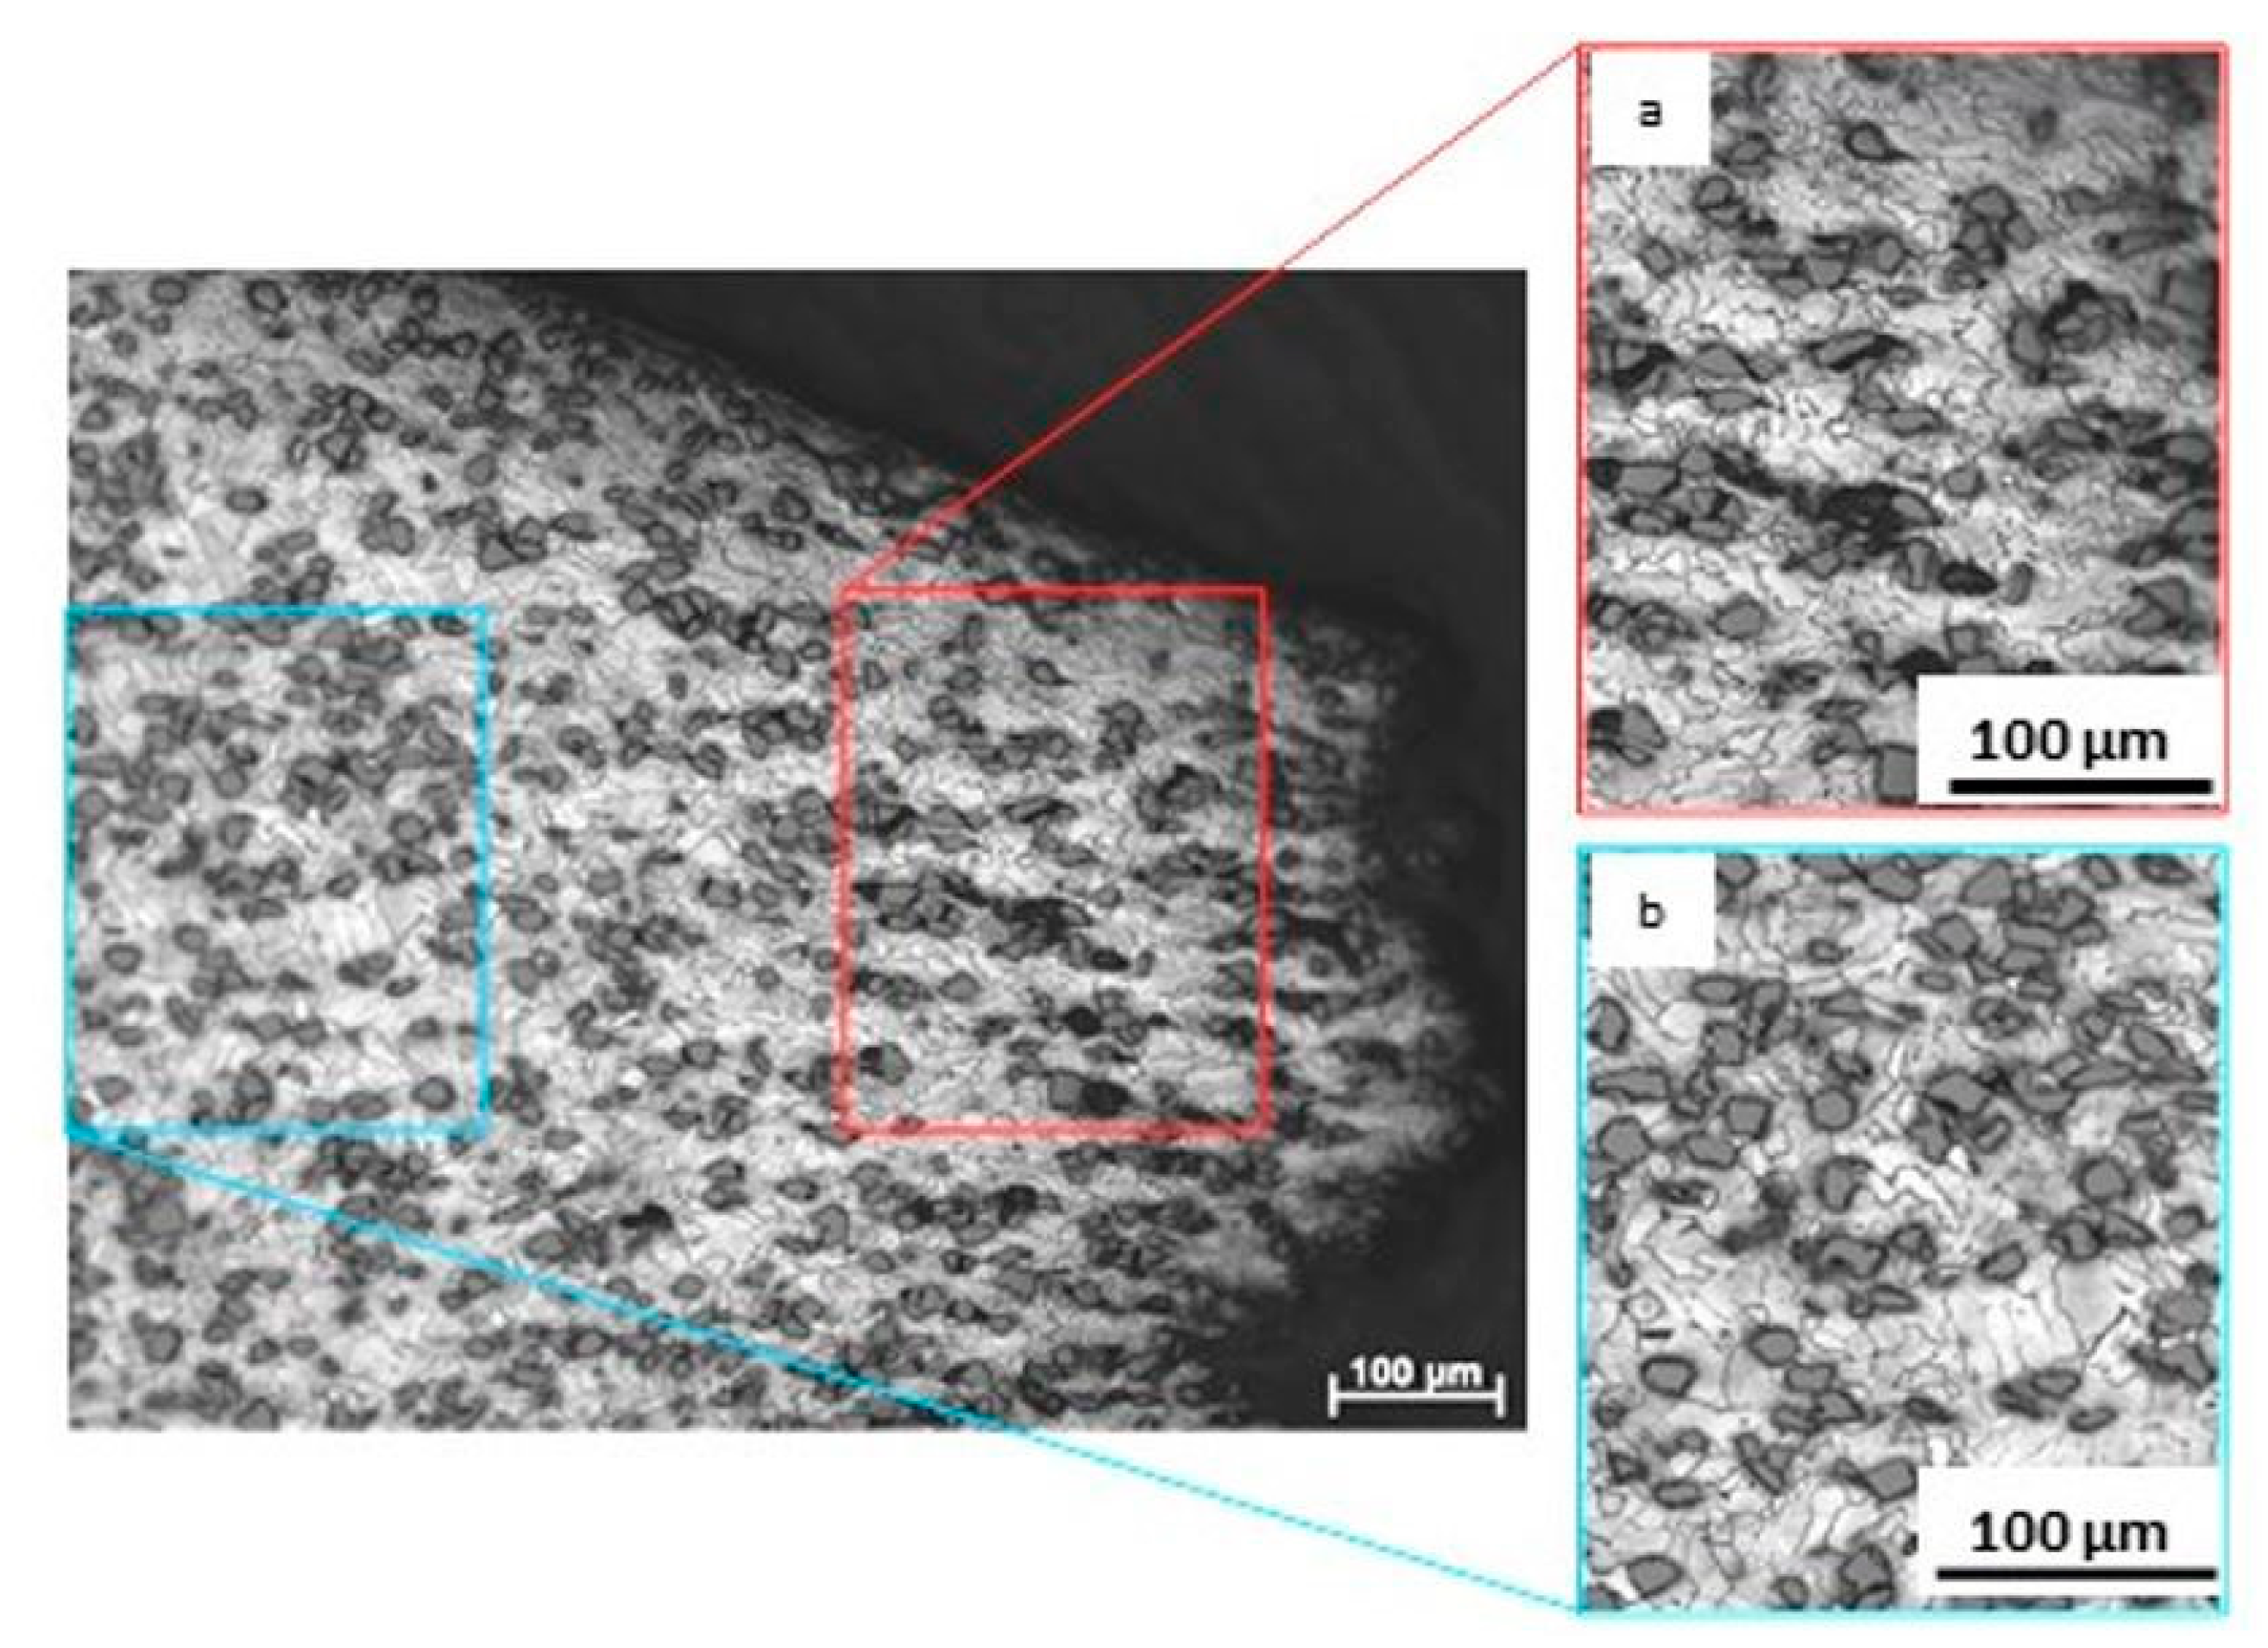
The distribution of the particles is quite uniform in both light metal matrix composite (L-MMC)-materials. However, depending on the hot extrusion process, the longitudinal axes of elongated reinforcement particles tend to be aligned along the extrusion direction (ED) as it can be derived from micrographs taken by light microscopy (LM) and scanning electron microscopy (SEM) (Figure 3).
2.2. Miniature Creep Device
In order to perform tomographic investigations on in situ creep experiments under synchrotron radiation conditions, several boundary conditions have to be fulfilled, in regard to the beamline specifications at the ID15A beamline at the European Synchrotron Radiation Facility (ESRF, Grenoble, France). Particularly, the requirements of the rotation table, the detector, as well as the measurement procedure had to be taken into account. The ultimate load of the rotation table, where the creep device is mounted, is limited to approx. 10 kg. Depending on the image size of the camera, the size of the measured volume must be adapted in order to depict the region of interest. Furthermore, the creep device should be as free of vibrations as possible to prevent blurring within the radiographs.
These boundary conditions were fulfilled by a miniature creep device with a total weight less than 1 kg developed by TU Berlin, which has been described in detail in [35,36,37]. The mechanical load on the specimen is applied by a vibration-free mechanical spring, whose linear characteristic curve can be used to calculate and adjust the exact load with an accuracy less than ± 0.1 N. The applied stress is calculated with respect to the cross section of the sample by
During the creep tests, the elongation of the samples was measured by a Linear Variable Differential Transducer (LVDT) (Type SM2-T-KA, WayCon, Taufkirchen, Germany) with a measuring range of ± 1 mm and a deviation of ± 0.1 µm. The elongation was recorded by data acquisition software. From that the strain of the sample was calculated by
where is the initial length of the gauge volume of the specimen. Further details of the specimen geometry are given below.
Due to experimental and geometrical specifications considered in the design of the creep device, the creep test procedure is different to common laboratory equipment: First, the load has to be applied before starting the heating process. Second, the elongation of the sample cannot be measured directly at the gauge volume due to the required rotation of the sample during the experiment. Therefore, the displacement transducer was mounted axially on the top of the miniature creep device. Once the thermal equilibrium of the entire apparatus is reached, only the extension of the sample is measured.
2.3. Specimen Preparation and Dimensions
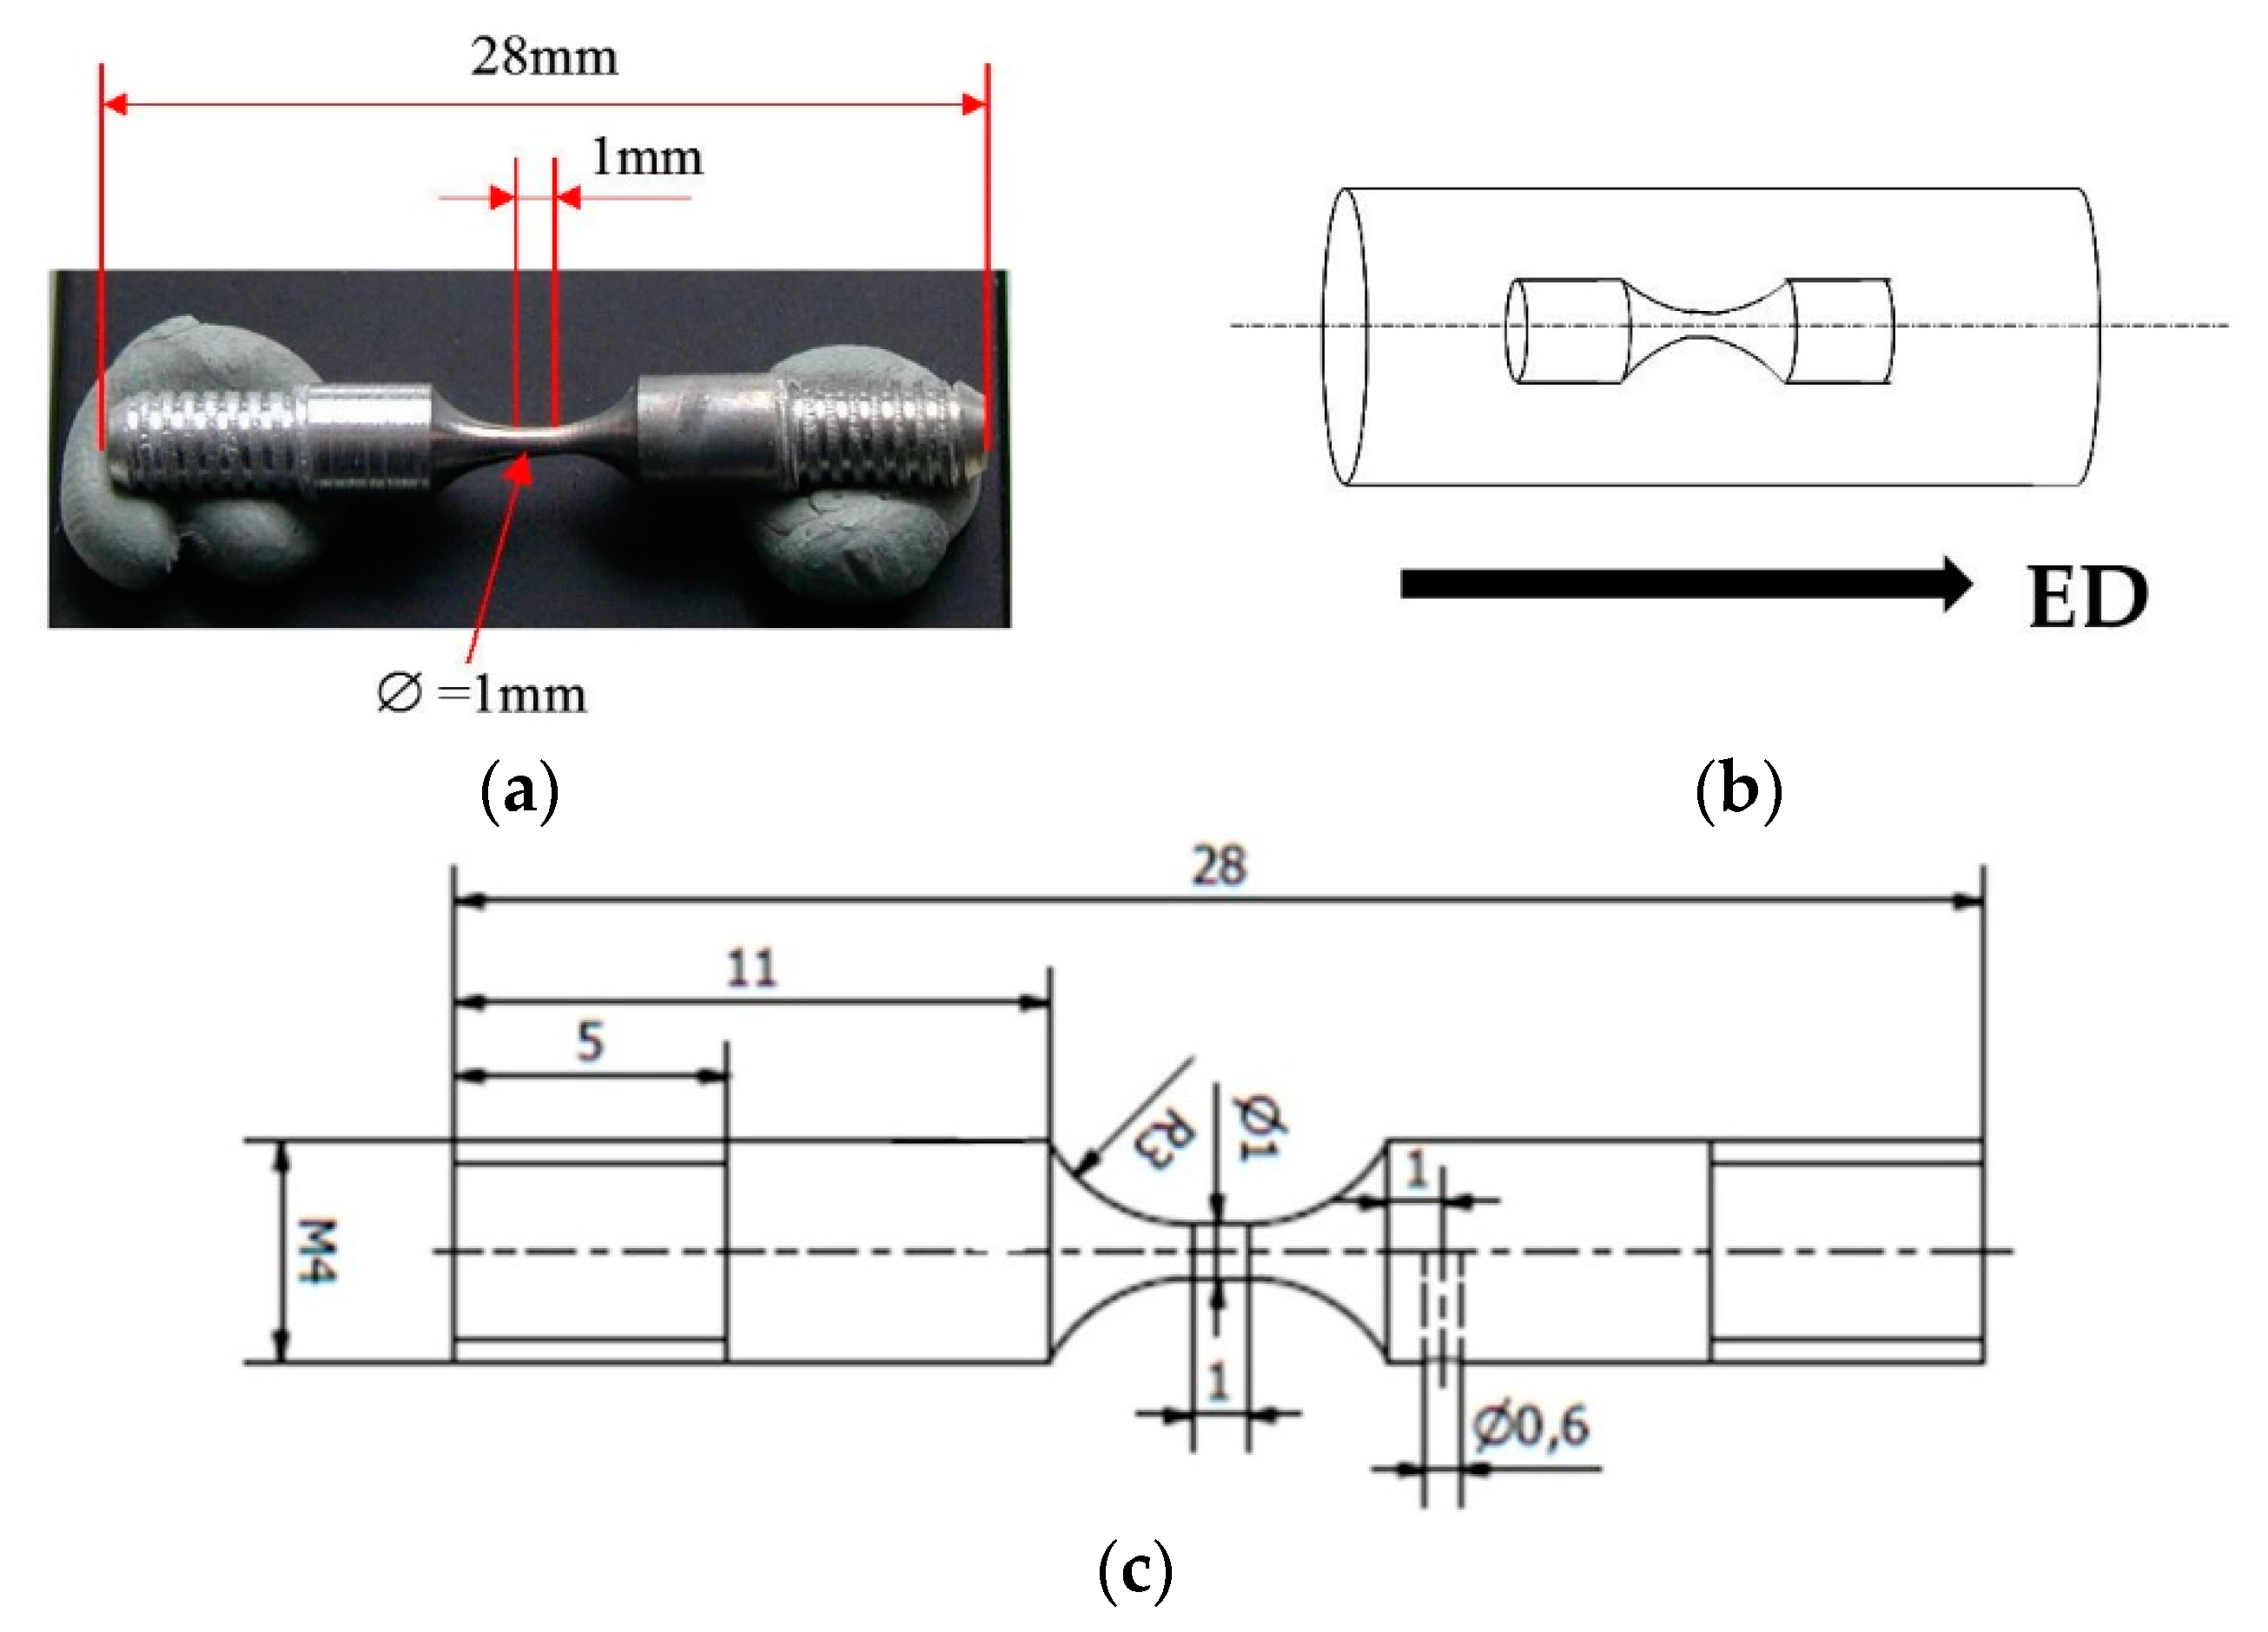
Miniature creep specimens were machined by turning from the hot extruded cylinders. The longitudinal axis of the specimens corresponds to the extrusion direction. Polishing the surface of the gauge volume prevented early failure due to roughness. The dimensions of the specimen (Figure 4) are determined by the experimental conditions given at the beamline. To ensure that the processes involved can be detected, the size of the volume of interest was adapted to the field-of-view of the detector (compare Section 2.4). Therefore, a gauge length 1 mm and a diameter 1 mm of the specimen were selected.
2.4. Experimental Setup at the Synchrotron Facility
The in situ 3D-µ-tomography experiments were carried out at the ID15A at the European Synchrotron Radiation facility (ESRF, Grenoble, France) using white beam conditions. Due to the long path of the beam through the experimental hutch an evacuated tube was installed to prevent scattering effects of the beam with ambient air. The distance from the detector optics to the sample was 100 mm. The DALSTAR 1M60 camera provides a resolution of 1024 × 1024 pixels and a field-of-view of 1.4 mm × 1.4 mm. In the reconstructed 3D-volumes a resolution of 1.6 µm × 1.6 µm × 1.6 µm per voxel was achieved. For the tomographic measurements on the material AA6061 + 22% (Al2O3)p, for every tomogram a total of 750 radiographs were recorded with an angular step size of 0.24°/180° rotation and an exposure time of 1 s each. Therefore, the measurement time for a tomogram was approx. 12 min. On cp-Titanium + 15% (SiC)p, the sample was rotated by an angle of 180° with a step size of 0.3°. About 500 up to 600 radiographs per 180° were recorded by an exposure time of 50 milliseconds, resulting in a measuring time for each tomogram of about 1 or 2 min in total. This enables to obtain sharp tomograms even in the tertiary creep stage at a high strain rate of the creep samples, in which no motion artifacts due to measurement occurred.
2.5. Data Processing
The reconstruction procedure of the 3D-volumes is described in [38]. The reconstruction software of the ESRF computing infrastructure NICE (Networked Interactive Computing Environment, ESRF, Grenoble, France) including the correction of reconstruction artefacts was applied. Using the software VGSTUDIO MAX 2.1 (Volume Graphics, Heidelberg, Germany), the reconstructed 3D-data were visualized and additionally the size, shape, and orientation of the creep voids were analyzed by the defect analysis tool.
2.6. Creep Experiments
The experimental parameters of thermal and mechanical loads were chosen to lead to fracture in several hours while simultaneously exhibiting characteristic creep behavior. Therefore, creep loading parameters were selected resulting in creep rates less than 1 × 10⁻⁶ s−1 to ensure that no hot tensile tests are performed [39]. Both materials were investigated at various temperatures and loads. The creep experiments were conducted in air. The applied temperature was reached after around 1 min and kept constant for the whole experiment with an accuracy of ± 1 K. Temperature and displacement of the sample as well as tomograms were recorded during the experiment from the initial state until creep fracture of each sample. Table 2 shows the selected mechanical and thermal loads as well as the number of analyzed tomograms, which is due to the number of recorded and in addition to evaluable tomograms.
3. Results
3.1. Creep Curve
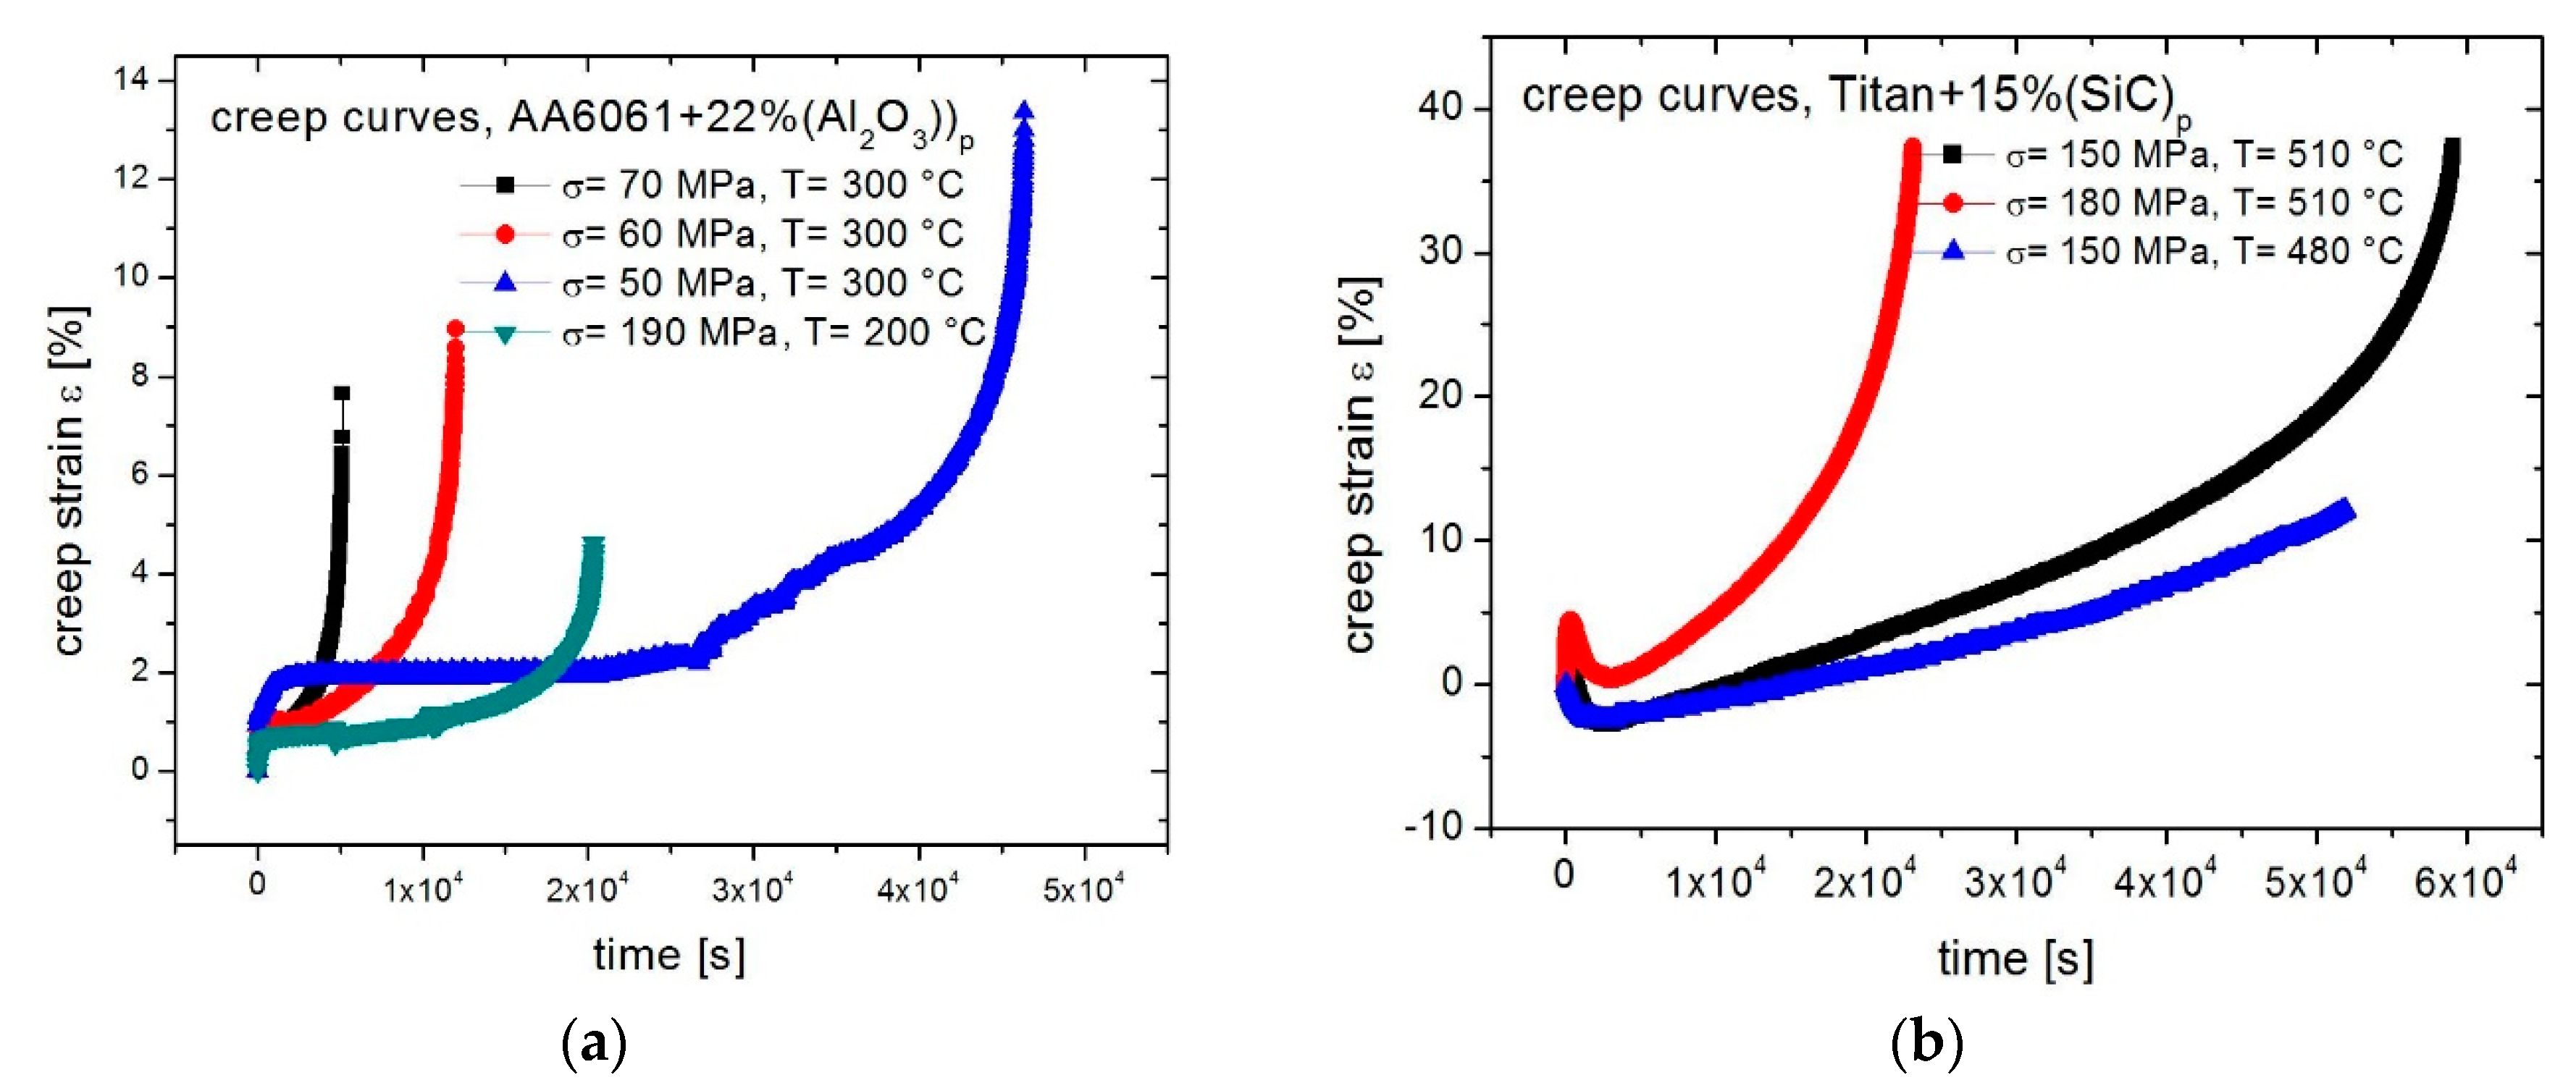
In Figure 5, the creep data for both MMC-materials are plotted in a diagram of strain ε over time t. All of the obtained creep curves exhibit a typical creep behavior in the early and late creep stages as shown in Figure 1. The elastic primary creep stages ahead of the early creep stage show an unusual creep behavior [18] due to the modified test procedure mentioned above.
The progression of the creep curves as well as the analyzed creep parameter (Table 3) show a dependence on temperature and/or stress. The strain at fracture of the Al-MMC in the range of 4–14% is significantly lower than of the Ti-MMC of 40%. The creep test of the Ti-MMC at a load of 150 MPa and the temperature of 480 °C was prematurely stopped due to the end of the beamtime.
3.2. Creep Damage
3.2.1. Total Cavitation
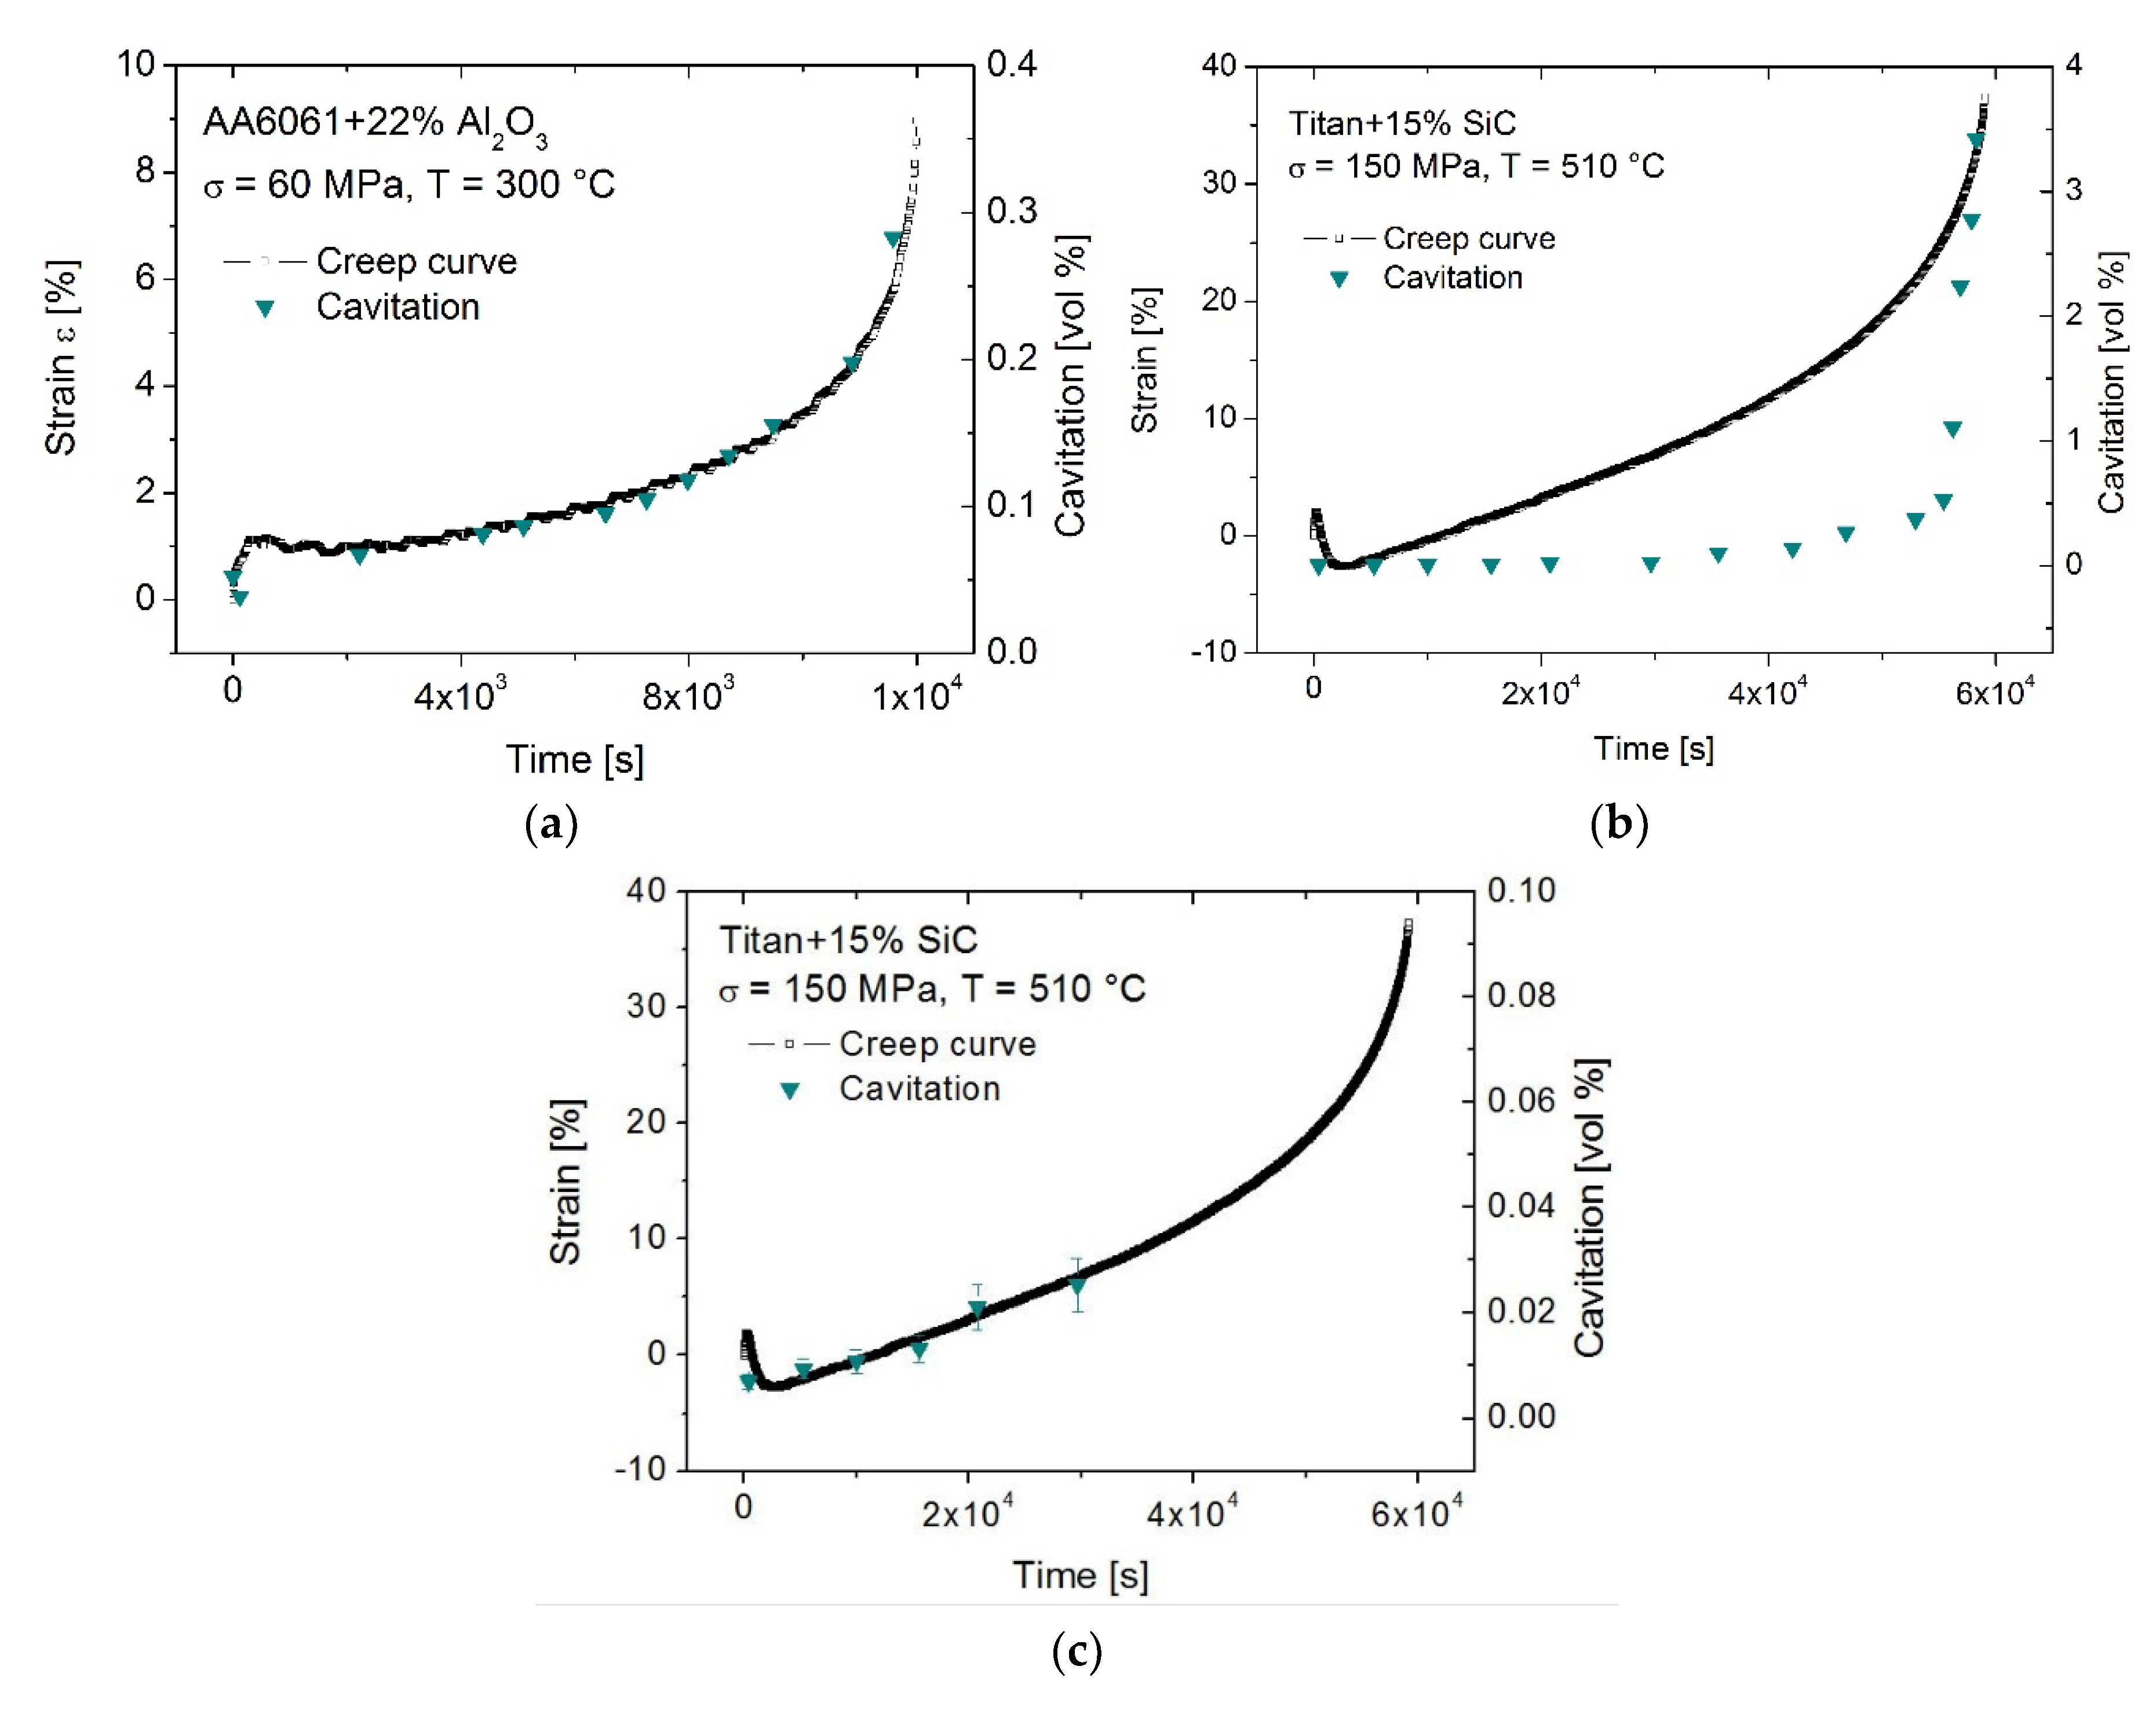
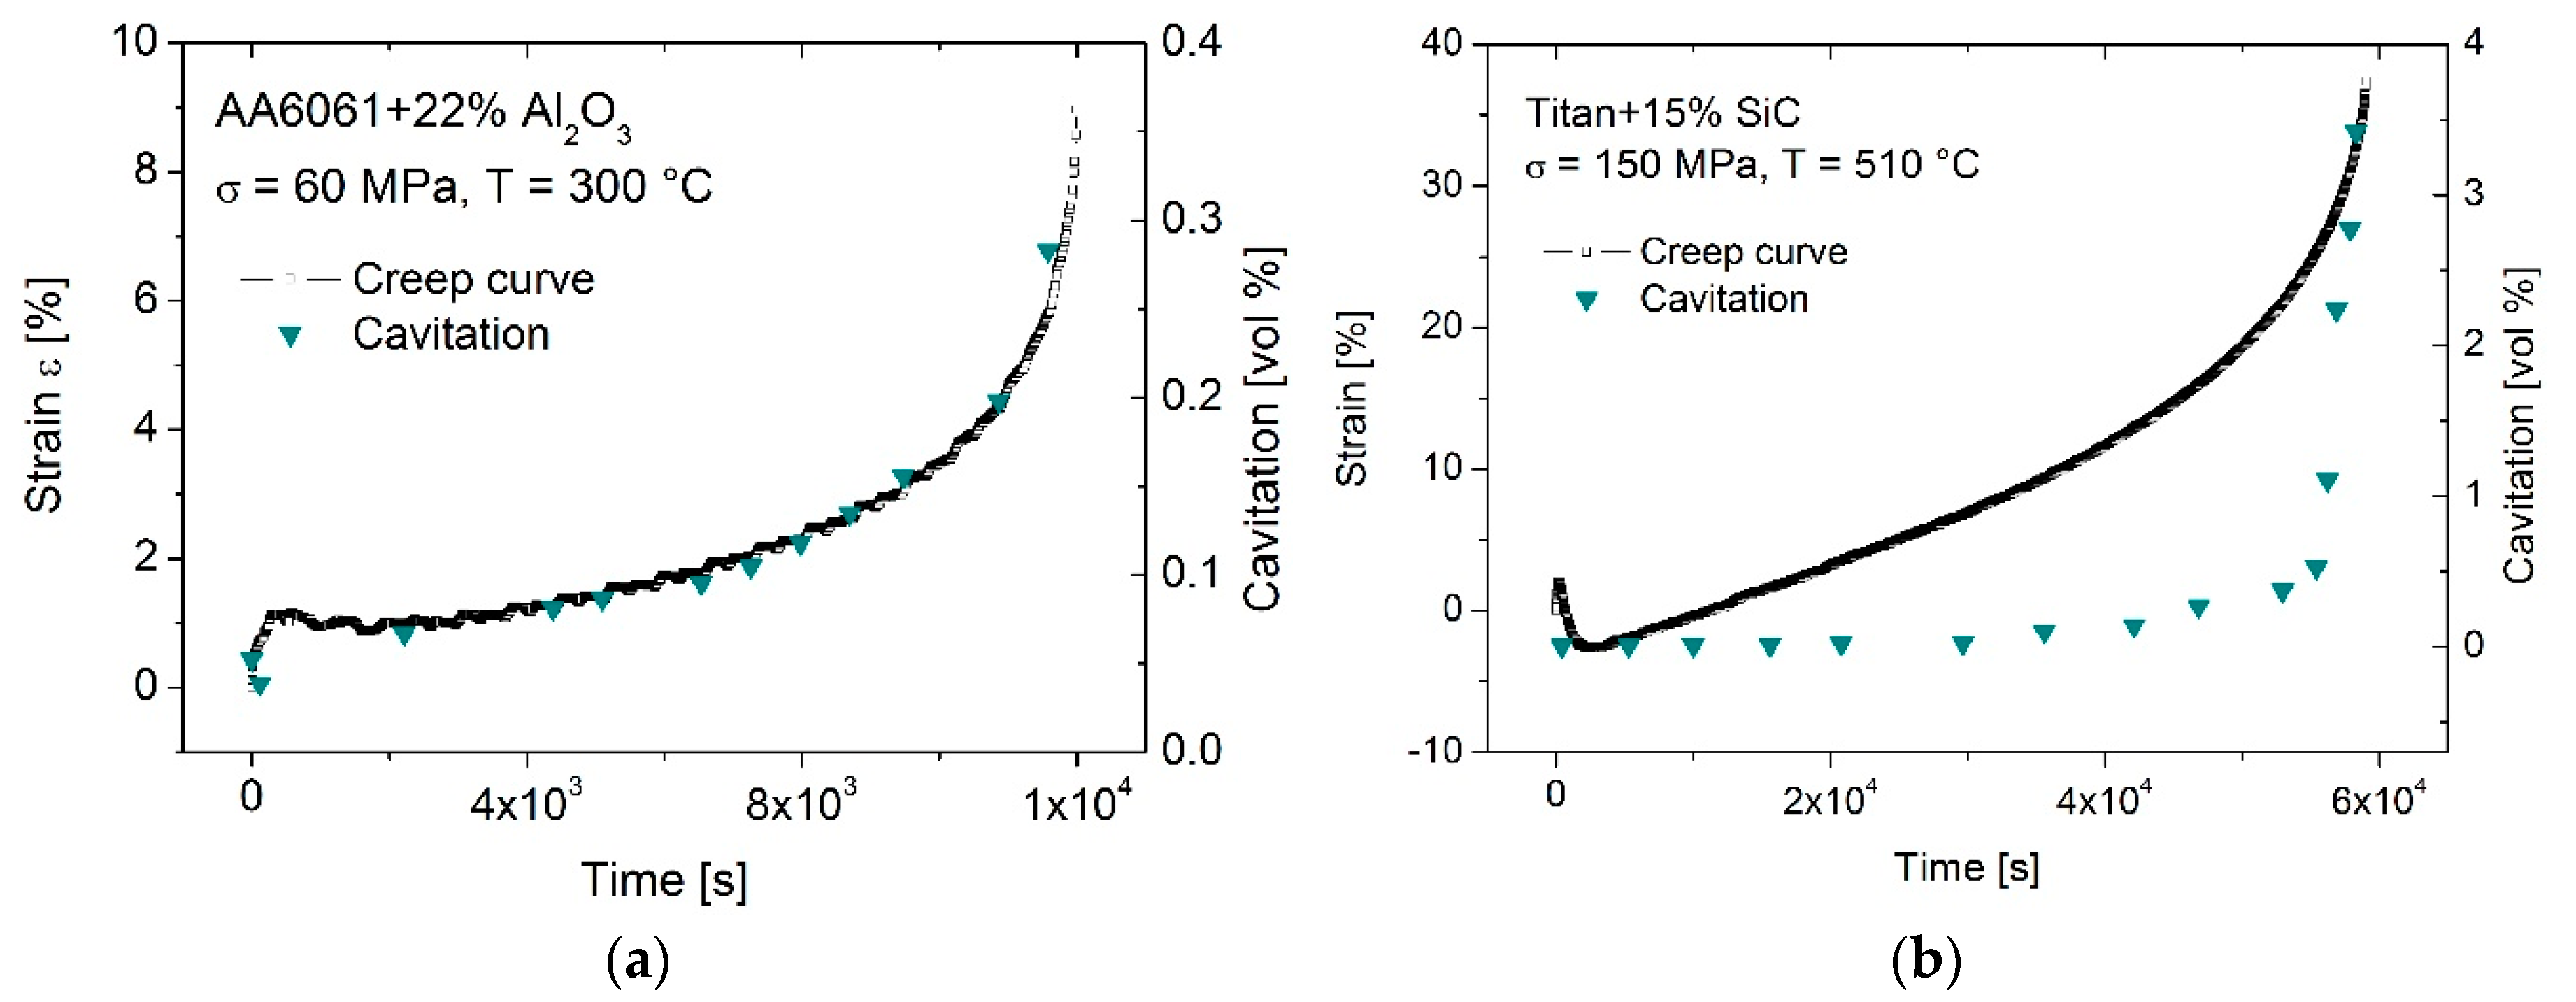
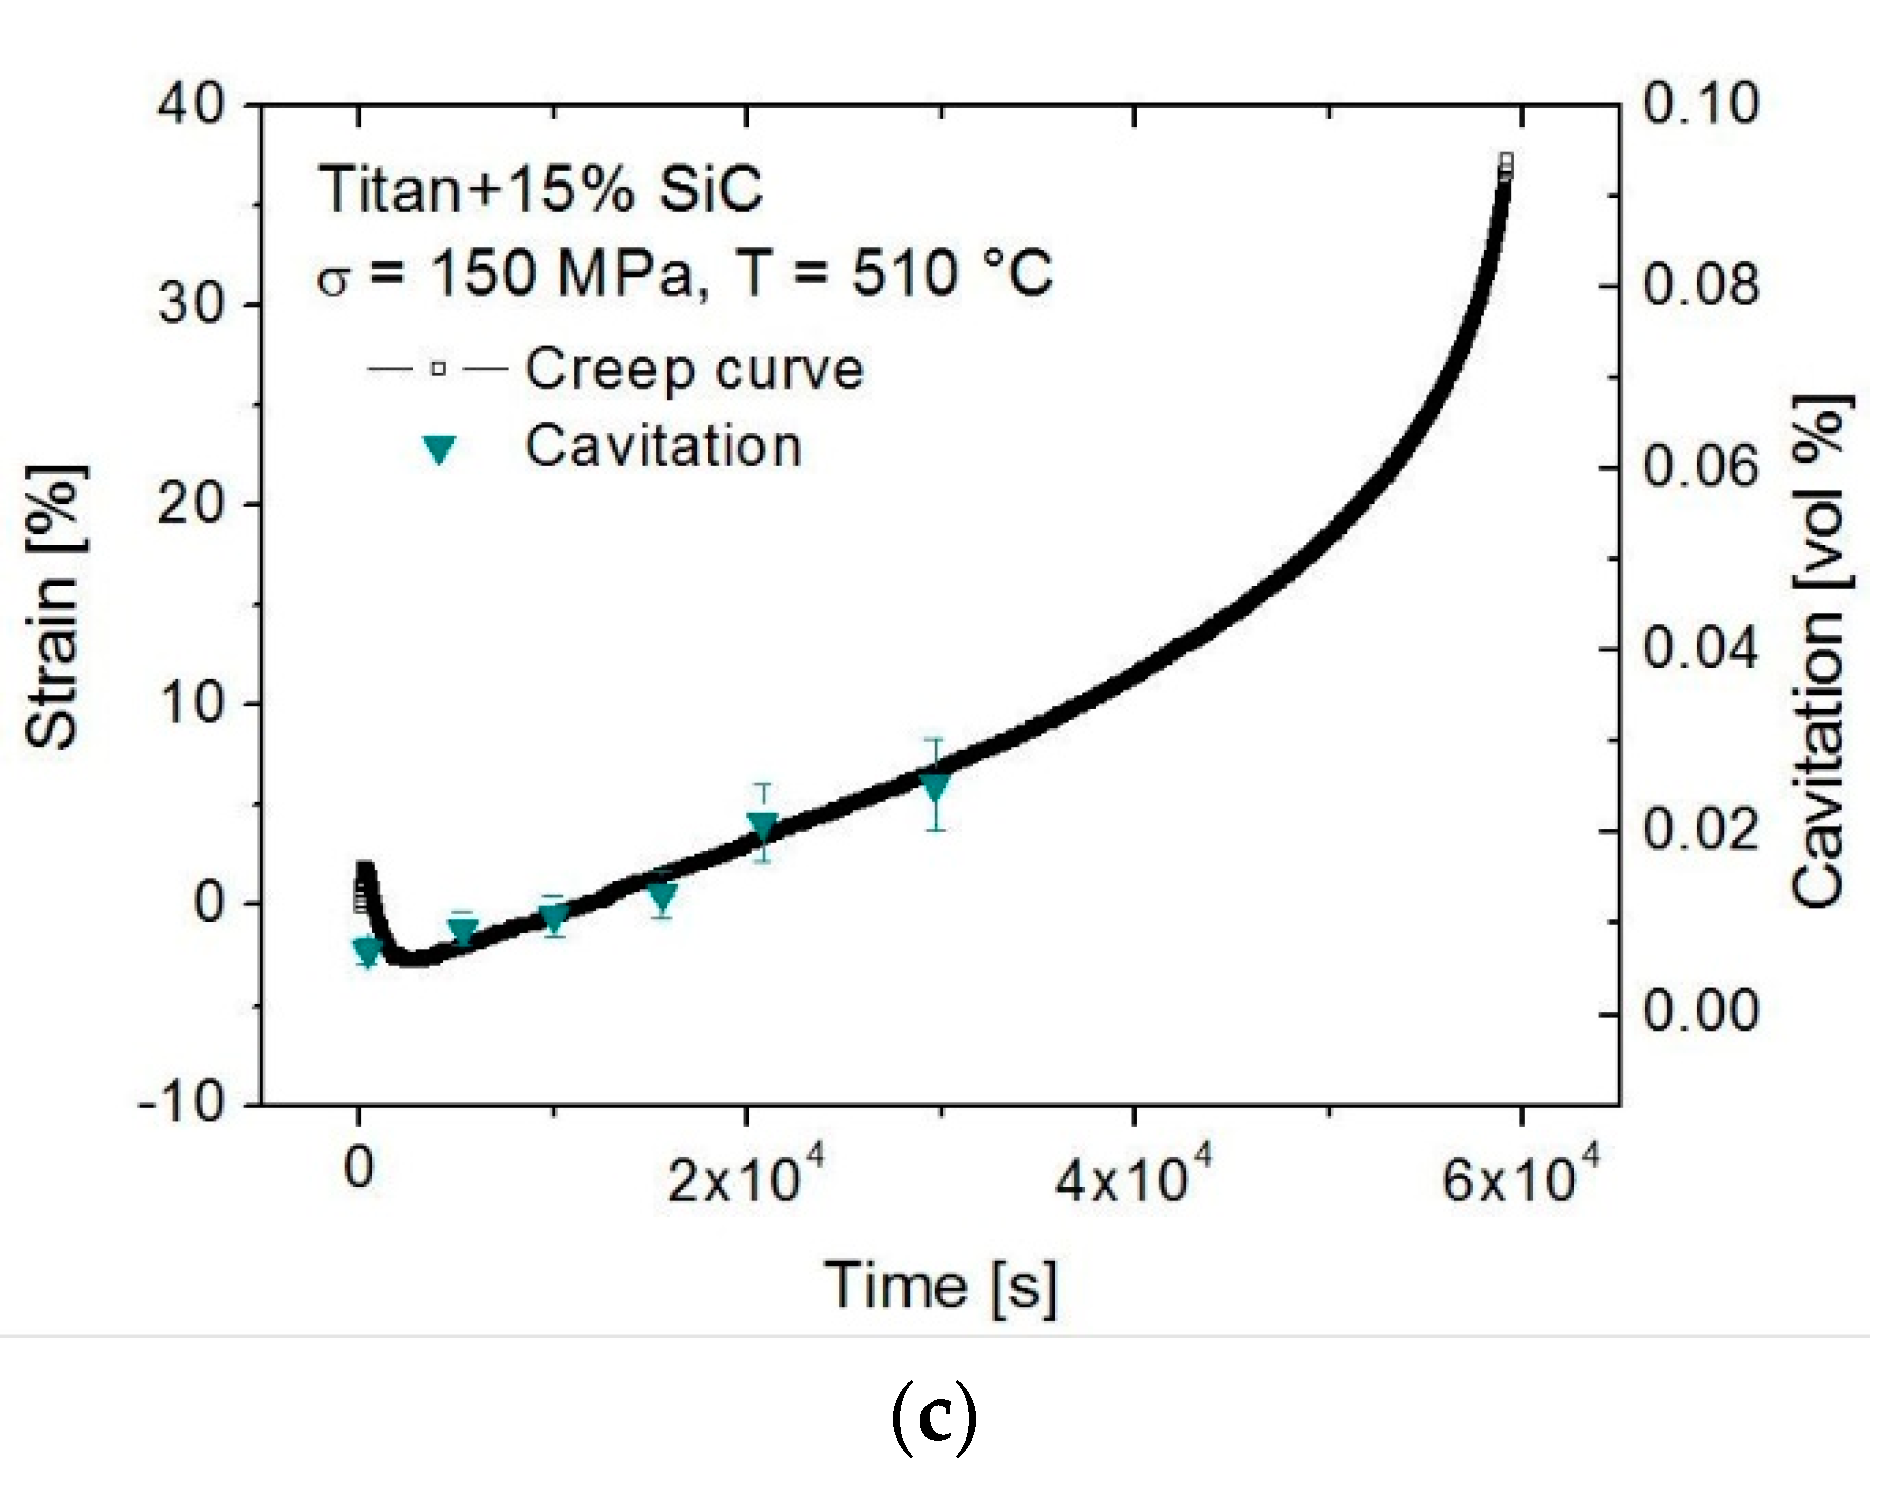
To evaluate the creep damage, several tomograms were taken during creep and the measured overall cavitation was related to the creep strain at the point of tomogram acquisition. The starting and the end points of each creep curve and the corresponding cavitation development were compared. Analyzing an entire creep experiment (early and late creep stages), the cavitation growth of the two investigated materials show different behaviors: For all investigated mechanical and thermal stresses in the Al-MMCs, the cavitation growth function is proportional to the creep strain (Figure 6a) as it was shown before in [40]. This cannot be observed for the Ti-MMC: Considering the entire creep curve (early and late stage) for all investigated mechanical and thermal stresses, the growth function of the cavitation is not proportional to the strain (Figure 6b). However, disregarding the development of cavitation in the late creep stage and adapting the corresponding cavitation development to strain curve only in the section of the early creep stage, here a proportionality of the cavitation to creep strain can be seen also (Figure 6c).
3.2.2. Creep Damage Formation and Growth Mechanism
The total cavitation and its evolution are determined by the number of voids and the void volume as well as their respective evolution. The void formation is defined by the number of voids as a function of the strain (Equation (1)) and the void growth by the void volume as a function of the strain multiplied by time (Equation (2)) [21]. From each tomogram, the total numbers of voids, their individual size, shape, and orientation related to the load axis were derived. Beyond Huppmann et al. [40] the formation and growth mechanisms like grain boundary diffusion, surface diffusion, and dislocation creep were analyzed on the basis of the morphology of the voids (spherical, ellipsoidal perpendicular, or parallel to the load axis) as previous defined in Figure 2. Furthermore, void formation and void growth are investigated in the early and late creep stages separately. Due to blurred tomograms in the late creep stage in the Al-MMC at a stress 70 MPa and temperature 300 °C, the development of the voids could not be evaluated.
Al-MMC
- Void formation
In Figure S1 of the Supplementary Materials, the developments of the mechanisms are shown in reference to the creep loading presented in Table 2. A mostly linear relationship of the strain to the total number of cavities equivalent to the void formation was observed in the early and late creep stages and can be expressed by
where is the initial number of voids and the slope specifies the increasing number of voids. This is equivalent to a continuous formation of new voids over the entire creep process (Figure 7).
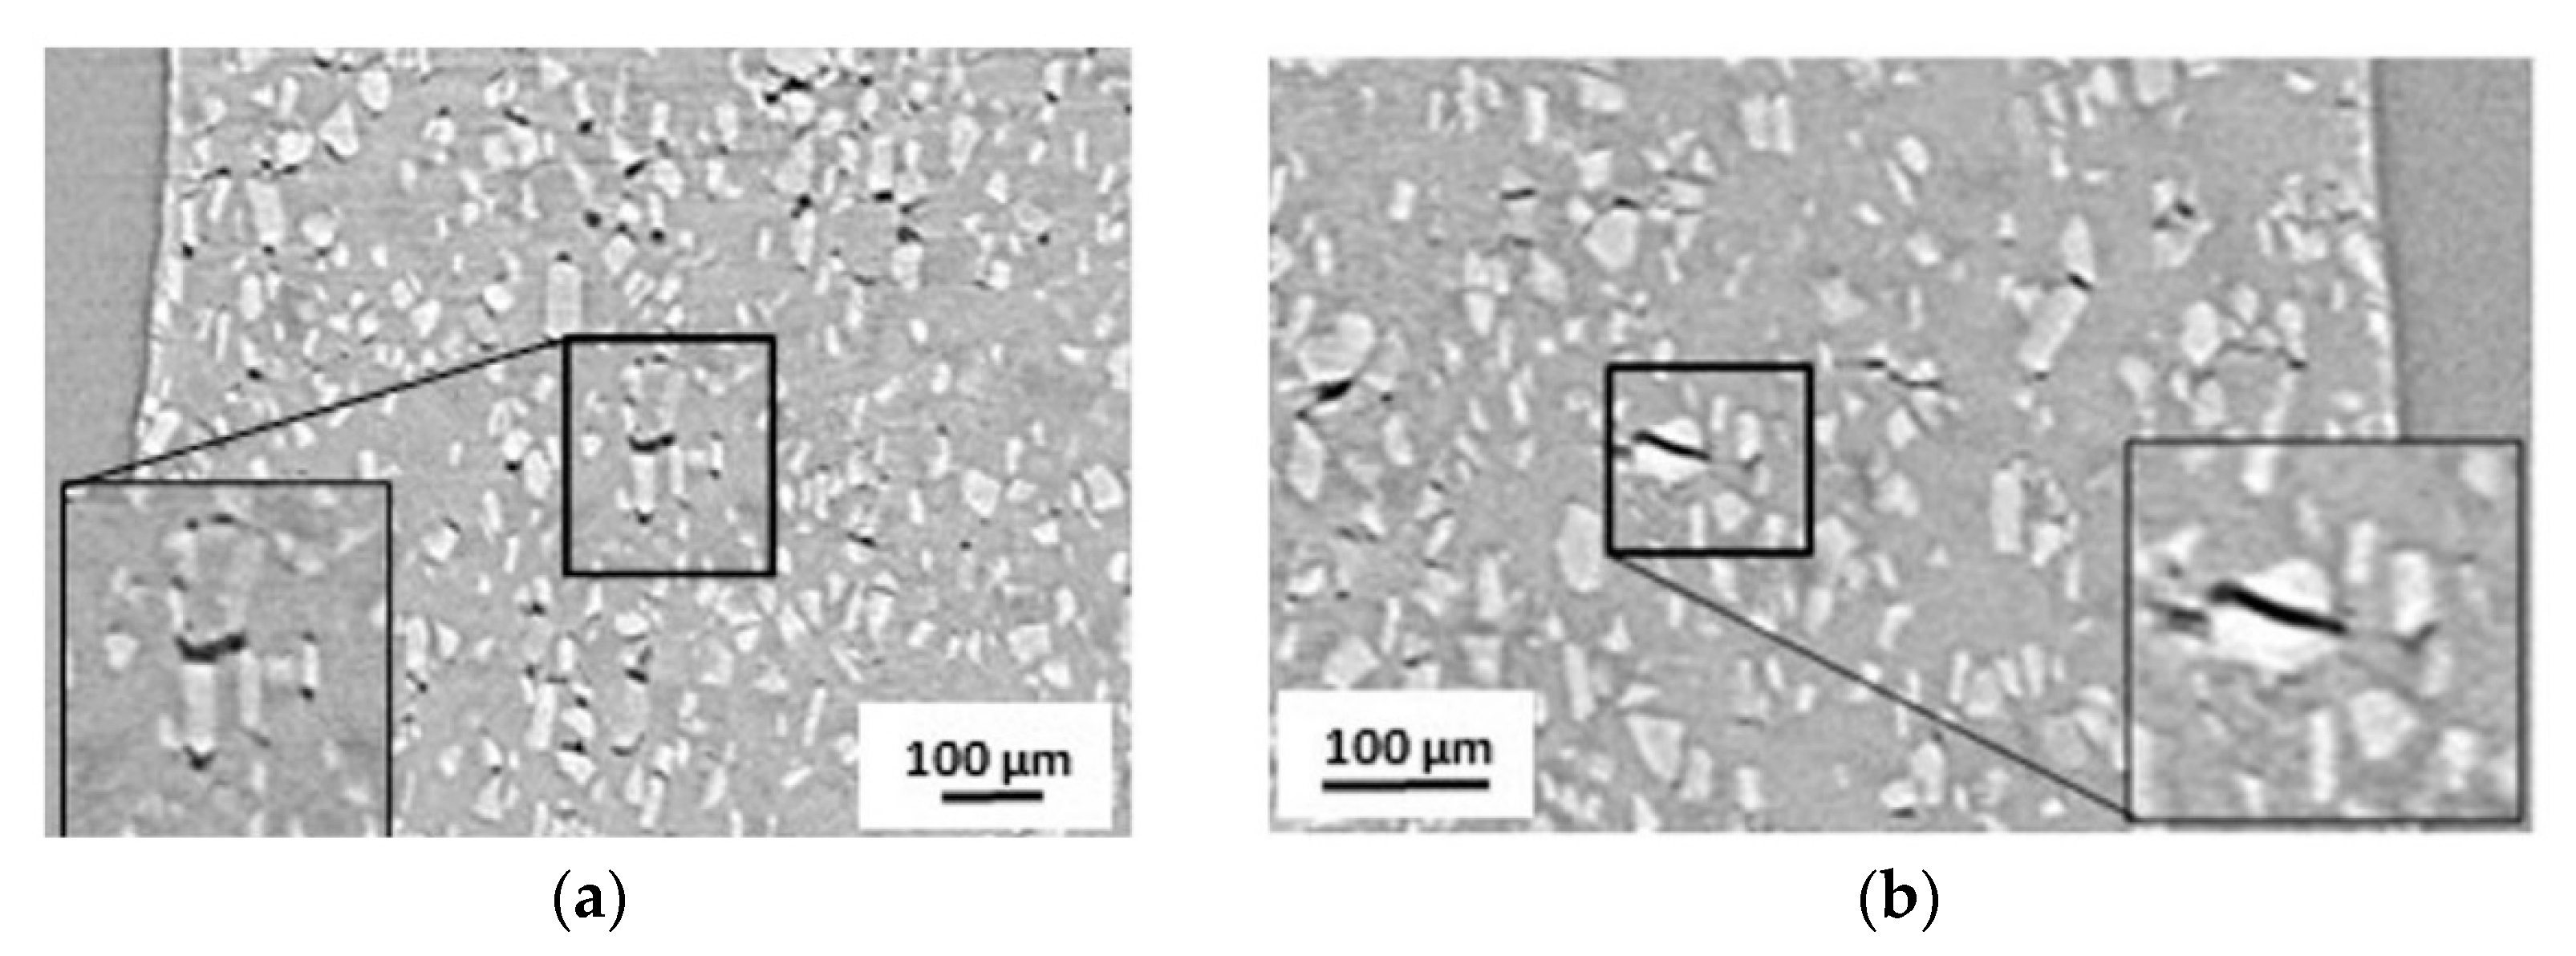
For the lowest mechanical load 50 MPa and 300 °C, a short time before fracture an inverse exponential function appeared (Figure S1b), which is related to a decrease of the void formation (Figure 7c,d) due to void growth, which will be discussed later. According to the various shapes of the voids, the different formation mechanisms and their respective fractions of the total void formation process were determined. In all stages, void formation is predominantly defined by ellipsoidal voids oriented perpendicular to the mechanical loading direction (Figure 2a–f), which in [18] was related to the process of surface diffusion. The visual analyses of the tomograms confirmed, that surface diffusion takes place in the metallic matrix at low mechanical load ( 50, 60, 70 MPa) and higher temperature ( 300 °C) (Figure 8a). However, at higher load ( 190 MPa) and lower temperature ( 200 °C) this is no longer valid and in the investigated Al-MMC, the ellipsoidal voids oriented perpendicular to the loading axis were identified to be caused by particle fracture (Figure 8b). Furthermore, in all investigations the void formation processes by grain boundary diffusion and dislocation creep take place simultaneously, albeit on a smaller scale.
In the early stages, all void formation processes in the matrix as well as particle fracture (Figure S1a,c–e) respectively occurred in the same magnitude and measurement accuracy, independent of temperature and mechanical load (Figure 9a). As an exception, the grain boundary process is significantly less pronounced at high mechanical load and lower temperature.
In contrast, stress and temperature dependencies were analyzed during the late stages: At a temperature of 300 °C, increasing the stress by 10 MPa leads to a decrease in void formation. At lower temperature 200 °C and higher stress 190 MPa, the void formation due to particle fracture is high, while void formation due to grain boundary diffusion and dislocation creep of the matrix is low (Figure 9b). This implies that the void formation processes in the later creep stages are stress and temperature dependent.
- Void growth
Concurrent to the void formation, void growth takes place in the early and late creep stages. However, the rates of the total void growth at all investigated creep load parameters are non-linear (Figure S2). During the early creep stage, the rates predominantly follow an inverse exponential function (Figure S2a,c,e,f), except at 300 °C and 70 MPa, where an exponential void growth was detected (Figure S2e). In the late creep stage, the inverse exponential void growth turns to exponential growth (Figure S2b,d,g). The exponential void growth is determined by
where is the initial void volume and the growth constant.
Again, analyzing the development of the individual growth mechanisms in all creep stages, at 300 °C and any mechanical stress all mechanisms follow the progression of the total growth curve. At the temperature 200 °C, this applies only to the growth mechanism of the gap width due to particle fracture, while grain boundary diffusion and dislocation creep in the matrix take place linearly. Hence, comparable to the void formation the main processes of void growth observed are the surface diffusion at 300 °C and growth of the gap width due to particle fracture at 200 °C (Figure S2).
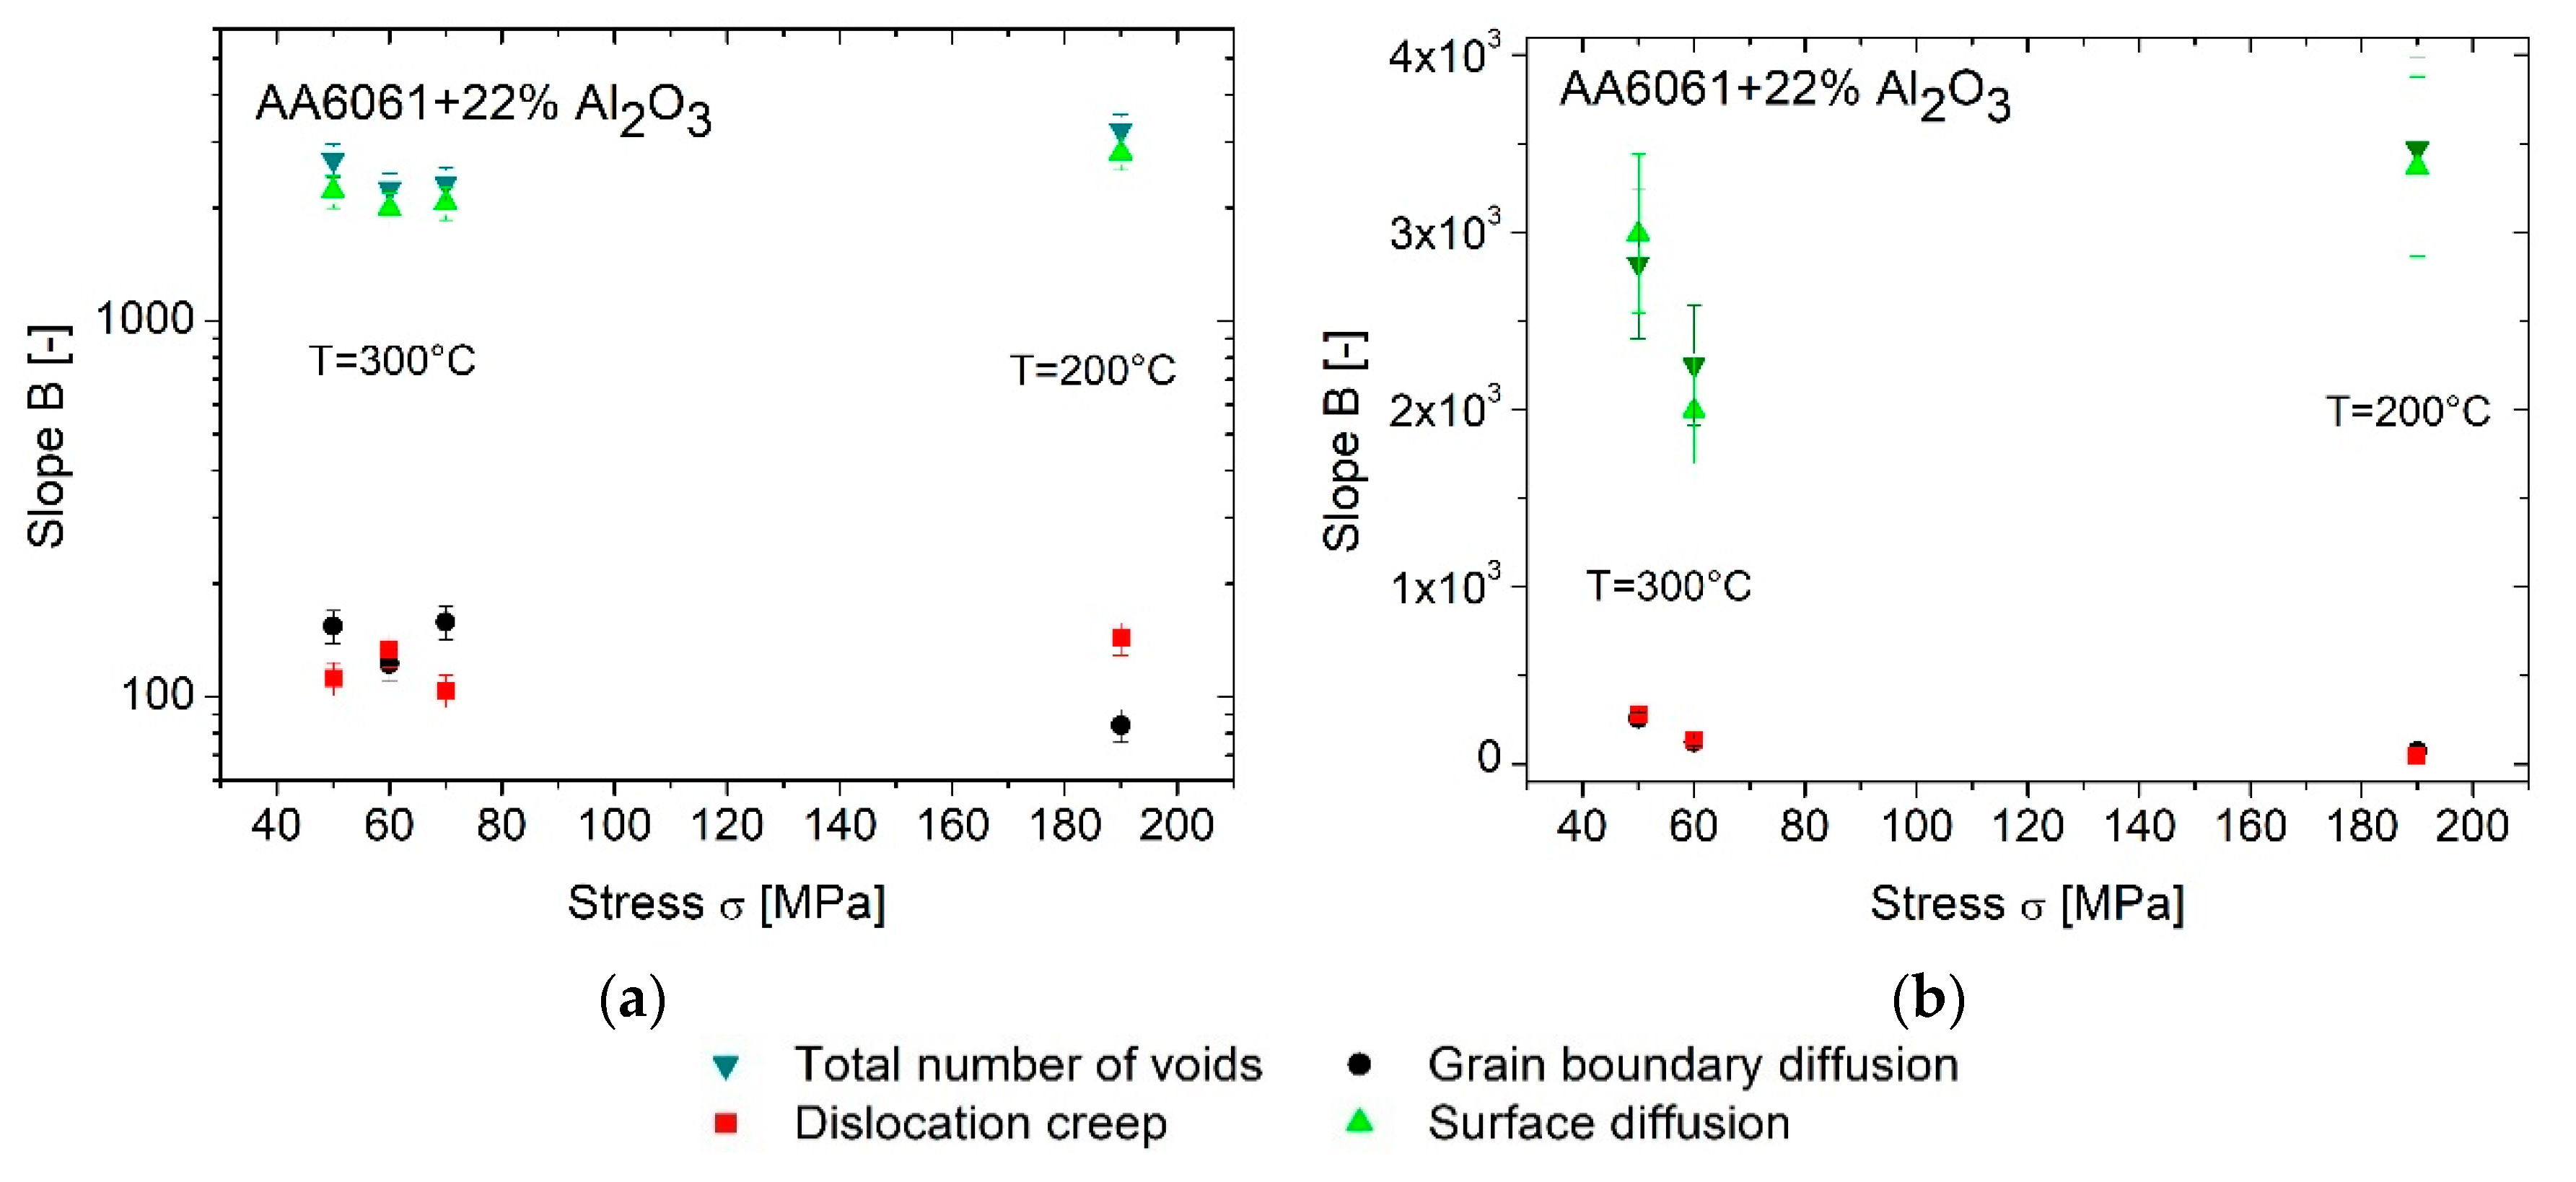
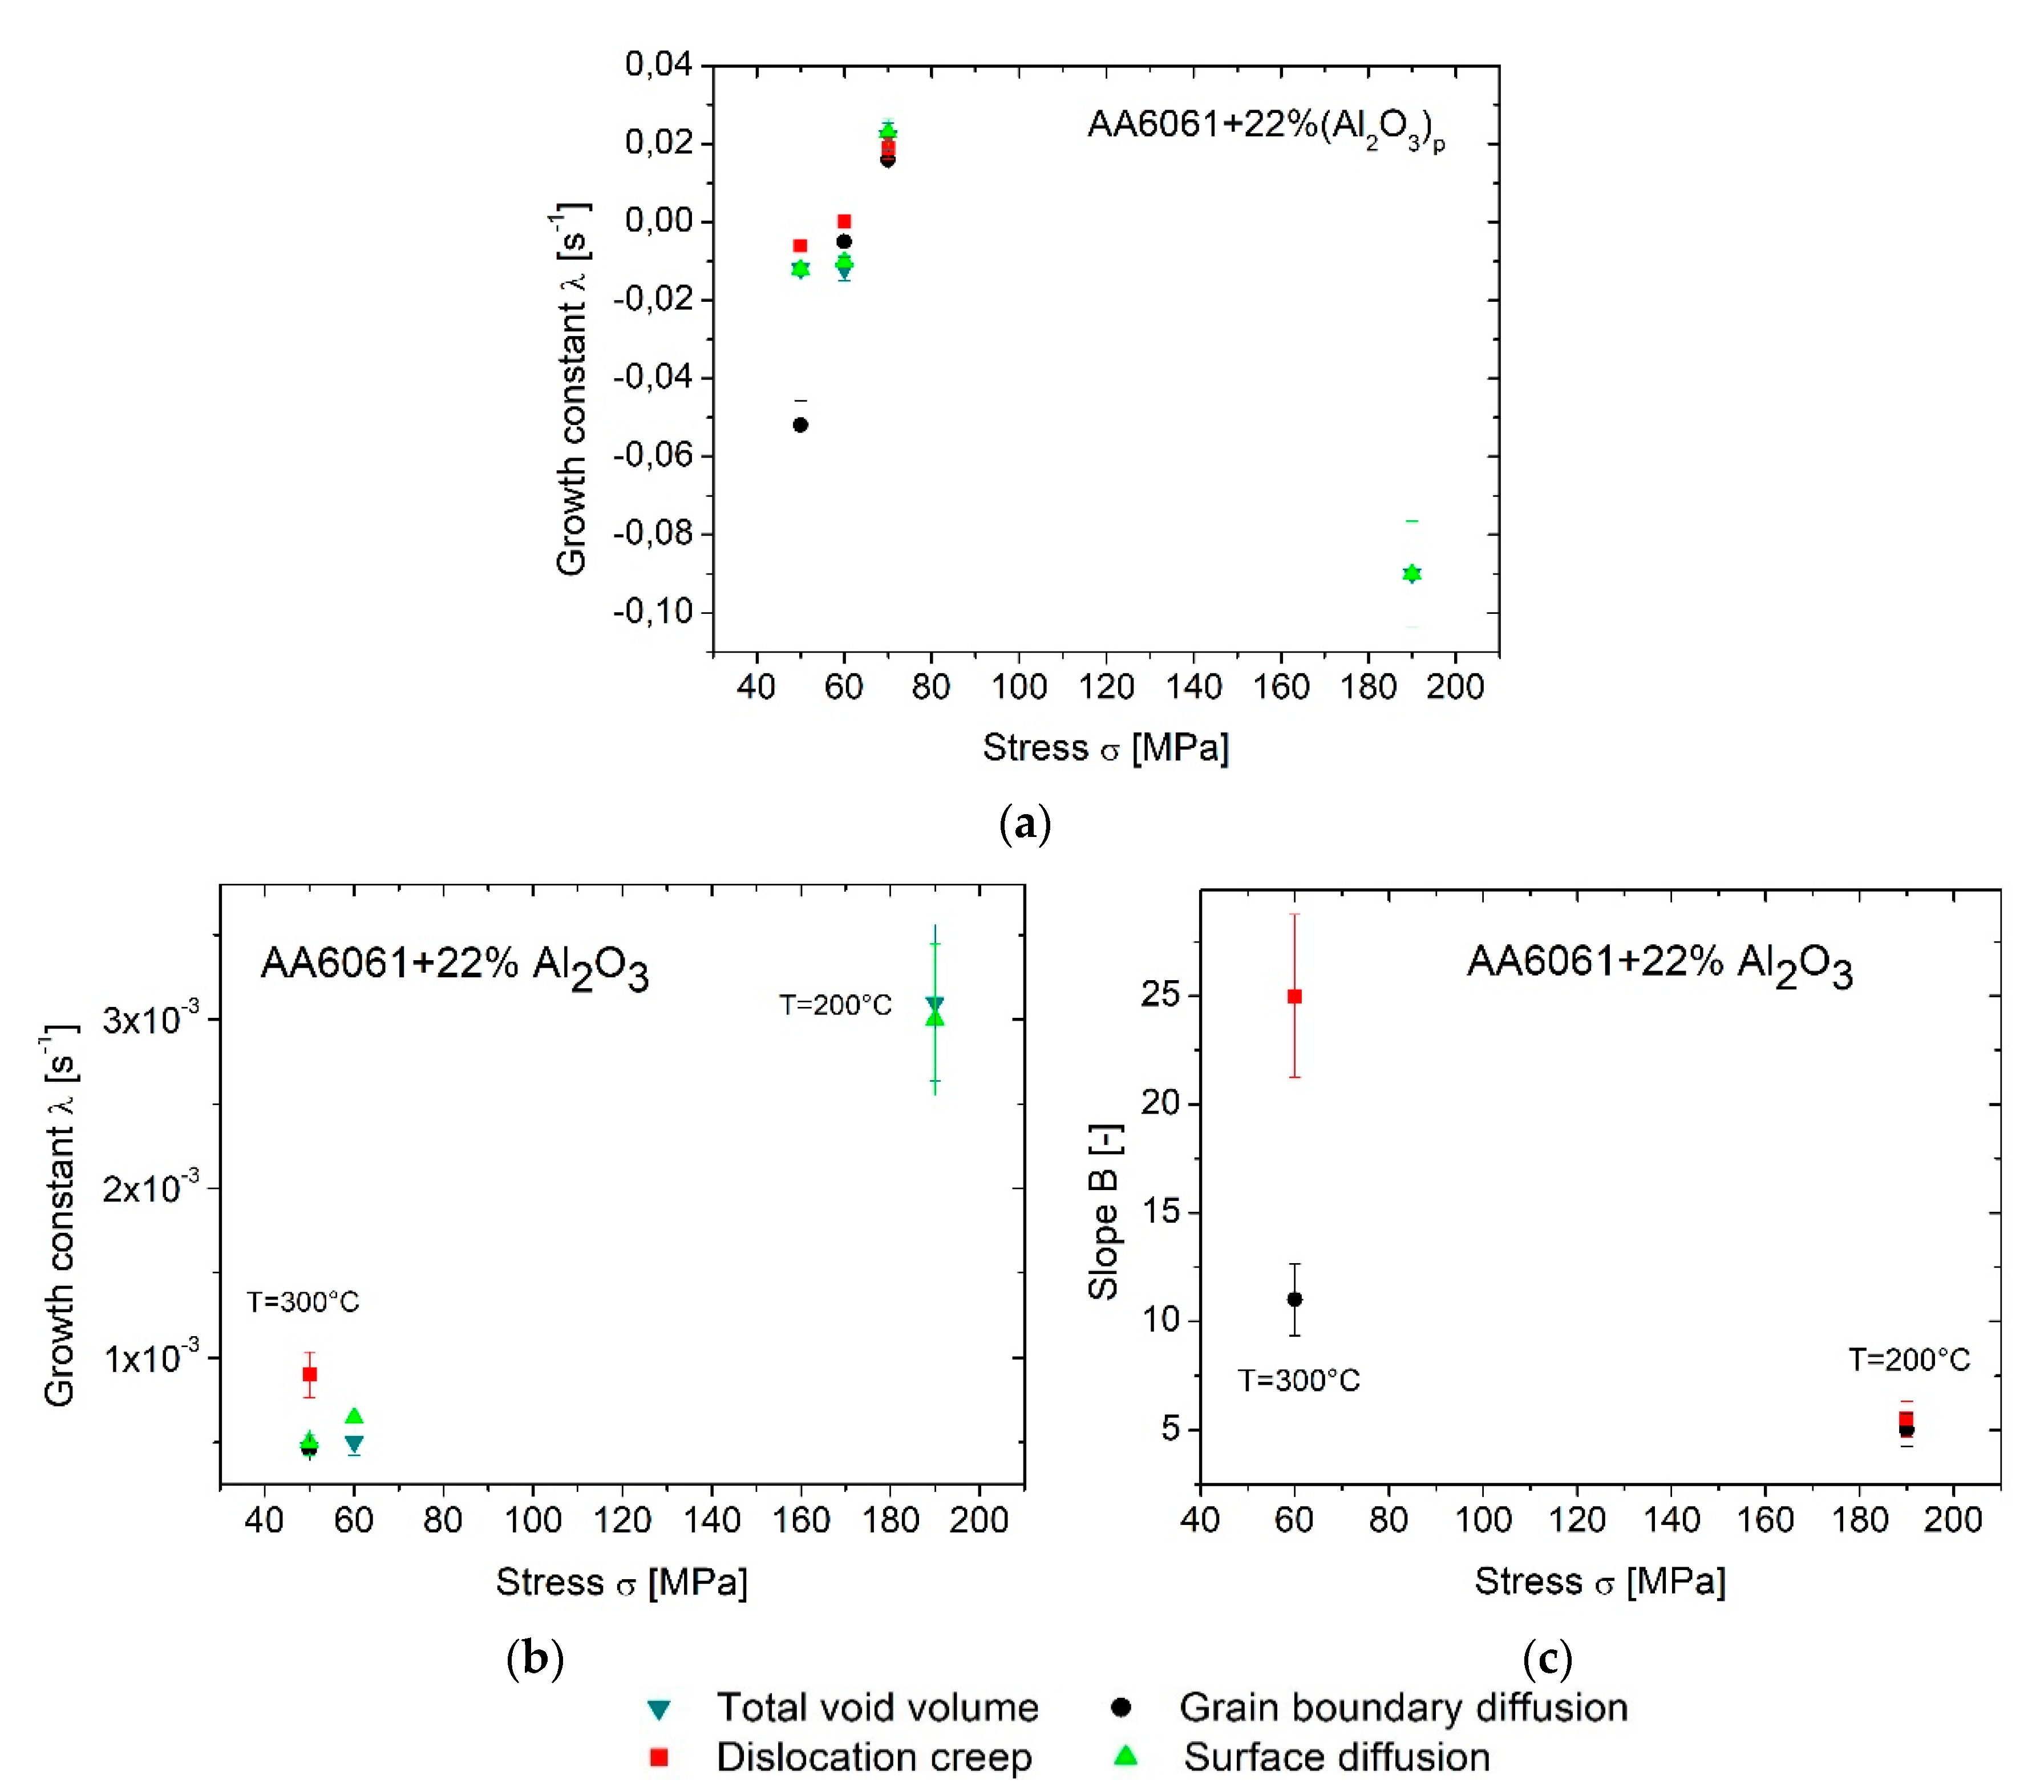
The individual growth mechanisms as a function of stress and temperature in the early and late creep stages can be illustrated using the values of the growth constant (Figure 10). In the early creep stages, all growth mechanisms increase with rising stress at 300 °C. At higher stress 190 MPa and lower temperature 200 °C the void growth decreases significantly. Therefore, the void growth in the early creep stages is depending on stress and temperature (Figure 10a). In the later creep stages, void growth at higher stress and constant or lower temperature is increasingly determined by the processes of surface diffusion or the growth of the gap width of particle fractures. This can be derived from the increasing growth constant (Figure 10b). In contrast, the mechanisms of grain boundary diffusion and dislocation creep decrease. Here, the growth functions change from exponential to linear functions, the slope also becomes smaller (Figure 10c). Although it is impossible to derive the particular fraction of the stress or temperature effect.
In summary, the developments of void formation as well as growth by the mechanisms of surface diffusion in the matrix and particle fracture are responsible for the evolution of the total creep damage, whereas the mechanisms of grain boundary diffusion and dislocation creep in the matrix have a minor influence in the Al-MMC. Additionally, the creep damage is defined by void formation in the early stage and by void growth in the late creep stage. The growth functions of total void formation and void growth of the individual microstructural damage mechanisms predominantly show the same curve progression.
Ti-MMC
- Void formation
Comparable to the Al-MMC, a linear behavior of the void formation was observed in the early creep stage, both for the total void formation as well as the individual mechanisms of surface diffusion, grain boundary diffusion, and dislocation creep (Figure S3a,c,e).
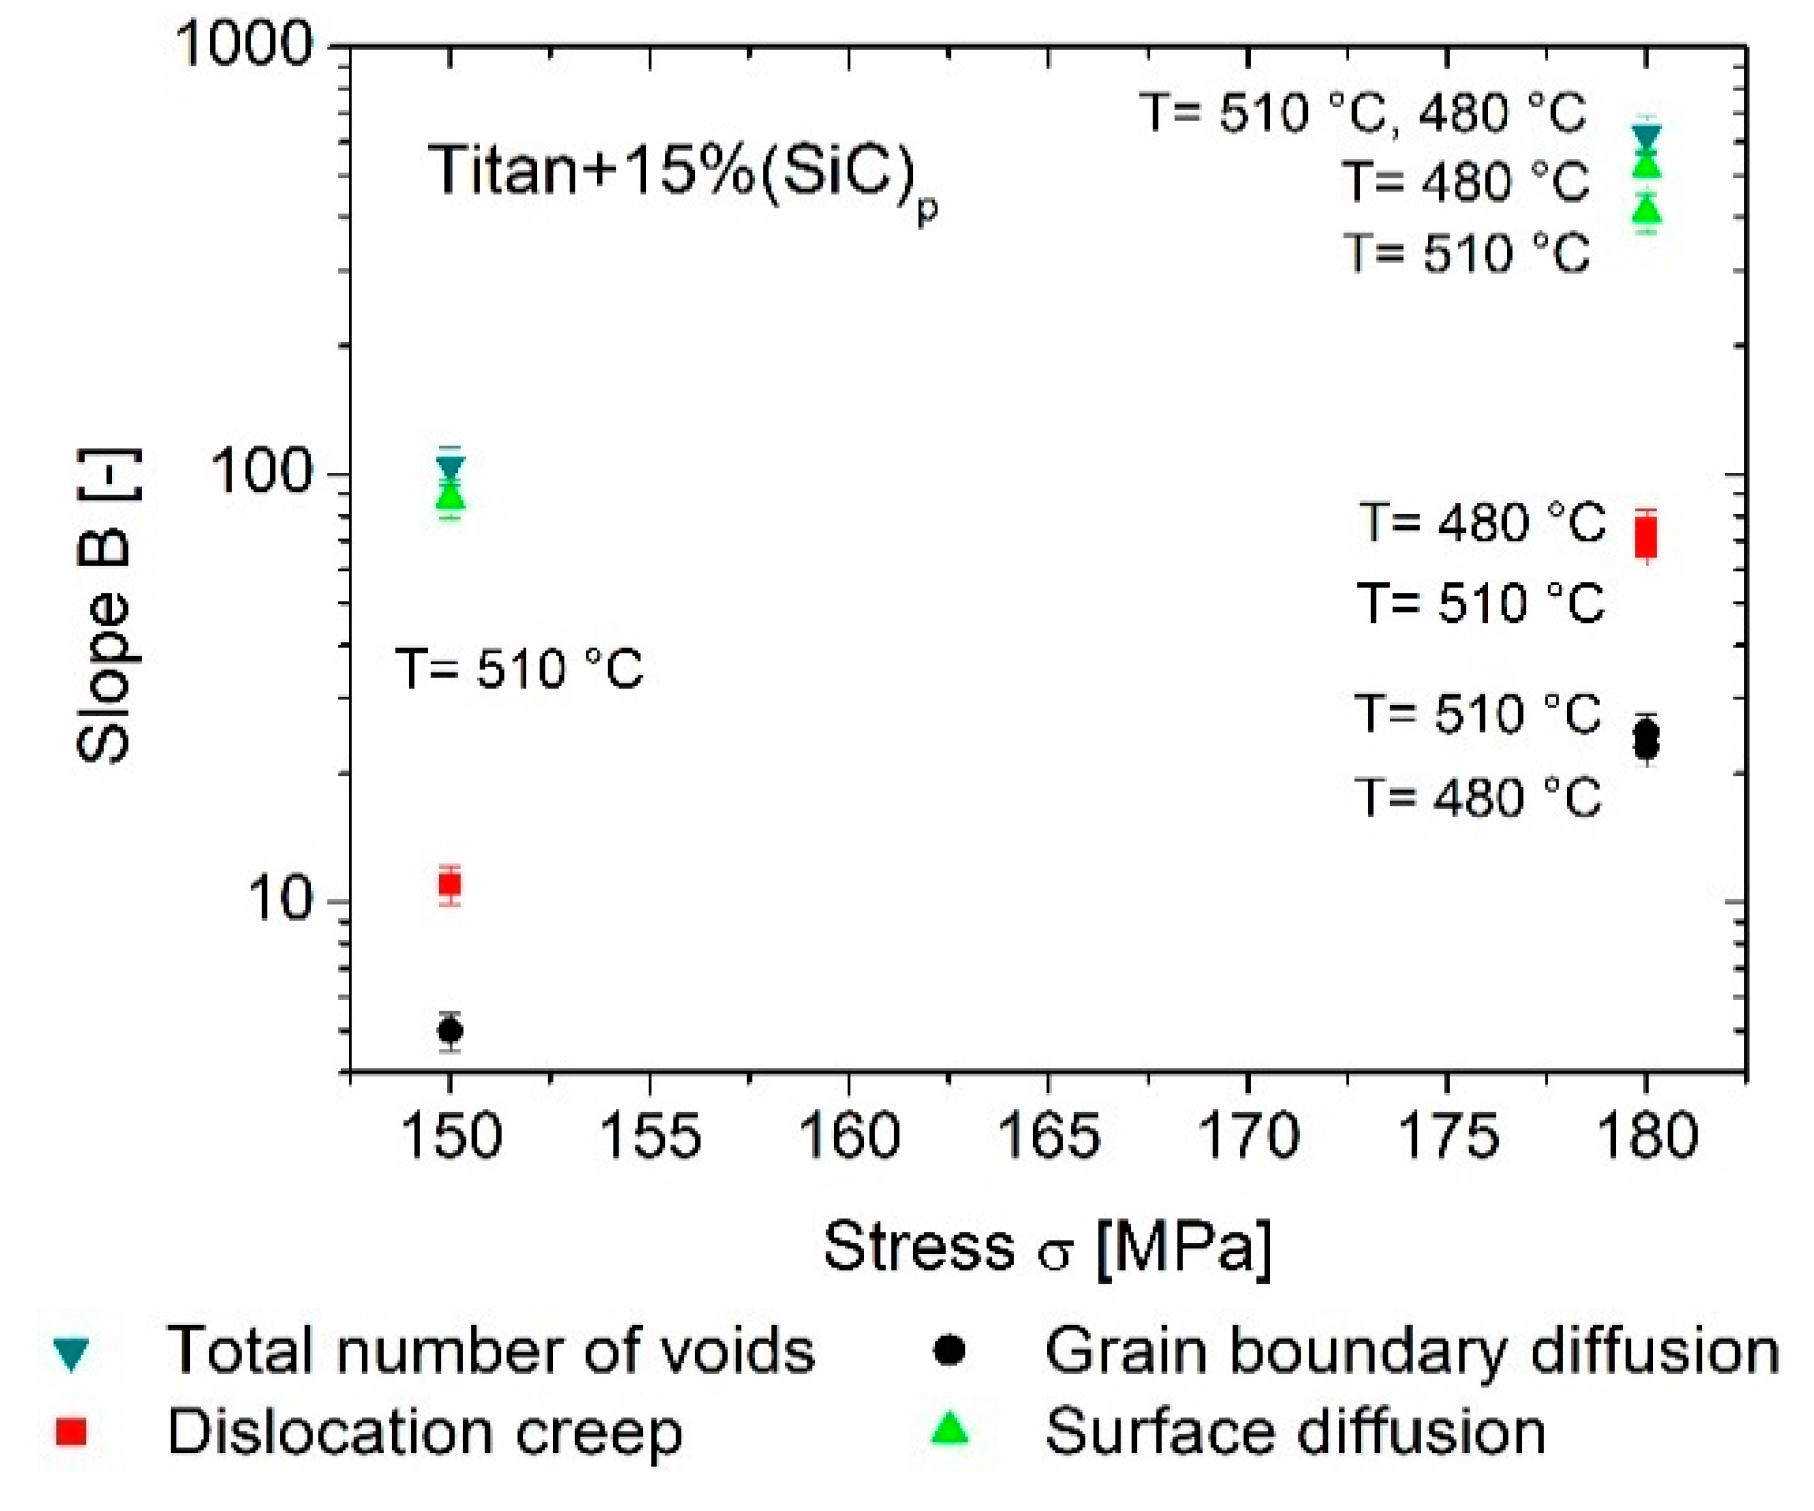
The values of the proportionality factors at the stress 150 MPa of the total void numbers as well as the void numbers of the individual mechanisms are lower by a factor 5–6 than those at 180 MPa. Here, at different temperatures ( 510 °C and 480 °C) the values are almost similar. Increasing the stress by 30 MPa consequently causes an enhanced void formation by all microstructural mechanisms. The diffusion mechanisms and dislocation creep of the matrix are therefore stress dependent. While the total number of cavities, and thus all mechanisms of the void formation, gives no indication of temperature dependence, the individual mechanisms show a slight temperature dependence. The grain boundary diffusion was observed to increase due to increasing temperature at constant stress, whereas the mechanisms of surface diffusion and dislocation creep are declining (Figure 11).
In the late creep stage, the void formation due to the formation mechanisms—the total void formation as well as the individual mechanisms—occurs quite differently (Figure S3b,d).
Although the surface diffusion is the main mechanism of void formation, the dislocation creep gains influence. A decreasing of the void formation by surface diffusion leads to a decreasing of the total void formation, despite being partially compensated by increase of dislocation creep. The mechanism of grain boundary diffusion still plays a minor role in the process of total cavitation formation. A graphical comparison of the fit parameters in the late creep stages is not possible due to the different functions (linear, exponential, bounded above, as well as decreasing).
- Void growth
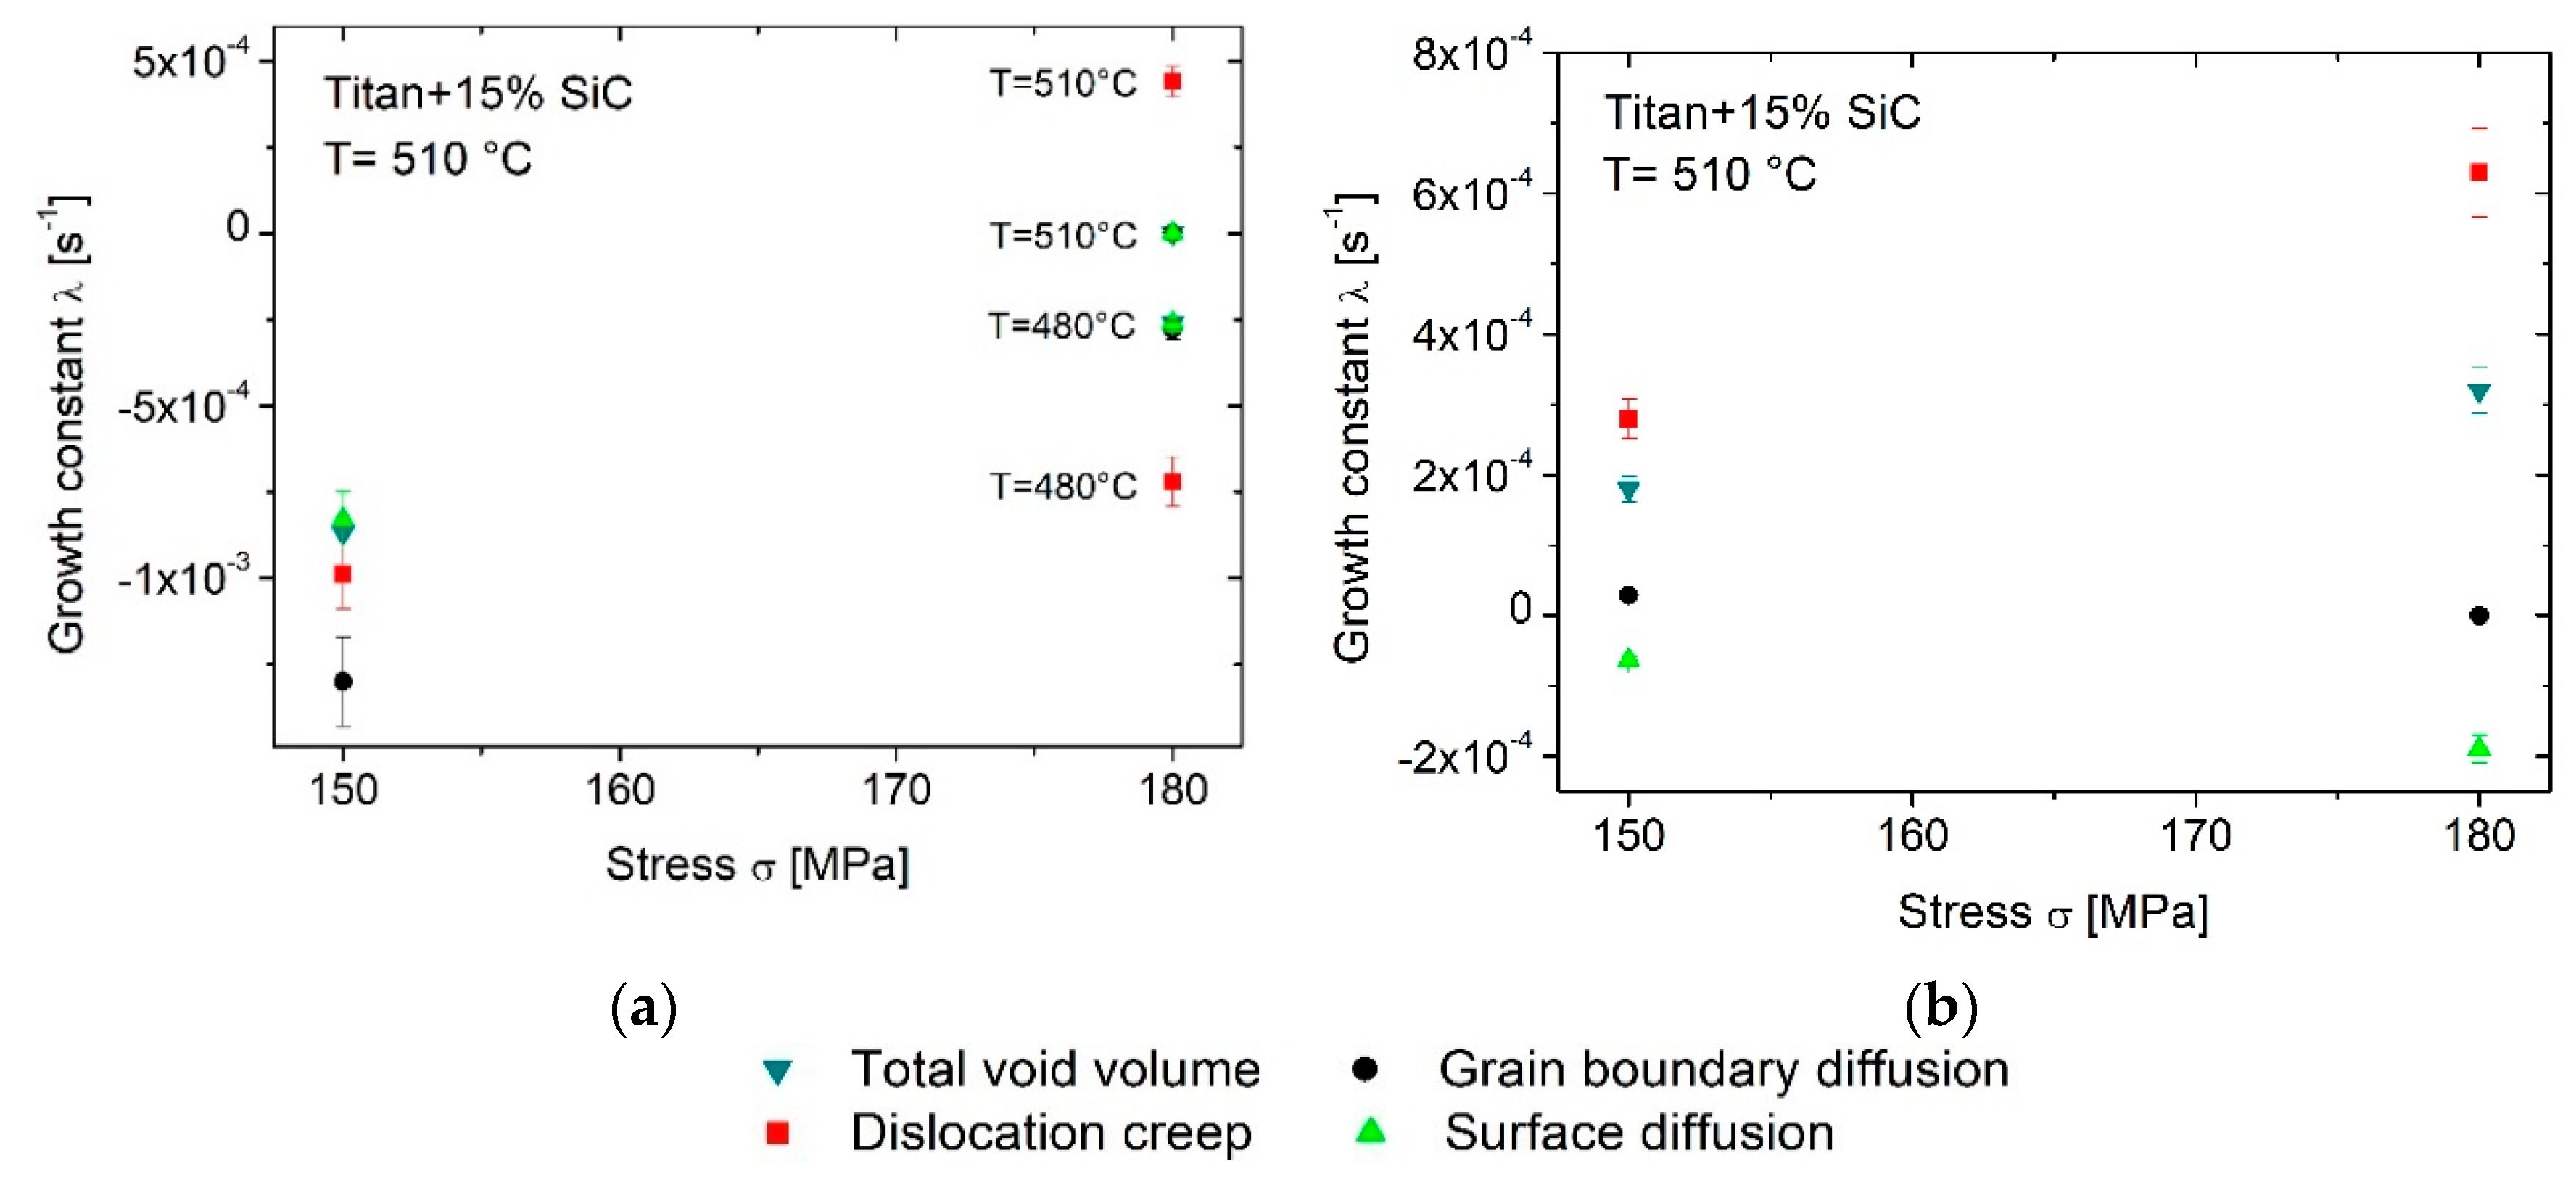
In the early creep stages, the total void growth as well as the individual growth mechanisms follow the same functional rule bounded above (Figure S4a,c,e). The main process of void formation is the surface diffusion. Its progression of the growth curve is almost congruent to the total void growth. The growth curve of the growth mechanism by grain boundary diffusion is also congruent, albeit with a significantly lower proportion. Hence, the values of the growth constants were found to be similar (Figure 12a). Furthermore, increasing the stress results in higher growth rates of the mechanism by dislocation creep independent from temperature. Comparing the void volumes in the early creep stages at the same value 2 × 10³ [1∙s] illustrates the effect of stress and temperature on void growth: Increasing the stress by 30 MPa from 150 to 180 MPa at constant temperature 510 °C results in a ten-fold higher growth of the void volume (Figure S4b,d). When keeping the stress constant at 180 MPa and decreasing the temperature by 30 K from 510 °C to 480 °C, this results in an approximate halving of the void volume (Figure S4c,e).
All curves of the total void volumes and the individual mechanisms at 510 °C can be approximated by an exponential growth function in the later creep stages. Compared to the void formation processes, the effect of the surface diffusion is decreasing, while the dislocation creep becomes the main process determining void growth (Figure S4b,d). Figure 12b shows that the enhancement of the stress results in higher growth rates of the total void volume. In sum, this is caused in particular by a higher proportion of the dislocation creep mechanism, but is reduced by a decreasing growth rate of the surface diffusion, while grain boundary diffusion remains more or less constant.
In summary, for the Ti-MMC, the development of the void formation as well as void growth in the early stage is mainly determined by surface diffusion, while in the progressing of creep in the late creep stage the dislocation creep becomes the predominant mechanism. The latter can also be visually taken from the tomography images based on the elliptical pore orientation along the load axis in Figure 13, where the void development in the late creep stage is shown.
Similar to the Al-MMC, the grain boundary diffusion has a minor influence on void formation and void growth.
4. Discussion
4.1. Creep Curve and Parameter
In the absence of repeated measurements, the plausibility of the creep parameters, such as creep time , minimum creep rate , strain at fracture , as well as contraction at fracture of the individual in situ experiments on miniature samples, and thus also the plausibility of the creep mechanisms taking place have to be estimated. Comparative studies on miniature and standardized samples were carried out by different authors observing similar creep behavior, e.g., [41,42,43,44,45,46]. However, in the literature a downsizing of standardized sample geometries maintaining the proportions was used. In the study presented here, this cannot be complied. Fulfilling the boundary conditions due to the field of view of the detector at the synchrotron X-ray facility, the gauge length of the miniature creep samples inserted is equal to the diameter of the sample. In this context, the two differences to standardized creep tests shall be discussed: First, the geometry of the miniature creep specimen. Second, the modified test procedure due to these requirements of the tomography experiments.
An unusual elastic primary creep stage occurred ahead of the early creep stage with a decreasing creep rate. Applying the same miniature creep device used here, [25,40] observed an unusual elastic primary creep behavior also, but do not provide any explanation for this. A similar creep behavior in the elastic primary stage was observed in the literature as well [25,40,41,42]. Using standard tensile testing machines, [41,42] attribute apparently negative strain rates to the fact that the miniature specimens are aligned in the specimen holders when the mechanical load is applied. Whereas in the secondary and tertiary creep stages, good agreement of the creep curves of miniature samples and standard samples were found. Alignment issues concerning the specimen holder, which could be affecting the primary creep stage can be excluded in our investigations, since the sample is already subjected to the mechanical load before heating.
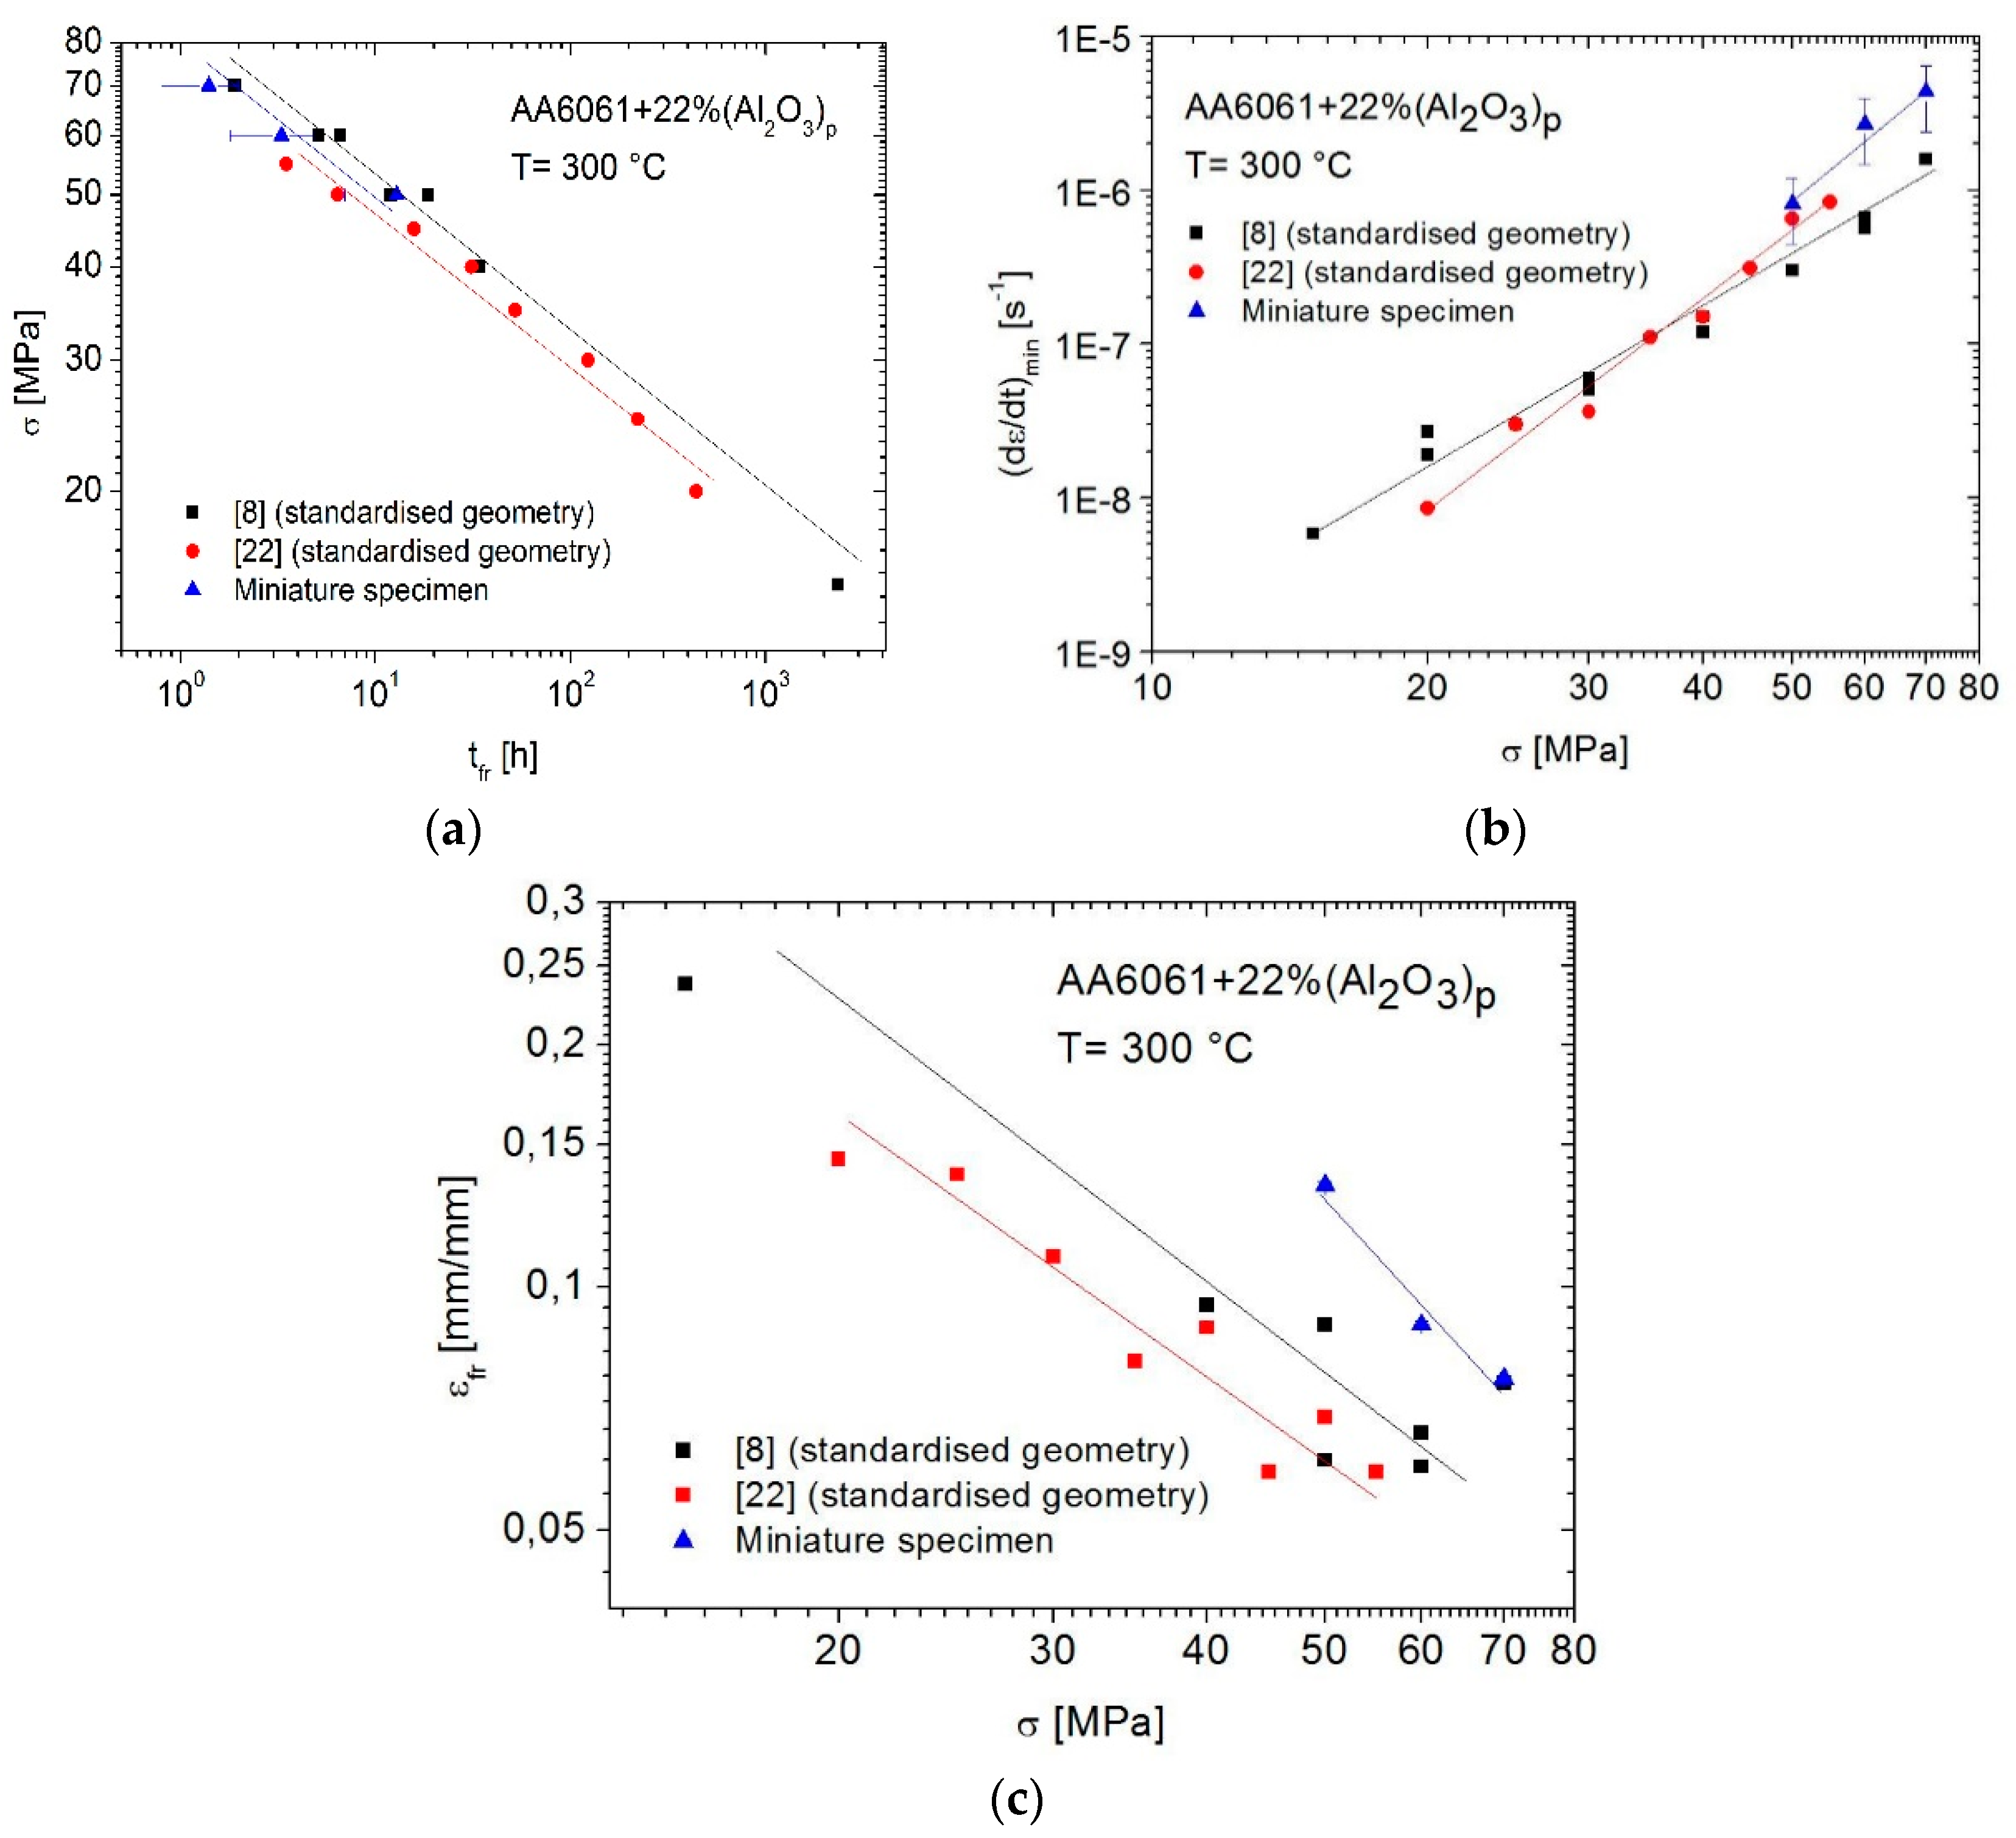
While there is a lack of literature regarding the cp-titanium matrix material to estimate the plausibility of the creep measurements presented here, the obtained creep parameters of the Al-MMC (Table 3) were found to be comparable to results presented in the literature using standardized samples of the same material [5,23]. The values of the time to fracture and the Norton-plot obtained in our investigations are in good agreement with the literature (Figure 14a,b). In contrast, the strains at fracture are larger compared to values presented in the literature (Figure 14c). According to the guidelines of European Committee for Standardization (CEN) regarding the estimation of uncertainties in creep tests, the calculation of a reference length is recommended for the assessment of the resulting error [47]. However, the miniature specimen’s geometry and the assumption of a stress exponent 5 ( 4.6 [5], 5.4 [23]) as specified by CEN, the calculation of the reference length results in merely a small change in the measured length, which does not explain the magnitude of the difference.
In addition to the geometry factor of the specimens, the modified creep test procedure, must be taken into account. Broeckmann et al. explains the influence of the testing temperature on the strain rate curve for Al-MMC [5]. They related large deviations in the results of various authors at temperatures higher than 300 °C to the different durations of the heating and preheating phases in the test. In the present work, the heating phase was kept very short due to the experimental boundary conditions. It can therefore be assumed, that the results deviating from the literature are caused by, among other things, the different heating procedures of the experiments. Since the elongation of the miniature sample was measured out of the gauge volume, the thermally induced total expansion of the miniature creep device during the heating process at already applied mechanical stress has to be taken into account. This affects the elastic primary creep stage, thus apparently negative strain occurs. Due to higher test temperatures, this effect is more pronounced in the Ti-MMC (Figure 5b) than in the Al-MMC (Figure 5a). After reaching the thermal equilibrium (7–10 min) and passing the minimum of the creep curve in the subsequent defined early and late creep stages, only the elongation of the sample is measured. However, since this measurement related artifact can neither be quantified nor estimated with conventional methods, the magnitude of the strains in the initial (elastic primary) stage suggest that the experimental procedure may be responsible for the higher strains of the miniature specimens compared to the standard specimens.
Hence, the results of the in situ creep tests carried out here are comparable with results on standard samples. Additionally, all of the obtained creep curves show well-known dependencies due to mechanical load and temperature [39] (Table 3, Figure 5). These findings demonstrate the plausibility of the experimental results presented in this study, and in turn, imply that the creep mechanisms taking place are reliable as well.
4.2. Creep Mechanisms
The ductility of materials during creep is characterized by the strain at fracture and the contraction at fracture , which are influenced by the creep loading, the microstructure, and the creep mechanisms.
Compared to the Ti-MMC, the Al-MMC material exhibited lower strain and contraction Z at fracture (Table 3), indicating a less ductile creep behavior. Even at room temperature, cp-titanium (grades 1–4) exhibits strain at fracture 15–30% and contraction at fracture 25–35% [48,49]. At an elevated temperature 510 °C for cp-Titanium, Luster et al. report values of 50% and 85% [50]. In the literature, the presence of particles as a reinforcing phase is considered to promote creep resistance compared to the non-reinforced Ti-matrix alloy, resulting in less ductility [9,51]. As ductility decreases, the strain and necking at fracture are lower as well. Literature findings and the results presented here ( 35% and 35%, Table 3), therefore indicate, that the addition of 15% SiC particle reinforcement in the cp-titanium-based MMC increases creep strength and limits plastic deformation of the matrix. This was described in [52] as well. Light microscopy images of the necking area, taken after the creep test, reveal a microstructural change in the matrix additionally to creep pores compared to the initial state (Figure 15): Up to a distance of approx. 400 µm from the fracture surface, a partially recrystallized microstructure and grains stretched in the direction of loading were found (Figure 15a), caused by both the test temperature and the stress states in the necking area [48]. Usually this is accompanied by an increase in ductility and plastic deformation in this region. In contrast, the microstructures further away from the fracture surface show the structure of the initial state (Figure 15b).
These findings are supported by the classification of creep fracture mechanical properties according to [17]. From this, two characteristic microstructural changes are expected in the matrix of the Ti-MMC in the temperature range 0.3∙: First, the formation and growth of voids following the power-law and second, dynamic recovery or recrystallization. The occurrence of recrystallization is indicated by the formation of new grains at former grain boundaries, as well as an accompanying process of softening. Grain formation results in a reduced dislocation density and in a reduced associated back stress (threshold stress). Likewise, the newly formed grains can evolve in directions allowing macroscopically homogeneous plastic deformation [53]. Various researchers investigated the creep behavior of pure titanium as well as titanium-alloy-based composites at comparable creep loading and consistently report the dislocation climb as the main creep mechanism [9,54,55]. Additionally, investigating a TiC particulate reinforced Ti-6Al-4V-alloy composite [9] identified a pronounced late creep stage, which was found here also. The high creep fracture strains and the strong necking of the Ti-MMC creep specimens investigated in this work are most likely results of these processes.
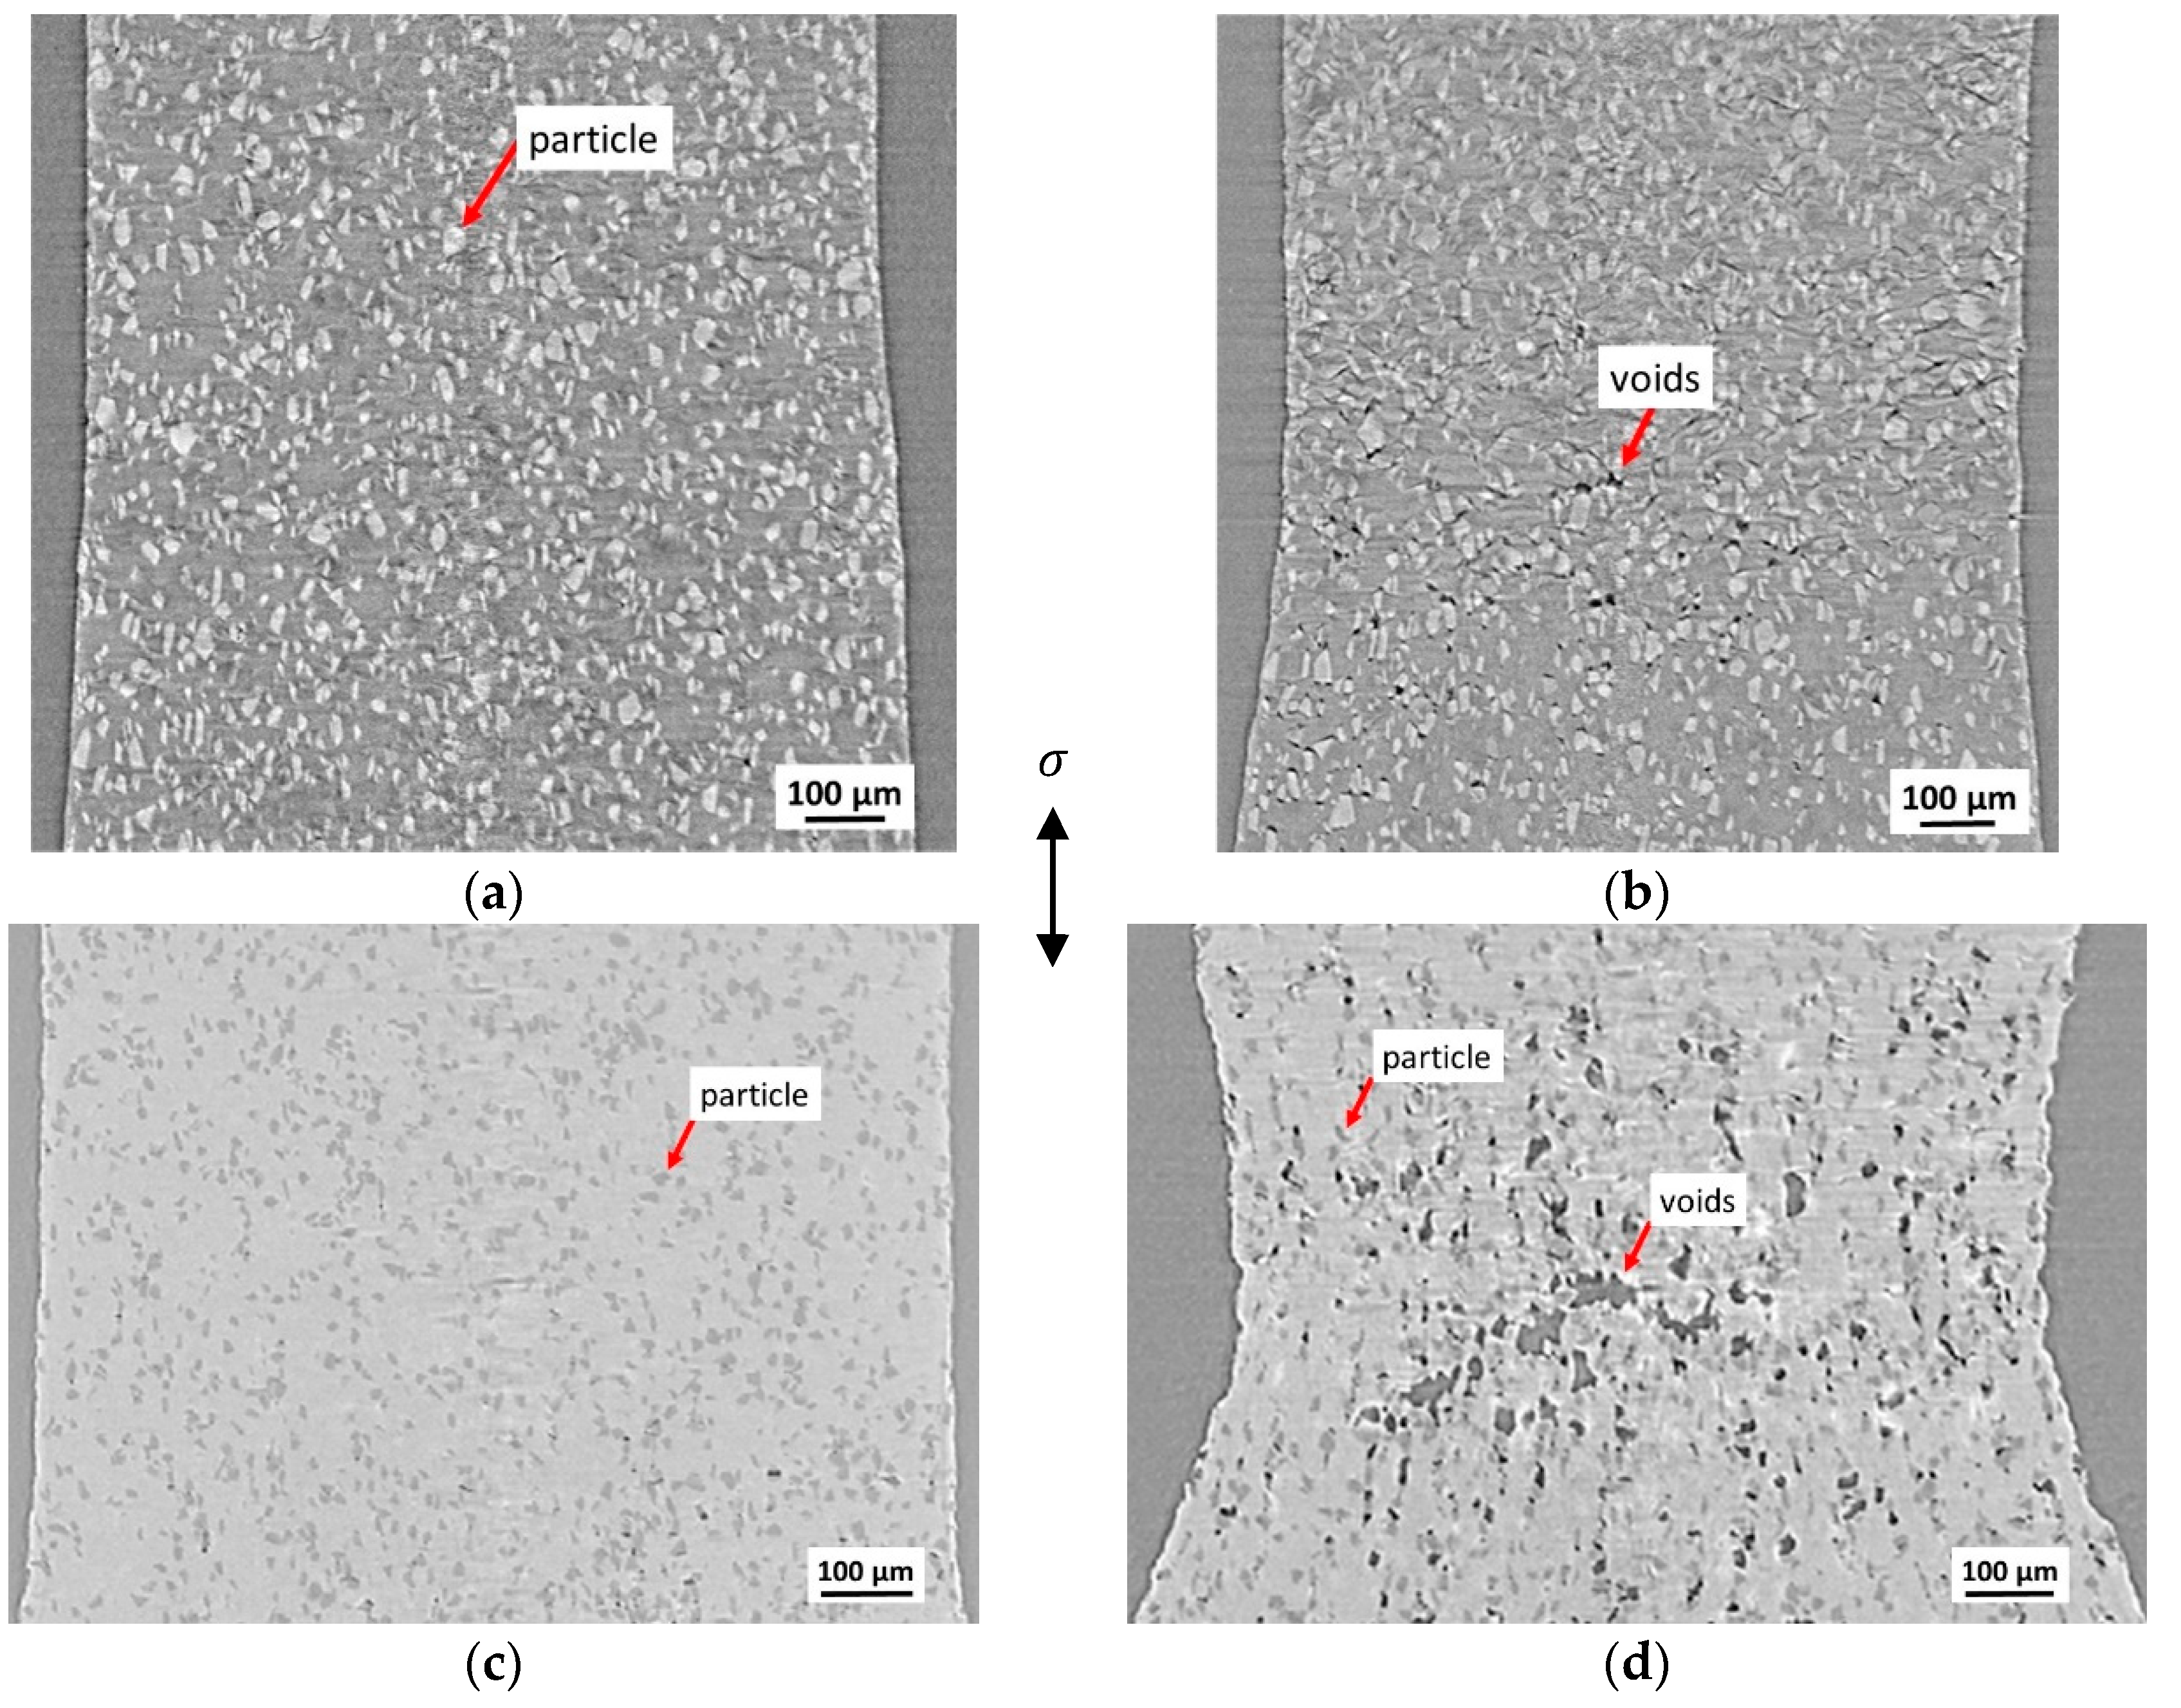
For the Al-MMC, an incipient necking was detected at the beginning of the early creep stage already. But, finally in the Al-MMC, the contraction at fracture ( 4.4–9.6%) remains significantly below the values of the Ti-MMC ( 35%). In the case of Ti-MMC, however, the necking does not start until the transition from the early to the late creep stage. Based on the tomograms, the area of necking was identified as showing the most creep damage due to porosity (Figure 16). Longitudinal sections taken from the tomograms and illustrating different creep stages verify the creep damage. Different absorption coefficients of the particles and the matrix of both MMCs result in distinguishably different grey values. Both in the initial state of the Al-MMC (Figure 16a) and during transition from the early to the late creep stage in the Ti-MMC (Figure 16c) the cavitation is low, while both materials have significantly higher cavitation a short time before fracture (Figure 16b,d). The overview displayed here illustrates the orientation of the cavities perpendicular (= surface diffusion, Figure 16b) or parallel (= dislocation creep, Figure 16d) to the load axis.
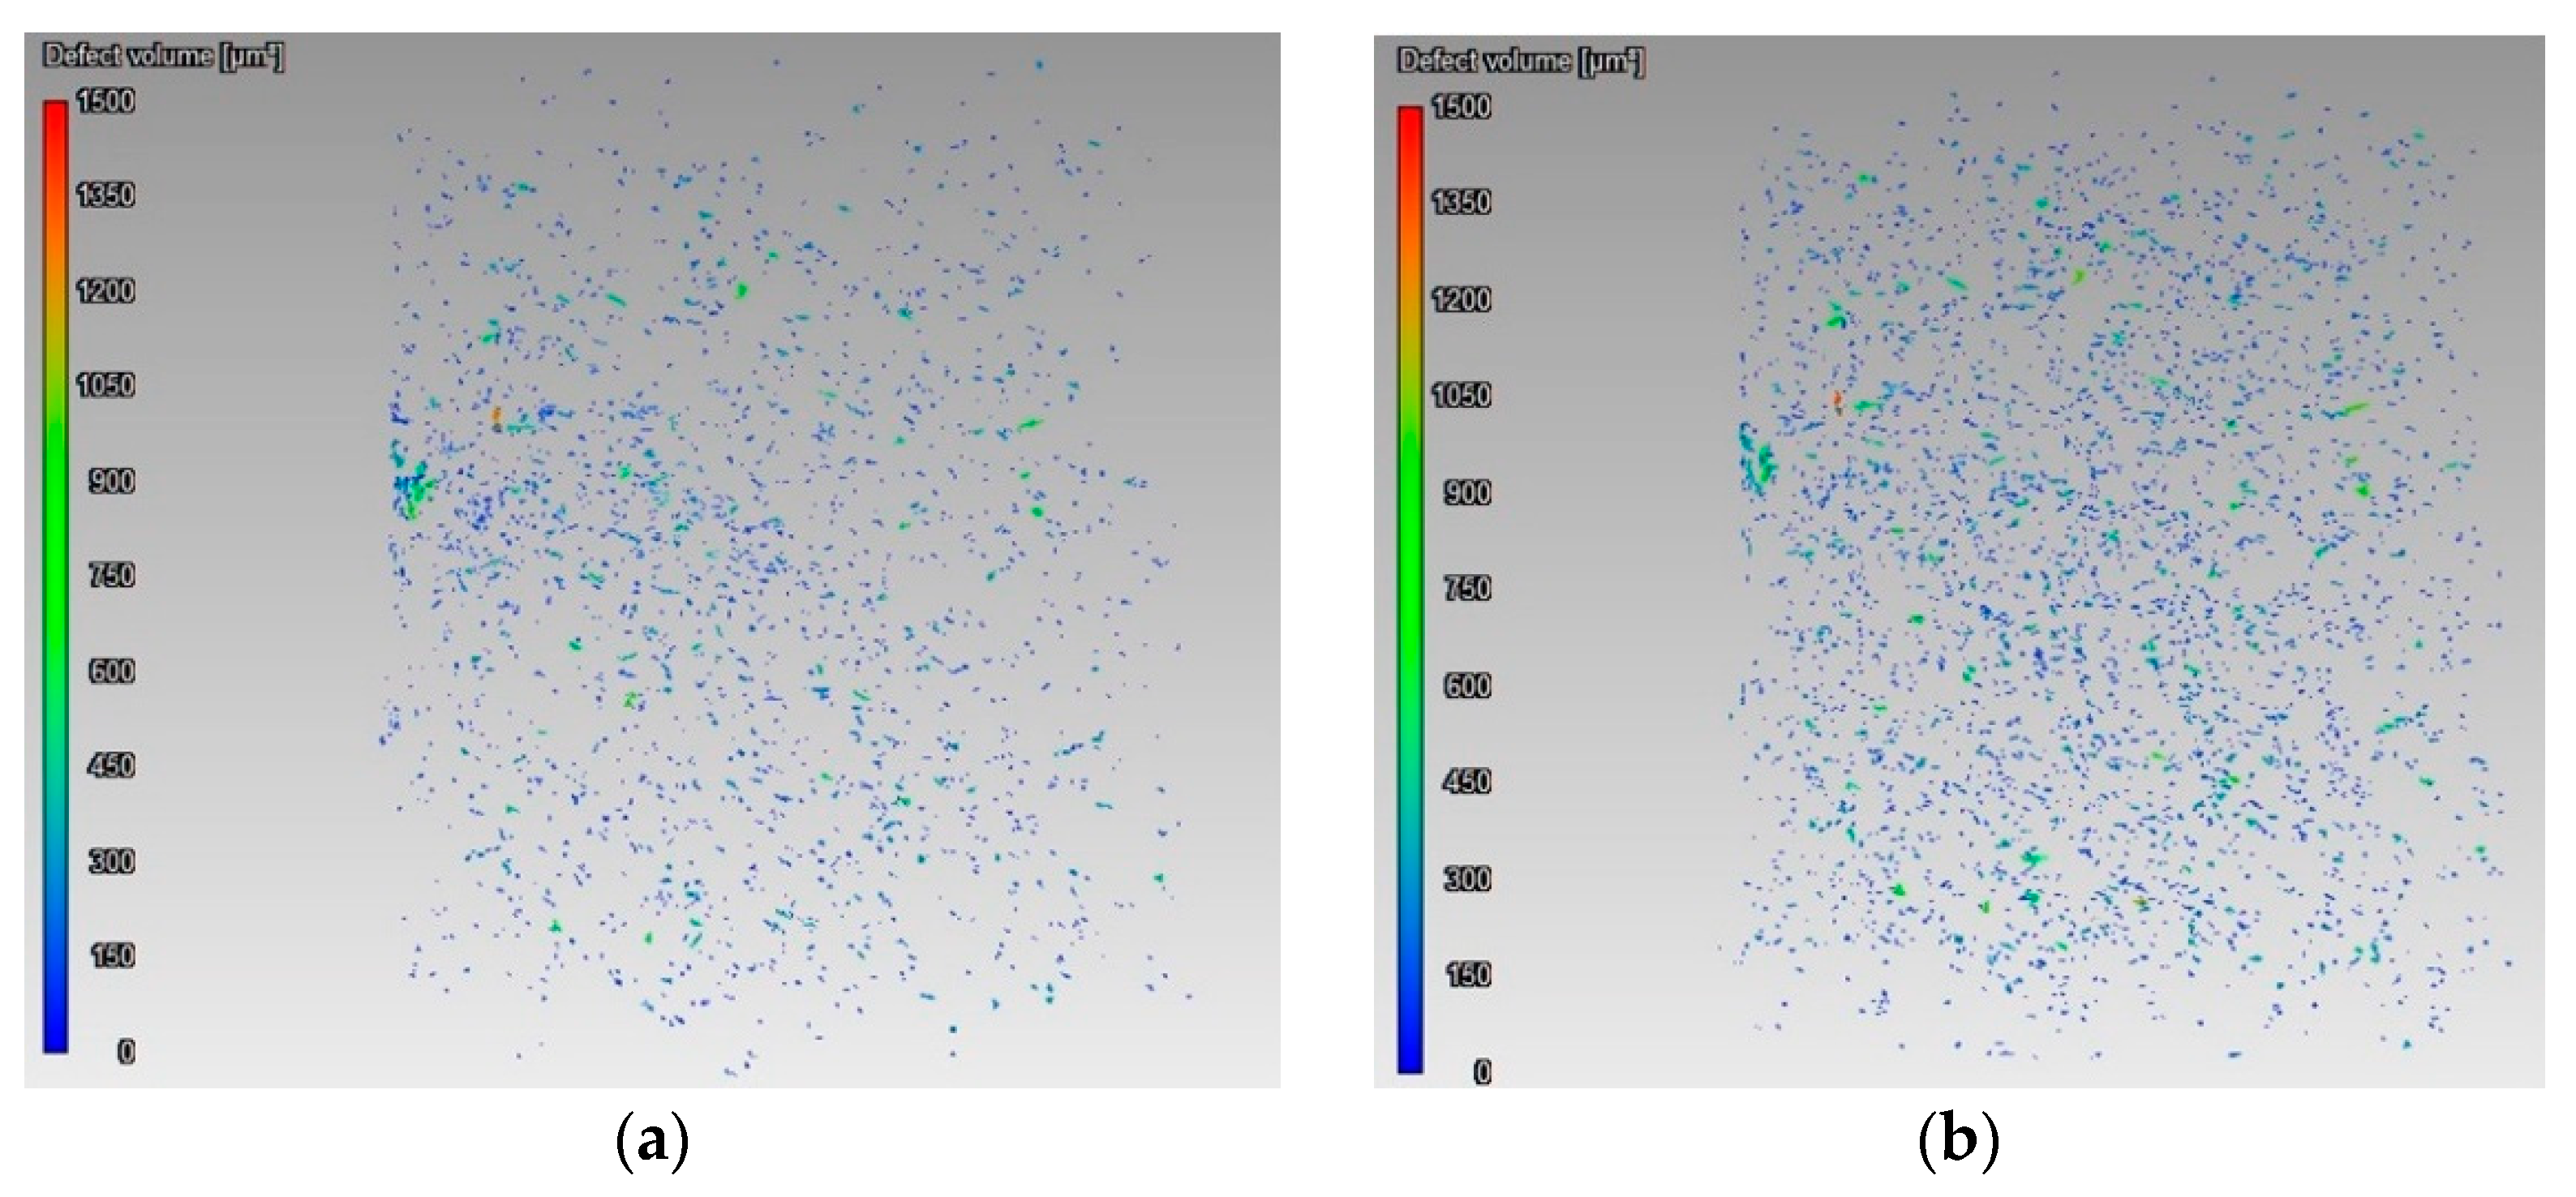
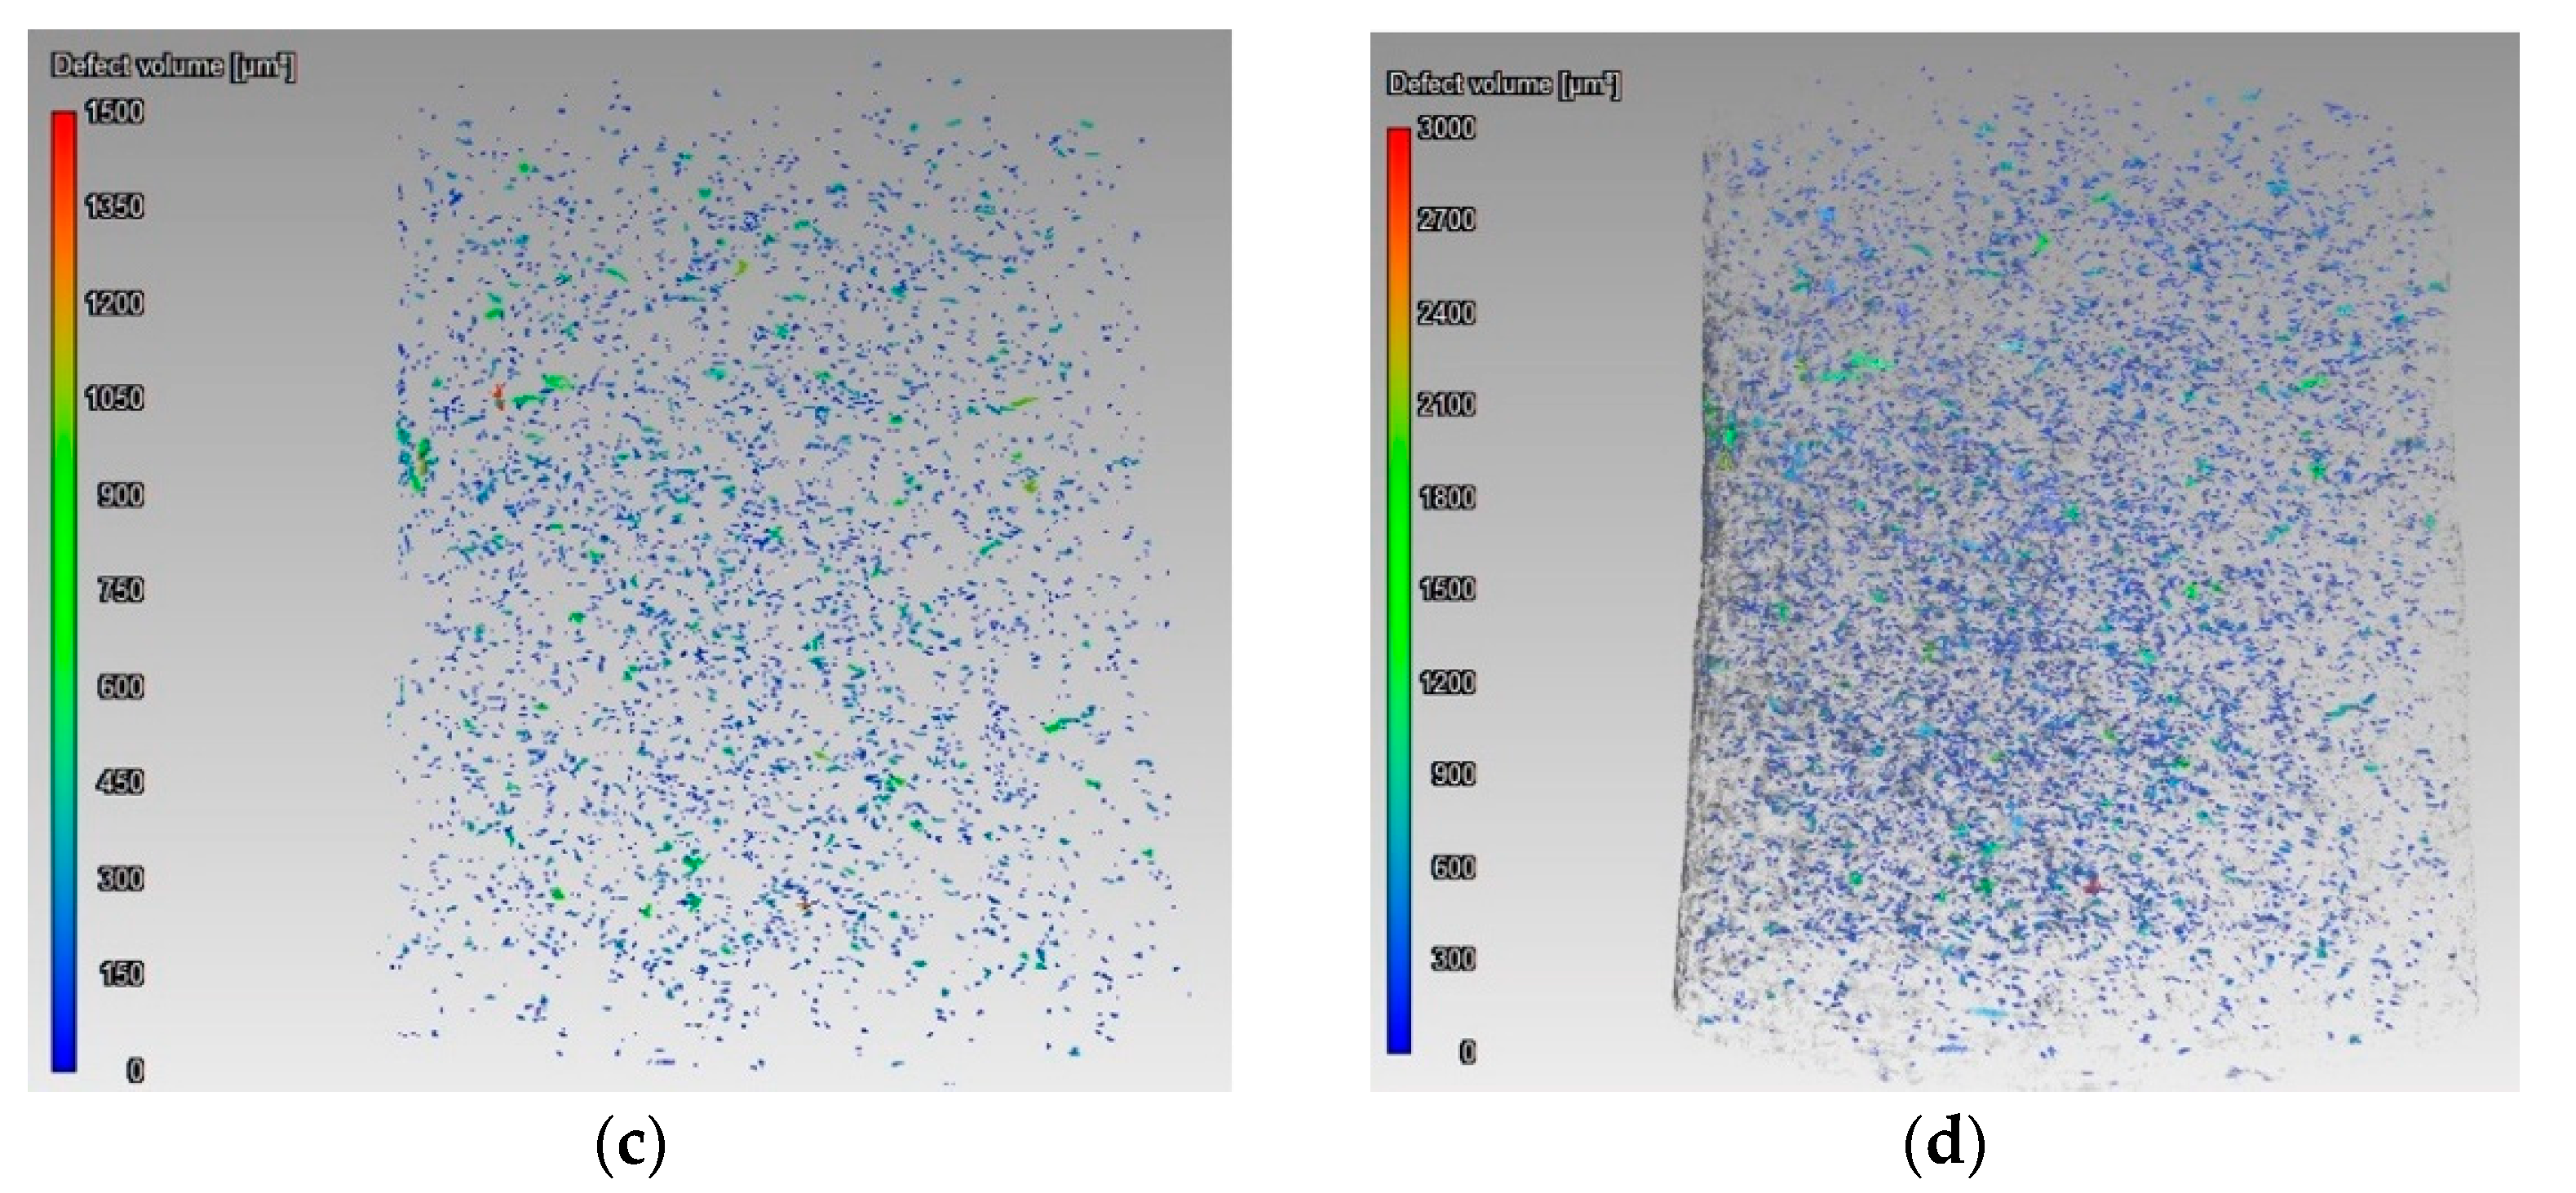
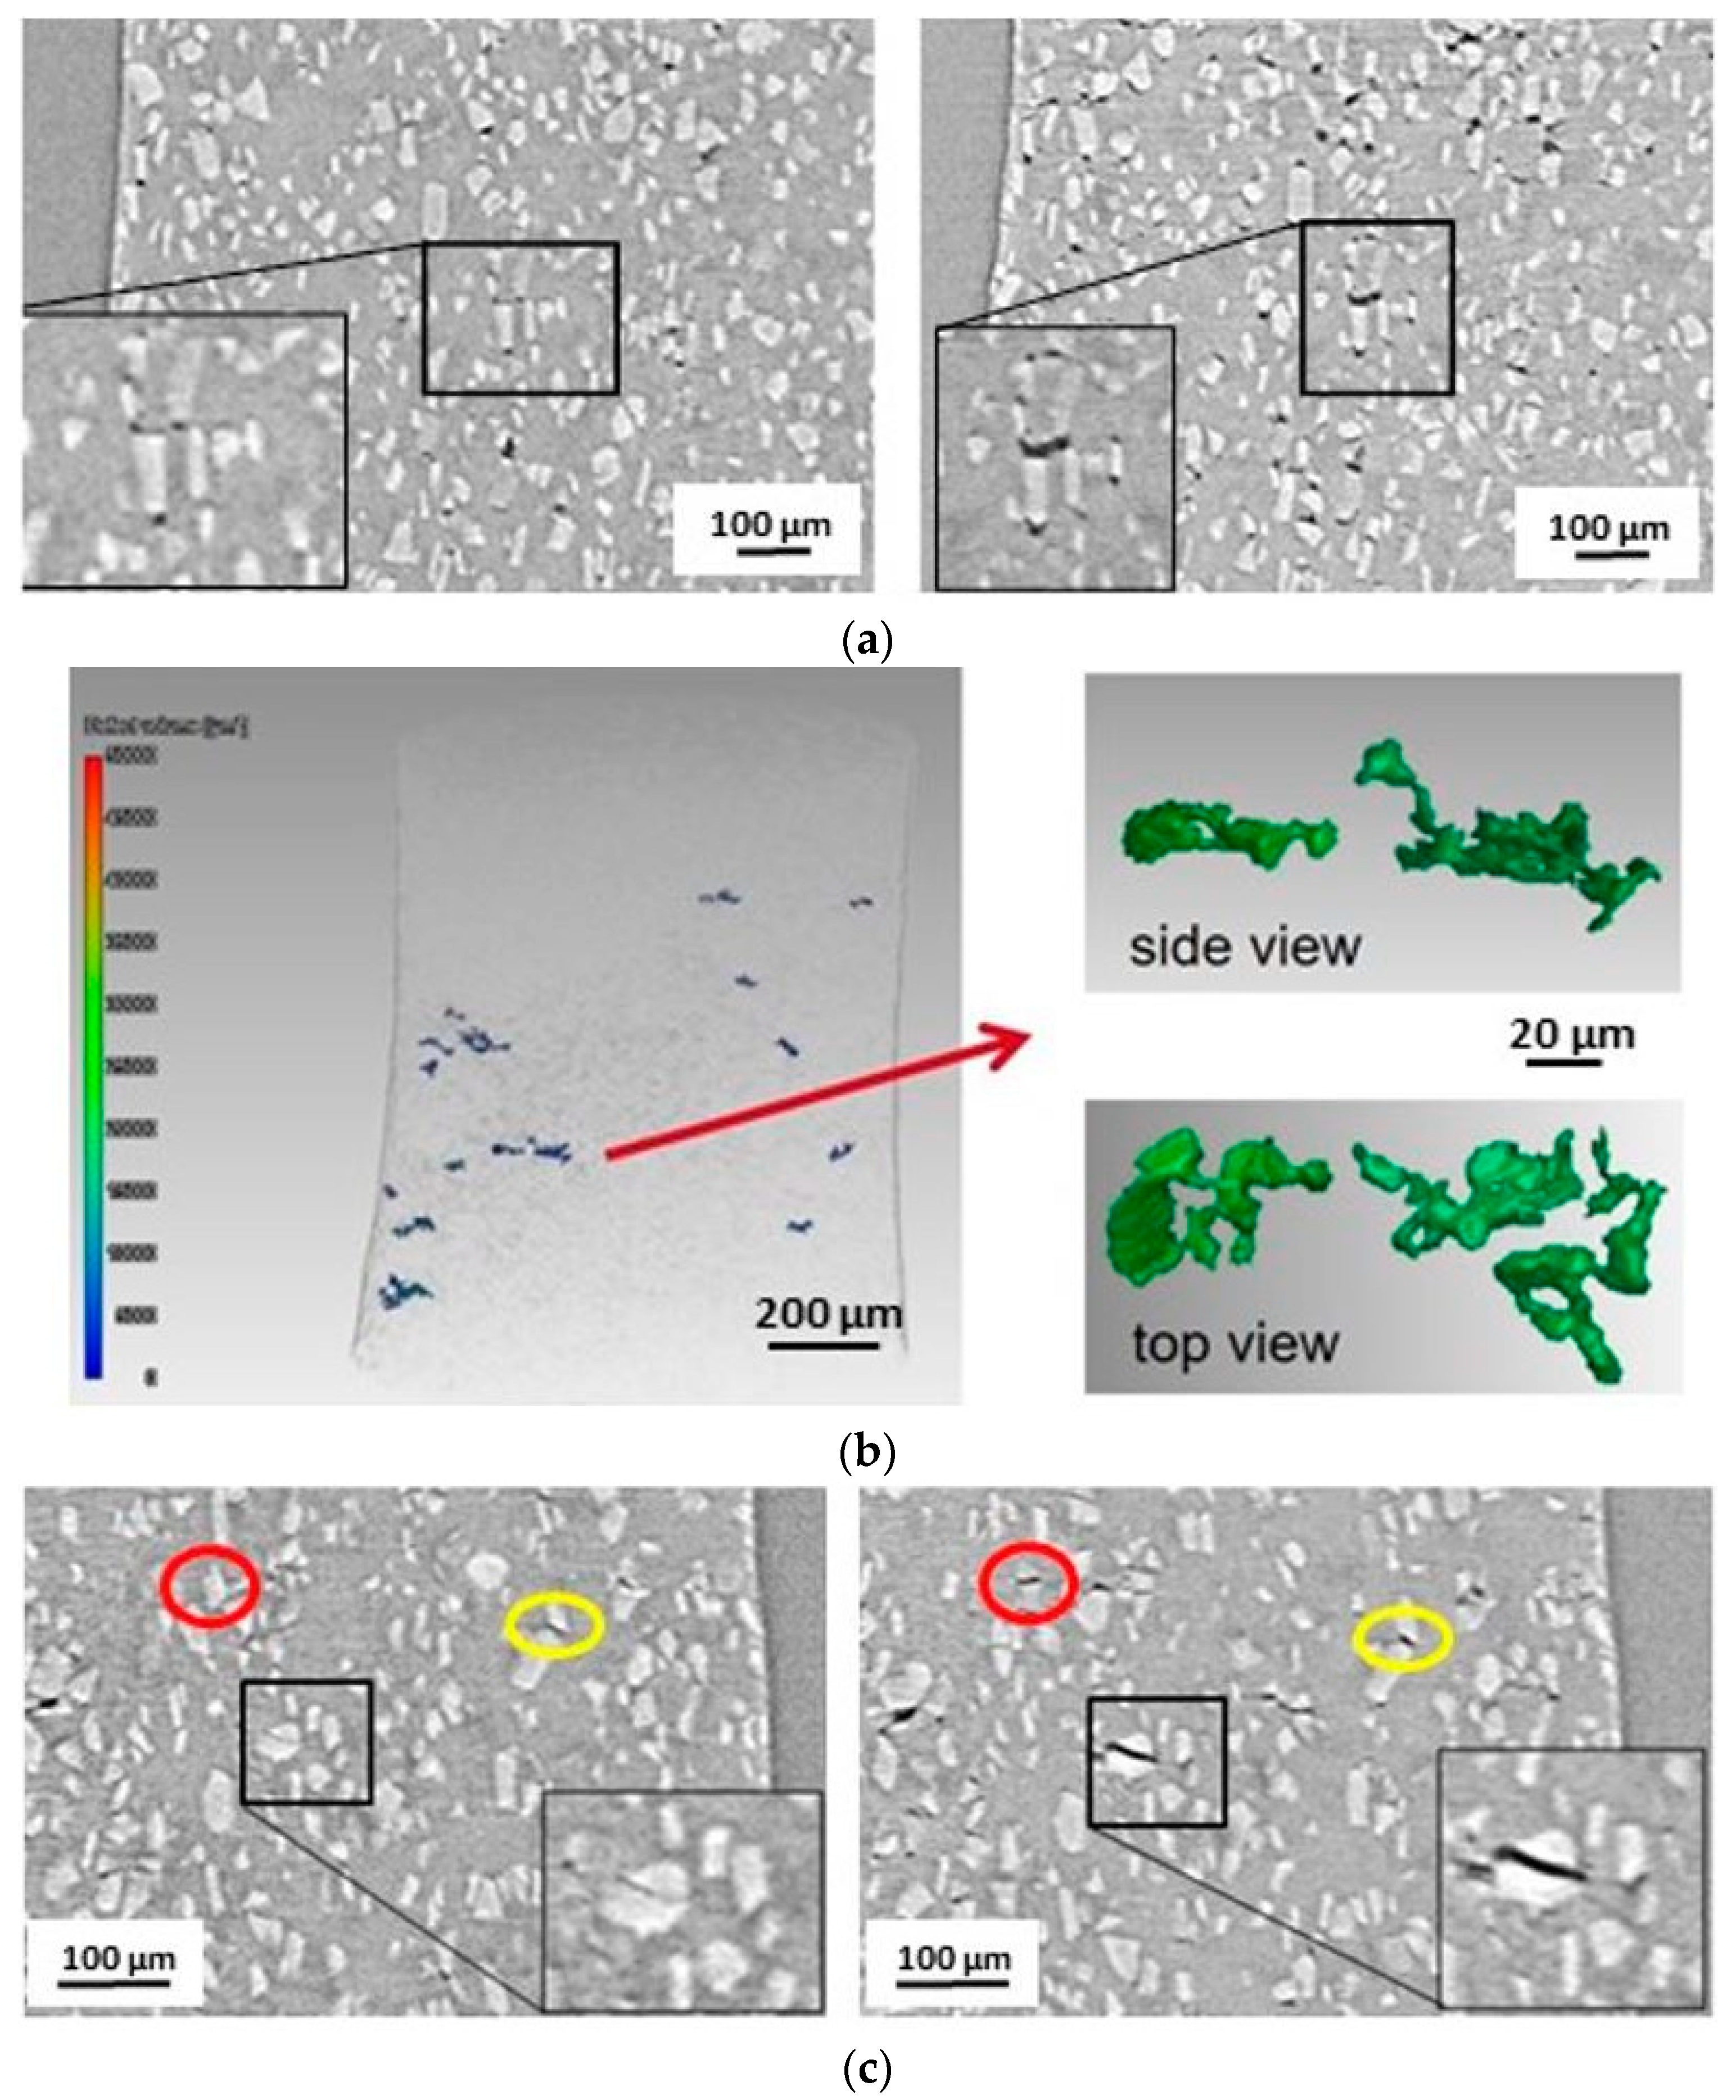
Taking the time-resolved 3D-visualization into account, the mechanisms specified above can be assigned to different creep stages. During creep cavities predominantly oriented perpendicular to the load direction persist in the Al-MMC, since no mechanism change occurs in the material. This applies to the mechanism of surface diffusion in the matrix as well as to the mechanism of particle fracture. In Figure 17a,b, the mechanism of surface diffusion at 50 MPa and 300 °C is represented at different points in time in 2D and 3D. The small cavities oriented slightly perpendicular to the load axis in the matrix at 0.77 evolve to clearly perpendicular oriented voids, which already have the shape of micro cracks (Figure 17a). The detailed 3D-view (Figure 17b) illustrates only the biggest approx. 15 voids in the last sharp tomogram before creep fracture. Every micro crack oriented perpendicular to the load axis coalesced by bridging from smaller cavities oriented perpendicular (Figure 17b, right: side view, top view) corresponding to the development of void formation and growth in the matrix (Figure 9 and Figure 10, Figures S1 and S2). In Cu-40Zn-2Pb-brass, cavity coalescence was detected in the late creep stage of voids formed in the early creep stage by [56,57,58], too.
At higher stress 190 MPa and lower temperatures 200 °C, the predominant process of particle fracture was observed to occur in larger particles in the very early creep process already at 0.03 (Figure 17c, left). Additionally, fractures of smaller particles occur as well, but are detected later during creep (Figure 17c, marked by red circle). Furthermore, void growth by surface diffusion develops by void formation as well as growth evolving from production-related pores (Figure 17c, marked by yellow circle). However, at these loading conditions surface diffusion provides only a minor contribution to creep damage compared to particle fracture.
Comparing the growth rates of the void formation as well as void growth in the Ti-MMC in the early and late creep stages, an indication of the starting conditions of necking can be derived from the mechanism change from surface diffusion to dislocation creep (Figure 9 and Figure 11, Figures S3 and S4). The pronounced necking in the Ti-MMC was observed to be related to the changeover of the previously dominant mechanism by surface diffusion to dislocation creep. Whereas the void growth by surface diffusion develops proportional to creep strain, the dislocation creep is resulting in pronounced disproportionately high void growth (Figures S4 and Figure 18), and so resulting in disproportional creep strain. As an example, Figure 18 shows the time frame at approx. 0.77 , where the changeover of the mechanisms related to the start of the necking as well as the transition from the early to late creep stage at 150 MPa and 510 °C is visible. The necking is marked by a dark grey arrow. The 3D images illustrate the changeover of the cavity orientation (Figure 18, right): At 0.77 the void formation via surface diffusion is usually still oriented perpendicular to the load axis (Video S1, showing the approx. 15 biggest voids), whereas at 0.98 , the void growth by dislocation creep is finally parallel oriented (Video S2, showing the approx. 15 biggest voids).
Cocks and Ashby specified in their model for the coupling mechanism of surface diffusion and dislocation creep, that in the early part of the void growth is controlled by diffusion and as the voids become larger, the power-law creep takes over. The changeover of the mechanisms takes place reaching a critical area fraction [18]. Since the creep damage was determined in 3D in the present work, the critical volume fraction , at which the change occurs, can be derived from the tomography data. At the creep load 150 MPa and 510 °C, this critical volume fraction 0.228% for the mechanism change from surface diffusion to dislocation creep is reached at the time of approx. 0.77 and strain 15% (Figure 6b and Figure 18, Figures S3b and S4b). At this strain value, exponential void formation and void growth starts by the dislocation creep mechanism due to the decreasing of surface diffusion. The disproportionately high growth in cavitation is due to the acceleration of the creep rate in the necking region resulting in an increasing net section stress causing the mechanism change [18].
5. Conclusions
In situ synchrotron X-ray 3D-micro-tomography enables non-destructive evaluation of creep damage in light-metal matrix composites (L-MMCs). From the tomograms, time and spatial resolved creep damage development can be determined and analyzed qualitatively as well as quantitatively. Qualitative findings revealed information about size, shape, and orientation of the creep voids providing the responsible creep mechanisms, whereas the quantitative results were used to analyze the time-dependent development in the early and late creep stages. The 3D-visualization of the creep damage furthermore allowed the characterization of the creep mechanisms as a function of the creep loading. The creep damage developed proportionally to the creep strain, indicating the mechanism of surface diffusion in the matrix and particle reinforcement fracture independent from the creep stage. Super-proportional development of creep damage and thus the creep strain was found to be related to the mechanism of dislocation creep.
The aluminum-matrix provides higher resistance to dislocation movement due to precipitation hardening, and as a consequence, less ductility is related to less total cavitation. In contrast, the commercially pure titanium-matrix with a reduced resistance to dislocation movement exhibits large ductility as well as high total cavitation.
Future work regarding data analysis will focus on the coalescence of individual cavities during creep as a function of creep loading and time. Future experiments will aim for higher spatial and temporal resolution to prevent blurred tomograms due to high creep strain a short time to fracture.
Supplementary Materials
The following are available online at https://www.mdpi.com/2075-4701/10/8/1034/s1, Figure S1: AA6061 + 22% Al2O3, pore formation, Figure S2: AA6061 + 22% Al2O3, pore growth, Figure S3: Ti-MMC, pore formation, Figure S4: Ti-MMC, pore growth, Video S1: Ti-MMC at 0.77 tfr, Video S2: Ti-MMC at 0.77 tfr.
Author Contributions
Conceptualization, B.C.; methodology, B.C.; investigation, B.C.; writing—original draft preparation, B.C.; writing—review and editing, B.C.; visualization, L.H. All authors have read and agreed to the published version of the manuscript.
Funding
The APC was funded by the German Research Foundation and the Open Access Publication Fund of TU Berlin.
Acknowledgments
The experiments were performed on beamline ID15A at the European Synchrotron Radiation Facility (ESRF), Grenoble, France. We are grateful to Marco Di Michiel at the ESRF for providing assistance in using beamline ID15A. Further, we are grateful to Birgit Skrotzki for calculating uncertainty of measurements according to evaluation methods by the Bundesanstalt für Materialforschung und -prüfung (BAM). We acknowledge support by the German Research Foundation and the Open Access Publication Fund of TU Berlin.
Conflicts of Interest
The authors declare no conflicts of interest.
References
- Miracle, D. Metal matrix composites—From science to technological significance. Compos. Sci. Technol. 2005, 65, 2526–2540. [Google Scholar] [CrossRef]
- Singerman, S.A.; Jackson, J.J. Titanium Metal Matrix Composites for Aerospace Applications. In Proceedings of the Superalloys 1996, Proceedings of Eighth International Symposium on Superalloys, Somerset County, PA, USA, 22–26 September 1996; pp. 579–586. [Google Scholar]
- Rawal, S.P. Metal-matrix composites for space applications. JOM 2001, 53, 14–17. [Google Scholar] [CrossRef]
- Kainer, K.U. Metallische Verbundwerkstoffe; Wiley-VCH: Weinheim, Germany, 2004; ISBN 9783527602063. [Google Scholar]
- Broeckmann, C. Kriechen Partikelverstärkter Metallischer Werkstoffe; VDI-Verlag: Düsseldorf, Germany, 2001. [Google Scholar]
- Krajewski, P.E.; Allison, J.E.; Jones, J.W. The influence of matrix microstructure and particle reinforcement on the creep behavior of 2219 aluminum. Metall. Mater. Trans. A 1993, 24, 2731. [Google Scholar] [CrossRef]
- Li, Y.; Mohamed, F.A. An investigation of creep behavior in an SiCx 2124 Al composite. Acta Mater. 1997, 45, 4775–4785. [Google Scholar] [CrossRef]
- LI, Y.; Langdon, T. A simple procedure for estimating threshold stresses in the creep of metal matrix composites. Scr. Mater. 1997, 36, 1457–1460. [Google Scholar] [CrossRef]
- Ma, Z.Y.; Mishra, R.S.; Tjong, S.C. High-temperature creep behavior of TiC particulate reinforced Ti–6Al–4V alloy composite. Acta Mater. 2002, 50, 4293–4302. [Google Scholar] [CrossRef]
- Zhu, S.J.; Mukherji, D.; Chen, W.; Lu, Y.X.; Wang, Z.G.; Wahi, R.P. Steady state creep behaviour of TiC particulate reinforced Ti–6Al–4V composite. Mater. Sci. Eng. A 1998, 256, 301–307. [Google Scholar] [CrossRef]
- Chawla, N.; Shen, Y.-L. Mechanical Behavior of Particle Reinforced Metal Matrix Composites. Adv. Eng. Mater. 2001, 3, 357–370. [Google Scholar] [CrossRef]
- Dai, S.; Bian, Z.; Wang, M.; Wu, Y.; Chen, D.; Li, H.; Wang, H. The High-Temperature Creep Behavior of In-Situ TiB2 Particulate Reinforced Al12Si4Cu2NiMg Composite. Metals 2018, 8, 917. [Google Scholar] [CrossRef] [Green Version]
- Rösler, J.; Bäker, M. Mechanisches Verhalten der Werkstoffe: Mit 34 Aufgaben mit Lösungen; 3., Durchges. und Korr. Aufl.; Vieweg + Teubner: Wiesbaden, Germany, 2008; ISBN 978-3-8351-0240-8. [Google Scholar]
- Frost, H.J.; Ashby, M.F. Deformation-mechanism maps. In The Plasticity and Creep of Metals and Ceramics; Pergamon Press: Oxford, UK, 1982; ISBN 978-0080293387. [Google Scholar]
- Ashby, M.F. A first report on deformation-mechanism maps. Acta Metall. 1972, 20, 887–897. [Google Scholar] [CrossRef]
- Čadek, J. Creep in Metallic Materials; Elsevier: Amsterdam, The Netherlands, 1988; ISBN 9780444989161. [Google Scholar]
- Ashby, M.F.; Gandhi, C.; Taplin, D.M.R. Overview No. 3 Fracture-mechanism maps and their construction for f.c.c. metals and alloys. Acta Metall. 1979, 27, 699–729. [Google Scholar] [CrossRef]
- Cocks, A.C.F.; Ashby, M.F. On creep fracture by void growth. Prog. Mater. Sci. 1982, 27, 189–244. [Google Scholar] [CrossRef]
- Nabarro, F.R.N.; De Villiers, F. Physics of Creep and Creep-Resistant Alloys; Chapman and Hall/CRC: Boca Raton, FL, USA, 2018; ISBN 0850668522. [Google Scholar]
- Frost, H.J.; Ashby, M.F. A Second Report on Deformation Mechanism Maps; Final Report; Division of Engineering and Applied Physics, Harvard University: Cambridge, MA, USA; U.S. Department of Commerce; National Technical Information Service: Springfield, VA, USA, 1973.
- Greenwood, G.W. Cavity nucleation in the early stages of creep. Philos. Mag. 1969, 19, 423–427. [Google Scholar] [CrossRef]
- Clyne, T.W.; Withers, P.J. An Introduction to Metal Matrix Composites; Cambridge University Press: Cambridge, UK, 2010; ISBN 9780521418089. [Google Scholar]
- Requena, G.; Telfser, D.; Hörist, C.; Degischer, H.P. Creep behaviour of AA 6061 metal matrix composite alloy and AA 6061. Mater. Sci. Technol. 2002, 18, 515–521. [Google Scholar] [CrossRef]
- Park, K.-T.; Lavernia, E.J.; Mohamed, F.A. High temperature creep of silicon carbide particulate reinforced aluminum. Acta Metall. Mater. 1990, 38, 2149–2159. [Google Scholar] [CrossRef]
- Isaac, A.; Sket, F.; Reimers, W.; Camin, B.; Sauthoff, G.; Pyzalla, A.R. In situ 3D quantification of the evolution of creep cavity size, shape, and spatial orientation using synchrotron X-ray tomography. Mater. Sci. Eng. A 2008, 478, 108–118. [Google Scholar] [CrossRef]
- Chapman, N.C.; Silva, J.; Williams, J.J.; Chawla, N.; Xiao, X. Characterisation of thermal cycling induced cavitation in particle reinforced metal matrix composites by three-dimensional (3D) X-ray synchrotron tomography. Mater. Sci. Technol. 2015, 31, 573–578. [Google Scholar] [CrossRef]
- Zhou, S.; Maire, E.; Xie, J.; Bareggi, A.; Adrien, J.; Dimichiel, M. Damage assessment of Al alloys using in situ tensile tests in x-ray tomography. In ICEM 2008: International Conference on Experimental Mechanics 2008, Proceedings of the International Conference on Experimental Mechnics 2008 and Seventh Asian Conference on Experimental Mechanics, Nanjing, China, 8 November 2008; He, X., Xie, H., Kang, Y., Eds.; SPIE: Paris, France, 2008; p. 73756F. [Google Scholar]
- Singh, S.S.; Williams, J.J.; Hruby, P.; Xiao, X.; De Carlo, F.; Chawla, N. In situ experimental techniques to study the mechanical behavior of materials using X-ray synchrotron tomography. Integr. Mater. 2014, 3, 109–122. [Google Scholar] [CrossRef] [Green Version]
- Sket, F.; Isaac, A.; Dzieciol, K.; Sauthoff, G.; Borbély, A.; Pyzalla, A.R. In situ tomographic investigation of brass during high-temperature creep. Scr. Mater. 2008, 59, 558–561. [Google Scholar] [CrossRef]
- Gupta, C.; Toda, H.; Mayr, P.; Sommitsch, C. 3D creep cavitation characteristics and residual life assessment in high temperature steels: A critical review. Mater. Sci. Technol. 2015, 31, 603–626. [Google Scholar] [CrossRef]
- Banhart, J.; Borbély, A.; Dzieciol, K.; Garcia-Moreno, F.; Manke, I.; Kardjilov, N.; Kaysser-Pyzalla, A.R.; Strobl, M.; Treimer, W. X-ray and neutron imaging—Complementary techniques for materials science and engineering. Int. J. Mater. Res. 2010, 101, 1069–1079. [Google Scholar] [CrossRef]
- Requena, G. Creep Behaviour of Discontinuously Reinforced Aluminium Alloys. Ph.D. Thesis, Technische Universität Wien, Vienna, Austria, 2004. [Google Scholar]
- Requena, G.C.; Degischer, H.P. Effects of particle reinforcement on creep behaviour of AlSi1MgCu. Z. Met. 2005, 96, 807–813. [Google Scholar] [CrossRef]
- Poletti, C.; Balog, M.; Schubert, T.; Liedtke, V.; Edtmaier, C. Production of titanium matrix composites reinforced with SiC particles. Compos. Sci. Technol. 2008, 68, 2171–2177. [Google Scholar] [CrossRef] [Green Version]
- Pyzalla, A.; Camin, B.; Buslaps, T.; Di Michiel, M.; Kaminski, H.; Kottar, A.; Pernack, A.; Reimers, W. Simultaneous tomography and diffraction analysis of creep damage. Science 2005, 308, 92–95. [Google Scholar] [CrossRef] [PubMed]
- Pyzalla, A.R. In-situ Observation of Creep Damage in Al-Al2O3 MMCs by Synchrotron X-ray Tomography; JCPDS-International Centre for Diffraction Data: Delaware County, PA, USA, 2006; pp. 73–78. [Google Scholar]
- Pyzalla, A.R.; Camin, B.; Buslaps, T.; Di Michiel, M.; Kaminski, H.; Lehrer, B.; Wichert, M.; Reimers, W. Synchrotronstrahlung zur Charakterisierung von Metallmatrix-Verbundwerkstoffen. In Proceedings of the 15. Symposium Verbundwerkstoffe und Werkstoffverbunde, Kassel, Germany, 6–8 April 2005; Schlimmer, M., Ed.; pp. 409–414, ISBN 3883553409. [Google Scholar]
- Di Michiel, M.; Merino, J.M.; Fernandez-Carreiras, D.; Buslaps, T.; Honkimäki, V.; Falus, P.; Martins, T.; Svensson, O. Fast microtomography using high energy synchrotron radiation. Rev. Sci. Instrum. 2005, 76, 043702. [Google Scholar] [CrossRef]
- Bürgel, R.; Jürgen Maier, H.; Niendorf, T. Handbuch Hochtemperatur—Werkstofftechnik. Grundlagen, Werkstoffbeanspruchungen, Hochtemperaturlegierungen und—Beschichtungen; Mit 66 Tab, 4.; Überarbeitete Auflage; Vieweg + Teubner Verlag/Springer Fachmedien Wiesbaden GmbH Wiesbaden: Wiesbaden, Germany, 2011; ISBN 978-3-8348-1388-6. [Google Scholar]
- Huppmann, M.; Camin, B.; Pyzalla, A.R.; Reimers, W. In-situ observation of creep damage evolution in Al–Al2O3 MMCs by synchrotron X-ray microtomography. Int. J. Mater. Res. 2010, 101, 372–379. [Google Scholar] [CrossRef]
- Mälzer, G.; Hayes, R.W.; Mack, T.; Eggeler, G. Miniature Specimen Assessment of Creep of the Single-Crystal Superalloy LEK 94 in the 1000 °C Temperature Range. Metall. Mat. Trans. A 2007, 38, 314–327. [Google Scholar] [CrossRef]
- Kurumlu, D. Mechanische und Mikrostrukturelle Untersuchungen an einer Kurzfaserverstärkten Aluminiumlegierung. Ph.D. Dissertation, Ruhr-Universität Bochum, Bochum, Germany, 2010. [Google Scholar]
- García, S.; Pascual, R.H.; Yurechko, M. Creep test guidelines for cladding tubes. In 7th Framework Programme—MATTER; Community Research; European Commission: Belgium, Brussels, 2011–2014; p. 32. [Google Scholar]
- Olbricht, J.; Bismarck, M.; Skrotzki, B. Characterization of the creep properties of heat resistant 9–12% chromium steels by miniature specimen testing. Mater. Sci. Eng. A 2013, 585, 335–342. [Google Scholar] [CrossRef]
- Bismarck, M.; Skrotzki, B.; Olbricht, J. Size effects in miniature specimen creep testing of P91. In Proceedings of the 3rd International ECCC Conference 2014, Milan, Italy, 5–7 May 2014; pp. 430–435. [Google Scholar]
- Dymáček, P.; Jarý, M.; Dobeš, F.; Kloc, L. Tensile and Creep Testing of Sanicro 25 Using Miniature Specimens. Materials 2018, 11, 142. [Google Scholar] [CrossRef] [Green Version]
- Comité Européen de Normalisation. Part 3: The Evaluation of Uncertainities in Creep Testing. In Measurement Uncertainties in Mechanical Tests on Metallic Materials: CEN Workshop Agreement; Comité Européen de Normalisation: Brussels, Belgium, 2005. [Google Scholar]
- Peters, M. Titan und Titanlegierungen; 3., Völlig neu Bearb., Aufl.; Wiley-VCH: Weinheim, Germany, 2002; ISBN 9783527611089. [Google Scholar]
- Handbuch Konstruktionswerkstoffe. Auswahl, Eigenschaften, Anwendung; 2., überarb. Aufl.; Moeller, E. (Ed.) Hanser: München, Germany, 2014; ISBN 978-3-446-43169-0. [Google Scholar]
- Luster, D.R. Creep Properties of Titanium. Materials and Methods: The Metalworking Industries’ Engineering Magazine, 1953; 199–203. [Google Scholar]
- Zhu, S.J.; Lu, Y.X.; Wang, Z.G.; Bi, J. Creep behavior of TiC-particulate-reinforced Ti alloy composite. Mater. Lett. 1992, 13, 199–203. [Google Scholar] [CrossRef]
- Davis, L.C.; Allison, J.E. Micromechanics effects in creep of metal-matrix composites. Metall. Mater. Trans. A 1995, 26, 3081–3089. [Google Scholar] [CrossRef]
- Skrotzki, B. Mechanical Loading of Light Alloys at Elevated Temperature; Zugl.: Bochum, Univ.; Habilitation, 2000, Als Ms. gedr; VDI-Verlag: Düsseldorf, Germany, 2001; ISBN 978-3-18-362905-3. [Google Scholar]
- Ranganath, S.; Mishra, R.S. Steady state creep behaviour of particulate-reinforced titanium matrix composites. Acta Mater. 1996, 44, 927–935. [Google Scholar] [CrossRef]
- Tsang, H.T.; Chao, C.G.; Ma, C.Y. Effects of volume fraction of reinforcement on tensile and creep properties of in-situ MMC. Scr. Mater. 1997, 37, 1359–1365. [Google Scholar] [CrossRef]
- Borbély, A.; Dzieciol, K.; Sket, F.; Isaac, A.; Di Michiel, M.; Buslaps, T.; Kaysser-Pyzalla, A.R. Characterization of creep and creep damage by in-situ microtomography. JOM 2011, 63, 78–84. [Google Scholar] [CrossRef]
- Isaac, A.; Sket, F.; Borbély, A.; Sauthoff, G.; Pyzalla, A.R. Study of Cavity Evolution During Creep by Synchrotron Microtomography Using a Volume Correlation Method. Pract. Metallogr. 2008, 45, 242–245. [Google Scholar] [CrossRef]
- Isaac, A.; Dzieciol, K.; Sket, F.; Di Michiel, M.; Buslaps, T.; Borbély, A.; Pyzalla, A.R. Investigation of creep cavity coalescence in brass by in-situ synchrotron x-ray microtomography. In Developments in X-Ray Tomography VI, Proceedings of the Optical Engineering + Applications, San Diego, CA, USA, 10 August 2008; Stock, S.R., Ed.; SPIE: Paris, France, 2008; p. 70781J. [Google Scholar]
Figure 1.
Creep curve.

Figure 2.
(a) Creep mechanisms and (b) the related void morphologies.

Figure 3.
Longitudinal section, parallel to extrusion axis: (a) Al-MMC (LM); (b) Ti-MMC (SEM).

Figure 4.
Miniature creep specimen: (a) main geometry; (b) extrusion direction (ED); (c) engineering detail drawing.
Figure 4.
Miniature creep specimen: (a) main geometry; (b) extrusion direction (ED); (c) engineering detail drawing.

Figure 5.
Creep curves: (a) AA6061 + 22% (Al2O3)p; (b) cp-Titanium + 15% (SiC)p.

Figure 6.
Relation of the total cavitation to creep curve: (a) Al-MMC; (b) and (c) Ti-MMC.


Figure 7.
Al-MMC, 50 MPa, 300 °C, void formation: (a) 0.004 ; (b) 0.11 ; (c) 0.24 ; (d) 0.78 .


Figure 8.
Creep damage: (a) surface diffusion at 0.98 ; (b) particle fracture at 0.96 .

Figure 9.
Al-MMC, void formation, linear fit parameter : (a) early stage; (b) late stage.

Figure 10.
Al-MMC, void growth: (a) early stage, exponential fit; (b) late stage, exponential fit; (c) late stage, linear fit.
Figure 10.
Al-MMC, void growth: (a) early stage, exponential fit; (b) late stage, exponential fit; (c) late stage, linear fit.

Figure 11.
Ti-MMC, void formation, early creep stage, linear fit.

Figure 12.
Ti-MMC, void growth, exponential fit: (a) early stage; (b) late stage.

Figure 13.
Ti-MMC, 150 MPa, 510 °C, 2D longitudinal section through tomogram: (a) 0.94 ; (b) 0.95 ; (c) 0.96 ; (d) 0.98 .
Figure 13.
Ti-MMC, 150 MPa, 510 °C, 2D longitudinal section through tomogram: (a) 0.94 ; (b) 0.95 ; (c) 0.96 ; (d) 0.98 .

Figure 14.
Creep parameter: (a) creep diagram; (b) Norton-diagram; (c) strain at creep fracture.

Figure 15.
Light microscopy image, longitudinal section, Ti-MMC, (a) recrystallized microstructure, (b) unchanged microstructure of the matrix.
Figure 15.
Light microscopy image, longitudinal section, Ti-MMC, (a) recrystallized microstructure, (b) unchanged microstructure of the matrix.

Figure 16.
Tomogram, 2D longitudinal section, contraction during creep: (a) Al-MMC, 50 MPa, 300 °C, initial state; (b) Al-MMC, 50 MPa, 300 °C at 0.996 ; (c) Ti-MMC, 150 MPa, 510 °C at 0.77 ; (d) Ti-MMC, 150 MPa, 510 °C at 0.99 .
Figure 16.
Tomogram, 2D longitudinal section, contraction during creep: (a) Al-MMC, 50 MPa, 300 °C, initial state; (b) Al-MMC, 50 MPa, 300 °C at 0.996 ; (c) Ti-MMC, 150 MPa, 510 °C at 0.77 ; (d) Ti-MMC, 150 MPa, 510 °C at 0.99 .

Figure 17.
Al-MMC, creep damage, longitudinal section: (a) 2D, surface diffusion, 50 MPa, 300 °C, left: 0.77 , right: 0.98 ; (b) 3D, surface diffusion, 50 MPa, 300 °C, 0.98 ; (c) particle fracture, 190 MPa, 200 °C, left: 0.03 , right: 0.98 .
Figure 17.
Al-MMC, creep damage, longitudinal section: (a) 2D, surface diffusion, 50 MPa, 300 °C, left: 0.77 , right: 0.98 ; (b) 3D, surface diffusion, 50 MPa, 300 °C, 0.98 ; (c) particle fracture, 190 MPa, 200 °C, left: 0.03 , right: 0.98 .

Figure 18.
Ti-MMC, changeover of creep mechanisms in the transition from early to late creep stage, 150 MPa, 510 °C.
Figure 18.
Ti-MMC, changeover of creep mechanisms in the transition from early to late creep stage, 150 MPa, 510 °C.


Table 1.
Investigated materials.
| Material Properties | AA6061 + 22% Al2O3 | cp-Titanium + 15% SiC |
|---|---|---|
| matrix material | precipitation hardening alloy | commercially pure |
| reinforcement | particles | particles |
| manufacturing | casting hot extrusion | powder metallurgical hot extrusion |
| heat treatment | T6 + over aged | - |
Table 2.
Creep loading and number of tomograms.
| Material | Stress (MPa) | Temperature (°C) | Number of Analyzed Tomograms |
|---|---|---|---|
| AA6061 + 22% (Al2O3)p | 50 | 300 | 14 |
| 60 | 300 | 12 | |
| 70 | 300 | 6 | |
| 190 | 200 | 42 | |
| cp-Titanium + 15% (SiC)p | 150 | 510 | 15 |
| 180 | 510 | 16 | |
| 180 | 480 | 11 |
Table 3.
Creep parameter.
| Material | Stress (MPa) | Temperature (°C) | Time to Fracture (s) | Strain at Fracture (%) | Contraction at Fracture (%) | Min. Creep Rate (s−1) | Creep Stage (% of Time to Fracture) | |
|---|---|---|---|---|---|---|---|---|
| Early | Late | |||||||
| Al-MMC | 50 | 300 | 46,350 | 13.38 | 4.4 | 8.2 × 10⁻⁷ | 49 | 46 |
| 60 | 300 | 11,970 | 8.97 | 7.3 | 2.7 × 10⁻⁶ | 39 | 54 | |
| 70 | 300 | 5140 | 7.66 | 9.6 | 4.4 × 10⁻⁶ | 32 | 63 | |
| 190 | 200 | 20,270 | 4.62 | 4.8 | 8.6 × 10⁻⁷ | 50 | 45 | |
| Ti-MMC | 150 | 510 | 58,970 | 36 | 35 | 3.16 × 10⁻⁶ | 46 | 50 |
| 180 | 510 | 23,130 | 35 | 35 | 3.85 × 10⁻⁶ | 17 | 71 | |
| 180 | 480 | 73,070 1 | 25 1 | - | 1.31 × 10⁻⁶ | 32 1 | 66 1 | |
1 extrapolated.
© 2020 by the authors. Licensee MDPI, Basel, Switzerland. This article is an open access article distributed under the terms and conditions of the Creative Commons Attribution (CC BY) license (http://creativecommons.org/licenses/by/4.0/).
Share and Cite
MDPI and ACS Style
Camin, B.; Hansen, L. In Situ 3D-µ-Tomography on Particle-Reinforced Light Metal Matrix Composite Materials under Creep Conditions. Metals 2020, 10, 1034. https://doi.org/10.3390/met10081034
AMA Style
Camin B, Hansen L. In Situ 3D-µ-Tomography on Particle-Reinforced Light Metal Matrix Composite Materials under Creep Conditions. Metals. 2020; 10(8):1034. https://doi.org/10.3390/met10081034
Chicago/Turabian StyleCamin, Bettina, and Lennart Hansen. 2020. "In Situ 3D-µ-Tomography on Particle-Reinforced Light Metal Matrix Composite Materials under Creep Conditions" Metals 10, no. 8: 1034. https://doi.org/10.3390/met10081034
Note that from the first issue of 2016, this journal uses article numbers instead of page numbers. See further details here.