Surface Oxidation Behavior and Wear Performance of a Fe-21.3Cr-3.5Al-0.5Ti-0.4Zr Steel

1
Key Laboratory of Automobile Materials, Ministry of Education, Jilin University, Changchun 130025, China
2
Department of Materials Science and Engineering, Jilin University, Changchun 130025, China
*
Author to whom correspondence should be addressed.
Metals 2020, 10(8), 1032; https://doi.org/10.3390/met10081032
Submission received: 11 July 2020
/
Revised: 28 July 2020
/
Accepted: 29 July 2020
/
Published: 1 August 2020
Abstract
:A type of Fe-21.3Cr-3.5Al-0.5Ti-0.4Zr steel was produced for application of spot-welding location pins in automobile industry. The oxidation behavior at temperatures of 1220–1340 °C and wear performance were investigated. The morphologies and constituent phases of the oxide layers were characterized by scanning electron microscope (SEM) and X-ray diffractometer (XRD). The hardness and wear performance of the oxide layers were also measured. The results showed that the mass gain presented a stage characteristic with increasing temperature, i.e., a small increasing at 1220–1260 °C, a moderate increasing at 1280–1300 °C, and a great increasing at 1320–1340 °C. The oxide layer primarily consisted of Al2O3 phase and a small amount of ZrO2 phase. ZrO2 increased in amount with temperature rising from 1220 to 1340 °C. The oxidized surface exhibited an increase of hardness with increasing temperature, but the lowest wear loss occurred at the oxidation temperature of 1280 °C.
1. Introduction
Fe-Cr-Al based alloys are well known for its excellent oxidation resistance and applications for fabrication of high-temperature components—such as electric resistance for furnaces, furnace tubes, fiber based domestic and industrial burners, and metallic substrate of automotive catalytic converters [1,2,3,4,5]. Two major types of protective oxide—i.e., chromium oxide and aluminum oxide—can form on the surfaces of Fe-Cr-Al based alloys in different temperature ranges. Cr2O3 can only provide good corrosion protection at low and intermediate temperatures, while Al2O3 can offer better corrosion protection at high temperatures. The most often reported upper limits of temperatures allowing the protective scales to form and sustain are 900–1100 °C for Cr2O3 and 1200–1400 °C for Al2O3 [6,7,8,9,10]. The better oxidation resistance of Fe-Cr-Al alloys at high temperatures is attributed to the formation of an adherent and slow-growing α-alumina layer. The role of Cr addition to Fe-Al alloys acts as a so-called third element effect [11,12]. That is, it promotes formation of Al2O3 on the Fe-Cr-Al alloys under a lower content than that in binary Fe-Al alloys. The effects of alloying elements on the physical properties and corrosion resistance of Fe-Cr-Al alloys have been investigated quite thoroughly [13,14,15]. However, it is less noticeable that Al2O3-rich oxide layer also possesses high hardness and good insulating properties, therefore, another application for certain types of Fe-Cr-Al alloys is to make spot welding location pins in automobile industry. The excellent oxidation resistance, a certain thickness of about 5–10 μm Al2O3 layer with good electrical insulation, and high wear resistance are required since the spot welding location pins suffered from a high environment temperature of 1000–1200 °C and tens thousands times of repeated wear during the welding location process.
The material currently used for making spot welding location pins is a special Fe-Cr-Al alloy containing some trace elements, i.e., the so-called KCF material. This material is costly and its exact composition is unknown. Therefore, it is of interest to develop a cheap material as an alternative to KCF material. It is known that the addition of reactive elements such as Zr and Ti to Fe-Cr-Al alloy improve the oxide scale adhesion [16]. For the purpose of preparing a material for making spot welding location pins, a type of Fe-21.3Cr-3.5Al-0.5Ti-0.4Zr steel was designed to satisfy the requirements for oxidation resistance, electrical insulation, and wear resistance. In addition, the material was a single-phase alloy with very low content of carbon, and has good rolling properties.
In the present study, Fe-21.3Cr-3.5Al-0.5Ti-0.4Zr steel was fabricated for application of spot welding location pins. Oxidation behavior of the alloy was studied at temperatures of 1220–1340 °C. The hardness and wear performance of samples oxidized at different oxidation temperatures were also measured and analyzed.
2. Experimental Details
The studied material was a Fe-Cr-Al-Ti-Zr steel prepared using pure Fe (99.98 wt %), Al (99.9 wt %), Cr (99.9 wt %), Ti (99.9 wt %), Zr (99.9 wt %), and Ni (99.9 wt %) by means of vacuum induction melting. The cast ingot was hot-rolled into bars of 20 mm in diameter at 1100 °C. The chemical composition of the alloy was analyzed by chemical analysis, as listed in Table 1.
Cylindrical samples with dimensions of 12 mm in diameter and 20 mm in length were machined from the bars for oxidation testing. The end surfaces of samples were ground with 1000 grit SiC abrasive paper, and then polished to surface roughness of about 0.4 μm Ra. Oxidation tests were performed in air at various temperatures of 1200–1340 °C for 3 h in a resistance furnace. The mass gain was measured on a single pan electrical balance with an accuracy of 0.1 mg. Each mass gain was an average of three samples. Surface oxide layers were examined by a Rigaku D/MAX 2500PC X-ray diffractometer (XRD, Rigaku Corporation, Japan.). The morphologies and chemical compositions of oxidized surfaces were observed using a TESCAN VEGA3 scanning electron microscope (SEM, TEsCAN, Germany) equipped with an energy dispersive X-ray spectrometer (EDS). The hardness of oxidized surfaces was measured using a HVS-1000 type digital microhardness tester (Lunjie Electromechanical Instrument Co., Ltd, Shanghai, China) with a load of 0.098 N and a holding time of 20 s. Wear testing was performed at the sliding speed of 1.0 m/s under the load of 20 N for a sliding distance of 188.4 m (1000 rotations) on a MG2000 pin-on-disc tribometer (Zhangjiakou Chengxin Test Equipment Manufacturing Co., Ltd., Zhangjiakou, China). Cylindrical pins were machined from bars into dimensions of 6 mm in diameter and 12 mm in length. After end surface preparation of pins including polishing to a roughness of about 0.4 μm Ra and cleaning in methanol solution, the pins were oxidized at temperatures of 1200–1340 °C. The counter discs of 70 mm in diameter and 10 mm in thickness were made of AISI 5150 steel with hardness of 57 HRC. The wear track of the discs was 60 mm in diameter. The surfaces of discs were also polished to a roughness of about 0.4 μm Ra before wear testing. The wear resistance of oxide layers formed at various temperatures was characterized by weight loss. Each weight loss in the study was an average of three samples. The morphologies of worn surfaces of pins were examined using SEM and EDS.
3. Results and Discussions
3.1. Microstructure of Fe-21.3Cr-3.5Al-0.5Ti-0.4Zr Steel
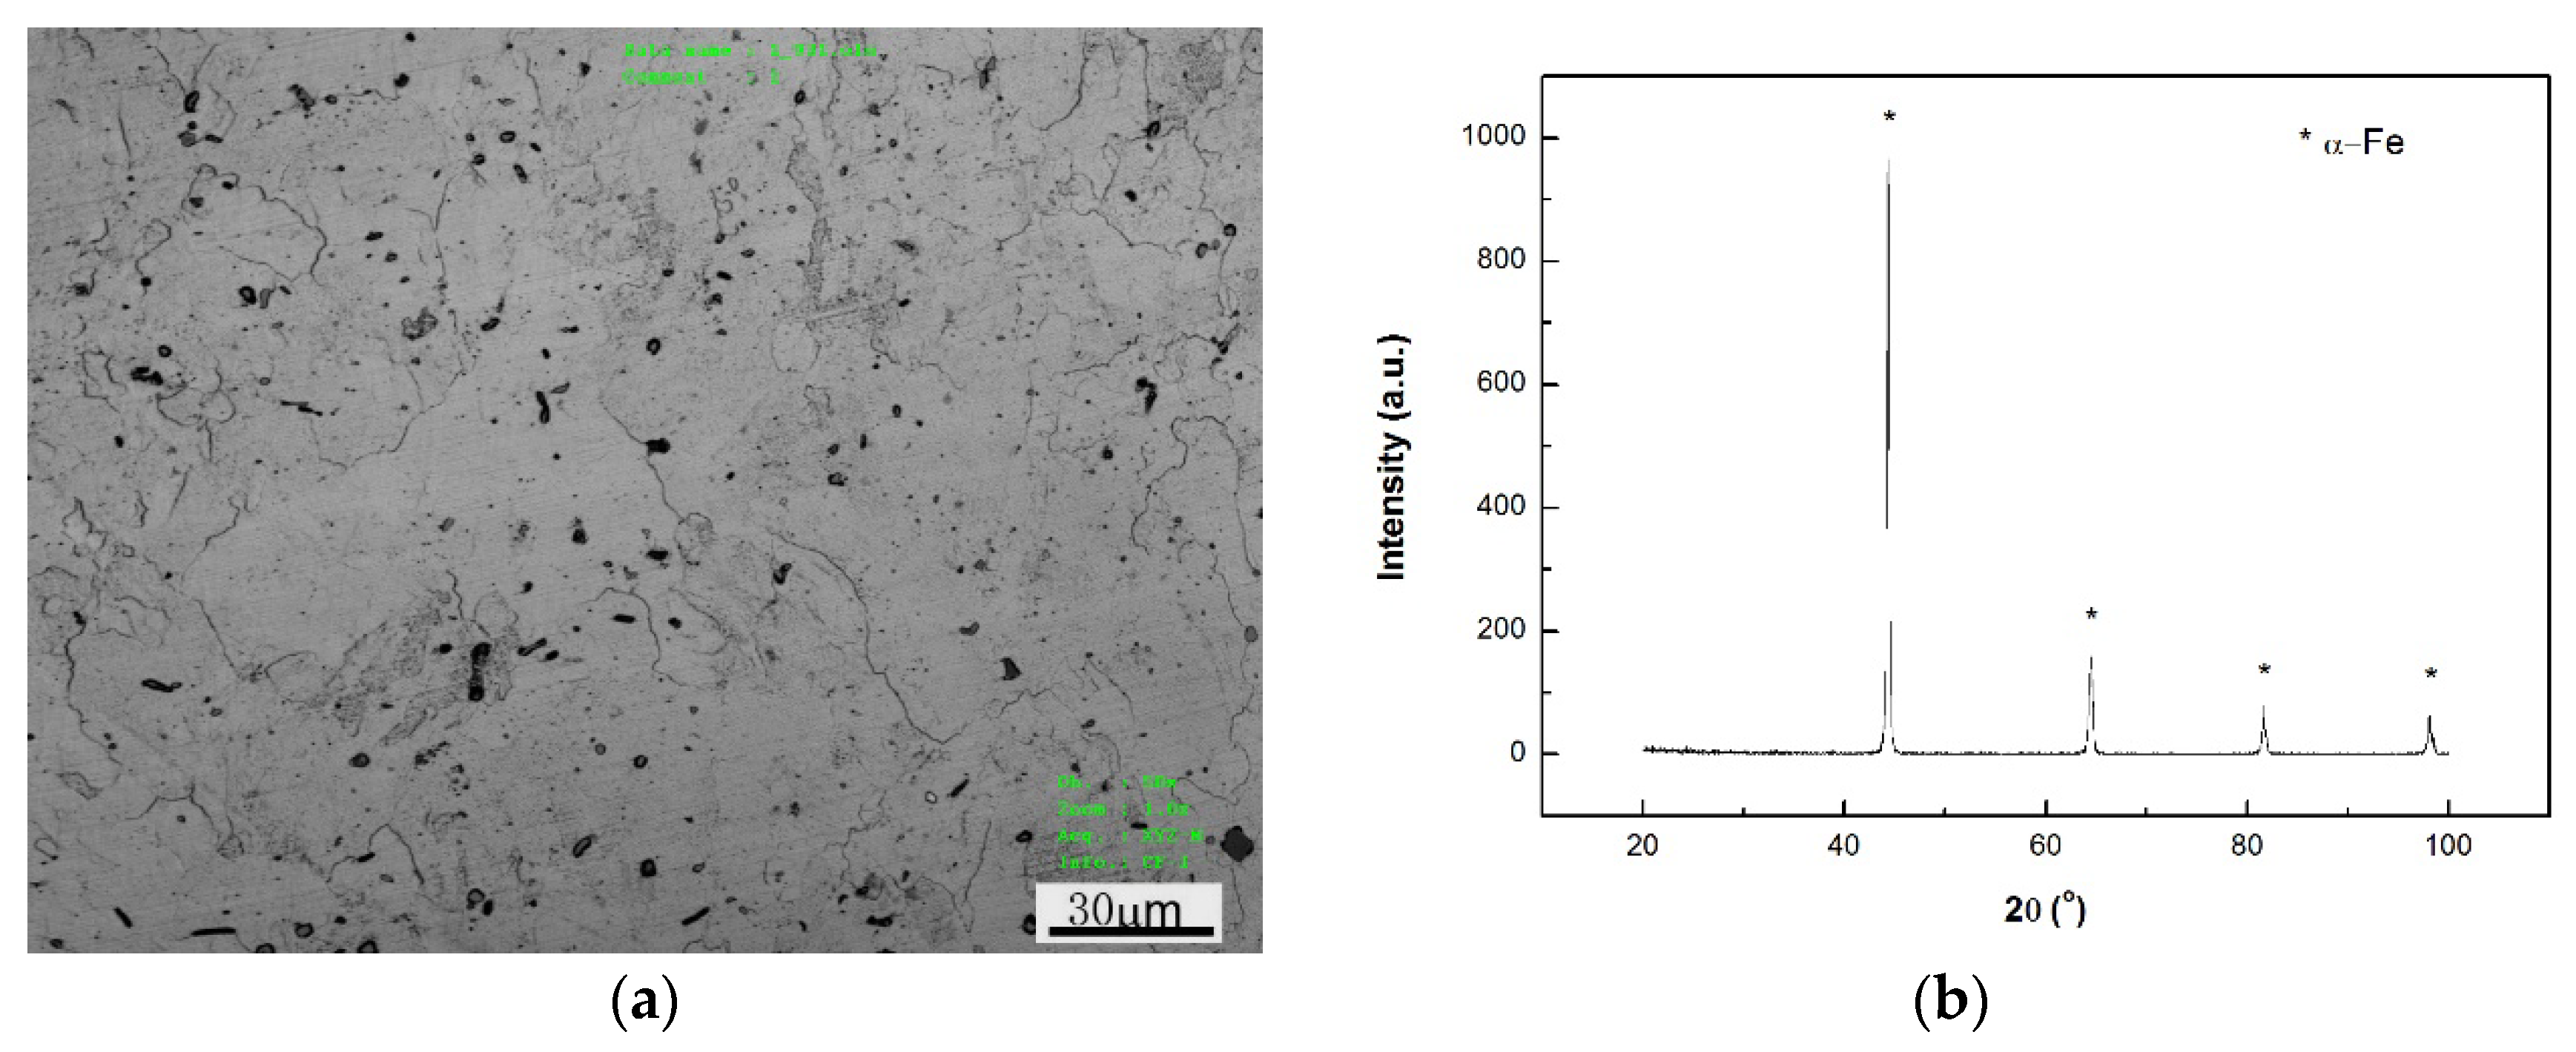
The microstructure of Fe-21.3Cr-3.5Al-0.5Ti-0.4Zr alloy primarily consisted of equiaxed grains with average size of about 21 μm, as shown in Figure 1a. XRD analysis shown in Figure 1b identified only the presence of α-Fe phase. Therefore, Fe-21.3Cr-3.5Al-0.5Ti-0.4Zr steel can be considered as a single-phase alloy.
3.2. Oxidation Behavior
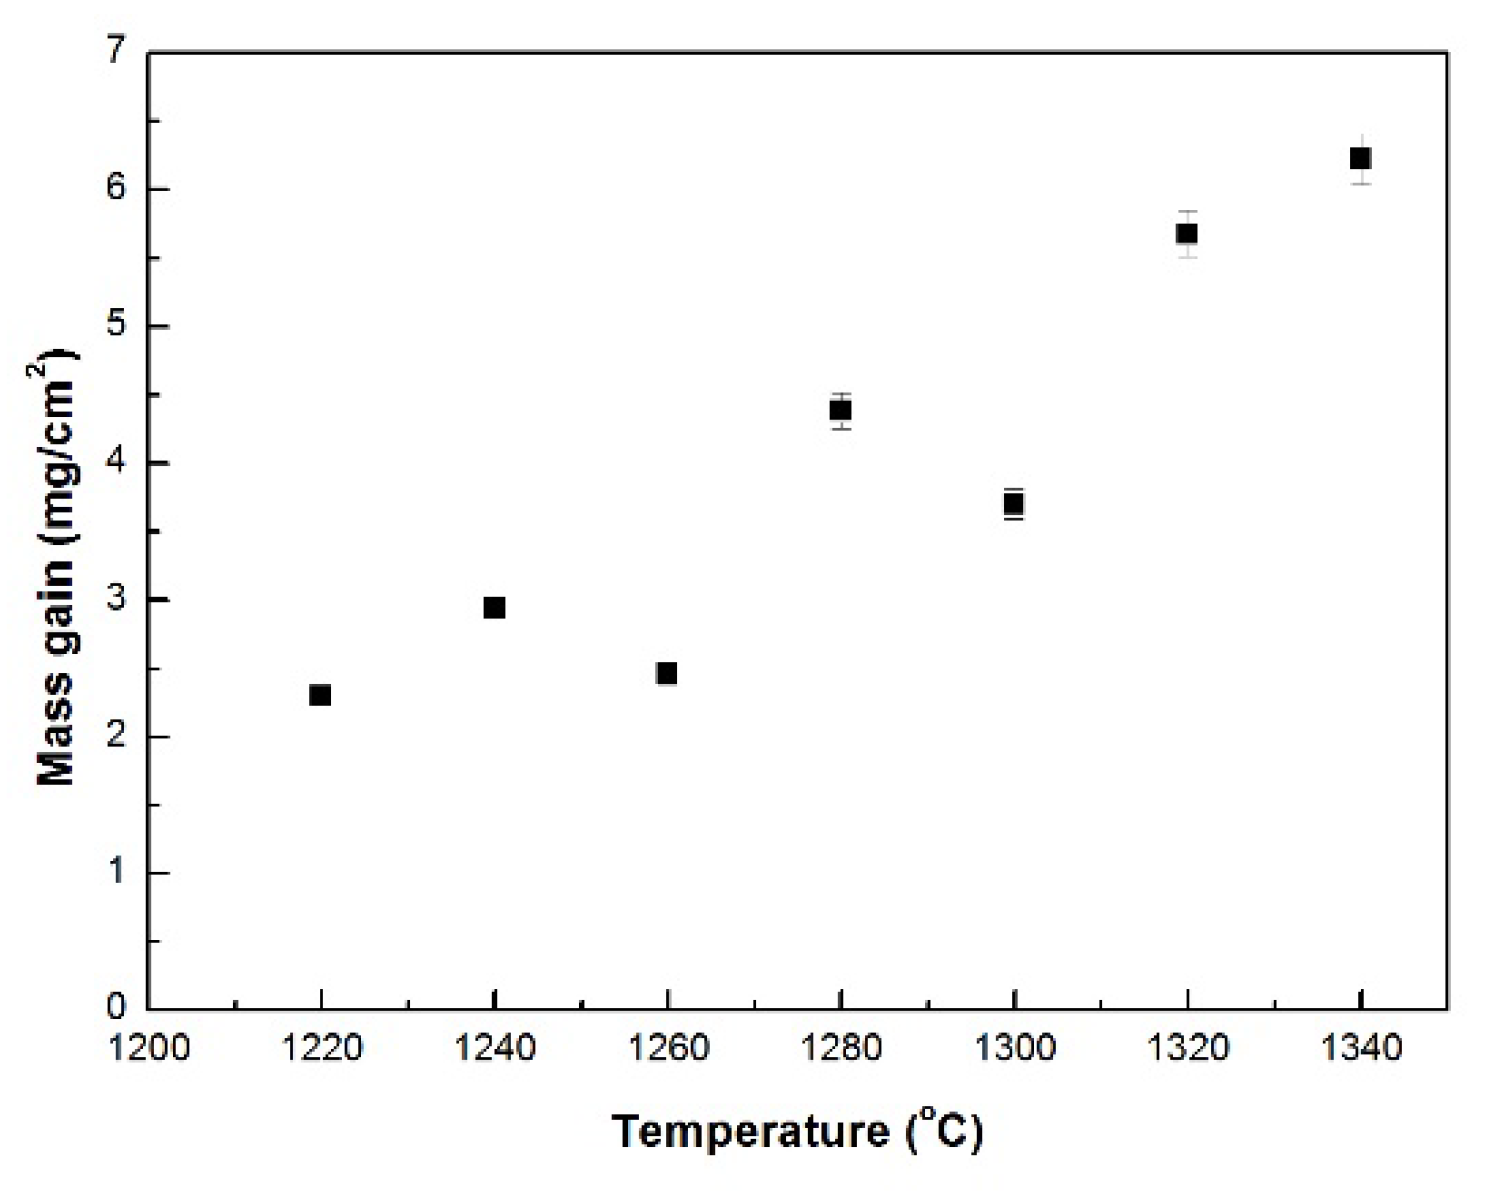
Figure 2 shows the mass gain of Fe-21.3Cr-3.5Al-0.5Ti-0.4Zr steel at temperatures of 1220–1340 °C. The mass gain rose with temperature in general, presenting a three-stage characteristic. The first stage ranged from 1220 to 1260 °C, where the mass gain only increased a little, varying from 2.23 to 2.94 mg/cm2. The second stage ranged from 1280 to 1300 °C, where the mass gain increased moderately and maintained a plateau, varying from 3.70 to 4.38 mg/cm2. The third stage ranged from 1320 to 1340 °C, where the mass gain increased considerably and reached the highest level of 6.22 mg/cm2 at 1340 °C. It is also noted that mass gain decreases a little at 1260 °C after rising at 1240 °C in the first stage, and also decreased slightly at 1300 °C after rising at 1280 °C in second stage.
3.3. Phase Constituents and Morphologies of Oxide Layers
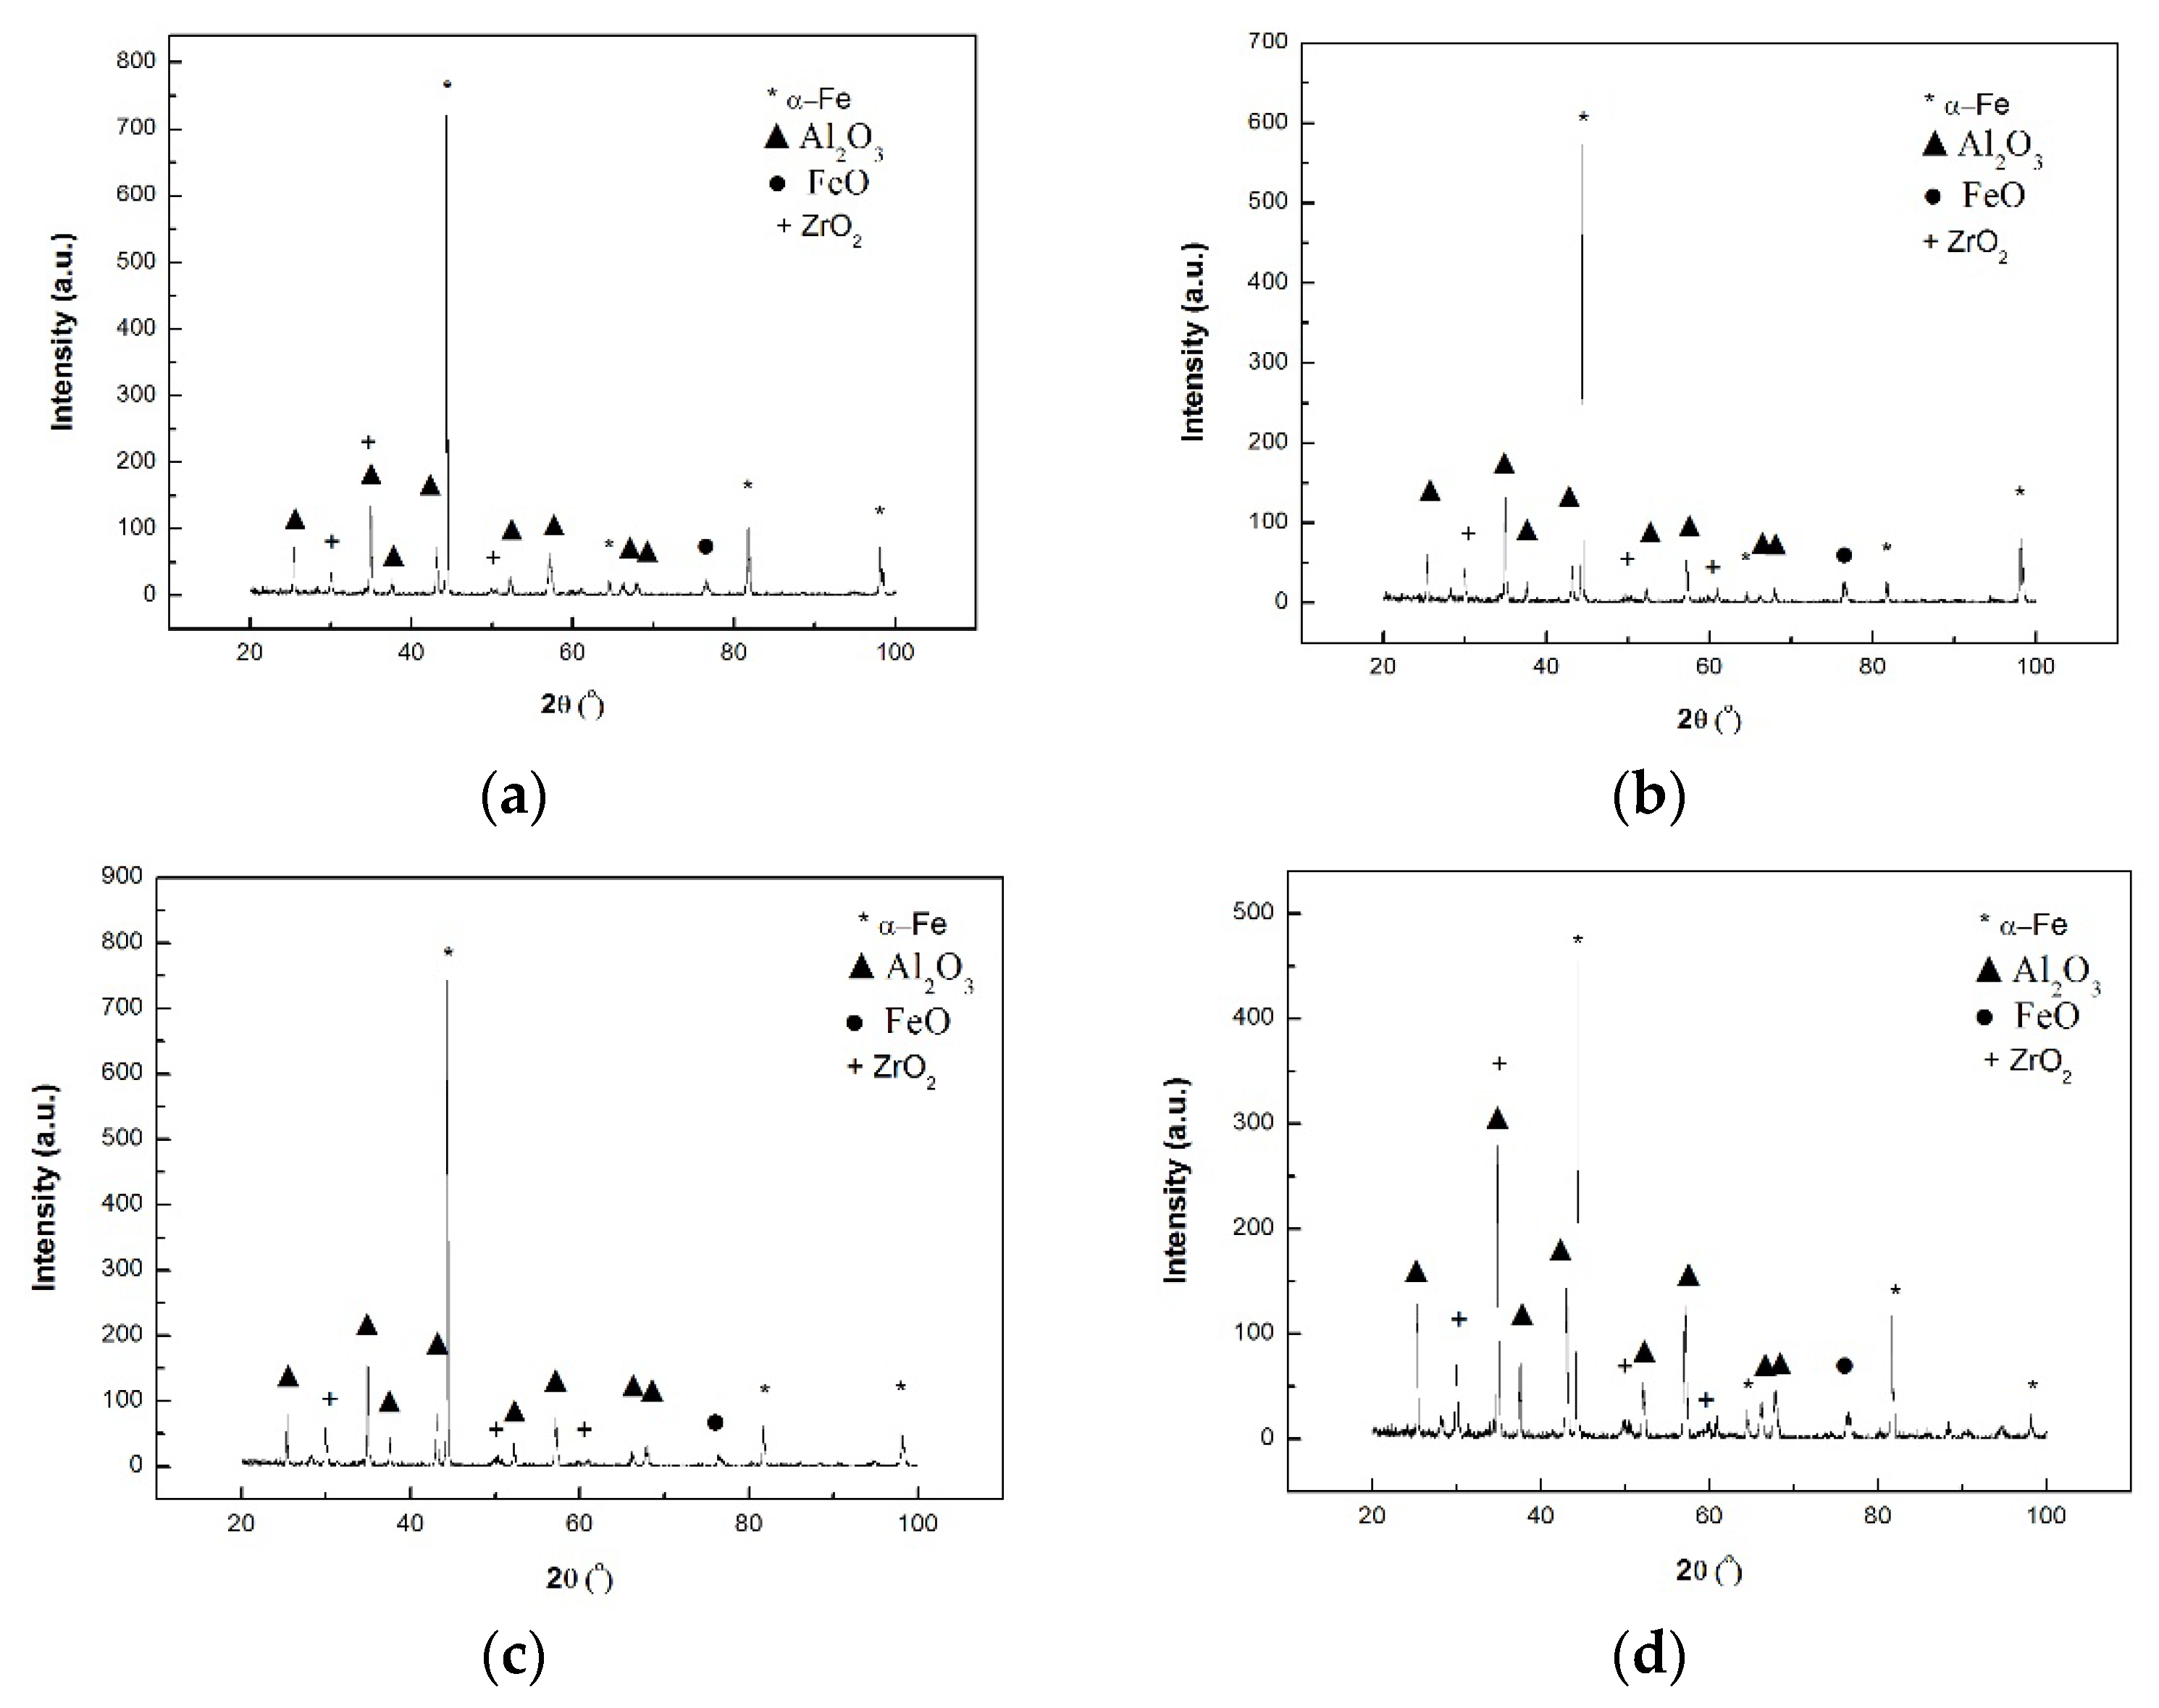
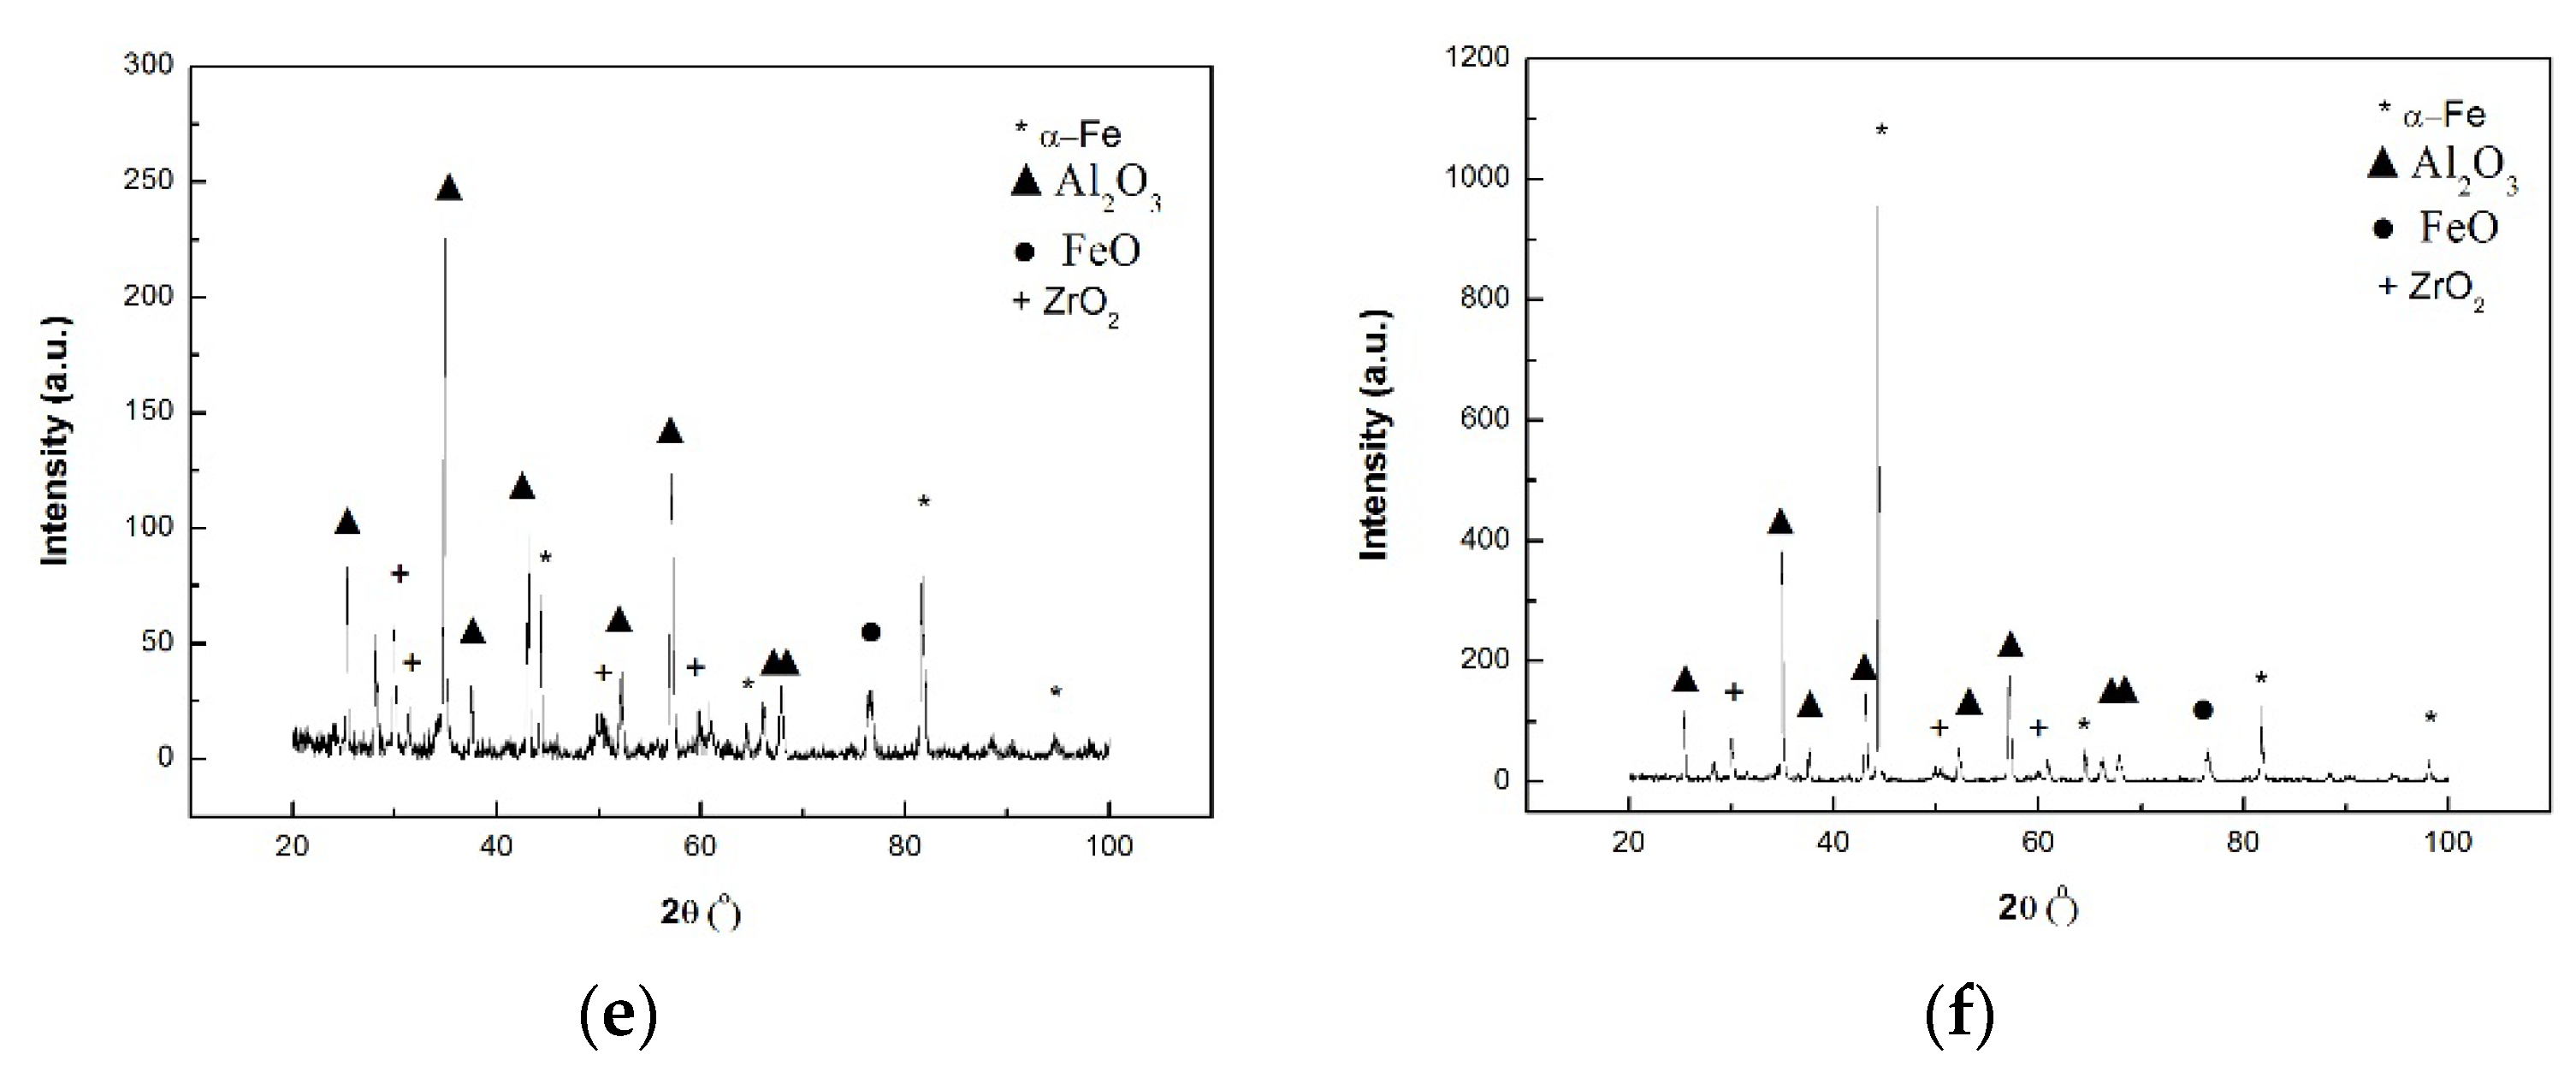
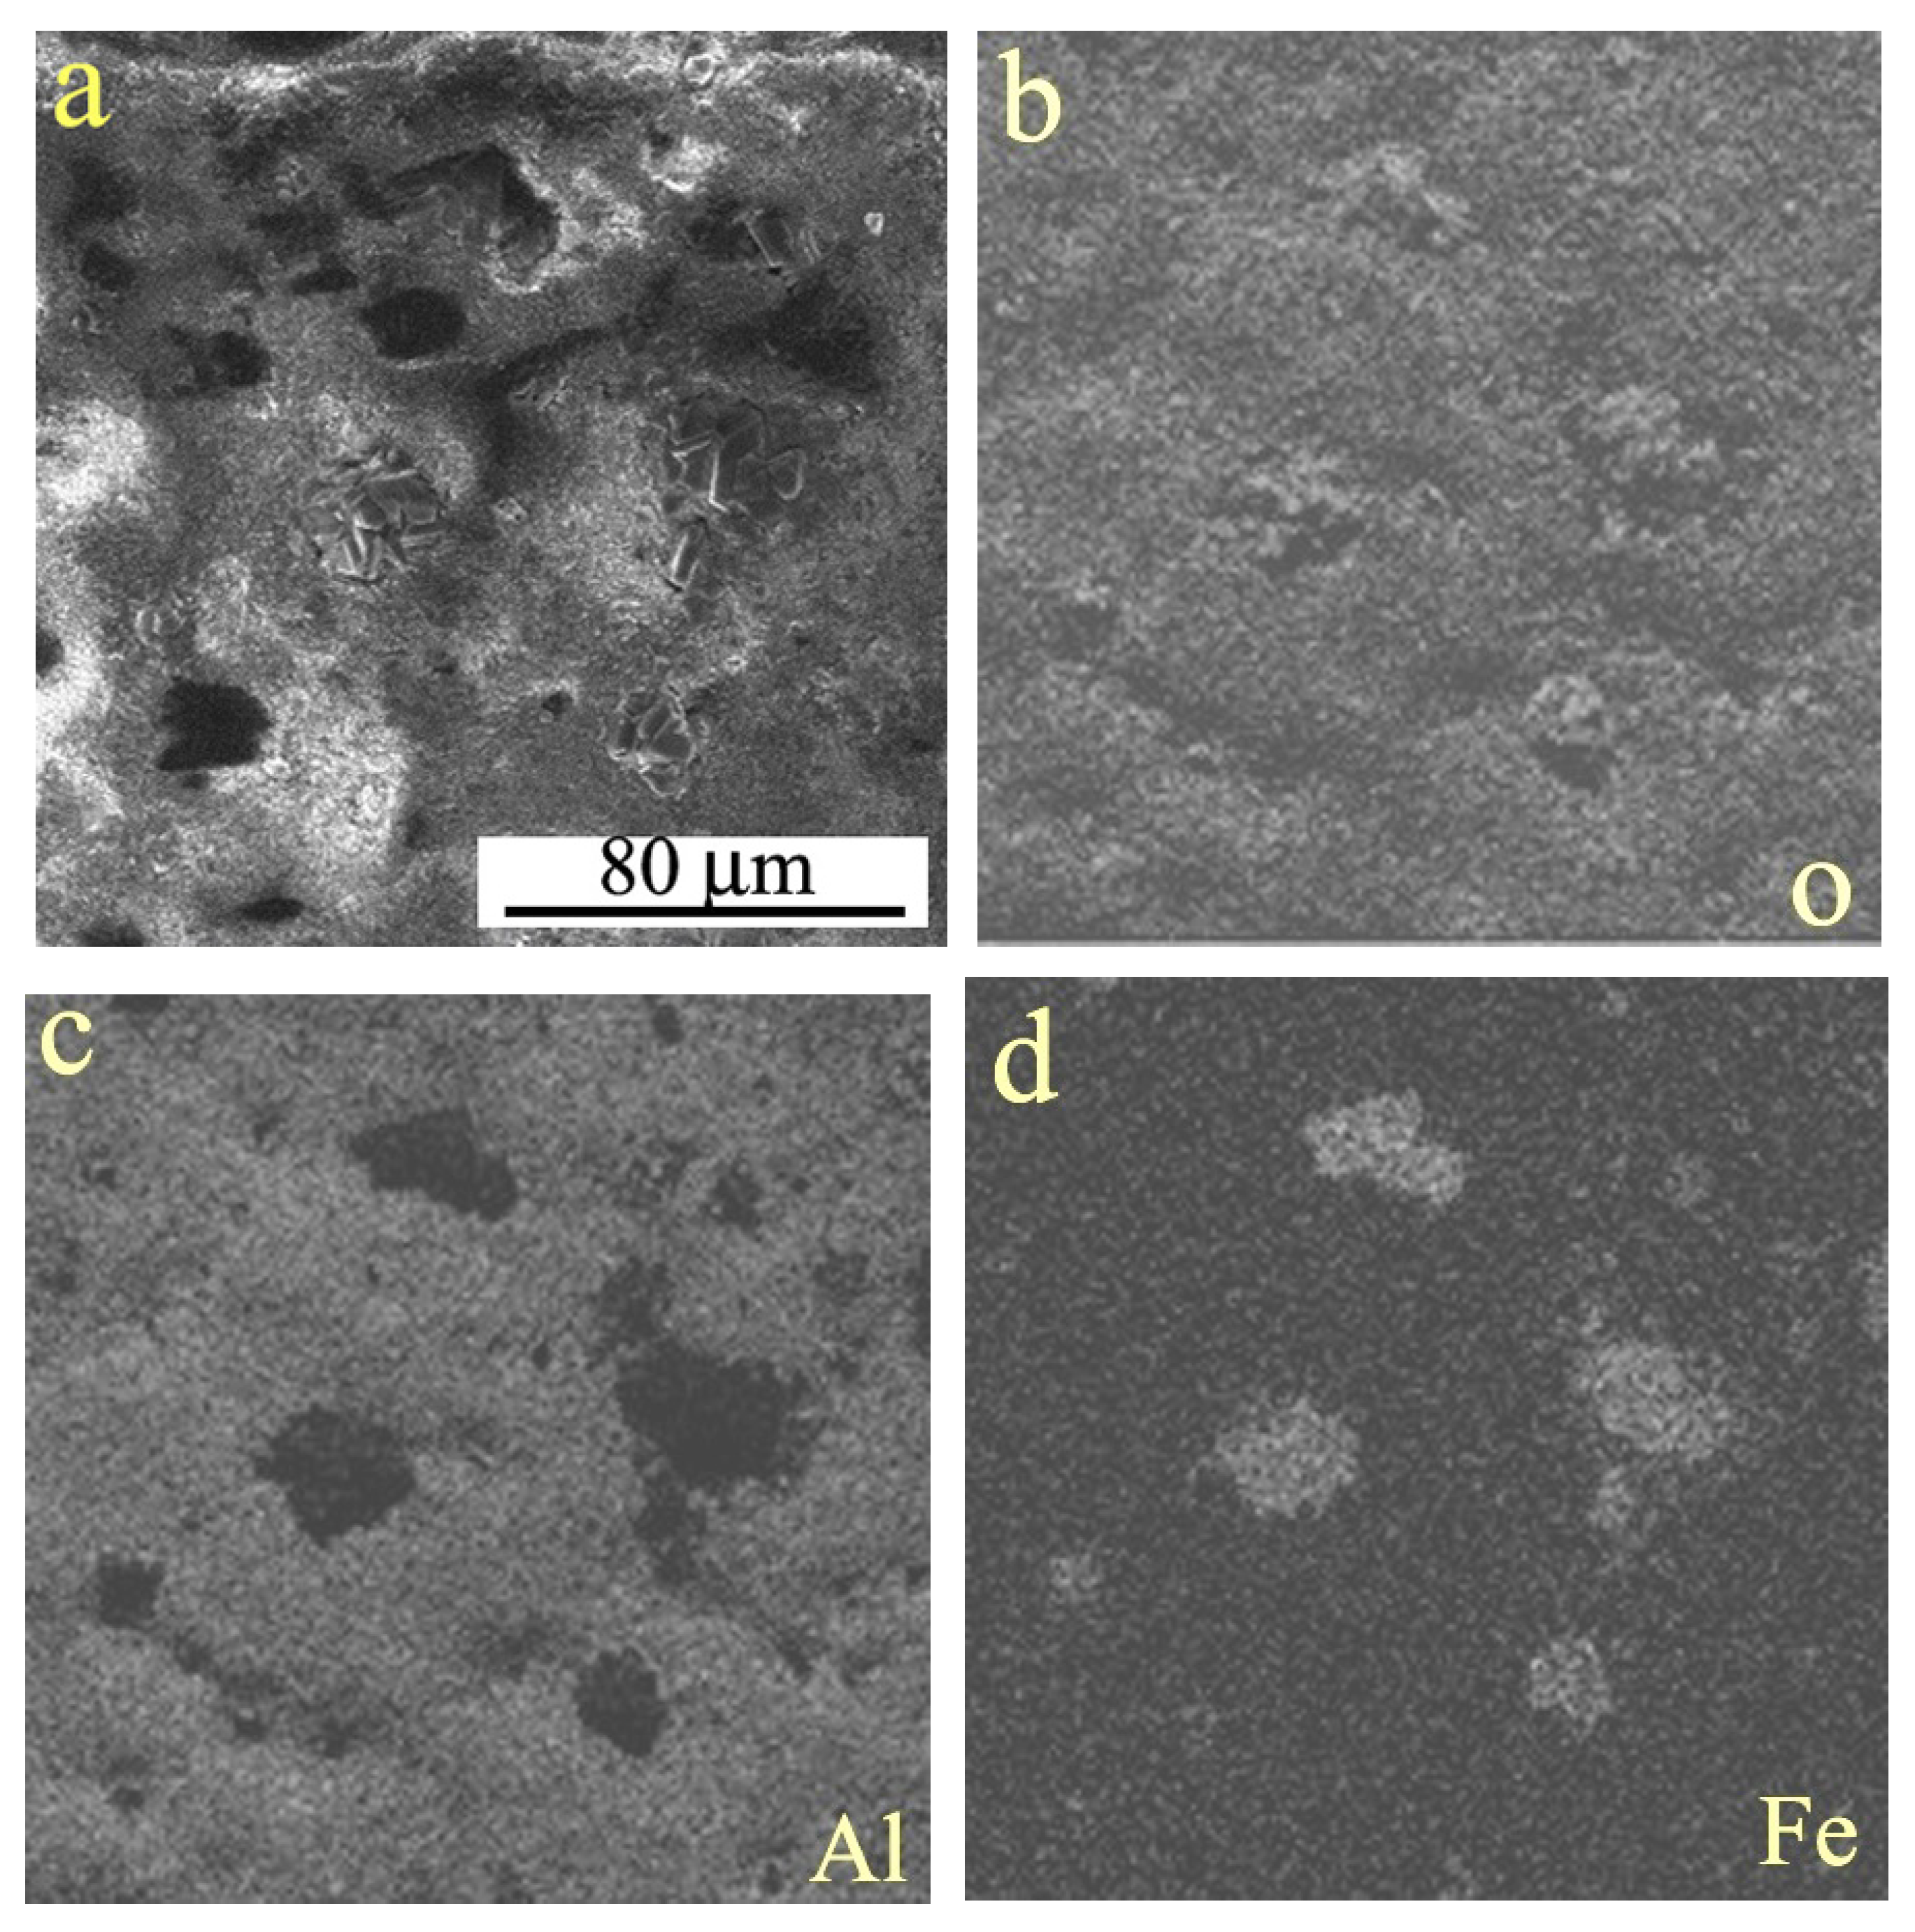
The XRD patterns of oxidation surfaces at various temperatures are shown in Figure 3. At 1220 °C, the XRD peaks of Al2O3 and ZrO2 were observed besides the XRD peaks of α-Fe substrate (Figure 3a). The XRD peaks of ZrO2 presented a quite lower intensity as compared with the peaks of Al2O3. It suggests that the oxide layer mainly consists of Al2O3 phase. At the temperatures of 1240 and 1260 °C, the XRD pattern almost remained unchanged (Figure 3b). This means that the oxide layer varies little in constituent phase amount and thickness. At the temperatures of 1280 and 1300 °C, the intensity of peaks of Al2O3 and ZrO2 started enhancing, especially at 1300 °C (Figure 3c,d). This indicates that the amount of Al2O3 and ZrO2 increases significantly in the oxide layer. At 1320 °C, the peak of Al2O3 at 35° was the highest intensified and surpassed the peaks of other phases such as α-Fe substrate and ZrO2 (Figure 3e), suggesting that Al2O3 grew rapidly and the oxide layer considerably thickened. However, at 1340 °C, it was found that the peak of α-Fe at 44.38° suddenly increased again (Figure 3f). It is thought to be due to formation of incompact blocks of magnetite phase (containing Fe, Fe2O, and Fe3O4) in the oxide layer, which was later observed from elemental mappings of the oxidized surface. The surface morphologies after oxidation at different temperatures are shown in Figure 4. The EDS chemical compositions of oxidation surfaces at different temperatures are listed in Table 2. At temperatures of 1220–1260 °C, the oxide layer mainly consisted of fine equiaxed grains (Figure 4a,b). EDS analysis revealed that the content of Al element ranged from 41.28% to 42.7%, and the content of O element ranged from 47.89% to 48.13.7%. It indicates that surface oxide layers are mainly composed of Al2O3 grains. In addition, at 1220 °C, a few large particles were found to be formed on the surface, which was identified as particles containing Zr and P elements by EDS elemental mapping. This type of particles decreased in amount with increasing temperature, and almost disappeared at 1260 °C, which may be responsible for a little decrease of mass gain at 1260 °C. At temperatures of 1280 and 1300 °C, the size of grains increased (observed from microphotograph at 4800× magnification, not shown here), and the oxide layers were more compact and more uniform in thickness as compared with the oxide layers formed at 1220 and 1260 °C (Figure 4c,d). It is found that at 1300 °C, the content of oxygen increased to a relatively high level of 48.70%, and content of zirconium element also reached as high as 6.58%, meanwhile the content of aluminum element decreased a little to 40.30%, and the content of iron element decreased to a low level of 2.27%. The more ZrO2 formed in the oxide layer could enhance the density, accordingly resulting in a little decrease of mass gain at 1300 °C. At temperatures of 1320 and 1340 °C, the grains grew significantly (Figure 4e,f). Meanwhile, the content of zirconium increased to a high level of 7.75–8.73%, suggesting formation of more fine ZrO2 particles in the oxide layer. At 1340 °C, a few oxide polygonal particles grew abnormally at localized areas, which resulted in interstices at those localized areas. These particles were found to be rich in iron and oxygen elements by the elemental mappings, as shown in Figure 5. Therefore, these particles were identified to be magnetite as observed in XRD analysis result. Furthermore, because the polygonal magnetite blocks formed on the surface at 1340 °C resulted in interstices at localized area of the surface, the XRD analysis result in Figure 3f shows a high peak of α-Fe substrate at 44° again.
3.4. Cross-Sectional Structures of Oxide Layers
The cross-sectional structures of oxide layers formed at different temperatures were examined using SEM and EDS techniques. Since the oxide layers were not uniform in thickness, the minimum, maximum, and average thicknesses of oxide layers in field of view were measured by means of SEM observation as well as elemental mappings of O, Al, Cr, Zr, and Fe, as listed in Table 3. It was found that at 1220 °C and 1240 °C, the oxide layers were quite uneven in thickness, the minimum and maximum thicknesses were 1.81 μm and 15.45 μm at 1220 °C, and 0.91 μm and 9.09 μm at 1240 °C, respectively. With increasing temperature to high temperature such as 1260 °C and 1280 °C, the difference between the maximum and minimum thickness decreased, and the average thickness increase to a range of 5.55–7.27 μm. At a temperature of 1300 °C, the oxide layer was uniform in thickness, but the average thickness decreased to about 6.46 μm. As temperature was increased to the highest level of 1320–1340 °C, the average thickness increased again, however, the difference between the maximum and minimum thickness increased again.
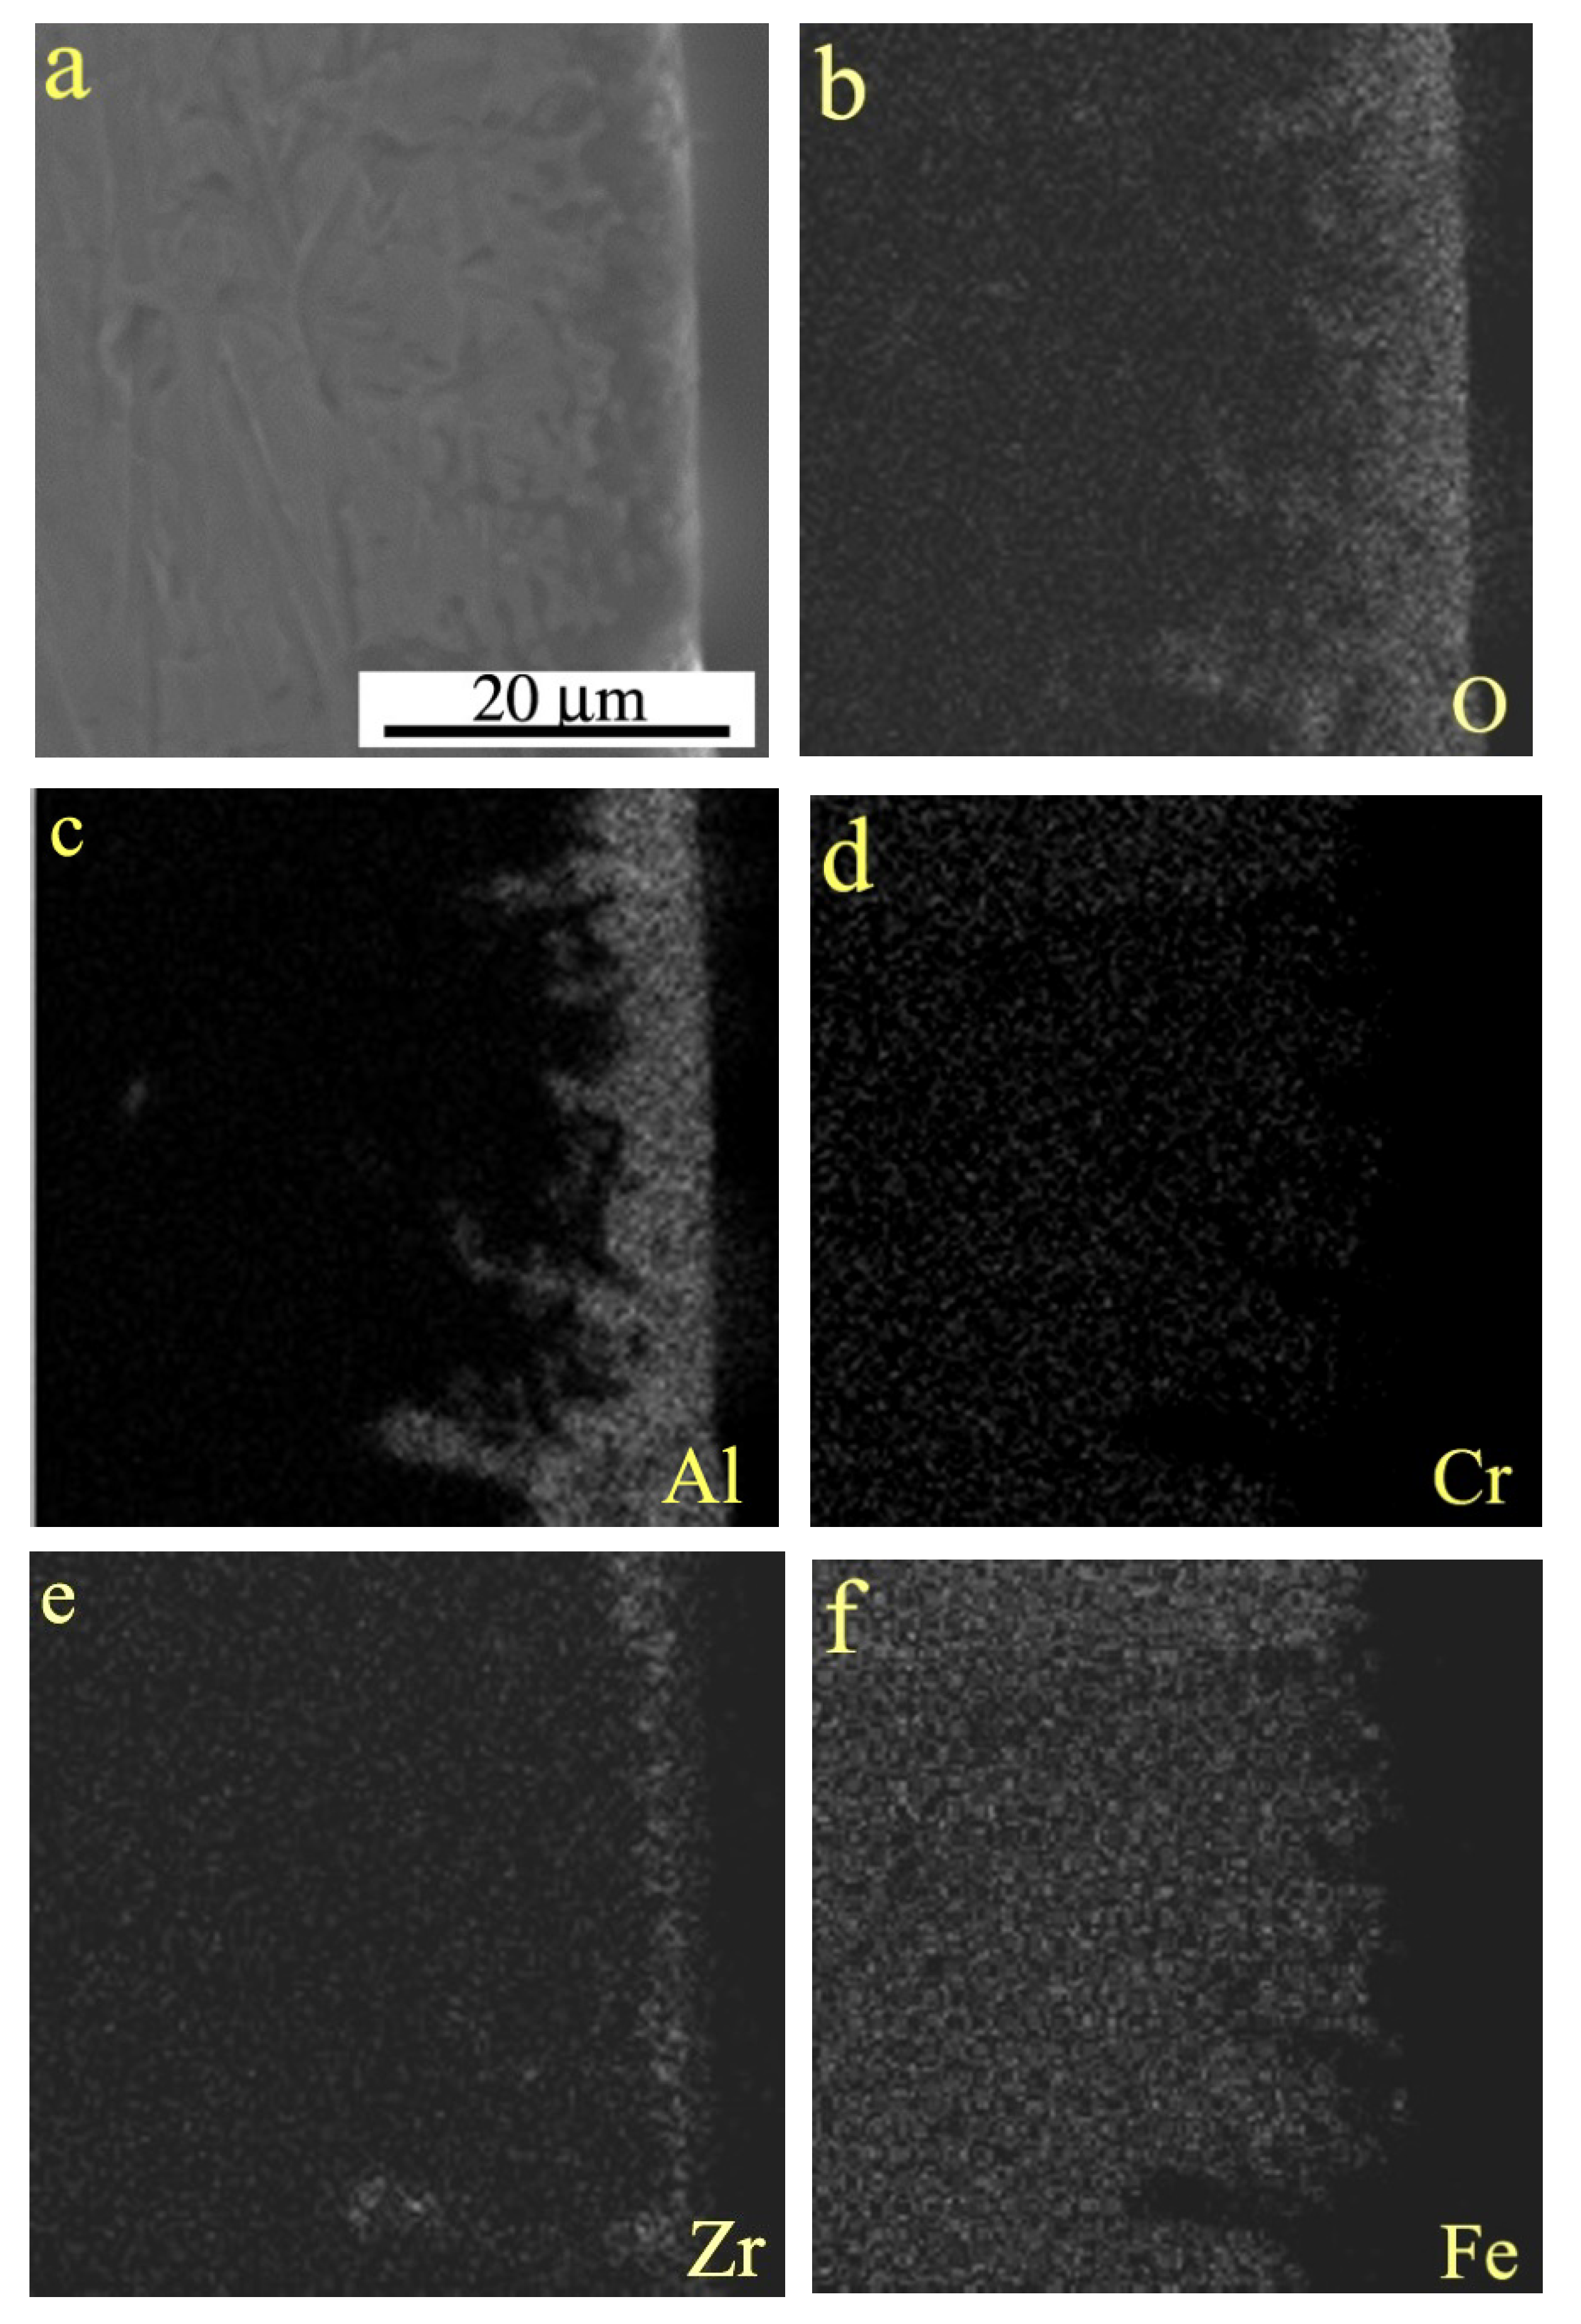
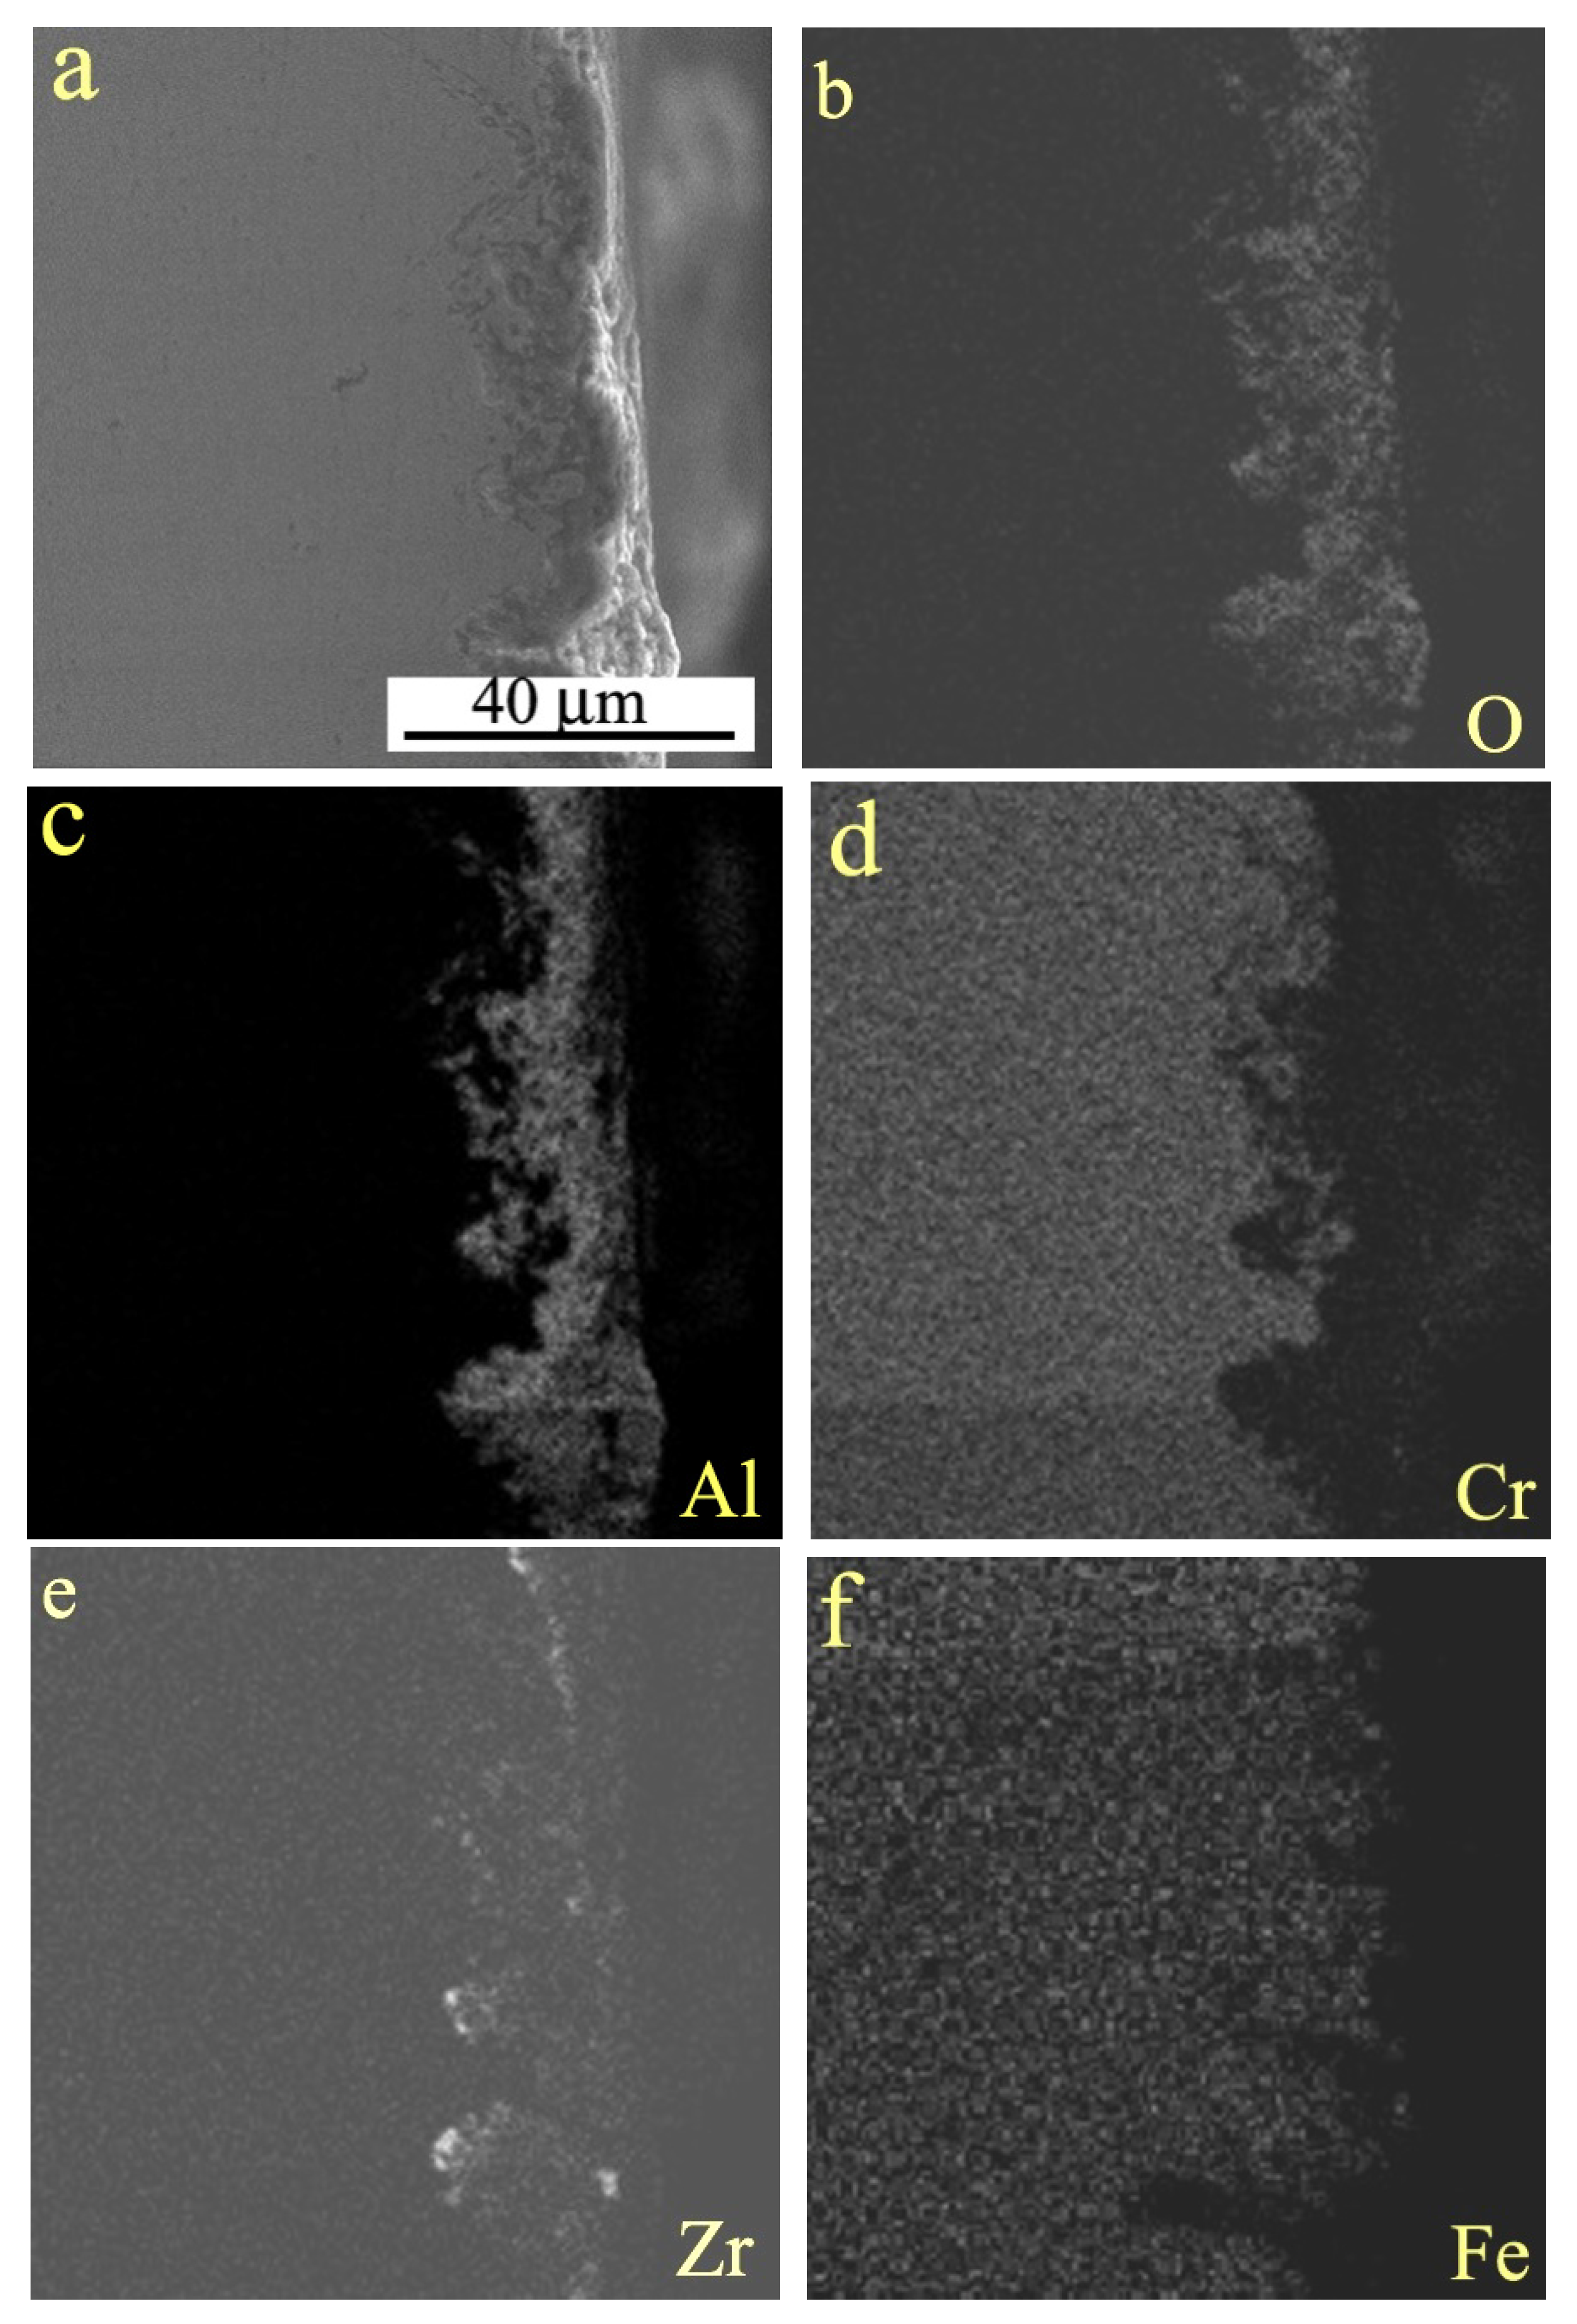
The cross-sectional microstructure observation and elemental mapping analysis of the oxide layer revealed that at 1220 and 1240 °C, the oxide layers primarily consisted of Al2O3, since the oxygen elemental mapping of the oxide layer agreed well with the aluminum elemental mapping. When temperature was increased to 1260 °C, the cross-sectional structure of oxide layer was improved, namely the oxide layer appeared to be even in thickness although the average thickness was not increased significantly. In addition, it was found that the outmost part of oxide layer was rich in Zr element, as shown in Figure 6. At 1280 °C, the thickness of oxide layer was further increased, and Zr element was uniformly distributed in almost entire oxide layer, as shown in Figure 7. At 1300 °C, the structure of oxide layer was similar to that at 1280 °C, but the average thickness of the oxide layer decreased a little. However, at high temperature of 1320 and 1340 °C, the density of the oxide layer decreased, there are porosity formed in the top part of oxide layer. Therefore, the oxide layer at 1280 °C is considered to be good in terms of thickness distribution, microstructure density, and distribution of phase constituents.
3.5. Hardness and Wear Performance of Oxide Layers
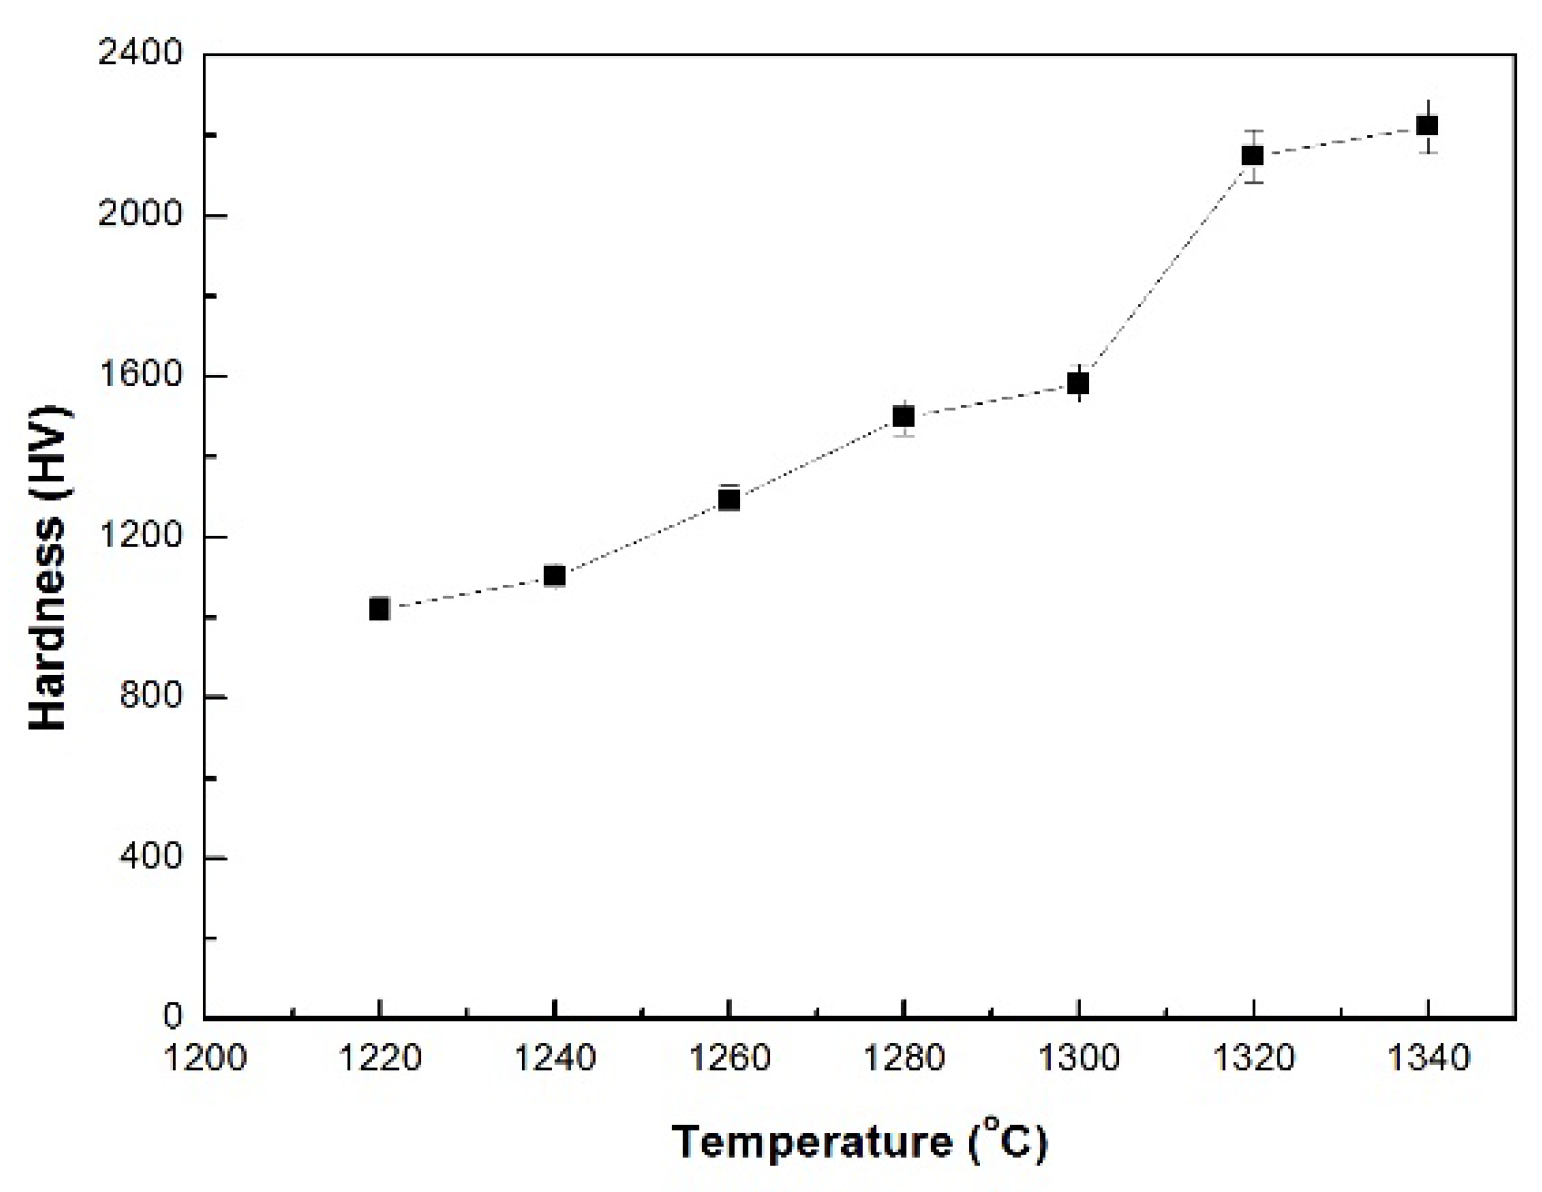
The hardness of oxide layers formed at different temperatures was measured using the load of 100 g for dwell time of 20 s on a microhardness tester, as shown in Figure 8. The surface hardness increased with increasing oxidation temperature. The reason could be mainly due to the following factors: firstly, the increase of oxides amount in the oxide layer since the content oxygen element increases from 47.95% at 1220 °C to 49.85% at 1340 °C. Secondly, the average thickness of oxide layer increasing with temperature. Thirdly, an increasing amount of fine ZrO2 particles was formed in the oxide layer since a high content of zirconium of 7.75–8.73% was detected at 1320 and 1340 °C.
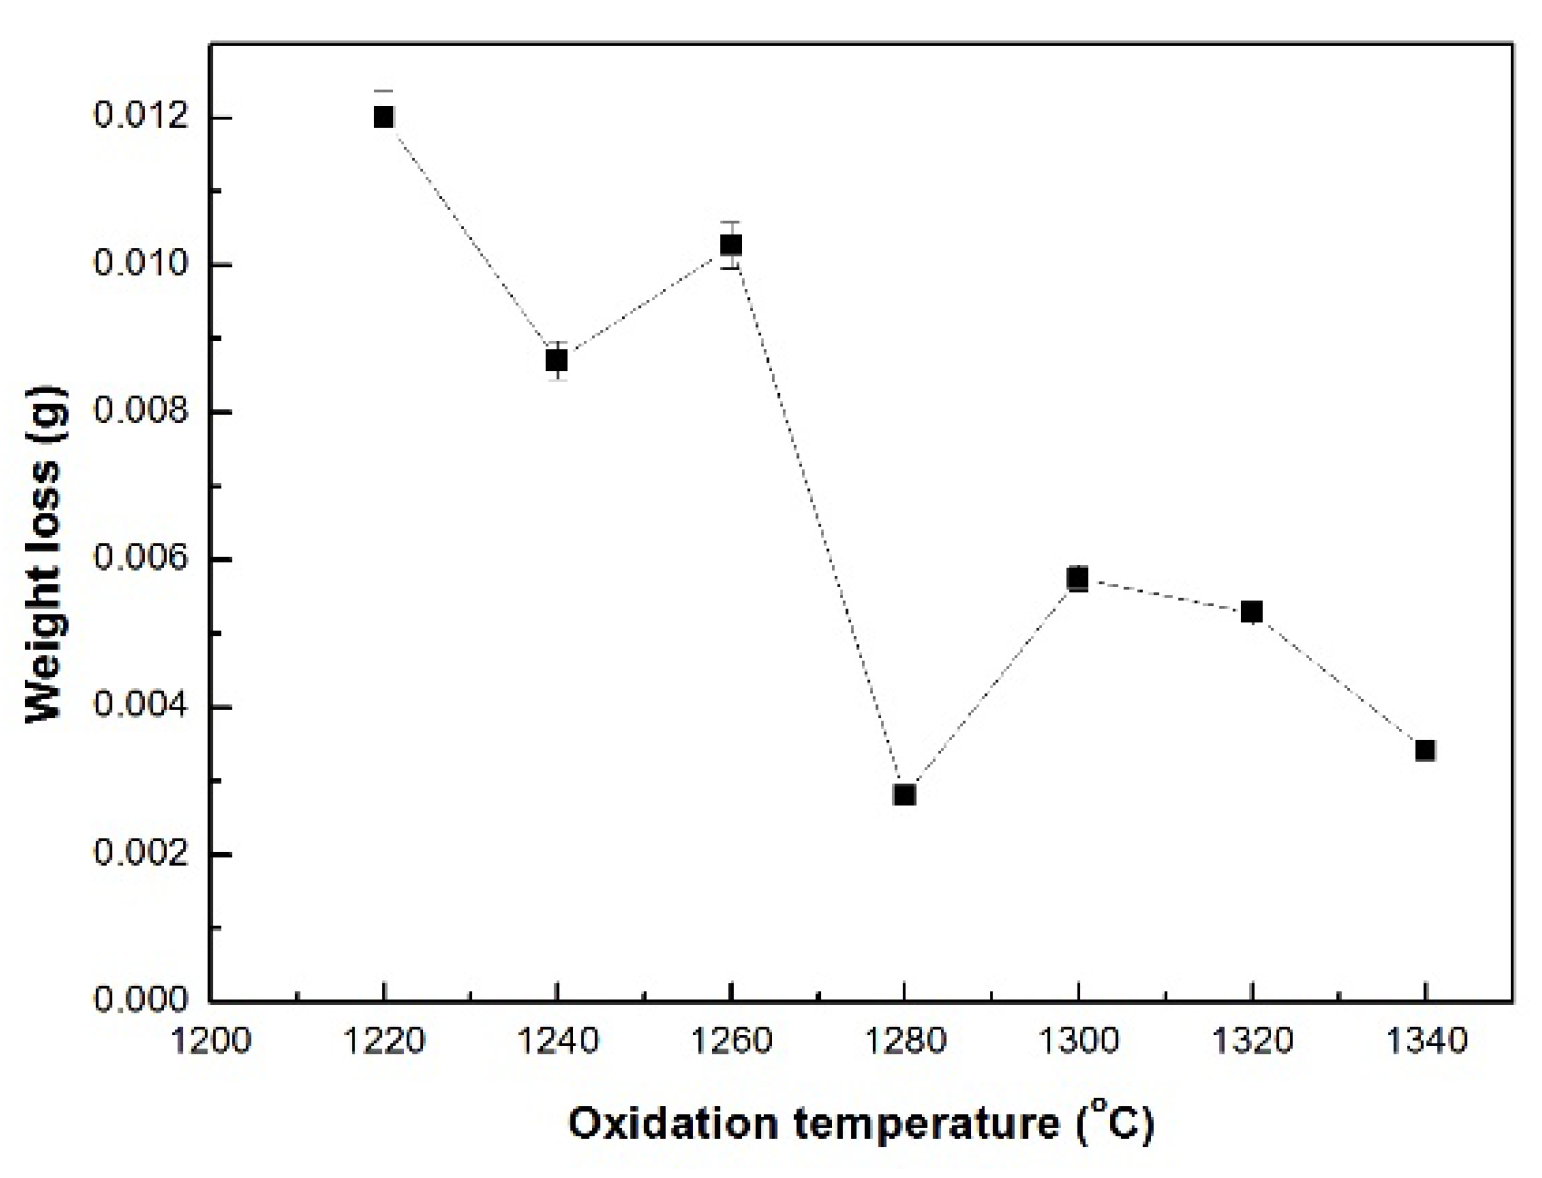
The wear weight loss of samples oxidized at different temperatures was measured and plotted against oxidation temperature, as shown in Figure 9. It can be seen that the weight loss is rather high at temperatures of 1220–1260 °C, then it decreases significantly to the minimum at 1280 °C, and finally rises again at 1300 °C before a slight decrease within the temperature range of 1320 to 1340 °C.
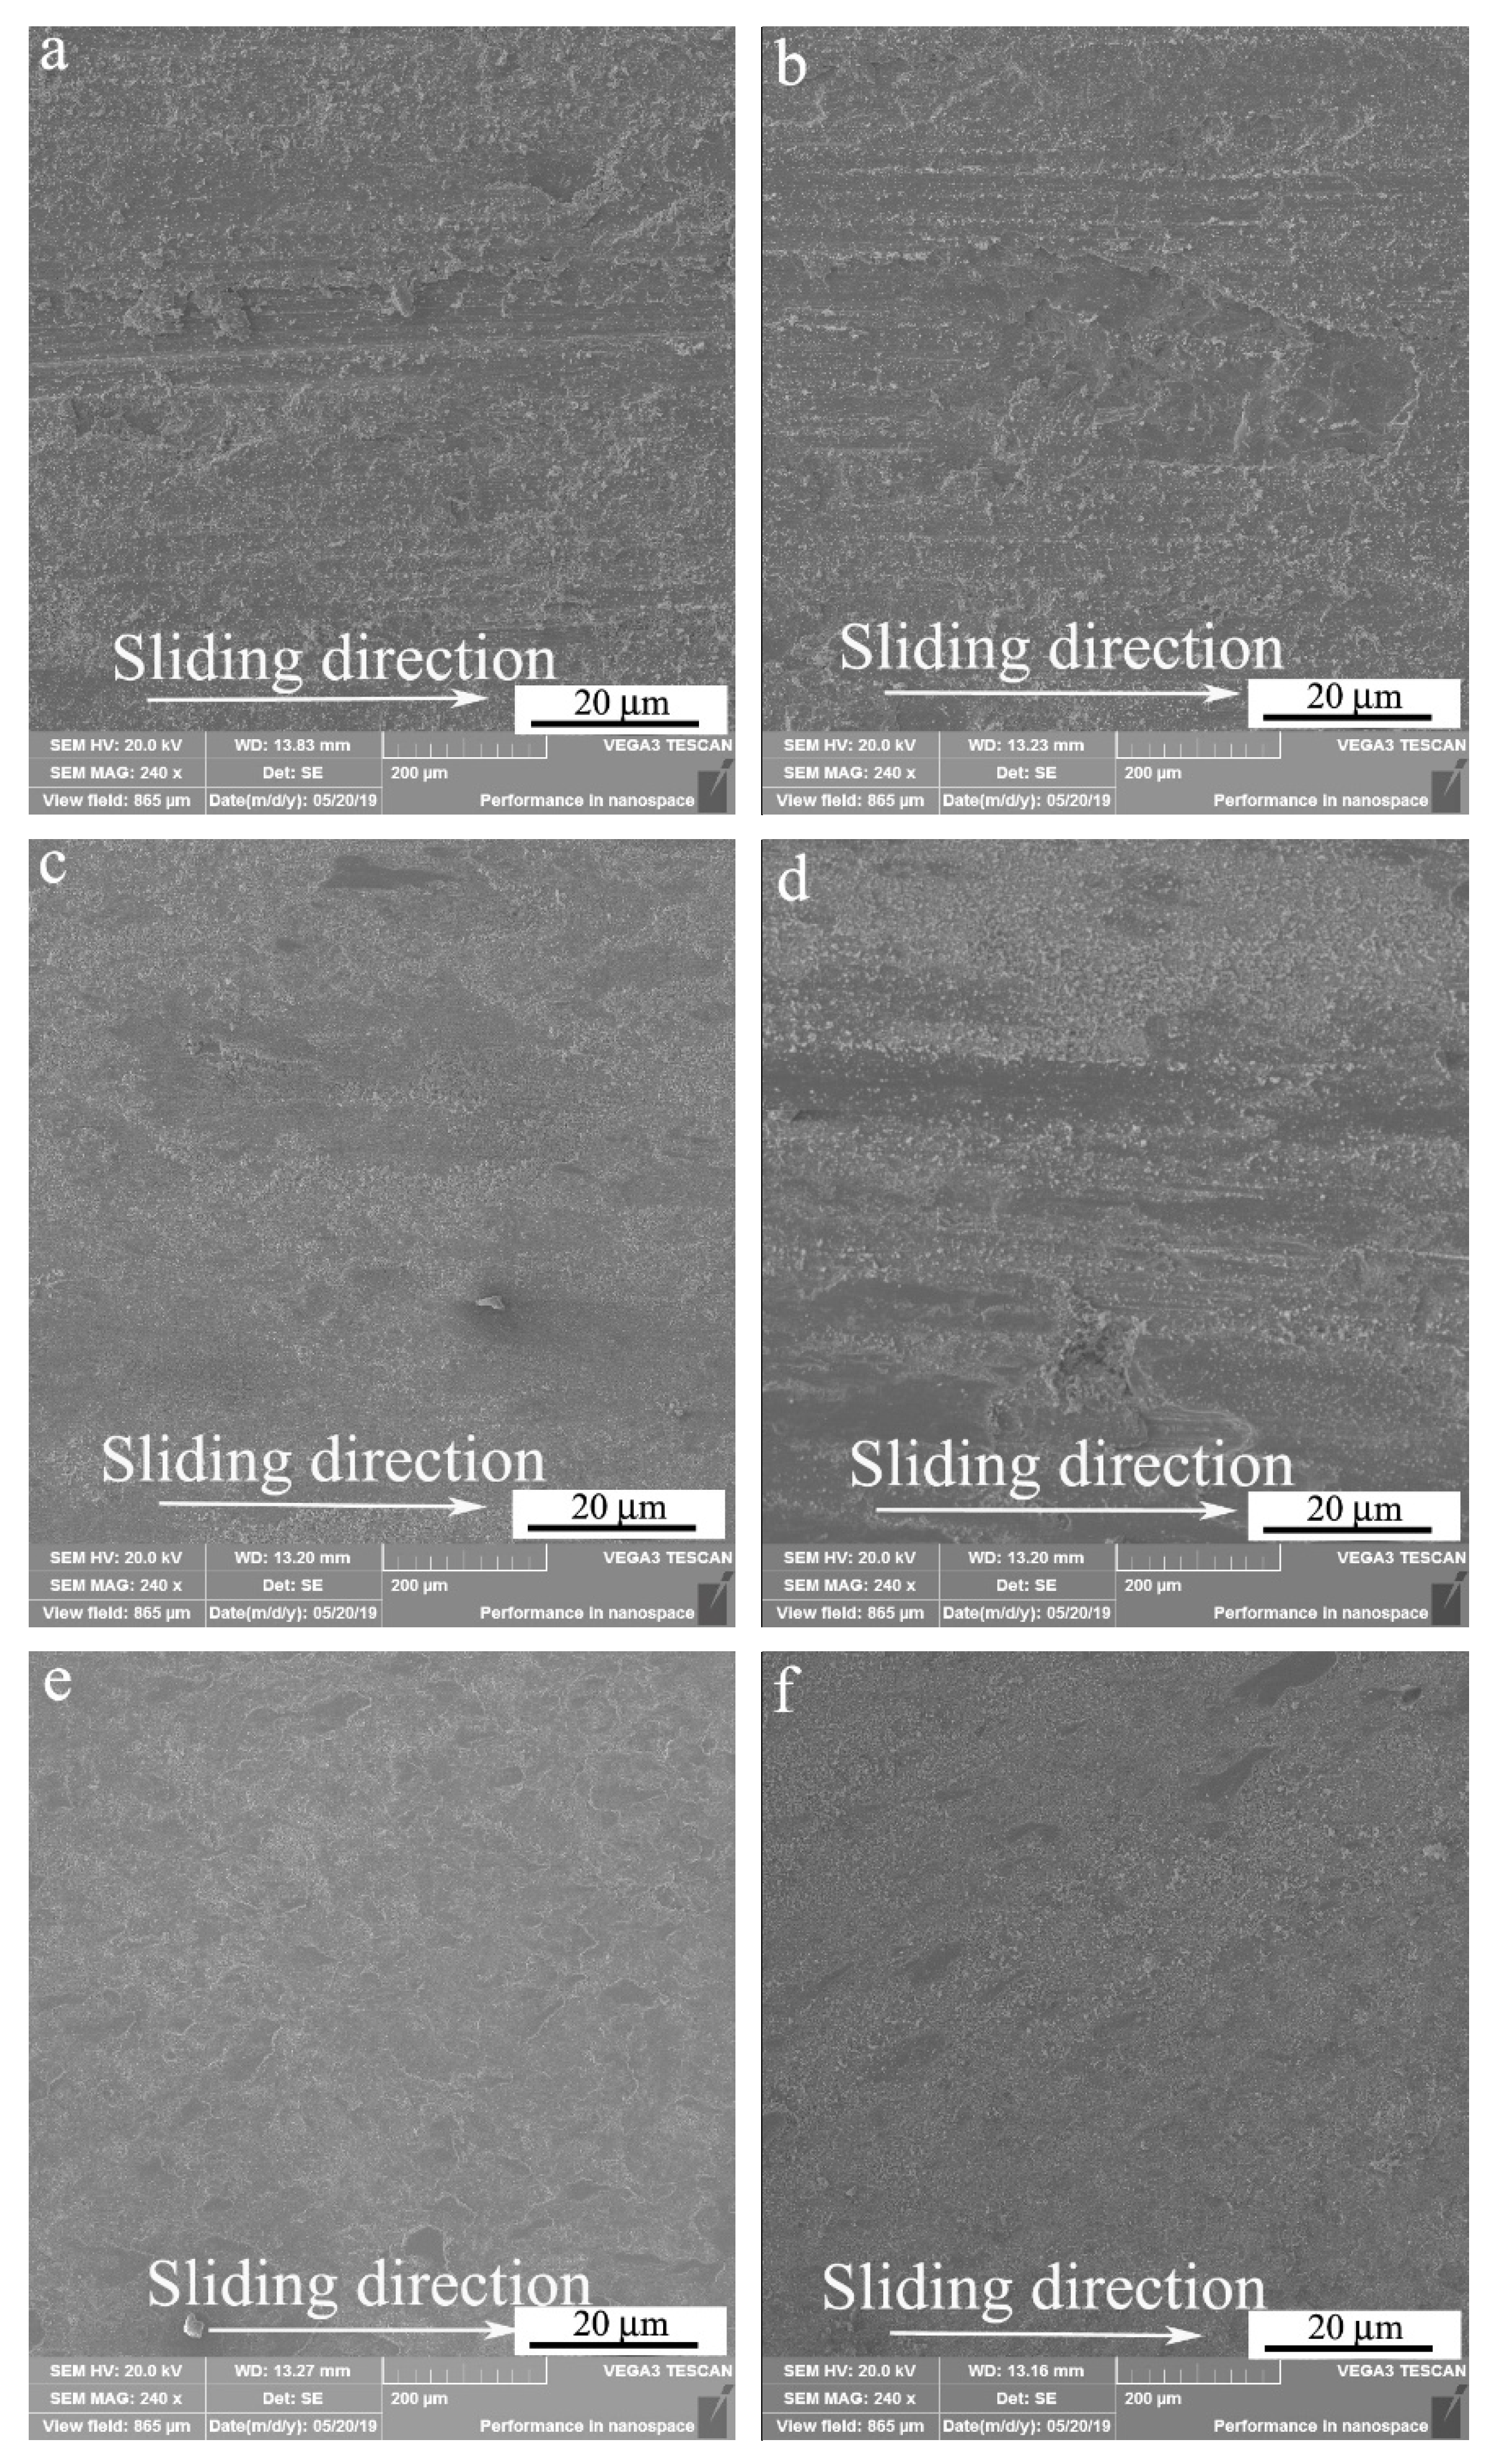
SEM microphotographs of worn surface morphologies of samples oxidized at different temperatures are shown in Figure 10. At 1240 °C, the oxide layer was almost worn off from the surface, and several small pieces of layers were found around the grooves (Figure 10a). The content of oxygen element was only 8.90% on the worn surface. Apparently, breakage and spallation of oxide layer and abrasion were the wear mechanisms. These wear features were also presented on the worn surface at 1260 °C (Figure 10b), and the oxide layer was essentially worn off form the surface. The content of oxygen element on the worn surface was 8.67%. At 1280 °C, the oxide layer was not worn through, and the features of grooves and spallation were absent (Figure 10c). Meanwhile, the content of the O element remained as high as 30.65% on the worn surface, suggesting that the oxide layer represent a good wear performance. However, at 1300 °C, part of oxide layer was worn through at localized area, and a few severe scratches were present on the worn surface (Figure 10d). Meanwhile, the content of oxygen decreased to 20.77% on the worn surface. At 1320 °C, surface damage extent was slight as compared with that at 1300 °C, but there still were some spallations of the oxide layer (Figure 10e). At 1340 °C, the worn surface was smooth and surface damage was slight (Figure 10f).
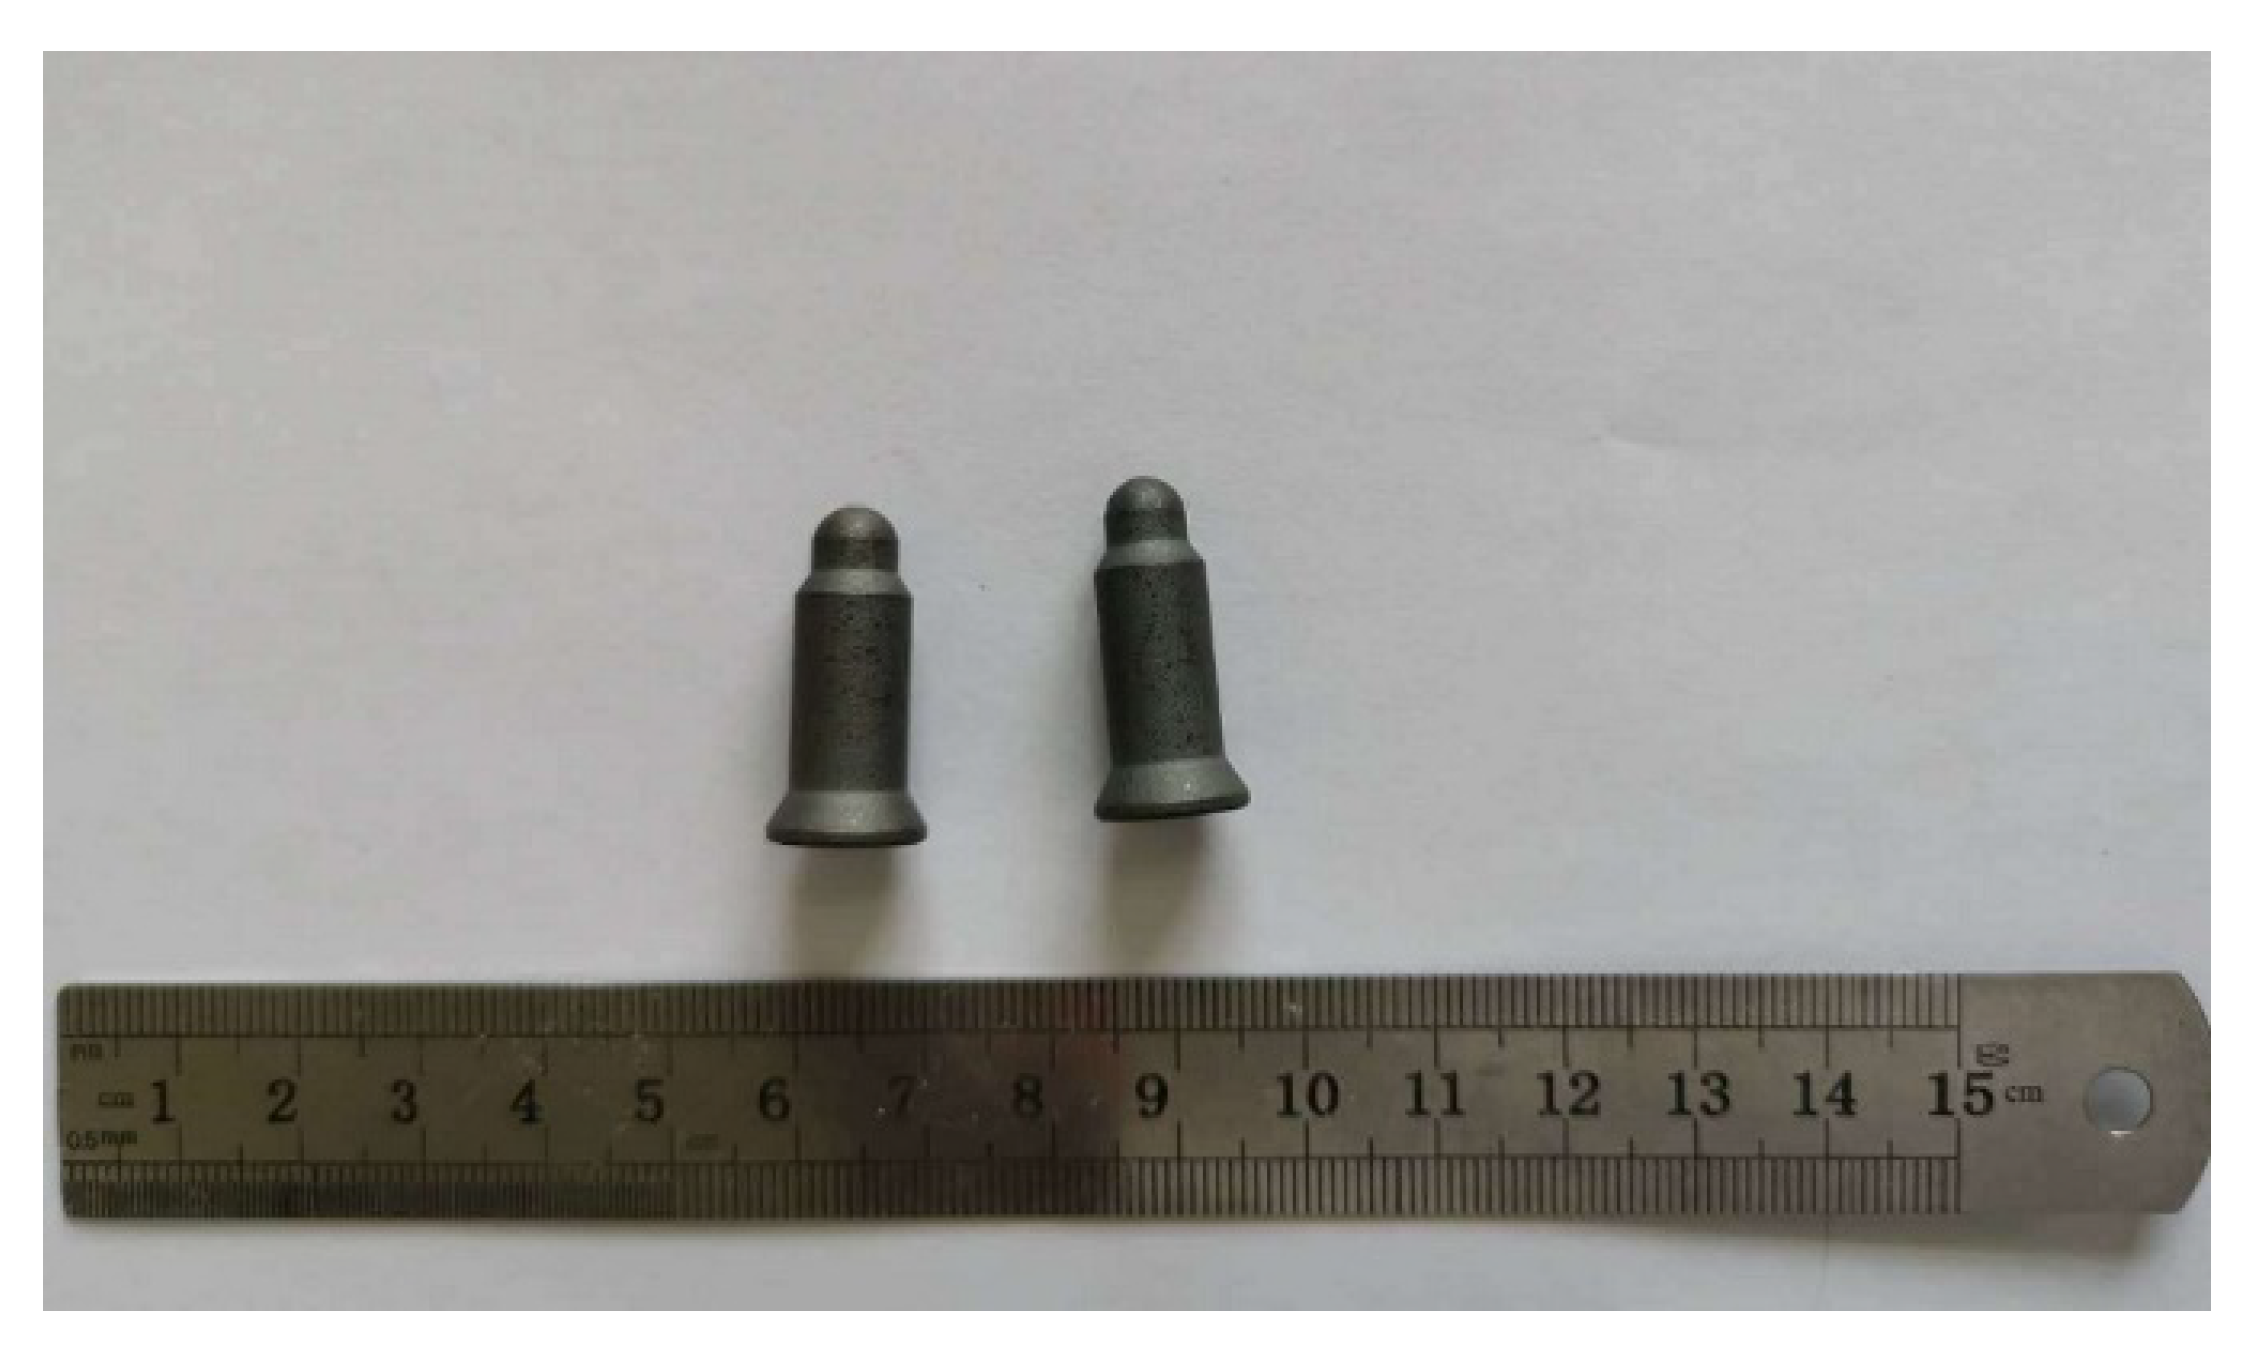
The content of oxygen decreased to 28.34% on the worn surface, suggesting a good wear performance, but next to that at 1280 °C. Therefore, the optimum treatment parameters for the studied alloy were selected as the oxidation temperature of 1280 °C and holding time of 3 h. For comparison, KCF material was oxidized using typical oxidation treatment parameters: temperature 1250 °C and holding time 3 h. The average thickness of the oxide layer was about 7.50 μm, and the average hardness of the oxide layer was about 1228 HV. The weight loss was 0.0024 g under the sliding condition of 20 N and 1.0 m/s. Figure 11 is the photograph of the spot welding location pins of the studied alloy oxidized at the optimum treatment parameters. The practical application of the spot welding location pins of the studied alloy in automotive industry has proved that their performance is comparable to that made of costly material imported from abroad.
4. Conclusions
The mass gain of Fe-21.3Cr-3.5Al-0.5Ti-0.4Zr steel presented a stage characteristic with increasing temperature present stage characteristic—i.e., a small increasing at the first stage of 1220–1260 °C, a moderate increasing at the second stage of 1280–1300 °C, a great increasing at the third stage of 1320–1340 °C.
The oxide layer mainly consisted of Al2O3 phase and a small amount of ZrO2 phase, and the amount of ZrO2 phase increased with increasing oxidation temperature. At temperature of 1340 °C, other phase, i.e., magnetite phases containing Fe element were found to be formed in the oxide layer.
The hardness of oxidation surface increased with temperature within the range of 1220–1340 °C.
The sample oxidized at 1280 °C exhibited the best wear resistance among the samples treated at temperatures of 1220–1340 °C.
Author Contributions
J.A. conceived and designed the experiments; Y.C., Z.L., and Y.T. performed the oxidation measurements; Y.C. performed SEM analysis; Z.L. and Y.T. analyzed the data; J.A. wrote the paper. All authors have read and agreed to the published version of the manuscript.
Funding
This research received no external funding.
Conflicts of Interest
The authors declare no conflict of interest.
References
- Nankung, J.; Kim, M.C.; Park, W.W. Fabrication of Fe-Cr-Al-base alloy strips by melting dragging and their oxidation resistance at elevated temperature. J. Mater. Technol. 2001, 115, 391–395. [Google Scholar] [CrossRef]
- Capdevila, C.; Miller, M.K.; Chao, J. Phase separation kinetics in a Fe-Cr-Al alloy. Acta Mater. 2012, 60, 4673–4684. [Google Scholar] [CrossRef] [Green Version]
- Bousquet, R.; Fayeulle, D.; Bruyer, E.; Bertrand, F. Effects of yttrium on the oxidation behavior of low sulfur content Fe-Cr-Al alloys for heat resistant wires. Oxid. Met. 2013, 80, 13–24. [Google Scholar] [CrossRef]
- Heinonen, M.H.; Kokko, K.; Punkkinen, M.P.J.; Nurmi, E.; Kollar, J.; Vitos, L. Initial oxidation of Fe-Al and Fe-Cr-Al alloys: Cr as an alumina booster. Oxid. Met. 2011, 76, 331–346. [Google Scholar] [CrossRef] [Green Version]
- Kim, S.; Choi, S.; Yun, J.; Kim, B.; Kang, Y.; Lee, K. High temperature oxidation behaviors of Fe-Cr-Al bulk and powder-sintered materials. Met. Mater. 2011, 6, 983–992. [Google Scholar] [CrossRef]
- Tortorelli, P.F.; Natesan, K. Critical factors affecting the high temperature corrosion performance of iron aluminides. Mater. Sci. Eng. A 1998, 258, 115–125. [Google Scholar] [CrossRef]
- Asteman, H.; Spiegel, M. A comparison of the oxidation behavior of Al2O3 formers and Cr2O3 formers at 700 °C—Oxide solid solutions acting as a template for nucleation. Corros. Sci. 2008, 50, 1734–1743. [Google Scholar] [CrossRef]
- Gurrappa, I.; Weiinbruch, S.; Naumenko, D.; Quadakkers, W.J. Factors governing breakaway oxidation of FeCrAl-based alloys. Mater. Corros. 2000, 51, 224–235. [Google Scholar] [CrossRef]
- Engkvist, J.; Grehk, T.M.; Bexell, U.; Olsson, M. Early stages of oxidation of uncoated and PVD SiO2 coated FeCrAl foils. Surf. Coat. Technol. 2009, 203, 2845–2850. [Google Scholar] [CrossRef]
- Hammer, L.; Meier, W.; Blum, V.; Heinz, K. Equilibration processes in surface of the binary alloy Fe-Al. J. Phys. Condens. Matter 2002, 14, 4145–4164. [Google Scholar] [CrossRef]
- Niu, Y.; Wang, S.; Gao, F.; Zhang, Z.G.; Gesmundo, F. The nature of the third-element effect in the oxidation of Fe-xCr-3 at.% Al alloys in 1 atm O2 at 1000 °C. Corros. Sci. 2008, 50, 346–356. [Google Scholar]
- Airiiskallio, E.; Nurmi, E.; Heinonen, M.H.; Vayrynen, I.J.; Kokko, K.; Ropo, M.; Punkkinen, M.P.J.; Pitkanen, H.; Alatalo, M.; Kollar, J.; et al. High temperature oxidation of Fe-Al and Fe-Cr-Al alloys: The role of Cr as a chemically active element. Corros. Sci. 2010, 52, 3394–3404. [Google Scholar] [CrossRef]
- Badini, C.; Laurella, F. Oxidation of FeCrAl alloy: Influence of temperature and atmosphere on scale growth rate and mechanism. Surf. Coat. Technol. 2001, 135, 291–298. [Google Scholar] [CrossRef]
- Brady, M.P.; Gleeson, B.; Wright, I.G. Alloy design strategies for promoting protective oxide-scale formation. JOM 2000, 52, 16–21. [Google Scholar] [CrossRef]
- Deacon, R.M.; DuPont, J.N.; Kiely, C.J.; Marder, A.R.; Tortorelli, P.F. Evaluation of the corrosion resistance of Fe-Al-Cr alloys in simulated low NOx environments. Part 2: Electroon microprobe analysis and scanning transmission electron microscopy studies. Oxid. Met. 2009, 72, 87–107. [Google Scholar] [CrossRef]
- Mizutani, A.; Miura, T.; Fujisawa, M.; Hayashi, S. Influence of Mo on high-temperature oxidation behavior of La- and Zr-added 20 mass%Cr-6 mass%Al ferritic stainless steels. Oxid. Met. 2017, 87, 109–124. [Google Scholar] [CrossRef]
Figure 1.
Optical microstructure (a) and X-ray diffraction (XRD) spectrum (b) of Fe-21.3Cr-3.5Al-0.5Ti-0.4Zr steel.
Figure 1.
Optical microstructure (a) and X-ray diffraction (XRD) spectrum (b) of Fe-21.3Cr-3.5Al-0.5Ti-0.4Zr steel.

Figure 2.
Mass gain at temperatures of 1220–1340 °C for 3 h.

Figure 3.
XRD patterns of oxide layers treated at different temperatures for 3 h: (a) 1220 °C, (b) 1260 °C, (c) 1280 °C, (d) 1300 °C, (e) 1320 °C, (f) 1340 °C.
Figure 3.
XRD patterns of oxide layers treated at different temperatures for 3 h: (a) 1220 °C, (b) 1260 °C, (c) 1280 °C, (d) 1300 °C, (e) 1320 °C, (f) 1340 °C.


Figure 4.
Surface morphologies of samples treated at different temperatures for 3 h: (a) 1220 °C, (b) 1260 °C, (c) 1280 °C, (d) 1300 °C, (e) 1320 °C, (f) 1340 °C.
Figure 4.
Surface morphologies of samples treated at different temperatures for 3 h: (a) 1220 °C, (b) 1260 °C, (c) 1280 °C, (d) 1300 °C, (e) 1320 °C, (f) 1340 °C.

Figure 5.
Scanning electron microscope (SEM) image and elemental mappings of surface oxidzed at 1340 °C for 3 h: (a) SEM image, (b) O, (c) Al, (d) Fe.
Figure 5.
Scanning electron microscope (SEM) image and elemental mappings of surface oxidzed at 1340 °C for 3 h: (a) SEM image, (b) O, (c) Al, (d) Fe.

Figure 6.
SEM image and elemental mappings of cross-sectional microstructure of sample oxidized at 1260 °C for 3 h: (a) SEM image, (b) O, (c) Al, (d) Cr, (e) Zr, (f) Fe.
Figure 6.
SEM image and elemental mappings of cross-sectional microstructure of sample oxidized at 1260 °C for 3 h: (a) SEM image, (b) O, (c) Al, (d) Cr, (e) Zr, (f) Fe.

Figure 7.
SEM image and elemental mappings of cross-sectional microstructure of sample oxidized at 1280 °C for 3 h: (a) SEM image, (b) O, (c) Al, (d) Cr, (e) Zr, (f) Fe.
Figure 7.
SEM image and elemental mappings of cross-sectional microstructure of sample oxidized at 1280 °C for 3 h: (a) SEM image, (b) O, (c) Al, (d) Cr, (e) Zr, (f) Fe.

Figure 8.
Hardness of oxidation surfaces treated at different temperatures for 3 h.

Figure 9.
Weight loss of samples oxidized at different temperatures for 3 h.

Figure 10.
SEM microphotographs of worn surfaces for samples oxidzed at different temperature for 3 h: (a) 1240 °C, (b) 1260 °C, (c) 1280 °C, (d) 1300 °C, (e) 1320 °C, (f) 1340 °C.
Figure 10.
SEM microphotographs of worn surfaces for samples oxidzed at different temperature for 3 h: (a) 1240 °C, (b) 1260 °C, (c) 1280 °C, (d) 1300 °C, (e) 1320 °C, (f) 1340 °C.

Figure 11.
Photograph of spot welding location pins made from the studied alloy.


Table 1.
Chemical composition of studied alloy (wt %).
| C | Cr | Al | Si | Mn | Ni | Ti | Zr | S | P |
|---|---|---|---|---|---|---|---|---|---|
| 0.015 | 21.27 | 3.50 | 0.10 | 0.24 | 0.24 | 0.53 | 0.42 | 0.0037 | 0.0090 |
Table 2.
Contents of major elements on surfaces of Fe-Cr-Al-Ti-Zr steel oxidized at different temperatures (wt %).
Table 2.
Contents of major elements on surfaces of Fe-Cr-Al-Ti-Zr steel oxidized at different temperatures (wt %).
| Temperature (°C) | O | Al | Cr | Zr | Ti | Fe |
|---|---|---|---|---|---|---|
| 1220 | 47.95 | 41.28 | 2.78 | 3.32 | 0.37 | 4.07 |
| 1240 | 47.89 | 41.75 | 1.11 | 4.51 | 0.19 | 2.87 |
| 1260 | 48.13 | 42.70 | 1.34 | 4.95 | 0.28 | 2.38 |
| 1280 | 48.60 | 40.64 | 1.59 | 5.77 | 0.18 | 3.11 |
| 1300 | 48.70 | 40.30 | 1.47 | 6.58 | 0.24 | 2.27 |
| 1320 | 47.92 | 39.60 | 1.22 | 7.75 | 0.27 | 3.24 |
| 1340 | 49.85 | 36.09 | 1.69 | 8.73 | 0.41 | 3.23 |
Table 3.
Thickness of oxide layers of the Fe-Cr-Al-Ti-Zr steel oxidized at different temperatures for 3 h.
Table 3.
Thickness of oxide layers of the Fe-Cr-Al-Ti-Zr steel oxidized at different temperatures for 3 h.
| Temperature (°C) | 1220 | 1240 | 1260 | 1280 | 1300 | 1320 | 1340 |
|---|---|---|---|---|---|---|---|
| Average thickness (μm) | 6.54 | 5.01 | 5.55 | 7.27 | 6.46 | 7.31 | 7.63 |
| Minimum thickness (μm) | 1.81 | 0.91 | 4.44 | 5.45 | 5.52 | 3.27 | 3.63 |
| Maximum thickness (μm) | 15.45 | 9.09 | 7.77 | 11.26 | 7.45 | 14.54 | 12.72 |
© 2020 by the authors. Licensee MDPI, Basel, Switzerland. This article is an open access article distributed under the terms and conditions of the Creative Commons Attribution (CC BY) license (http://creativecommons.org/licenses/by/4.0/).
Share and Cite
MDPI and ACS Style
An, J.; Chen, Y.; Liu, Z.; Tian, Y. Surface Oxidation Behavior and Wear Performance of a Fe-21.3Cr-3.5Al-0.5Ti-0.4Zr Steel. Metals 2020, 10, 1032. https://doi.org/10.3390/met10081032
AMA Style
An J, Chen Y, Liu Z, Tian Y. Surface Oxidation Behavior and Wear Performance of a Fe-21.3Cr-3.5Al-0.5Ti-0.4Zr Steel. Metals. 2020; 10(8):1032. https://doi.org/10.3390/met10081032
Chicago/Turabian StyleAn, Jian, Yiguang Chen, Zhihui Liu, and Yuxi Tian. 2020. "Surface Oxidation Behavior and Wear Performance of a Fe-21.3Cr-3.5Al-0.5Ti-0.4Zr Steel" Metals 10, no. 8: 1032. https://doi.org/10.3390/met10081032
Note that from the first issue of 2016, this journal uses article numbers instead of page numbers. See further details here.