Article

Impact of Perception of Green Space for Health Promotion on Willingness to Use Parks and Actual Use among Young Urban Residents

1
College of Forestry and Landscape Architecture, South China Agricultural University, Guangzhou 510642, China
2
College of Landscape Architecture and Arts, Northwest A&F University, Xianyang 712100, China
3
School of Architecture, Tsinghua University, Beijing 10084, China
4
School for Environment and Sustainability, University of Michigan, Ann Arbor, MI 48104, USA
*
Authors to whom correspondence should be addressed.
Int. J. Environ. Res. Public Health 2020, 17(15), 5560; https://doi.org/10.3390/ijerph17155560
Submission received: 7 July 2020 / Revised: 28 July 2020 / Accepted: 31 July 2020 / Published: 1 August 2020
(This article belongs to the Section Environmental Health)

Abstract

:
Promoting the use of green space is a fundamental way to improve physical and mental health and to enhance the quality of life of urban residents. In response to increasing demand for green space in cities, the impact of perception of green space for health promotion on willingness to use parks and actual use among young urban residents was investigated in this study. A total of 1135 young residents (ages 18–35) in three cities in China were surveyed by online questionnaire. A group of multiple regression models was constructed to investigate the influencing perception factors of participants’ willingness to use parks and actual use. The results revealed that the young residents’ perception of green space components for health promotion (green space access, types, sizes, plants, water, sensory features, microclimate environments and amenity facilities) had a greater effect on their willingness to use parks and to promote health, while it was less influential with respect to their actual park use behavior (frequency and duration). Among these variables, green space access is a critical concern for willingness to use toward parks. The disparities of perception of green space for health promotion effect on willingness to use a park and actual use provide a better understanding of the psychological factors affecting park use among young residents. The findings also provided some implications for public health policymakers, urban planners and landscape architects in designing parks to encourage visitation by young people.

1. Introduction

As urbanization and populations rapidly increase, maintaining livable and healthy cities has become a great challenge around the world [1]. The inactive urban lifestyle is thought to be associated with increases in hypertension [2], diabetes [3], obesity [4] and mental health issues such as depression and anxiety [5]. It has been suggested that today’s younger generations are less healthy and more likely to suffer from chronic diseases than their predecessors [6]. In China, urban environments have led to changes in lifestyles that increase the risk factors for noncommunicable diseases [7]. To address urban-related health problems, various preventative measures have been proposed in urban environments [8,9,10]. Providing urban green spaces has become one of the important measures to promote physical activity and enhance human well-being, which has aroused wide interest among researchers and policymakers [11,12,13].
Green spaces such as urban parks are a useful environmental source for urban dwellers to improve physical, mental and social health [14]. For example, interactions with urban parks can encourage physical activity, thereby reducing heart disease, type II diabetes and obesity and thus improving the physical health of people [15,16]. Natural landscapes in urban parks reduce mental fatigue and help people find relief from their stressful daily routines, as well as improve cognitive capacity [17,18,19]. Furthermore, urban parks provide a variety of opportunities for people to participate in public activities and thus promote social interaction [20,21].
Despite the health benefits associated with urban park visitation, recent studies have shown that parks are generally underutilized among young people [22,23]. To date, most of the empirical studies on the associations between park usage and health outcomes for young people have been focused on Western countries in urban contexts [24,25,26]. However, it is difficult to compare these relationships observed in other countries to the Chinese population. First, the differences in park physical features between cities in China and other countries could result in different relationships with park usage among residents [27]. Second, a large amount of evidence shows that people from different ethnic and cultural backgrounds and ages vary in the ways they use green spaces and in their perceptions of the beneficial effects of parks [28,29,30,31]. Consequently, it is necessary to understand these relationships in a Chinese context.
Although the literature concerning the factors affecting park usage is accumulating in China, most studies focus on the objective environment attributes, such as park pathways [32,33], quality of greenery [34] and accessibility [35,36]. Studies examining the psychological mechanism of built environments on individual’s park use behavior are still insufficient. A few studies suggest that peoples’ perception of the environment could influence willingness and intention toward their surroundings, which may stimulate actual behavior [37,38]. Relatively fewer studies pay attention to the effects of perception of green space for health promotion on resident willingness to use parks. Furthermore, as cities usually with higher living standards, many large cities in China have attracted large population of young residents that are facing more pressures than their predecessors (e.g., education and employment), and the health status of this group has become a great social challenge [39,40]. However, existing studies related to the association between psychological factors and park usage for young urban residents remain relatively deficient in Chinese society. This is important because encouraging park visitation could promote the physical health and mental health of young residents [41].
Aiming to address the above knowledge gaps, the associations among young urban residents’ perception of green space for health promotion, willingness to use parks and actual behavior in three cities in China were investigated. Young urban residents age ranging from 18 to 35 years were selected according to the definition of young residents from previous research and China’s medium and long term youth development plan (2016–2025) [34,42,43]. In addition, owing to the recent changes in the role of traditional parks, new and more accessible forms of green space have been gaining more attention among urban residents. Therefore, green spaces such as roof gardens, green lane and greenery associated with housing estates were added into the broader context of parks in our study. Based on the study results, several suggestions for Future Park planning and design to encourage visitation by urban young residents are proposed herein.

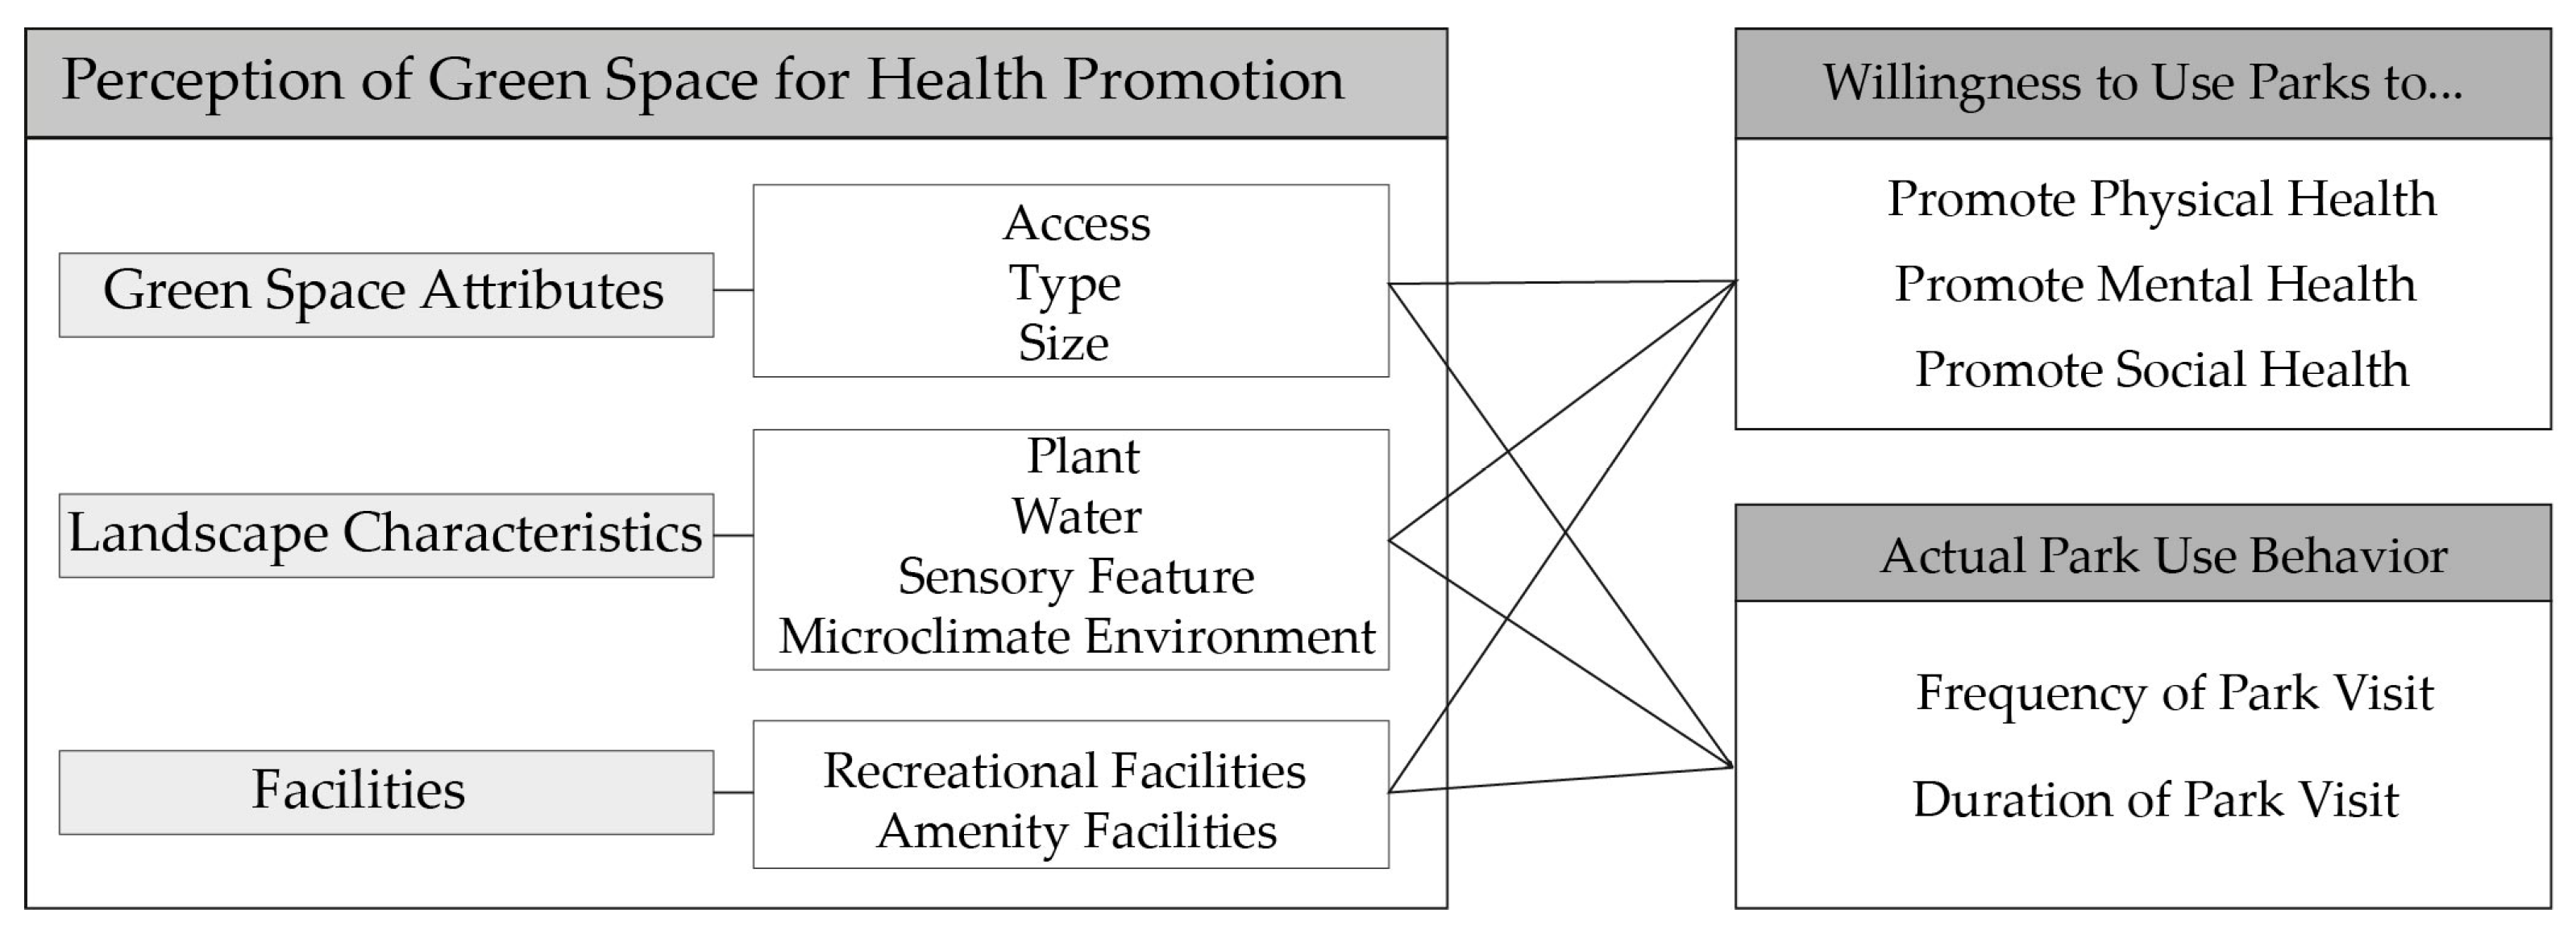
2. Literature Review and Theoretical Framework

2.1. Perceived Benefit and Willingness to Use toward Green Space

Perceived benefit relates to an individual’s perception of the positive changes that are brought by specific behavior, which, in turn, influences the attitude of a person toward their external environment [38,44]. Additionally, according to the theory of planned behavior (TPB), willingness is affected by attitude, i.e., if a person’s attitude toward a certain behavior is more positive, the person then has a stronger willingness to exhibit that behavior [37].
Many studies have demonstrated the roles of perception in contributing to behavioral intention towards green space [45,46,47]. For example, Chen et al. showed that the perception of benefits of green space is closely associated with the willingness of residents to conserve green space [48]. Perceptions of the contribution of small green spaces in reducing air pollution had a positive impact on residents’ willingness to pay for maintaining roof gardens and green lanes [49]. Furthermore, some studies have noted that awareness of the benefits that green space provide may increase the willingness of the people to use green space [46,50]. The presence of water features in a park could afford relaxed feelings and reduces stress; hence, people would have a positive attitude toward the park, ultimately enhancing their willingness to visit parks [51,52]. Additional studies in Western countries also suggest that the perceptions of greenness density, biodiversity, presence of old trees, comfort, cleanliness and order could indirectly influence an individual’s intention to use parks [53,54]. For example, perceived amount of vegetation could promote use of space and contribute to the fostering of social activities [55]. Perception of park cleanliness and order have also been found to be strongly related with frequency of visitation [56]. However, a negative perception of the green space may contribute to a negative willingness to use it. The perception of fear or insecurity in a park could provoke a psychological barrier that makes people avoid the park [57]. To some extent, such an insecure feeling has an adverse impact on attitudes toward the willingness to use parks [58]. In addition, evidence indicates that differences exist between Chinese and Western attitudes towards urban parks and green spaces, e.g., park usage pattern and outdoor recreation characteristics [30]. Therefore, it is likely that differences between Western and Chinese young urban residents influence the perception of benefits of park use, which in turn vary in promoting their willingness towards park use for improving health.

2.2. Factors Affecting Park Use

During the past several decades, many studies have been conducted by scholars to explore factors that affect the interactions between people and urban green space. Structural factors, such as size and proximity, have demonstrated associations with park use [59,60]. For example, Cohen et al. found that increase in parkland size was associated with an increase in the frequency of park visitation through a study of 174 neighborhood parks across the United States [61]. Other studies suggested that accessibility is an essential precondition for park use [62,63], as increased in distance from a park likely leads to a decline in the park visitation [64]. Park physical features may also play a vital role in encouraging park use or physical activity among residents [65], especially for specific features, e.g., playgrounds [66], water features [67] and vegetation [68]. In contrast, other features, such as litter, vandalism and poor playground surface quality have been shown to have a negative impact on park use [69,70].
In addition to physical factors, numerous studies have demonstrated the effects of psychological factors on the park use. For example, Ries et al. found that higher-quality perception of a park had a positive influence on park visitation among young people [71]. Some studies also showed that an individual’s nature orientation or attitude towards nature was the more important factor explaining urban dwellers’ actual park visitation [72,73]. Perceived vegetation quality and provision of facilities also encourage park visitation of residents, which in turn may improve mental, physical and social health [74,75]. Moreover, it was suggested that perceived accessibility was more important than a physical distance in determining park use behavior [76]. In view of the above, the roles of both physical and psychological factors in influencing park visitation are relatively well investigated, yet very little is known about the associations between young residents’ perception of green space for health promotion and their actual park use behavior.
Based on the literature review above, the theoretical framework in Figure 1 is proposed. Figure depicts how the perception of green space for health promotion affects willingness to use and actual use toward parks among urban young residents, in order to answer the following questions:
(1) Did the young residents’ perceptions of green space for health promotion shape their willingness to use park to promote health?
(2) Did this perception affect their park use behavior?
(3) Which factors of the perception of green space for health promotion were strongly associated with park use willingness and actual behavior?
The answers to these questions are important because they could increase our understanding of factors that contribute to the promotion of park use. Thus, urban policymakers could understand how to design and manage urban parks, which would effectively increase residents’ willingness to use parks, promote actual park use behavior and improve the health of young urban residents.

3. Materials and Methods

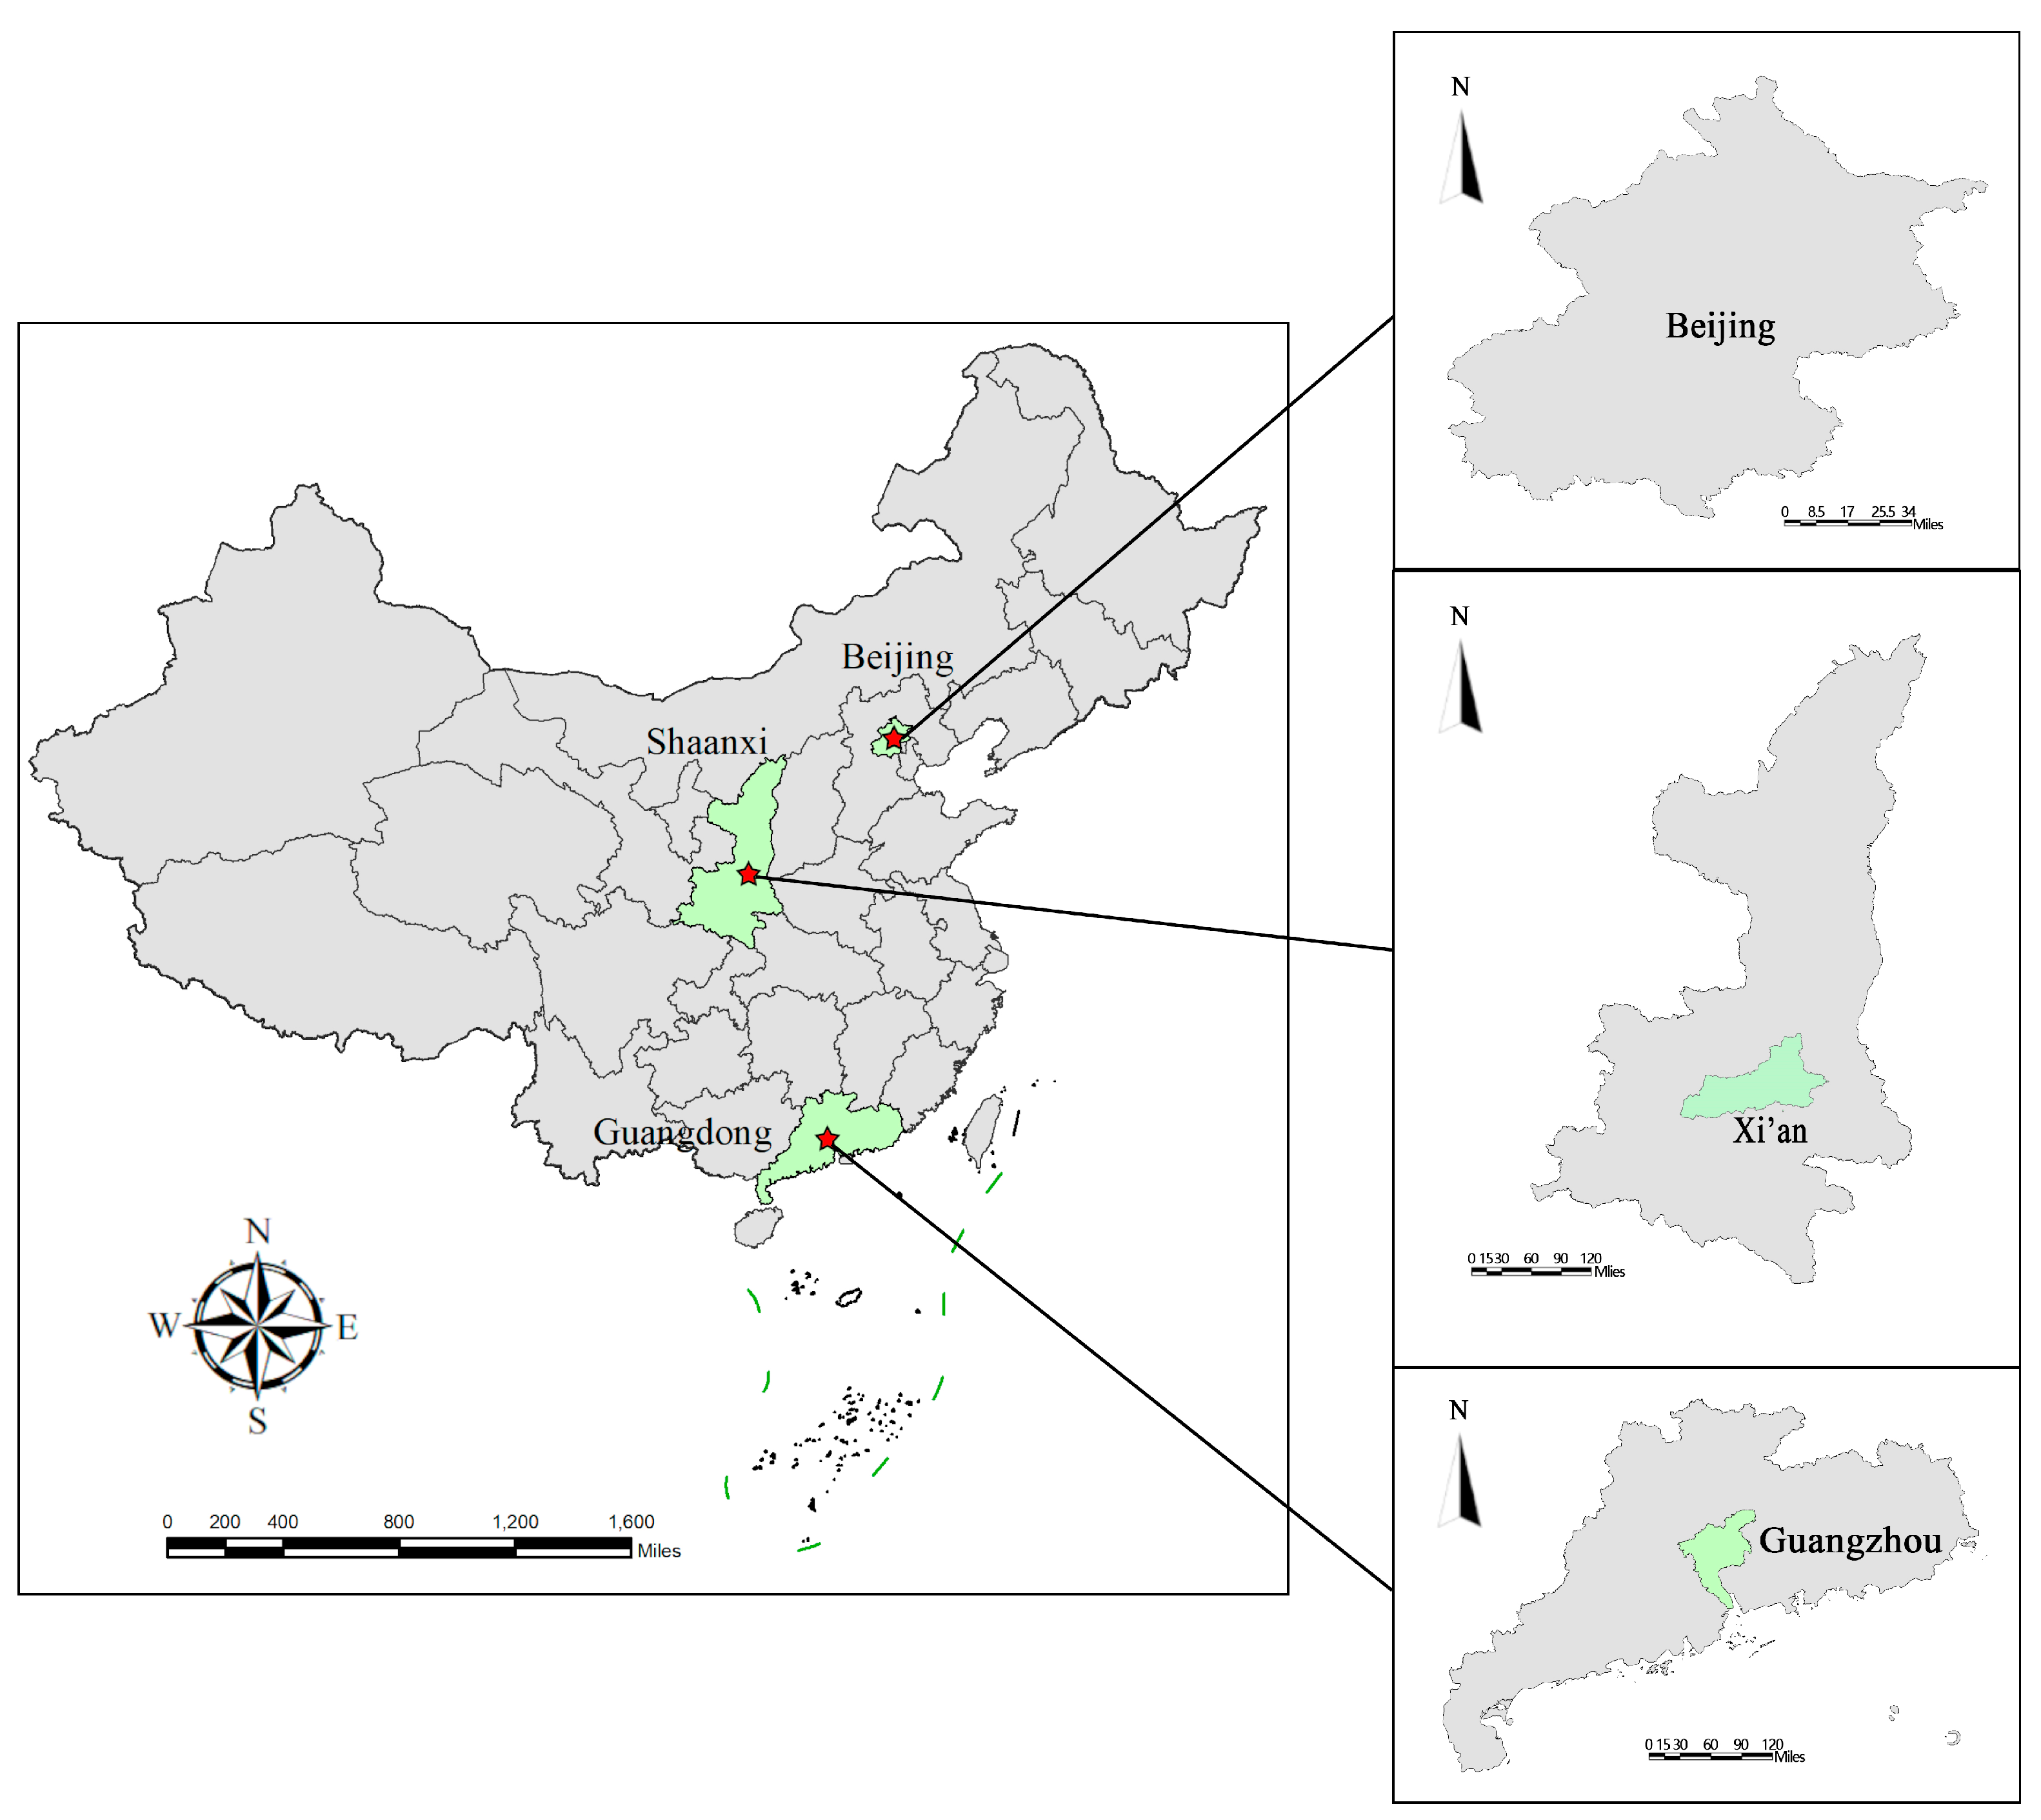
3.1. Study Design and Participants

This study was designed to improve understanding of the effect of young urban residents’ perceptions of green space components for health promotion on their park use willingness and behavior in Chinese cities. To achieve the objectives, an online questionnaire survey was conducted in three typical cities, i.e., Beijing, Xi’an and Guangzhou.
Beijing, Xi’an and Guangzhou are in the Beijing–Tianjin–Hebei region, the Guanzhong Plain region and Pearl River Delta, respectively (Figure 2). The three cities offer important sites with which to investigate the impact of perception of green space for health promotion on willingness to use parks and actual use among young urban residents because of their demographics and green space distribution. Beijing, the capital of China, is the country’s political, cultural and economic center of China. By the end of 2018, Beijing had 21.53 million permanent residents [77]. The city occupied a total area of 16,410 km2 and had 852.86 km2 of green space and its official ratio of park green space was 16.3 m2 per capita [78]. The overall number and area of urban parks in Beijing has increased year-by-year. By 2015, the number of registered parks in Beijing has grown to more than 400, including Chaoyang district, Haidian district and Fengtai districts, which cover a large area [79]. Located in a river valley, Xi’an lies north of the Weihe River and south of the Qinling Mountains. Xi’an is an important megalopolis and a crucial scientific, educational and industrial base of Central China. As the capital of Shaanxi Province, Xi’an includes an area of 10,097 km2 and has a population of approximately 10 million. The urban green coverage of Xi’an reached 41.6% with 104 urban parks and a per capita park green space of 11.9 m2 by the end of 2018 [80]. Guangzhou is an important central city, international business center and comprehensive transportation hub of South China. As the capital of Guangdong Province, Guangzhou is a megacity with a population of nearly 15 million in 2018. It has a large percentage of urban green spaces with approximately 400 parks in the inner and outer suburbs, and the park green space per capita has reached 17.3 m2 [81]. With similar green coverage rates, diverse types of green spaces, populations and economic statuses, Beijing, Xi’an and Guangzhou are typical representatives of socioeconomic centers with the conditions to attract and retain youth in China, representing North, Central and South China [82]. Therefore, the sample data from these areas may mirror the willingness to use parks to promote health, park use behaviors and the components concerning perceptions of green space among young urban residents in China.
By March 2020, China had 904 million Internet users, among which about 80% were young people aged from 10 to 49 years old [83]. Therefore, an online questionnaire survey was a better choice for young urban residents that were more likely to have good access to the Internet than other age groups. The questionnaires on the Wenjuanxing website (www.wjx.cn), one of the most frequently used online data-collection platforms in China. Invitations were sent to potential subjects and responses solicited through social media and email from October 2017 to November 2019. Participants were informed that the eligible age for this study was between 18 years old and 35 years old [34,42,43], and participants must have lived in that city for at least six months. Respondents were reassured in advance that all identifying information would be kept anonymous and that the information was for noncommercial use. Finally, a total of 1340 online questionnaires were collected. The returned questionnaires had the quality criteria of all the questions being completed and verifiable demographic information being provided. Of all the collected questionnaires, 205 were invalid due to incompletion or being ineligible. Thus, the valid sample consisted of 1135 respondents, with an overall valid-response rate of 84.7% (the invalid-response rate was 15.3%).

3.2. Survey Instrument

A web-based questionnaire containing 20 questions in total was designed for data collection following an extensive literature review. It was divided into three subsections: (1) respondents’ willingness to use parks to promote health and actual park use behavior, (2) perception of green space components for health promotion and (3) demographic information. The first section was designed to capture the data for the dependent variables, including the willingness to use parks to promote health (three questions) and park use behavior (two questions). The second section included questions designed to gather participants’ perceptions about green space components for health promotion (nine questions). The third section was set to collect demographic information (six questions), including the city of residence, age, sex, education, monthly income and type of residence. It took approximately 5 to 10 min for each respondent to complete the questionnaire.

3.2.1. Dependent Variables

According to the World Health Organization, “health is a state of complete physical, mental, and social well-being and not merely the absence of disease or infirmity [84].” Thus, the respondents’ willingness to use parks to promote health consisted of three categories, i.e., physical, mental and social health. These categories represent different dimensions of individual health that people would be willing to promote by going to green spaces. Physical health described the ability to protect and restore an organism (e.g., pressure and heart rate) from the changing circumstances of an external environment [85,86,87]. mental health was defined as the capacity to deal with, recover from and prevent psychological stress (e.g., anxiety and depression), as well as recognize one’s own intellectual and emotional potential [86,87,88]. Social health could be operationalized in terms of social support, referring to the ability to harbor good interpersonal relationships and social adaptation (e.g., interaction and collaboration) [85,86,87]. The study was used to investigate respondents’ willingness of park use to promote health by asking “Would you like to go to parks to improve your physical/mental/social health?” A five-point scale (from 1 = not at all to 5 = very willing) was implemented for the analysis to create the willingness index for health benefits.
Frequency and duration of the park visits were used to measure park use behavior. Frequency and the duration of park visits have been widely applied in studies of the relationship between green space and health [59,89,90]. The frequency of park visits was assessed by asking, “How often do you visit urban parks or other green spaces?” The response options for the first question were on a seven-point scale (1 = annually or less often, 2 = quarterly, 3 = monthly, 4 = biweekly, 5 = weekly, 6 = semiweekly and 7 = daily). The duration of park visits was measured by asking, “How long on average do you stay in your most frequently used parks?” The response options for the second question were on a five-point scale (1 = 30 min or less, 2 = 0.5–1 h, 3 = 1–2 h, 4 = 2–3 h, 5 = over 3 h).

3.2.2. Independent Variables

The perceptions of green space components for health promotion included the perception of green space attributes (three items), landscape characteristics (four items) and facilities (two items). Three categories of green space components were adopted from previous studies [34,89,91,92,93,94,95]. For the green space attributes, participants were asked whether green space access (e.g., walking distance and road system), type (e.g., green space in residential areas and multifunctional parks) or size (e.g., 1, 2 and 5 Ha) played a role in respondents’ health promotion. The landscape characteristics were measured by asking whether plants (e.g., ornamental features and canopy density), water (e.g., artificial and natural), sensory features (e.g., sound and smell) or microclimate environments (e.g., temperature and humidity) contributed to health promotion. The facilities were assessed by asking respondents whether rest facilities (e.g., seats and pergolas with chairs) or amenity facilities (e.g., exercise facilities, running paths, swings and slides) had an impact on their health promotion. All the response options were listed on a Likert scale (1 = strongly disagree to 5 = strongly agree).

3.3. Statistical Analyses

Amos 21 software (IBM, Armonk, NY, USA) and SPSS (version 22.0, IBM, Armonk, NY, USA) was used for the statistical analysis in this study. First, the Cronbach’s α coefficients were examined and a confirmatory factor analysis (CFA) performed for the reliability and convergent validity of the constructs. Composite reliability (CR) coefficients and average variance extracted (AVE) scores were calculated as estimates. Second, the descriptive statistics were examined for both the demographic characteristics and the experimental variables. Third, Spearman’s correlation analysis was conducted to investigate the univariate correlations between the dependent variables (perceptions of green space components for health promotion and demographic variables) and independent variables (willingness to use parks and actual park use behavior), as well as screen irrelevant variables (p > 0.05). Finally, to further understand the influencing perception factors of young residents’ willingness to use parks for health promotion and their park use behavior, a set of multiple regression models was built. Additionally, collinearity statistics were applied to check multicollinearity issues if there were moderate to strong correlations between the independent variables. All independent variables fell within an acceptable level of the variance inflation factor (VIF) ratio (<4.0), implying that the concerns regarding multicollinearity were eliminated [96].

4. Results

4.1. Reliability and Validity Analysis

Regarding the reliability, the Cronbach’s α values for the willingness to use parks to promote health and the park use behavior were 0.836 and 0.712, respectively. As shown in Table 1, the Cronbach’s α values of the independent variables were all above the threshold of 0.7, which can be regarded as reliable. Regarding the convergent validity, the CR coefficients for each independent variable exceeded the threshold value of 0.7 [97] and average variance extracted (AVE) scores were calculated with values higher than 0.5 in Table 1 [98], indicating that the results were acceptable. Loading values, also called standardized path coefficients, were used to assess the relationship between variables, ranging from 0.677 to 0.912 among the independent variables in this study.

4.2. Descriptive Statistics

Table 2 displays the demographic and socioeconomic characteristics of the 1135 residents that participated in the online survey. More than half of the participants were young residents between the ages of 18 and 25 (60.5%) and most of the respondents were female (67.9%), which may be due to the fact that women are more likely to have a greater willingness to participate in online surveys than men [99]. Most of the participants had earned a bachelor’s degree (66.3%) or a master’s degree (24.8%), representing a relatively high educational level. In addition, 33.6% of respondents had a monthly personal income of less than 1000 CNY, followed by 19.7% with a monthly income of 5000 CNY to 10,000 CNY. Regarding the residence location, 61.8% of the participants reported that they were living in the central city, while 34.4% were living in suburban districts.
Table 3 lists the descriptive statistics for the dependent and independent variables used in the multiple regression models, including means and standard deviations. In terms of the willingness to use parks to promote health, the average scores for the physical health, mental health and social health variables were 4.04 ± 0.97, 4.42 ± 0.87 and 4.00 ± 0.99, respectively, ranging from willing to very willing, indicating that most of the participants were willing to go to parks to promote physical, mental and social health. Notably, among these three variables, the mental health variable had the highest mean scores.
For park use behavior, the mean score of the frequency of the park visits was 3.42 ± 1.37, ranging from monthly to biweekly, and the duration of the park visits was the lowest, between 0.5 h and 2 h (M = 2.23 and SD = 0.82).
For the perception of green space components for health promotion, the mean scores of all of the variables were higher than 4 on a five-point scale (M = 4.07–4.28), except for the rest facilities (M = 3.84 and SD = 1.07). This result indicated that most of the young residents reported relatively high awareness levels of the role of green space components for health promotion. However, the assessment of the role of rest facilities for health promotion ranged from neutral to agreement.

4.3. Correlation Analyses

Table 4 presents the bivariate correlation coefficients of the variables in this study. All of the perception variables (i.e., perception of green space components for health promotion) were positively and significantly correlated with the willingness to use parks to promote health (rs = 0.307–0.538 and ps < 0.01). Similarly, all the perception variables were positively associated with the frequency of park visits (rs = 0.109–0.161 and ps < 0.01). Moreover, almost all the perception variables were significantly associated with the duration of the park visits (rs = 0.060–0.115 and ps < 0.01), except for the green space access variable (r = 0.045 and p > 0.05). Some demographic variables (age, education level and income) had a significant correlation with the dependent variables (the willingness to use parks to promote health and the duration of the park visits). After filtering the variables, the perception variables significantly correlated with the dependent variables were included in the regression models. Some demographic variables (age, gender, education level and income) were also included in the regression model, since they may impact on the respondents’ park use willingness and behavior. In addition, there were moderate to strong correlations between the independent variables. Thus, the collinearity problem merited further investigation.

4.4. Predictors of the Willingness to Use Parks to Promote Health

Table 5 presents the multiple regression models using the willingness to use parks to promote health (i.e., physical, mental and social health) as the dependent variable. The results demonstrated that all of the variance inflation factor (VIF) values were less than 3.4, suggesting that the multicollinearity problem among the independent variables were acceptable.
With respect to the physical health variable, Model 1 explained approximately 45.7% of the variables. Green space access (β = 0.289, p < 0.01), type (β = 0.109, p < 0.01), size (β = 0.179, p < 0.01), sensory features (β = 0.129, p < 0.01) and amenity facilities (β = 0.079, p < 0.05) exerted a significant positive influence on the willingness to use parks to promote physical health. For the mental health variable, Model 2 accounted for approximately 57.3% of the variables. The results revealed that green space access (β = 0.301, p < 0.01), type (β = 0.098, p < 0.01), size (β = 0.172, p < 0.01), plants (β = 0.130, p < 0.01), sensory features (β = 0.136, p < 0.01) and microclimate environments (β = 0.107, p < 0.01) were positive predictors of the willingness to use parks to promote mental health. For the social health variable, Model 3 explained nearly 41.9% of the variables. Green space access (β = 0.229, p < 0.01), type (β = 0.151, p < 0.01), size (β = 0.151, p < 0.01) and water (β = 0.174, p < 0.01) demonstrated positive relationships with the willingness to use parks to promote social health and gender produce significant observations (β = −0.064, p < 0.05). In total, these predictors for Models 1–3 had significant explanation power, and all of the F-statistics were at the 0.01 level. In Models 1–3, the perception of green space access for health promotion was found to be the strongest predictor of willingness to use parks to promote health. The role of several demographic variables in the willingness to use parks to promote health was notable. Young men tended to report higher willingness to use parks to promote physical health (β = −0.058, p < 0.05) and social health (β = −0.064, p < 0.05), which was consistent with a previous study [100]. People who earned less monthly personal income were more willing to use parks to promote mental health (β = −0.061, p < 0.05), which may be explained by the fact that people with higher income could have multiple choices with which to promote health that were not restricted to park usage [101].

4.5. Predictors of Park Use Behavior

As shown in Table 6, we constructed regression analyses to examine the predictors of park use behavior. The results in Model 4 indicated that age (β = 0.099, p < 0.05), gender (β = −0.067, p < 0.05) and green space access (β = 0.097, p < 0.05) showed a significant influence on the frequency of park visits. In Model 5, plant (β = −0.102, p > 0.05) and microclimate environments (β = 0.120, p > 0.05) appeared statistically significant. However, the R-square values for Models 4 and Model 5 were less than 0.04, suggesting that the relationships between the predictors and the dependent variables were extremely weak, which also could be seen as having no relation. Thus, the predictors of the frequency and duration of park visits could not be determined from the perception of green space components for health promotion among young residents.

5. Discussion

5.1. Effects of Perception on Park Use Willingness and Behavior

The research reported in this article was intended to examine the impact of perception of green space components for health promotion on willingness to use parks and actual use among young residents in Chinese cities. Overall, the results revealed that young residents’ perception of green space components for health promotion had a greater effect on their willingness to use parks to promote health. In contrast, young peoples’ perceptions of green space components for health promotion were less influential on their actual park use behavior. The findings in this study provided a greater understanding of how the perception of parks for health promotion affected park use among young urban residents.
The park use willingness models that were examined in this study were moderately strong and the young residents’ perceptive assessments of eight specific green space components for health promotion were found to be positive predictors, including green space access, type, size, plants, water, sensory features, microclimate environments and amenity facilities. Notably, the perception of green space attributes for health promotion, including the green space access, type and size, had a positive effect on the intention to use parks for all three dimensions of health effects. This finding indicated that young residents that knew these three attributes of green space were crucial factors that would contribute to well-being were more willing to use parks to achieve physical, mental and social health. Moreover, the perception of “green space access” was the most robust predictor for park use willingness in this research. This may have been largely attributed to the reason that having access to green space was a prerequisite for health promotion realization, making it a more remarkable predictor [94]. The above findings were similar to those of previous studies, indicating that park utilization and future visitation intention related to health was positively determined by perceived accessibility [46,102,103]. Likewise, some research studies found that the type and size of green space were correlated with different park benefits, activities and park use [46,60,92,104,105]. For example, Byrne et al. reported that an individual’s perception of park accessibility was a determinant of park use decisions [102]. Brown et al. suggested that neighborhood parks were associated with psychological benefits, while community parks and natural parks were related to social benefits and environmental benefits, respectively [104]. Moreover, large green spaces tend to have more natural elements, recreational facilities and walking paths [106,107,108], which may offer more attractiveness and opportunities for various activities. Therefore, the health values and intentions that residents held for park use may have been related to these properties, which may partly explain the results in this study.
With respect to the perception of landscape characteristics for health promotion, there were three interesting findings. First, both the “plants” and “microclimate environments” variables were positive predictors of the willingness to use parks to promote mental health, suggesting that young residents could be more willing to visit parks to achieve psychological recovery if they believed that plants and microclimate environments played an important role in promoting health. The effect of plants on mental health has been widely recognized, and it has also been found to be a driving and attractive factor for the motivation to visit parks [72,109,110,111]. It has also been reported that planting influences microclimate environments and may lead to great well-being, relaxation and comfort [112,113], which possibly provokes higher intentions to visit parks. Second, the perception of water was associated with the willingness to use parks for social health. This result provided support for the established evidence that one of the main benefits people identified receiving from blue space visits was social interaction [114]. Additionally, the residents who had a better understanding of the importance of sensory features for health promotion reported a higher level of willingness to use parks for physical and mental health. Our research on the perception–willingness models may further expand the previous findings, which indicated that sensory perception was linked to health-related behaviors and mental restoration [115].
With respect to the perception of facilities for health promotion, the “amenity facilities” variable showed a significant impact on the willingness to use parks to promote physical health. The important role of amenity facilities in park use has been demonstrated in previous research, which may also explain the relationship found in this study [89,116].
However, the park use behavior models had weak and mixed results. It was found that the young residents’ perception of green space components for health promotion could not predict the frequency and duration of park visits. The results of this research also showed that most of the young residents reported relatively high awareness of the role of green space components for health promotion. They also showed high intensions to visit parks to promote health, especially mental health. However, most respondents tended to visit parks at low frequency, and they spent less of their time visiting parks. This was consistent with previous research studies that showed that parks were generally underutilized by young people [23,117].
The more noteworthy findings of this research were the disparities between young residents’ park use willingness and their use behavior. The results may have been partly explained by the following reasons. It was previously reported that young Chinese residents aged 20–30 were less likely to visit parks for leisure in their daily life because they preferred to pursue more active and exciting activities, such as visiting pubs and exploring wild areas [118]. Some potential barriers may influence young people’s actual park use behavior, such as less leisure time due to being busy with work and study [119,120]. Furthermore, insufficient availability of green space due to governmental and social failures or accessible barriers (such as entrance restrictions) may have an impact on the residents’ willingness and usage of green spaces [121]. In addition, according to previous research, young people spend most of their leisure on the Internet, rather than outdoor activities [122]. Moreover, the planning and design of urban parks in China have mainly focused on the recreational, esthetic and environmental effects, which may lack attractiveness for young residents.
However, our findings were different with some studies in the Western countries. First, unlike Chinese young adults, residents in western countries tend to visit green spaces more frequently. For example, a nationwide study in Denmark suggested that 43.0% of the adult Danes visit green space every day and 91.5% of them visit green space at least once per week [123]. This could be partly explained by the fact that many green spaces in Europe and America contained more physically challenging facilities that could encourage young people to visit green spaces, such as skateparks, climbing frames, running tracks, fitness rings,, etc. [24]. Conversely, there were fewer sports theme parks that could provide appropriate activities for young people in China [124]. Second, western people prefer to walk dogs, do ball sports, jog or enjoy the sunshine in green spaces [125,126]. However, young Chinese people seldom go to green spaces for activities, and they may think that green spaces are somewhere occupied by older people and children. Finally, compared to Western countries, the development of urban parks in China got off a late start. The residents of most Western countries have paid more attention to community parks and informal green spaces in recent years [127,128], while the priority of the planning and management were still large urban parks in Chinese green space departments, which may limit the usage of green space among young people.

5.2. Implications for Practice

This study generated knowledge that young residents’ perceptions were an important factor significantly affecting the willingness to use parks to promote health. The findings in our research fit into a broader picture of effects to facilitate park use for health promotion and the findings provide some implications for green space design. The significant perceptive predictors of the willingness to use parks to promote health could be incorporated more appropriately into the design of green space. For example, access to green space was found to be a crucial factor affecting park use. Thus, it is recommended that urban planners improve the physical and perceived accessibility of green spaces. Intervention strategies were suggested, such as making green spaces of different sizes and functions that would be reasonably distributed in the city scales and providing information about different routes to access parks for young residents [129]. Green space designers and managers also must pay more attention to other predictors, including plants, water, sensory features, microclimate environments and amenity facilities.
The findings in our study suggest that improving the above features may lead to higher willingness to use parks among young residents. However, young residents reported that they seldom visited parks in practice, which may imply that their willingness to use parks did not reflect their actual visitation behavior. Thus, our findings called attention to resurrecting outdoor activities for young residents. Because the way that young people perceive and use parks could be shaped by their values and interests [24], local policymakers should consider organizing natural programs that could cater to young residents’ orientations, which may ultimately lead to remodeling their health-related behavior [43,130].

5.3. Limitations and Future Research

Some potential limitations of this study are worth mentioning. First, only a single point in time was examined in this study and cause and effect could not be differentiated from a cross-sectional nature. For instance, demographic and socioeconomic characteristics may have affected the relationship between the inferred reasons and outcomes [24]. Therefore, we should use longitudinal studies that involve taking multiple measures over an extended period should be used in further research. Second, this study only depended on perceived measures instead of objective measures. The perception of green space components for health promotion was entirely based on the participants’ subjective assessment. Thus, the answers may have differed from actual results because of mental deviation from subjective perception. A previous study applied objective measures to assess associations between experiences with natural environments and mental health [131]. Similarly, a set of measures including, but not restricted to testing the biologically active components and the physical environments were used to deal with the biases. In this way, what factors that have specific health effects on young people could be further explored. Third, samples in the study mainly came from urban areas with relatively small populations. Most of the sample population were young residents with Internet access, while other young people with Internet difficulties were not included. Although the study adopted a convenient online questionnaire, it could also limit the generalizability and create a bias for the real results. Consequently, a combination of various forms of investigation such as interviews, field surveys and observations, should be applied in the future. Finally, the reasons for the differences between willingness to use parks and actual park use behavior among young residents in this study are still unclear. Although young people may be busy and prefer more attractive activities, in the future, it will be necessary to investigate the mechanism behind these differences and what features would encourage young residents to visit parks.

6. Conclusions

Owing to the growing disconnection between young residents and nature, in this study targeted young urban residents in China were targeted as respondents. The impact of the perception of green space for health promotion on park use willingness and behavior among young urban residents was explored. Overall, our findings demonstrated that young residents’ perception of green space components for health promotion had a greater effect on their willingness to use parks to promote health and the perception of access to green space access was the most robust predictor of willingness. In contrast, the effect of young people’s perception of green space components for health promotion was less influential on their actual park use behavior. Such disparities between park use willingness and actual use need more effort to facilitate actual park use behavior for health promotion among young residents. The findings also provided some implications for public health policymakers, urban planners and landscape architects in terms of the planning and design of green spaces oriented toward young people.

Author Contributions

Conceptualization, Y.X. and C.C.; methodology, C.C. and Y.X.; validation, C.C., W.L. and Y.X.; formal analysis, W.L., H.L. and D.Z.; investigation, W.L., H.L. and D.Z.; resources, C.C. and Y.X.; data curation, W.L., X.Y. and D.Z.; writing—original draft preparation, W.L., H.L. and C.C.; writing—review and editing, C.C., Y.X., N.K. and W.L.; visualization, N.K. and X.Y.; supervision, Y.X.; project administration, C.C.; funding acquisition, Y.X. and C.C. All authors have read and agreed to the published version of the manuscript.

Funding

This research was funded by the National Natural Science Foundation of China, Grant Numbers: 51808229 and 51908310 and by the 2019 Philosophy and Social Science Foundation of Guangzhou, Grant Number: 2019GZGJ53 and by Research Project of Degree and Graduate Education Reform of Guangdong Province, Grant Number: 2019JGXM16.

Conflicts of Interest

The authors declare there are no conflict of interest.

References

  1. Moore, M.; Gould, P.; Keary, B.S. Global urbanization and impact on health. Int. J. Hyg. Environ. Health 2003, 206, 269–278. [Google Scholar] [CrossRef] [PubMed]
  2. He, J.; Klag, M.J.; Whelton, P.K.; Chen, J.-Y.; Mo, J.-P.; Qian, M.-C.; Mo, P.-S.; He, G.-Q. Migration, Blood Pressure Pattern, and Hypertension: The Yi Migrant Study. Am. J. Epidemiol. 1991, 134, 1085–1101. [Google Scholar] [CrossRef] [PubMed]
  3. Goryakin, Y.; Rocco, L.; Suhrcke, M. The contribution of urbanization to non-communicable diseases: Evidence from 173 countries from 1980 to 2008. Econ. Hum. Biol. 2017, 26, 151–163. [Google Scholar] [CrossRef] [PubMed] [Green Version]
  4. Flegal, K.M. Prevalence and Trends in Obesity Among US Adults, 1999–2008. JAMA 2010, 303, 235. [Google Scholar] [CrossRef] [PubMed] [Green Version]
  5. Prince, M.; Patel, V.; Saxena, S.; Maj, M.; Maselko, J.; Phillips, M.R.; Rahman, A. No health without mental health. Lancet 2007, 370, 859–877. [Google Scholar] [CrossRef]
  6. Hulsegge, G.; Picavet, H.S.J.; Blokstra, A.; Nooyens, A.C.J.; Spijkerman, A.M.W.; Van Der Schouw, Y.T.; Smit, H.A.; Verschuren, W.M. Today’s adult generations are less healthy than their predecessors: Generation shifts in metabolic risk factors: The Doetinchem Cohort Study. Eur. J. Prev. Cardiol. 2014, 21, 1134–1144. [Google Scholar] [CrossRef]
  7. Gong, P.; Liang, S.; Carlton, E.J.; Jiang, Q.; Wu, J.; Wang, L.; Remais, J.V. Urbanisation and health in China. Lancet 2012, 379, 843–852. [Google Scholar] [CrossRef]
  8. Moore, S.M.; Borawski, E.A.; Cuttler, L.; Ievers-Landis, C.E.; Love, T.E. IMPACT: A multi-level family and school intervention targeting obesity in urban youth. Contemp. Clin. Trials 2013, 36, 574–586. [Google Scholar] [CrossRef] [Green Version]
  9. Arango, C.; Díaz-Caneja, C.M.; McGorry, P.D.; Rapoport, J.; Sommer, I.E.; Vorstman, J.A.; McDaid, D.; Marín, O.; Serrano-Drozdowskyj, E.; Freedman, R.; et al. Preventive strategies for mental health. Lancet Psychiatry 2018, 5, 591–604. [Google Scholar] [CrossRef]
  10. Draper, C.E.E.; Bosire, E.; Prioreschi, A.; Ware, L.J.J.; Cohen, E.; Lye, S.J.J.; Norris, S.A.A. Urban young women’s preferences for intervention strategies to promote physical and mental health preconception: A Healthy Life Trajectories Initiative (HeLTI). Prev. Med. Rep. 2019, 14, 100846. [Google Scholar] [CrossRef]
  11. James, P.; Tzoulas, K.; Adams, M.D.; Barber, A.; Box, J.; Breuste, J.; Elmqvist, T.; Frith, M.; Gordon, C.; Greening, K.L.; et al. Towards an integrated understanding of green space in the European built environment. Urban For. Urban Green. 2009, 8, 65–75. [Google Scholar] [CrossRef]
  12. Pretty, J.; Peacock, J.; Sellens, M.; Griffin, M. The mental and physical health outcomes of green exercise. Int. J. Environ. Health Res. 2005, 15, 319–337. [Google Scholar] [CrossRef] [PubMed]
  13. Irvine, K.N.; Warber, S.L. Greening healthcare: Practicing as if the natural environment really mattered. Altern. Ther. Health Med. 2002, 8, 76–83. [Google Scholar] [PubMed]
  14. Hartig, T.; Mitchell, R.; De Vries, S.; Frumkin, H. Nature and Health. Annu. Rev. Public Health 2014, 35, 207–228. [Google Scholar] [CrossRef] [Green Version]
  15. Twohig-Bennett, C.; Jones, A. The health benefits of the great outdoors: A systematic review and meta-analysis of greenspace exposure and health outcomes. Environ. Res. 2018, 166, 628–637. [Google Scholar] [CrossRef]
  16. Astell-Burt, T.; Feng, X.; Kolt, G.S. Is Neighborhood Green Space Associated With a Lower Risk of Type 2 Diabetes? Evidence From 267,072 Australians. Diabetes Care 2014, 37, 197–201. [Google Scholar] [CrossRef] [Green Version]
  17. McEachan, R.R.C.; Prady, S.L.; Smith, G.; Fairley, L.; Cabieses, B.; Gidlow, C.; Wright, J.; Dadvand, P.; Van Gent, D.; Nieuwenhuijsen, M.J. The association between green space and depressive symptoms in pregnant women: Moderating roles of socioeconomic status and physical activity. J. Epidemiol. Community Health 2016, 70, 253–259. [Google Scholar] [CrossRef] [Green Version]
  18. Gascon, M.; Triguero-Mas, M.; Martínez, D.; Dadvand, P.; Forns, J.; Plasència, A.; Nieuwenhuijsen, M.J.; Mas, M.T.; Martínez, D.; Dadvand, P.; et al. Mental Health Benefits of Long-Term Exposure to Residential Green and Blue Spaces: A Systematic Review. Int. J. Environ. Res. Public Health 2015, 12, 4354–4379. [Google Scholar] [CrossRef] [Green Version]
  19. Kaplan, S. The restorative benefits of nature: Toward an integrative framework. J. Environ. Psychol. 1995, 15, 169–182. [Google Scholar] [CrossRef]
  20. Maas, J.; Van Dillen, S.M.E.; Verheij, R.A.; Groenewegen, P.P. Social contacts as a possible mechanism behind the relation between green space and health. Health Place 2009, 15, 586–595. [Google Scholar] [CrossRef] [Green Version]
  21. Ruijsbroek, A.; Mohnen, S.M.; Droomers, M.; Kruize, H.; Gidlow, C.; Gražulevičiene, R.; Andrusaityte, S.; Maas, J.; Nieuwenhuijsen, M.J.; Triguero-Mas, M.; et al. Neighbourhood green space, social environment and mental health: An examination in four European cities. Int. J. Public Health 2017, 62, 657–667. [Google Scholar] [CrossRef] [PubMed] [Green Version]
  22. Rigolon, A. Parks and young people: An environmental justice study of park proximity, acreage, and quality in Denver, Colorado. Landsc. Urban Plan. 2017, 165, 73–83. [Google Scholar] [CrossRef]
  23. Floyd, M.F.; Bocarro, J.N.; Smith, W.R.; Baran, P.K.; Moore, R.C.; Cosco, N.G.; Edwards, M.B.; Suau, L.J.; Fang, K. Park-Based Physical Activity Among Children and Adolescents. Am. J. Prev. Med. 2011, 41, 258–265. [Google Scholar] [CrossRef] [PubMed]
  24. Lindberg, M.; Schipperijn, J. Active use of urban park facilities – Expectations versus reality. Urban For. Urban Green. 2015, 14, 909–918. [Google Scholar] [CrossRef]
  25. Veitch, J.; Carver, A.; Abbott, G.; Giles-Corti, B.; Timperio, A.; Salmon, J. How active are people in metropolitan parks? An observational study of park visitation in Australia. BMC Public Health 2015, 15, 610. [Google Scholar] [CrossRef] [Green Version]
  26. Karsten, L. It all used to be better? Different generations on continuity and change in urban children’s daily use of space. Child. Geogr. 2005, 3, 275–290. [Google Scholar] [CrossRef]
  27. Su, M.; Tan, Y.; Liu, Q.; Ren, Y.; Kawachi, I.; Li, L.; Lv, J. Association between perceived urban built environment attributes and leisure-time physical activity among adults in Hangzhou, China. Prev. Med. 2014, 66, 60–64. [Google Scholar] [CrossRef] [Green Version]
  28. Özgüner, H. Cultural differences in attitudes towards urban parks and green spaces. Landsc. Res. 2011, 36, 599–620. [Google Scholar] [CrossRef]
  29. Ho, C.H.; Sasidharan, V.; Elmendorf, W.; Willits, F.K.; Graefe, A.; Godbey, G. Gender and ethnic variations in urban park preferences, visitation, and perceived benefits. J. Leis. Res. 2005, 37, 281–306. [Google Scholar] [CrossRef]
  30. Sasidharan, V.; And, F.W.; Godbey, G. Cultural differences in urban recreation patterns: An examination of park usage and activity participation across six population subgroups. Manag. Leis. 2005, 10, 19–38. [Google Scholar] [CrossRef]
  31. Kaczynski, A.T.; Potwarka, L.R.; Smale, B.J.A.; Havitz, M.E. Association of Parkland Proximity with Neighborhood and Park-based Physical Activity: Variations by Gender and Age. Leis. Sci. 2009, 31, 174–191. [Google Scholar] [CrossRef]
  32. Zhai, Y.; Baran, P.K. Do configurational attributes matter in context of urban parks? Park pathway configurational attributes and senior walking. Landsc. Urban Plan. 2016, 148, 188–202. [Google Scholar] [CrossRef]
  33. Zhai, Y.; Baran, P.K. Urban park pathway design characteristics and senior walking behavior. Urban For. Urban Green. 2017, 21, 60–73. [Google Scholar] [CrossRef]
  34. Zhang, W.; Yang, J.; Ma, L.; Huang, C. Factors affecting the use of urban green spaces for physical activities: Views of young urban residents in Beijing. Urban For. Urban Green. 2015, 14, 851–857. [Google Scholar] [CrossRef]
  35. Liu, H.; Li, F.; Xu, L.; Han, B. The impact of socio-demographic, environmental, and individual factors on urban park visitation in Beijing, China. J. Clean. Prod. 2017, 163, S181–S188. [Google Scholar] [CrossRef]
  36. Liu, H.; Li, F.; Li, J.; Zhang, Y. The relationships between urban parks, residents’ physical activity, and mental health benefits: A case study from Beijing, China. J. Environ. Manag. 2017, 190, 223–230. [Google Scholar] [CrossRef] [PubMed]
  37. Ajzen, I. The theory of planned behavior. Organ. Behav. Hum. Decis. Process. 1991, 50, 179–211. [Google Scholar] [CrossRef]
  38. Ajzen, I. Behavioral interventions: Design and evaluation guided by the theory of planned behavior. In Social Psychology and Evaluation; The Guilford Press: New York, NY, USA, 2011; pp. 74–100. [Google Scholar]
  39. Luo, J.; Qu, Z.; Rockett, I.; Zhang, X. Employment status and self-rated health in north-western China. Public Health 2010, 124, 174–179. [Google Scholar] [CrossRef]
  40. Yang, T.; Rockett, I.R.H.; Lv, Q.; Cottrell, R.R. Stress Status and Related Characteristics among Urban Residents: A Six-Province Capital Cities Study in China. PLoS ONE 2012, 7, e30521. [Google Scholar]
  41. Audrey, S.; Batista-Ferrer, H. Healthy urban environments for children and young people: A systematic review of intervention studies. Health Place 2015, 36, 97–117. [Google Scholar] [CrossRef] [Green Version]
  42. The CPC Central Committee and the State Council. Medium and long term Youth Development Plan (2016–2025). Available online: http://www.gov.cn/zhengce/2017-04/13/content_5185555.htm#1 (accessed on 10 March 2020).
  43. Yen, Y.; Wang, Z.; Shi, Y.; Xu, F.; Soeung, B.; Sohail, M.T.; Rubakula, G.; Juma, S.A. The predictors of the behavioral intention to the use of urban green spaces: The perspectives of young residents in Phnom Penh, Cambodia. Habitat Int. 2017, 64, 98–108. [Google Scholar] [CrossRef]
  44. Ajzen, I.; Driver, B.L. Application of the Theory of Planned Behavior to Leisure Choice. J. Leis. Res. 1992, 24, 207–224. [Google Scholar] [CrossRef]
  45. Wan, C.; Shen, G.Q.; Choi, S. The moderating effect of subjective norm in predicting intention to use urban green spaces: A study of Hong Kong. Sustain. Cities Soc. 2018, 37, 288–297. [Google Scholar] [CrossRef]
  46. Zhang, J.; Tan, P.Y. Demand for parks and perceived accessibility as key determinants of urban park use behavior. Urban For. Urban Green. 2019, 44, 126420. [Google Scholar] [CrossRef]
  47. Fongar; Aamodt; Randrup; Solfjeld Does Perceived Green Space Quality Matter? Linking Norwegian Adult Perspectives on Perceived Quality to Motivation and Frequency of Visits. Int. J. Environ. Res. Public Health 2019, 16, 2327. [CrossRef] [Green Version]
  48. Chen, B.; Bao, Z.; Zhu, Z. Assessing the willingness of the public to pay to conserve urban green space: The hangzhou city, China, case. J. Environ. Health 2006, 69, 28–30. [Google Scholar]
  49. Zhang, X.; Ni, Z.; Wang, Y.; Chen, S.; Xia, B. Public perception and preferences of small urban green infrastructures: A case study in Guangzhou, China. Urban For. Urban Green. 2020, 53, 126700. [Google Scholar] [CrossRef]
  50. Irvine, K.; Warber, S.; Devine-Wright, P.; Gaston, K. Understanding Urban Green Space as a Health Resource: A Qualitative Comparison of Visit Motivation and Derived Effects among Park Users in Sheffield, UK. Int. J. Environ. Res. Public Health 2013, 10, 417–442. [Google Scholar] [CrossRef]
  51. Nordh, H.; Alalouch, C.; Hartig, T. Assessing restorative components of small urban parks using conjoint methodology. Urban For. Urban Green. 2011, 10, 95–103. [Google Scholar] [CrossRef]
  52. Voigt, A.; Kabisch, N.; Wurster, D.; Haase, D.; Breuste, J. Structural Diversity: A Multi-dimensional Approach to Assess Recreational Services in Urban Parks. Ambio 2014, 43, 480–491. [Google Scholar] [CrossRef] [Green Version]
  53. Shanahan, D.F.; Lin, B.B.; Gaston, K.J.; Bush, R.; Fuller, R.A. What is the role of trees and remnant vegetation in attracting people to urban parks? Landsc. Ecol. 2015, 30, 153–165. [Google Scholar] [CrossRef] [Green Version]
  54. Geissler, G.L.; Rucks, C.T. The overall theme park experience: A visitor satisfaction tracking study. J. Vacat. Mark. 2011, 17, 127–138. [Google Scholar] [CrossRef]
  55. Sullivan, W.C.; Kuo, F.E.; Depooter, S.F. The Fruit of Urban Nature. Environ. Behav. 2004, 36, 678–700. [Google Scholar] [CrossRef]
  56. Moran, M.; Van Cauwenberg, J.; Hercky-Linnewiel, R.; Cerin, E.; Deforche, B.; Plaut, P. Understanding the relationships between the physical environment and physical activity in older adults: A systematic review of qualitative studies. Int. J. Behav. Nutr. Phys. Act. 2014, 11, 79. [Google Scholar] [CrossRef] [PubMed] [Green Version]
  57. Sreetheran, M.; Van den Bosch, C.C.K. A socio-ecological exploration of fear of crime in urban green spaces—A systematic review. Urban For. Urban Green. 2014, 13, 1–18. [Google Scholar] [CrossRef]
  58. Wang, D.; Brown, G.; Liu, Y. The physical and non-physical factors that influence perceived access to urban parks. Landsc. Urban Plan. 2015, 133, 53–66. [Google Scholar] [CrossRef]
  59. Abdul Malek, N.; Nashar, A. Do Duration of Stay and Park Visitation Matter? An Evaluation of Park Distance. Plan. MALAYSIA 2020, 18, 84–93. [Google Scholar] [CrossRef]
  60. Rung, A.L.; Mowen, A.J.; Broyles, S.T.; Gustat, J. The Role of Park Conditions and Features on Park Visitation and Physical Activity. J. Phys. Act. Heal. 2011, 8, S178–S187. [Google Scholar] [CrossRef] [Green Version]
  61. Cohen, D.A.; Han, B.; Nagel, C.J.; Harnik, P.; McKenzie, T.L.; Evenson, K.R.; Marsh, T.; Williamson, S.; Vaughan, C.; Katta, S. The First National Study of Neighborhood Parks. Am. J. Prev. Med. 2016, 51, 419–426. [Google Scholar] [CrossRef] [Green Version]
  62. Cohen, D.A.; McKenzie, T.L.; Sehgal, A.; Williamson, S.; Golinelli, D.; Lurie, N. Contribution of Public Parks to Physical Activity. Am. J. Public Health 2007, 97, 509–514. [Google Scholar] [CrossRef]
  63. Iwarsson, S.; Ståhl, A. Accessibility, usability and universal designE—positioning and definition of concepts describing person-environment relationships. Disabil. Rehabil. 2003, 25, 57–66. [Google Scholar] [CrossRef] [PubMed]
  64. Coombes, E.; Jones, A.P.; Hillsdon, M. The relationship of physical activity and overweight to objectively measured green space accessibility and use. Soc. Sci. Med. 2010, 70, 816–822. [Google Scholar] [CrossRef] [PubMed] [Green Version]
  65. Kaczynski, A.T.; Potwarka, L.R.; Saelens, B.E. Association of Park Size, Distance, and Features With Physical Activity in Neighborhood Parks. Am. J. Public Health 2008, 98, 1451–1456. [Google Scholar] [CrossRef] [PubMed]
  66. Baran, P.K.; Smith, W.R.; Moore, R.C.; Floyd, M.F.; Bocarro, J.N.; Cosco, N.G.; Danninger, T.M. Park Use Among Youth and Adults: Examination of Individual, Social, and Urban Form Factors. Environ. Behav. 2014, 46, 768–800. [Google Scholar] [CrossRef]
  67. White, M.; Smith, A.; Humphryes, K.; Pahl, S.; Snelling, D.; Depledge, M. Blue space: The importance of water for preference, affect, and restorativeness ratings of natural and built scenes. J. Environ. Psychol. 2010, 30, 482–493. [Google Scholar] [CrossRef]
  68. Ode Sang, Å.; Knez, I.; Gunnarsson, B.; Hedblom, M. The effects of naturalness, gender, and age on how urban green space is perceived and used. Urban For. Urban Green. 2016, 18, 268–276. [Google Scholar] [CrossRef]
  69. McCormack, G.R.; Rock, M.; Toohey, A.M.; Hignell, D. Characteristics of urban parks associated with park use and physical activity: A review of qualitative research. Health Place 2010, 16, 712–726. [Google Scholar] [CrossRef]
  70. Van Hecke, L.; Verhoeven, H.; Clarys, P.; Van Dyck, D.; Van de Weghe, N.; Baert, T.; Deforche, B.; Van Cauwenberg, J. Factors related with public open space use among adolescents: A study using GPS and accelerometers. Int. J. Health Geogr. 2018, 17, 1–16. [Google Scholar] [CrossRef]
  71. Ries, A.V.; Voorhees, C.C.; Roche, K.M.; Gittelsohn, J.; Yan, A.F.; Astone, N.M. A Quantitative Examination of Park Characteristics Related to Park Use and Physical Activity Among Urban Youth. J. Adolesc. Heal. 2009, 45, S64–S70. [Google Scholar] [CrossRef]
  72. Lin, B.B.; Fuller, R.A.; Bush, R.; Gaston, K.J.; Shanahan, D.F. Opportunity or orientation? Who uses urban parks and why. PLoS ONE 2014, 9, e87422. [Google Scholar] [CrossRef] [Green Version]
  73. Wang, D.; Brown, G.; Liu, Y.; Mateo-Babiano, I. A comparison of perceived and geographic access to predict urban park use. Cities 2015, 42, 85–96. [Google Scholar] [CrossRef]
  74. Wan, C.; Shen, G.Q. Encouraging the use of urban green space: The mediating role of attitude, perceived usefulness and perceived behavioural control. Habitat Int. 2015, 50, 130–139. [Google Scholar] [CrossRef]
  75. Kuo, F.E.; Sullivan, W.C.; Coley, R.L.; Brunson, L. Fertile Ground for Community: Inner-City Neighborhood Common Spaces. Am. J. Community Psychol. 1998, 26, 823–851. [Google Scholar] [CrossRef]
  76. McCormack, G.R.; Cerin, E.; Leslie, E.; Du Toit, L.; Owen, N. Objective Versus Perceived Walking Distances to Destinations. Environ. Behav. 2008, 40, 401–425. [Google Scholar] [CrossRef]
  77. Beijing Municipal Bureau of Statistics. Beijing Statistical Yearbook 2019. Available online: http://nj.tjj.beijing.gov.cn/nj/main/2019-tjnj/zk/indexch.htm (accessed on 10 March 2020).
  78. Beijing Municipal Bureau of Landscape and Forestry. Urban greening resources in Beijing in 2018. Available online: http://yllhj.beijing.gov.cn/zwgk/tjxx/201904/t20190404_531241.html (accessed on 10 March 2020).
  79. Beijing Municipal Administration Center of Parks. Park Enquiries throughout the City. Available online: http://www.bjmacp.gov.cn/qsgycx.ASPX (accessed on 16 January 2015).
  80. Xi’an Bureau of Statistics. Xi’an 2018 Statistical Communique on National Economic and Social Development. Available online: http://tjj.xa.gov.cn/tjsj/tjgb/gmjjhshfzgb/5d7fc5b1f99d651bbeb377a7.html (accessed on 10 March 2020).
  81. Guangzhou Bureau of Statistics. Guangzhou Statistical Yearbook 2019. Available online: http://210.72.4.58/portal/queryInfo/statisticsYearbook/index (accessed on 10 March 2020).
  82. Andresen, W. Evaluating an asset-based effort to attract and retain young people. Community Dev. 2012, 43, 49–62. [Google Scholar] [CrossRef]
  83. China Internet Network Information Center. The 45th China Statistical Report on Internet Development. Available online: http://www.cac.gov.cn/2020-04/27/c_1589535470378587.htm (accessed on 10 March 2020).
  84. Organization., W.H. Basic Documents: Forty-Ninth Edition (Including Amendments Adopted up to 31 May 2019). Available online: https://apps.who.int/gb/bd/pdf_files/BD_49th-en.pdf (accessed on 10 March 2020).
  85. Wallston, B.S.; Alagna, S.W.; DeVellis, B.M.; DeVellis, R.F. Social support and physical health. Heal. Psychol. 1983, 2, 367–391. [Google Scholar] [CrossRef]
  86. Huber, M.; André Knottnerus, J.; Green, L.; Van Der Horst, H.; Jadad, A.R.; Kromhout, D.; Leonard, B.; Lorig, K.; Loureiro, M.I.; Van Der, M.; et al. How should we define health? BMJ 2011, 343, 1–3. [Google Scholar] [CrossRef] [Green Version]
  87. Zhang, L.; Zhou, S.; Kwan, M.-P. A comparative analysis of the impacts of objective versus subjective neighborhood environment on physical, mental, and social health. Health Place 2019, 59, 102170. [Google Scholar] [CrossRef]
  88. World Health Organization. Mental Health: New Understanding, New Hope. JAMA 2001, 286, 2391. [Google Scholar] [CrossRef]
  89. Veitch, J.; Salmon, J.; Deforche, B.; Ghekiere, A.; Van Cauwenberg, J.; Bangay, S.; Timperio, A. Park attributes that encourage park visitation among adolescents: A conjoint analysis. Landsc. Urban Plan. 2017, 161, 52–58. [Google Scholar] [CrossRef]
  90. Yigitcanlar, T.; Kamruzzaman, M.; Teimouri, R.; Degirmenci, K.; Alanjagh, F.A. Association between park visits and mental health in a developing country context: The case of Tabriz, Iran. Landsc. Urban Plan. 2020, 199, 103805. [Google Scholar] [CrossRef]
  91. Stewart, O.T.; Moudon, A.V.; Littman, A.J.; Seto, E.; Saelens, B.E. The Association Between Park Facilities and Duration of Physical Activity During Active Park Visits. J. Urban Heal. 2018, 95, 869–880. [Google Scholar] [CrossRef] [PubMed]
  92. Zhang, S.; Zhou, W. Recreational visits to urban parks and factors affecting park visits: Evidence from geotagged social media data. Landsc. Urban Plan. 2018, 180, 27–35. [Google Scholar] [CrossRef]
  93. Grilli, G.; Mohan, G.; Curtis, J. Public park attributes, park visits, and associated health status. Landsc. Urban Plan. 2020, 199, 103814. [Google Scholar] [CrossRef]
  94. Wan, C.; Shen, G.Q.; Choi, S.; Calvin Wan, Geoffrey Qiping Shen, S. C. Effects of physical and psychological factors on users’ attitudes, use patterns, and perceived benefits toward urban parks. Urban For. Urban Green. 2020, 51, 126691. [Google Scholar] [CrossRef]
  95. Roberts, H.; Kellar, I.; Conner, M.; Gidlow, C.; Kelly, B.; Nieuwenhuijsen, M.; McEachan, R. Associations between park features, park satisfaction and park use in a multi-ethnic deprived urban area. Urban For. Urban Green. 2019, 46, 126485. [Google Scholar] [CrossRef] [Green Version]
  96. O’brien, R.M. A Caution Regarding Rules of Thumb for Variance Inflation Factors. Qual. Quant. 2007, 41, 673–690. [Google Scholar] [CrossRef]
  97. Bagozzi, R.P.; Yi, Y. On the evaluation of structural equation models. J. Acad. Mark. Sci. 1988, 16, 74–94. [Google Scholar] [CrossRef]
  98. O’Fallon, W.M.; Cooley, W.W.; Lohnes, P.R. Multivariate Data Analysis. Technometrics 1973, 15, 648. [Google Scholar] [CrossRef]
  99. Smith, W. Does Gender Influence Online Survey Participation? A Record-Linkage Analysis of University Faculty Online Survey Response Behavior. Online Submiss. 2008, 501717, 21. [Google Scholar]
  100. Richardson, E.A.; Mitchell, R. Gender differences in relationships between urban green space and health in the United Kingdom. Soc. Sci. Med. 2010, 71, 568–575. [Google Scholar] [CrossRef] [PubMed] [Green Version]
  101. LARRIMORE, J. Does a Higher Income Have Positive Health Effects? Using the Earned Income Tax Credit to Explore the Income-Health Gradient. Milbank Q. 2011, 89, 694–727. [Google Scholar] [CrossRef] [PubMed] [Green Version]
  102. Byrne, J.; Wolch, J. Nature, race, and parks: Past research and future directions for geographic research. Prog. Hum. Geogr. 2009, 33, 743–765. [Google Scholar] [CrossRef] [Green Version]
  103. Mowen, A.J.; Confer, J.J. The Relationship between Perceptions, Distance, and Socio-demographic Characteristics upon Public Use of an Urban Park “In-Fill. ” J. Park Recreat. Admi. 2003, 21, 58–74. [Google Scholar]
  104. Brown, G.; Rhodes, J.; Dade, M. An evaluation of participatory mapping methods to assess urban park benefits. Landsc. Urban Plan. 2018, 178, 18–31. [Google Scholar] [CrossRef] [Green Version]
  105. Lyu, F.; Zhang, L. Using multi-source big data to understand the factors affecting urban park use in Wuhan. Urban For. Urban Green. 2019, 43, 126367. [Google Scholar] [CrossRef]
  106. Schipperijn, J.; Stigsdotter, U.K.; Randrup, T.B.; Troelsen, J. Influences on the use of urban green space—A case study in Odense, Denmark. Urban For. Urban Green. 2010, 9, 25–32. [Google Scholar] [CrossRef]
  107. Giles-Corti, B.; Broomhall, M.H.; Knuiman, M.; Collins, C.; Douglas, K.; Ng, K.; Lange, A.; Donovan, R.J. Increasing walking: How important is distance to, attractiveness, and size of public open space? Am. J. Prev. Med. 2005, 28, 169–176. [Google Scholar] [CrossRef]
  108. Cohen, D.A.; Marsh, T.; Williamson, S.; Derose, K.P.; Martinez, H.; Setodji, C.; McKenzie, T.L. Parks and physical activity: Why are some parks used more than others? Prev. Med. 2010, 50, S9–S12. [Google Scholar] [CrossRef] [Green Version]
  109. Schipperijn, J.; Bentsen, P.; Troelsen, J.; Toftager, M.; Stigsdotter, U.K. Associations between physical activity and characteristics of urban green space. Urban For. Urban Green. 2013, 12, 109–116. [Google Scholar] [CrossRef]
  110. Gubbels, J.S.; Kremers, S.P.J.; Droomers, M.; Hoefnagels, C.; Stronks, K.; Hosman, C.; De Vries, S. The impact of greenery on physical activity and mental health of adolescent and adult residents of deprived neighborhoods: A longitudinal study. Health Place 2016, 40, 153–160. [Google Scholar] [CrossRef] [PubMed]
  111. Negami, H.R.; Mazumder, R.; Reardon, M.; Ellard, C.G. Field analysis of psychological effects of urban design: A case study in Vancouver. Cities Health 2018, 2, 106–115. [Google Scholar] [CrossRef]
  112. Lo, S.M.; Yiu, C.Y.; Lo, A. An analysis of attributes affecting urban open space design and their environmental implications. Manag. Environ. Qual. An Int. J. 2003, 14, 604–614. [Google Scholar] [CrossRef]
  113. Schinasi, L.H.; Benmarhnia, T.; De Roos, A.J. Modification of the association between high ambient temperature and health by urban microclimate indicators: A systematic review and meta-analysis. Environ. Res. 2018, 161, 168–180. [Google Scholar] [CrossRef] [PubMed]
  114. De Bell, S.; Graham, H.; Jarvis, S.; White, P. The importance of nature in mediating social and psychological benefits associated with visits to freshwater blue space. Landsc. Urban Plan. 2017, 167, 118–127. [Google Scholar] [CrossRef]
  115. Zhang, T.; Liu, J.; Li, H. Restorative Effects of Multi-Sensory Perception in Urban Green Space: A Case Study of Urban Park in Guangzhou, China. Int. J. Environ. Res. Public Health 2019, 16, 4943. [Google Scholar] [CrossRef] [PubMed] [Green Version]
  116. Veitch, J.; Salmon, J.; Parker, K.; Bangay, S.; Deforche, B.; Timperio, A. Adolescents’ ratings of features of parks that encourage park visitation and physical activity. Int. J. Behav. Nutr. Phys. Act. 2016, 13, 73. [Google Scholar] [CrossRef] [Green Version]
  117. Payne, L.L.; Mowen, A.J.; Orsega-Smith, E. An Examination of Park Preferences and Behaviors Among Urban Residents: The Role of Residential Location, Race, and Age. Leis. Sci. 2002, 24, 181–198. [Google Scholar] [CrossRef]
  118. Chen, W.Y.; Jim, C.Y. Cost–benefit analysis of the leisure value of urban greening in the new Chinese city of Zhuhai. Cities 2008, 25, 298–309. [Google Scholar] [CrossRef]
  119. Xu, Y.; Qi, J.; Yang, Y.; Wen, X. The contribution of lifestyle factors to depressive symptoms: A cross-sectional study in Chinese college students. Psychiatry Res. 2016, 245, 243–249. [Google Scholar] [CrossRef]
  120. Damon, W.; Lerner, R.M. Child and Adolescent Development: An Advanced Course; Wiley: Hoboken, NJ, USA, 2008; Volume 19, ISBN 9780470176573. [Google Scholar]
  121. Biernacka, M.; Kronenberg, J. Urban Green Space Availability, Accessibility and Attractiveness, and the Delivery of Ecosystem Services. Cities Environ. 2019, 12, 5. [Google Scholar]
  122. Opić, S.; Đuranović, M. Leisure Time of Young Due to Some Socio-demographic Characteristics. Procedia Soc. Behav. Sci. 2014, 159, 546–551. [Google Scholar] [CrossRef] [Green Version]
  123. Schipperijn, J.; Ekholm, O.; Stigsdotter, U.K.; Toftager, M.; Bentsen, P.; Kamper-Jørgensen, F.; Randrup, T.B. Factors influencing the use of green space: Results from a Danish national representative survey. Landsc. Urban Plan. 2010, 95, 130–137. [Google Scholar] [CrossRef]
  124. Dan, Z. The Study on America’s Sports Parks; Soochow University: Suzhou, China, 2017. [Google Scholar]
  125. Veitch, J.; Christian, H.; Carver, A.; Salmon, J. Physical activity benefits from taking your dog to the park. Landsc. Urban Plan. 2019, 185, 173–179. [Google Scholar] [CrossRef]
  126. Van Hecke, L.; Ghekiere, A.; Van Cauwenberg, J.; Veitch, J.; De Bourdeaudhuij, I.; Van Dyck, D.; Clarys, P.; Van De Weghe, N.; Deforche, B. Park characteristics preferred for adolescent park visitation and physical activity: A choice-based conjoint analysis using manipulated photographs. Landsc. Urban Plan. 2018, 178, 144–155. [Google Scholar] [CrossRef]
  127. Pietrzyk-Kaszyńska, A.; Czepkiewicz, M.; Kronenberg, J. Eliciting non-monetary values of formal and informal urban green spaces using public participation GIS. Landsc. Urban Plan. 2017, 160, 85–95. [Google Scholar] [CrossRef]
  128. Plane, J.; Klodawsky, F. Neighbourhood amenities and health: Examining the significance of a local park. Soc. Sci. Med. 2013, 99, 1–8. [Google Scholar] [CrossRef]
  129. Veitch, J.; Carver, A.; Hume, C.; Crawford, D.; Timperio, A.; Ball, K.; Salmon, J. Are independent mobility and territorial range associated with park visitation among youth? Int. J. Behav. Nutr. Phys. Act. 2014, 11, 73. [Google Scholar] [CrossRef] [Green Version]
  130. Hagger, M.S.; Chatzisarantis, N.; Biddle, S.J.H. The influence of self-efficacy and past behaviour on the physical activity intentions of young people. J. Sports Sci. 2001, 19, 711–725. [Google Scholar] [CrossRef]
  131. Ward Thompson, C.; Roe, J.; Aspinall, P.; Mitchell, R.; Clow, A.; Miller, D. More green space is linked to less stress in deprived communities: Evidence from salivary cortisol patterns. Landsc. Urban Plan. 2012, 105, 221–229. [Google Scholar] [CrossRef] [Green Version]
Figure 1. Potential relationships among perception of green space for health promotion, willingness to use parks and actual park use behavior among young urban residents.
Ijerph 17 05560 g001
Figure 2. Locations selected for conducting the questionnaire.
Ijerph 17 05560 g002
Table 1. Reliability and validity analysis.
VariableItemsLoading ValueCronbach’s αCRAVE
Green space attributesAccess0.8010.8290.8290.618
Type0.773
Size0.785
Landscape characteristicsPlants0.8260.9020.9040.703
Water0.826
Sensory features0.872
Microclimate Environments0.828
FacilitiesRest facilities0.6770.7560.7810.645
Amenity facilities0.912
Table 2. Demographic characteristics of participants (N = 1135).
CharacteristicsNumberPercentage (%)
Age
18–2568760.5
26–3023120.4
31–3521719.1
Gender
Male36432.1
Female77167.9
Education level
High school or below514.5
Bachelor’s degree75366.3
Master’s degree28224.8
Doctorate494.3
Income
<100038133.6
1000–200011710.3
2000–3000867.6
3000–500016814.8
5000–10,00022419.7
10,000–20,00011810.4
>20,000413.6
City
Beijing39034.4
Xi’an32728.8
Guangzhou41836.8
Residence location
Central city70161.8
Suburban districts39034.4
Others443.9
Table 3. Descriptive statistics for the dependent and independent variables (N = 1149).
ItemMeanStandard Deviation
Dependent variables: Park use willingness and behavior
Willingness to use parks to promote health
Physical health4.040.97
Mental health4.420.87
Social health4.000.99
Park use behavior
Frequency of park visits3.421.37
Duration of park visits2.230.82
Independent variables: Perception of green space components for health promotion
Green space attributes
Access4.260.90
Type4.130.98
Size4.110.96
Landscape characteristics
Plants4.190.93
Water4.150.95
Sensory features4.280.83
Microclimate environments4.260.89
Facilities
Rest facilities3.841.07
Amenity facilities4.070.90
Table 4. Correlation analyses among the variables.
1234567891011121314151617181920
1. AGE
2. GEN−0.196 **
3. EDU0.147 **−0.078 **
4. INC0.661 **−0.251 **0.078 **
5. CIT0.124 **−0.022−0.253 **0.087 **
6. RES−0.094 **0.0200.000−0.093 **−0.036
7. ACC0.109 **0.0430.081 **0.073 *0.006−0.063 *
8. TYP0.080 **0.0070.0150.081 **0.116 **−0.0530.540 **
9. SIZ0.153 **0.0090.087 **0.134 **0.060 *−0.0190.586 **0.559 **
10. PLA0.065 *0.077 **0.128 **0.040−0.004−0.0120.480 **0.494 **0.501 **
11. WAT0.0120.0300.073 *0.0040.030−0.0250.470 **0.499 **0.462 **0.675 **
12. SEN0.0350.0570.0540.030−0.015−0.0280.493 **0.447 **0.440 **0.619 **0.623 **
13. MIC0.085 **0.0340.072 *0.100 **0.012−0.0290.483 **0.463 **0.470 **0.582 **0.564 **0.676 **
14. RES0.097 **0.0350.0150.061 *0.049−0.0340.327 **0.391 **0.381 **0.422 **0.462 **0.441 **0.449 **
15. AME0.0090.071 *−0.0470.0060.052−0.0490.454 **0.507 **0.403 **0.527 **0.580 **0.579 **0.560 **0.602 **
16. PHY0.084 **−0.0190.0280.0510.027−0.0350.538 **0.465 **0.513 **0.405 **0.410 **0.438 **0.433 **0.352 **0.434 **
17. MEN0.083 **0.0240.106 **0.043−0.032−0.0090.531 **0.454 **0.508 **0.484 **0.440 **0.486 **0.465 **0.307 **0.371 **0.567 **
18. SOC0.107 **−0.0420.060 *0.090 **0.023−0.0100.489 **0.490 **0.475 **0.428 **0.441 **0.385 **0.406 **0.354 **0.398 **0.576 **0.544 **
19. FRE0.052−0.050−0.0050.0130.047−0.0270.152 **0.114 **0.130 **0.139 **0.109 **0.138 **0.142 **0.123 **0.161 **0.198 **0.137 **0.145 **
20. DUR0.090 **−0.0270.0170.099 **−0.007−0.0240.0450.069 *0.068 *0.113 **0.077 **0.115 **0.060 *0.081 **0.086 **0.0390.092 **0.071 *0.062 *
Note: AGE—age; GEN—gender; EDU—education level; INC—income; CIT—city; RES—residence location; ACC—access; TYP—Type; SIZ—size; PLA—plants; WAT—water; SEN—sensory features; MIC—microclimate environments; RES—rest facilities; AME—amenity facilities; PHY—physical health; MEN—mental health; SOC—social health; FRE—frequency of park visits; DUR—duration of park visits. * p < 0.05; ** p < 0.01.
Table 5. Multiple regression results with willingness to use parks to promote health as the dependent variable.
VariableModel 1
(Physical Health)
Model 2
(Mental Health)
Model 3
(Social Health)
CoefficientsVIFCoefficientsVIFCoefficientsVIF
Demographic variablesAge0.0331.0960.0281.0960.0391.096
Gender−0.058 *1.078−0.0121.078−0.064 *1.078
Education level−0.0351.7940.0291.794−0.0081.794
Income−0.0531.815−0.061 *1.815−0.0131.815
Green space attributesAccess0.289 **2.2150.301 **2.2150.229 **2.215
Type0.109 **2.0810.098 **2.0810.151 **2.081
Size0.179 **2.1580.172 **2.1580.151 **2.158
Landscape characteristicsPlants0.0112.8 550.130 **2.8550.0602.855
Water−0.0172.8590.0292.8590.174 **2.859
Sensory features0.129 **3.3870.136 **3.387−0.0533.387
Microclimate environments0.0192.8510.107 **2.8510.0432.851
FacilitiesRest facilities0.0391.706−0.0201.7060.0381.706
Amenity facilities0.079 *2.830−0.0452.8300.0122.830
R20.464 0.578 0.426
Adjusted R20.458 0.573 0.419
F-statistic74.596 ** 118.272 ** 64.024 **
Note: Independent variable—perception of green space components for health promotion. VIF—variance inflation factor. * p < 0.05; ** p < 0.01.
Table 6. Multiple regression results with park use behavior as the dependent variable.
VariableModel 4
(Frequency of Park Visits)
Model 5
(Duration of Park Visits)
CoefficientsVIFCoefficientsVIF
Demographic variablesAge0.099 *1.096−0.0531.093
Gender−0.067 *1.0780.0391.077
Education level−0.0421.7940.0451.788
Income−0.0581.815−0.0331.814
Green space attributesAccess0.097 *2.215
Type−0.0602.081−0.0181.995
Size0.0352.1580.0261.953
Landscape characteristicsPlants0.0432.855−0.102 *2.855
Water−0.0442.8590.0642.857
Sensory features−0.0023.387−0.0773.288
Microclimate environments0.0522.8510.120 *2.845
FacilitiesRest facilities0.0151.706−0.0351.699
Amenity facilities0.0752.8300.0302.790
R20.040 0.025
Adjusted R20.029 0.015
F-statistic3.599 ** 2.428 **
Note: Independent variable—perception of green space components for health promotion. VIF—variance inflation factor. * p < 0.05; ** p < 0.01.

