Filling in the Flyover Zone: High Phosphorus in Midwestern (USA) Reservoirs Results in High Phytoplankton Biomass but Not High Primary Productivity
 Erin L. Petty
 Daniel V. Obrecht
 Rebecca L. North
- MU Limnology Laboratory, School of Natural Resources, College of Food, Agriculture, and Natural Resources, University of Missouri, Columbia, MO, United States
In lakes and reservoirs, climate change increases surface water temperatures, promotes thermal stability, and decreases hypolimnetic oxygen. Increased anthropogenic land-use and precipitation enhance nutrient and sediment supply. Together, these effects alter the light and nutrient dynamics constraining phytoplankton biomass and productivity. Given that lake and reservoir processes differ, and that globally, reservoir numbers are increasing to meet water demands, reservoir-centric studies remain underrepresented. In the agricultural Midwest (United States), ubiquitous reservoirs experience eutrophy and hypolimnetic anoxia. Here, we explore influences of eutrophication and land-use on the proximate light and nutrient status of phytoplankton communities in 32 Missouri reservoirs. Light and nutrient status indicators include mixed layer irradiance, phosphorus (P) and nitrogen (N) stoichiometry/debts, photosynthetic efficiency, and photosynthetic-irradiance parameters. Contributing to the ongoing P vs. N and P management debate, we evaluate if phytoplankton biomass and productivity are constrained by light, P, N, or a combination thereof, across gradients of trophic status and land-use during two contrasting wet and dry summers. Despite agricultural prevalence, P-deficiency is more prominent than either N- or light-deficiency. In 2018, ∼46% of samples were P-deficient with ∼36% indicating neither light nor nutrient deficiency. Gross primary productivity per unit chlorophyll-a (GPPB) demonstrates negative relationships with nutrients, biomass, and turbidity, and positive relationships with light availability. GPPB is highest in oligotrophic reservoirs where light utilization efficiency is also highest. Overall, phytoplankton biomass and productivity appear constrained by P and light, respectively. If Midwestern reservoirs are precursors of future inland waters affected by climate change and eutrophication, our crystal ball indicates that both P and light will be important regulators of phytoplankton dynamics and subsequent water quality.
Introduction
Inland freshwaters, such as lakes and reservoirs, are viewed as valuable and sensitive sentinels of climatic change (Williamson et al., 2009a). Climate forcing is primarily driven by altered patterns of incident solar radiation, air temperature, and precipitation (Williamson et al., 2009b). In response to increasing air temperatures, there is global evidence that lakes are warming (Schmid et al., 2014; O’Reilly et al., 2015). While exact responses vary across systems (O’Reilly et al., 2015; Woolway and Merchant, 2017), long-term incremental increases in global air temperatures are promoting earlier, stronger, and extended stratification in many inland surface waters (Woolway and Merchant, 2019). Climate-induced alterations to vertical mixing and stratification are also expected to change in-lake productivity (O’Reilly et al., 2003; O’Beirne et al., 2017), impacting light and nutrient dynamics (Verburg and Hecky, 2009; Williamson et al., 2009b).
Climate and anthropogenic activity mutually contribute to intensify freshwater eutrophication (Jeppesen et al., 2010). Watershed land-use and regional precipitation patterns affect the supply of nutrients and sediment transported to- and transformed within- lakes and reservoirs (Hayes et al., 2015). Agriculture and urbanization have drastically increased proportions of the bioavailable macronutrients, phosphorus (P) and nitrogen (N), on the landscape and within aquatic ecosystems (Bennett et al., 2001; Galloway et al., 2008; Howarth et al., 2012). Watersheds dominated by cropland agriculture typically export nutrients and sediment to lakes and reservoirs at higher rates and concentrations than do undisturbed and/or forested watersheds (Knowlton and Jones, 1995; Knoll et al., 2003). In the central US, more intense rainfall events as a result of climate-induced changes in precipitation are expected to enhance episodic pulses of nutrients and sediment in surface runoff. These interactions influence aquatic light conditions and increase the quantity of P and N available to phytoplankton communities in lakes and reservoirs (Paerl and Scott, 2010).
Variations in light availability as well as P and N supply can impact the light and nutrient status of phytoplankton communities where a balance of light and nutrients is needed for photosynthesis, nutrient uptake, and assimilation. As such, deficiencies in light and/or nutrients play a key role in controlling phytoplankton community structure, growth, and productivity (Titman, 1976). The relative importance of P and N as controls in freshwater ecosystems, however, has been contested for decades (Schindler, 1977; Elser et al., 1990; Schindler et al., 2008; Paerl et al., 2016). The traditional paradigm designates P as the single primary macronutrient controlling phytoplankton growth and productivity in temperate freshwater lakes (Schindler, 1974, 1977; Guildford and Hecky, 2000), but there is evidence that N, too, has a role to play (Morris and Lewis, 1988; Elser et al., 1990; Lewis and Wurtsbaugh, 2008; Abell et al., 2010). Numerous inland studies even offer evidence of simultaneous control by P and N (Elser et al., 2007; North et al., 2007; Sterner, 2008; Rowland et al., 2019) and/or light (Millard et al., 1996; Guildford et al., 2000; Knowlton and Jones, 2000; Dubourg et al., 2015).
Lakes and reservoirs were once considered synonymous (Hutchinson, 1957). Contemporary limnology, however, has shown that even though they possess many shared characteristics, reservoir processes sometimes differ from those of natural lakes (Kimmel and Groeger, 1984; Hayes et al., 2017). For example, reservoirs tend to have larger watersheds with greater contributions of nutrients and sediment that promote increased productivity and reduced water clarity (Hayes et al., 2017). Reservoir-centric studies, however, are underrepresented relative to natural lake studies. As global reservoir and dam construction intensify to meet growing water demands (Zarfl et al., 2015), it may become increasingly important that we equally understand the processes of both lakes and reservoirs, particularly as they relate to climate change and eutrophication. Being the primary lentic habitat in the central US (Thornton, 1990), ubiquitous Midwestern reservoirs may serve as climate analogs for future aquatic ecosystems. High eutrophication rates in the agriculturally dominated Midwest (Mitsch et al., 2001; Jones et al., 2008a) make these reservoirs precursors of future surface water quality, as ∼94% of reservoirs in the study region are classified as mesotrophic, eutrophic, or hypertrophic (Jones et al., 2008b). Moreover, since Midwestern reservoirs regularly experience hypolimnetic anoxia during summer stratification (Jones et al., 2011), they may also forewarn how future light and nutrient dynamics will affect phytoplankton biomass and primary productivity.
Here, we explore influences of climate, eutrophication, and land-use on the proximate light and nutrient status of phytoplankton communities in 32 Midwestern reservoirs. By evaluating general indicators of water quality and proximate physiological deficiencies in the phytoplankton communities, we determine if chlorophyll-a (chla), as a proxy for phytoplankton biomass, and primary productivity are constrained by light, P, N, or a combination thereof. We explore these constraints across gradients of trophic status and land-use, which reflect gradients in nutrient concentrations as well as ambient light environments, during the climatically contrasting summers of 2017 (wet) and 2018 (dry). Decades of previous work on Midwestern reservoirs utilized Liebig’s Law of the Minimum (Von Liebig, 1840) to identify important empirical relationships between concentrations of chla, and P (r2 = 0.83) and N (r2 = 0.78; Jones et al., 2008b). Our study applies the concept of Blackman limitation (Blackman, 1905), or rate limitation, to describe the condition(s) by which phytoplankton growth, productivity, and photosynthetic responses are constrained by resource availability. We describe limitation in terms of proximate deficiency (Tyrrell, 1999), which considers the phytoplankton communities’ instantaneous responses to nutrients and/or light. We also invoke the term co-deficiency to describe simultaneous constraint by more than one resource (Saito et al., 2008), whether that be by light and a nutrient or by multiple nutrients (Healey, 1985). Building off previously elucidated relationships (Jones et al., 2008b), we predict that light and both P and N will serve as proximate controls of phytoplankton communities regardless of climatic year. Light deficiency will occur in eutrophic and hypertrophic reservoirs and nutrient deficiency in oligotrophic reservoirs; culminating in the highest phytoplankton biomass and productivity in hypertrophic reservoirs.
Materials and Methods
Study Site Description
We sampled 32 mid-continental, mid-latitude manmade reservoirs in the summers of 2017 and 2018. The reservoirs are located across Missouri, a Midwestern state in the central US (Figure 1). Missouri is characterized by five main physiographic regions (Thom and Wilson, 1980), which correspond to a gradient in dominant land-use. Our study reservoirs span four of the five physiographic regions, representing the land-use and resultant trophic status gradients (Jones et al., 2008a, b), where five of the reservoirs are oligo-, 13 meso-, 12 eu-, and 2 hyper- trophic. Trophic classification is based on average total phosphorus (TP) concentrations during the 2-year summer sampling window (criteria from Jones et al., 2008b). The reservoirs were chosen to represent a range in nutrient concentrations, underwater light conditions, phytoplankton biomass, reservoir morphology, and watershed land-use. All are warm monomictic, except for Lake Niangua, which is a shallow (6.1 m maximum depth), polymictic reservoir (Supplementary Table 1).
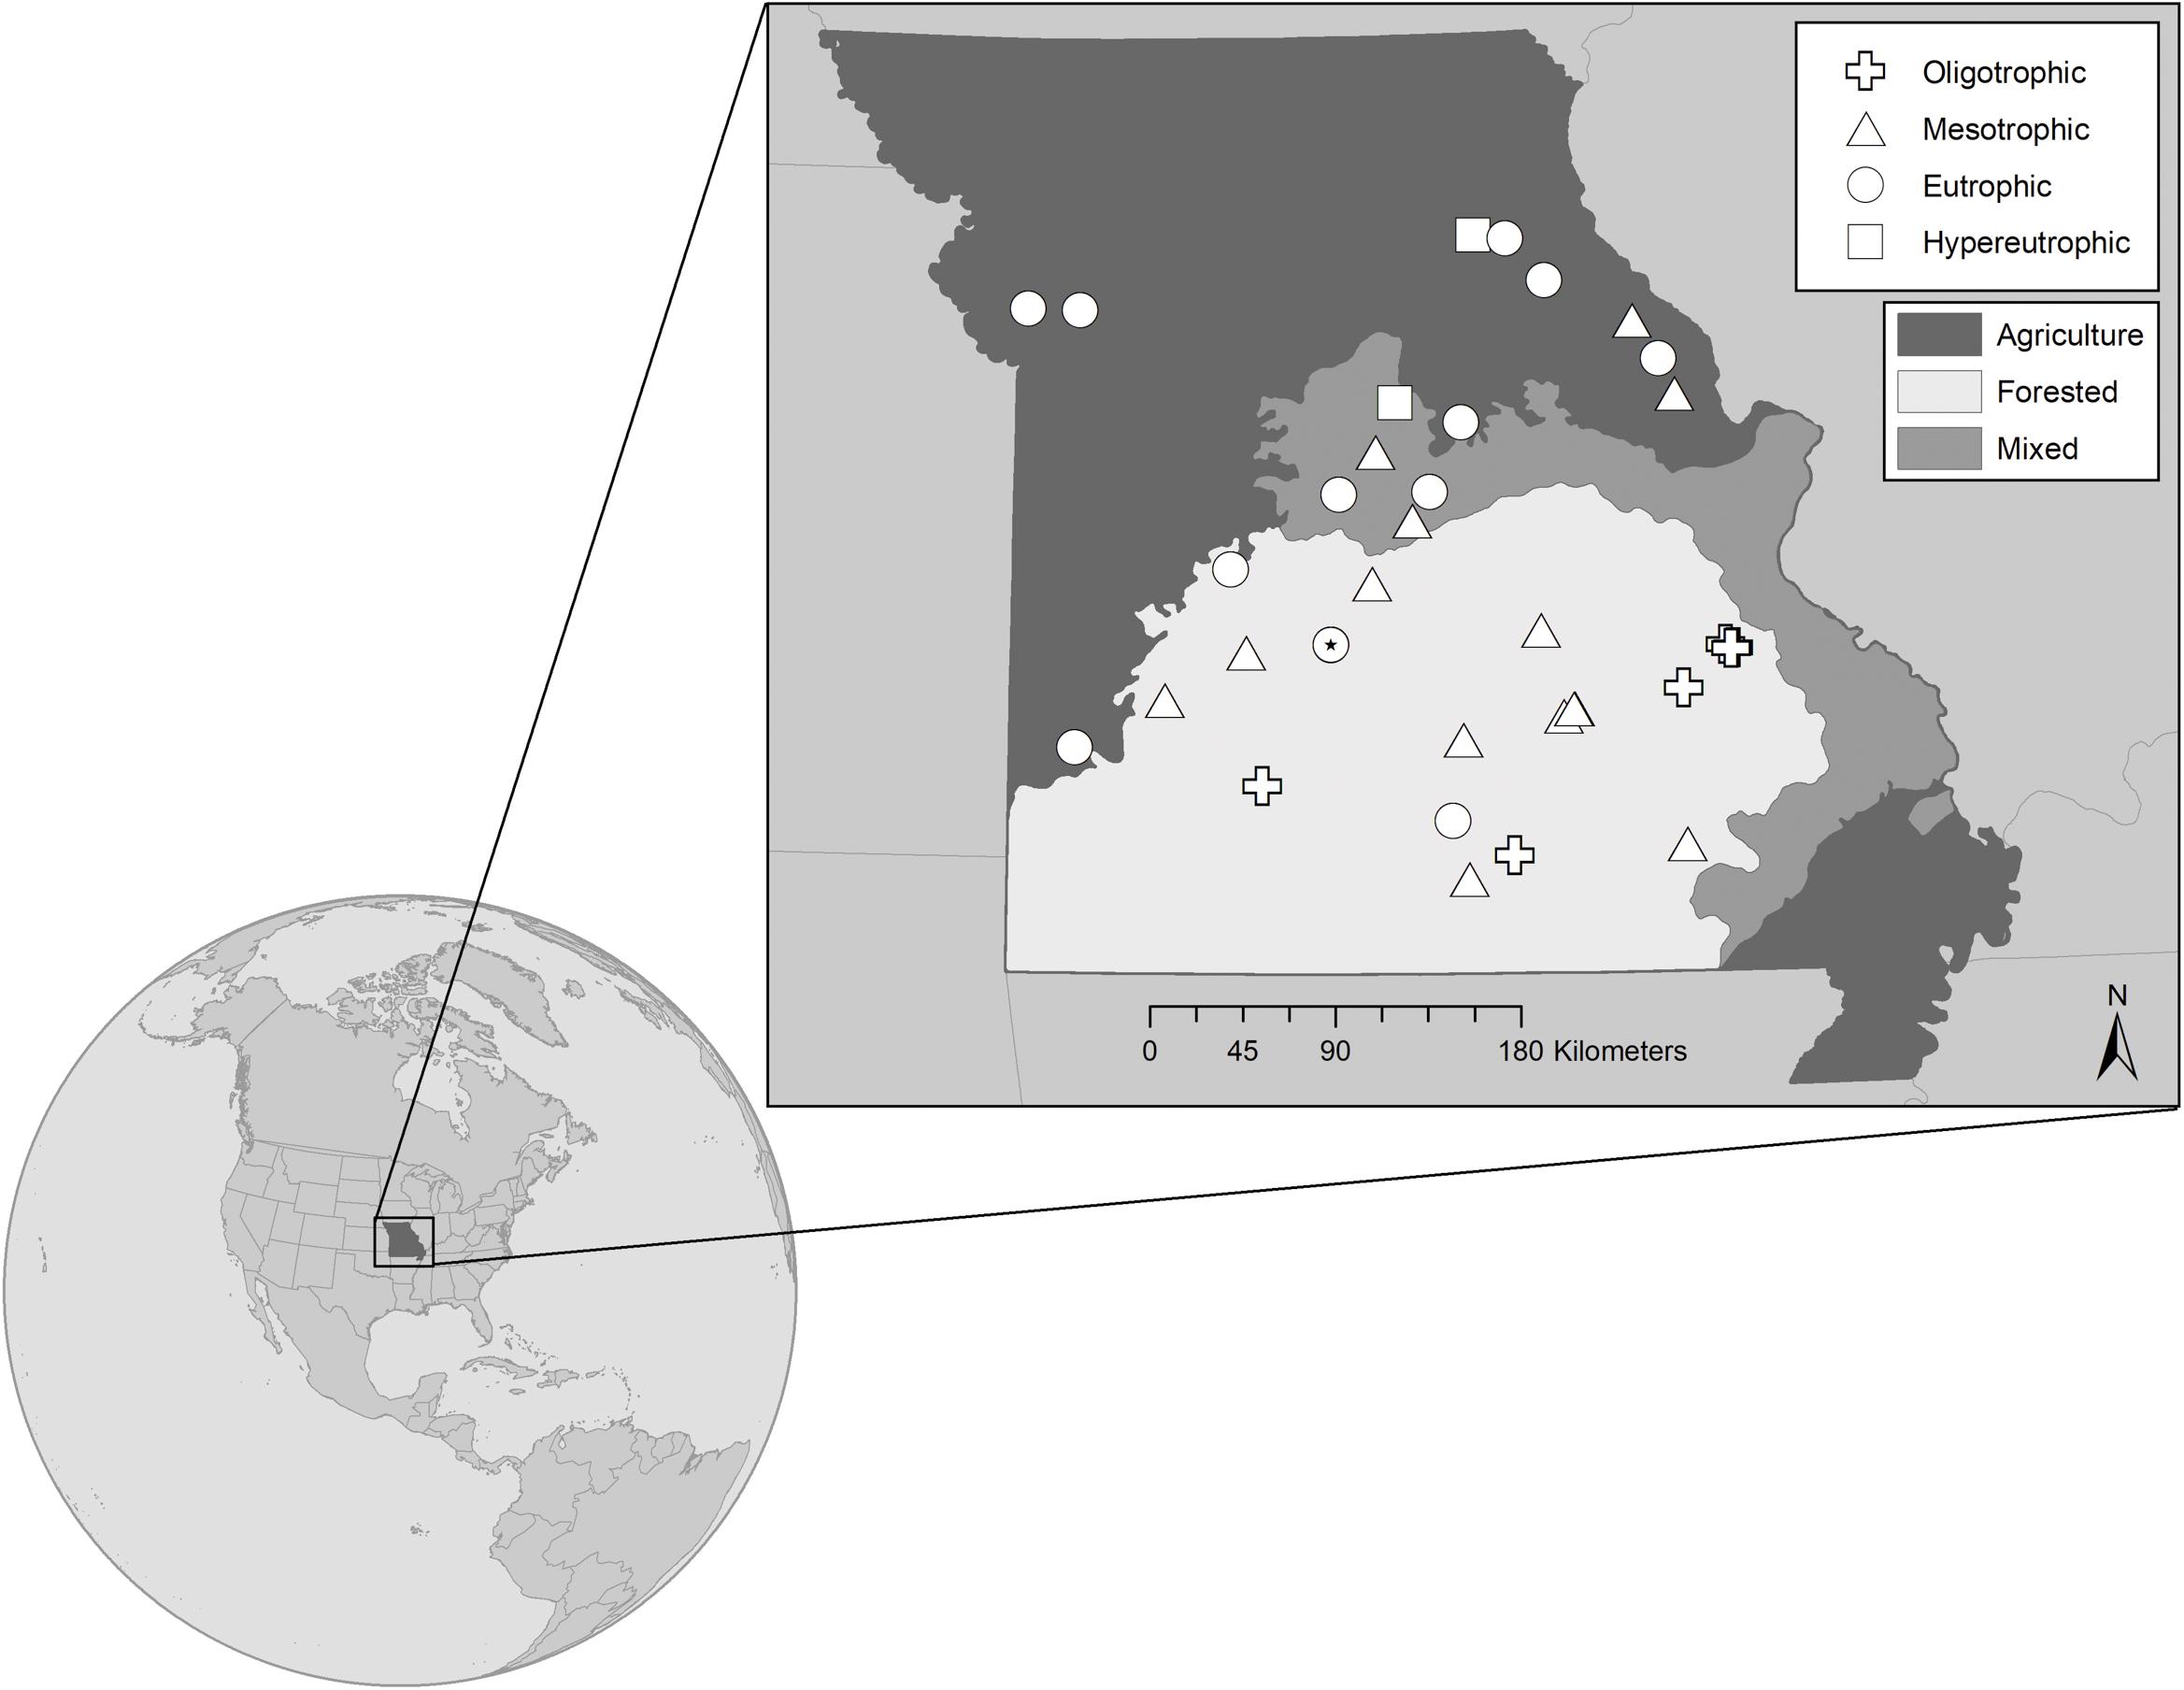
Figure 1. Map showing the 32 reservoir study sites located in Missouri, United States. Sites represent the trophic gradient demonstrated by reservoirs throughout the state from very low (∼0.10 μmol L– 1) to very high (∼4.40 μmol L– 1) epilimnetic total phosphorus concentrations. Symbols distinguish trophic status, where  represent oligo-, meso-, eu-, and hyper- trophic, respectively. All are warm monomictic, except for polymictic Niangua which is denoted as a eutrophic circle with a filled dot (*) in the center. Shading indicates the dominant land-use that has been generalized for each of the state’s major physiographic regions, with the north dominated by agriculture, the south largely forested, and mixed land cover in-between. Land-use specific to each reservoir’s watershed has been classified separately.
Watershed land-use/land-cover (LULC) data was derived from the 2016 National Land Cover Database, a product of the Multi-Resolution Land Characteristics Consortium (Yang et al., 2018)1. We selected watershed boundaries of interest from the Missouri 2019 Lake Numeric Nutrient Criteria Watersheds dataset developed by the Missouri Department of Natural Resources (MDNR)2. Watersheds not included in this dataset were manually digitized using flow direction and flow accumulation grids generated from 10-m resolution digital elevation models in ESRI ArcGIS 10.5. We zonally tabulated LULC for each watershed in ArcGIS, and calculated LULC as percent developed, barren, forest, rangeland, wetland, and agriculture which also contained pasture and cropland subclasses. Watersheds were categorically generalized as either agriculture (pasture or cropland), forest, or mixed based on the dominant (>50%) LULC. When a watershed contained >50% agriculture, the watershed was specified as either ag-pasture or ag-crop to denote the subclass with the higher contribution. A mixed classification was assigned to watersheds with no single LULC greater than 50%. Barren (0–2%), rangeland (0–10%), wetland (0–3%), and developed (0–10%, except for four watersheds with 22–44%) were considered minor contributions to overall LULC and were not included as unique LULC categories.
Each year, we sampled the reservoirs 3–4 times between mid-May and mid-September during a period of established thermal stratification. Throughout these months, the climate across Missouri was characterized by the Palmer Drought Severity Index (PDSI) to be mid-range to very moist for 2017 (statewide monthly average range for April through September: −0.88 to 2.36) and mid-range to severe-drought for 2018 (statewide monthly average range for April through September −2.07 to 0.55; NOAA, 2019). Indicators of water quality and nutrient status were assessed on 29 reservoirs in 2017, followed by a more in-depth collection of water chemistry as well as physiological measurements on 27 reservoirs in 2018. Most of the reservoirs (n = 24) were sampled in both years, allowing us to explore the influence of climate (i.e., wet vs. dry) on phytoplankton light and nutrient status (Table 1).
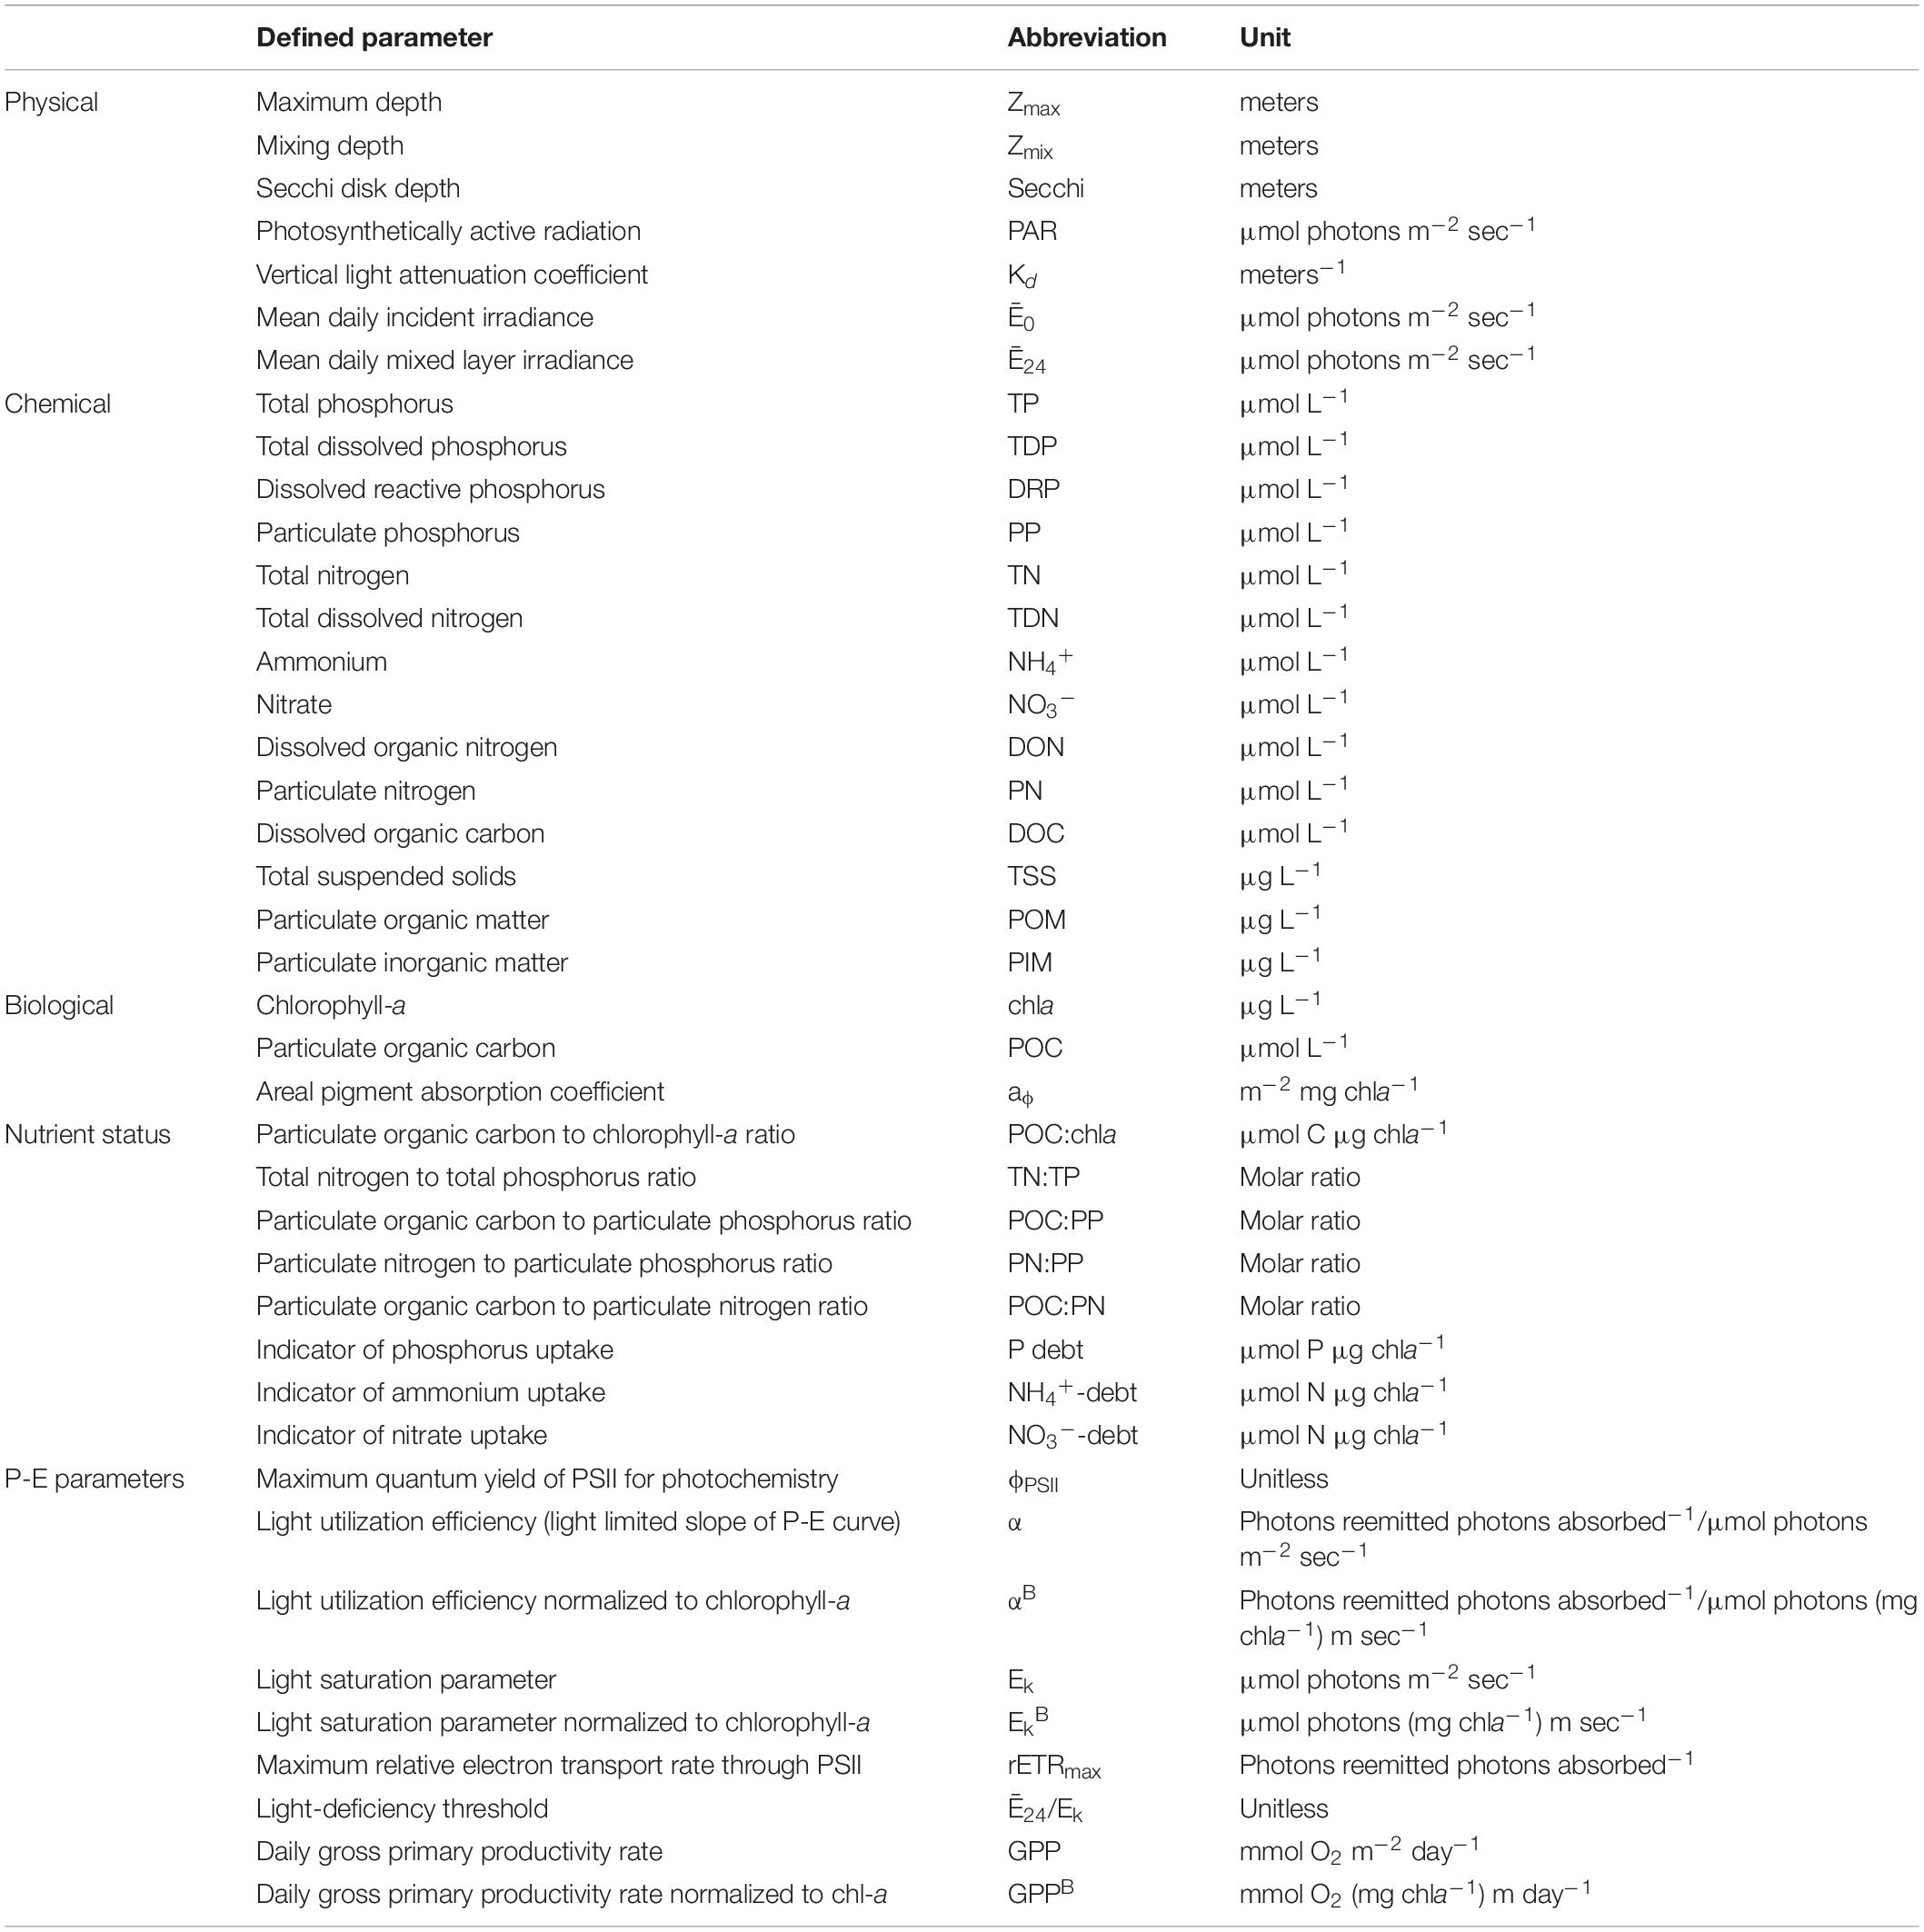
Table 1. Definitions, abbreviations, and units describing physical, chemical, and biological parameters.
Field Sampling
Sampling occurred at maximum water depth near the dam of each reservoir. Secchi transparency depths were recorded. Photosynthetically active radiation (PAR) profiles were collected in 0.25-m increments using a cosine corrected underwater quantum sensor (LI-192, Li-Cor Biosciences, Lincoln, Nebraska, United States). The vertical attenuation coefficient (Kd) was calculated from the PAR profiles using the linear regression of the natural logarithm of irradiance to depth (Kirk, 2011). A Yellow Springs Instruments (Yellow Springs, Ohio, United States) EXO3 multi-parameter sonde was deployed to collect depth profiles (0.001 m resolution) of temperature (0.001°C resolution with an accuracy of ± 0.01°C) and dissolved oxygen (DO) measured with an optical sensor (0.01 mg L–1 resolution with an accuracy of ±0.1 mg L–1). Integrated epilimnetic whole water samples were collected via peristaltic pump from the surface to one meter above the thermocline, where the thermocline was defined in the field by vertical temperature gradients ≥1.0°C m–1. Discrete hypolimnetic whole water samples were collected via Van Dorn sampler from one meter off bottom. During isothermal conditions (e.g., polymictic Lake Niangua), a single integrated sample was taken from the surface to one meter off bottom via peristaltic pump. All water samples were collected into acid-washed high-density polyethylene (HDPE) containers, placed in coolers, and returned to the University of Missouri Limnology Laboratory within 12-h of collection where they were then processed.
Laboratory Analyses and Data Processing
Physical Parameters
Maximum depth (Zmax) was based on records of dam height provided by MDNR. Water column mixing depth (Zmix) was determined using the “rLakeAnalyzer” R-package (Winslow et al., 2019) and reported as the depth from surface to the top of the metalimnion. Based on sampling date and latitude, daily incident irradiance was modeled in 1 min increments and scaled to PAR (μmol photons m–2 s–1) using the “phytotools” R-package (Silsbe and Malkin, 2015). We then calculated mean daily (24-h) incident irradiance (Ē0), assuming cloud-free conditions. Following Guildford et al. (2000), we derived mean daily mixed layer irradiance (Ē24) from Kd, Zmix, and Ē0:
where Ē24 describes the amount of light experienced in the mixed layer by suspended phytoplankton over a 24-h period.
Chemical Parameters
Water samples were processed and analyzed for TP and total N (TN), total dissolved P (TDP) and N (TDN), dissolved reactive P (DRP), ammonium (NH4+), nitrate (NO3–), dissolved organic carbon (DOC), particulate N (PN), and particulate P (PP). TP and TN were pipetted directly into glass test tubes and refrigerated until analysis. All dissolved nutrient samples were filtered through glass-fiber filters (GFF, 0.7 μm pore). Filters for DOC filtrate were pre-combusted at 550°C for 4 h. Filtrate for TDP and TDN were refrigerated in glass test tubes, while DRP, NH4+, NO3– and DOC samples were stored frozen in acid-washed HDPE bottles. PN and PP were captured on pre-combusted GFF filters (0.7 μm pore), dried, and stored with desiccant.
All P samples were analyzed spectrophotometrically using an ascorbic acid colorimetric method (APHA, 2017; 4500-P E). TP, TDP, and DRP were analyzed in triplicate; PP in duplicate. TP, TDP, and PP were digested prior to analysis following an ammonium peroxydisulfate method (APHA, 2017; 4500-P B). Detection limits for all P analyses are 0.03 μmol L–1.
TN and TDN were analyzed in triplicate using the second derivative spectroscopy method (Crumpton et al., 1992). NH4+ and NO3– were analyzed in duplicate on a Lachat QuikChem Flow Injection Analyzer (Hach, Loveland, Colorado, United States) using a Lachat method for NH4+ (10-107-06-1-K) and a slightly modified Lachat method for NO3– (10-107-04-1-B/C). Detection limits were 2.50 μmol L–1 for TN and TDN, 0.71 μmol L–1 for NH4+, and 0.36 μmol L–1 for NO3–. Dissolved organic nitrogen (DON) was calculated by difference from TDN, NH4+, and NO3–. PN was analyzed at the UC Davis Stable Isotope Facility using an Elementar Vario EL Cube or Micro Cube elemental analyzer (Elementar Analysensysteme GmbH, Hanau, Germany) interfaced to a PDZ Europa 20-20 isotope ratio mass spectrometer (Sercon Ltd., Cheshire, United Kingdom) with a detection limit of 0.7 μmol N.
We analyzed DOC in duplicate following a combustion-infrared method (APHA, 2017; 5310 B) with a Shimadzu total organic carbon analyzer (TOC-VCPH, Shimadzu Scientific Instruments, Columbia, Maryland, United States). The detection limit for DOC was 16.7 μmol L–1.
Seston was collected on Whatman 934-AH filters (1.5 μm pore) in duplicate and analyzed for total suspended solids (TSS) using a standard tared-weight method (APHA, 2017; 2540-D E) with a detection limit of 0.1 mg L–1. Dried (105°C) and weighed filters were placed in a muffle furnace at 550°C for 20 min to burn off particulate organic matter (POM). Filters were weighed again to determine particulate inorganic matter (PIM). POM was calculated by difference from TSS and PIM.
Biological Parameters
Chla concentrations (proxy for phytoplankton biomass) were measured on whole water samples filtered onto 0.7 μm GFF filters which were immediately frozen and stored with desiccant. After ethanol extraction and pheophytin acid-correction, chla was analyzed on a Turner Design fluorometer (TD700, San Jose, California, United States; Knowlton, 1984; Sartory and Grobbelaar, 1984). The detection limit was 0.09 μg L–1.
Particulate organic carbon (POC) samples were collected on pre-combusted GFF filters (0.7 μm pore). Inorganic carbonates were removed from samples following a modified fumigation method based on Brodie et al. (2011) wherein filters were continuously subjected to concentrated 37% hydrochloric acid fumes for 4 h. After fumigation, samples were dried at 55–60°C and stored with desiccant. POC was analyzed at the UC Davis Stable Isotope Facility using an Elementar Vario EL Cube or Micro Cube elemental analyzer (Elementar Analysensysteme GmbH, Hanau, Germany) interfaced to a PDZ Europa 20-20 isotope ratio mass spectrometer (Sercon Ltd., Cheshire, United Kingdom) with a detection limit of 1.7 μmol C.
The quantitative filter technique (Tassan and Ferrari, 1995) was used to determine the areal pigment absorption coefficient (aϕ), which provides an estimate of cross-sectional light absorption via chla for photochemistry and photosynthesis. We passed whole water samples through GFF filters (pore size 0.7 μm) that were immediately placed in foil-wrapped petri dishes to limit light exposure and frozen. Absorbance was measured before and after depigmentation via sodium hypochlorite solution (4–5% active chlorine) on a scanning spectrophotometer (Agilent Cary60 UV/VIS, Santa Clara, California, United States) in 1 nm increments from wavelengths 350–750 nm. We calculated aϕ based on Silsbe et al. (2012):
where AP and ANAP are sestonic absorption before and after depigmentation, respectively; β, equaling 2, is the path-length amplification factor adjusting for absorption differences between filter and water; Vf/Af is the ratio of filter volume to circumferential area of filtered particulates.
Light and Nutrient Status Indicators
Phytoplankton light and nutrient status were assessed using a suite of deficiency indicators, which included Ē24; Ē24/Ek; POC:chla; P-, NH4+-N, and NO3–-N debts; stoichiometric nutrient ratios (TN:TP, POC:PP, PN:PP, POC:PN); and photosynthetic efficiency experiments. These indicators have previously established, literature-supported thresholds for estimating proximate deficiencies of light, P, and N (Table 2; Healey and Hendzel, 1979; Guildford and Hecky, 2000). Thresholds based on the work of Healey and Hendzel (1979) were applied to measurements of P and NH4+-N debt, as well as to POC:PP, PN:PP, POC:PN, and POC:chla. These thresholds were developed on laboratory culture experiments (Healey and Hendzel, 1979), but have been successfully applied across a diverse range of lake systems worldwide (e.g., Guildford et al., 2000; North et al., 2008; Dubourg et al., 2015).
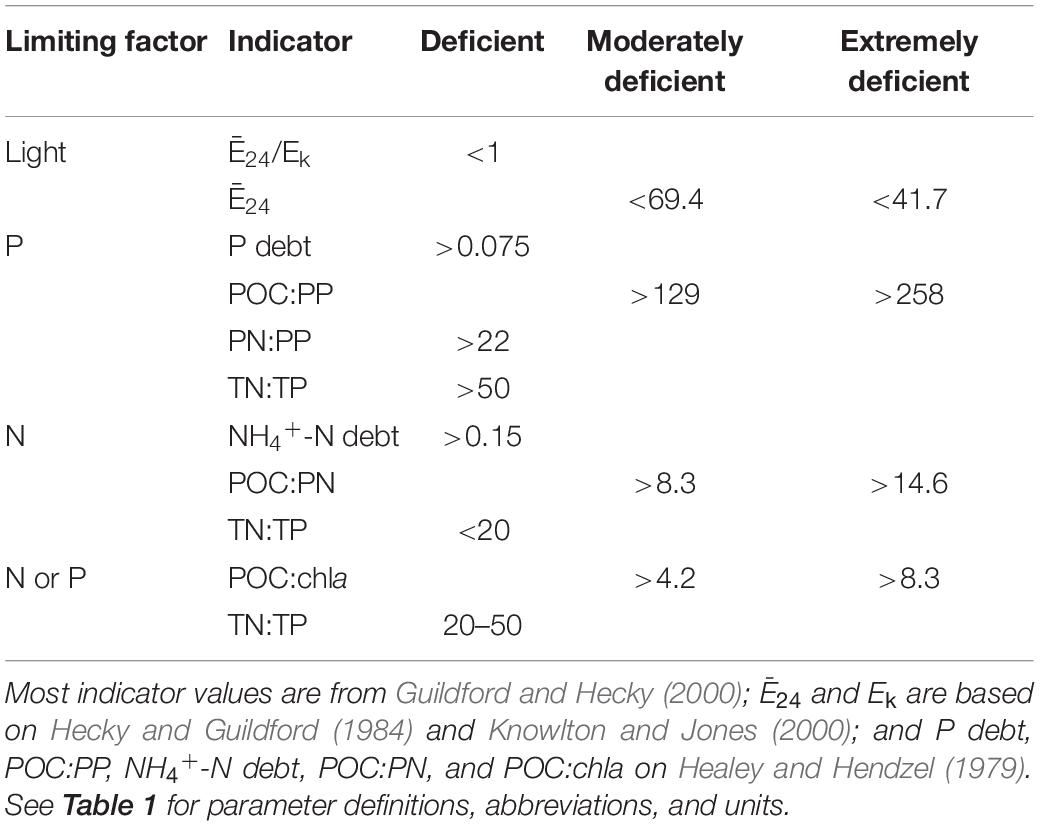
Table 2. Established light and nutrient status indicator thresholds that were applied to the reservoir phytoplankton communities to assess deficiency.
Light deficiency
Our light deficiency thresholds (Ē24, Ē24/Ek) were developed on a turbid Canadian reservoir where the onset of P-deficiency occurred when Ē24 was between 41.7 and 58.3 μmol photon m–2 s–1 (Hecky and Guildford, 1984). Knowlton and Jones (1996), who focused on the turbid Missouri reservoir- Mark Twain, as well as Millard et al. (1996) who worked on Lake Ontario, suggested that co-limitation by light and nutrients could occur at irradiances ≤69.4 μmol photon m–2 s–1. This irradiance threshold has been supported in other applications of shallow, turbid inland waters (Schallenberg and Burns, 2004). We have, therefore, adopted a Ē24 threshold of 69.4 μmol photon m–2 s–1 to represent moderate light-deficiency and the Hecky and Guildford (1984) threshold of 41.7 to represent extreme light-deficiency (Table 2).
We also applied the ratio of Ē24/Ek to assess light-deficiency, where Ē24 represents mean daily mixed layer irradiance and Ek, the LC-derived light saturation parameter (details below). The threshold for Ē24/Ek light-deficiency is one (Table 2). When Ē24 > Ek, there is theoretically enough light for photosynthesis. Alternatively, when Ē24 < Ek, phytoplankton may experience light-deficient conditions (Hecky and Guildford, 1984).
Nutrient deficiency
Nutrient debt experiments based on Healey (1977) were conducted to assess nutrient deficiency. In the laboratory, one L subsamples of epilimnetic whole water were placed in acid-washed cubitainers and spiked with ∼5 μM of KH2PO4, NH4Cl, or KNO3. The four treatments (control receiving no nutrient addition, +P, +NH4+, +NO3–) were incubated in an environmental chamber for 18–24 h under darkened conditions (0.001–0.008 μmol photons m–2 s–1) at average ambient epilimnetic water temperatures (23–30°C). Samples for DRP, NH4+, and NO3– were collected from the +P, +NH4+, and +NO3– treatments, respectively, before and after incubation. DRP, NH4+, and NO3– samples were also collected from each control treatment. P debt, NH4+-N debt, and NO3–-N debt, as indicators of nutrient uptake, were calculated as the change in nutrient concentration per unit of chla before and after incubation.
We complemented the Healey and Hendzel (1979) nutrient debts with additional photosynthetic efficiency experiments. These experiments assess phytoplankton physiological response to nutrient additions and provide additional evidence of nutrient deficiency. Nutrient additions and incubations followed the same protocol as the debt experiments described above. Following incubation, maximum quantum yields of photosystem II (ϕPSII) of each treatment was measured as described below. Significant increases in ϕPSII from control to nutrient addition treatment suggested deficiency of that nutrient.
P-E Parameters
We measured ϕPSII and rapid light curves (LC) to evaluate the phytoplanktons’ capability to absorb and utilize light energy for photosynthesis via PSII. We used the empirical optimum value of ∼0.65 (Kromkamp et al., 2008) to assess overall phytoplankton stress. Following a 30-min dark adaptation period, both ϕPSII and LCs were measured from whole water samples in triplicate with a Water-Pulse Amplitude Modulated (Water-PAM) Fluorometer (Heinz Walz GmbH, Effeltrich, Germany) interfaced to WinControl software (version 3.26). We corrected for non-algal background fluorescence with sample filtrate that had been passed through a 0.2 μm pore GFF filter. LCs were measured in nine 1-min intervals wherein light intensity steadily increased from 21 to 1,420 μmol photons m–2 s–1. Photosynthetic-irradiance (P-E) parameters describing light utilization efficiency (α) and light saturation (Ek) were derived by fitting each LC to a normalized irradiance model (Webb et al., 1974) in the “phytotools” R-package (Silsbe and Malkin, 2015). The maximum relative electron transport rate through PSII (rETRmax) was then calculated as the product of α and Ek. For comparison across systems, α and Ek were normalized to chla (αB, EkB).
Gross Primary Productivity
Areal rates of gross primary productivity (GPP) of the phytoplankton communities were estimated based on the Fee (1990) primary production model. With the “phytoprod” function of the “phytotools” R-package (Silsbe and Malkin, 2015), we calculated GPP from α, Ek, chla, aϕ, Kd, and Ē0. Final units of mol O2 m–2 day–1 were reached by multiplying the “phytoprod” output by the molecular weight of O2 as well as the quantum yield of O2 evolution, which we assume is 0.25 mol O2 [mol e–]–1. For comparison across systems, GPP was normalized to chla (GPPB).
Statistical Analyses
All data were assessed for normality using the Shapiro-Wilk test (p < 0.05). If we accepted the null hypothesis of the Shapiro-Wilk test (p < 0.05), data were transformed accordingly (e.g., common log, square root, reciprocal), whenever possible, to achieve normality prior to any statistical analysis. If we rejected the null hypothesis of the Shapiro-Wilk test (p > 0.05), data were assumed normal and no transformations applied.
To explore relationships between continuous parametric variables, we used Pearson’s correlation coefficients (r). To assess differences across temporal gradients (between years and/or sampling events), as well as across the trophic and land-use gradient for each reservoir, we ran linear mixed effect (LME) models with the “nlme” R-package (Pinheiro et al., 2020). For parameters collected in both 2017 and 2018, we used the following model structure:
Yi = β0 + β1 Year +β2 SamplingEvent +β3 Year*SamplingEvent + β4 TrophicStatus + β5 LandUse + Reservoir + εi
where Yi was the normally distributed parameter Y at reservoir i, while Year (2017, 2018), SamplingEvent (1–4), TrophicStatus (oligotrophic to hypertrophic), and LandUse (forested, mixed, ag-pasture/crop) were fixed effects. Reservoir was a random effect that created a new baseline for each sampling location. Random effects and the residual error were assumed to be drawn from a normal distribution. A simplified model lacking Year and the interaction term (Year∗SamplingEvent) was applied for parameters collected in a single year. Each LME was subjected to an analysis of variance (ANOVA). If the ANOVA identified statistically significant effects in the LME (p < 0.05), we conducted a Tukey’s Honest Significant Difference post-hoc test to compare factor levels for significance. All post-hoc results are indicated by lowercase letters on figures and in tables, unless otherwise noted. Different lowercase letters indicate significant differences between factor levels. Letters are ordered alphabetically and indicate trend direction where, for example, “a” represents the lowest and “d” represents the highest mean.
To assess significant differences across sampling events, trophic status, and watershed land-use for the nutrient debt experiments, we conducted non-parametric Kruskal-Wallis one-way ANOVAs. If an ANOVA tested significant (p < 0.05), a Dunn’s multiple comparisons post-hoc test was implemented to identify significant differences between factor levels. We also used one-way ANOVAs to test for significant differences among treatments for each ϕPSII experiment. If significant (p < 0.05), a 2-sided Dunnett-test (pairwise comparison) was conducted to identify significant positive responses to nutrient additions of P, NH4+, NO3–, and P+NH4+ relative to untreated control treatments.
Results
Northern Missouri is 58% agriculture while the south is 61% forested (Figure 1 and Supplementary Table 1). TP concentrations are correlated with forest (p < 0.001, r = −0.65), ag-crop (p < 0.001, r = 0.65), and ag-pasture (p < 0.001, r = 0.31) percent land-cover. As percent forest increases, we observe lower TP and more oligo- and meso- trophic systems. Alternatively, as percent agriculture increases, we observe higher TP and more eu- and hyper- trophic systems.
Physical Parameters
Missouri reservoirs are relatively shallow systems where Zmax ranges from 4.6 to 49.1 m (Table 3), with 63% of our study reservoirs <20 m and only 9% >40 m. Mean Zmix was ∼27–30% of the water column in oligo-, meso-, and eu- trophic reservoirs, and 51% in hypertrophic reservoirs (Tables 3, 4). There is a negative correlation between Zmax and trophic status (p < 0.001, r = −0.47), wherein shallower reservoirs are hypertrophic and deeper reservoirs are oligotrophic. Similarly, Zmix was significantly shallower in hypertrophic than oligotrophic systems (Table 5). Hypolimnetic anoxia is common in Missouri reservoirs during summer stratification (Jones et al., 2011). We observed this in both summers, wherein every warm monomictic reservoir (n = 31) experienced hypolimnetic anoxia with DO concentrations < 0.5 mg L–1. Across these 31 reservoirs, water columns were 27–87% anoxic, with the mean water column ∼65% anoxic.
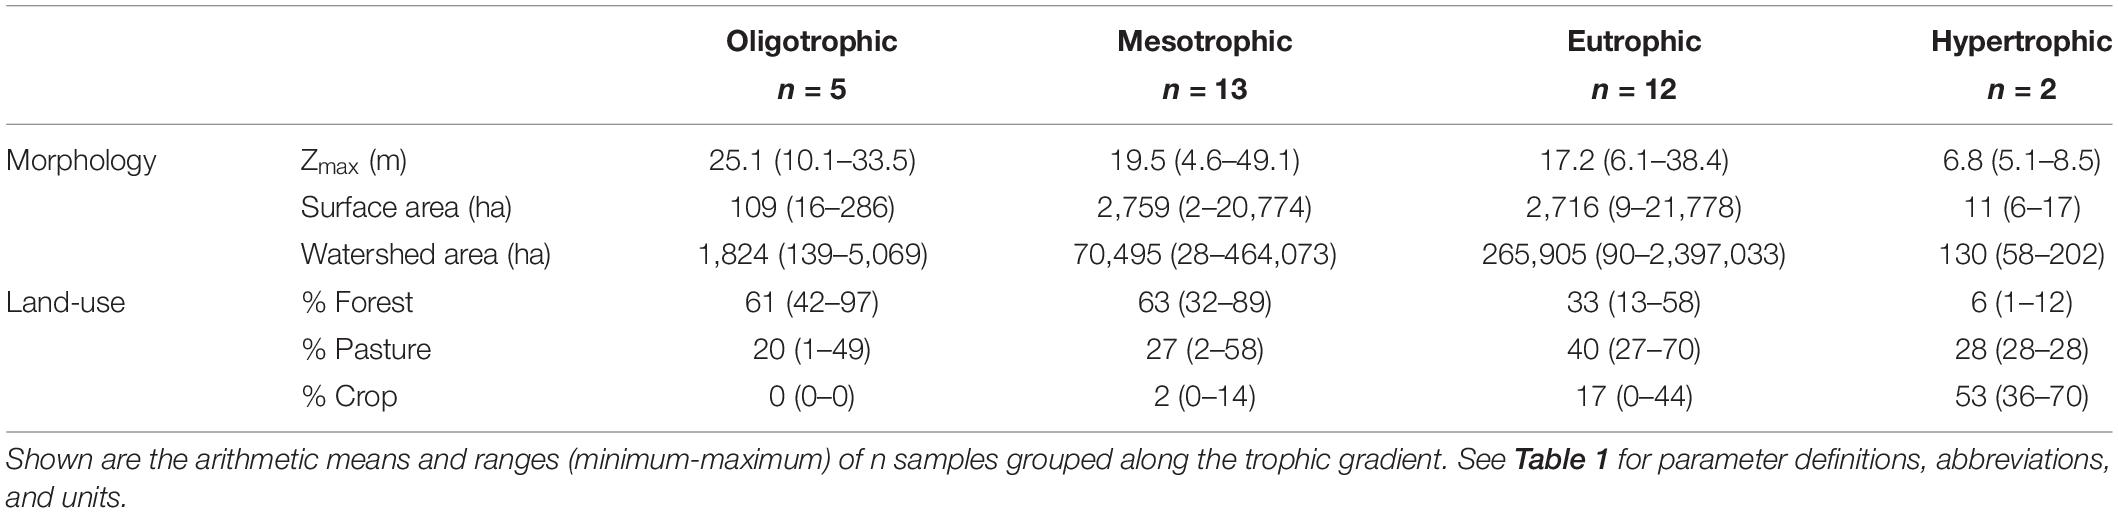
Table 3. Morphology and watershed land-use describing the 32 reservoirs sampled during the 2-year study window.
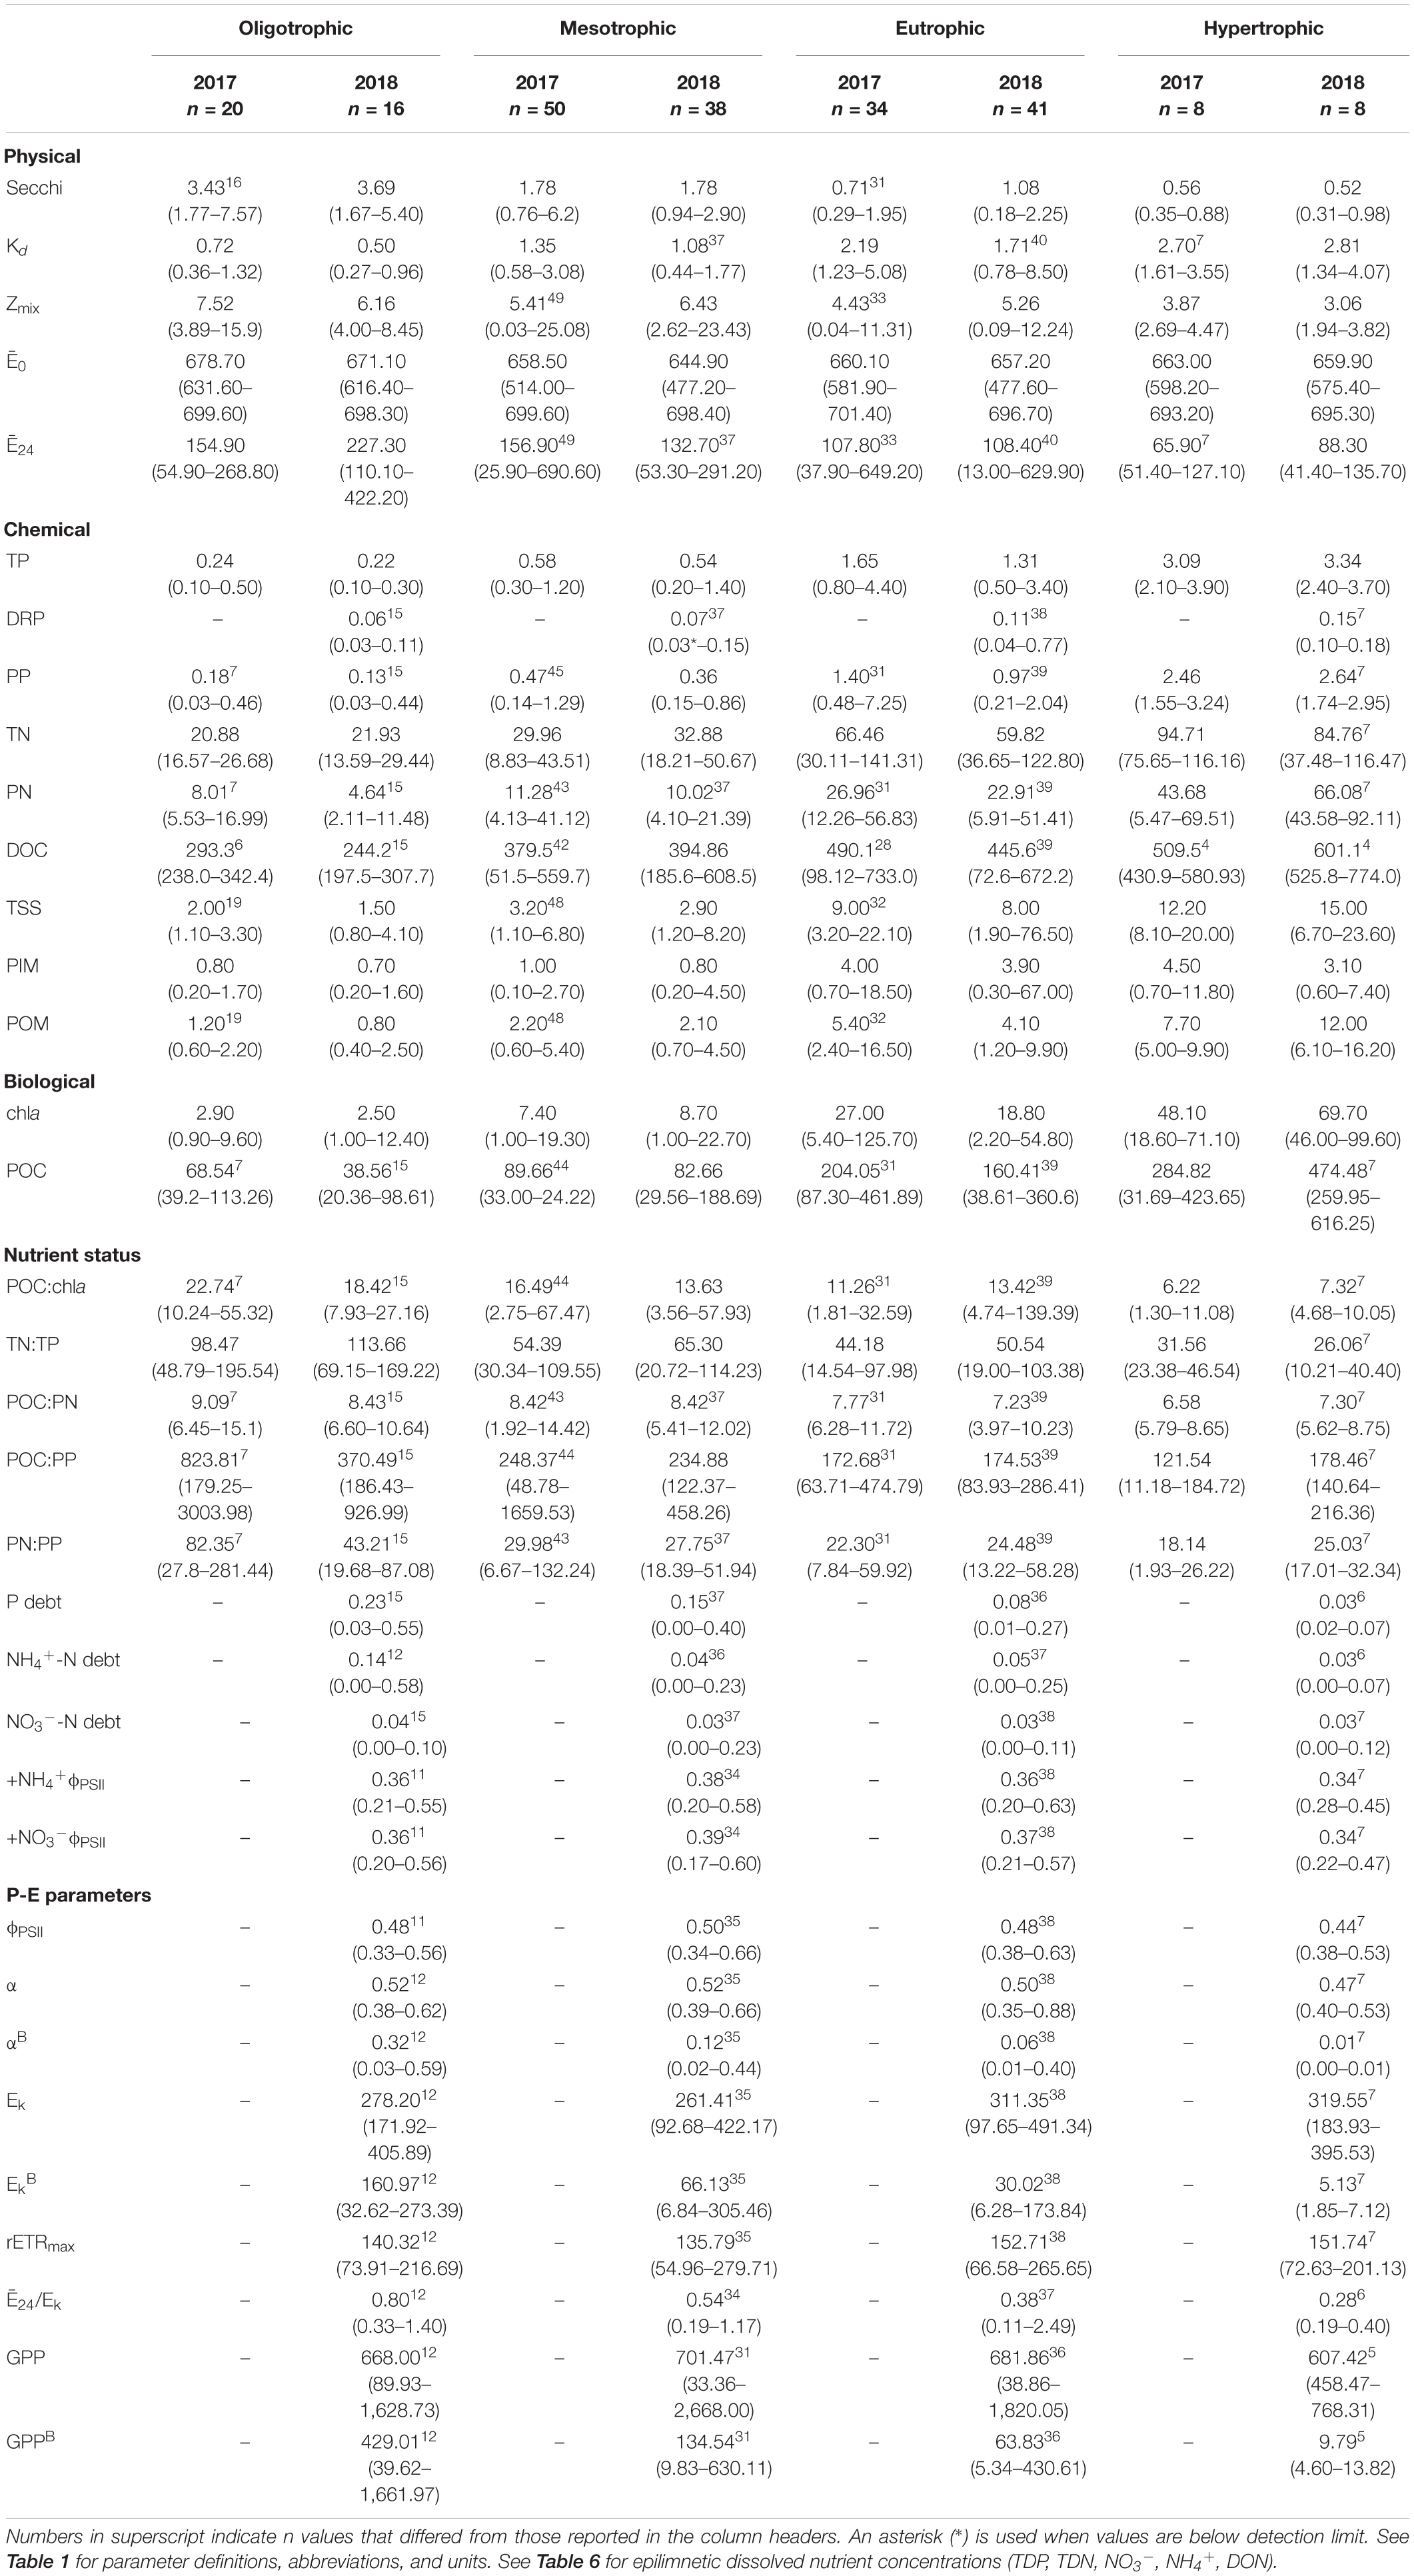
Table 4. Limnological parameters for the 32 reservoirs sampled during the 2-year sample window. Shown are arithmetic means and ranges (minimum-maximum) of n samples grouped along the trophic gradient.
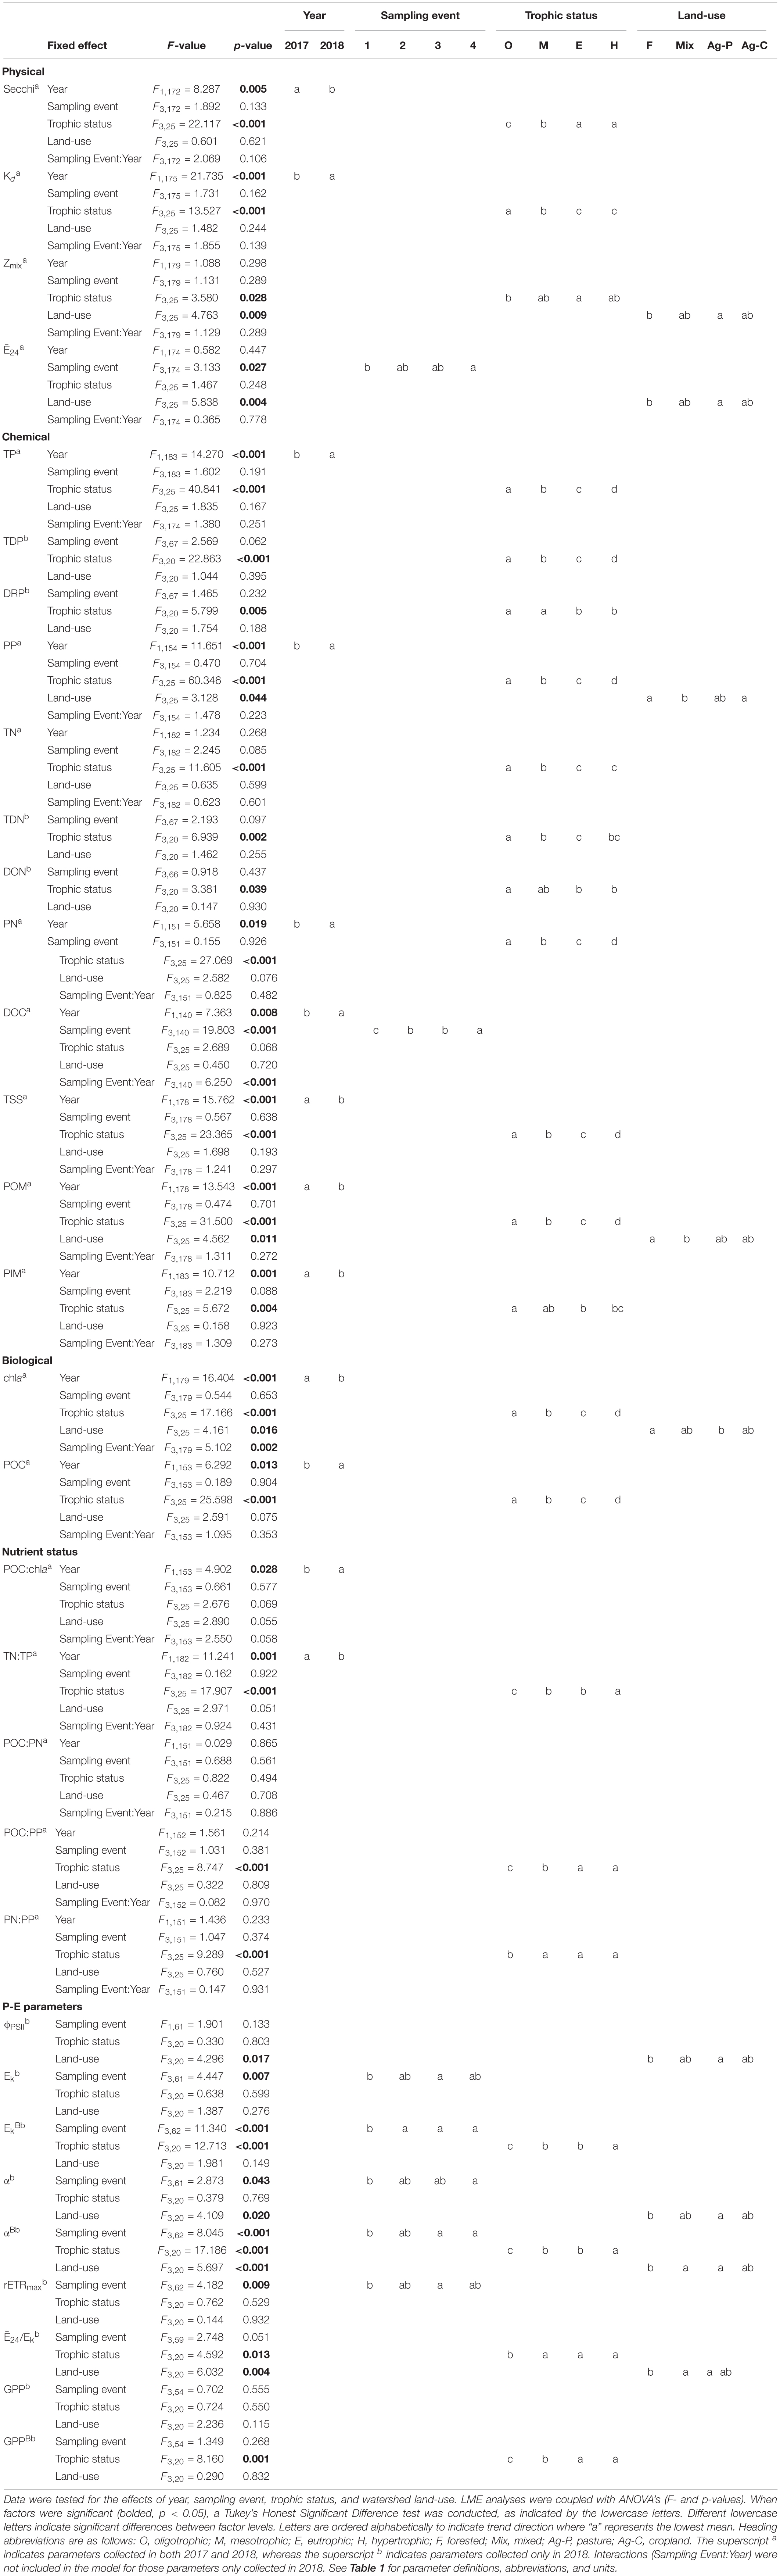
Table 5. Linear mixed effect (LME) model output for physical, chemical, biological, nutrient status, and photosynthesis-irradiance (P-E) parameters.
The light environment in the reservoirs differed significantly from 2017 to 2018, although Zmix did not. Water clarity was highest in oligotrophic reservoirs during the drier sampling year (2018). Across all reservoirs, Secchi depths were significantly deeper and Kds were significantly smaller during the drier year (Table 5). In oligotrophic systems, Secchi depths were ∼6–7× deeper and Kds were ∼73–82% smaller than in hypertrophic systems. Compared to 2017, TSS in 2018 was 25% lower in oligo- and ∼10% lower in meso- and eu- trophic reservoirs. These relationships fall apart in hypertrophic systems where we saw no significant differences (p > 0.05) in Secchi, Kd, nor TSS from 2017 to 2018 (Table 4).
Light Deficiency
Light deficiency was not prominent during the summers of 2017 and 2018. Across both years, Ē24 trophic means ranged from 65.9 to 227.3 μmol photons m–2 s–1 and while there were no significant differences between trophic status nor wet and dry years, Ē24 was lower during the wetter year and decreased from oligo- to hyper- trophic (Figure 2). Only 6% (2017) and 3% (2018) of individual samples were below the 41.7 μmol photons m–2 s–1 threshold for extreme light-deficiency (Table 2 and Figure 2). No reservoir below the extreme light-deficiency threshold in 2017 fell below it again in 2018. Only the mean Ē24 for the 2017 hypertrophic reservoirs (65.9 μmol photons m–2 s–1) was below the 69.4 μmol photons m–2 s–1 moderate threshold for light-deficiency (Table 4 and Figure 2). Approximately 27% of all sampling events were less than the moderate threshold in 2017 compared to ∼19% in 2018 (Figure 2). Of the eight reservoirs below the threshold in 2017, nine also fell below during at least one sampling event in 2018. We found significant differences between Ē24 and sampling event, as well as land-use. Ē24 was significantly higher during the May/June sampling event, and in forested watersheds, than during the August/September sampling event or in ag-pasture watersheds (Table 5).
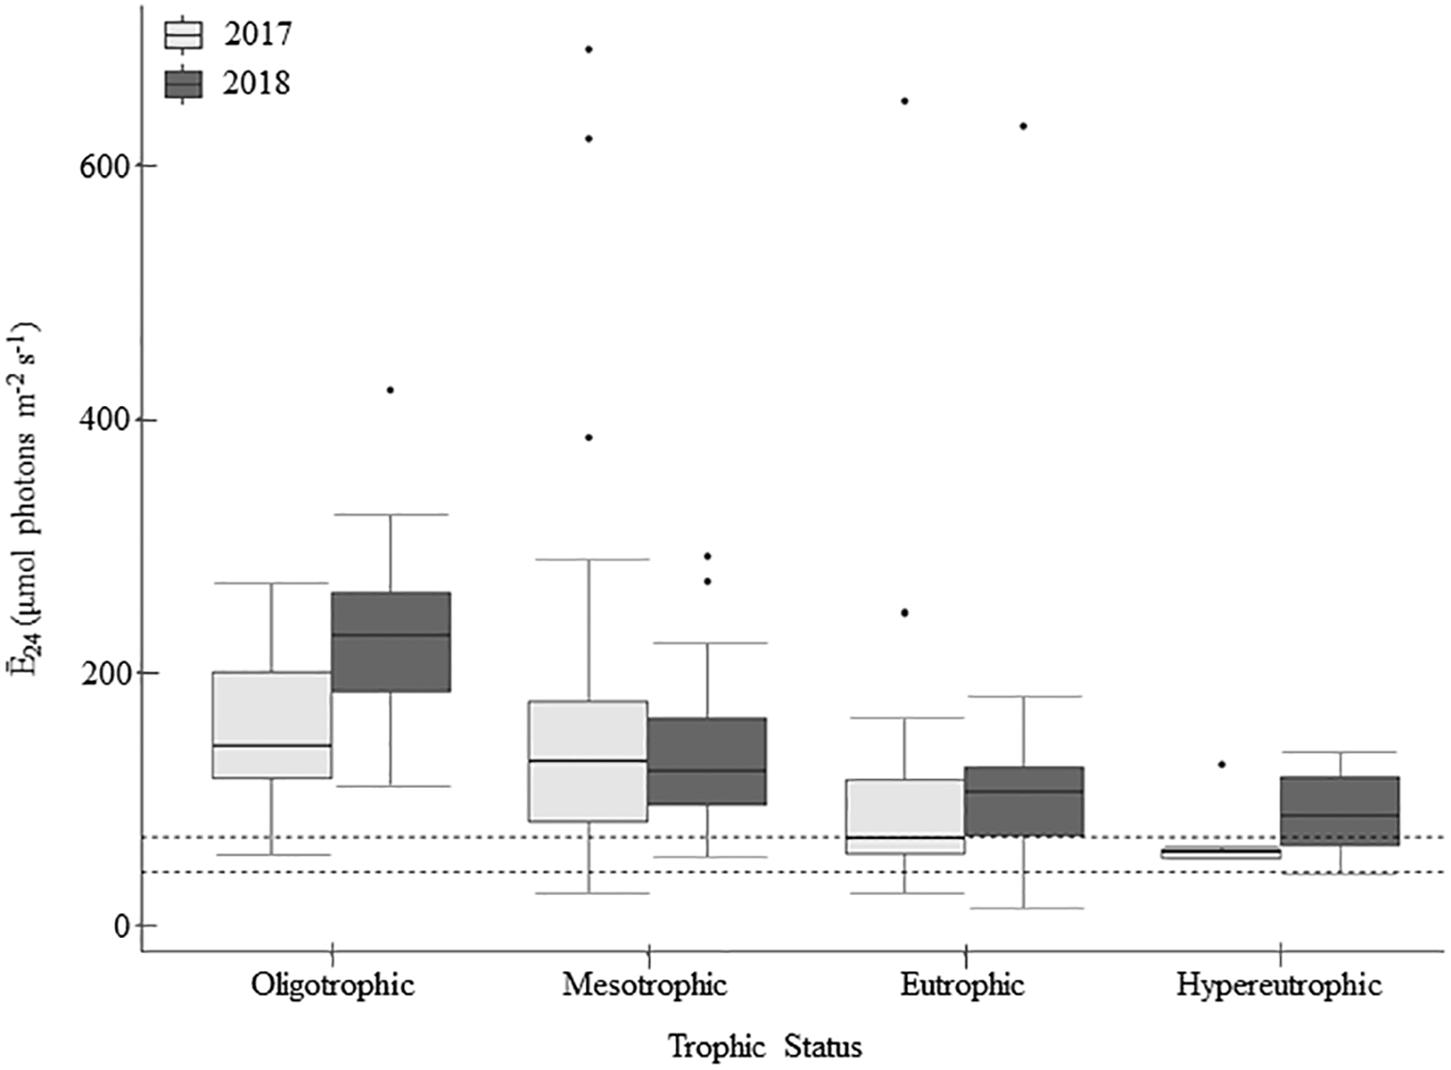
Figure 2. Mean daily mixed layer irradiance (Ē24) across trophic status during the 2017 and 2018 sampling seasons (n = 213). Within the boxplots, the 50th percentile (median) is visualized with a solid horizontal line within each box. The 25th and 75th percentiles are represented by box hinges above and below the median line. On either end of the box, whiskers denote the smallest and largest values within 1.5× the interquartile range (IQR) and points indicate values beyond 1.5× the IQR. Dashed lines on the figure represent the light-deficiency thresholds, where values below the lines would be considered light deficient (Table 2).
Relative to the light saturation parameter (Ek), the ratio of Ē24/Ek indicates that light-deficiency dominated in these systems. Summer means for Ē24/Ek across the trophic groupings ranged from 0.28 to 0.80 and were below the light-deficiency threshold of one (Table 4). Only calculated for the reservoirs sampled in 2018, it indicates that the demand for light exceeded the supply (ratio < 1) for 92% of sampling events; 75% in oligo-, 91% in meso-, 97% in eu-, and 100% in hyper- trophic reservoirs. All 29 of the reservoirs, regardless of trophic status, were light-deficient by this metric at least once during the 2018 season. All sampling events that were below the Ē24 moderate deficiency threshold in 2018 were also deemed light deficient by the Ē24/Ek threshold. We found no evidence of photoacclimation (MacIntyre et al., 2002) as indicated by positive, significant relationships between POC and chla in 2017 (p < 0.001, r = 0.78) and 2018 (p < 0.001, r = 0.90). Peak POC:chla ratios occurred above the light threshold, when Ē24 was ∼50–150 μmol photons m–2 sec–1, indicating nutrient deficiency.
Chemical and Biological Parameters
Nutrient concentrations were positively related to trophic status for most forms of P and N (TDP, DRP, PP, TN, TDN, DON, PN). Trophic mean concentrations of TP and DOC were higher during the wetter than the drier year (Table 5), except for in hypertrophic reservoirs where the relationship weakened (Table 4). Similarly, trophic mean particulate nutrient concentrations (i.e., PP, PN, POC) were also significantly higher during the wetter year (Table 5), barring the hypertrophic reservoirs.
From oligo- to hyper- trophic, mean epilimnetic TP concentrations ranged from 0.23 to 3.21 μmol L–1. Across the trophic gradient, TP largely consisted of PP wherein TP was ∼70–80% PP (Table 4). Mean epilimnetic TDP and DRP concentrations generally increased with increasing trophic status. Across the trophic gradient, mean epilimnetic DRP constituted ∼20–50% of mean epilimnetic TDP, with oligo- and hyper- trophic reservoirs at the lower and upper end of that range, respectively (Tables 3, 6).
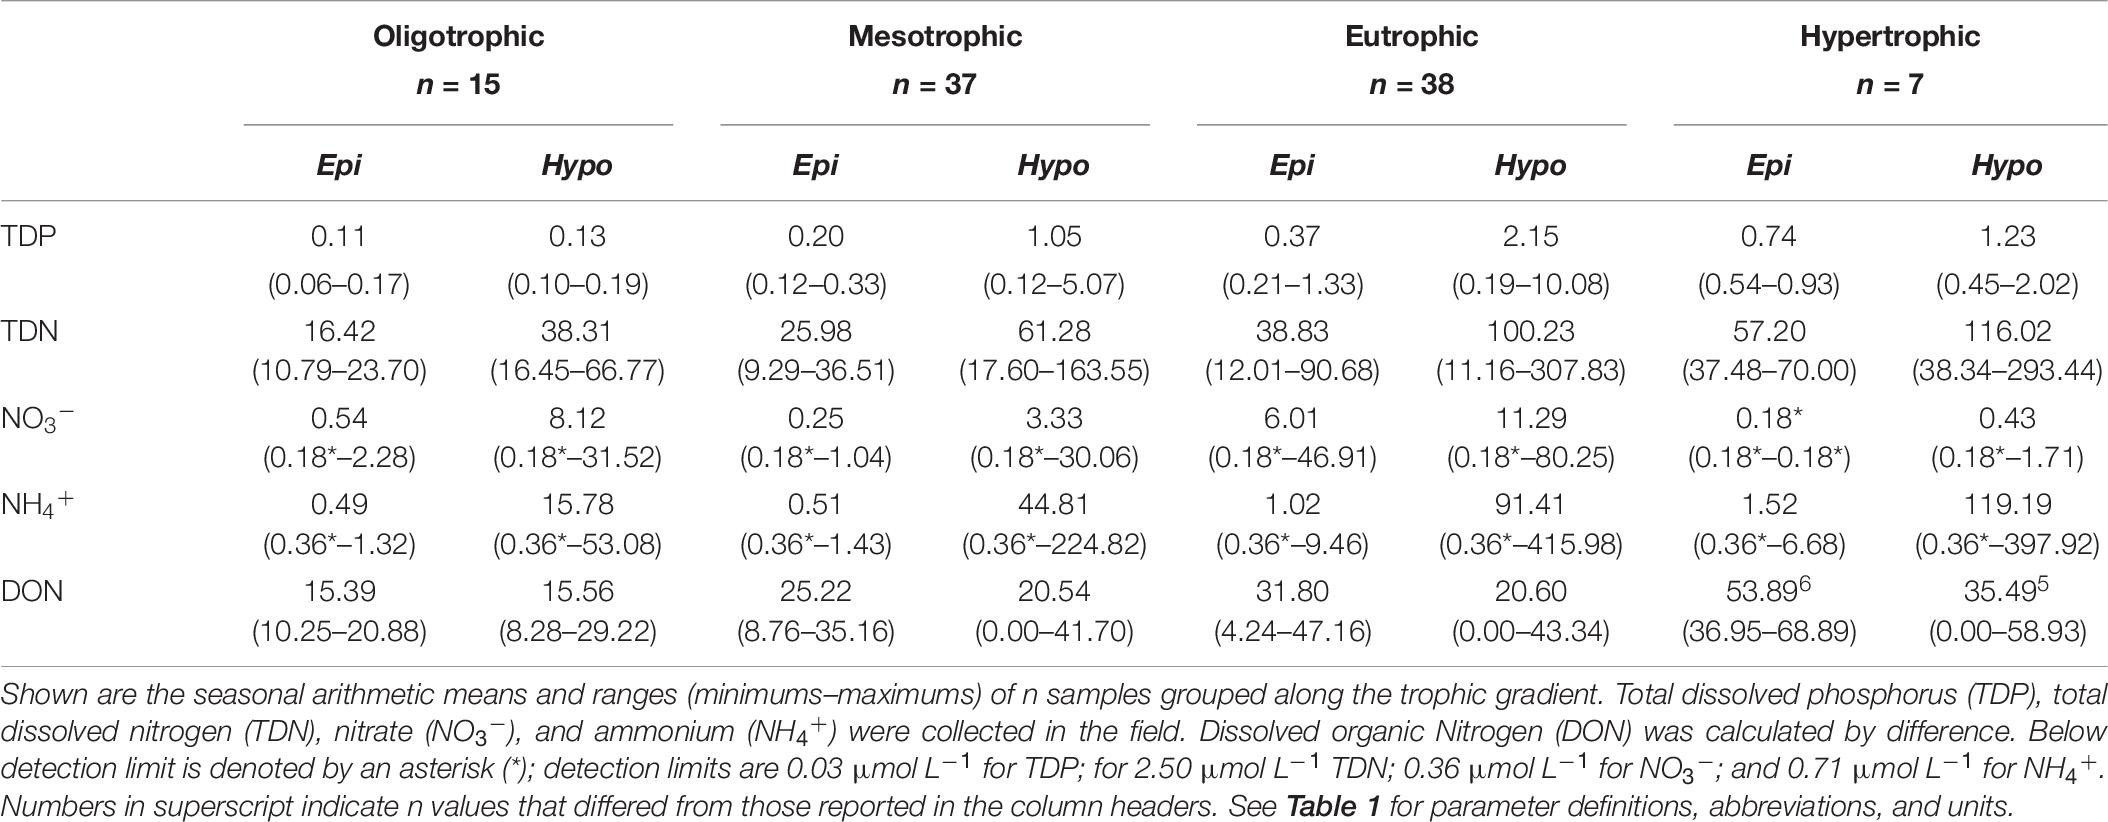
Table 6. Epilimnetic and hypolimnetic dissolved nutrient chemistry from the 27 reservoirs sampled during 2018 summer stratification.
Mean epilimnetic TN concentrations ranged from 21.35 in oligotrophic to 95.25 μmol L–1 in hypertrophic reservoirs. With dissolved N comprising the majority of TN in most reservoirs, PN constituted ∼30–39% of TN in oligo-, meso-, and eu- trophic and 61% of TN in hypertrophic reservoirs. DON represented the largest fraction of epilimnetic TDN, with NO3– + NH4+ accounting for 3–18% of epilimnetic TDN (Table 4). In 2018, mean epilimnetic NO3– was 1.75 μmol L–1, while NH4+ was 0.89 μmol L–1 (Table 6). The majority of epilimnetic NH4+ (68%) and NO3– (79%) were below detection. In ag-crop watersheds, NO3– was higher than NH4+ concentrations, whereas in forested, mixed, and ag-pasture reservoirs, NH4+ was higher than NO3–. Hypertrophic reservoirs also have more NH4+ relative to NO3– compared to oligo-, meso-, and eu- trophic reservoirs.
Mean hypolimnetic TDP, TDN, NO3–, and NH4+ were consistently higher than epilimnetic concentrations across the trophic gradient. Hypolimnetic DRP was not measured due to interference with presumably high iron concentrations. Mean hypolimnetic TDP was 1.2–1.7× higher than epilimnetic concentrations in oligo- and hyper- trophic systems, and 5.3–5.8× higher in meso- and eu- trophic systems. Hypolimnetic NO3– was 2–2.5× higher than epilimnetic NO3– in eu- and hyper- trophic systems, and 13–15 x higher than epilimnetic NO3– in meso- and oligo- trophic systems. In contrast, hypolimnetic NH4+ was 32 (oligo-), 88 (meso-), 90 (eu-), and 78 (hyper- trophic)× higher than epilimnetic NH4+ concentrations. Hypolimnions contained ∼2, 14, 8, and 277× more NH4+ than NO3– in oligo-, meso-, eu-, and hyper- trophic systems, respectively (Table 6). TSS was dominated by POM (∼60–69% in 2017 and 51–80% in 2018; Table 4). PIM only exceeded POM in ∼15% of samples each year.
Both chla and POC serve as proxies for phytoplankton biomass. There were increasingly higher chla concentrations with increasing trophic status (Table 4 and Figure 3A) and higher chla trophic means in the wetter year. Reservoirs of forested and ag-pasture watersheds had the lowest and highest chla concentrations, respectively (Table 5).
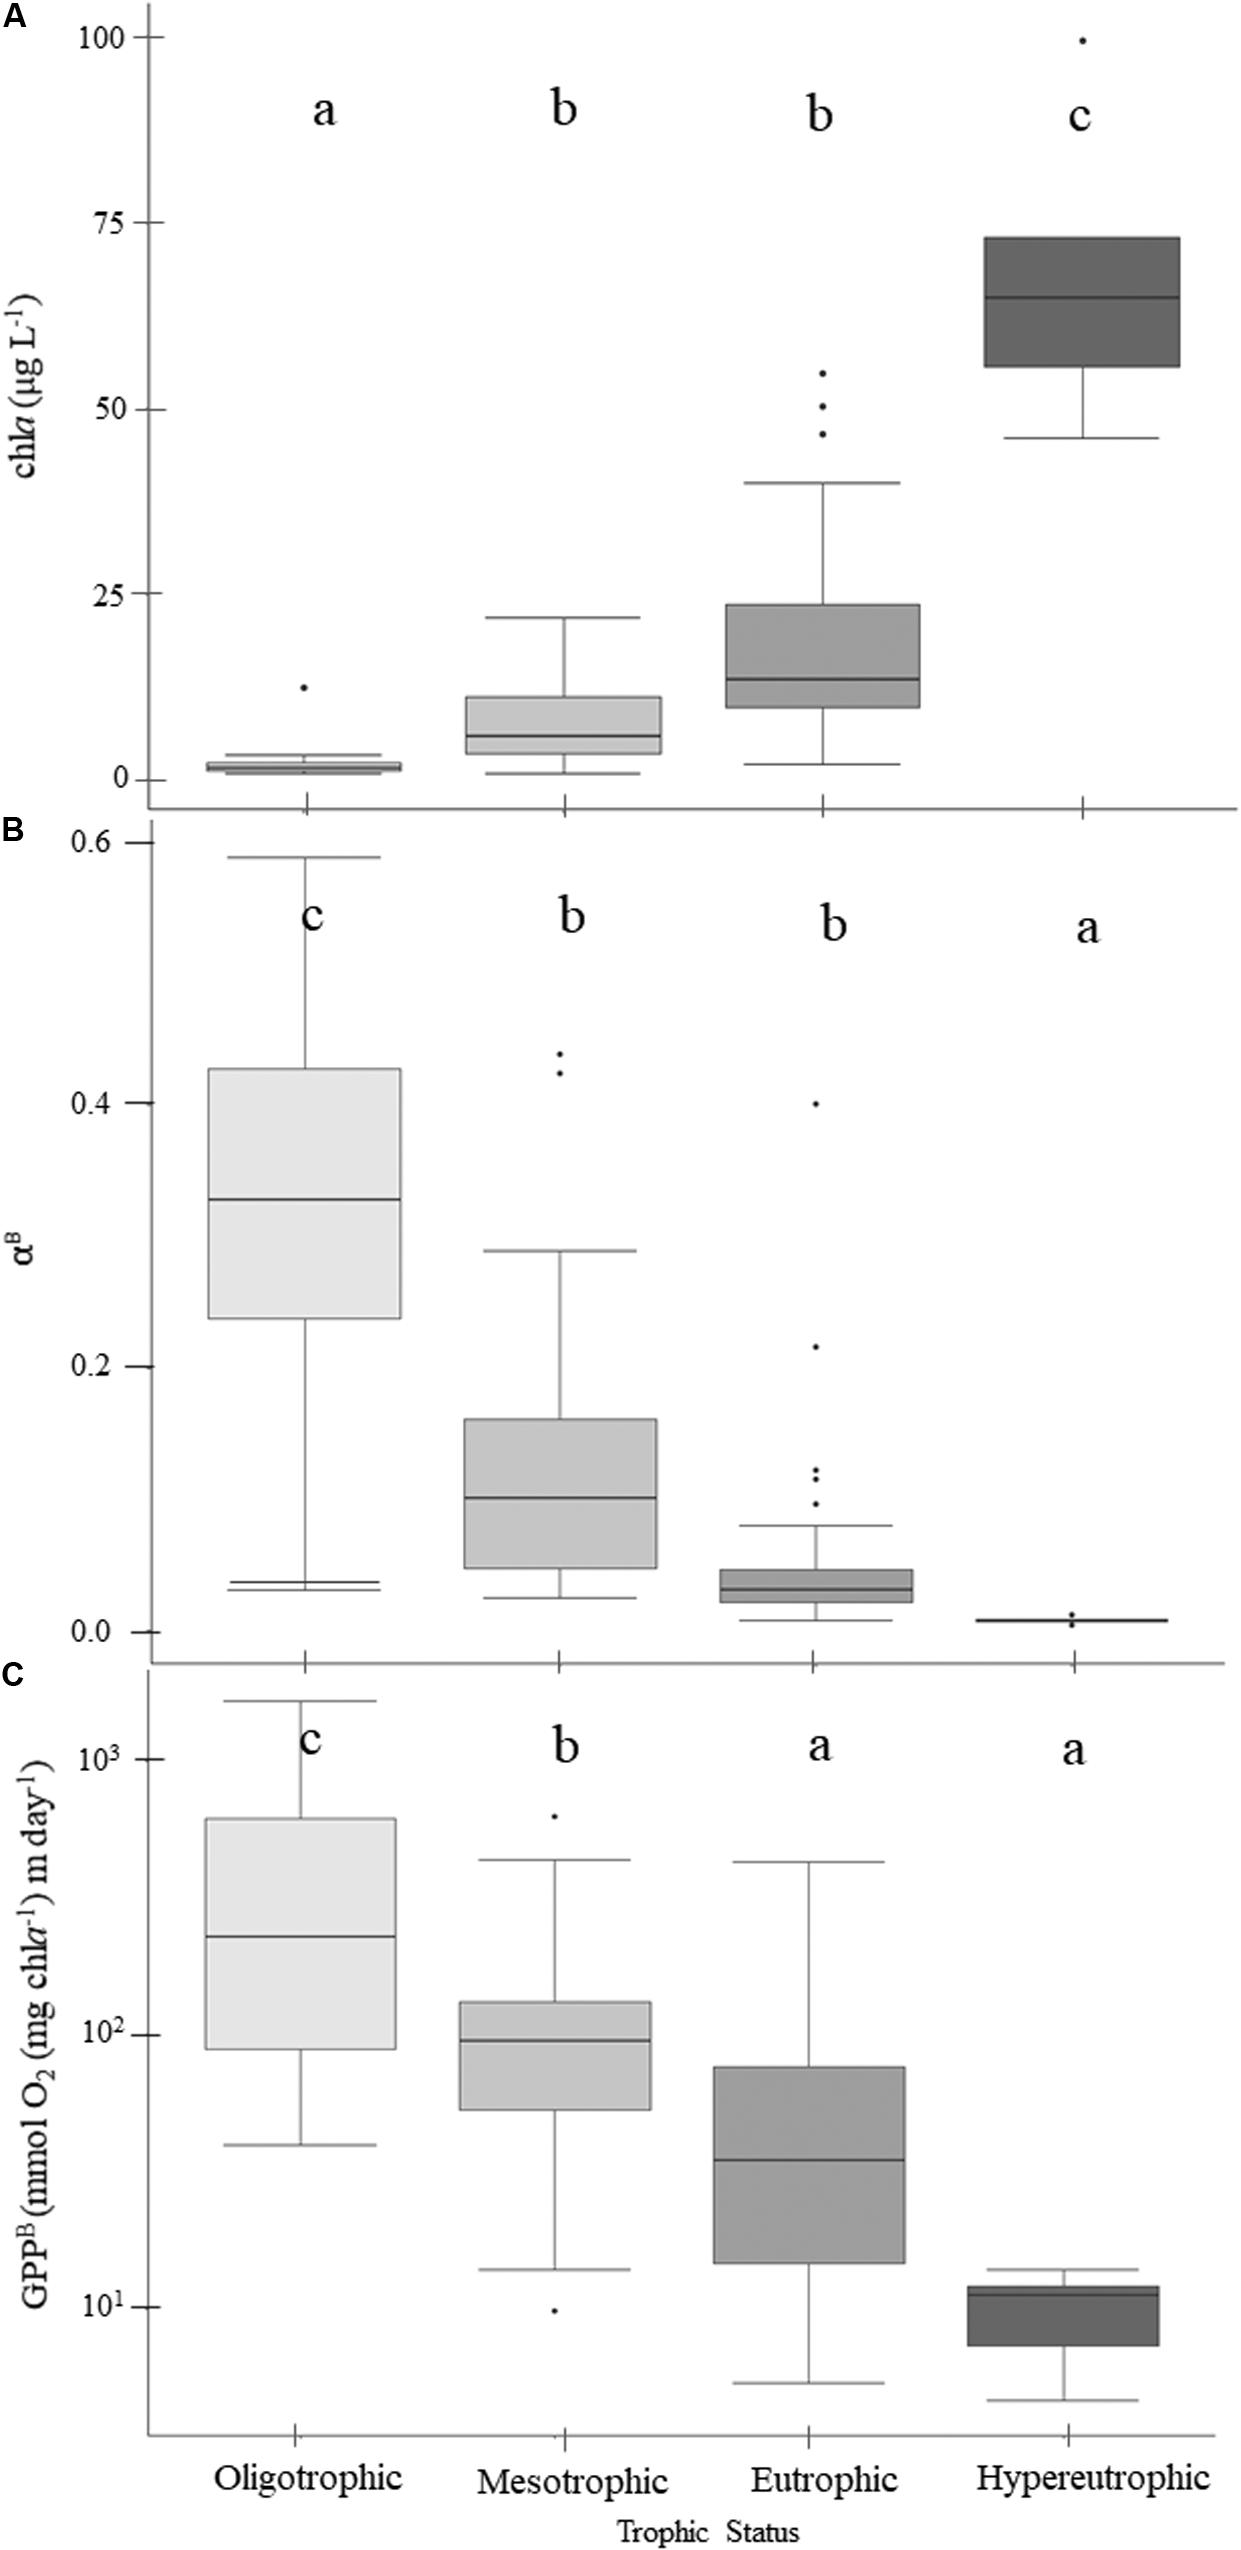
Figure 3. Patterns of chlorophyll-a (A), light utilization efficiency per unit of chlorophyll-a (B), and gross primary production (GPPB) rates normalized to chlorophyll-a (C) across the trophic gradient. Within the boxplots, the 50th percentile (median) is visualized with a solid horizontal line. The 25th and 75th percentiles are represented by box hinges above and below the median line. On either end of the box, whiskers denote the smallest and largest values within 1.5× the interquartile range (IQR) and points indicate values beyond 1.5× the IQR. Lowercase letters indicate results from multiple comparison post-hoc tests, where similar letters denote no significant differences between trophic states (Table 5).
Nutrient Status
Physiological indicators suggest that P-deficiency is prevalent in Missouri reservoirs (Figure 4). TN:TP ratios favored P-deficiency in both years (Table 4) with only 2% of samples indicating N-deficiency. TN:TP ratios were significantly higher in the drier year (2018) than the wetter year (2017; Tables 3, 5). Exceedance of the P-deficiency thresholds occurred in 83% of POC:PP and 65% of PN:PP samples (Tables 2, 4 and Figures 4A,B) with no significant differences between wet and dry years (Table 5). P debt results also support P-deficiency, with 7% of the samples exceeding the threshold in 2018 (Table 4 and Figure 4C). Only 11% of ϕPSII P-addition experiments exhibited positive increases in ϕPSII relative to the controls (Figure 4D and Supplementary Table 2).
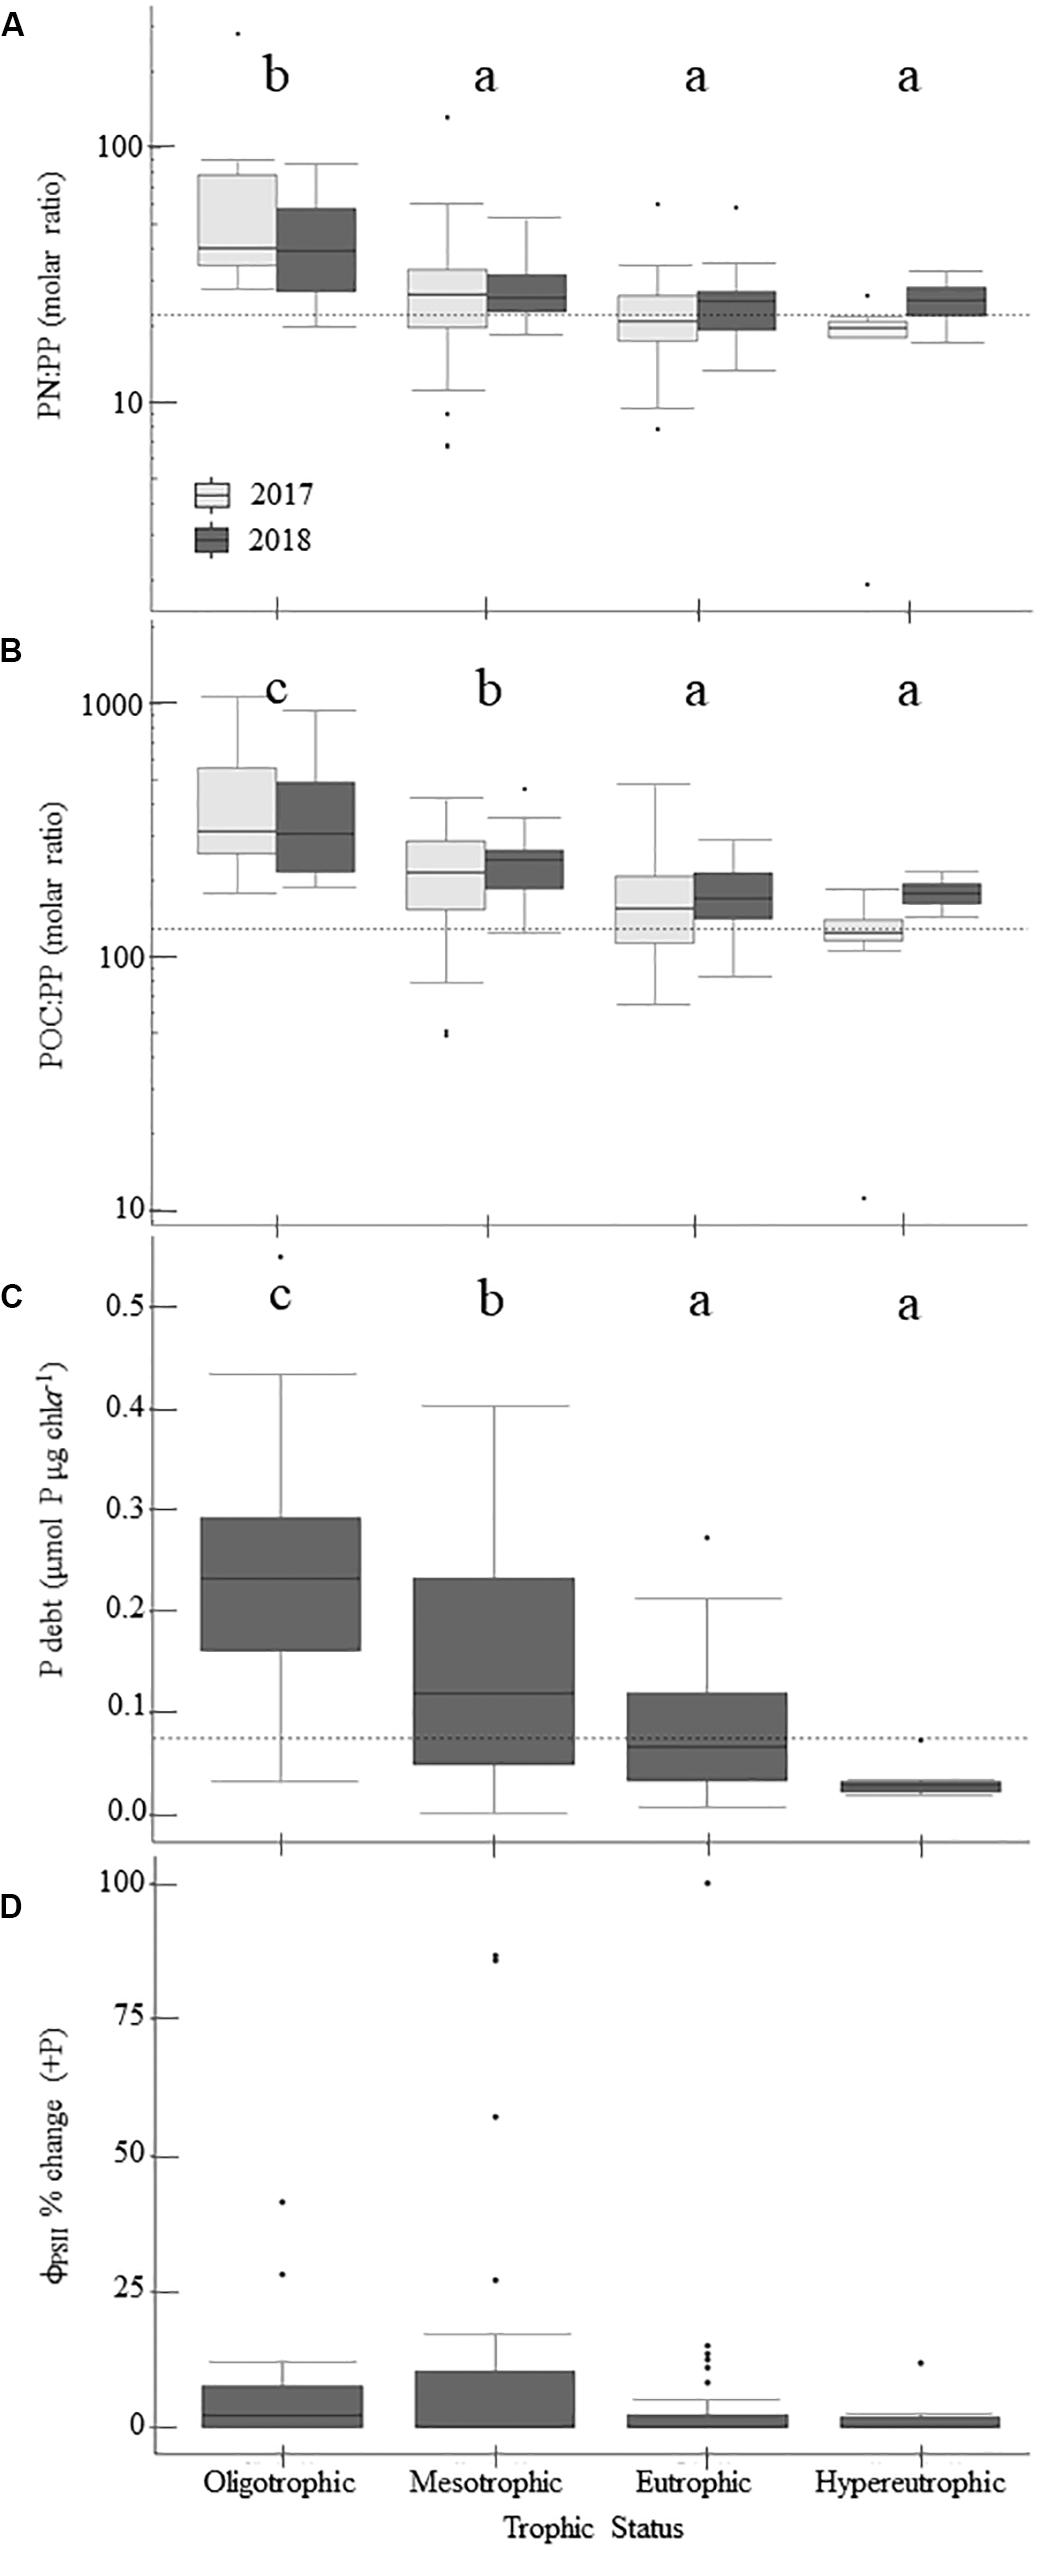
Figure 4. Patterns in phosphorus-deficiency across the trophic gradient and 2-year sample period, if applicable, for parameters sampled in 2017 and 2018. Panels show particulate nitrogen to particulate phosphorus (PN:PP) ratios (A), particulate organic carbon to particulate phosphorus (POC:PP) ratios (B), phosphorus debts (P debt; C), and percent change in ϕPSII relative to the control treatment following P-additions (D). Dashed horizontal lines indicate phosphorus-deficiency thresholds where applicable. Values above those lines suggest phosphorus-deficiency (Table 2). Lowercase letters indicate results from multiple comparisons post-hoc tests, where similar letters denote no significant differences between trophic states (Table 5). Within the boxplots, the 50th percentile (median) is visualized with a solid horizontal line. The 25th and 75th percentiles are represented by box hinges above and below the median line. On either end of the box, whiskers denote the smallest and largest values within 1.5× the interquartile range (IQR) and points indicate values beyond 1.5× the IQR.
N-deficiency is not common in Missouri reservoirs (Figure 5). The POC:PN ratio, which was the only N-indicator applied in both years, showed no difference between 2017 and 2018 (Table 5) and only 35% of samples were above the N-deficiency threshold (Table 2, Figure 5A, and Supplementary Table 2). N debts and ϕPSII N-addition experiments provided little support for N-deficiency (Tables 4, 6, 7, Figure 5, and Supplementary Table 2).
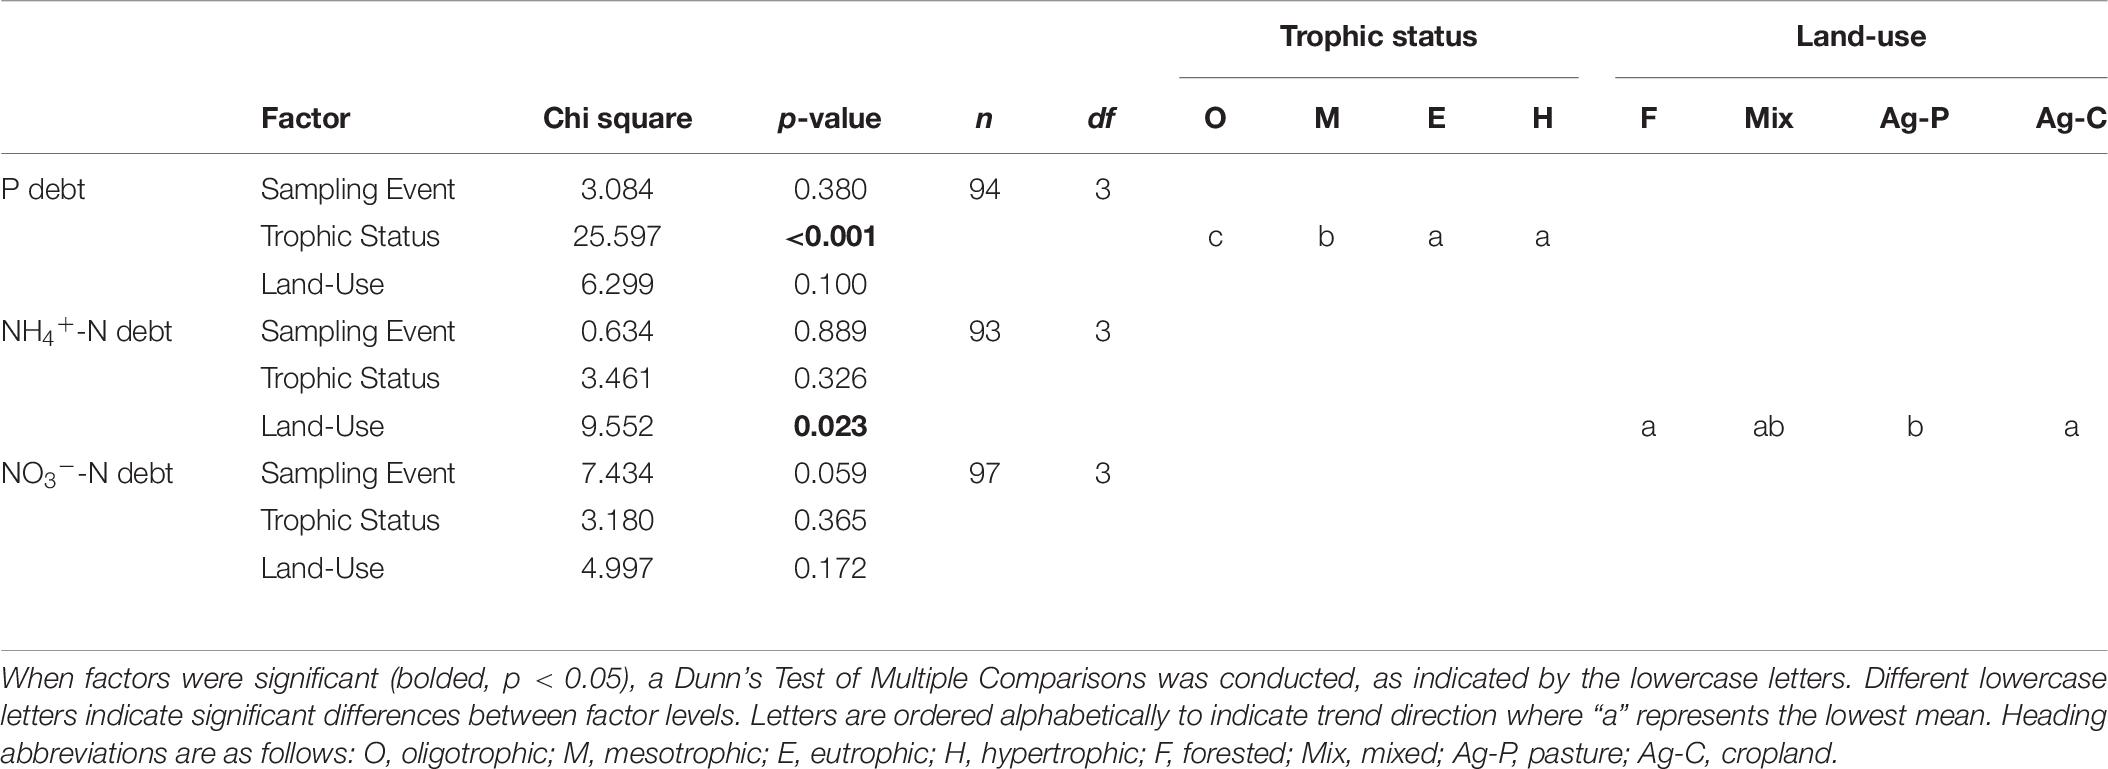
Table 7. A Kruskal Wallis ANOVA was conducted on the 2018 nutrient debts (P debt, NH4+-N debt, NO3–-N debt) to test for the effects of sampling event, trophic status, and watershed land-use.
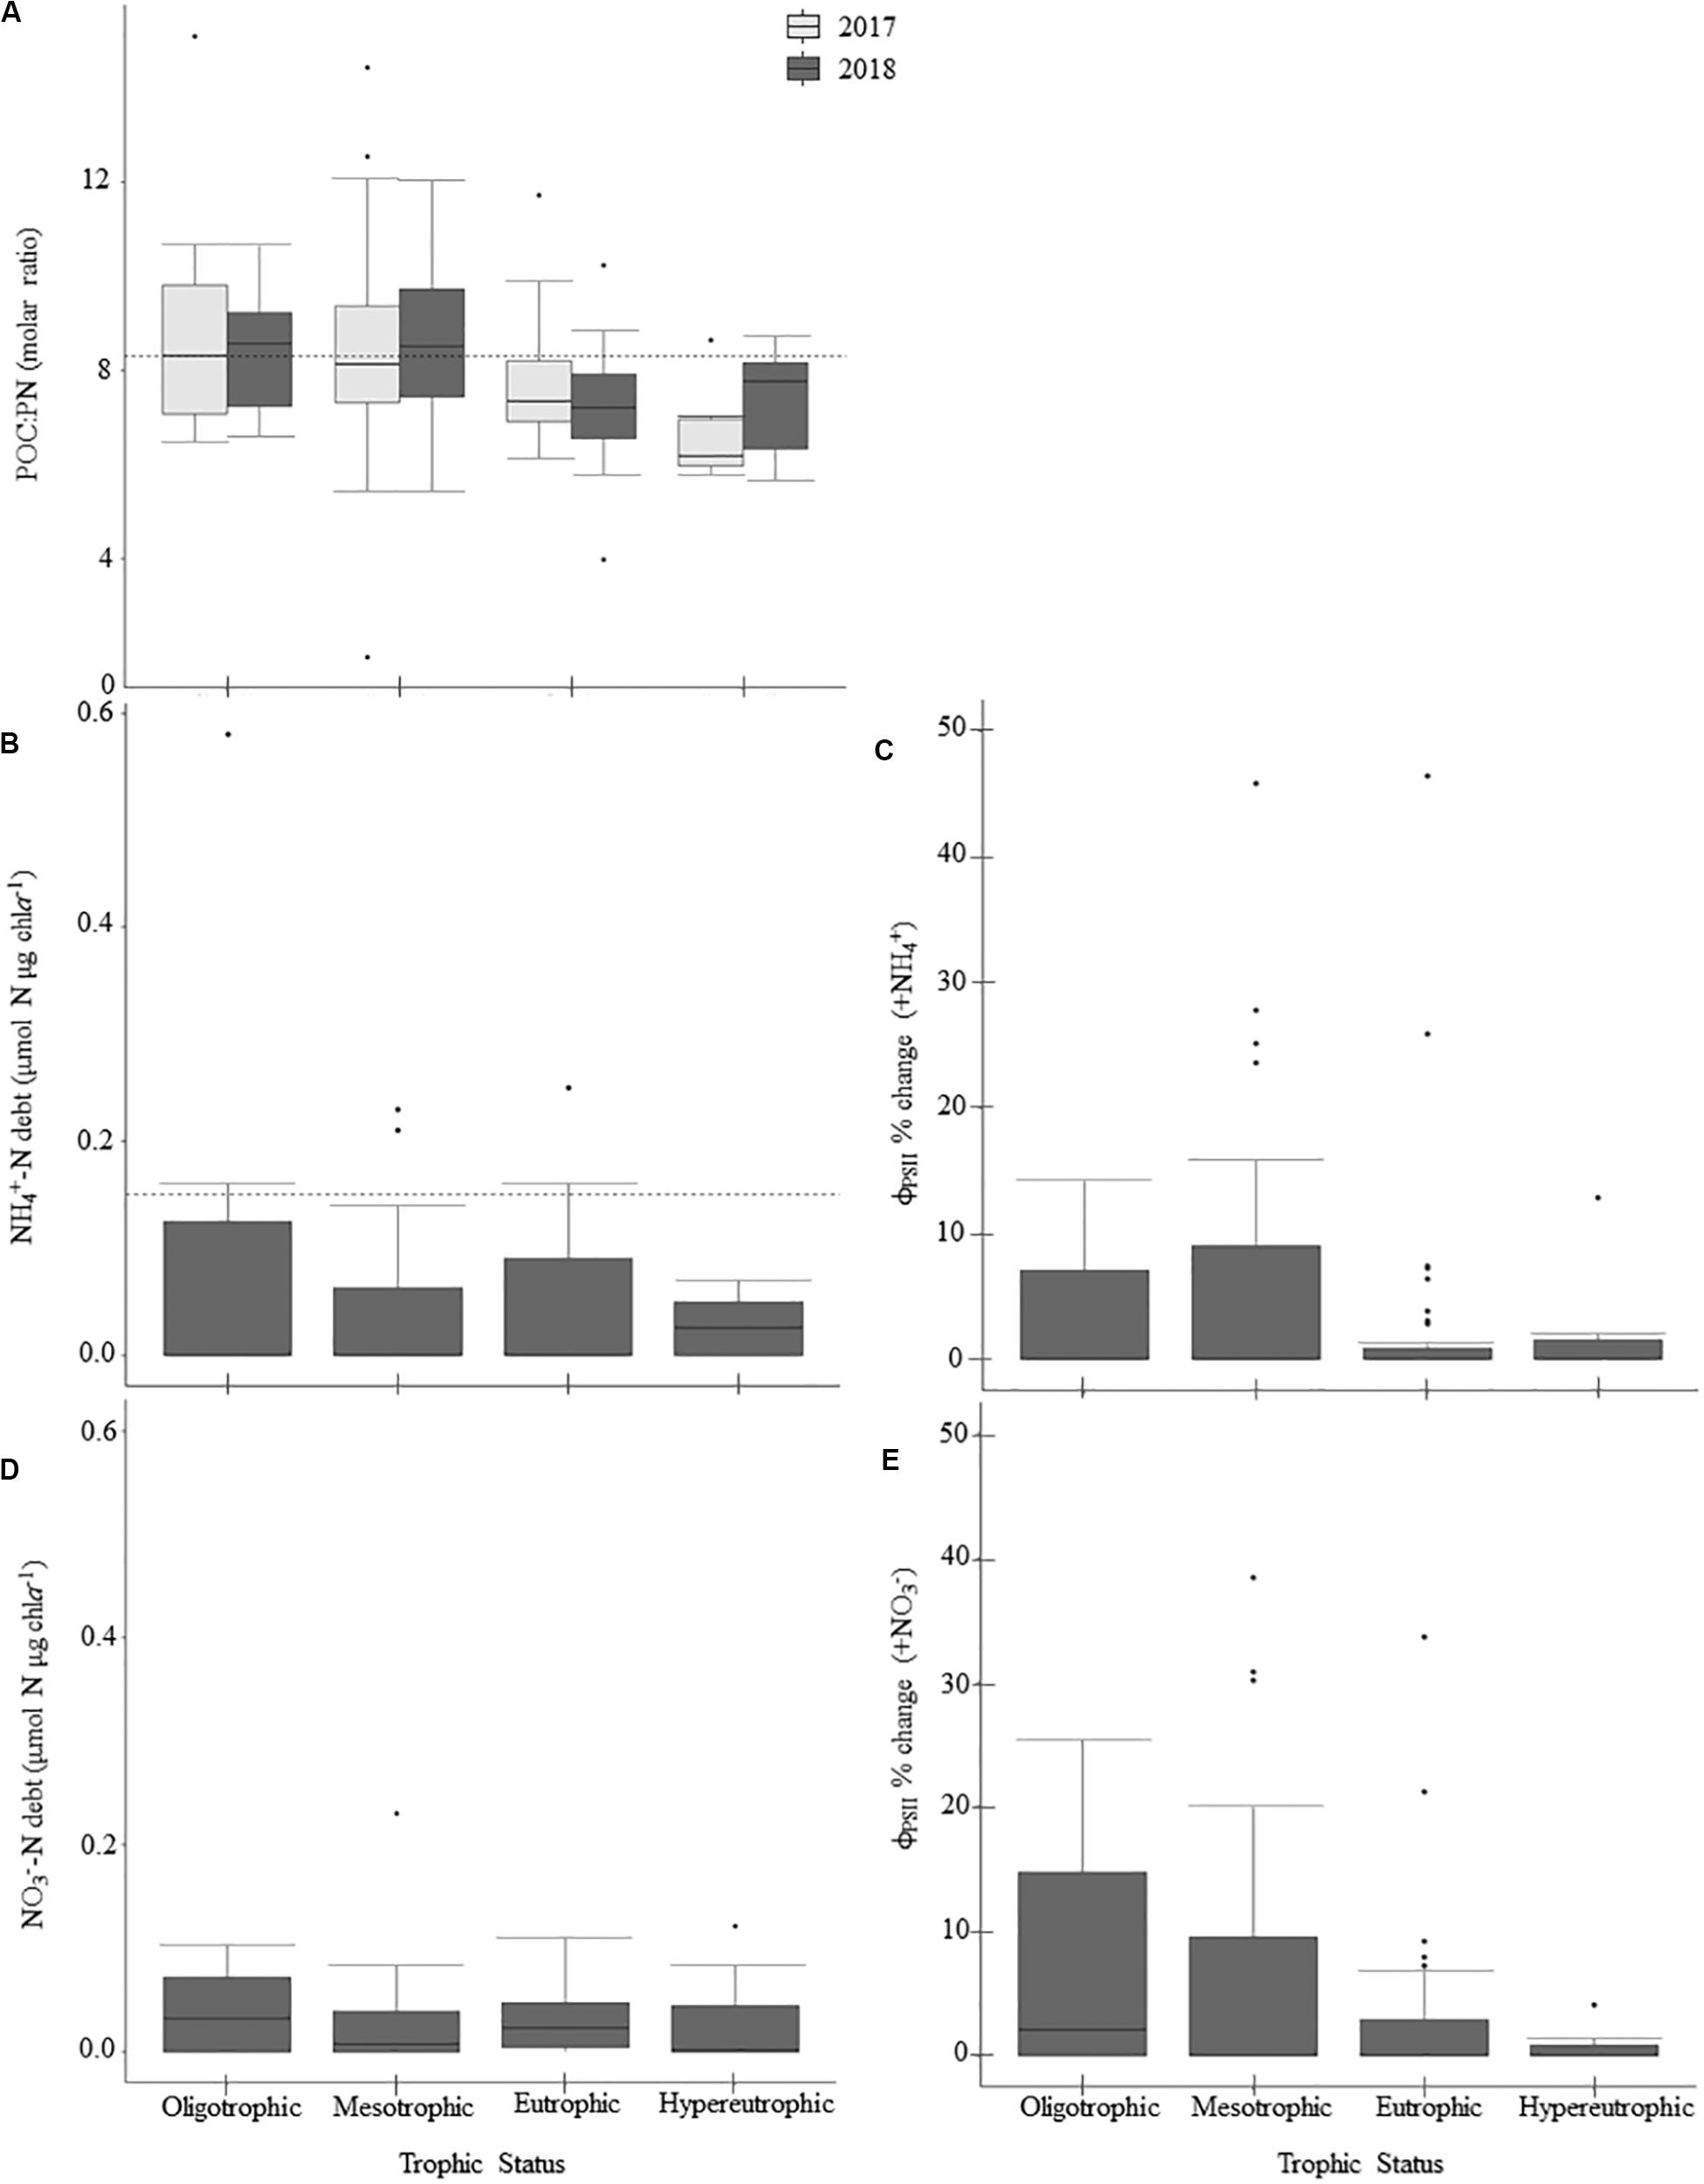
Figure 5. Patterns in nitrogen-deficiency across the trophic gradient and 2-year sample period, if applicable, for parameters sampled in 2017 and 2018. Panels show particulate organic carbon to particulate nitrogen (POC:PN) ratios (A), ammonium debts (NH4+-debt; B), percent change in ϕPSII relative to the control treatment following NH4+-additions (C), nitrate debts (NO3– -debt; D), and percent change in ϕPSII relative to the control treatment following NO3– additions (E). Dashed horizontal lines indicate nitrogen-deficiency thresholds where applicable. Values above those lines suggest nitrogen-deficiency (Table 2). There were no significant differences between trophic states (Table 5). Within the boxplots, the 50th percentile (median) is visualized with a solid horizontal line. The 25th and 75th percentiles are represented by box hinges above and below the median line. On either end of the box, whiskers denote the smallest and largest values within 1.5× the interquartile range (IQR) and points indicate values beyond 1.5× the IQR.
Missouri reservoirs are primarily P-deficient. When plotted on a coordinate plane, the P debt and NH4+-N debt thresholds create four quadrants wherein we can estimate N-only deficiency (quadrant 1), NP co-deficiency (quadrant 2), P-only deficiency (quadrant 3) and sufficiency of both N and P (quadrant 4; Figure 6). None of the phytoplankton communities indicated N-only deficiency (quadrant 1) and only 8% fell in quadrant 2 suggesting NP co-deficiency. Most samples indicated P-only deficiency (51%) or N and P sufficiency (41%; Figure 6).
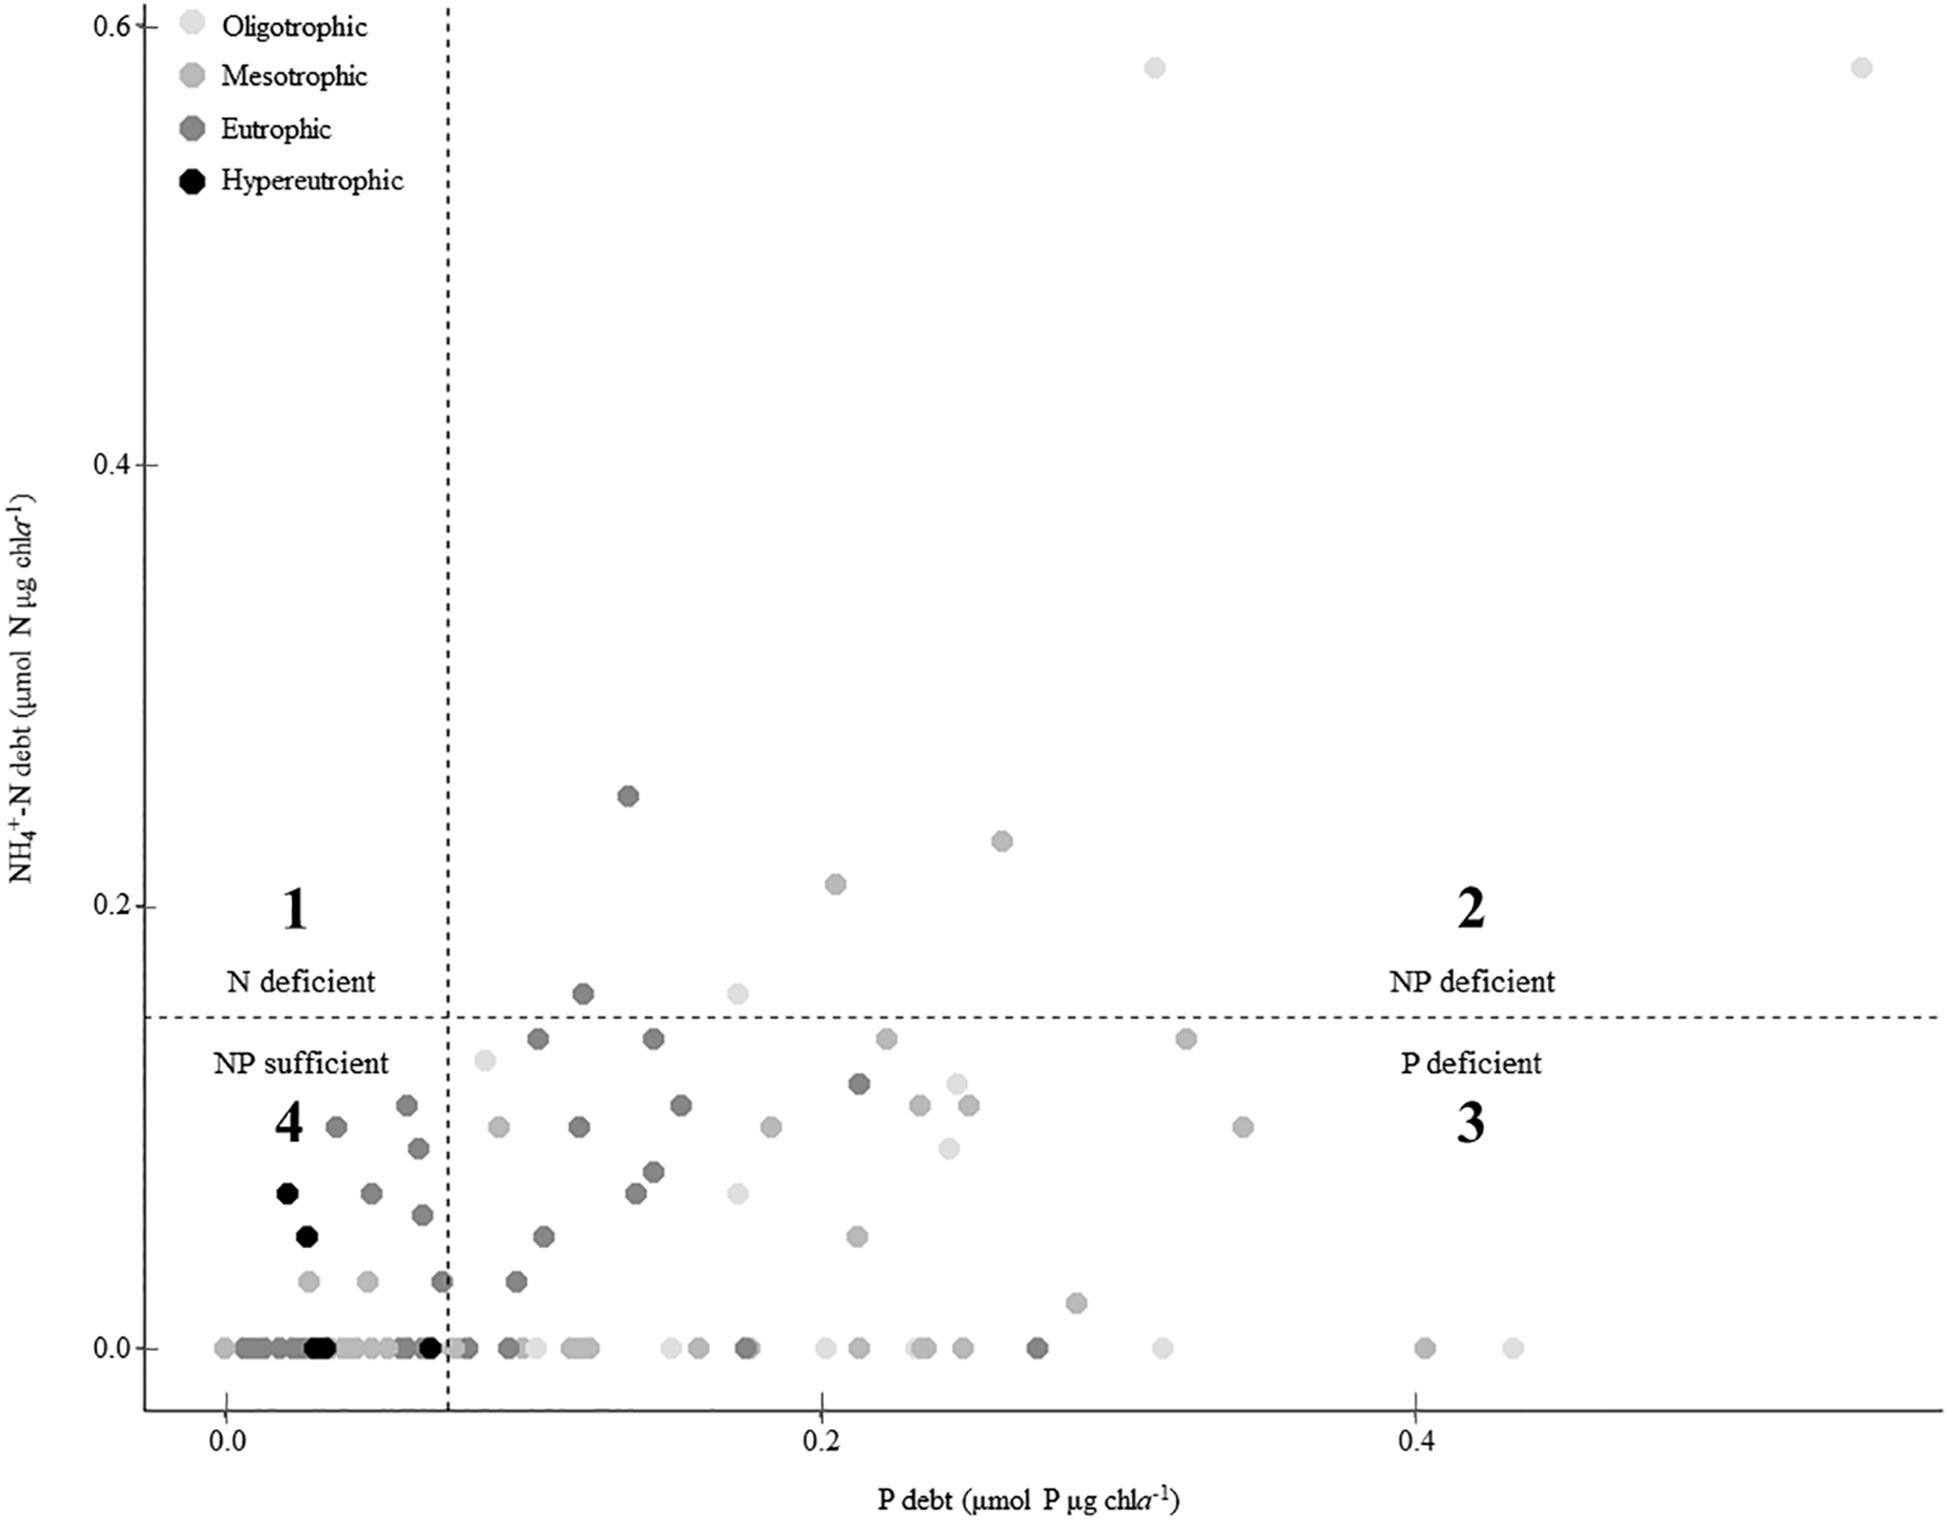
Figure 6. Summary of nutrient deficiency across the trophic gradient according to phosphorus (P) and ammonium (NH4+) debts. Dashed lines indicate deficiency thresholds for P and NH4+-debts (Table 2). Values above these lines suggest deficiency, thus quadrants 1, 3, and 2 represent N-only deficiency, P-only deficiency, and NP co-deficiency, respectively. Quadrant 4 represents nutrient sufficiency in both P and N.
Given that indicator values can vary due to influences of phytoplankton community composition and non-algal particulate matter (Hecky et al., 1993), multiple indicator implementation increases assessment strength, especially when observing agreement between ≥2 indicators (Hecky and Kilham, 1988). In 2017, POC:PP and PN:PP ratios were employed as our primary P status indicators with 100% agreement in favor of P-deficiency in oligotrophic reservoirs (Supplementary Table 3). In 2018, P-indicators were expanded to include P debt and P-addition ϕPSII experiments. All but one oligotrophic sample favored P-deficiency; 2% with complete agreement, and 73% with 3/4 indicator agreement. Overall agreement was much higher for N-indicators than P-indicators with all N-indicators agreeing 63–64% of the time for NH4+ and NO3– additions. We found 88% of indicator applications favored N-sufficiency for NH4+, while 95% of applications favored N-sufficiency for NO3– additions (Supplementary Table 3).
Photosynthesis-Irradiance (P-E) Parameters
In 2018, ϕPSII ranged from 0.33 to 0.66 across the trophic gradient with a mean of 0.48 (Table 4). The ϕPSII in all but one sampling event fell below the empirical optimum value of ∼0.65, with only 8% of sampling events having values >0.60. Land-use had a significant effect on ϕPSII, where agricultural-pasture had the lowest mean ϕPSII and forested had the highest. There was no relationship with trophic status. We also found no relationship between trophic status and α, although a significant relationship did exist between α and land-use, as well as sampling event (Table 5). Phytoplankton in reservoirs of forested watersheds were the most efficient at utilizing light, whereas those in ag-pasture watersheds were the least efficient. Efficiency was highest in May/June and lowest in August/September. After normalization to chla, αB differed across trophic status with phytoplankton of oligotrophic reservoirs being more efficient than those of meso-, eu-, or hyper- trophic reservoirs (Table 5 and Figures 3A,B). As with α, αB demonstrated that efficiency was higher in May/June and in forested watersheds than in August/September or ag-pasture watersheds. Ranging from 92.68 to 491.34 with an average of 292.63 μmol photons m–2 s–1 (Table 4), there was no relationship between the light saturation parameter (Ek) and trophic status (Table 5). The maximum relative electron transport rate through photosystem II (rETRmax) ranged from 54.96 to 279.71 with an average of 145.14 (Table 4) and was also not related to trophic status (Table 5). Sampling event was related to both Ek and rETRmax wherein both P-E parameters peaked in May/June and reached the lowest values by July/August. Per unit of chla, however, EkB was higher for phytoplankton in oligotrophic reservoirs compared to meso-, eu-, or hyper- trophic reservoirs. EkB was also higher in May/June but was not related to land-use (Table 5).
Gross Primary Productivity
Ranging from 668 to 701 mmol O2 m–2 day–1, mean GPP rates were similar between oligo-, meso-, and eu- trophic reservoirs. Hypertrophic reservoirs demonstrated a lower mean GPP of 607 mmol O2 m–2 day–1. Across individual samples, GPP widely ranged from ∼33 to 2,668 (Table 4). There was no relationship between GPP and any chemical or biological parameters nor with trophic status (Table 5).
Rates of GPP normalized to chla (GPPB) were negatively related to trophic status, where GPPB was highest in oligotrophic reservoirs and decreased with increasing eutrophy (p = 0.001; Figure 3C). While trophic mean GPPB rates ranged from ∼10 to 430 mmol O2 (mg Chla–1) m day–1, the mean GPPB in oligotrophic reservoirs was ∼3, ∼7, and ∼44× higher than those in meso-, eu-, and hyper- trophic reservoirs, respectively (Table 4 and Figure 3C). We found positive correlations between GPPB and physical and P-E parameters, and negative correlations for chemical and biological parameters. Higher GPPB rates correlated with higher light availability and P-E activity, and lower turbidity, nutrients, and proxies for phytoplankton biomass (Supplementary Table 4).
Discussion
Missouri reservoirs have variable light availability, nutrient chemistry, proxies for phytoplankton biomass, and GPP rates across the trophic gradient and between the climatically contrasting summers of 2017 and 2018. P-deficiency was the predominant constraint on phytoplankton biomass with rare occurrences of N-deficiency. Light deficiency was observed ∼25% of the times sampled. Highest in oligotrophic reservoirs, mean GPPB, EkB, and αB decreased with increasing eutrophy. Productivity was constrained by light availability, induced through self-shading by phytoplankton communities.
Production:Biomass Ratios
The median chla concentration in our study reservoirs is 9.3 μg L–1, ranging from 0.9 to 125.7 μg L–1. These concentrations are ∼1.5× higher than the median summer chla (6 μg L–1) measured in 2,239 lakes in the Midwest and Northeast United States (Oliver et al., 2017). A global study of 1,316 lakes ranging from tropical to polar, reported a median chla concentration of 5.9 μg L–1 (Abell et al., 2012). Within this dataset, the low-temperate lakes had a median chla of 13.2 μg L–1 (Abell et al., 2012), 1.4× higher than our Midwest reservoirs. Neither of these studies, however, differentiated between lakes and reservoirs; reservoirs tend to have higher phytoplankton biomass and productivity (Kimmel and Groeger, 1984).
Just as P is assumed to be the primary constraint on phytoplankton biomass (Schindler, 1974), a similar paradigm exists for lake productivity (Vollenweider, 1976). Global lake observations support the paradigm, showing strong positive relationships between GPP and TP (Hanson et al., 2003; Solomon et al., 2013). While most Missouri reservoirs are consistent with the P-paradigm for biomass accrual, their productivity diverges from the lake-centric model by GPP and GPPB having, respectively, no relationship and a strongly negative relationship with TP (Supplementary Table 4). The ratio of production to biomass across our trophic gradient is high at low TP (oligotrophic) and low at high TP (hypertrophic). A negative relationship between GPPB and TP has also been observed in seven Midwestern (Wisconsin) lakes (Lauster et al., 2006). There, GPPB decreased with increasing eutrophy, wherein the median GPPB, measured with light/dark bottle incubations, was 21.89, 8.39, 5.67, and 0.72 mmol O2 (mg chla–1) m day–1 for oligo-, meso-, eu-, and dys- trophic lakes, respectively (Lauster et al., 2006). They also reported a wide, albeit lower range in GPP (9–179 mmol O2 m–2 day–1) and GPPB (1–320 mmol O2 (mg chla–1) m day–1; Lauster et al., 2006). The wide range we observed in GPP (33–2,668 mmol O2 m–2 day–1) is also higher than a literature synthesis utilizing various GPP methods from a global assemblage of lakes (3–1,100 mmol O2 m–2 day–1, n = 72; Hoellein et al., 2013). Given the higher productivity expected from reservoirs (Kimmel and Groeger, 1984), our rates are more comparable to other temperate reservoirs, for which productivity studies are rare. Rates from 2 Canadian reservoirs- South Indian Lake and Lake Diefenbaker are still lower than what we report here. Two years after impoundment, productivity measured with 14C uptake in South Indian Lake were 71 mmol O2 m–2 day–1 for GPP and 17 mmol O2 (mg chla–1) m day–1 for GPPB (Hecky and Guildford, 1984). In the oligo-mesotrophic reservoir, Lake Diefenbaker, fluorometrically derived GPP rates (11–746 mmol O2 m–2 day–1) overlapped the range of rates in our oligotrophic reservoirs, but its mean GPP was ∼6× smaller. Similar chla averages between our reservoirs and Lake Diefenbaker (2.5 and 3.0 μg L–1, respectively) shortened the gap between mean GPPB rates, but Lake Diefenbaker rates were still ∼3× smaller than those of our oligotrophic reservoirs (Dubourg et al., 2015). Given that reservoir construction has increased by an order of magnitude in the past half century (Zarfl et al., 2015), it is important to consider these elevated reservoir rates in global carbon modeling exercises. The high GPP rates reported here in Midwest reservoirs will also have implications for reservoir ecological functioning and food webs.
Variances between reported productivity estimates may be attributed not only to intersystem differences, but also to methodological differences. We derived our estimates fluorometrically, as did others, but traditional methods rely on diel changes in O2, light/dark bottle incubations and/or 14C fixation. Fluorometric methods predict GPP 1.6× higher than actual C-fixation (Kromkamp et al., 2008). Fluorometrically derived P-E parameters can also vary with species composition of the phytoplankton (Campbell et al., 1998; Suggett et al., 2009). Cyanobacteria, in particular, are known to exhibit significantly lower ϕPSII than eukaroytes (Campbell et al., 1998). While the members of our present-day phytoplankton communities are unknown, it has been previously demonstrated that cyanobacterial abundance increases with trophic status in Missouri reservoirs (Jones et al., 2008b).
In north temperate lakes, productivity exhibits notable positive and negative interactions with Ē24 and turbidity, respectively (Staehr and Sand-Jensen, 2007; Torremorell et al., 2009; Staehr et al., 2010; Laas et al., 2012). Low productivity in turbid waters can be attributed to high PIM (Grobbelaar, 1989) or high POM, via the light-shade acclimation response (Kromkamp et al., 2008). Previous studies on Missouri reservoirs have shown that PIM typically dominates summer seston (29–87% of TSS; Jones and Knowlton, 1993; Knowlton and Jones, 1995, 2000). During our 2-year sampling window, TSS was dominated by POM in 85% of samples and the lowest GPPB rates corresponded with the highest POM concentrations. We conclude that self-shading by phytoplankton induced light deficiencies which regulated primary productivity. Increased turbidity via elevated biomass accrual and self-shading were also evidenced by negative correlations of both GPPB and αB with chla and Kd in a eutrophic lake in the Netherlands (Kromkamp et al., 2008).
Light-deficiency was most common in reservoirs from Missouri watersheds dominated by ag-crop, followed by ag-pasture. While agricultural land use enhances nutrient export to surface waters, row-crop agriculture is often associated with higher nutrient enrichment than low-intensity livestock production (Strayer et al., 2003). Although our high-nutrient systems had more PIM than did our low-nutrient systems, POM concentrations were notably higher than PIM concentrations in nearly all samples. Thus, when light-deficiency occurred, it was induced by self-shading rather than mineral turbidity.
The shallow mixing depths of Missouri reservoirs ensure that phytoplankton communities spend sufficient time in the euphotic zone, reflected in high Ē24 values and lack of evidence for photoacclimation. As with the GPP methodological issues, Ek derived from fluorometry is often higher than Ek from C-incorporation (Napoléon and Claquin, 2012). Nutrient deficiency, in particular, can perturb the relationship between electron transport rate and C, from which the fluorometric-Ek is derived (Napoléon et al., 2013). The Ē24:Ek ratio was originally applied using C-incorporation methods (Hecky and Guildford, 1984), therefore, using fluorometrically derived Ē24:Ek may overestimate the actual degree of light-deficiency. As a physiological measurement, ϕPSII is often used as a general indicator of phytoplankton stress, with values less than 0.65, as most of our samples were, indicative of light and/or nutrient deficiency (Kromkamp and Forster, 2003), hindering photosynthetic capacity (Kromkamp et al., 2008). Given that the lowest ϕPSII occurred in the highest-nutrient/lowest-light systems, the physiological stress likely does not reflect a lack of nutrients, but rather, light deficiency. If the phytoplankton were stressed due to nutrient deficiencies, we would have observed significant increases in ϕPSII post-nutrient additions.
The Role of Nutrients in Constraining Phytoplankton Biomass in an Agricultural State
Agriculture is prominent on the Missouri landscape, representing 41% of the land-use, therefore, we would expect P to be in ample supply in these surface waters. Yet, P-deficiency is prevalent. We observe high concentrations of the most bioavailable form of P, DRP, in eu- and hyper- trophic reservoirs within agricultural watersheds. Conservation tillage and surface broadcasting of fertilizer resulted in a 218% increase in concentrations of DRP in Lake Erie (Michalak et al., 2013), and similar practices in Pennsylvania caused DRP to increase 3–28× above background levels following fertilizer application (Kleinman et al., 2009). The prominence of P deficiency in Missouri reservoirs implies that additional inputs of P could result in increased phytoplankton biomass. Thus, implementation of beneficial management practices (BMPs) that would reduce DRP runoff are advised. Climate-induced increases in flow to downstream reservoirs need to be countered with increased efforts for nutrient retention on the landscape (Sharpley et al., 2013). These land-based nutrient management efforts, however, may not yield an immediate improvement in water quality. Internal P loading rates are likely high in these reservoirs, as evidenced by high TDP concentrations in the hypolimnions during summer stratification. Extended stratification in a future climate (Woolway and Merchant, 2019) would further exacerbate internal P loading rates (North et al., 2014).
We recommend increased focus on mitigating non-point source P inputs, as it appears that these reservoirs are effective in N removal, resulting in low epilimnetic dissolved inorganic N concentrations, likely due to high rates of denitrification (Gooding and Baulch, 2017). Globally, increasing N-based fertilizer use is resulting in N concentrations in surface waters in excess of phytoplankton demand (Glibert et al., 2016). Despite these trends, studies in Kansas and Arkansas have demonstrated N to be a potentially important constraint on phytoplankton biomass (Dzialowski et al., 2005; Scott and Grantz, 2013). Our mean epilimnetic DON concentrations in reservoirs with row-crop agriculture watersheds were nearly double those in forested watersheds. Globally, urea fertilizer use has increased more than 100-fold in the last four decades (Glibert et al., 2006), and in the United States, nearly 90% of N-based fertilizer being applied is urea instead of ammonium nitrate (Paerl et al., 2016). Urea can exceed 40% of the DON pool (Glibert et al., 2006). Historical urea and DON concentrations are unknown for Missouri reservoirs, but previous publications indicate that 45% of the reservoirs had molar TN:TP ratios < 38 (Jones and Knowlton, 1993), indicating some N deficiency (Guildford and Hecky, 2000).
How Might Light and Nutrients Constrain Phytoplankton Dynamics in a Changing World?
The increase in rainfall intensity associated with climate change, accompanied by the pervasiveness of agriculture and urbanization, will contribute to greater proportions of bioavailable P and N reaching inland waters. Simultaneously, climatically induced stronger and longer-lasting thermal stratification (Woolway and Merchant, 2019) is anticipated to increase hypolimnetic oxygen depletion. Bottom-water anoxia stimulates internal loading, which amplifies hypolimnetic nutrient concentrations (North et al., 2014). Given that ∼94% of Missouri reservoirs are already meso-, eu-, or hyper- trophic and quickly develop hypolimnetic anoxia during summer stratification, these Midwestern systems represent potential climate analogs and precursors of the light and nutrient conditions impacting future reservoir phytoplankton dynamics. Although light-deficiency may be alleviated due to shallower mixing depths; most of these characteristically turbid systems will likely still have enough light to support phytoplankton growth, photosynthesis, and nutrient uptake.
Conclusion
Under current climatic and anthropogenic influences, both P and light play active roles in controlling phytoplankton biomass and primary productivity in Midwestern reservoirs. Phytoplankton biomass is predominantly constrained by P concentrations during the summer stratified season, despite the abundance of both P and N in the agriculturally dominant region. Although this conclusion aligns with the traditionally accepted P-paradigm for freshwater ecosystems, the demonstration of co-deficiency between light, P, and N should also be acknowledged, especially within the context of the P vs. N and P management debate (Schindler et al., 2008; Paerl et al., 2016). Primary productivity in Midwestern reservoirs contradicts the traditional P-paradigm for lake productivity. GPPB was higher in low-nutrient reservoirs where light was in sufficient supply, and not shaded by high phytoplankton biomass. Here, we offer further evidence for the need to evaluate application of these paradigms to all systems across time and space, especially as we see shifts in climate patterns and anthropogenic activity that will ultimately alter the light and nutrient dynamics of future ecosystems.
Data Availability Statement
The datasets generated for this study are available on request to the corresponding author.
Author Contributions
EP designed the study under the direction and leadership of RN who conceived the original idea. EP collected the data by processing water samples, performing the experiments, and conducting laboratory and statistical analyses, performed calculations and modeled parameters described in the manuscript, designed figures, and wrote the manuscript in close consultation with RN. DO coordinated field sampling efforts, contributed data, and assisted in QA/QC of data. All authors contributed to the article and approved the submitted version.
Conflict of Interest
The authors declare that the research was conducted in the absence of any commercial or financial relationships that could be construed as a potential conflict of interest.
Acknowledgments
This work was made possible by the Missouri Department of Natural Resources, which generously funds the Missouri Statewide Lake Assessment Program coordinated by the University of Missouri (MU) Limnology Laboratory. We would like to thank the numerous MU Limnology Laboratory employees who contributed to sample collection and analysis. Specifically, thank you to Thomas Swenson, undergraduate research assistant; Carol Pollard and Clare Vanderwerken, laboratory technicians; Cody Kimbell and Matthew Sauer (2017) field rovers; and Madalyn Stoeker and Emily Phaup (2018) field rovers. Thank you to Dr. Greg Silsbe for his insight regarding the “phytotools” R-package, Dr. Christine Spinka for providing statistical consultation, Drs. Chung-ho Lin and Jacob Westhoff for generously sharing environmental chamber space for experiments, Dr. Patrick Neale for providing expert testimonial, and Dr. Alba Argerich for providing helpful comments to improve and clarify the writing of this manuscript. We thank Dr. John R. Jones for his title suggestion. We would also like to acknowledge Dr. Joy Matthews and the University of California – Davis Stable Isotope Facility for their professional and timely analytical services. Analytical costs were, in part, supported by a Grant-In-Aid of Research from Sigma Xi, the Scientific Research Honor Society.
Supplementary Material
The Supplementary Material for this article can be found online at: https://www.frontiersin.org/articles/10.3389/fenvs.2020.00111/full#supplementary-material
Footnotes
References
Abell, J. M., Özkundakci, D., and Hamilton, D. P. (2010). Nitrogen and phosphorus limitation of phytoplankton growth in New Zealand lakes: implications for eutrophication control. Ecosystems 13, 966–977. doi: 10.1007/s10021-010-9367-9
Abell, J. M., Özkundakci, D., Hamilton, D. P., and Jones, J. R. (2012). Latitudinal variation in nutrient stoichiometry and chlorophyll-nutrient relationships in lakes: A global study. Fundam Appl. Limnol. 181, 1–14. doi: 10.1127/1863-9135/2012/0272
APHA (2017). Standard Methods for the Examination of Water and Wastewater, 23 Edn, eds E. W. Rice, R. B. Baird, and A. D. Eaton (Washington, DC: American Public Health Association).
Bennett, E. M., Carpenter, S. R., and Caraco, N. F. (2001). Human impact on erodable phosphorus and eutrophication: a global perspective. Bioscience 51, 227–234.
Blackman, F. F. (1905). Optima and limiting factors. Ann. Bot. 19, 281–296. doi: 10.1093/oxfordjournals.aob.a089000
Brodie, C. R., Leng, M. J., Casford, J. S. L., Kendrick, C. P., Lloyd, J. M., Yongqiang, Z., et al. (2011). Evidence for bias in C and N concentrations and δ13C composition of terrestrial and aquatic organic materials due to pre-analysis acid preparation methods. Chem. Geol. 282, 67–83. doi: 10.1016/j.chemgeo.2011.01.007
Campbell, D., Hurry, V., Clarke, A. K., Gustafsson, P., and Oquist, G. (1998). Chlorophyll fluorescence analysis of cyanobacterial photosynthesis and acclimation. Microbiol. Mol. Biol. Rev. 62, 667–683. doi: 10.1128/mmbr.62.3.667-683.1998
Crumpton, W. G., Isenhart, T. M., and Mitchell, P. D. (1992). Nitrate and organic N analyses with second-derivative spectroscopy. Limnol. Oceanogr. 37, 907–913. doi: 10.4319/lo.1992.37.4.0907
Dubourg, P., North, R. L., Hunter, K., Vandergucht, D. M., Abirhire, O., Silsbe, G. M., et al. (2015). Light and nutrient co-limitation of phytoplankton communities in a large reservoir: lake Diefenbaker, Saskatchewan, Canada. J. Great Lakes Res. 41, 129–143. doi: 10.1016/j.jglr.2015.10.001
Dzialowski, A. R., Wang, S. H., Lim, N. C., Spotts, W. W., and Huggins, D. G. (2005). Nutrient limitation of phytoplankton growth in central plains reservoirs, USA. J. Plankton Res. 27, 587–595. doi: 10.1093/plankt/fbi034
Elser, J. J., Bracken, M. E. S., Cleland, E. E., Gruner, D. S., Harpole, W., Hillebrand, H., et al. (2007). Global analysis of nitrogen and phosphorus limitation of primary producers in freshwater, marine and terrestrial ecosystems. Ecol. Lett. 10, 1135–1142. doi: 10.1111/j.1461-0248.2007.01113.x
Elser, J. J., Marzolf, E. R., and Goldman, C. R. (1990). Phosphorus and nitrogen limitation of phytoplankton growth in the freshwaters of North America: a review and critique of experimental enrichments. Can. J. Fish. Aquat. Sci. 47, 1468–1477. doi: 10.1139/f90-165
Fee, E. J. (1990). Computer programs for calculating in situ phytoplankton photosynthesis. Can. Tech. Rep. Fish. Aquat. Sci. 1740, 1–27.
Galloway, J. N., Townsend, A. R., Erisman, J. W., Bekunda, M., Cai, Z., Freney, J. R., et al. (2008). Transformation of the nitrogen cycle: recent trends, questions, and potential solutions. Science 320, 889–892. doi: 10.1126/science.1136674
Glibert, P. M., Harrison, J., Heil, C., and Seitzinger, S. (2006). Escalating worldwide use of urea: a global change contributing to coastal eutrophication. Biogeochemistry 77, 441–463. doi: 10.1007/s10533-005-3070-5
Glibert, P. M., Wilkerson, F. P., Dugdale, R. C., Raven, J. A., Dupont, C. L., Leavitt, P. R., et al. (2016). Pluses and minuses of ammonium and nitrate uptake and assimilation by phytoplankton and implications for productivity and community composition, with emphasis on nitrogen-enriched conditions. Limnol. Oceanogr. 61, 165–197. doi: 10.1002/lno.10203
Gooding, R. M., and Baulch, H. M. (2017). Small reservoirs as a beneficial management practice for nitrogen removal. J. Environ. Qual. 46, 96–104. doi: 10.2134/jeq2016.07.0252
Grobbelaar, J. U. (1989). The contribution of phytoplankton productivity in turbid freshwaters to their trophic status. Hydrobiologia 173, 127–133. doi: 10.1007/BF00015522
Guildford, S. J., Bootsma, H. A., Fee, E. J., Hecky, R. E., and Patterson, G. (2000). Phytoplankton nutrient status and mean water column irradiance in lakes Malawi and Superior. Aquat. Ecosyst. Heal Manag. 3, 35–45. doi: 10.1080/14634980008656989
Guildford, S. J., and Hecky, R. E. (2000). Total nitrogen, total phosphorus, and nutrient limitation in lakes and oceans: is there a common relationship? Limnol. Oceanogr. 45, 1213–1223. doi: 10.4319/lo.2000.45.6.1213
Hanson, P. C., Bade, D. L., Carpenter, S. R., Kratz, T. K., and Long, W. (2003). Lake metabolism: relationships with dissolved organic carbon and phosphorus. Limnol. Oceanogr. 48, 1112–1119. doi: 10.4319/lo.2003.48.3.1112
Hayes, N. M., Deemer, B. R., Corman, J. R., Razavi, N. R., and Strock, K. E. (2017). Key differences between lakes and reservoirs modify climate signals: a case for a new conceptual model. Limnol. Oceanogr. Lett. 2, 47–62. doi: 10.1002/lol2.10036
Hayes, N. M., Vanni, M. J., Horgan, M. J., and Renwick, W. H. (2015). Climate and land use interactively affect lake phytoplankton nutrient limitation status. Ecology 96, 392–402. doi: 10.1890/13-1840.1
Healey, F. P. (1977). Ammonium and urea uptake by some freshwater algae. Can. J. Bot. 55, 61–69. doi: 10.1139/b77-013
Healey, F. P., and Hendzel, L. L. (1979). Indicators of phosphorus and nitrogen deficiency in five algae in culture. J. Fish. Res. Board Canada 36, 1364–1369. doi: 10.1139/f79-195
Healey, P. F. (1985). Interacting effects of light and nutrient limitation on the growth rate of Synechococcus linearis (Cyanophyceae). J. Phycol. 21, 134–146. doi: 10.1111/j.0022-3646.1985.00134.x
Hecky, R. E., Campbell, P., and Hendzel, L. L. (1993). The stoichiometry of carbon, nitrogen, and phosphorus in particulate matter of lakes and oceans. Limnol. Oceanogr. 38, 709–724. doi: 10.4319/lo.1993.38.4.0709
Hecky, R. E., and Guildford, S. J. (1984). Primary productivity of Southern Indian Lake before, during, and after impoundment and Churchill River diversion. Can. J. Fish. Aquat. Sci. 41, 591–604. doi: 10.1139/f84-072
Hecky, R. E., and Kilham, P. (1988). Nutrient limitation of phytoplankton in freshwater and marine environments: a review of recent evidence on the effects of enrichment. Limnol. Oceanogr. 33, 796–822. doi: 10.4319/lo.1988.33.4part2.0796
Hoellein, T. J., Bruesewitz, D. A., and Richardson, D. C. (2013). Revisiting Odum (1956): a synthesis of aquatic ecosystem metabolism. Limnol. Oceanogr. 58, 2089–2100. doi: 10.4319/lo.2013.58.6.2089
Howarth, R., Swaney, D., Billen, G., Garnier, J., Hong, B., Humborg, C., et al. (2012). Nitrogen fluxes from the landscape are controlled by net anthropogenic nitrogen inputs and by climate. Front. Ecol. Environ. 10:37–43. doi: 10.1890/100178
Jeppesen, E., Moss, B., Bennion, H., Carvalho, L., Demeester, L., Feuchtmayr, H., et al. (2010). “Interaction of climate change and eutrophication,” in Climate Change Impacts on Freshwater Ecosystems, eds M. Kernan, R. W. Battarbee, and B. Moss (Hoboken, NY: Blackwell Publishing Ltd), 119–151. doi: 10.1002/9781444327397.ch6
Jones, J. R., and Knowlton, M. F. (1993). Limnology of Missouri reservoirs: an analysis of regional patterns. Lake Reserv. Manag. 8, 17–30. doi: 10.1080/07438149309354455
Jones, J. R., Knowlton, M. F., and Obrecht, D. V. (2008a). Role of land cover and hydrology in determining nutrients in mid-continent reservoirs: implications for nutrient criteria and management. Lake Reserv. Manag. 24, 1–9. doi: 10.1080/07438140809354045
Jones, J. R., Obrecht, D. V., Perkins, B. D., Knowlton, M. F., Thorpe, A. P., Watanabe, S., et al. (2008b). Nutrients, seston, and transparency of Missouri reservoirs and oxbow lakes: an analysis of regional limnology. Lake Reserv. Manag. 24, 155–180. doi: 10.1080/07438140809354058
Jones, J. R., Knowlton, M. F., Obrecht, D. V., and Graham, J. L. (2011). Temperature and oxygen in Missouri reservoirs. Lake Reserv. Manag. 27, 173–182. doi: 10.1080/07438141.2011.583713
Kimmel, B. L., and Groeger, A. W. (1984). Factors controlling primary production in lakes and reservoirs?: a perspective. Lake Reserv. Manag. 1, 277–281. doi: 10.1080/07438148409354524
Kirk, J. T. O. (2011). Light and Photosynthesis in Aquatic Ecosystems, 3rd Edn. New York, NY: Cambridge University Press, doi: 10.4319/lo.1987.32.1.0275
Kleinman, P., Buda, A. R., Saporito, L. S., Sharpley, A. N., and Bryant, R. B. (2009). Application of manure to no-till soils: phosphorus losses by sub-surface and surface pathways. Nutr. Cycl. Agroecosyst. 84, 215–227. doi: 10.1007/s10705-008-9238-3
Knoll, L. B., Vanni, M. J., and Renwick, W. H. (2003). Phytoplankton primary production and photosynthetic parameters in reservoirs along a gradient of watershed land use. Limnol. Oceanogr. 48, 608–617. doi: 10.4319/lo.2003.48.2.0608
Knowlton, M. F. (1984). Flow-through micocuvette for fluorometric determination of chlorophyll. Water Resour. Bull. 20, 795–799. doi: 10.1111/j.1752-1688.1973.tb05876.x
Knowlton, M. F., and Jones, J. R. (1995). Temporal and spatial dynamics of suspended sediment, nutrients, and algal biomass in Mark Twain Lake. Missouri. Arch. Hydrobiol. 135, 145–178.
Knowlton, M. F., and Jones, J. R. (1996). Experimental evidence of light and nutrient limitation of algal growth in a turbid midwest reservoir. Arch. Hydrobiol. 135, 321–335.
Knowlton, M. F., and Jones, J. R. (2000). Non-algal seston, light, nutrients, and chlorophyll in Missouri reservoirs. J. Lake Reserv. Manag. 16, 322–332. doi: 10.1080/07438140009354239
Kromkamp, J. C., Dijkman, N. A., Peene, J., Simis, S. G. H., and Gons, H. J. (2008). Estimating phytoplankton primary production in Lake IJsselmeer (The Netherlands) using variable fluorescence (PAM-FRRF) and C-uptake techniques. Eur. J. Phycol. 43, 327–344. doi: 10.1080/09670260802080895
Kromkamp, J. C., and Forster, R. M. (2003). The use of variable fluorescence measurements in aquatic ecosystems: differences between multiple and single turnover measuring protocols and suggested terminology. Eur. J. Phycol. 38, 103–112. doi: 10.1080/0967026031000094094
Laas, A., Noges, P., Koiv, T., and Noges, T. (2012). High-frequency metabolism study in a large and shallow temperate lake reveals seasonal switching between net autotrophy and net heterotrophy. Hydrobiologia 694, 57–74. doi: 10.1007/s10750-012-1131-z
Lauster, G. H., Hanson, P. C., and Kratz, T. K. (2006). Gross primary production and respiration differences among littoral and pelagic habitats in northern Wisconsin lakes. Can. J. Fish. Aquat. Sci. 63, 1130–1141. doi: 10.1139/F06-018
Lewis, W. M., and Wurtsbaugh, W. A. (2008). Control of lacustrine phytoplankton by nutrients: erosion of the phosphorus paradigm. Int. Rev. Hydrobiol. 93, 446–465. doi: 10.1002/iroh.200811065
MacIntyre, H. L., Kana, T. M., Anning, T., and Geider, R. J. (2002). Photoacclimation of photosynthesis irradiance response curves and photosynthetic pigments in microalgae and cyanobacteria. J. Phycol. 38, 17–38. doi: 10.1046/j.1529-8817.2002.00094.x
Michalak, A. M., Anderson, E. J., Beletsky, D., Boland, S., Bosch, N. S., Bridgeman, T. B., et al. (2013). Record-setting algal bloom in Lake Erie caused by agricultural and meteorological trends consistent with expected future conditions. Proc. Natl. Acad. Sci. U.S.A. 110, 6448–6452. doi: 10.1073/pnas.1216006110
Millard, E. S., Myles, D. D., Johannsson, O. E., and Ralph, K. M. (1996). Seasonal phosphorus deficiency of Lake Ontario phytoplankton at two index stations: light versus phosphorus limitation of growth. Can. J. Fish. Aquat. Sci. 53, 1112–1124. doi: 10.1139/cjfas-53-5-1112
Mitsch, W. J., Day, J. W., Gilliam, J. W., Groffman, P. M., and Hey, D. L. (2001). Reducing nitrogen loading to the Gulf of Mexico from the Mississippi River Basin: strategies to counter a persistent ecological problem. Bioscience 51, 373–388.
Morris, D. P., and Lewis, W. M. (1988). Phytoplankton nutrient limitation in Colorado mountain lakes. Freshw. Biol. 20, 315–327. doi: 10.1111/j.1365-2427.1988.tb00457.x
Napoléon, C., and Claquin, P. (2012). Multi-parametric relationships between PAM measurements and carbon incorporation, an in situ approach. PLoS One 7:1–12. doi: 10.1371/journal.pone.0040284
Napoléon, C., Raimbault, V., and Claquin, P. (2013). Influence of nutrient stress on the relationships between PAM measurements and carbon incorporation in four phytoplankton species. PLoS One 8:66423. doi: 10.1371/journal.pone.0066423
NOAA (2019). Historical Palmer Drought Indices. Natl Ocean Atmos Adm. Available online at: https://www.ncdc.noaa.gov/temp-and-precip/drought/historical-palmers (accessed August 5, 2019).
North, R. L., Guildford, S. J., Smith, R. E. H., Havens, S. M., and Twiss, M. R. (2007). Evidence for phosphorus, nitrogen, and iron colimitation of phytoplankton communities in Lake Erie. Limnol. Oceanogr. 52, 315–328. doi: 10.4319/lo.2007.52.1.0315
North, R. L., Guildford, S. J., Smith, R. E. H., Twiss, M. R., and Kling, H. J. (2008). Nitrogen, phosphorus, and iron colimitation of phytoplankton communities in the nearshore and offshore regions of the African Great Lakes. Verh. Int. Verein Limnol. 30, 259–264. doi: 10.1080/03680770.2008.11902122
North, R. P., North, R. L., Livingstone, D. M., Köster, O., and Kipfer, R. (2014). Long-term changes in hypoxia and soluble reactive phosphorus in the hypolimnion of a large temperate lake: Consequences of a climate regime shift. Glob. Chang Biol. 20, 811–823. doi: 10.1111/gcb.12371
O’Reilly, C. M., Rowley, R. J., Schneider, P., Lenters, J. D., Mcintyre, P. B., Kraemer, B. M., et al. (2015). Rapid and highly variable warming of lake surface waters around the globe. Geophys. Res. Lett. 42, 10773–10781. doi: 10.1002/2015GL066235
O’Beirne, M. D., Werne, J. P., Hecky, R. E., Johnson, T. C., Katsev, S., and Reavie, E. D. (2017). Anthropogenic climate change has altered primary productivity in Lake Superior. Nat. Commun. 8:15713. doi: 10.1038/ncomms15713
Oliver, S. K., Collins, S. M., Soranno, P. A., Wagner, T., Stanley, E. H., Jones, J. R., et al. (2017). Unexpected stasis in a changing world: Lake nutrient and chlorophyll trends since 1990. Glob. Chang Biol. 23, 5455–5467. doi: 10.1111/gcb.13810
O’Reilly, C. M., Alin, S. R., Piisnier, P. D., Cohen, A. S., and McKee, B. A. (2003). Climate change decreases aquatic ecosystem productivity of Lake Tanganyika, Africa. Nature 424, 766–768. doi: 10.1038/nature01833
Paerl, H. W., and Scott, J. T. (2010). Throwing fuel on the fire: synergistic effects of excessive nitrogen inputs and global warming on harmful algal blooms. Environ. Sci. Technol. 44, 7756–7758. doi: 10.1021/es102665e
Paerl, H. W., Scott, J. T., McCarthy, M. J., Newell, S. E., Gardner, W. S., Havens, K. E., et al. (2016). It takes two to tango: when and where dual nutrient (N & P) reductions are needed to protect lakes and downstream ecosystems. Environ. Sci. Technol. 50, 10805–10813. doi: 10.1021/acs.est.6b02575
Pinheiro, J., Bates, D., DebRoy, S., Sarkar, D., and R Core Team. (2020). nlme: Linear and Nonlinear Mixed Effects Models. Available online at: https://cran.r-project.org/package=nlme (accessed May 24, 2020).
Rowland, F. E., North, R. L., McEachern, P., Obrecht, D. V., Gurung, T. B., Jones, S. B., et al. (2019). Phytoplankton nutrient deficiencies vary with season in sub-tropical lakes of Nepal. Hydrobiologia 833, 157–172. doi: 10.1007/s10750-019-3897-8
Saito, M. A., Goepfert, T. J., and Ritt, J. T. (2008). Some thoughts on the concept of colimitation: three definitions and the importance of bioavailability. Limnol. Oceanogr. 53, 1–16.
Sartory, D. P., and Grobbelaar, J. U. (1984). Extraction of chlorophyll a from freshwater phytoplankton for spectrophotometric analysis. Hydrobiologia 114, 177–187. doi: 10.1007/BF00031869
Schallenberg, M., and Burns, C. W. (2004). Effects of sediment resuspension on phytoplankton production: teasing apart the influences of light, nutrients and algal entrainment. Freshw. Biol. 49, 143–159. doi: 10.1046/j.1365-2426.2003.01172.x
Schindler, D. W. (1974). Eutrophication and recovery in experimental lakes: implications for lake management. Science 184, 897–899. doi: 10.1126/science.184.4139.897
Schindler, D. W. (1977). Evolution of phosphorus limitation in lakes. Science 195, 260–262. doi: 10.1126/science.195.4275.260
Schindler, D. W., Hecky, R. E., Findlay, D. L., Stainton, M. P., Parker, B. R., Paterson, M. J., et al. (2008). Eutrophication of lakes cannot be controlled by reducing nitrogen input: results of a 37-year whole-ecosystem experiment. Proc. Natl. Acad. Sci. U.S.A. 105, 11254–11258. doi: 10.1073/pnas.0805108105
Schmid, M., Hunziker, S., and Wüest, A. (2014). Lake surface temperatures in a changing climate: a global sensitivity analysis. Clim. Chang 124, 301–315. doi: 10.1007/s10584-014-1087-2
Scott, J. T., and Grantz, E. M. (2013). N2 fixation exceeds internal nitrogen loading as a phytoplankton nutrient source in perpetually nitrogen-limited reservoirs. Freshw. Sci. 32, 849–861. doi: 10.1899/12-190.1
Sharpley, A., Jarvie, H. P., Buda, A., May, L., Spears, B., and Kleinman, P. (2013). Phosphorus legacy: overcoming the effects of past management practices to mitigate future water quality impairment. J. Environ. Qual. 42, 1308–1326. doi: 10.2134/jeq2013.03.0098
Silsbe, G. M., Hecky, R. E., and Smith, R. E. H. (2012). Improved estimation of carbon fixation rates from active flourometry using spectral fluorescence in light-limited environments. Limnol. Oceanogr. Methods 10, 736–751. doi: 10.4319/lom.2012.10.736
Silsbe, G. M., and Malkin, S. Y. (2015). Phytotools: Phytoplankton Production Tools. Available online at: https://cran.r-project.org/package=phytotools (accessed February 14, 2015).
Solomon, C. T., Bruesewitz, D. A., Richardson, D. C., Rose, K. C., Van de Bogert, M. C., Hanson, P. C., et al. (2013). Ecosystem respiration: drivers of daily variability and background respiration in lakes around the globe. Limnol. Oceanogr. 58, 849–866. doi: 10.4319/lo.2013.58.3.0849
Staehr, P., Sand-Jensen, K., Raun, A., Nielsson, B., and Kidmose, J. (2010). Drivers of metabolism and net heterotrophy in contrasting lakes. Limnol. Oceangr. 55, 817–830. doi: 10.4319/lo.2010.55.2.0817
Staehr, P. A., and Sand-Jensen, K. (2007). Temporal dynamics and regulation of lake metabolism. Limnol. Oceanogr. 52, 108–120. doi: 10.4319/lo.2007.52.1.0108
Sterner, R. W. (2008). On the phosphorus limitation paradigm for lakes. Int. Rev. Hydrobiol. 93, 433–445. doi: 10.1002/iroh.200811068
Strayer, D. L., Beighley, R. E., Thompson, L. C., Brooks, S., Nilsson, C., Pinay, G., et al. (2003). Effects of land cover on stream ecosystems: roles of empirical models and scaling issues. Ecosystems 6, 407–423. doi: 10.1007/s10021-002-0170-0
Suggett, D. J., Moore, C. M., Hickman, A. E., and Geider, R. J. (2009). Interpretation of fast repetition rate (FRR) fluorescence: signatures of phytoplankton community structure versus physiological state. Mar. Ecol. Progr. Ser. 9, 1–19. doi: 10.3354/meps07830
Tassan, S., and Ferrari, G. M. (1995). An alternative approach to absorption measurements of retained on filters aquatic particles. Limnol. Oceanogr. 40, 1358–1368. doi: 10.4319/lo.1995.40.8.1358
Thom, R. H., and Wilson, J. H. (1980). The natural divisions of Missouri. Trans. Mo. Acad. Sci. 4, 9–23.
Thornton, K. W. (1990). “Perspectives on reservoir limnology,” in Reservoir Limnology: Ecological Perspectives, eds K. W. Thornton, B. L. Kimmel, and F. E. Payne (New York, NY: John Wiley & Sons, Inc), 1–14.
Titman, D. (1976). Ecological competition between algae: experimental confirmation of resource-based competition theory. Science 192, 463–465. doi: 10.1126/science.192.4238.463
Torremorell, A., Llames, M., Perez, G., Escaray, R., Bustingorry, J., and Zagarese, H. (2009). Annual patterns of phytoplankton density and primary production in a large, shallow lake: the central role of light. Freshw. Biol. 54, 437–449. doi: 10.1111/j.1365-2427.2008.02119.x
Tyrrell, T. (1999). The relative influences of nitrogen and phosphorus on oceanic primary production. Nature 400, 525–531. doi: 10.1038/22941
Verburg, P., and Hecky, R. E. (2009). The physics of the warming of Lake Tanganyika by climate change. Limnol. Oceanogr. 54, 2418–2430. doi: 10.4319/lo.2009.54.6_part_2.2418
Vollenweider, R. A. (1976). Advances in defining critical loading levels for phosphorus in lake eutrophication. Mem. Ist. Ital. Idrobiol. 33, 53–83.
Von Liebig, J. (1840). Die Organische Chemie in ihrer Anwendung auf Agrikultur und Physiologie. Braunschweig: Friedrich Vieweg.
Webb, W. L., Newton, M., and Starr, D. (1974). Carbon dioxide exchange of Alnus rubra. Oecologia 17, 281–291. doi: 10.1007/bf00345747
Williamson, C. E., Saros, J. E., and Schindler, D. W. (2009a). Climate change: sentinels of change. Science 323, 887–888. doi: 10.1126/science.1169443
Williamson, C. E., Saros, J. E., Vincent, W. F., and Smol, J. P. (2009b). Lakes and reservoirs as sentinels, integrators, and regulators of climate change. Limnol. Oceanogr. 54, 2273–2282. doi: 10.4319/lo.2009.54.6_part_2.2273
Winslow, L., Read, J., Woolway, R., Brentrup, J., Leach, T., Zwart, J., et al. (2019). rLakeAnalyzer: Lake Physics Tools. Available online: https://zenodo.org/record/1003169#.Ws82F9NubEY (accessed October 6, 2017).
Woolway, R. I., and Merchant, C. J. (2017). Amplified surface temperature response of cold, deep lakes to inter-annual air temperature variability. Sci. Rep. 7, 1–8. doi: 10.1038/s41598-017-04058-0
Woolway, R. I., and Merchant, C. J. (2019). Worldwide alteration of lake mixing regimes in response to climate change. Nat. Geosci. 12, 271–276. doi: 10.1038/s41561-019-0322-x
Yang, L., Jin, S., Danielson, P., Homer, C., Gass, L., Bender, S. M., et al. (2018). A new generation of the United States National Land Cover Database: requirements, research priorities, design, and implementation strategies. ISPRS J. Photogramm. Remote Sens. 146, 108–123. doi: 10.1016/j.isprsjprs.2018.09.006
Keywords: nitrogen, phosphorus, trophic status, eutrophication, phytoplankton, climate change, nutrients, light
Citation: Petty EL, Obrecht DV and North RL (2020) Filling in the Flyover Zone: High Phosphorus in Midwestern (USA) Reservoirs Results in High Phytoplankton Biomass but Not High Primary Productivity. Front. Environ. Sci. 8:111. doi: 10.3389/fenvs.2020.00111
Received: 06 March 2020; Accepted: 26 June 2020;
Published: 30 July 2020.
Edited by:
Sergi Sabater, University of Girona, SpainReviewed by:
Guillaume Grosbois, Swedish University of Agricultural Sciences, SwedenDavi Gasparini Fernandes Cunha, Universidade de São Paulo São Carlos, Brazil
Copyright © 2020 Petty, Obrecht and North. This is an open-access article distributed under the terms of the Creative Commons Attribution License (CC BY). The use, distribution or reproduction in other forums is permitted, provided the original author(s) and the copyright owner(s) are credited and that the original publication in this journal is cited, in accordance with accepted academic practice. No use, distribution or reproduction is permitted which does not comply with these terms.
*Correspondence: Rebecca L. North, northr@missouri.edu