Article

Arbuscular Mycorrhizal Symbiosis Enhances Photosynthesis in the Medicinal Herb Salvia fruticosa by Improving Photosystem II Photochemistry

by
Michael Moustakas
1,2,*,
Gülriz Bayçu
1,
Ilektra Sperdouli
3,
Hilal Eroğlu
1,4 and
Eleftherios P. Eleftheriou
2,*
1
Department of Biology, Faculty of Science, Istanbul University, 34134 Istanbul, Turkey
2
Department of Botany, Aristotle University of Thessaloniki, GR-54124 Thessaloniki, Greece
3
Institute of Plant Breeding and Genetic Resources, Hellenic Agricultural Organization-Demeter, Thermi, 57001 Thessaloniki, Greece
4
Biology Division, Institute of Graduate Studies in Science, Istanbul University, 34134 Istanbul, Turkey
*
Authors to whom correspondence should be addressed.
Plants 2020, 9(8), 962; https://doi.org/10.3390/plants9080962
Submission received: 28 May 2020 / Revised: 12 July 2020 / Accepted: 28 July 2020 / Published: 30 July 2020
(This article belongs to the Special Issue 2019 Feature Papers by Plants’ Editorial Board Members)

Abstract

:
We investigated the influence of Salvia fruticosa colonization by the arbuscular mycorrhizal fungi (AMF) Rhizophagus irregularis on photosynthetic function by using chlorophyll fluorescence imaging analysis to evaluate the light energy use in photosystem II (PSII) of inoculated and non-inoculated plants. We observed that inoculated plants used significantly higher absorbed energy in photochemistry (ΦPSII) than non-inoculated and exhibited significant lower excess excitation energy (EXC). However, the increased ΦPSII in inoculated plants did not result in a reduced non-regulated energy loss in PSII (ΦNO), suggesting the same singlet oxygen (1O2) formation between inoculated and non-inoculated plants. The increased ΦPSII in inoculated plants was due to an increased efficiency of open PSII centers to utilize the absorbed light (Fv’/Fm’) due to a decreased non-photochemical quenching (NPQ) since there was no difference in the fraction of open reaction centers (qp). The decreased NPQ in inoculated plants resulted in an increased electron-transport rate (ETR) compared to non-inoculated. Yet, inoculated plants exhibited a higher efficiency of the water-splitting complex on the donor side of PSII as revealed by the increased Fv/Fo ratio. A spatial heterogeneity between the leaf tip and the leaf base for the parameters ΦPSII and ΦNPQ was observed in both inoculated and non-inoculated plants, reflecting different developmental zones. Overall, our findings suggest that the increased ETR of inoculated S. fruticosa contributes to increased photosynthetic performance, providing growth advantages to inoculated plants by increasing their aboveground biomass, mainly by increasing leaf biomass.

1. Introduction

Arbuscular mycorrhizal fungi (AMF) are ubiquitous soil microorganisms that establish mutualistic symbioses with the majority of land plants [1], including most agricultural crops [2]. AMF are considered an important tool in the modern environmentally friendly agriculture in the 21st century for the improvement of crop yield and quality and for the decrease of mineral fertilizers and pesticides/herbicides [3]. The main benefits of AMF to plants include improved acquisition and accumulation of nutrients (such as P and N); and to repay, host plants provide organic carbon to AMF [4]. Photosynthesis-derived CO2 assimilation is the main method of production of organic carbon [5] and chlorophyll fluorescence analysis is usually used to characterize photosynthetic performance [6].
Naturally appearing soil microbes may be used as inoculants to maintain crop yields despite reduced resource (water and nutrient) inputs [7]. Several studies revealed that AMF could increase plant biomass and help host plants to improve their nutrient uptake and their tolerance/resistance to biotic and abiotic stresses [5,6,7,8,9,10,11]. Under drought stress AMF inoculation increased the content of compatible solutes, assisting in maintaining the relative water content, and upregulated the antioxidant system of maize plants, facilitating alleviation of oxidative effects through elimination of reactive oxygen species (ROS) [12]. Yet, under drought stress AMF promoted growth, nutrient content, and physiological and biochemical parameters in Ceratonia siliqua plants mediating drought tolerance [13].
AMF symbiosis is considered to be the most widespread plant–fungus interaction as it concerns about 90% of terrestrial plant species [1]. Plant inoculation with AMF improves root development and photosynthetic rates, increases nutrient and water uptake, and promotes defense against pathogens [14,15]. The most frequently used species and most studied among members of the Glomeromycota, where AMF belong [16,17], is Rhizophagus irregularis (Błaszk., Wubet, Renker & Buscot), C. Walker and A. Schüßler (syn. Glomus irregulare Błaszk., Wubet, Renker & Buscot, previously known as Glomus intraradices) [18,19]. R. irregularis is an endomychorrhizal fungus being one of the most popular since it stimulates the growth and development of different plant species, colonizing nearly all the important commercial crops [13,20,21,22]. Recently, an increasing research interest has been noticed in the utilization of AMF for improving plant growth of aromatic and medicinal plants [23,24]. Since medicinal plants are used in diverse productions including herbal, agricultural, pharmaceutical and food, as well as cosmetic industries, AMF colonization research on medicinal plants is of particular value [25]. Greek sage (Salvia fruticose) is a perennial herb or sub-shrub, native to the eastern Mediterranean, possessing pharmacological activities with great market demand, being used for its beauty, medicinal and gastronomic value, along with its sweet nectar and pollen.
Since plant production is driven by photosynthesis, evaluating photosynthetic function is a reasonable way to estimate the fate of plant growth and development [26,27], while variations in the efficiency or capacity of photosynthesis can lead to variation in growth rate, productivity and crop yield [28]. Photosynthesis is a highly regulated process in which the absorbed solar energy as photons by the light-harvesting complexes (LHCs) is transferred to the reaction centers (RCs) where through charge separation the electrons flow from photosystem II (PSII) to photosystem I (PSI) [26,27,29] (for details see Figure 1). The two photosystems work coordinately, and the result is the formation of ATP and reducing power (reduced ferredoxin and NADPH) that need to be coordinated with the activity of metabolic processes for carbohydrate synthesis [26,29]. The disturbance of photosynthesis at the molecular level is associated with low electron transport through PSII (ETR) and/or with structural injury to PSII and the LHCs [30]. By using chlorophyll fluorescence imaging analysis, it is possible to measure the fraction of open or closed PSII reaction centers (qp) and estimate the excess excitation energy (EXC) or, in other words, estimate the effective quantum yield of PSII photochemistry (ΦPSII) and thus photosynthetic efficiency [30]. Chlorophyll fluorescence analysis that estimates the photosynthetic performance has been frequently used as a highly sensitive indicator of photosynthetic efficiency and an extremely sensitive biomarker to monitor plant health status [31,32,33,34,35,36,37,38]. But since photosynthetic function is not uniform at the whole leaf level, especially under environmental stress conditions [39,40], point chlorophyll fluorescence measurements are not typical of the physiological status of the entire leaf [41,42]. This disadvantage is solved by chlorophyll fluorescence imaging analysis that can reveal the photosynthetic heterogeneity of the entire leaf zone [43,44,45,46,47].
Most researchers who have explored the mechanisms underlying the growth advantage of AMF plants have done it under stress conditions and not under normal growth ones [5,6]. Photosynthetic performance of plant symbiotic relationships with mycorrhizal fungi has been evaluated almost exclusively under stress conditions since soil microbes are used as inoculants to maintain crop yields under decreased water and nutrient inputs [7,13,21,22]. However, the mechanisms that contribute to enhanced photosynthetic performance and plant growth of plant symbiotic relationships with AMF can be better evaluated under non-stress conditions.
In our experiments we wanted to test whether colonization of the medicinal herb Salvia fruticosa by R. irregularis could result in positive effects on photosynthetic performance and growth of sage plants. We hypothesize that if AMF colonization is successful then plant growth traits will be improved through increased photosynthetic performance. Thus, we applied the method of chlorophyll fluorescence imaging analysis to assess the allocation of absorbed light energy in order to reveal any differentiation mechanism in light energy use that contributes to increased photosynthetic performance of inoculated plants.

2. Results

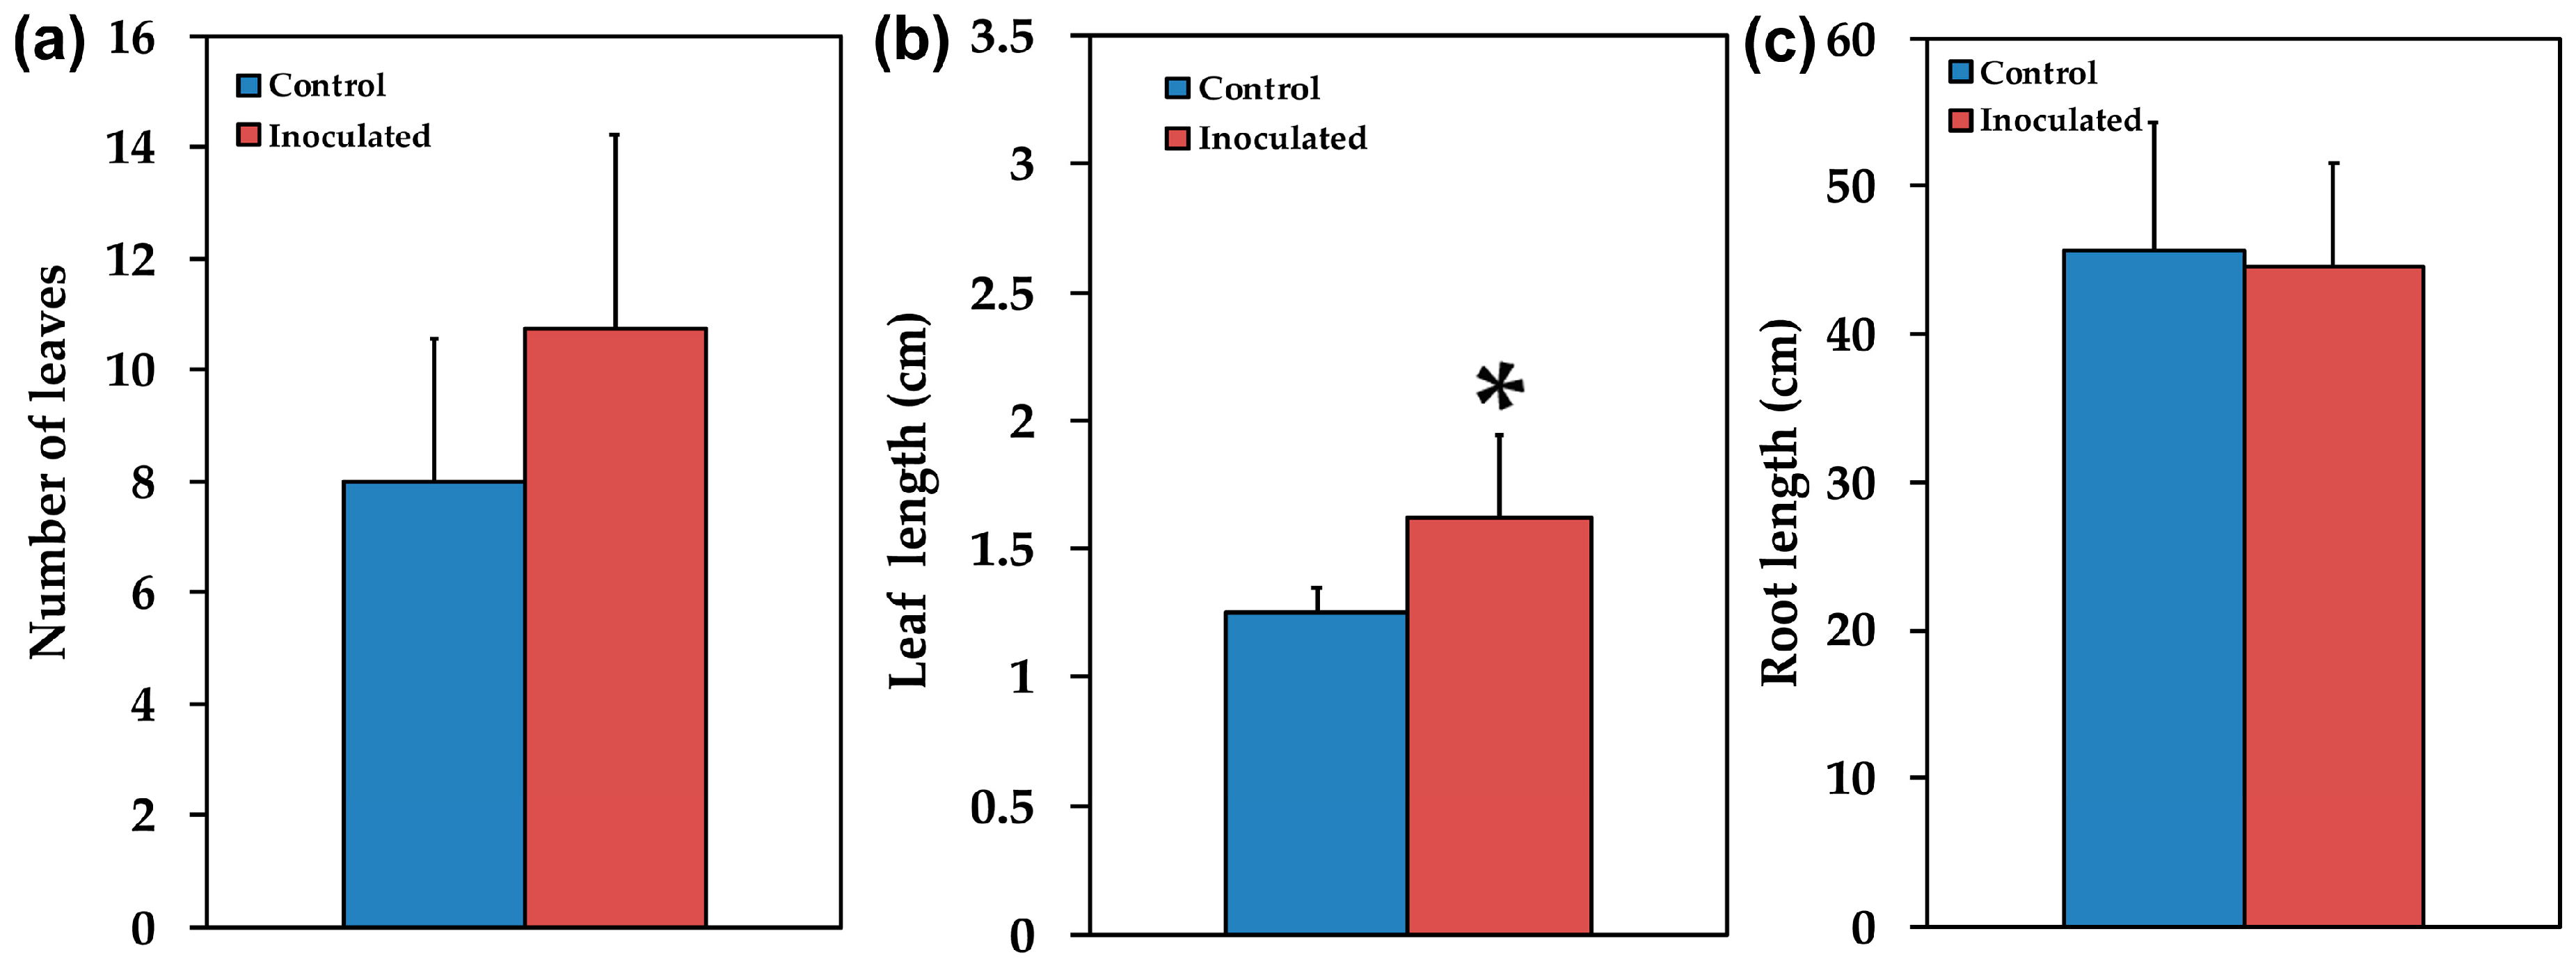
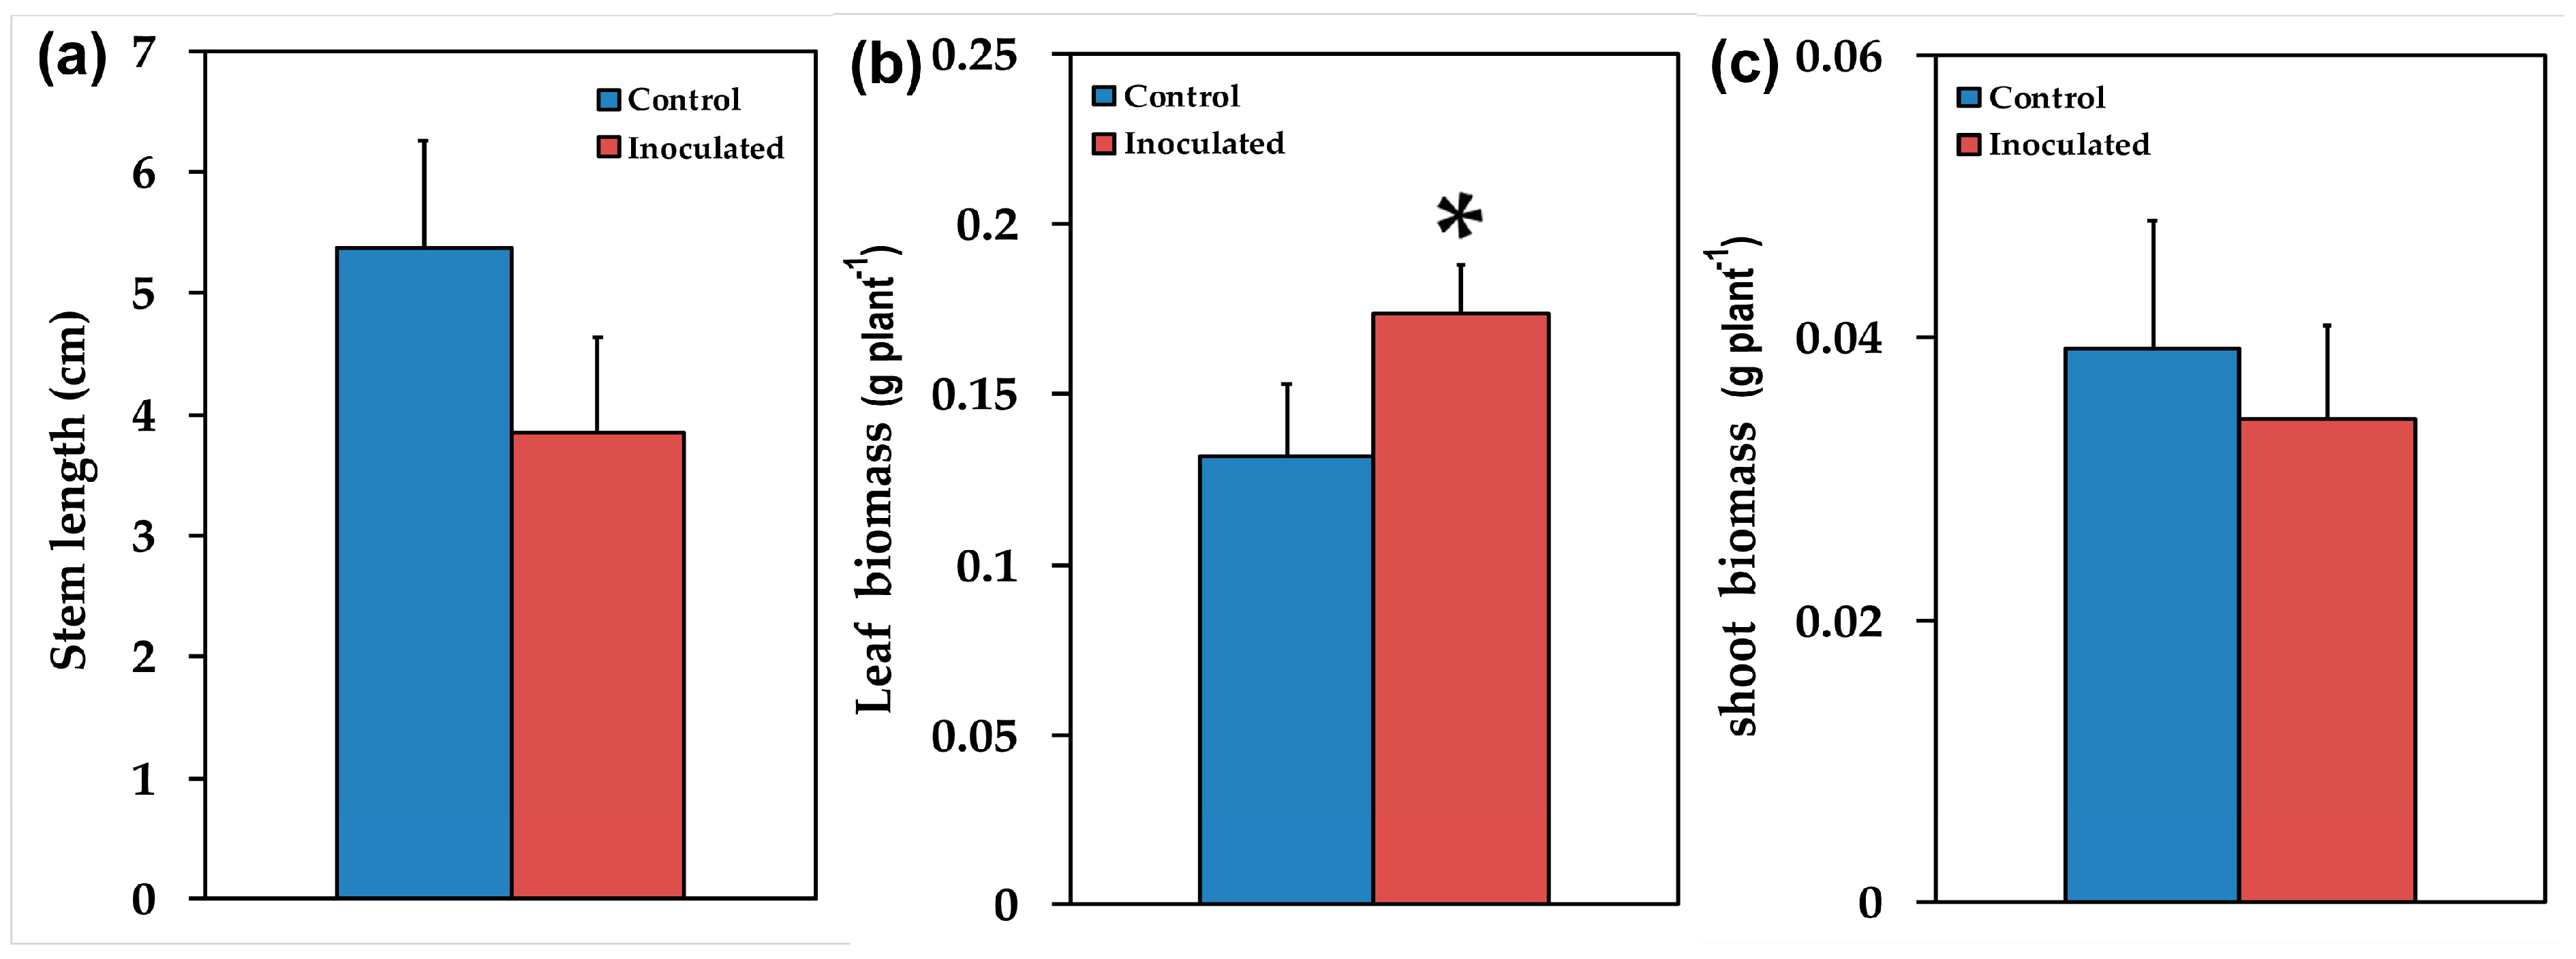
2.1. Mycorrhizal Colonization and Plant Growth Performance

Mycorrhizal colonization was estimated by using the gridline intersection method in stained roots from 12 inoculated S. fruticosa plants that were cut into about 1 cm long pieces. The percentage of root length colonized was quantified in 15 root segments collected at random per plant. About 69.5 ± 2.2% of the root length of S. fruticosa inoculated with R. irregularis was colonized, with the formation of vesicles, arbuscules and hyphae. AMF inoculation positively (p < 0.05) influenced plant growth traits such as leaf length (Figure 2b), leaf biomass (Figure 3b), and aboveground, biomass (Figure 4a), while the ratio of belowground to aboveground biomass was negatively influenced (Figure 4c) since it decreased (p < 0.05) compared to non-inoculated plants. There were no significant changes in the number of leaves (Figure 2a), root length (Figure 2c), stem length (Figure 3a), shoot biomass (Figure 3c), and root biomass (Figure 4b).

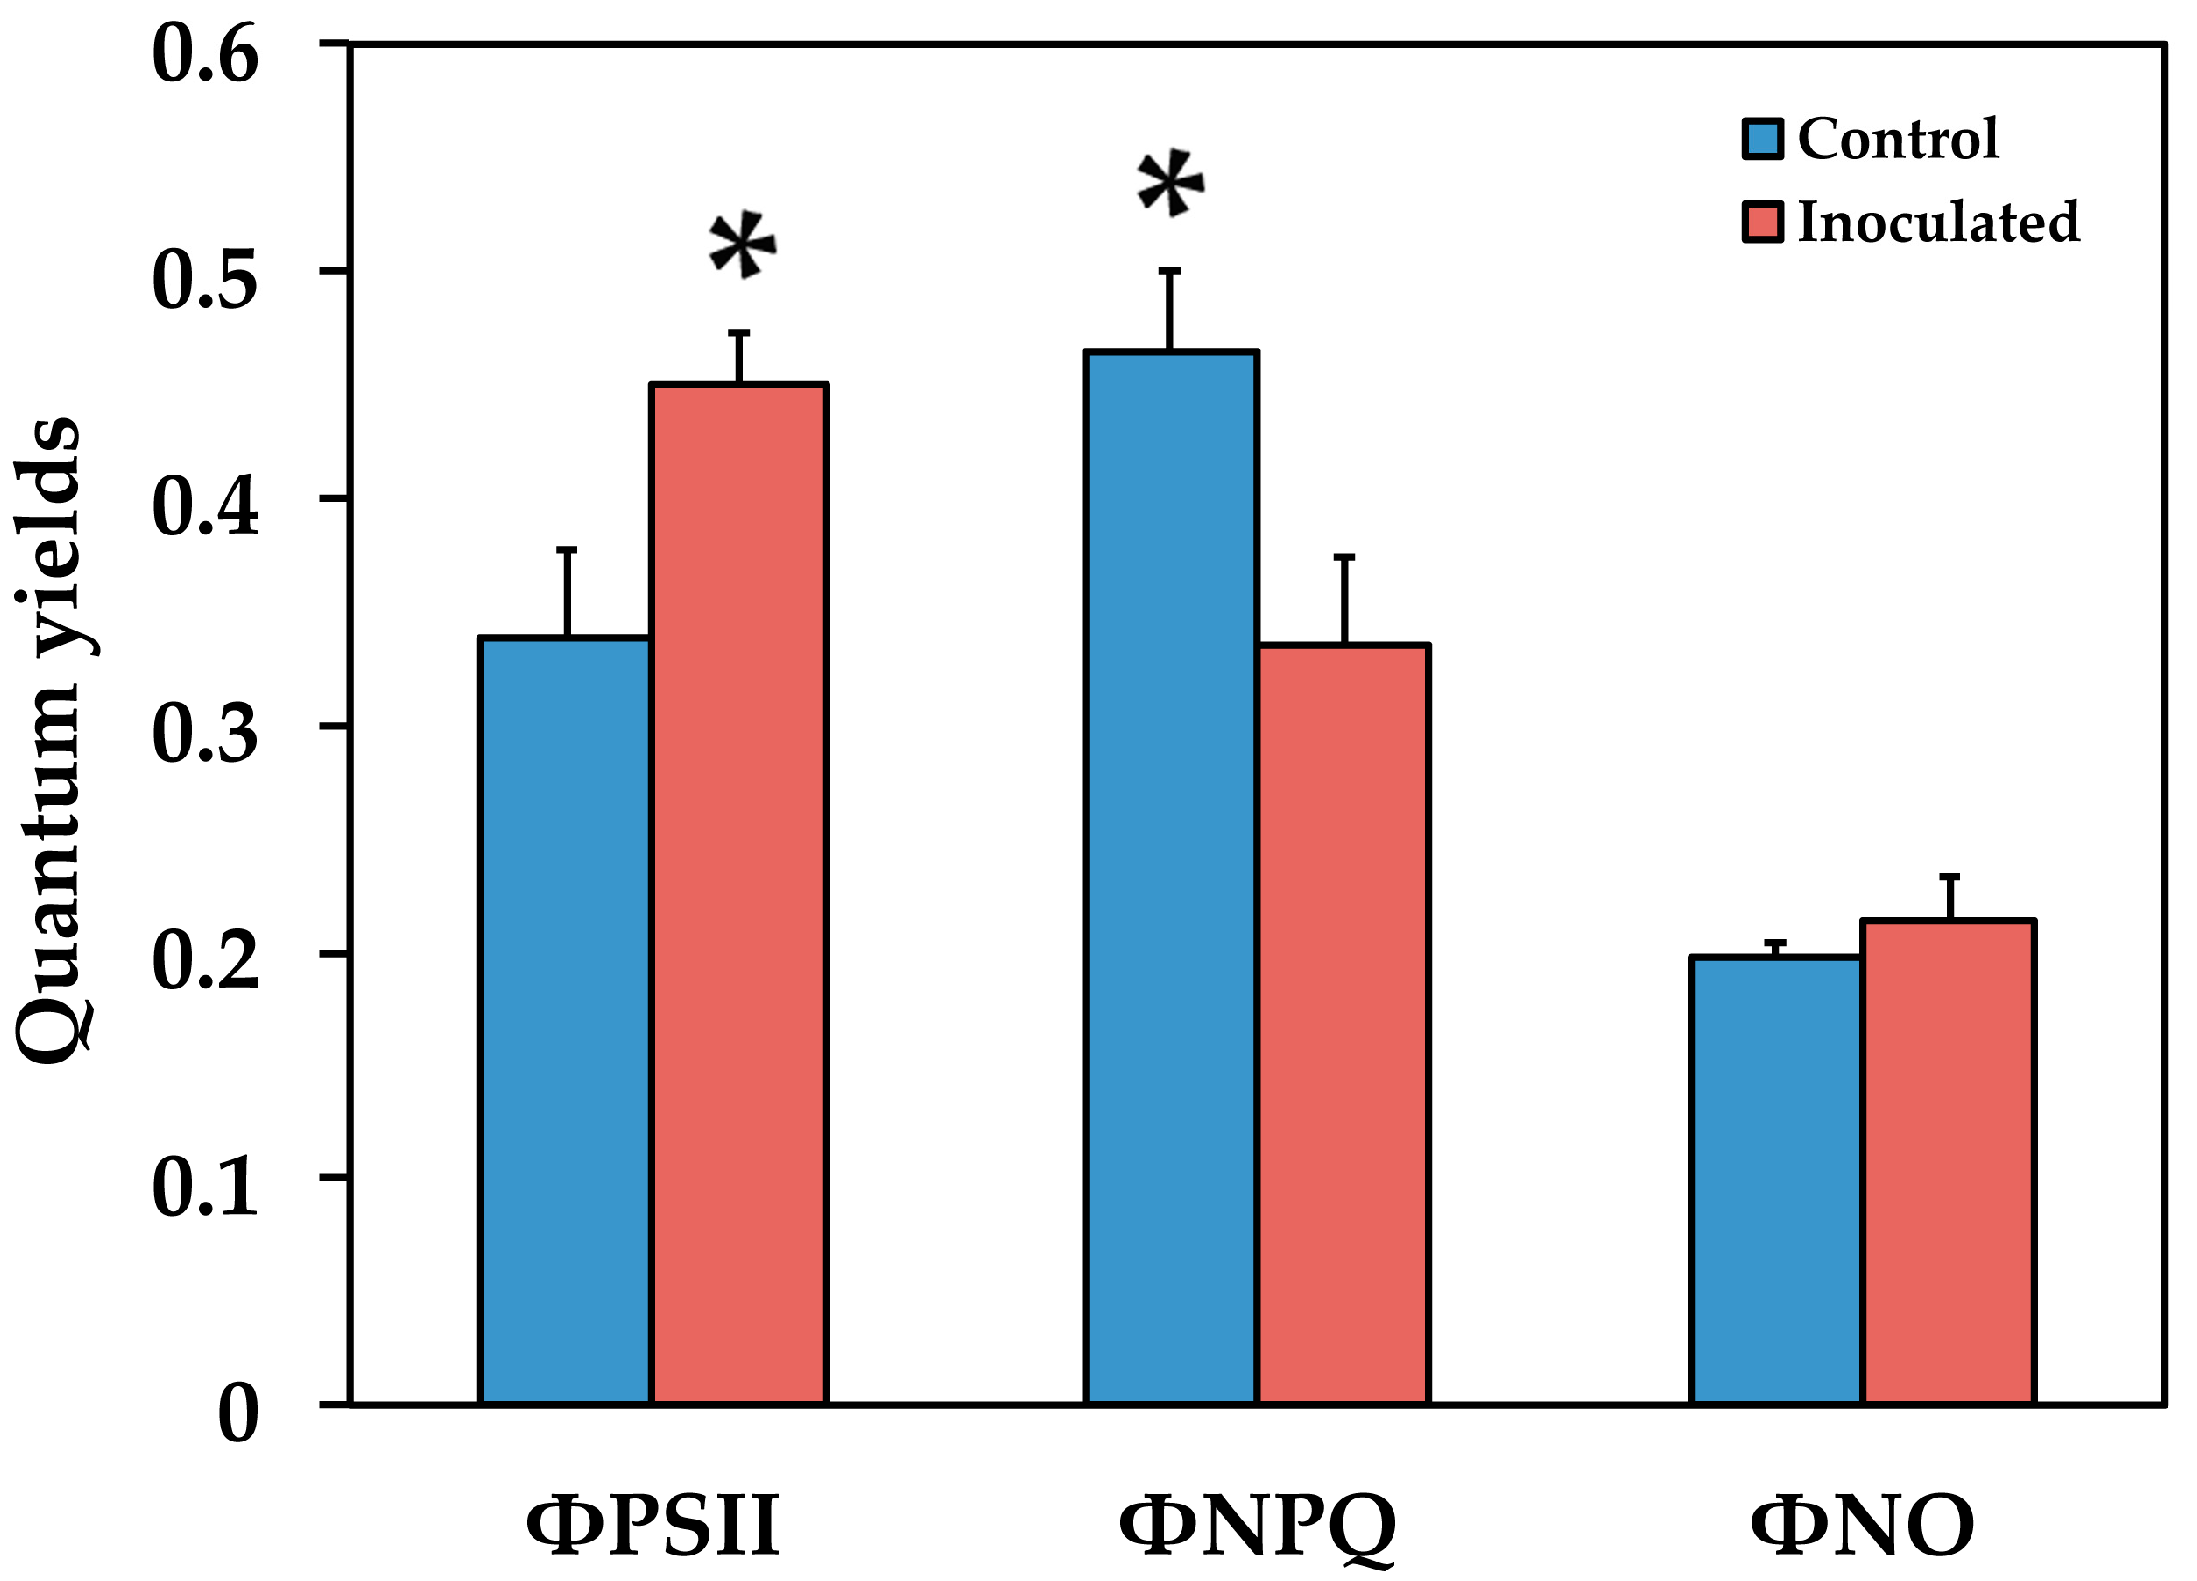
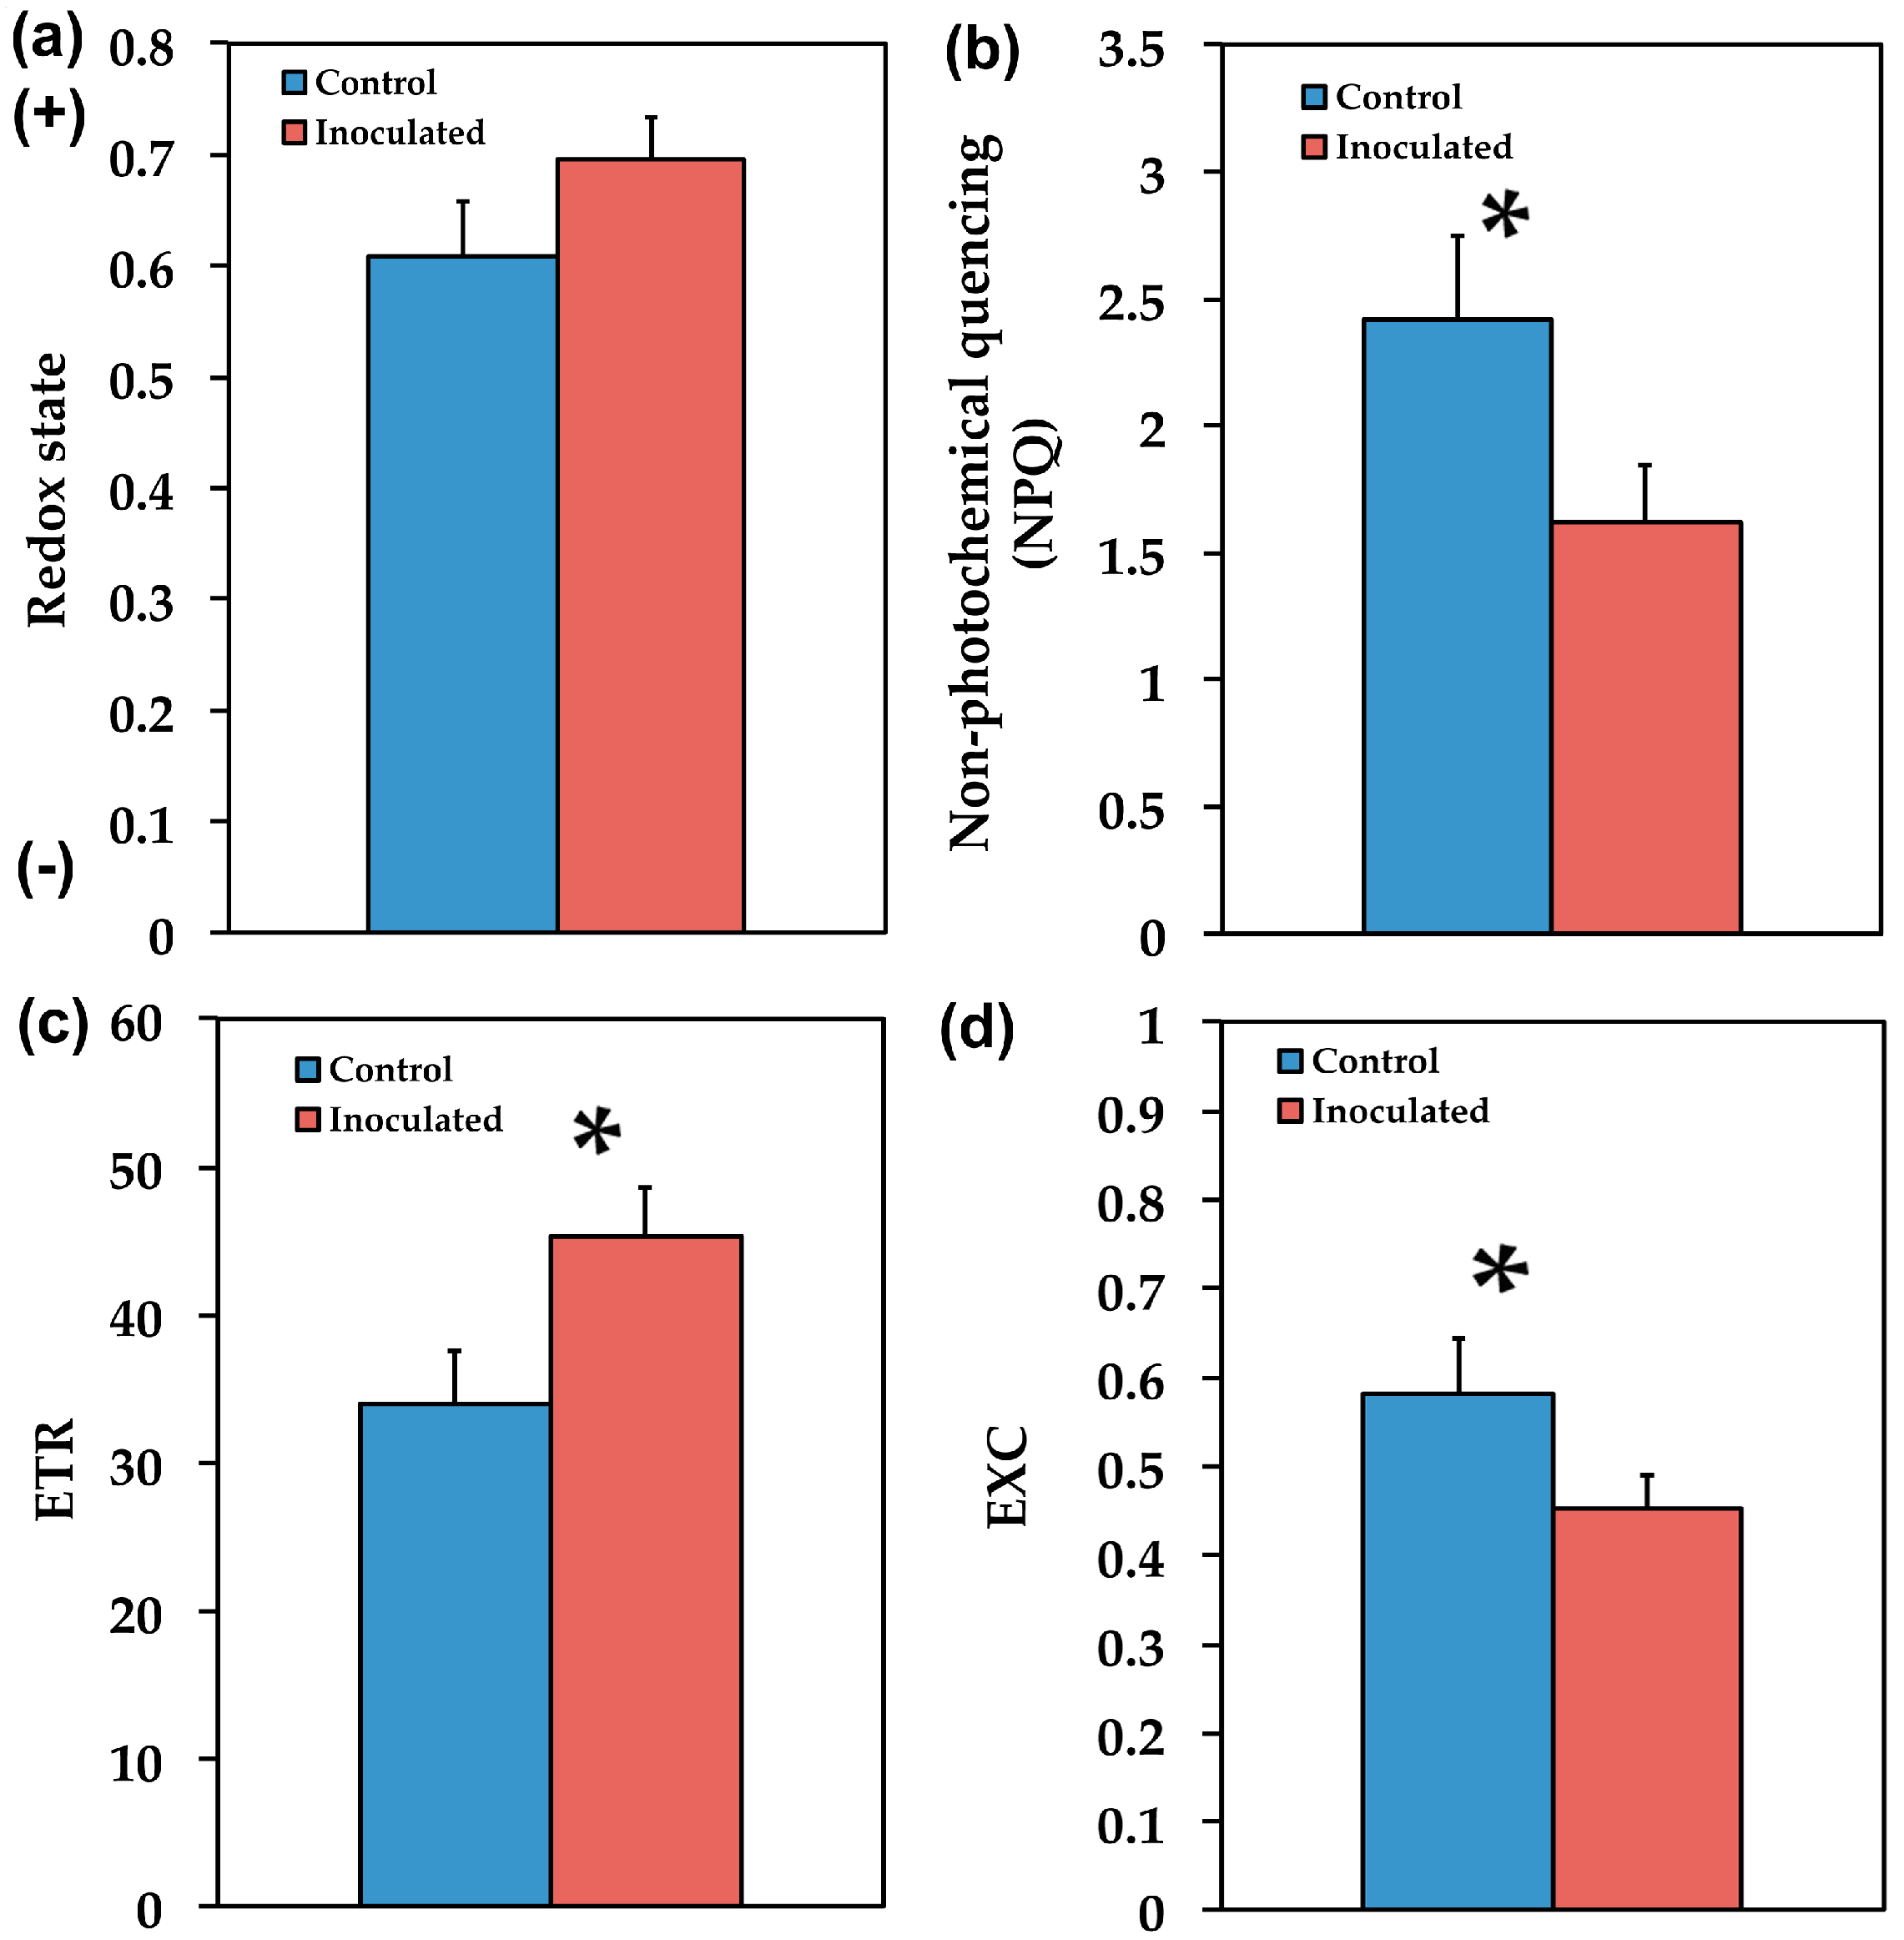
2.2. The Allocation of Absorbed Light Energy in Inoculated and Non-inoculated Salvia

We estimated the fraction of the absorbed light energy that is used for photochemistry (ΦPSII), is lost by regulated heat dissipation (ΦNPQ) and non-regulated energy loss (ΦNO) [48]. These three quantum yields ΦPSII, ΦNPQ and ΦNO, add up to unity [48]. ΦPSII in the inoculated S. fruticosa increased by 33% (p < 0.05) compared to non-inoculated, but the increased ΦNPQ (38%, p < 0.05) in the non-inoculated Salvia resulted in non-significant changes in ΦNO between them (Figure 5).

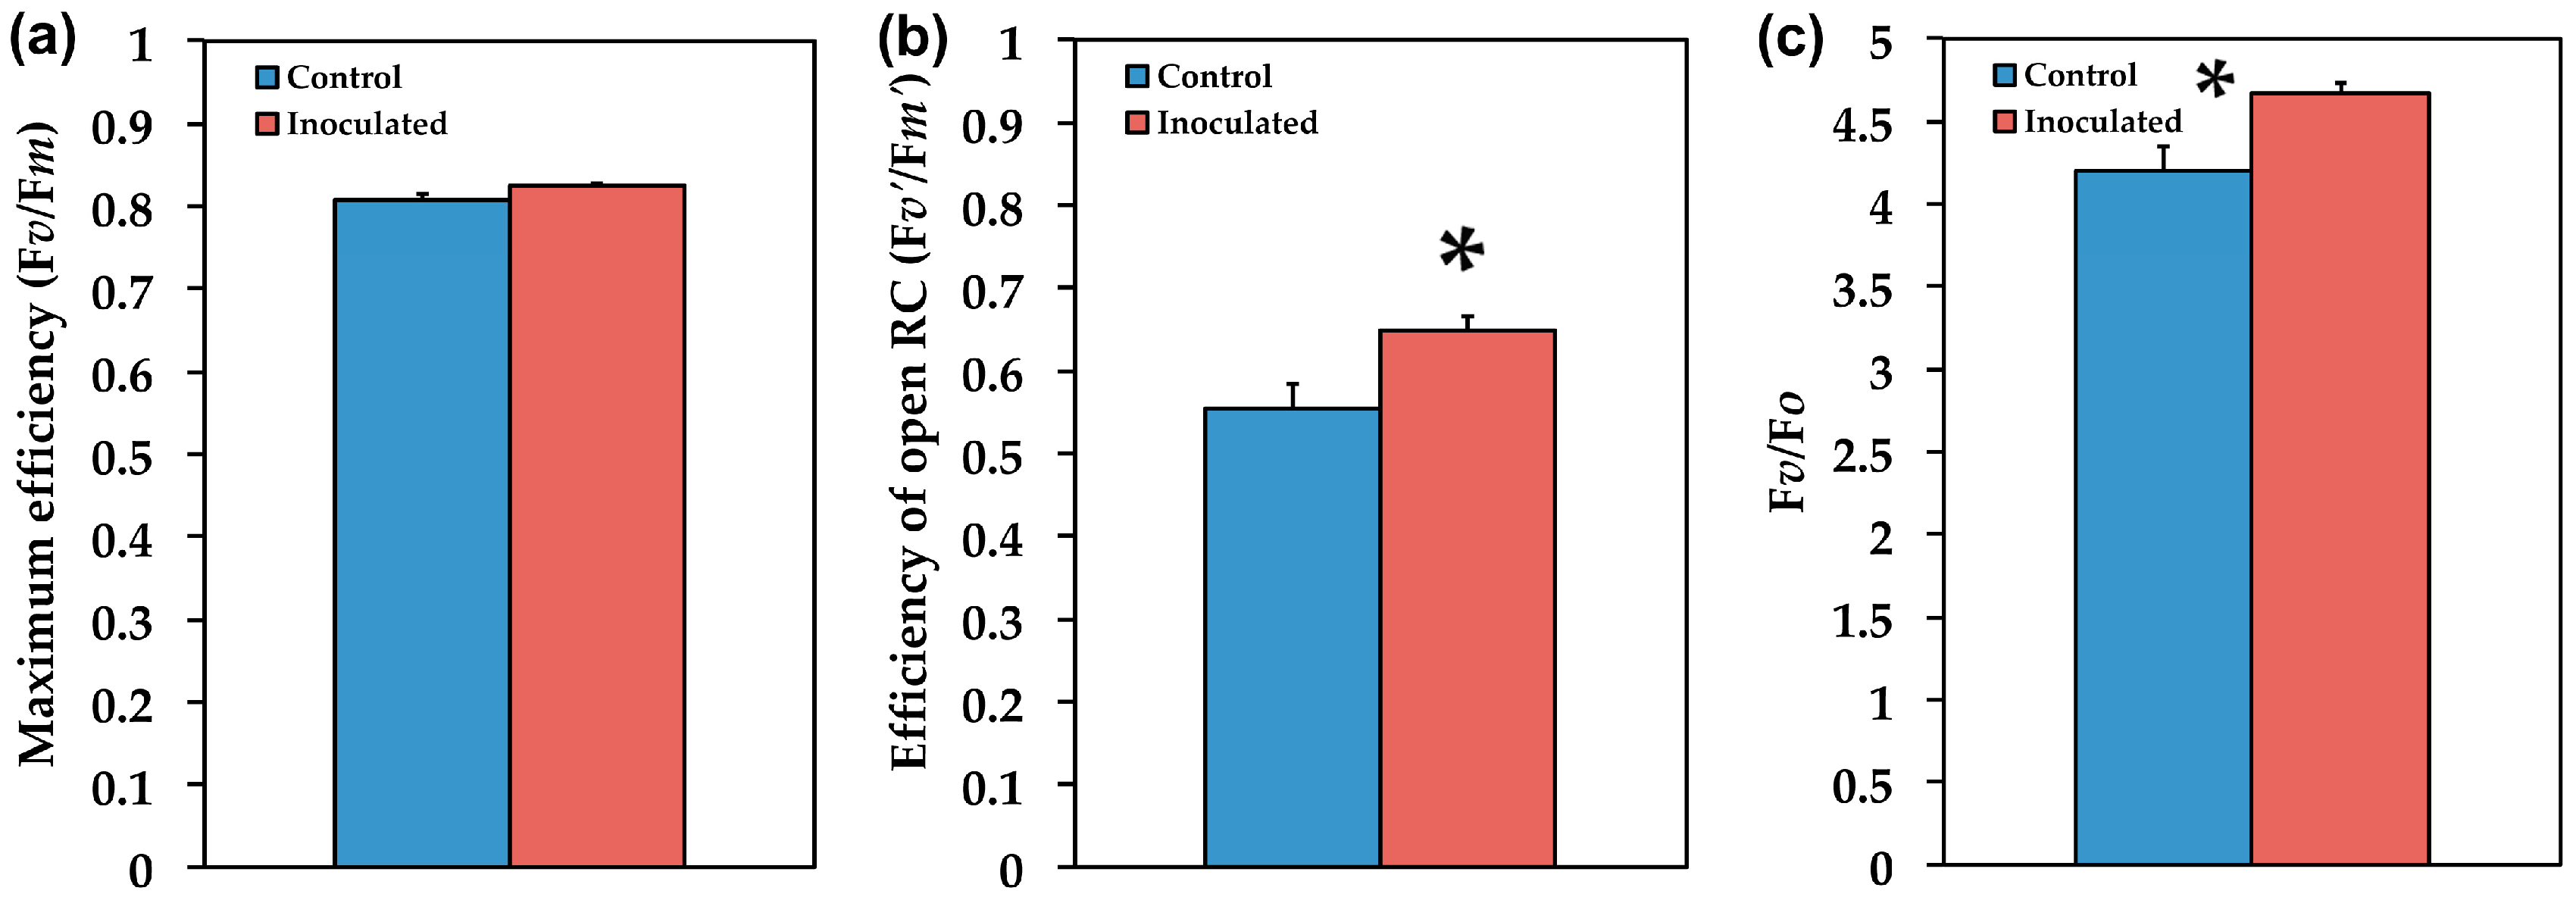
2.3. The Efficiency of PSII in Inoculated and Non-Inoculated Salvia

The maximum efficiency of PSII photochemistry (Fv/Fm) did not differ between inoculated and non-inoculated S. fruticosa (Figure 6a), but the efficiency of open PSII reaction centers (Fv’/Fm’) was 19% (p < 0.05) higher in the inoculated ones (Figure 6b), and it was also higher (11%, p < 0.05) in the efficiency of the water-splitting complex on the donor side of PSII (Fv/Fo) (Figure 6c).
The fraction of open PSII reaction centers, which is the redox state of the plastoquinone pool (qp), did not differ between inoculated and non-inoculated S. fruticosa (Figure 7a). The non-photochemical quenching (NPQ) that reflects heat dissipation of excitation energy was higher (49%, p < 0.05) in control (non-inoculated) S. fruticosa (Figure 7b). This higher NPQ resulted in significant (p < 0.05) lower (33%) electron transport rate (ETR) in the non-inoculated plants (Figure 7c). Overall inoculated S. fruticosa presented lower (23%, p < 0.05) excess excitation energy (EXC) than non-inoculated (Figure 7d).

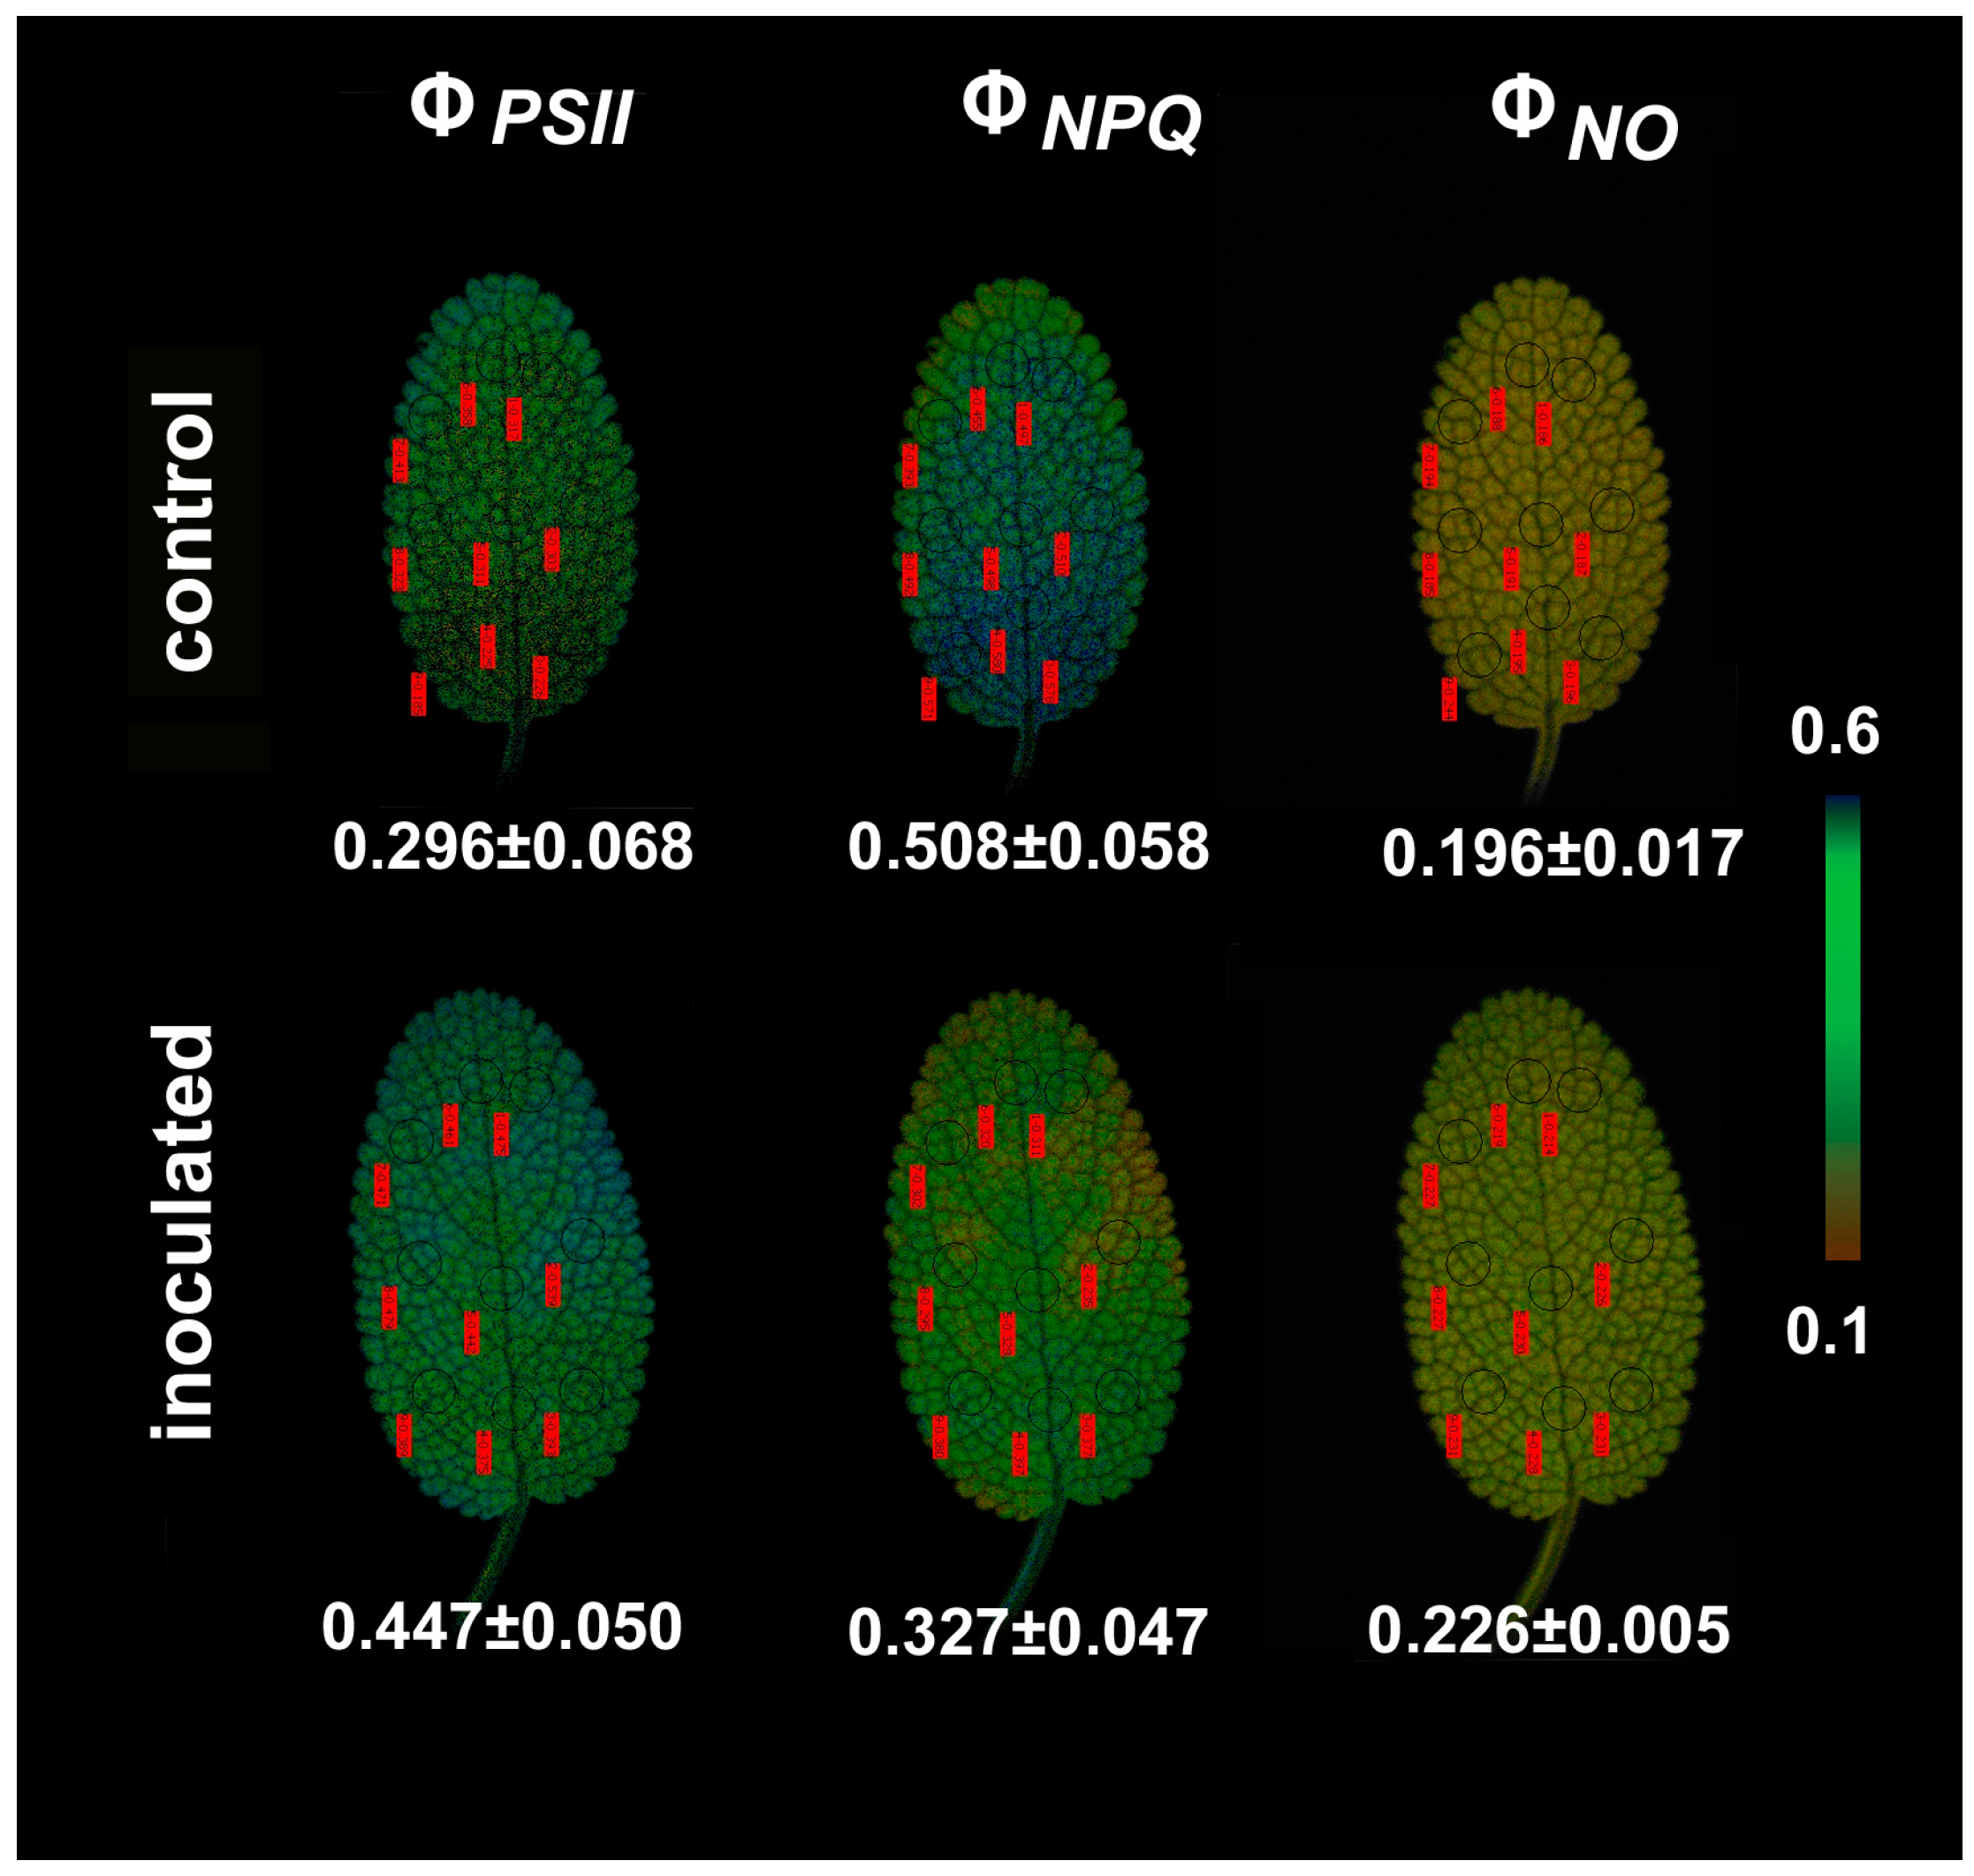
2.4. Chlorophyll a Fluorescence Images

Representative chlorophyll a fluorescence images obtained by the chlorophyll fluorescence imaging analysis method that can reveal any spatial heterogeneity over the leaf are shown in Figure 8 and Figure 9. No significant heterogeneity was detected in the leaf area for the parameters of the minimum chlorophyll a fluorescence (Fo), the maximum chlorophyll a fluorescence (Fm), and the maximum efficiency of PSII photochemistry (Fv/Fm) in both inoculated and non-inoculated sage plants (Figure 8). Still, we were able to distinguish a small spatial heterogeneity between the leaf tip and the leaf base of sage for the parameters ΦPSII and ΦNPQ (Figure 9).
The average Fo value of the whole leaf was lower (10%, p < 0.05) in inoculated S. fruticosa (Figure 8), while average Fm value did not differ significantly between inoculated and non-inoculated S. fruticosa, as well as the average Fv/Fm ratio values (Figure 8). ΦPSII values were higher in the leaf tip of both inoculated and non-inoculated sage, while ΦNPQ values show the reverse pattern (Figure 9). No spatial heterogeneity over the leaf was observed for ΦNO images (Figure 9).

3. Discussion

AMF inoculation significantly influenced plant growth traits such as aboveground biomass (Figure 4a) mainly by increasing leaf biomass (Figure 3b). However, the ratio of belowground to aboveground biomass decreased (Figure 4c), probably due to the fact that AMF symbiosis improves mineral nutrition and water uptake [6,7,10], thus there is no need for increased root biomass. The increased photosynthetic surface of the host plant provided AMF with organic carbon while the fungi provided improved acquisition and accumulation of nutrients [4] without the need for increased root biomass of the host plant. Similar results were observed with plant growth promoting rhizobacteria [49]. However, AMF inoculation has previously been shown to promote root growth and branching in different plants [50].
In our experiments we used chlorophyll fluorescence imaging analysis in order to reveal the photosynthetic heterogeneity of the entire leaf zone in both inoculated and non-inoculated plants. The observed spatial heterogeneity between the leaf tip and the leaf base of sage for the parameters ΦPSII and ΦNPQ (Figure 9) may represent the different developmental zones between the leaf tip and the leaf base [42] and a non-uniform gene expression pattern at the base toward the tip [51]. Heterogeneity in photosynthetic performance depending on the leaf age has been repeatedly described in plant species [52,53,54,55,56,57].
Our data show that the proportion of absorbed energy being used in photochemistry (ΦPSII) in control (non-inoculated) S. fruticosa was lower by 33% compared to inoculated plants (Figure 5). However, this decrease in ΦPSII was compensated by increases in the photoprotective energy dissipation (ΦNPQ) that resulted in no difference in ΦNO between inoculated and non-inoculated plants (Figure 5). ΦNO comprises of chlorophyll fluorescence internal conversions and intersystem crossing that results to singlet oxygen (1O2) creation via the triplet state of chlorophyll (3chl*) [58,59,60,61] (see Figure 1). 1O2 is considered a highly damaging ROS produced by PSII [62,63,64,65,66] and high levels of 1O2 activate programmed cell death [67]. However, there was no difference in 1O2 formation between inoculated and non-inoculated sage plants.
According to the model of PSII function proposed by Genty et al. [68], the increased ΦPSII in inoculated S. fruticosa (Figure 5) can be attributed either to the fraction of open PSII reaction centers (qp) or to the efficiency of these centers (Fv’/Fm’). The former (qp) is a measure of the redox state of the plastoquinone pool and the latter (Fv’/Fm’) is a measure of the supply of energy reaching the PSII reaction centers. In our experiment, considering both the qp and Fv’/Fm’ parameters, it can be proposed that the increased ΦPSII in inoculated plants was due to a higher efficiency of open PSII centers to utilize the absorbed light (Figure 6b) since the fraction of open reaction centers did not differ between inoculated and non-inoculated sage plants (Figure 7a). Νon-photochemical quenching (NPQ) mechanisms can reduce energy transfer to reaction centers, thus reducing ΦPSII without any appreciable effect on qp (so the redox state can be kept relatively steady while a reduced efficiency of PSII centers occur) [69]. The NPQ parameter is an estimate of the dissipated surplus light energy from PSII, primarily representing thermal energy dissipation from LHCII via the zeaxanthin quencher [58,70]. The excess light energy that is dissipated as heat by de-excitation (NPQ) decreases the efficiency of photochemical reactions of photosynthesis (down-regulation of PSII) [56,71,72,73]. Thus, the decreased ΦPSII in sage plants with non-mycorrhizal inoculum was due to an increased NPQ that reduced the efficiency of PSII centers (Fv’/Fm’). An increased NPQ decreases electron-transport rate (ETR), preventing ROS formation [67] (see Figure 1). ROS can contribute directly to PSII damage or inhibit the repair of PSII reaction centers [62,74,75,76,77].
Inoculated S. fruticosa plants exhibited significant lower (23%, p < 0.05) excess excitation energy (EXC) [78] than non-inoculated (Figure 7d). Efficient photoprotective mechanisms are associated with avoidance of excess energy in chloroplasts [79] as it was observed in the inoculated plants, implying that inoculation contributes to prevention of excess excitation energy at PSII (Figure 7d). It is well defined that NPQ and photoinhibition are strongly interdependent [80,81,82] but how much NPQ or dissipation is needed to successfully limit photoinhibition is a complex question to answer [83,84].
The redox state of the plastoquinone pool did not differ between inoculated and non-inoculated plants, suggesting that it can be kept relatively steady (Figure 7a). Increased available evidence implies that plastoquinone redox state controls stomatal opening in response to light with a more reduced redox state corresponding to increased stomatal opening [85,86,87]. Chloroplast redox regulation has long been considered central for plant photosynthesis through its role in the light-dependent activation of Calvin–Benson–Bassham cycle enzymes [88]. Yet, using chlorophyll fluorescence parameters, carbon assimilation can be easily estimated [89].
Both ratio Fv/Fm [90] and its correlated more sensitive form Fv/Fo [91] provide an estimate of the potential PSII efficiency of dark-adapted leaves [92]. Though the maximum efficiency of PSII photochemistry (Fv/Fm) did not differ between inoculated and non-inoculated plants, the significant difference observed in the efficiency of the water-splitting complex on the donor side of PSII (Fv/Fo) suggests that it is a better parameter than Fv/Fm and can distinguish small differences in PSII photosynthetic performance [93,94]. In our experiment, the increased Fv/Fo ratio in inoculated plants reveals a higher efficiency of the water-splitting complex on the donor side of PSII [95,96]. The donor side photoinhibition mechanism elucidates photoinhibition by malfunction of the water-splitting complex [97,98,99,100]. If the water-splitting complex does not properly reduce the primary electron donor P680+, then P680+ may cause harmful oxidations in PSII [100].
The maximum chlorophyll a fluorescence in the dark-adapted leaf (Fm) did not differ between inoculated and non-inoculated plants (Figure 8), while the minimum chlorophyll a fluorescence in the dark-adapted leaf (Fo) was lower (10%, p < 0.05) in inoculated plants. An increase in Fo has been considered as a measure of malfunction in the PSII reaction center and decreased efficiency of reaction center photochemistry [70,101,102,103,104,105], and it is observed when the acceptor-side is photoinhibited [106]. Thus, colonization of S. fruticosa by the AMF Rhizophagus irregularis resulted in a higher efficient PSII donor and acceptor-side.
Overall, our findings suggested that the increased ETR of inoculated S. fruticosa (Figure 7c) contributed to increased photosynthetic performance providing growth advantages [107] to inoculated plants by increasing their aboveground biomass (Figure 4a) mainly by increasing leaf biomass (Figure 3b). It seems that the effect of AMF symbiosis on plant growth is coupled with equilibrium between costs and benefits in which the higher carbohydrate cost to plants for AMF symbiosis is balanced by increases in their photosynthetic capacity [108].

4. Materials and Methods

4.1. Plant Material and Growth Conditions

Seeds of Salvia fruticosa Mill. (Greek sage, Lamiaceae) were obtained from Zeytinburnu Medicinal Plant Garden (Istanbul, Turkey). The seeds were surface sterilized in 5% sodium hypochlorite and then washed 3 times with deionized water. The sterilized seeds were then transferred to sterilized filter paper, moistened with deionized water, and left in the dark at room temperature to germinate. The germinated seeds were transferred into plastic multi-pots containing previously sterilized sand and placed in a phytotron with controlled environmental conditions under a long day photoperiod 16 h/8 h, with 70 ± 5%/80 ± 5% humidity (day/night), temperature 23 ± 1 °C/20 ± 1 °C (day/night) and light intensity of 300 ± 20 μmol photons m−2 s−1 [109]. Salvia seedlings were watered with nutrient solution (Table 1) for 3 weeks and then were transferred to larger pots for arbuscular mycorrhizal application (9 cm base diameter, 15 cm height). All presented data are from two independent biological replicates with three leaf samples (each leaf sample from a different plant) per treatment per experiment for chlorophyll fluorescence measurements and six samples (per treatment per experiment) for growth measurements and for mycorrhizal colonization evaluation.

4.2. Arbuscular Mycorrhizal Application

Five g of Rhizophagus irregularis (Błaszk., Wubet, Renker & Buscot) C. Walker and A. Schüßler (syn. Glomus irregulare Błaszk., Wubet, Renker & Buscot, previously known as Glomus intraradices) (Great White Granular 1, 132 propagules per gram, Plant Revolution Inc., Santa Ana, CA, USA) containing 200 spores cm-3 were applied to each pot (7 cm depth from the sand surface) in half of the pots before Salvia planting [110]. Treatments included AMF inoculation with R. irregularis (inoculated) or the non-mycorrhizal control (control, non-inoculated). Nutrient solution (Table 1) was given (every other day) to both groups for 16 weeks.

4.3. Growth Measurements and Mycorrhizal Colonization Evaluation

Roots, stems, and leaves of inoculated or control-non-inoculated S. fruticosa plants were harvested separately and washed with running tap water, and tissue lengths and fresh mass were recorded.
The percentage of total root colonization was determined by the gridline intersection method under a bright field microscope [111]. Fresh roots of S. fruticosa from 12 plants inoculated with R. irregularis were gently washed with running tap water and cut into about 1 cm-long pieces. The specimens were cleared with 10% potassium hydroxide and stained with trypan blue solution according to Phillips and Hayman [112]. Then they were observed under a microscope and the percentage of root length colonized was quantified in 15 root segments collected at random per plant.

4.4. Chlorophyll Fluorescence Imaging Analysis

Chlorophyll fluorescence parameters were measured in dark-adapted (20 min) randomly selected Salvia leaves of the same developmental stage (control-non-inoculated or inoculated) using a chlorophyll fluorometer imaging-PAM M-Series (Heinz Walz GmbH, Effeltrich, Germany) as previously described [113]. In each leaf 9 areas of interest (AOI) were selected for analysis. The initial chlorophyll a fluorescence (Fo) was obtained by modulated measuring light of 0.5 μmol photons m–2 s−1 and the maximal fluorescence (Fm) with a saturating pulse (SP) of 6000 μmol photons m–2 s−1 (see Figure 10 for explanation). The maximum efficiency of PSII photochemistry (Fv/Fm) was calculated as (Fm-Fo)/Fm and the efficiency of the water-splitting complex on the donor side of PSII (Fv/Fo) was calculated as (Fm-Fo)/Fo [114]. The steady-state photosynthesis was measured after 5 min illumination time before switching off the actinic light (AL) of 200 μmol photons m–2 s−1 (Figure 10). The maximum chlorophyll a fluorescence in the light-adapted leaf (Fm΄) was measured with SPs every 20 s for 5 min after application of the AL (200 μmol photons m–2 s−1). The effective quantum yield of PSII photochemistry (ΦPSII) was calculated by the Imaging Win software (Heinz Walz GmbH, Effeltrich, Germany) as (Fm’-Fs)/Fm’, and the redox state of the plastoquinone pool (qp), which is the fraction of open PSII reaction centers as (Fm’-Fs)/(Fm’-Fo’). The minimum chlorophyll a fluorescence in the light-adapted leaf (Fo’) was computed by the Imaging Win software using the approximation of Oxborough and Baker [115] as Fo’= Fo/(Fv/Fm+Fo/Fm’). The quantum yield of regulated non-photochemical energy loss in PSII (ΦNPQ) was calculated as Fs/Fm’−Fs/Fm and the quantum yield of non-regulated energy loss in PSII (ΦNO) as Fs/Fm. The efficiency of excitation energy capture by open PSII reaction centers (Fv’/Fm’) was calculated as (Fm’-Fo’)/Fm’, and non-photochemical quenching (NPQ) that reflects heat dissipation of excitation energy as (Fm-Fm’)/Fm’. The relative PSII electron transport rate (ETR) was calculated as ΦPSII x PAR x c x abs, by the Imaging Win software, where PAR is the Photosynthetic Active Radiation (200 μmol photons m–2 s−1), c is 0.5 since the absorbed light energy is assumed to be equally distributed between PSII and PSI, and abs is the total light absorption of the leaf taken as 0.84. The relative excess energy at PSII was calculated according to Bilger et al. [78], as EXC = (Fv/Fm−ΦPSII)/(Fv/Fm).
Representative chlorophyll fluorescence color-coded images of the initial chlorophyll a fluorescence (Fo), the maximal fluorescence (Fm), the maximum efficiency of PSII photochemistry (Fv/Fm), the effective quantum yield of PSII photochemistry (ΦPSII), the quantum yield of regulated non-photochemical energy loss in PSII (ΦNPQ) and the quantum yield of non-regulated energy loss in PSII (ΦNO) are also displayed for control-non-inoculated and inoculated Salvia fruticosa leaves.

4.5. Statistical Analysis

Chlorophyll fluorescence parameters represent averaged values (n = 6) from two independent experiments with three leaf samples (each leaf sample from a different plant) per treatment per experiment, while growth measurements and mycorrhizal colonization evaluation represent averaged values (n = 12) from six samples (per treatment per experiment). Results are expressed as mean ± SD. Statistically significant differences between the treatments were analyzed by the Student’s t-test at a level of p < 0.05 (StatView computer package, Abacus Concepts, Inc Berkley, CA, USA).

Author Contributions

Conceptualization, M.M., G.B. and E.P.E.; validation, M.M., G.B. and H.E.; formal analysis, M.M. and I.S.; investigation, I.S. and H.E.; resources, G.B.; writing—original draft preparation, M.M.; writing—review and editing, M.M., G.B. and E.P.E.; supervision, M.M. and G.B.; project administration, G.B.; funding acquisition, G.B. All authors have read and agreed to the published version of the manuscript.

Funding

This research was funded by the ISTANBUL UNIVERSITY SCIENTIFIC RESEARCH PROJECTS, Project ID: 3351.

Acknowledgments

We are grateful to Tuğçe Ağba and Seda Karadağ (Istanbul University, PhD students, Biology) for providing plant seeds and fungus used in the experiments and for their kind support during plant growth and inoculation procedures. We also wish to thank Ceyda Yazıcı (Istanbul University, MSc student, Biology) for her kind help during the growth of plants.

Conflicts of Interest

The authors declare no conflict of interest. The funders had no role in the design of the study; in the collection, analyses, or interpretation of data; in the writing of the manuscript, or in the decision to publish the results.

References

  1. Parniske, M. Arbuscular mycorrhiza: The mother of plant root endosymbioses. Nat. Rev. Microbiol. 2008, 6, 763. [Google Scholar] [CrossRef] [PubMed]
  2. Douds, D.D.; Nagahashi, G.; Reider, C.; Hepperly, P.R. Inoculation with arbuscular mycorrhizal fungi increases the yield of potatoes in a high P soil. Biol. Agric. Hortic. 2007, 25, 67–78. [Google Scholar] [CrossRef]
  3. Golubkina, N.; Krivenkov, L.; Sekara, A.; Vasileva, V.; Tallarita, A.; Caruso, G. Prospects of arbuscular mycorrhizal fungi utilization in production of Allium plants. Plants 2020, 9, 279. [Google Scholar] [CrossRef] [PubMed] [Green Version]
  4. Zhang, L.; Xu, M.; Liu, Y.; Zhang, F.; Hodge, A.; Feng, G. Carbon and phosphorus exchange may enable cooperation between an arbuscular mycorrhizal fungus and a phosphate-solubilizing bacterium. New Phytol. 2016, 210, 1022–1032. [Google Scholar] [CrossRef] [Green Version]
  5. Zhang, X.; Zhang, H.; Zhang, Y.; Liu, Y.; Zhang, H.; Tang, M. Arbuscular mycorrhizal fungi alter carbohydrate distribution and amino acid accumulation in Medicago truncatula under lead stress. Environ. Exp. Bot. 2020, 171, 103950. [Google Scholar] [CrossRef]
  6. Sheng, M.; Tang, M.; Chen, H.; Yang, B.; Zhang, F.; Huang, Y. Influence of arbuscular mycorrhizae on photosynthesis and water status of maize plants under salt stress. Mycorrhiza 2008, 18, 287–296. [Google Scholar] [CrossRef]
  7. Dodd, I.C.; Ruíz-Lozano, J.M. Microbial enhancement of crop resource use efficiency. Curr. Opin. Biotechnol. 2012, 23, 236–242. [Google Scholar] [CrossRef]
  8. Gianinazzi, S.; Gollotte, A.; Binet, M.N.; van Tuinen, D.; Redecker, D.; Wipf, D. Agroecology: The key role of arbuscular mycorrhizas in ecosystem services. Mycorrhiza 2010, 20, 519–530. [Google Scholar] [CrossRef]
  9. Ruiz-Sánchez, M.; Aroca, R.; Muñoz, Y.; Polón, R.; Ruiz-Lozano, J.M. The arbuscular mycorrhizal symbiosis enhances the photosynthetic Mycorrhiza efficiency and the antioxidative response of rice plants subjected to drought stress. J. Plant Physiol. 2010, 167, 862–869. [Google Scholar] [CrossRef]
  10. Dhawi, F.; Datta, R.; Ramakrishna, W. Mycorrhiza and heavy metal resistant bacteria enhance growth, nutrient uptake and alter metabolic profile of sorghum grown in marginal soil. Chemosphere 2016, 157, 33–41. [Google Scholar] [CrossRef]
  11. Zhan, F.; Li, B.; Jiang, M.; Yue, X.; He, Y.; Xia, Y.; Wang, Y. Arbuscular mycorrhizal fungi enhance antioxidant defense in the leaves and the retention of heavy metals in the roots of maize. Environ. Sci. Pollut. Res. 2018, 25, 24338–24347. [Google Scholar] [CrossRef] [PubMed]
  12. Begum, N.; Ahanger, M.A.; Su, Y.; Lei, Y.; Mustafa, N.S.A.; Ahmad, P.; Zhang, L. Improved drought tolerance by AMF inoculation in maize (Zea mays) involves physiological and biochemical implications. Plants 2019, 8, 579. [Google Scholar] [CrossRef] [PubMed] [Green Version]
  13. Boutasknit, A.; Baslam, M.; Ait-El-Mokhtar, M.; Anli, M.; Ben-Laouane, R.; Douira, A.; El Modafar, C.; Mitsui, T.; Wahbi, S.; Meddich, A. Arbuscular mycorrhizal fungi mediate drought tolerance and recovery in two contrasting carob (Ceratonia siliqua L.) ecotypes by regulating stomatal, water relations, and (in)organic adjustments. Plants 2020, 9, 80. [Google Scholar] [CrossRef] [PubMed] [Green Version]
  14. Singh, N.V.; Singh, S.K.; Singh, A.K.; Meshram, D.T.; Suroshe, S.S.; Mishra, D.C. Arbuscular mycorrhizal fungi (AMF) induced hardening of micropropagated pomegranate (Punica granatum L.) plantlets. Sci. Hortic. 2012, 136, 122–127. [Google Scholar] [CrossRef]
  15. Romero-Munar, A.; Tauler, M.; Gulías, J.; Baraza, E. Nursery preconditioning of Arundo donax L. plantlets determines biomass harvest in the first two years. Ind. Crops Prod. 2018, 119, 33–40. [Google Scholar] [CrossRef]
  16. Schwarzott, D.; Walker, C.; Schüssler, A. Glomus, the largest genus of the arbuscular mycorrhizal fungi (Glomales), is nonmonophyletic. Mol. Phylogenet. Evol. 2001, 21, 190–197. [Google Scholar] [CrossRef]
  17. Krüger, M.; Krüger, C.; Walker, C.; Stockinger, H.; Schüßler, A. Phylogenetic reference data for systematics and phylotaxonomy of arbuscular mycorrhizal fungi from phylum to species level. New Phytol. 2011, 193, 970–984. [Google Scholar] [CrossRef]
  18. Blaszkowski, J.; Czerniawska, B.; Wubet, T.; Schuessler, T.; Buscot, F.; Renker, C. Glomus irregulare, a new arbuscular mycorrhizal fungus in the Glomeromycota. Mycotaxon 2008, 106, 247–267. [Google Scholar]
  19. Stockinger, H.; Walker, C.; Schüssler, A. ‘Glomus intraradices DAOM197198’, a model fungus in arbuscular mycorrhiza research, is not Glomus intraradices. New Phytol. 2009, 183, 1176–1187. [Google Scholar] [CrossRef]
  20. Formey, D.; Molès, M.; Haouy, A.; Savelli, B.; Bouchez, O.; Bécard, G.; Roux, C. Comparative analysis of mitochondrial genomes of Rhizophagus irregularis—syn. Glomus irregular—Reveals a polymorphism induced by variability generating elements. New Phytol. 2012, 196, 1217–1227. [Google Scholar]
  21. He, F.; Sheng, M.; Tang, M. Effects of Rhizophagus irregularis on photosynthesis and antioxidative enzymatic system in Robinia pseudoacacia L. under drought stress. Front. Plant Sci. 2017, 8, 183. [Google Scholar] [CrossRef] [Green Version]
  22. Le Pioufle, O.; Ganoudi, M.; Calonne-Salmon, M.; Dhaou, F.B.; Declerck, S. Rhizophagus irregularis MUCL 41833 improves phosphorus uptake and water use efficiency in maize plants during recovery from drought stress. Front. Plant Sci. 2019, 10, 897. [Google Scholar] [CrossRef] [Green Version]
  23. Golubkina, N.; Logvinenko, L.; Novitsky, M.; Zamana, S.; Sokolov, S.; Molchanova, A.; Shevchuk, O.; Sekara, A.; Tallarita, A.; Caruso, G. Yield, essential oil and quality performances of Artemisia dracunculus, Hyssopus officinalis and Lavandula angustifolia as affected by arbuscular mycorrhizal fungi under organic management. Plants 2020, 9, 375. [Google Scholar] [CrossRef] [PubMed] [Green Version]
  24. Kushwaha, R.K.; Rodrigues, V.; Kumar, V.; Patel, H.; Raina, M.; Kumar, D. Soil microbes-medicinal plants interactions: Ecological diversity and future prospect. In Plant Microbe Symbiosis; Varma, A., Tripathi, S., Prasad, R., Eds.; Springer: Cham, Switzerland, 2020; pp. 263–286. [Google Scholar]
  25. Zubek, S.; Błaszkowski, J. Medicinal plants as hosts of arbuscular mycorrhizal fungi and dark septate endophytes. Phytochem. Rev. 2009, 8, 571–580. [Google Scholar] [CrossRef]
  26. Moustaka, J.; Ouzounidou, G.; Sperdouli, I.; Moustakas, M. Photosystem II is more sensitive than photosystem I to Al3+ induced phytotoxicity. Materials 2018, 11, 1772. [Google Scholar] [CrossRef] [PubMed] [Green Version]
  27. Sperdouli, I.; Moustaka, J.; Antonoglou, O.; Adamakis, I.D.S.; Dendrinou-Samara, C.; Moustakas, M. Leaf age dependent effects of foliar-sprayed CuZn nanoparticles on photosynthetic efficiency and ROS generation in Arabidopsis thaliana. Materials 2019, 12, 2498. [Google Scholar] [CrossRef] [Green Version]
  28. Flood, P.J.; Harbinson, J.; Aarts, M.G. Natural genetic variation in plant photosynthesis. Trends Plant Sci. 2011, 16, 327–335. [Google Scholar] [CrossRef]
  29. Anderson, J.M. Changing concepts about the distribution of photosystems I and II between grana-appressed and stroma-exposed thylakoid membranes. Photosynth. Res. 2002, 73, 157–164. [Google Scholar] [CrossRef]
  30. Antonoglou, O.; Moustaka, J.; Adamakis, I.D.; Sperdouli, I.; Pantazaki, A.; Moustakas, M.; Dendrinou-Samara, C. Nanobrass CuZn nanoparticles as foliar spray non phytotoxic fungicides. ACS Appl. Mater. Interfaces 2018, 10, 4450–4461. [Google Scholar] [CrossRef]
  31. Krause, G.; Weis, E. Chlorophyll fluorescence and photosynthesis: The basics. Annu. Rev. Plant Physiol. Plant Mol. Biol. 1991, 42, 313–349. [Google Scholar] [CrossRef]
  32. Asfi, M.; Ouzounidou, G.; Panajiotidis, S.; Therios, I.; Moustakas, M. Toxicity effects of olive-mill wastewater on growth, photosynthesis and pollen morphology of spinach plants. Ecotoxicol. Environ. Saf. 2012, 80, 69–75. [Google Scholar] [CrossRef] [PubMed]
  33. Asfi, M.; Ouzounidou, G.; Moustakas, M. Evaluation of olive oil mill wastewater toxicity on spinach. Environ. Sci. Pollut. Res. 2012, 19, 2363–2371. [Google Scholar] [CrossRef] [PubMed]
  34. Murchie, E.H.; Lawson, T. Chlorophyll fluorescence analysis: A guide to good practice and understanding some new applications. J. Exp. Bot. 2013, 64, 3983–3998. [Google Scholar] [CrossRef] [PubMed] [Green Version]
  35. Sperdouli, I.; Moustakas, M. Differential blockage of photosynthetic electron flow in young and mature leaves of Arabidopsis thaliana by exogenous proline. Photosynthetica 2015, 53, 471–477. [Google Scholar] [CrossRef]
  36. Kalaji, H.M.; Jajoo, A.; Oukarroum, A.; Brestic, M.; Zivcak, M.; Samborska, I.A.; Cetner, M.D.; Łukasik, I.; Goltsev, V.; Ladle, R.J. Chlorophyll a fluorescence as a tool to monitor physiological status of plants under abiotic stress conditions. Acta Physiol. Plant. 2016, 38, 1–11. [Google Scholar] [CrossRef] [Green Version]
  37. Moustaka, J.; Ouzounidou, G.; Bayçu, G.; Moustakas, M. Aluminum resistance in wheat involves maintenance of leaf Ca2+ and Mg2+ content, decreased lipid peroxidation and Al accumulation, and low photosystem II excitation pressure. BioMetals 2016, 29, 611–623. [Google Scholar] [CrossRef]
  38. Kalaji, H.M.; Račková, L.; Paganová, V.; Swoczyna, T.; Rusinowski, S.; Sitko, K. Can chlorophyll-a fluorescence parameters be used as bio-indicators to distinguish between drought and salinity stress in Tilia cordata Mill? Environ. Exp. Bot. 2018, 152, 149–157. [Google Scholar] [CrossRef]
  39. Barbagallo, R.P.; Oxborough, K.; Pallett, K.E.; Baker, N.R. Rapid, noninvasive screening for perturbations of metabolism and plant growth using chlorophyll fluorescence imaging. Plant Physiol. 2003, 132, 485–493. [Google Scholar] [CrossRef] [Green Version]
  40. Gorbe, E.; Calatayud, A. Applications of chlorophyll fluorescence imaging technique in horticultural research: A review. Sci. Hortic. 2012, 138, 24–35. [Google Scholar] [CrossRef]
  41. Chaerle, L.; Lenk, S.; Hagenbeek, D.; Buschmann, C.; Van Der Straeten, D. Multi-color fluorescence imaging for early detection of the hypersensitive reaction to tobacco mosaic virus. J. Plant Physiol. 2007, 164, 253–262. [Google Scholar] [CrossRef]
  42. Sperdouli, I.; Moustakas, M. Spatio-temporal heterogeneity in Arabidopsis thaliana leaves under drought stress. Plant Biol. 2012, 14, 118–128. [Google Scholar] [CrossRef] [PubMed]
  43. Martinez-Penalver, A.; Reigosa, M.J.; Sanchez-Moreiras, A.M. Imaging chlorophyll a fluorescence reveals specific spatial distributions under different stress conditions. Flora 2011, 206, 836–844. [Google Scholar] [CrossRef]
  44. Moustakas, M.; Malea, P.; Zafeirakoglou, A.; Sperdouli, I. Photochemical changes and oxidative damage in the aquatic macrophyte Cymodocea nodosa exposed to paraquat-induced oxidative stress. Pest. Biochem. Physiol. 2016, 126, 28–34. [Google Scholar] [CrossRef] [PubMed]
  45. Bayçu, G.; Moustaka, J.; Gevrek-Kürüm, N.; Moustakas, M. Chlorophyll fluorescence imaging analysis for elucidating the mechanism of photosystem II acclimation to cadmium exposure in the hyperaccumulating plant Noccaea caerulescens. Materials 2018, 11, 2580. [Google Scholar] [CrossRef] [PubMed] [Green Version]
  46. Moustakas, M.; Hanć, A.; Dobrikova, A.; Sperdouli, I.; Adamakis, I.D.S.; Apostolova, E. Spatial heterogeneity of cadmium effects on Salvia sclarea leaves revealed by chlorophyll fluorescence imaging analysis and laser ablation inductively coupled plasma mass spectrometry. Materials 2019, 12, 2953. [Google Scholar] [CrossRef] [PubMed] [Green Version]
  47. Moustakas, M.; Bayçu, G.; Gevrek-Kürüm, N.; Moustaka, J.; Csatári, I.; Rognes, S.E. Spatiotemporal heterogeneity of photosystem II function during acclimation to zinc exposure and mineral nutrition changes in the hyperaccumulator Noccaea caerulescens. Environ. Sci. Pollut. Res. 2019, 26, 6613–6624. [Google Scholar] [CrossRef]
  48. Kramer, D.M.; Johnson, G.; Kiirats, O.; Edwards, G.E. New fluorescence parameters for determination of QA redox state and excitation energy fluxes. Photosynth. Res. 2004, 79, 209–218. [Google Scholar] [CrossRef]
  49. Gutierrez-Manero, F.J.; Ramos-Solano, B.; Probanza, A.; Mehouachi, J.; Tadeo, F.R.; Talon, M. The plant-growth-promoting rhizobacteriaBacillus pumilusandBacillus licheniformisproduce high amounts of physiologically active gibberellins. Physiol. Plant. 2001, 111, 206–211. [Google Scholar] [CrossRef]
  50. Ramírez-Flores, M.R.; Bello-Bello, E.; Rellán-Álvarez, R.; Sawers, R.J.H.; Olalde-Portuga, V. Inoculation with the mycorrhizal fungus Rhizophagus irregularis modulates the relationship between root growth and nutrient content in maize (Zea mays ssp. mays L.). Plant Direct. 2019, 3, 1–12. [Google Scholar]
  51. Li, N.; Chen, Y.R.; Ding, Z.; Li, P.; Wu, Y.; Zhang, A.; Yu, S.; Giovannoni, J.J.; Fei, Z.; Zhang, W.; et al. Nonuniform gene expression pattern detected along the longitudinal axis in the matured rice leaf. Sci. Rep. 2015, 5, 8015. [Google Scholar] [CrossRef] [Green Version]
  52. Jiang, C.D.; Li, P.M.; Gao, H.Y.; Zou, Q.; Jiang, G.M.; Li, L.H. Enhanced photoprotection at the early stages of leaf expansion in field-grown soybean plants. Plant Sci. 2005, 168, 911–919. [Google Scholar] [CrossRef]
  53. Sperdouli, I.; Moustakas, M. Differential response of photosystem II photochemistry in young and mature leaves of Arabidopsis thaliana to the onset of drought stress. Acta Physiol. Plant. 2012, 34, 1267–1276. [Google Scholar] [CrossRef]
  54. Sperdouli, I.; Moustakas, M. A better energy allocation of absorbed light in photosystem II and less photooxidative damage contribute to acclimation of Arabidopsis thaliana young leaves to water deficit. J. Plant Physiol. 2014, 171, 587–593. [Google Scholar] [CrossRef] [PubMed]
  55. Sperdouli, I.; Moustakas, M. Leaf developmental stage modulates metabolite accumulation and photosynthesis contributing to acclimation of Arabidopsis thaliana to water deficit. J. Plant Res. 2014, 127, 481–489. [Google Scholar] [CrossRef]
  56. Moustaka, J.; Tanou, G.; Adamakis, I.D.; Eleftheriou, E.P.; Moustakas, M. Leaf age dependent photoprotective and antioxidative mechanisms to paraquat-induced oxidative stress in Arabidopsis thaliana. Int. J. Mol. Sci. 2015, 16, 13989–14006. [Google Scholar] [CrossRef] [PubMed] [Green Version]
  57. Bielczynski, L.W.; Łącki, M.K.; Hoefnagels, I.; Gambin, A.; Croce, R. Leaf and plant age affects photosynthetic performance and photoprotective capacity. Plant Physiol. 2017, 175, 1634–1648. [Google Scholar] [CrossRef] [PubMed]
  58. Müller, P.; Li, X.P.; Niyogi, K.K. Non-photochemical quenching. A response to excess light energy. Plant Physiol. 2001, 125, 1558–1566. [Google Scholar] [CrossRef] [Green Version]
  59. Kasajima, I.; Ebana, K.; Yamamoto, T.; Takahara, K.; Yano, M.; Kawai-Yamada, M.; Uchimiya, H. Molecular distinction in genetic regulation of nonphotochemical quenching in rice. Proc. Natl. Acad. Sci. USA 2011, 108, 13835–13840. [Google Scholar] [CrossRef] [Green Version]
  60. Gawroński, P.; Witoń, D.; Vashutina, K.; Bederska, M.; Betliński, B.; Rusaczonek, A.; Karpiński, S. Mitogen-activated protein kinase 4 is a salicylic acid-independent regulator of growth but not of photosynthesis in Arabidopsis. Mol. Plant 2014, 7, 1151–1166. [Google Scholar] [CrossRef] [Green Version]
  61. Moustaka, J.; Tanou, G.; Giannakoula, A.; Panteris, E.; Eleftheriou, E.P.; Moustakas, M. Anthocyanin accumulation in poinsettia leaves and its functional role in photo-oxidative stress. Environ. Exp. Bot. 2020, 175, 104065. [Google Scholar] [CrossRef]
  62. Hideg, É.; Spetea, C.; Vass, I. Singlet oxygen production in thylakoid membranes during photoinhibition as detected by EPR spectroscopy. Photosynth. Res. 1994, 39, 191–199. [Google Scholar] [CrossRef] [PubMed]
  63. op den Camp, R.G.L.; Przybyla, D.; Ochsenbein, C.; Laloi, C.; Kim, C.; Danon, A.; Wagner, D.; Hideg, É.; Göbel, C.; Feussner, I.; et al. Rapid induction of distinct stress responses after the release of singlet oxygen in Arabidopsis. Plant Cell 2003, 15, 2320–2332. [Google Scholar] [CrossRef] [PubMed] [Green Version]
  64. Krieger-Liszkay, A.; Fufezan, C.; Trebst, A. Singlet oxygen production in photosystem II and related protection mechanism. Photosynth. Res. 2008, 98, 551–564. [Google Scholar] [CrossRef]
  65. Triantaphylidès, C.; Havaux, M. Singlet oxygen in plants: Production, detoxification and signaling. Trends Plant Sci. 2009, 14, 219–228. [Google Scholar] [CrossRef]
  66. Telfer, A. Singlet oxygen production by PSII under light stress: Mechanism, detection and the protective role of beta-carotene. Plant Cell Physiol. 2014, 55, 1216–1223. [Google Scholar] [CrossRef] [Green Version]
  67. Roach, T.; Na, C.S.; Stöggl, W.; Krieger-Liszkay, A. The non-photochemical quenching protein LHCSR3 prevents oxygen-dependent photoinhibition in Chlamydomonas reinhardtii. J. Exp. Bot. 2020, 71, 2650–2660. [Google Scholar] [CrossRef]
  68. Genty, B.; Briantais, J.M.; Baker, N.R. The relationship between the quantum yield of photosynthetic electron transport and quenching of chlorophyll fluorescence. Biochim. Biophys. Acta 1989, 990, 87–92. [Google Scholar] [CrossRef]
  69. Simón, I.; Díaz-López, L.; Gimeno, V.; Nieves, M.; Pereira, W.E.; Martínez, V.; Lidon, V.; García-Sánchez, F. Effects of boron excess in nutrient solution on growth, mineral nutrition, and physiological parameters of Jatropha curcas seedlings. J. Plant Nutr. Soil Sci. 2013, 176, 165–174. [Google Scholar] [CrossRef]
  70. Demmig-Adams, B.; Cohu, C.M.; Muller, O.; Adams, W.W. Modulation of photosynthetic energy conversion efficiency in nature: From seconds to seasons. Photosynth. Res. 2012, 113, 75–88. [Google Scholar] [CrossRef]
  71. Takahashi, S.; Badger, M.R. Photoprotection in plants: A new light on photosystem II damage. Trends Plant Sci. 2011, 16, 53–60. [Google Scholar] [CrossRef]
  72. Moustaka, J.; Moustakas, M. Photoprotective mechanism of the non-target organism Arabidopsis thaliana to paraquat exposure. Pest. Biochem. Physiol. 2014, 111, 1–6. [Google Scholar] [CrossRef] [PubMed]
  73. Ruban, A.V. Nonphotochemical chlorophyll fluorescence quenching: Mechanism and effectiveness in protecting plants from photodamage. Plant Physiol. 2016, 170, 1903–1916. [Google Scholar] [CrossRef] [PubMed] [Green Version]
  74. Nishiyama, Y.; Yamamoto, H.; Allakhverdiev, S.I.; Inaba, M.; Yokota, A.; Murata, N. Oxidative stress inhibits the repair of photodamage to the photosynthetic machinery. EMBO J. 2001, 20, 5587–5594. [Google Scholar] [CrossRef] [PubMed]
  75. Murata, N.; Takahashi, S.; Nishiyama, Y.; Allakhverdiev, S.I. Photoinhibition of photosystem II under environmental stress. Biochim. Biophys. Acta 2007, 1767, 414–421. [Google Scholar] [CrossRef] [PubMed] [Green Version]
  76. Roach, T.; Sedoud, A.; Krieger-Liszkay, A. Acetate in mixotrophic growth medium affects photosystem II in Chlamydomonas reinhardtii and protects against photoinhibition. Biochim. Biophys. Acta 2013, 1827, 1183–1190. [Google Scholar] [CrossRef] [PubMed] [Green Version]
  77. Kale, R.; Hebert, A.E.; Frankel, L.K.; Sallans, L.; Bricker, T.M.; Pospíšil, P. Amino acid oxidation of the D1 and D2 proteins by oxygen radicals during photoinhibition of Photosystem II. Proc. Natl. Acad. Sci. USA 2017, 114, 2988–2993. [Google Scholar] [CrossRef] [Green Version]
  78. Bilger, W.; Schreiber, U.; Bock, M. Determination of the quantum efficiency of photosystem II and of non-photochemical quenching of chlorophyll fluorescence in the field. Oecologia 1995, 102, 425–432. [Google Scholar] [CrossRef]
  79. Lima, C.S.; Ferreira-Silva, S.L.; Carvalho, F.E.L.; Neto, M.C.L.; Aragăo, R.M.; Silva, E.N.; Sousa, R.M.J.; Silveira, J.A.G. Antioxidant protection and PSII regulation mitigate photo-oxidative stress induced by drought followed by high light in cashew plants. Environ. Exp. Bot. 2018, 149, 59–69. [Google Scholar] [CrossRef] [Green Version]
  80. Li, X.P.; Muller-Moule, P.; Gilmore, A.M.; Niyogi, K.K. PsbS-dependent enhancement of feedback de-excitation protects photosystem II from photoinhibition. Proc. Natl Acad. Sci. USA 2002, 99, 15222–15227. [Google Scholar] [CrossRef] [Green Version]
  81. Krah, N.; Logan, B.A. Loss of psbS expression reduces vegetative growth, reproductive output, and light-limited, but not light-saturated, photosynthesis in Arabidopsis thaliana (Brassicaceae) grown in temperate light environments. Am. J. Bot. 2010, 97, 644–649. [Google Scholar] [CrossRef]
  82. Hubbart, S.; Smillie, I.; Heatley, M.; Swarup, R.; Foo, C.; Zhao, L.; Murchie, E. Enhanced thylakoid photoprotection can increase yield and canopy radiation use efficiency in rice. Commun. Biol. 2018, 1, 22. [Google Scholar] [CrossRef] [PubMed] [Green Version]
  83. Ruban, A.V. Evolution under the sun: Optimizing light harvesting in photosynthesis. J. Exp. Bot. 2015, 66, 7–23. [Google Scholar] [CrossRef] [PubMed] [Green Version]
  84. Murchie, E.H.; Ruban, A.V. Dynamic non-photochemical quenching in plants: From molecular mechanism to productivity. Plant J. 2020, 101, 885–896. [Google Scholar] [CrossRef] [PubMed] [Green Version]
  85. Busch, F.A. Opinion: The red-light response of stomatal movement is sensed by the redox state of the photosynthetic electron transport chain. Photosynth. Res. 2014, 119, 131–140. [Google Scholar] [CrossRef] [PubMed]
  86. Glowacka, K.; Kromdijk, J.; Kucera, K.; Xie, J.; Cavanagh, A.P.; Leonelli, L.; Leakey, A.D.B.; Ort, D.R.; Niyogi, K.K.; Long, S.P. Photosystem II Subunit S over-expression increases the efficiency of water use in a field-grown crop. Nat. Commun. 2018, 9, 868. [Google Scholar] [CrossRef] [Green Version]
  87. Kromdijk, J.; Głowacka, K.; Long, S.P. Predicting light-induced stomatal movements based on the redox state of plastoquinone: Theory and validation. Photosynth. Res. 2019, 141, 83–97. [Google Scholar] [CrossRef] [Green Version]
  88. Kaiser, E.; Correa Galvis, V.; Armbruster, U. Efficient photosynthesis in dynamic light environments: A chloroplast’s perspective. Biochem. J. 2019, 476, 2725–2741. [Google Scholar] [CrossRef] [Green Version]
  89. McAusland, L.; Davey, P.; Kanwal, N.; Baker, N.; Lawson, T.A. Novel system for spatial and temporal imaging of intrinsic plant water use efficiency. J. Exp. Bot. 2013, 64, 4993–5007. [Google Scholar] [CrossRef] [Green Version]
  90. Kitajima, H.; Butler, W.L. Quenching of chlorophyll fluorescence and primary photochemistry in chloroplasts by dibromothymo-quinone. Biochim. Biophys. Acta 1975, 376, 105–115. [Google Scholar] [CrossRef]
  91. Babani, F.; Lichtenthaler, H.K. Light-induced and age-dependent development of chloroplasts in etiolated barley leaves as visualized by determination of photosynthetic pigments, CO2 assimilation rates and different kinds of chlorophyll fluorescence ratios. J. Plant Physiol. 1996, 148, 555–566. [Google Scholar] [CrossRef]
  92. Lichtenthaler, H.K.; Babani, F.; Langsdorf, G. Chlorophyll fluorescence imaging of photosynthetic activity in sun and shade leaves of trees. Photosynth Res. 2007, 93, 235–244. [Google Scholar] [CrossRef] [PubMed]
  93. Pereira, W.E.; De Siqueira, D.L.; Martinez, C.A.; Puiatti, M. Gas exchange and chlorophyll fluorescence in four citrus rootstocks under aluminium stress. J. Plant Physiol. 2000, 157, 513–520. [Google Scholar] [CrossRef]
  94. Pellegrini, E.; Carucci, M.G.; Campanella, A.; Lorenzini, G.; Nali, C. Ozone stress in Melissa officinalis plants assessed by photosynthetic function. Environ. Exp. Bot. 2011, 73, 94–101. [Google Scholar] [CrossRef]
  95. Govindachary, S.; Bukhov, N.G.; Joly, D.; Carpentier, R. Photosystem II inhibition by moderate light under low temperature in intact leaves of chilling-sensitive and -tolerant plants. Physiol. Plant. 2004, 121, 322–333. [Google Scholar] [CrossRef]
  96. Mosadegh, H.; Trivellini, A.; Lucchesini, M.; Ferrante, A.; Maggini, R.; Vernieri, P.; Mensuali Sodi, A. UV-B physiological changes under conditions of distress and eustress in sweet basil. Plants 2019, 8, 396. [Google Scholar] [CrossRef] [Green Version]
  97. Callahan, F.E.; Becker, D.W.; Cheniae, G.M. Studies on the photo-inactivation of the water-oxidizing enzyme. II. Characterization of weak light photoinhibition of PSII and its light-induced recovery. Plant Physiol. 1986, 82, 261–269. [Google Scholar] [CrossRef] [Green Version]
  98. Chen, G.X.; Kazimir, J.; Cheniae, G.M. Photoinhibition of hydroxylamine-extracted photosystem II membranes: Studies of the mechanism. Biochemistry 1992, 31, 11072–11083. [Google Scholar] [CrossRef]
  99. Anderson, J.M.; Park, Y.I.; Chow, W.S. Unifying model for the photoinactivation of photosystem II in vivo: A hypothesis. Photosynth. Res. 1998, 56, 1–13. [Google Scholar] [CrossRef]
  100. Sarvikas, P.; Hakala, M.; Pätsikkä, E.; Tyystjärvi, T.; Tyystjärvi, E. Action spectrum of photoinhibition in leaves of wild type and npq1-2 and npq4-1 mutants of Arabidopsis thaliana. Plant Cell Physiol. 2006, 47, 391–400. [Google Scholar] [CrossRef] [Green Version]
  101. Demmig, B.; Björkman, O. Comparison of the effect of excessive light on chlorophyll fluorescence (77K) and photon yield of O2 evolution in leaves of higher plants. Planta 1987, 171, 171–184. [Google Scholar] [CrossRef]
  102. Franklin, L.A.; Levavasseur, G.; Osmond, C.B.; Henley, W.J.; Ramus, J. Two components of onset and recovery during photoinhibition of Ulva rotundata. Planta 1992, 186, 399–408. [Google Scholar] [CrossRef] [PubMed]
  103. Osmond, B. What is photoinhibition? Some insights from comparisons of shade and sun plants. In Photoinhibition of Photosynthesis from Molecular Mechanisms to the Field; Baker, N.R., Bowyer, J.R., Eds.; Bios Scientific Publishing Ltd.: Oxford, UK, 1994; pp. 1–24. [Google Scholar]
  104. Park, Y.I.; Chow, W.S.; Anderson, J.M. Light inactivation of functional photosystem-II in leaves of peas grown in moderate light depends on photon exposure. Planta 1995, 196, 401–411. [Google Scholar] [CrossRef]
  105. Oguchi, R.; Terashima, I.; Chow, W.S. The involvement of dual mechanisms of photoinactivation of photosystem II in Capsicum annuum L. plants. Plant Cell Physiol. 2009, 50, 1815–1825. [Google Scholar] [CrossRef] [PubMed]
  106. Wilson, S.; Ruban, A.V. Quantitative assessment of the high-light tolerance in plants with an impaired photosystem II donor side. Biochem. J. 2019, 476, 1377–1386. [Google Scholar] [CrossRef]
  107. Zhang, C.; Wang, H.; Xu, Y.; Zhang, S.; Wang, J.; Hu, B.; Hou, X.; Li, Y.; Liu, T. Enhanced relative electron transport rate contributes to increased photosynthetic capacity in autotetraploid pak choi. Plant Cell Physiol. 2020, 61, 761–774. [Google Scholar] [CrossRef]
  108. Romero-Munar, A.; Fernández Del-Saz, N.; Ribas-Carbó, M.; Flexas, J.; Baraza, E.; Florez-Sarasa, I.; Fernie, A.R.; Gulías, J. Arbuscular mycorrhizal symbiosis with Arundo donax decreases root respiration and increases both photosynthesis and plant biomass accumulation. Plant Cell Environ. 2017, 40, 1115–1126. [Google Scholar] [CrossRef]
  109. Bayçu, G.; Gevrek-Kürüm, N.; Moustaka, J.; Csatári, I.; Rognes, S.E.; Moustakas, M. Cadmium-zinc accumulation and photosystem II responses of Noccaea caerulescens to Cd and Zn exposure. Environ. Sci. Pollut. Res. 2017, 24, 2840–2850. [Google Scholar] [CrossRef]
  110. Höpfner, I. Competition and facilitation among grassland plants—The role of arbuscular mycorrhiza. Ph.D. Thesis, Faculty of Biology, University of Bielefeld, Bielefeld, Germany, December 2014. [Google Scholar]
  111. Giovannetti, M.; Mosse, B. An evaluation of techniques for measuring vesicular arbuscular mycorrhizal infection in roots. New Phytol. 1980, 84, 489–500. [Google Scholar] [CrossRef]
  112. Phillips, J.M.; Hayman, D.S. Improved procedures for clearing roots and staining parasitic and vesicular-arbuscular mycorrhizal fungi for rapid assessment of infection. Trans. Br. Mycol. Soc. 1970, 55, 158–161. [Google Scholar] [CrossRef]
  113. Moustaka, J.; Panteris, E.; Adamakis, I.D.S.; Tanou, G.; Giannakoula, A.; Eleftheriou, E.P.; Moustakas, M. High anthocyanin accumulation in poinsettia leaves is accompanied by thylakoid membrane unstacking, acting as a photoprotective mechanism, to prevent ROS formation. Environ. Exp. Bot. 2018, 154, 44–55. [Google Scholar] [CrossRef]
  114. Kalaji, M.H.; Carpentier, R.; Allakhverdiev, S.I.; Bosa, K. Fluorescence parameters as an early indicator of light stress in barley. J. Photochem. Photobiol. B. 2012, 112, 1–6. [Google Scholar] [CrossRef]
  115. Oxborough, K.; Baker, N.R. Resolving chlorophyll a fluorescence images of photosynthetic efficiency into photochemical and non-photochemical components–calculation of qP and Fv′/Fm′ without measuring Fo′. Photosynth. Res. 1997, 54, 135–142. [Google Scholar] [CrossRef]
Figure 1. The chloroplast electron transport chain from photosystem II (PSII) to photosystem I (PSI) and finally to ferredoxin (Fdx) to form NADPH, showing also the creation of singlet oxygen (1O2) via the triplet state of chlorophyll (3chl*), other reactive oxygen species (ROS) formation and scavenging, ATP synthesis and the oxidation at PSII (water-splitting complex) of water to O2, electrons (e), and protons (H+). Electrons are transferred from H2O to NADP+ while accompanying this electron transfer, and a proton gradient is established across the membrane utilized for the synthesis of ATP by the ATP synthase. Light-harvesting complex of PSII (LHCII) absorbs light energy and transfers it to the reaction center of PSII, where excitation of specially bound chlorophyll (Chl) molecules results in transfer of an electron from H2O oxidation to quinone A (QA). The fully reduced quinol molecule (PQH2) picks up two protons from the stroma and is oxidized to a quinone (PQ) and while the electrons are transferred through cytochrome b6f, to plastocyanin (PC) and to PSI, protons are transferred from the stroma to the chloroplast lumen. Shown are the structures of the soluble proteins ferredoxin (Fdx) and ferredoxin-NADP+ reductase (FNR), on the stromal side, that transfer the electrons to NADP+ to form NADPH. When NADP+ is not available (e.g., NADPH is not used in Calvin–Benson–Bassham cycle), electrons are transferred to molecular oxygen (O2) forming superoxide anions (O2) that are converted by the superoxide dismutase (SOD) to hydrogen peroxide (H2O2) that is reduced by ascorbate peroxidase (APX) to water and oxygen. APX uses electrons from ascorbate that are oxidized, but through monodehydroascorbate reductase (MDAR) ascorbate are reduced from NADPH, thus contributing to NADP+ availability [Modified from Biochemistry & Molecular Biology of Plants, second edition 2015, Bob B. Buchanan, Wilhelm Gruissem and Russell L. Jones (eds), John Wiley & Sons, Ltd. (after license)].
Plants 09 00962 g001
Figure 2. The number of leaves (a), the leaf length in cm (b), and the root length in cm (c), of control (non-inoculated) and inoculated Salvia fruticosa plants. Error bars on columns are standard deviations (n = 12). An asterisk (*) represents a significantly different mean between the two treatments by Student’s t-test at a level of p < 0.05.
Plants 09 00962 g002
Figure 3. The stem length in cm (a), the leaf fresh biomass in g per plant (b), and the shoot fresh biomass in g per plant (c), of control (non-inoculated) and inoculated Salvia fruticosa plants. Error bars on columns are standard deviations (n = 12). An asterisk (*) represents a significantly different mean between the two treatments by Student’s t-test at a level of p < 0.05.
Plants 09 00962 g003
Figure 4. The aboveground fresh biomass in g per plant (a), the root fresh biomass in g per plant (b), and the ratio of belowground to aboveground fresh biomass (c), of control (non-inoculated) and inoculated Salvia fruticosa plants. Error bars on columns are standard deviations (n = 12). An asterisk (*) represents a significantly different mean by Student’s t-test at a level of p < 0.05.
Plants 09 00962 g004
Figure 5. The quantum yields of PSII photochemistry (ΦPSII) of regulated non-photochemical energy loss in PSII (ΦNPQ) and of non-regulated energy loss in PSII (ΦNO) of Salvia fruticosa leaves from control (non-inoculated) and inoculated plants. Error bars on columns are standard deviations (n = 6). An asterisk (*) represents a significantly different mean for the same parameter by Student’s t-test at a level of p < 0.05.
Plants 09 00962 g005
Figure 6. The maximum efficiency of PSII photochemistry (Fv/Fm) (a), the efficiency of open PSII reaction centers (Fv’/Fm’) (b), and the efficiency of the water-splitting complex on the donor side of PSII (Fv/Fo) (c), of Salvia fruticosa leaves from control (non-inoculated) and inoculated plants. Error bars on columns are standard deviations (n = 6). An asterisk (*) represents a significantly different mean between the two treatments by Student’s t-test at a level of p < 0.05.
Plants 09 00962 g006
Figure 7. The redox state of plastoquinone pool (qp) which is a measure of the fraction of open PSII reaction centers (a), the non-photochemical quenching (NPQ) that reflects heat dissipation of excitation energy (b), the relative PSII electron transport rate (ETR) (c), and the excess excitation energy (EXC) (d), of Salvia fruticosa leaves from control (non-inoculated) and inoculated plants. Error bars on columns are standard deviations (n = 6). An asterisk (*) represents a significantly different mean between the two treatments by Student’s t-test at a level of p < 0.05.
Plants 09 00962 g007
Figure 8. Representative chlorophyll a fluorescence images of the minimum chlorophyll a fluorescence in the dark-adapted leaf (Fo), the maximum chlorophyll a fluorescence in the dark-adapted leaf (Fm), and the maximum efficiency of PSII photochemistry (Fv/Fm) of Salvia fruticosa leaves from control (non-inoculated) and inoculated plants. The color code depicted at the right side of the image ranges from black (pixel values 0.0) to purple (1.0). The nine areas of interest (AOI) are shown in each image. The average value (±SD) of the whole leaf for each parameter is shown.
Plants 09 00962 g008
Figure 9. Representative chlorophyll a fluorescence images of the effective quantum yield of PSII photochemistry (ΦPSΙΙ), the quantum yield of regulated non-photochemical energy loss in PSII (ΦNPQ), and the quantum yield of non-regulated energy loss in PSII (ΦNO) of Salvia fruticosa leaves from control (non-inoculated) and inoculated plants. The color code depicted at the right side of the image ranges from values 0.1 to 0.6. The nine areas of interest (AOI) are shown in each image. The average value (± SD) of the whole leaf for each parameter is shown.
Plants 09 00962 g009
Figure 10. A typical modulated fluorescence trace using dark-adapted leaf material showing how Fo, Fm, Fo’, Fm’ and Fs are formed to measure photochemical and non-photochemical parameters. In the dark-adapted state, a “measuring light” is switched on that is of too low intensity to induce electron transport through PSII but high enough to elicit the minimal level of chlorophyll fluorescence, termed Fo. A brief saturating pulse of light results in the formation of the maximum yield of fluorescence, Fm. The difference between Fm and Fo is the variable fluorescence, Fv. The ratio Fv/Fm is indicator of the maximum quantum yield of PSII photochemistry. The application of saturating pulses under actinic light illumination closes all the reaction centers and provides the maximum fluorescence in the light-adapted state, termed Fm’. The steady-state level of fluorescence in the light is termed Fs and is measured immediately before switching off the actinic light. Fo’ is measured immediately after switching off the actinic light. The difference between Fm’ and Fo’ is the variable fluorescence, Fv’. The ratio Fv’/Fm’ is an indicator of the efficiency of excitation energy captured by open PSII reaction centers.
Plants 09 00962 g010
Table 1. The composition of the nutrient solution used in the experiment (pH 6.5).
Nutrient ElementsStock Solution (g L-1)Used in Nutrient Solution (ml L-1)
KH2PO432.932.00
K2SO429.072.00
MgSO4.7H2O30.424.00
CaCl2.2H2O11.004.00
NH4NO356.005.00
MnCl2.4H2O1.4431.00
NaMoO4.2H2O0.0181.00
H3BO30.0181.00
CuSO4.5H2O0.0081.00
ZnSO4.7H2O1.441.00
FeSO4.7H2O + + Titriplex III EDTA7.00+9.301.00

