Cation Doping Approach for Nanotubular Hydrosilicates Curvature Control and Related Applications


1
Ioffe Institute, St. Petersburg 194021, Russia
2
Grebenshchikov Institute of Silicate Chemistry of the RAS, St. Petersburg 199034, Russia
*
Author to whom correspondence should be addressed.
Crystals 2020, 10(8), 654; https://doi.org/10.3390/cryst10080654
Submission received: 29 June 2020
/
Revised: 25 July 2020
/
Accepted: 29 July 2020
/
Published: 30 July 2020
(This article belongs to the Special Issue Synthesis, Structure, and Properties of Inorganic Nanotubes)
Abstract
:The past two decades have been marked by an increased interest in the synthesis and the properties of geoinspired hydrosilicate nanoscrolls and nanotubes. The present review considers three main representatives of this group: halloysite, imogolite and chrysotile. These hydrosilicates have the ability of spontaneous curling (scrolling) due to a number of crystal structure features, including the size and chemical composition differences between the sheets, (or the void in the gibbsite sheet and SiO2 tetrahedron, in the case of imogolite). Mineral nanoscrolls and nanotubes consist of the most abundant elements, like magnesium, aluminium and silicon, accompanied by uncontrollable amounts of impurities (other elements and phases), which hinder their high technology applications. The development of a synthetic approach makes it possible to not only to overcome the purity issues, but also to enhance the chemical composition of the nanotubular particles by controllable cation doping. The first part of the review covers some principles of the cation doping approach and proposes joint criteria for the semiquantitative prediction of morphological changes that occur. The second part focuses on some doping-related properties and applications, such as morphological control, uptake and release, magnetic and mechanical properties, and catalysis.
1. Introduction
The year 2020 can be considered as the 90th anniversary of inorganic nanotubes. In 1930, L. Pauling [1] assumed the ability of certain hydrosilicate layers to curve because of size differences between alternating sheets. Following the development of electron microscopes, the tubular morphology of halloysite and chrysotile minerals was successfully visualised in 1949–1950 [2,3,4]. In the next decades, the geoinspired synthetic experiments, X-ray diffraction and microscopic studies of R. Roy and D.M. Roy [5], J.C.-S. Yang [6], H. Saito and I. Yamai [7,8], K. Yada and K. Iishi [9], and E.J.W. Whittaker [10,11,12,13] contributed greatly to hydrosilicate nanotubes’ classification and the understanding of their growth mechanism. The third nanotubular mineral that will be considered in this review was discovered and synthesised a little later [14,15,16]. Revealing imogolite’s tubular morphology was more challenging than with chrysotile and halloysite because of the substantially smaller size of the former. Despite such a long history of the study of tubular hydrosilicate particles, the famous term ‘nanotube’ only appeared after the carbon nanotubes’ observations made by S. Iijima [17], and this was related, perhaps, to the remarkable progress that had been made in electronic component miniaturisation.
The aim of the present review was, first, to look at chrysotile, halloysite and imogolite as related hydrosilicates, whose formation process, growth, and specific morphology obey similar rules. For example, the hydrothermal synthesis of halloysite nanotubes is still very complicated and most published papers have used halloysite mineral for a variety of applications. It might be argued that the mineral is available in large amounts, but this does not excuse the lack of synthetic results. We believe that a comparative study of the related hydrosilicates will help to reveal, and probably overcome, that hindrance.
Second, pristine chrysotile, halloysite and imogolite nanotubes contain Mg, Al and Si cations, which can be substituted by other elements during a synthetic experiment. We hope that the joint consideration of the three hydrosilicates will promote an exchange of ideas and approaches to their synthesis. Moreover, since the cation type and content are among the key factors of morphology control, it is important to reveal regularities and possible limitations of cation doping of the hydrosilicate layer.
Third, a general aim of cation doping is to confer a new property on the hydrosilicate nanotube, so this should be discussed as well.
In accordance with these aims, the present review consists of three sections, in addition to the Introduction and Conclusion. Section 2 is devoted to an overview of hydrosilicates’ structural modelling and the contemporary principles of the cation doping approach. Section 3 considers synthesis and some cation doping-related morphological effects. Section 4 reviews a number of properties and applications of cation doped hydrosilicate nanotubes and nanoscrolls. We will use both the term ‘nanotube’ and ‘nanoscroll’, because both forms of cross-section can be observed for hydrosilicates. ‘Nanoscroll’ is more appropriate when a is model based on a spiral form, or when a formation mechanism via scrolling, is considered.
2. Principles of Curvature Control
2.1. Crystal Structure and the Origin of Strain
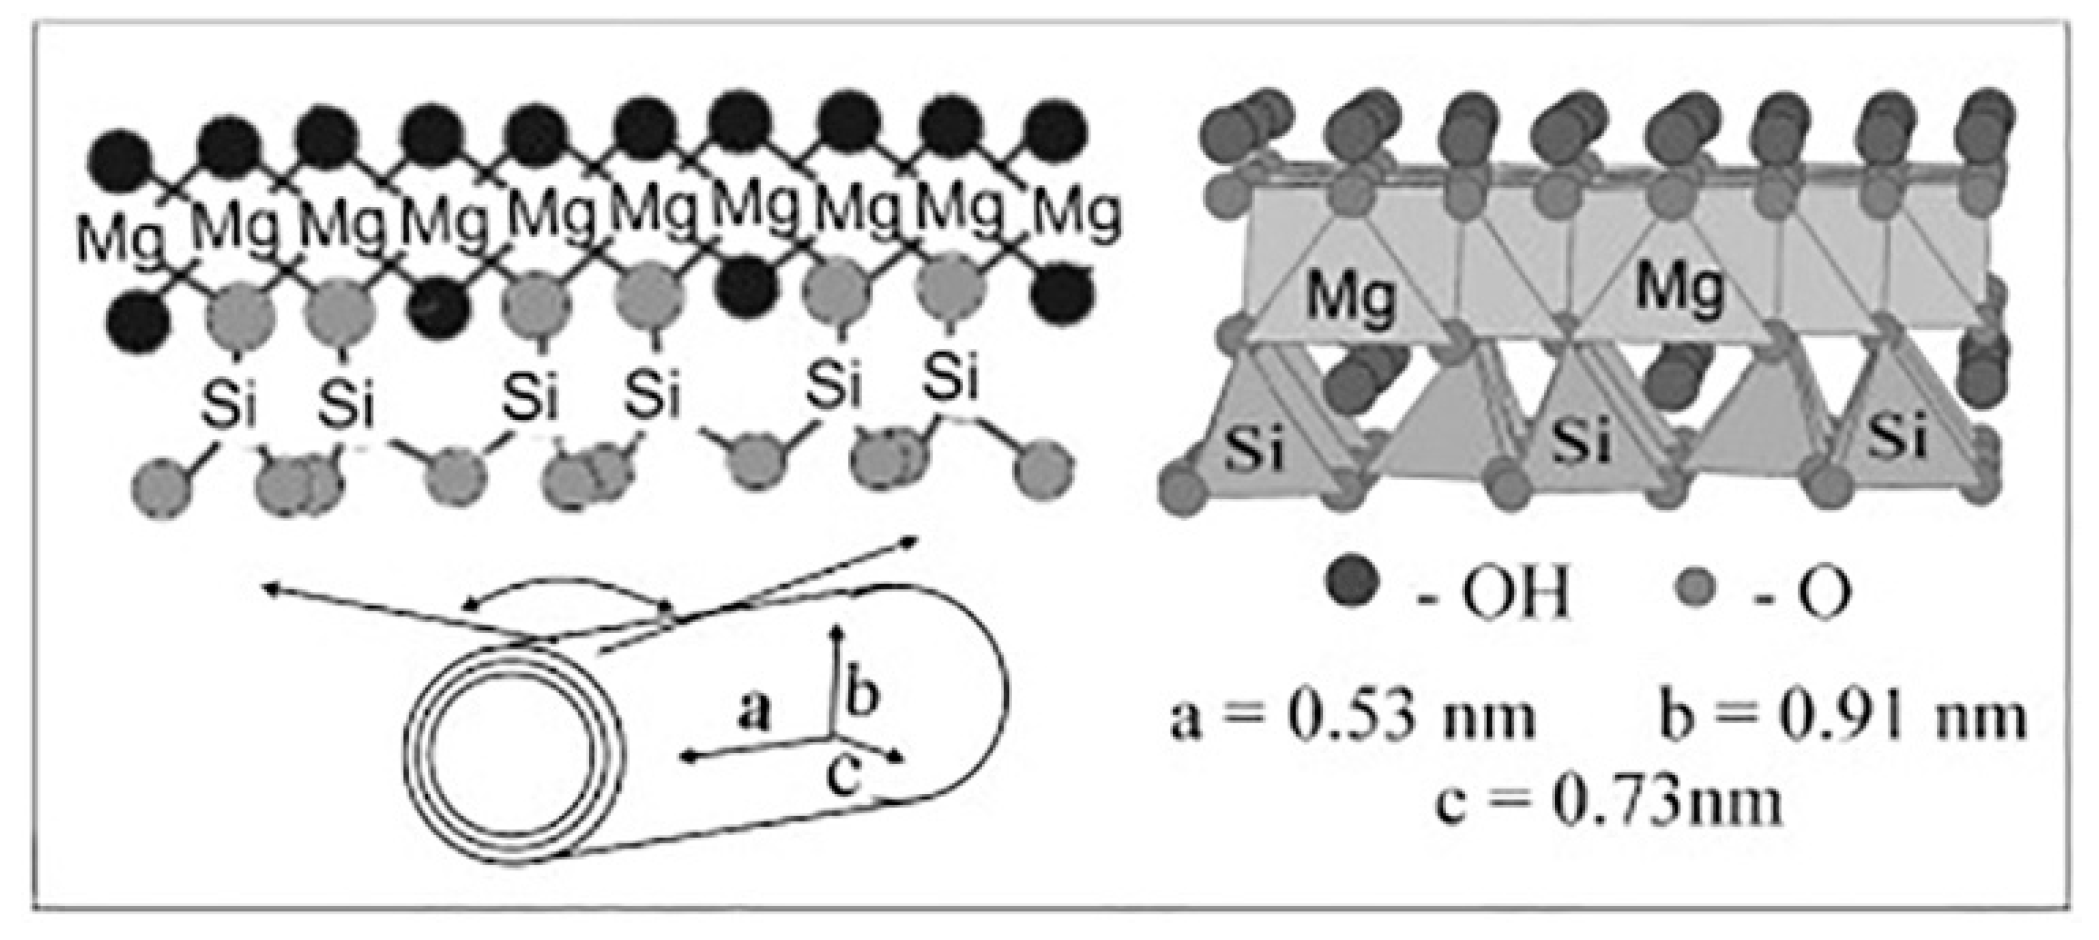
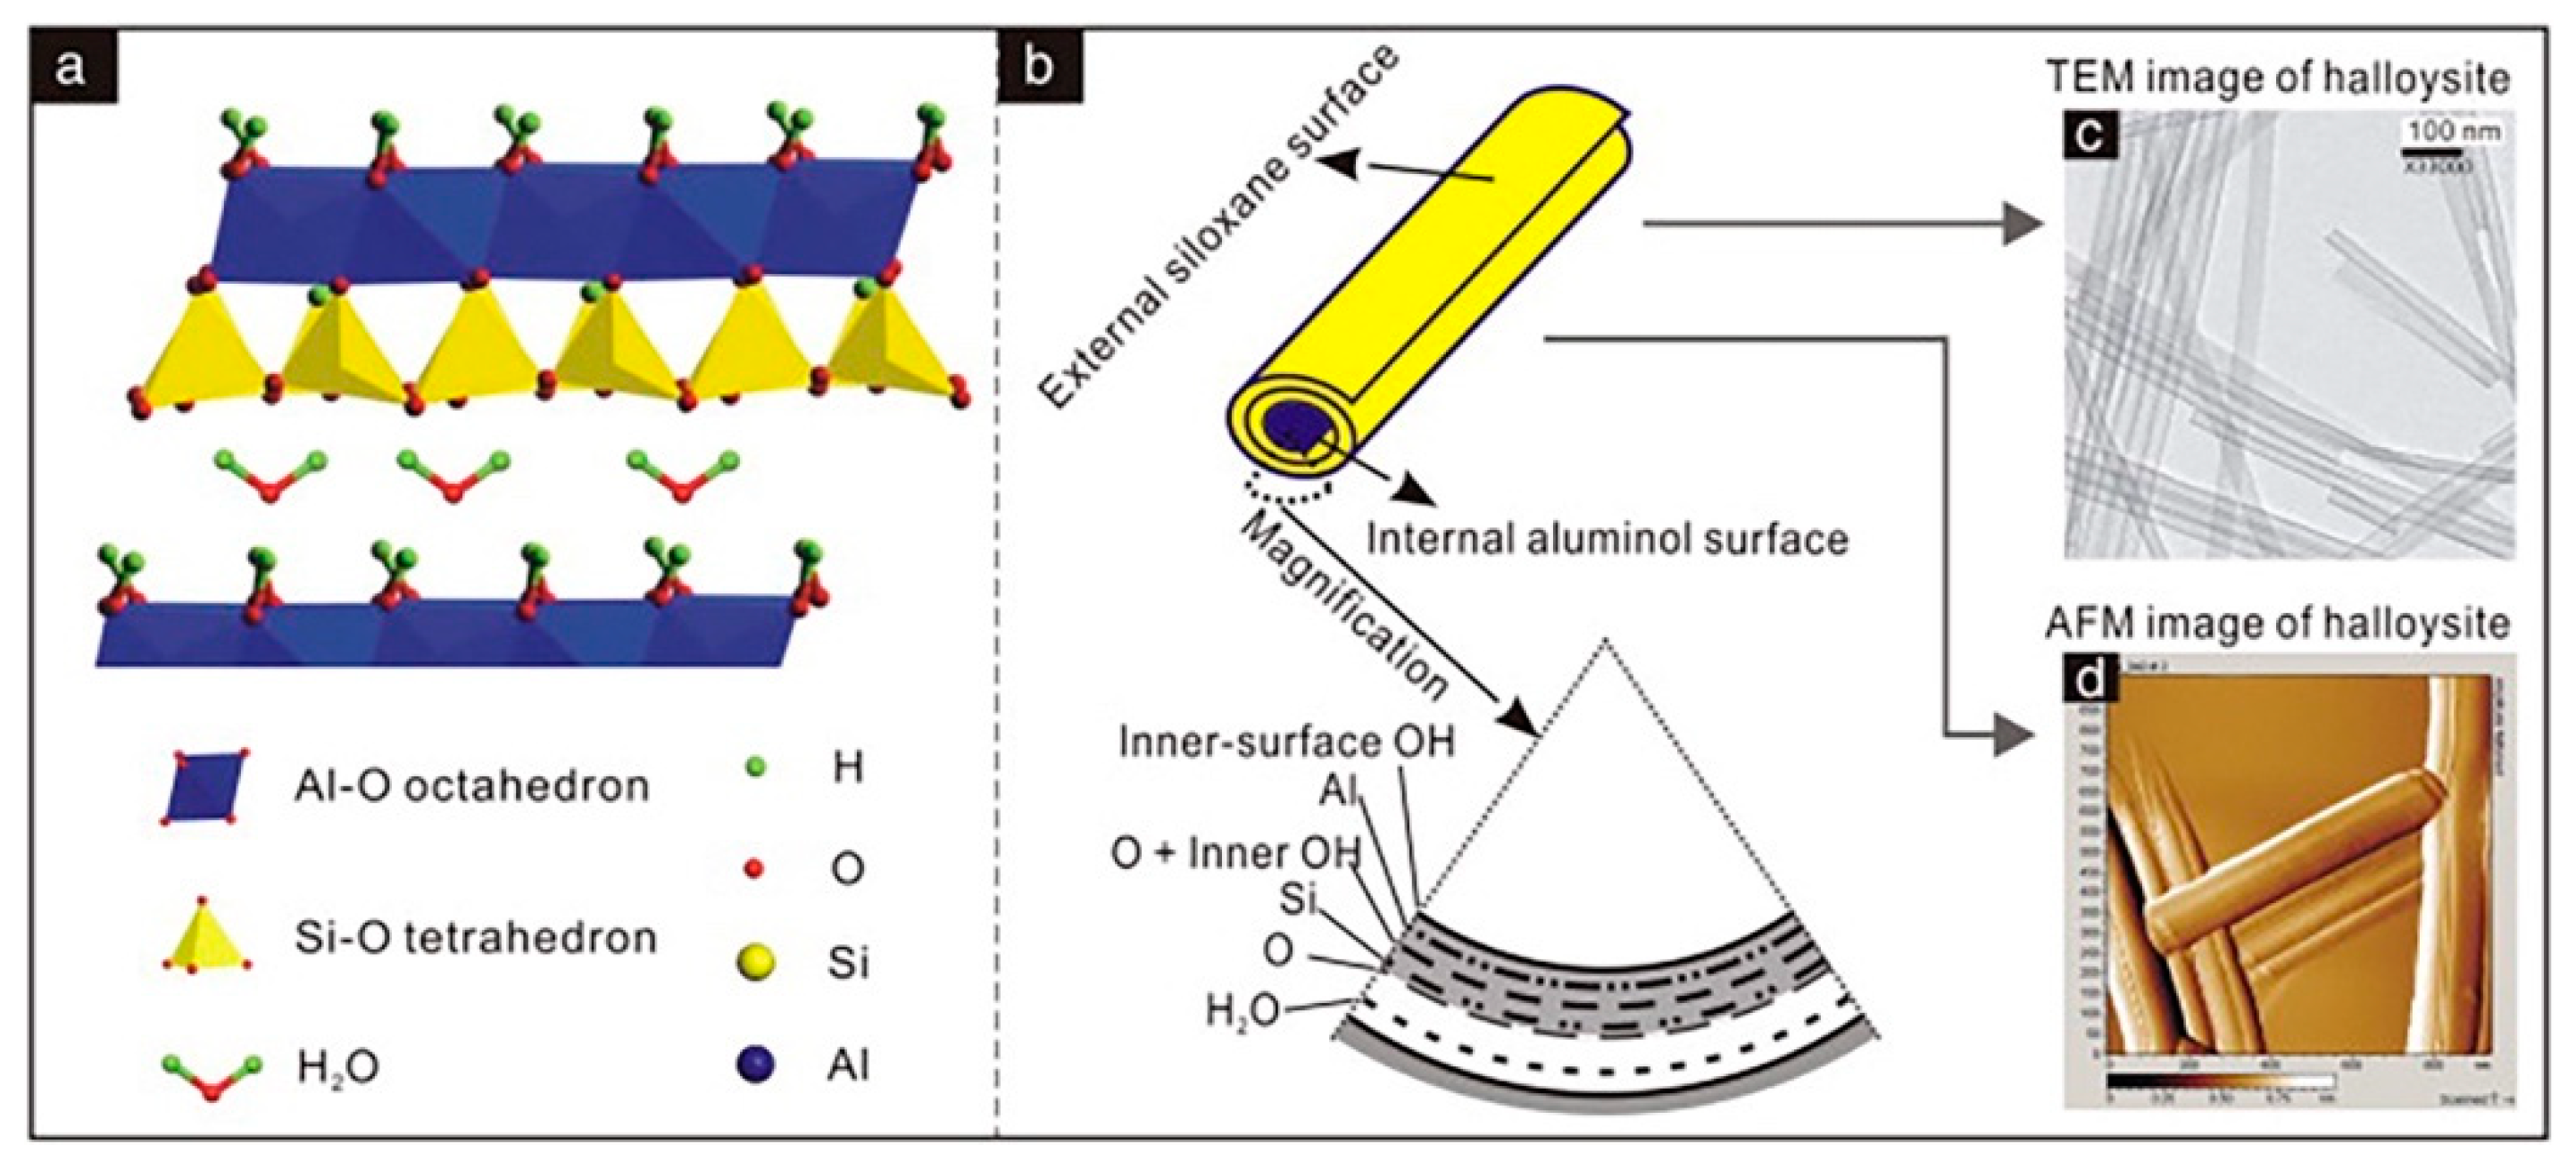
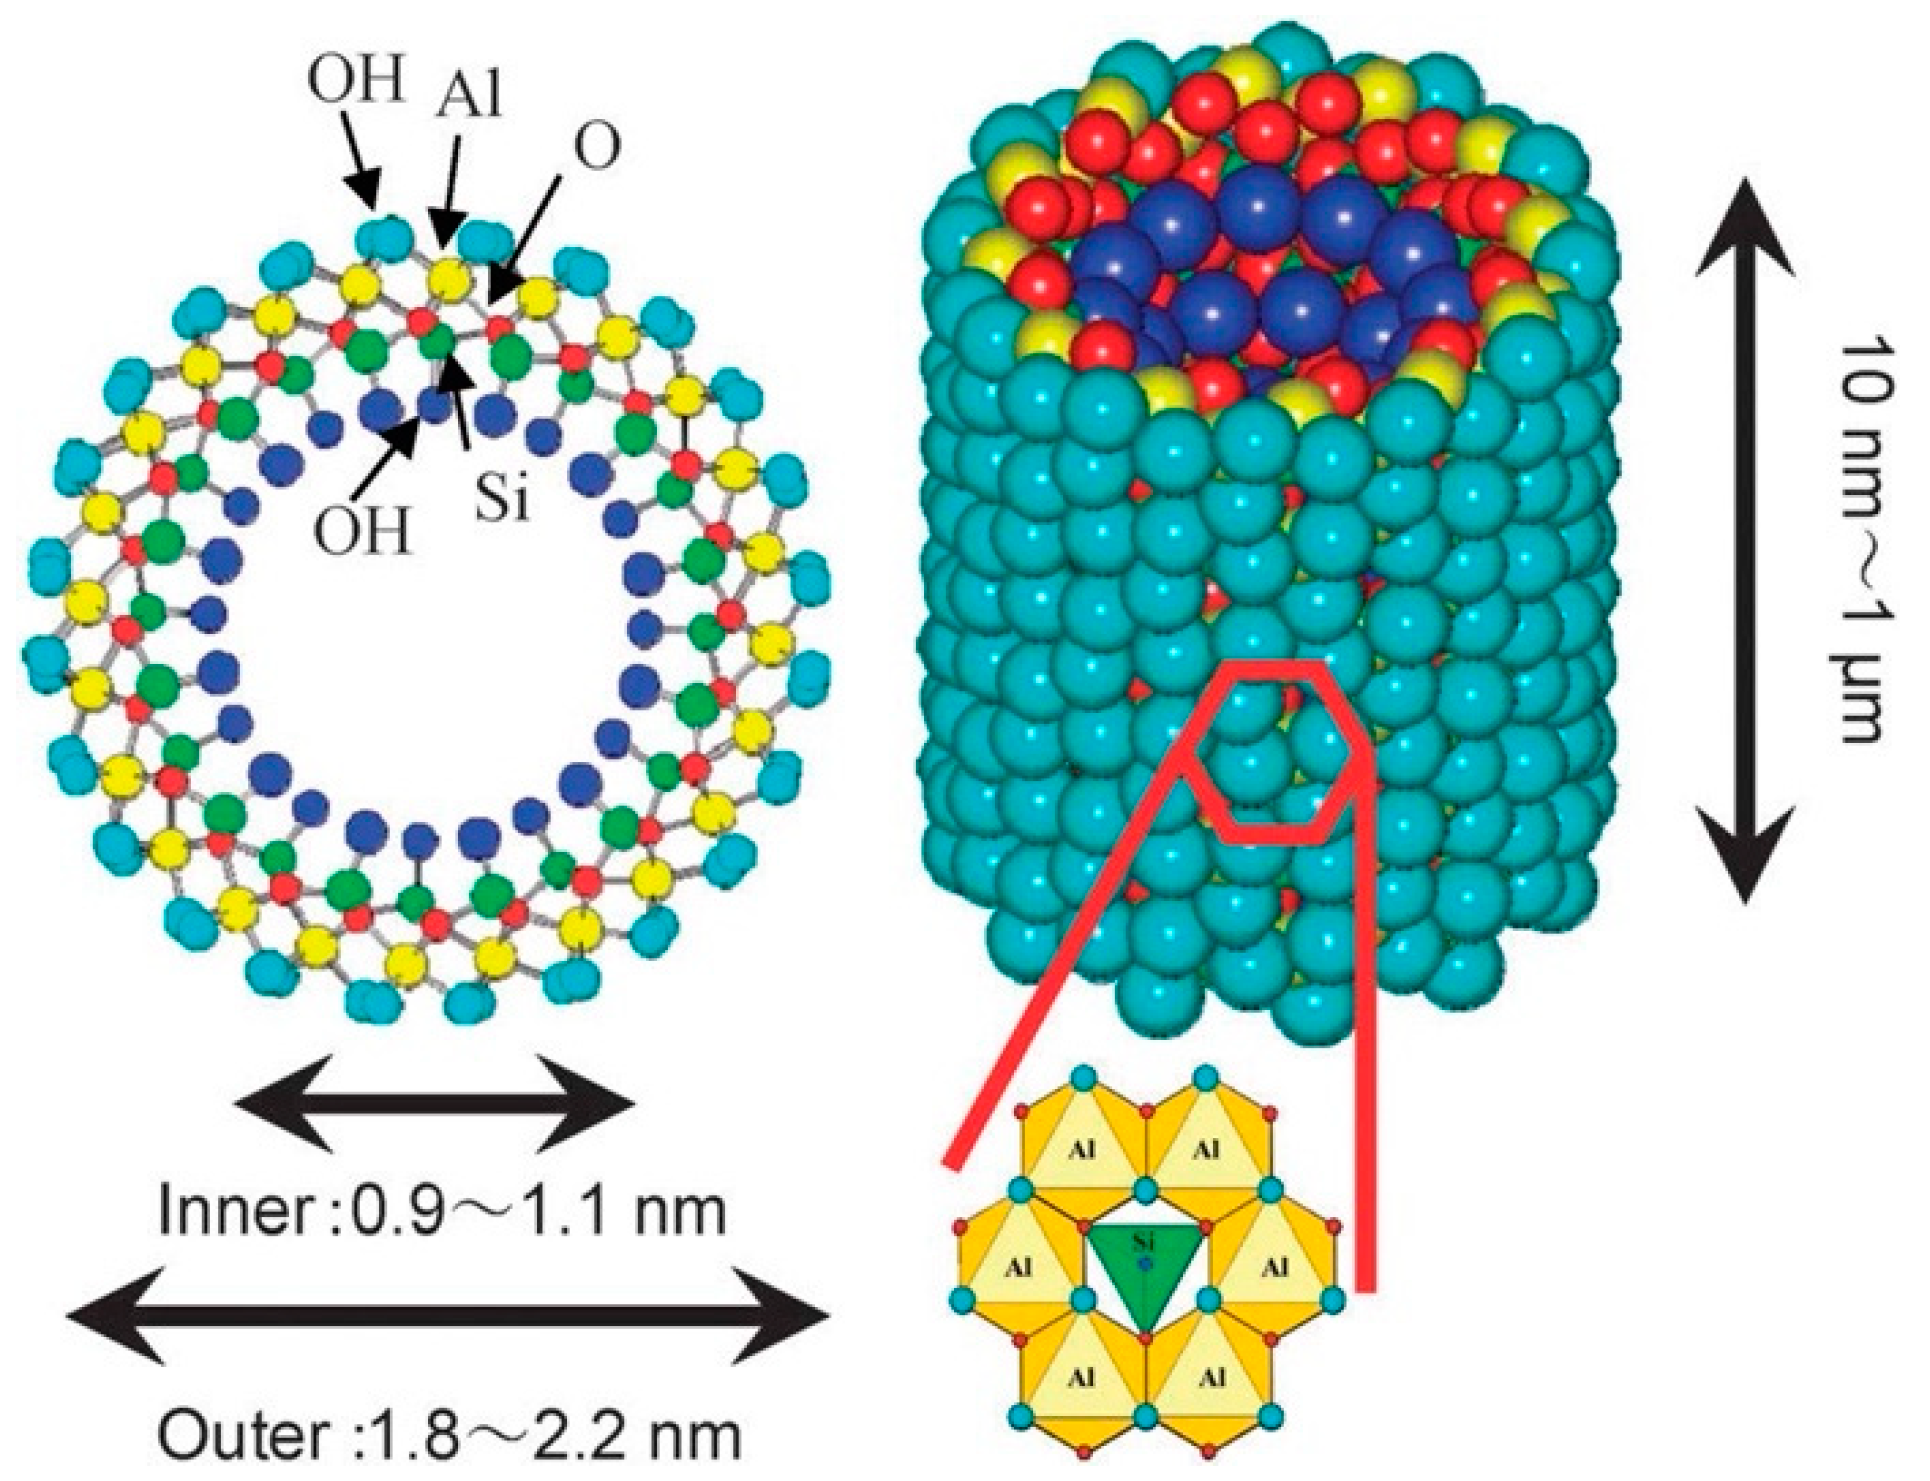
The crystal structures of chrysotile, halloysite and imogolite are wrapped around the very similar idea of the joining of two different polyhedral motives or sheets. In the case of chrysotile, these sheets are brucite-like octahedrons and a pseudohexagonal network of silica tetrahedrons (Figure 1). A gibbsite-like octahedral sheet constitutes halloysite (Figure 2) and imogolite (Figure 3) layers. The latter has silica tetrahedrons separated from one another. At first glance, it would seem that structural variations in those hydrosilicates are insignificant, but they suddenly lead to striking differences in morphology. First, it is the direction of the layer’s bending: chrysotile and imogolite curve in such a manner that the octahedral sheet becomes the outer one, while in the case of halloysite, this sheet becomes the inner one. Moreover, only imogolite tends to form single-walled nanotubes, whereas chrysotile and halloysite are multi-walled, and sometimes this wall consists of tens of layers. Adjacent layers are directly joined together by hydrogen bonding, but sometimes, in halloysite there is an additional buffer layer of water molecules situated in between (Figure 2) that increases the interlayer period. This structural modification is called 10 Å-halloysite, whereas its dehydrated version (with a period similar to chrysotile) is called 7 Å-halloysite [18]. It is intriguing that reports on a possibly hydrated version of chrysotile are absent. The morphological diversity of those three hydrosilicates goes beyond tubular morphology. To date, platy lizardite [19] and kaolinite [20] are known to be platy analogues of chrysotile and halloysite. Spherical allophane [21,22] and polyhedral endellite [23,24] could form instead from tubular imogolite and halloysite, whereas chrysotile has its polygonal variation [25,26,27].
According to recent structural studies, chrysotile is a monoclinic Cc space group with lattice constants nm, nm and nm, ° [30]. Its cell consists of two layers in the c direction. Zhang et al. [31] assigned triclinic P1 group to 7 Å-halloysite with lattice constants nm, nm and nm (one layer in the cell), °, ° and °. All of these values were obtained by crystal structure refinement using wide-angle X-ray scattering. Demichelis et al. [32] proposed to use the gibbsite ( nm, nm, °) cell as an initial approximation for imogolite for ab initio calculations. An interpretation of X-ray patterns in the case of imogolite involved the supercells of nanotube aggregates [33,34]. Alvarez-Ramírez [34] also attempted to optimise a hypothetical flat imogolite unit cell using the Density Functional Theory (DFT) approach and revealed that the parameters nm and nm were less than that of gibbsite.
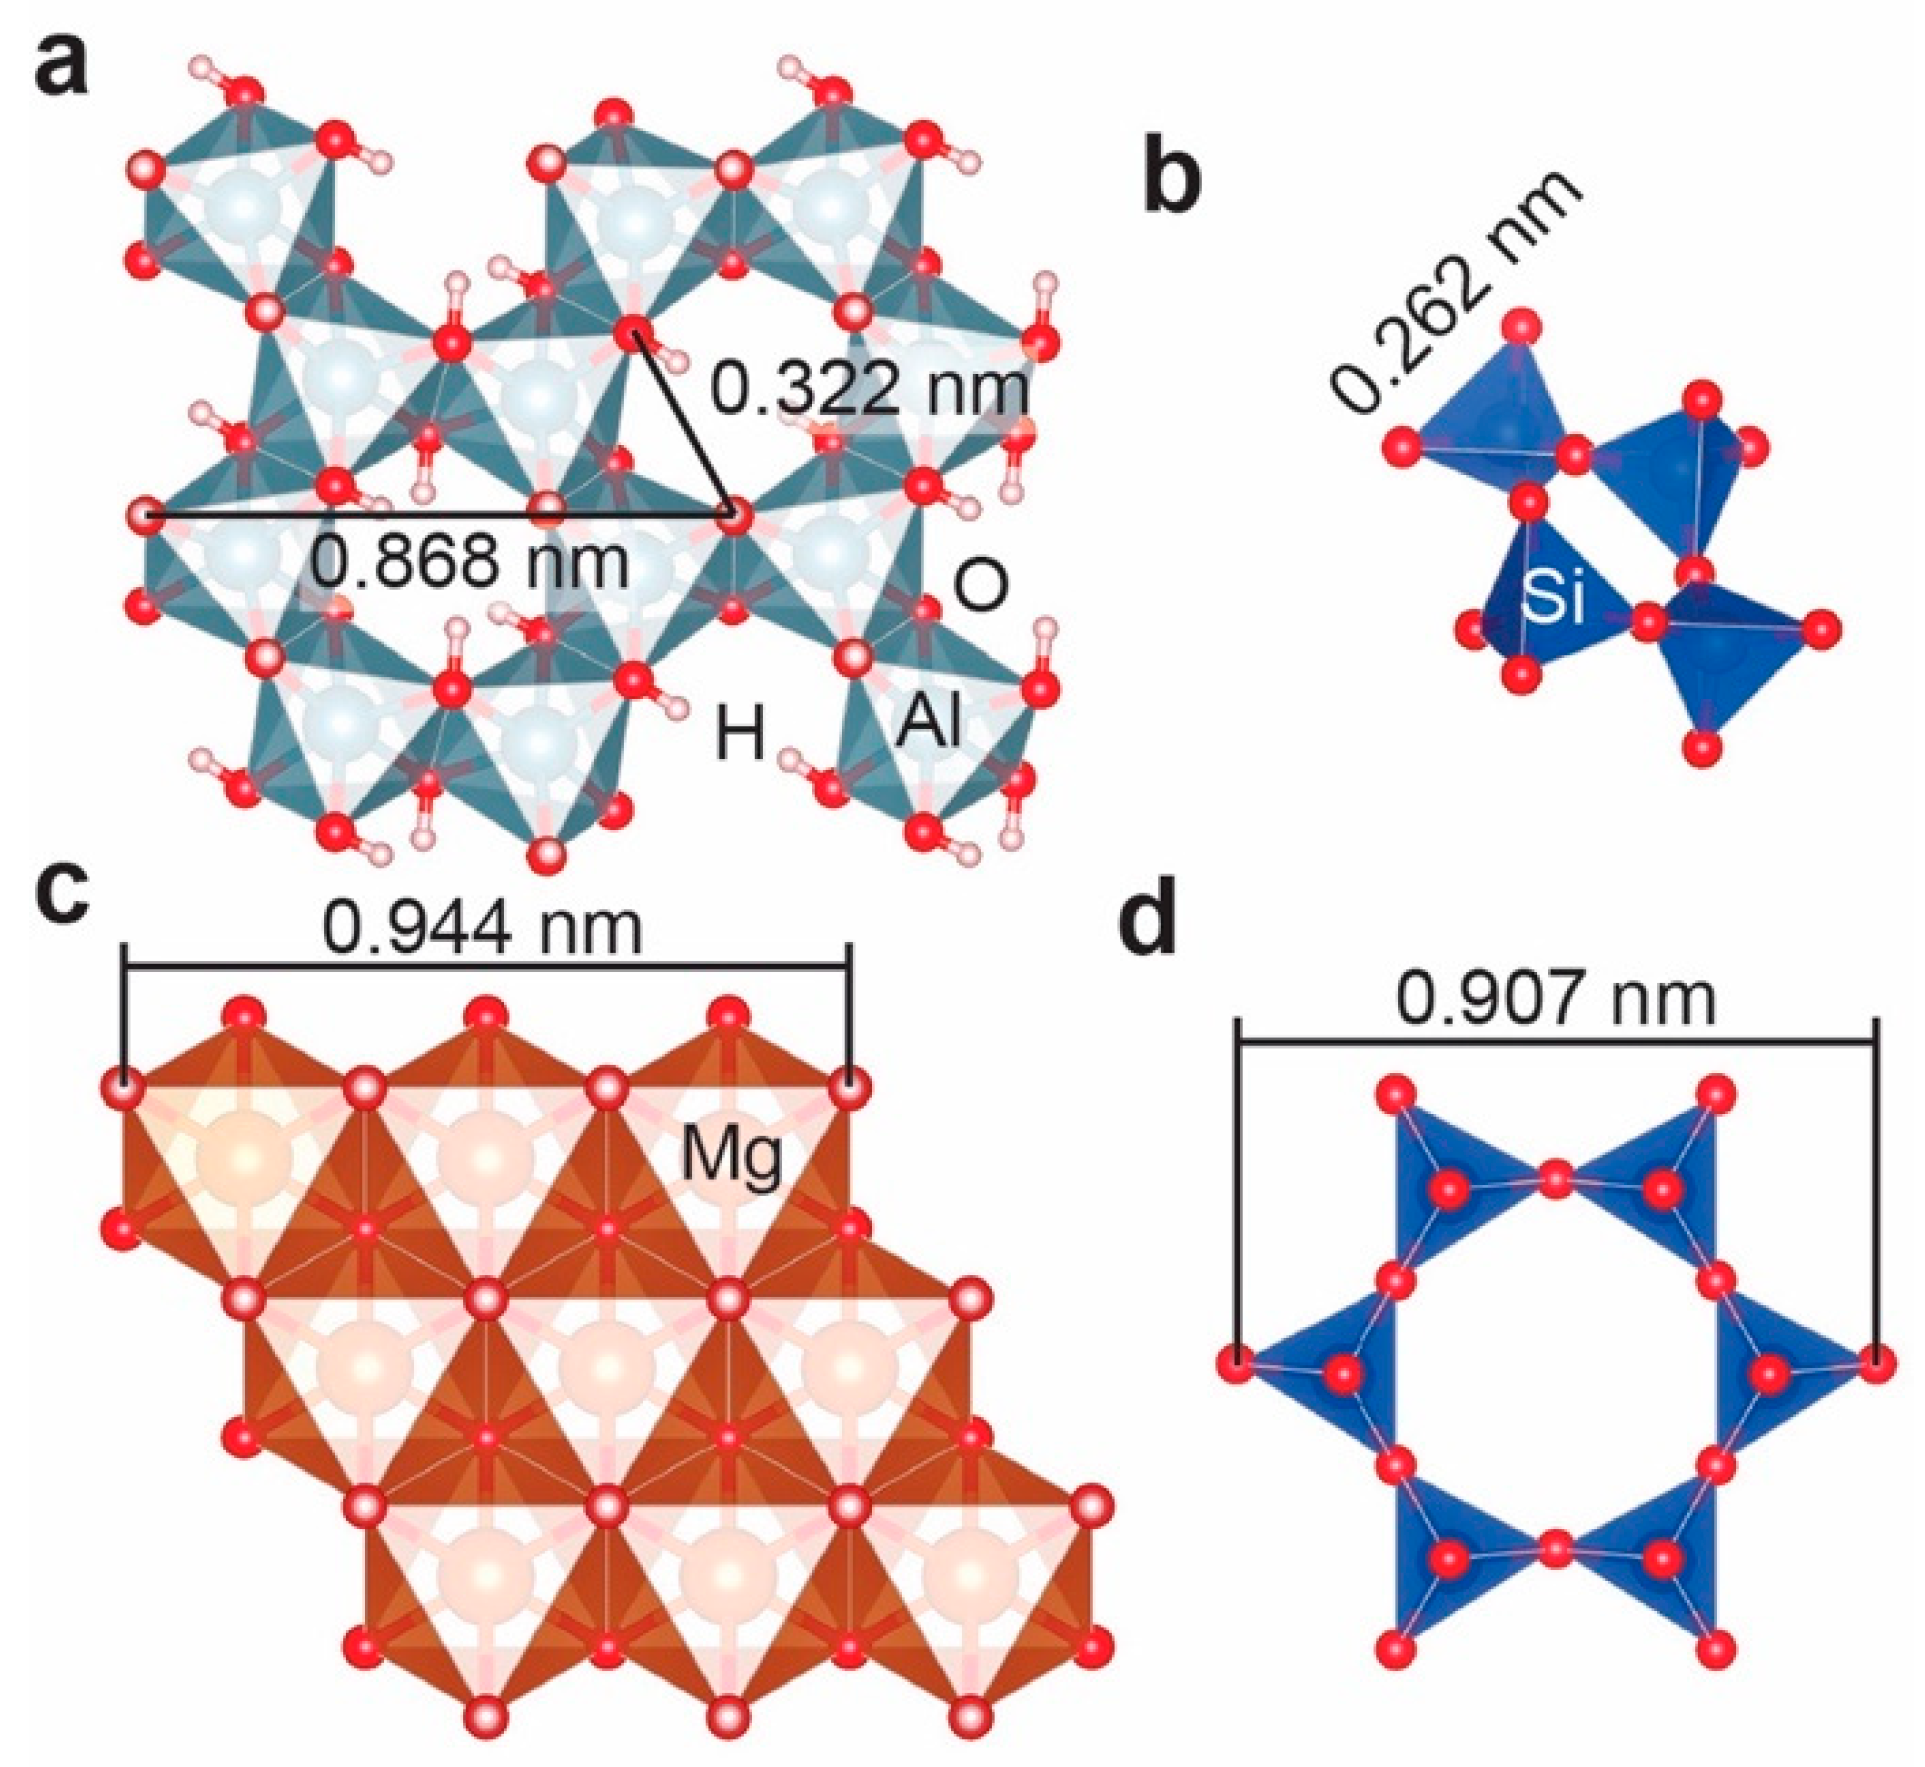
In order to reveal the origin of strain and curvature in those hydrosilicates, the initial structures of the sheets should be compared prior their chemical bonding. Figure 4 shows principal hydrosilicate building blocks. An estimation of the average cavity size in the Al(OH)3 layer [35] as the distance between oxygen ions that would be shared between octahedra and tetrahedra yielded a value of 0.322 nm. The same procedure carried out for SiO2 cristobalite tetrahedra [36] resulted in a value of 0.262 nm. The pseudohexagonal network of SiO2 tetrahedra constructed on that basis would have a specific size of 0.907 nm. A comparison of these values with the specific sizes of Mg(OH)2 (0.944 nm [37]) and Al(OH)3 (0.864 nm) would lead to the conclusion that there is a substantial size difference between the structural elements which has to be overcome somehow. Moreover, this basic comparison enables the prediction of the main direction of scrolling, assuming that it is a means of size difference compensation.
The main principle of curvature control by cation doping relies on the idea that substitution will change the specific size of polyhedrons (sheets) and in turn, the preferred curvature of the layer.
2.2. An Overview of Nanotube Modelling
Although tubular particles were visualised by a transmission electron microscope in 1949–1950 [4], nanotube modelling advanced greatly after the observation of carbon nanotubes [17] and the discovery of their mechanical, electronic and morphological properties. This section considers two groups of models, divided by the principle of continuity. The first group includes the DFT and molecular dynamics (MD) approaches, which rely on precise nanotube crystal structure optimisation. Conversely, the second group of phenomenological modelling considers the layer as a continuous medium with a number of parameters and applies the equations obtained for macroscopic processes at the nanoscale or operates with time-dependent kinetic equations. Both groups have their strengths and weaknesses, which will be highlighted below. We also recommend the book section, written by A. Enyashin [40], that considers recent advances in the modelling of inorganic nanotubes.
2.2.1. DFT and MD ‘Microscopic’ Models
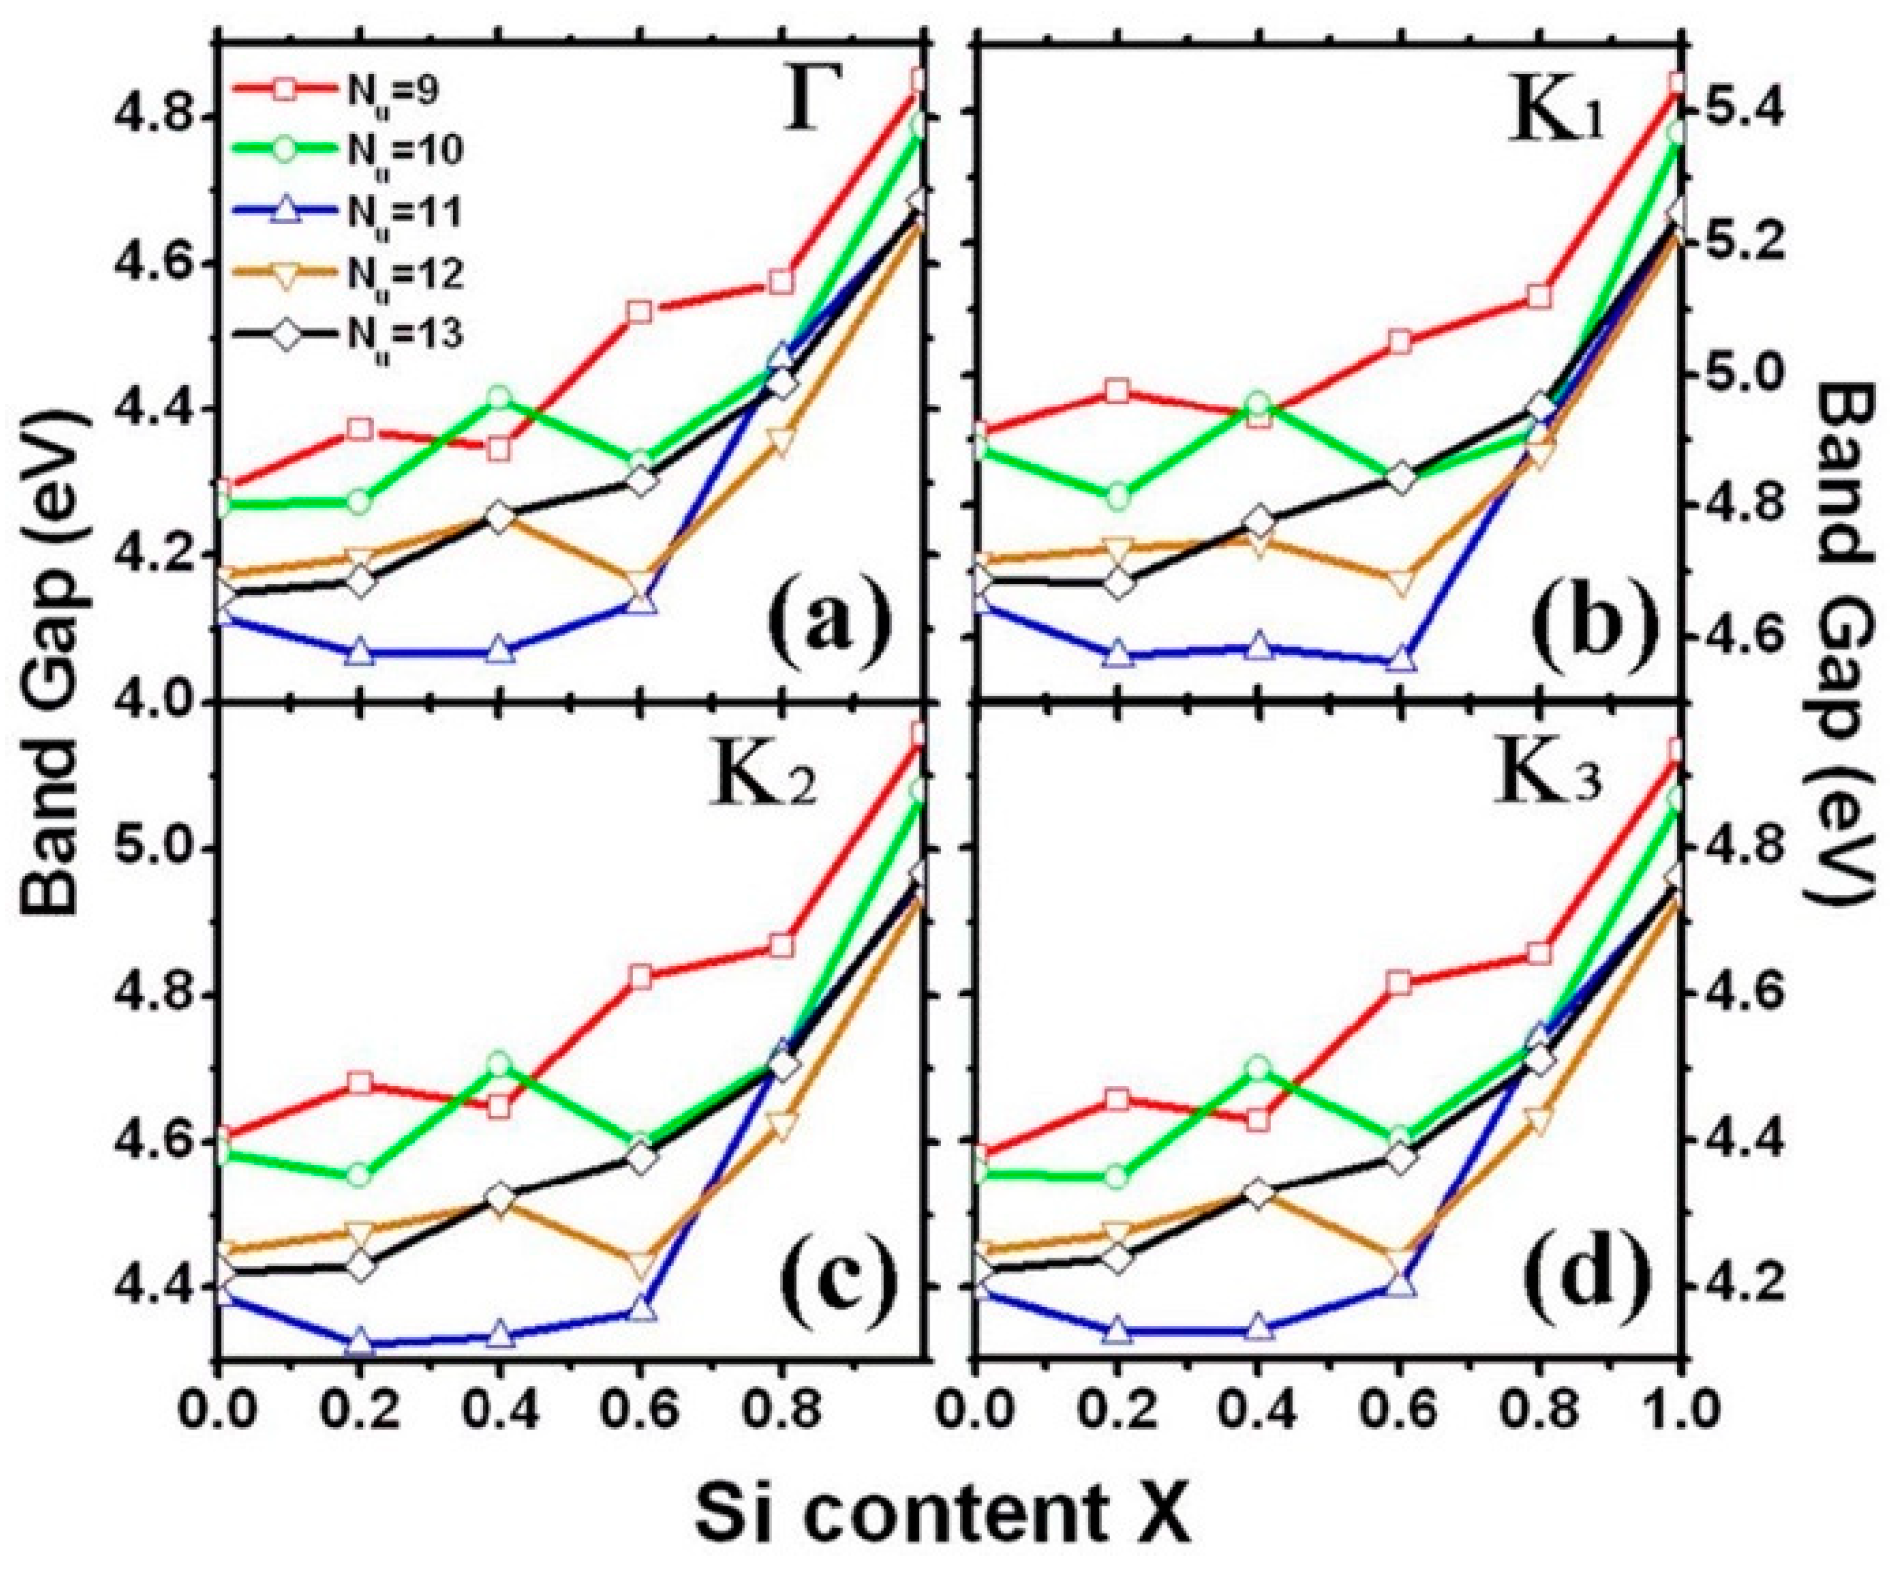
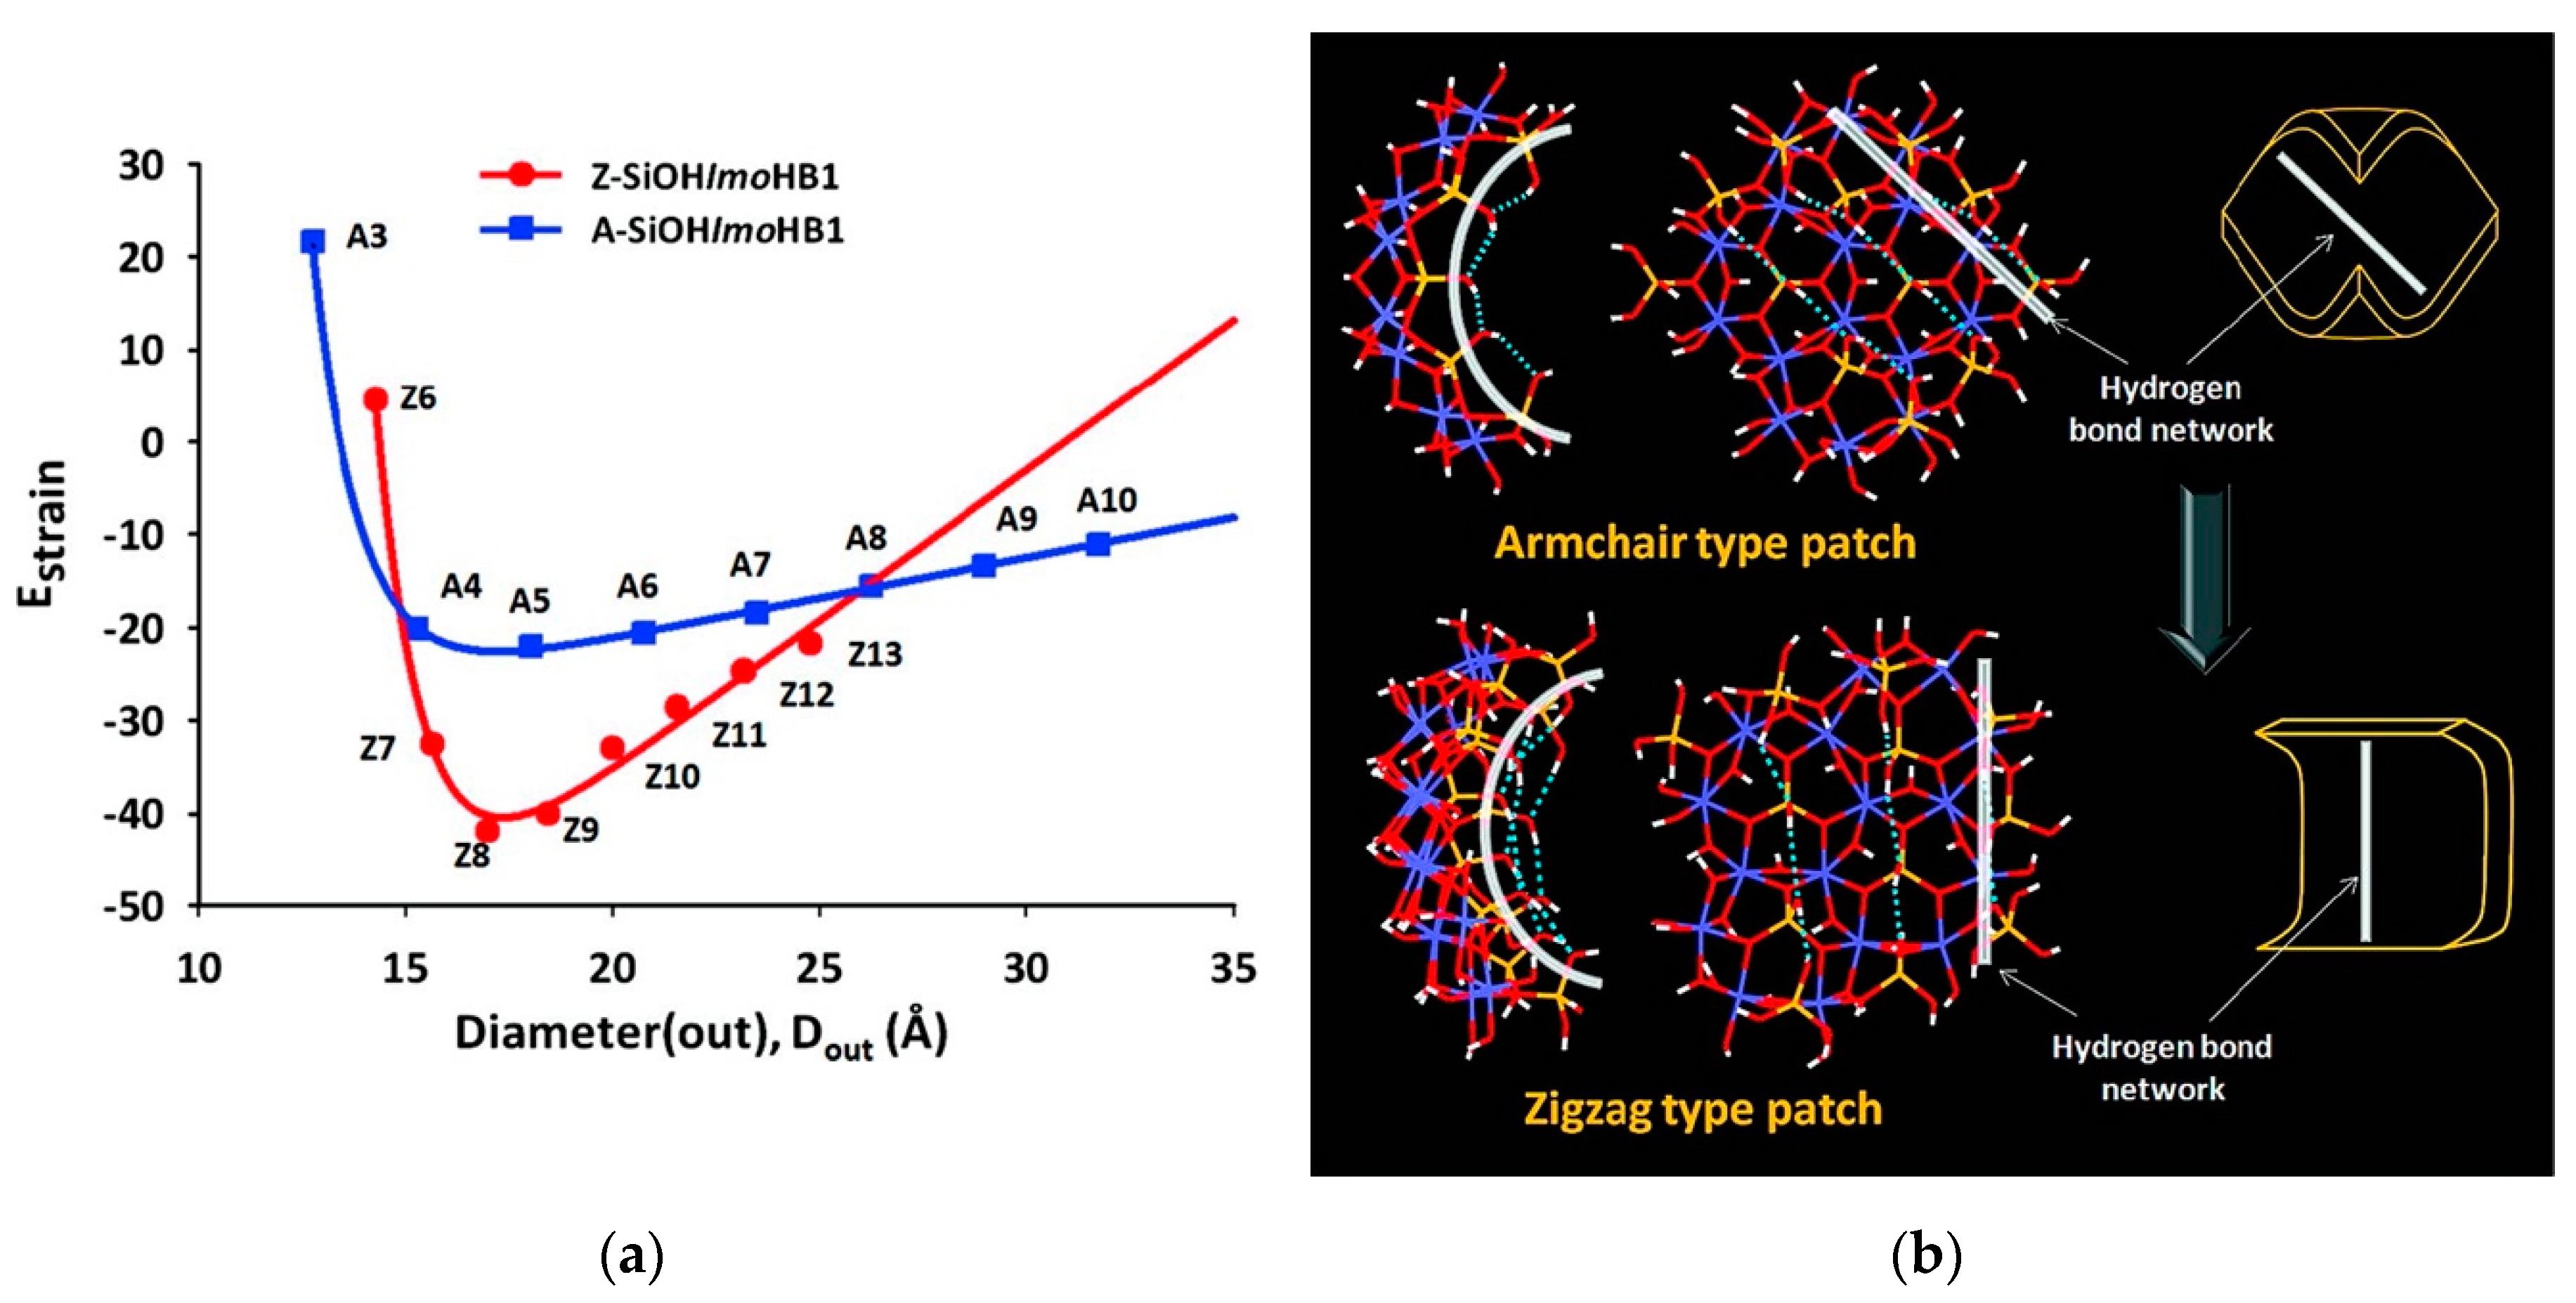
We would like to start with an overview of the modelling of imogolite as the smallest nanotube. Its small size has facilitated computations, there being no need to involve large cells in order to achieve good agreement with the experiment. Early works that involved DFT and MD approaches were focused on preferable cross-section geometry. Konduri et al. [41] reported a single-walled imogolite nanotube diameter of 1.98 nm based on aluminium atoms and an outer diameter of 2.26 nm, whereas experimental evidence suggested that this should be 2.2 nm. The authors also calculated the dependence of radial breathing mode frequency, which could be useful for the spectroscopic characterisation of imogolite. The work [34] considered the band gap X-ray scattering and vibrational frequency evolution in (OH)3Al2O3(SixGe1–x)OH imogolite nanoscrolls. The author demonstrated that Si to Ge substitution decreased the band gap value in a number of wave vector points (Figure 5). X-ray diffraction simulations revealed that the pattern depended more on the model nanotube radius than on the Si content. Guimarães et al. [42] adopted the concept of the chirality vector to study structure optimisation and the electronic and mechanical properties of zigzag- and armchair-type imogolites. The authors reported a substantial zigzag imogolite strain energy preference. The preferred curvature radius of 1 nm was in good correlation with results reported in [41]. The estimated Young’s modulus of zigzag imogolite of different radii varied from 175 to 479 GPa. The calculations yielded a very high band gap value of 10 eV for imogolite. The work of Demichelis et al. [32] and Lee et al. [43] was focused on the role of hydroxyl groups in imogolite shaping. The authors showed that the energy difference between the two chirality types could be explained by the energy preference in the hydrogen bond network arrangement on imogolite surfaces (Figure 6). The proper orientation of hydrogen bonds could provide an additional 2.0 kJ/mol of preference per formula unit of zigzag imogolite. Moreover, Lee et al. [43] obtained the preferable imogolite diameter of 1.7 nm (zigzag nanotubes), which was a bit smaller than those reported in [32,41,42]. Perhaps, the hydrogen bond network can not only favour zigzag-imogolite formation, but bend the layer in addition to the action of size difference between the sheets.
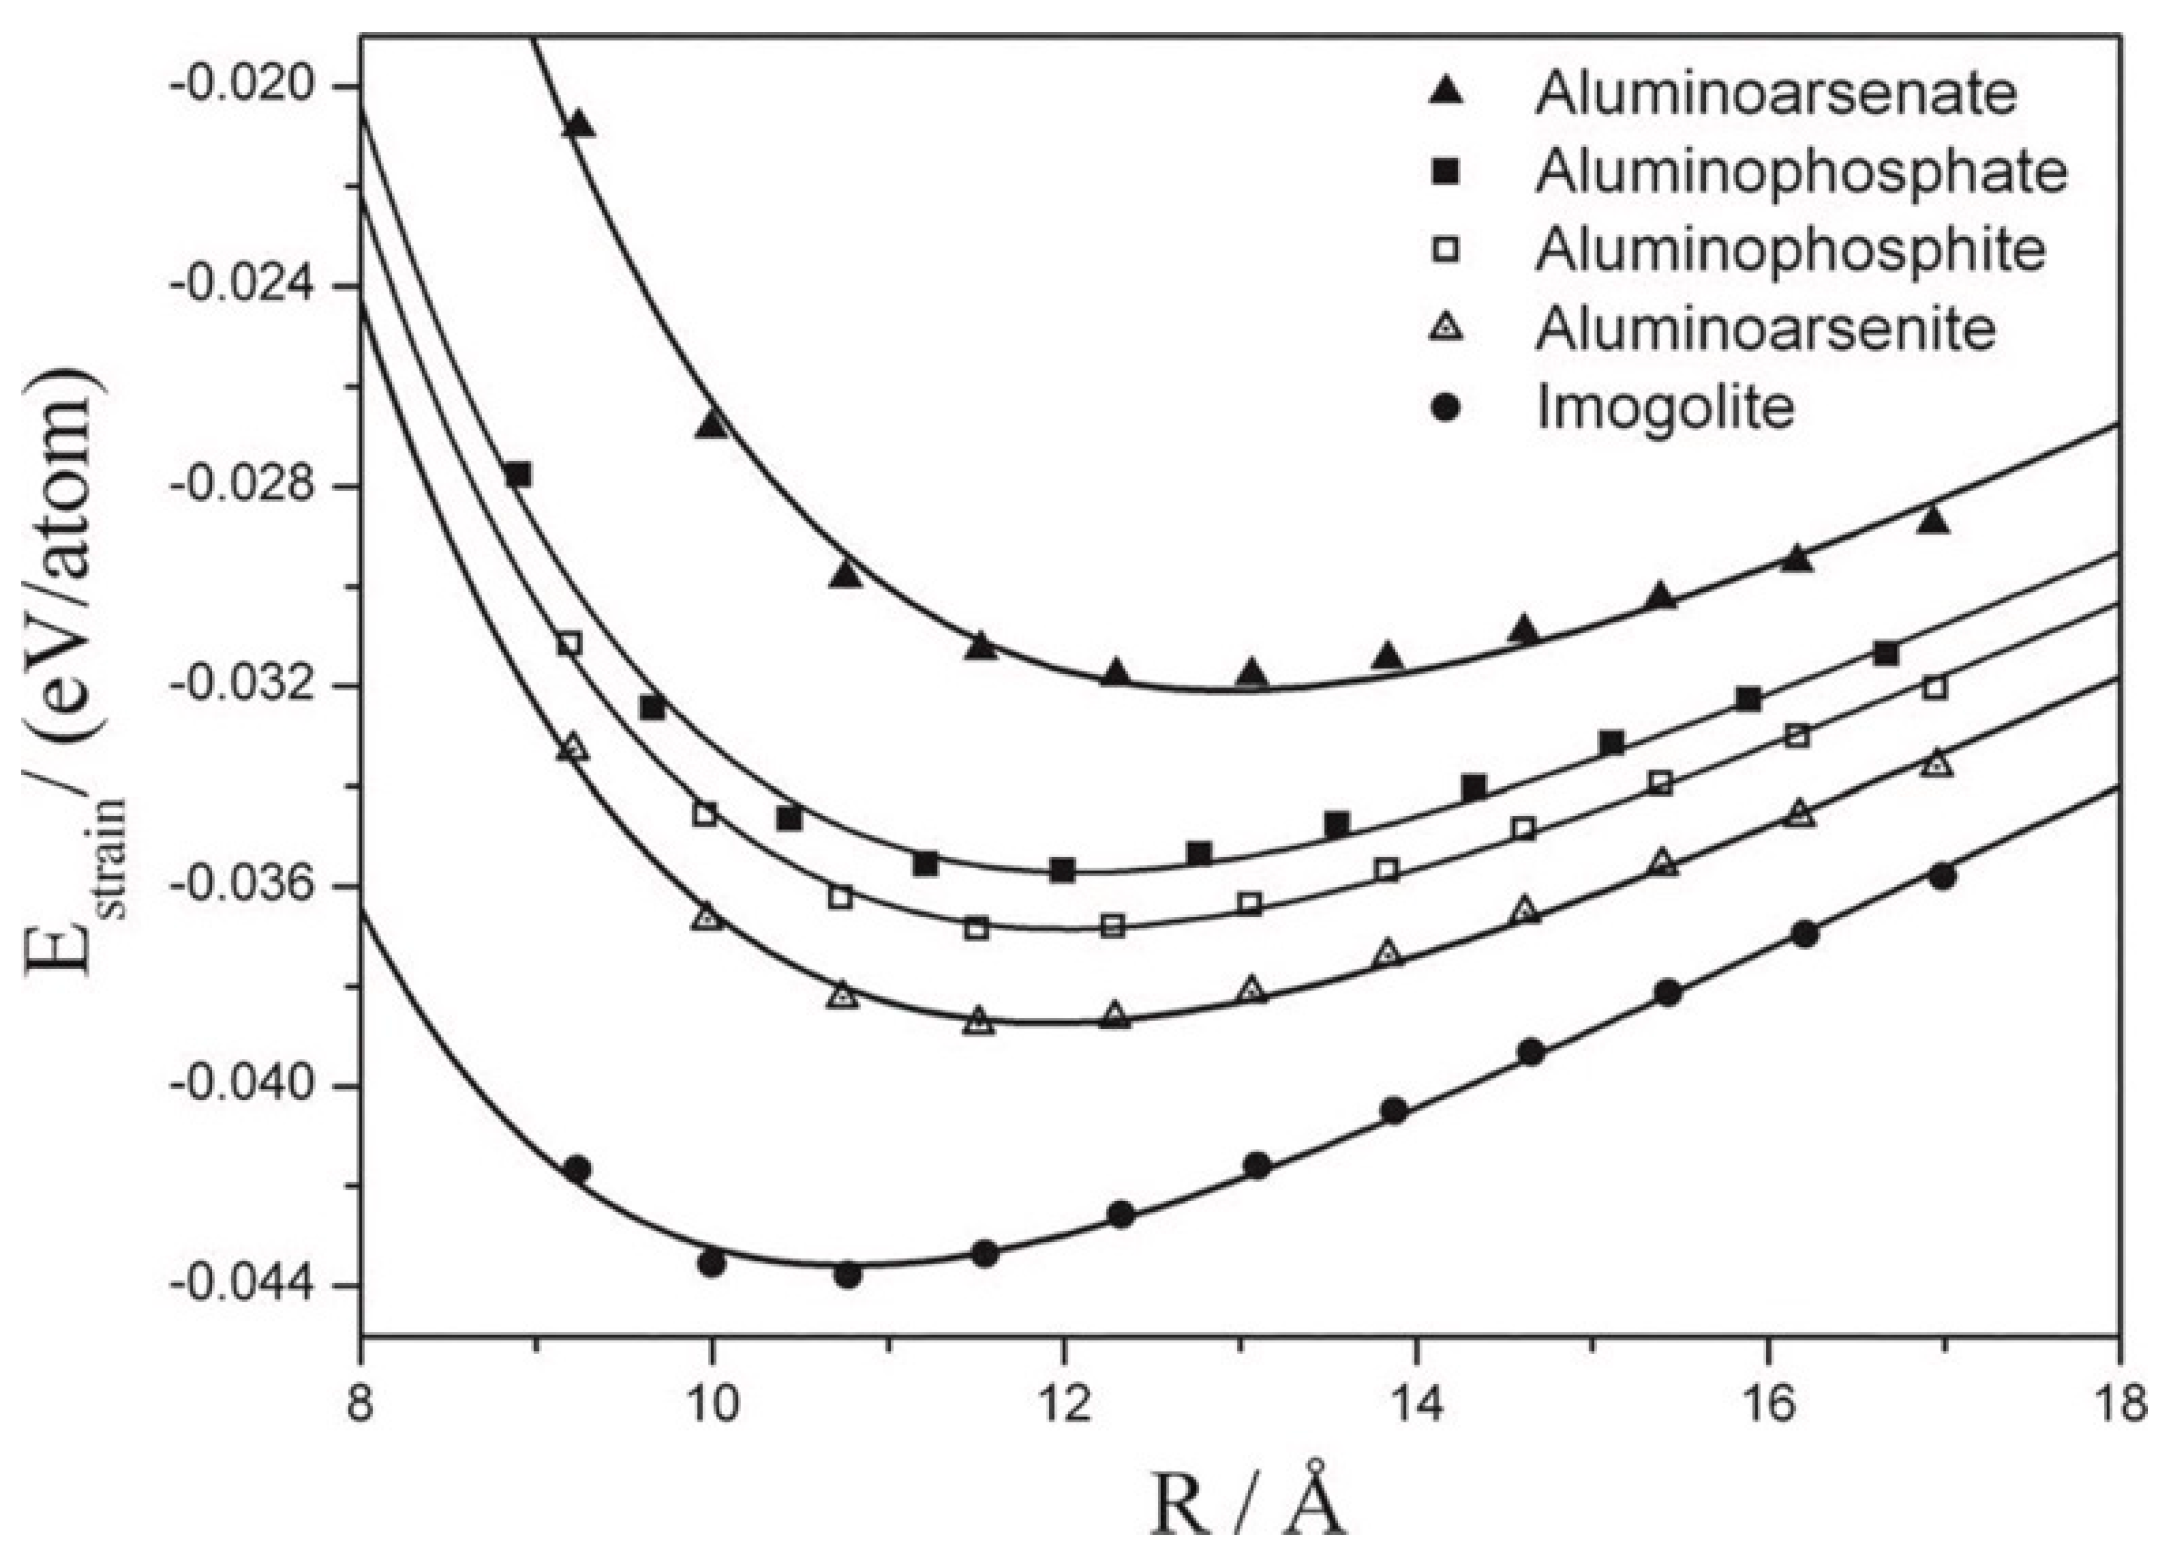
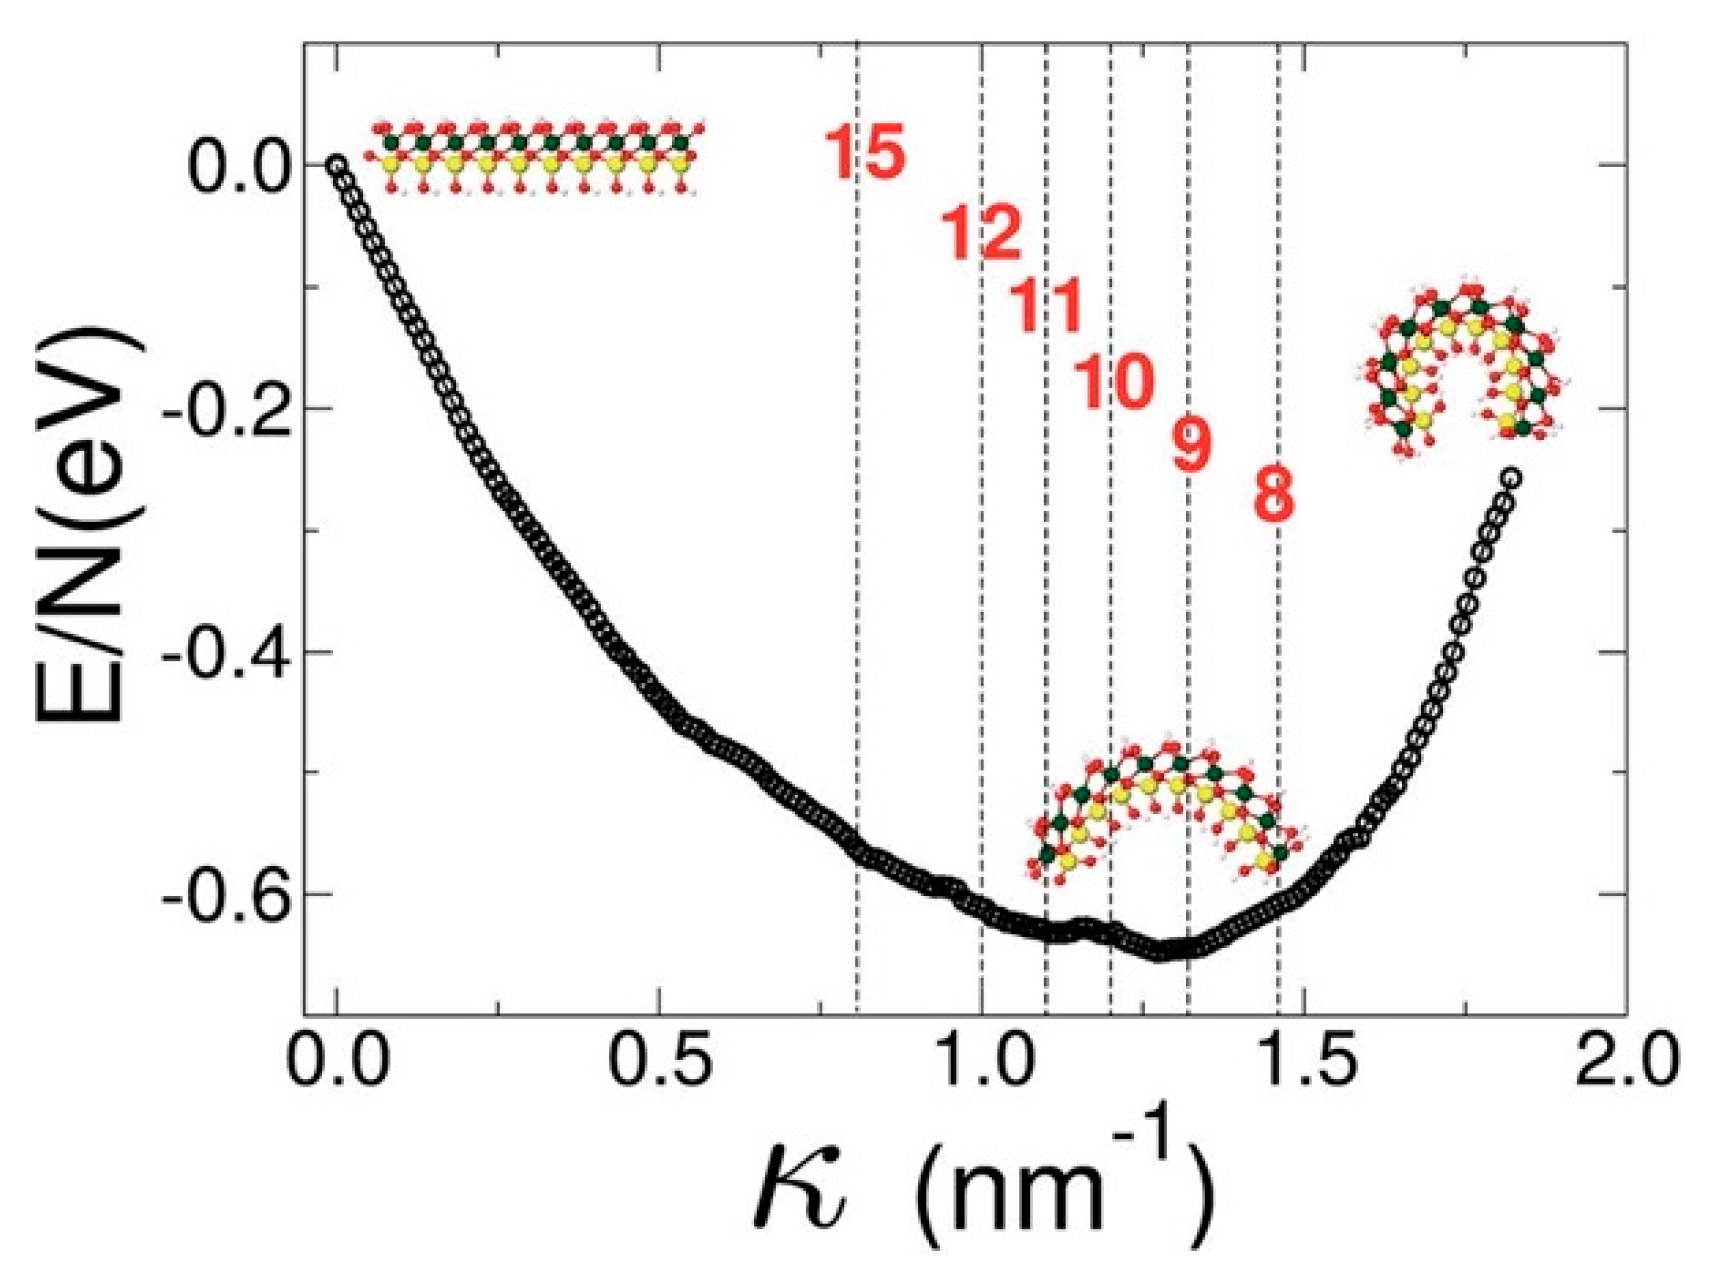
Some papers have been devoted to the study of substituted variations of imogolite. Alvarez-Ramírez [44] carried out a study of a general (OH)3N2O3MOH imogolite-like nanotube where M = C, Si, Ge, Sn and N = Al, Ga, In. The author demonstrated a change in the preferable cross-section geometry from a circular one to an elliptical and squared one with a more or less equal preferable radius expressed as a number of gibbsite-like units. In addition, the paper reported on a decrease in the direct band gap from around 4.7 eV to 2.5 eV with an0 increase in the M and N atomic numbers. The study [45] considered phosphorus and arsenic as potential substitutes for silicon. The authors demonstrated that changing Si increased the nanotube’s preferable radius of curvature, but at the same time it decreased the energy effect of bending (Figure 7).
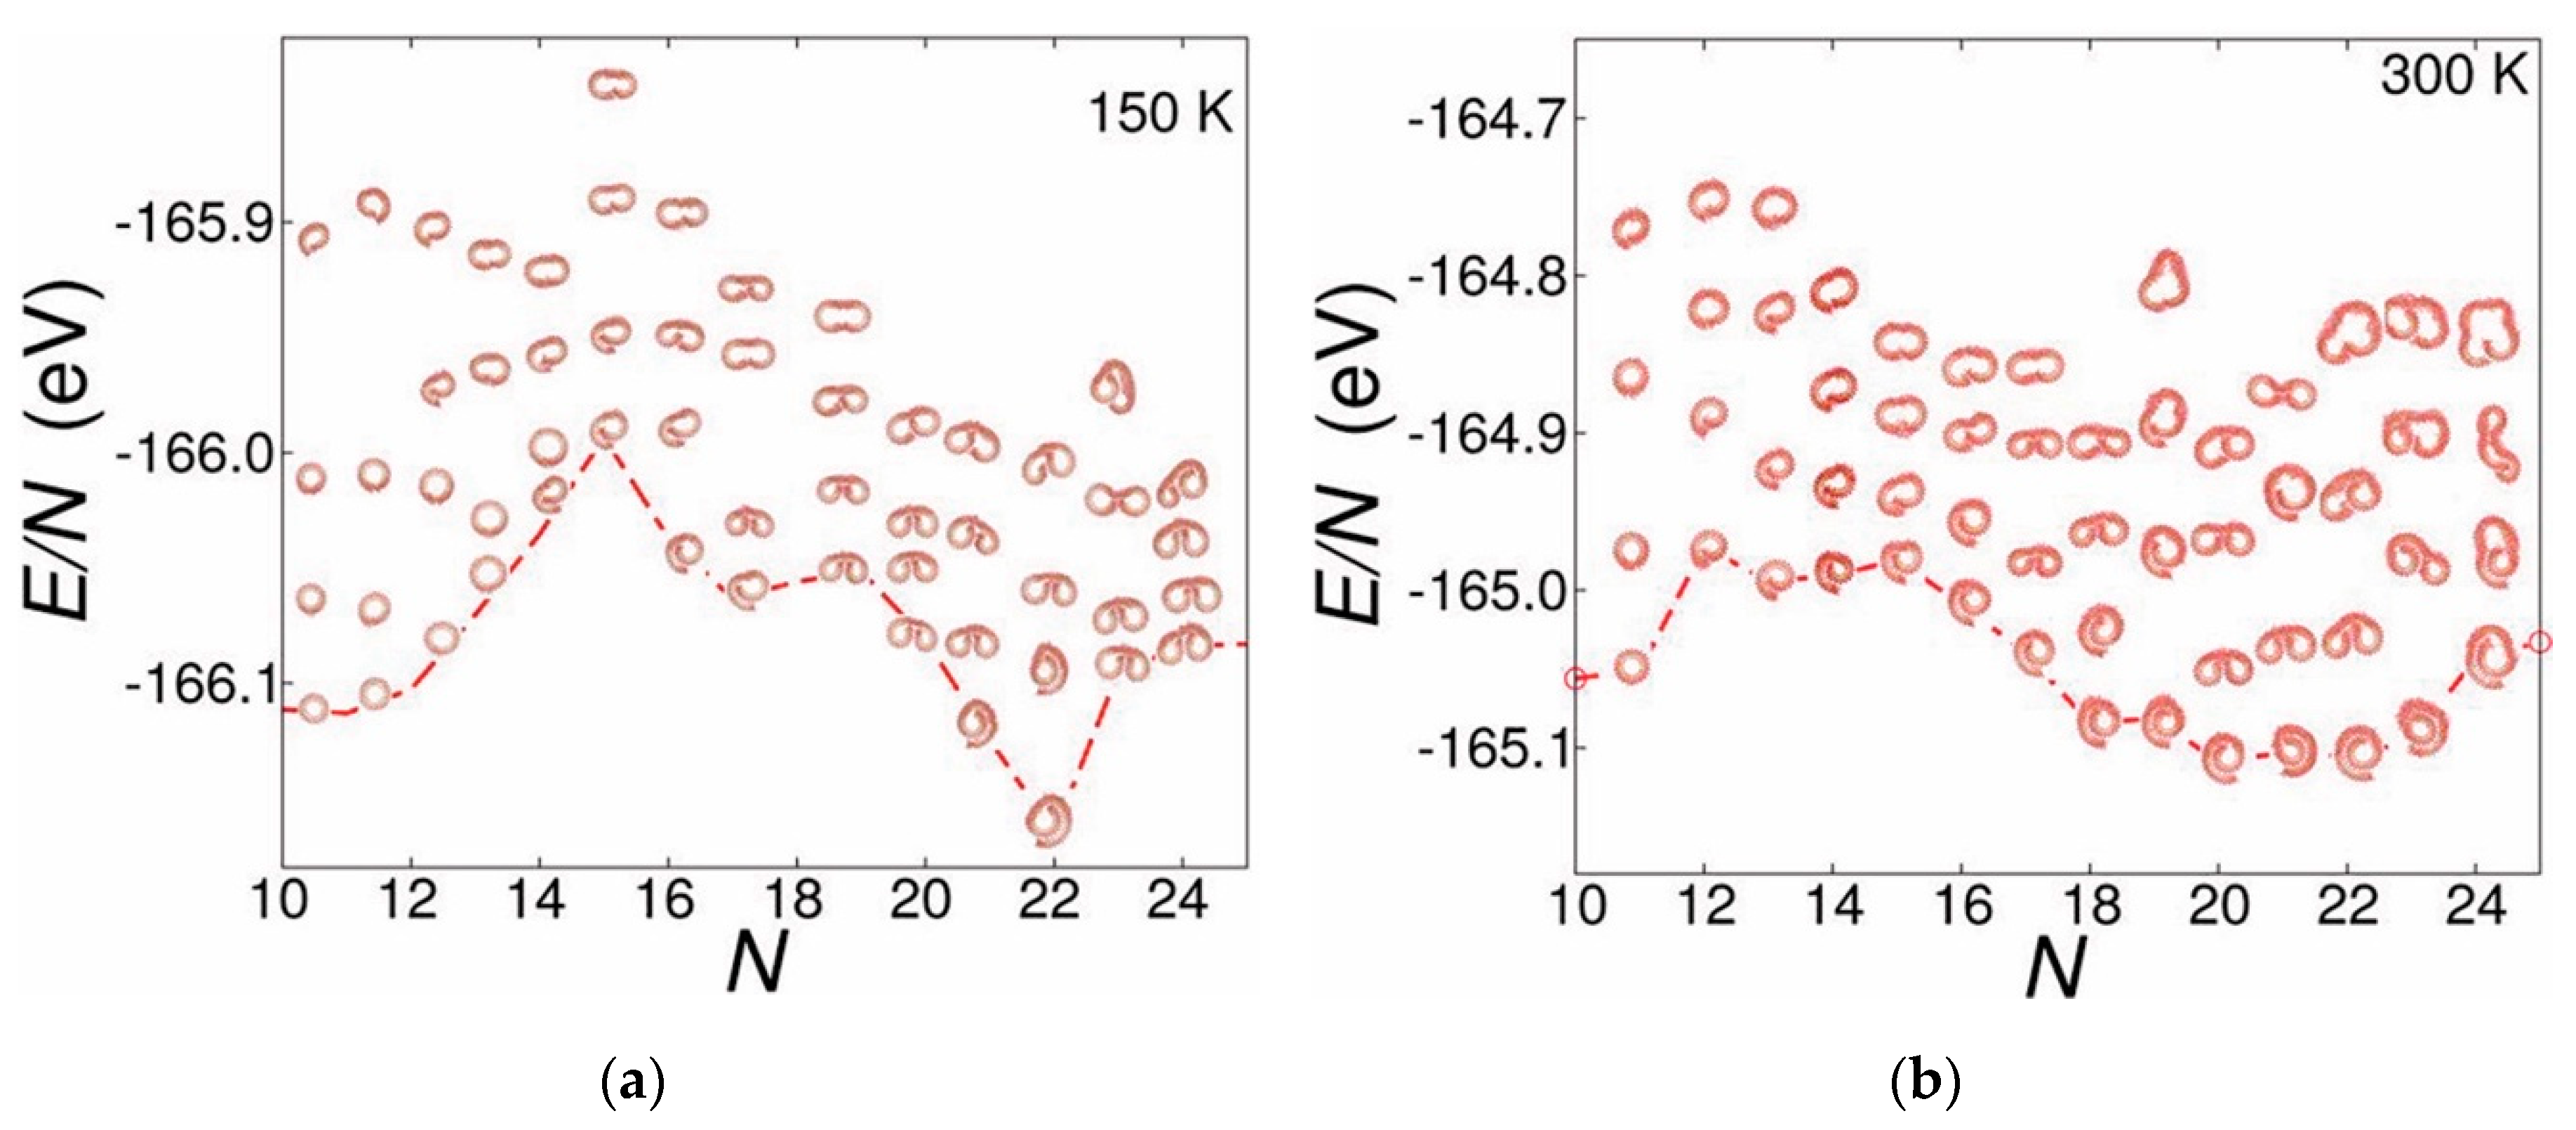
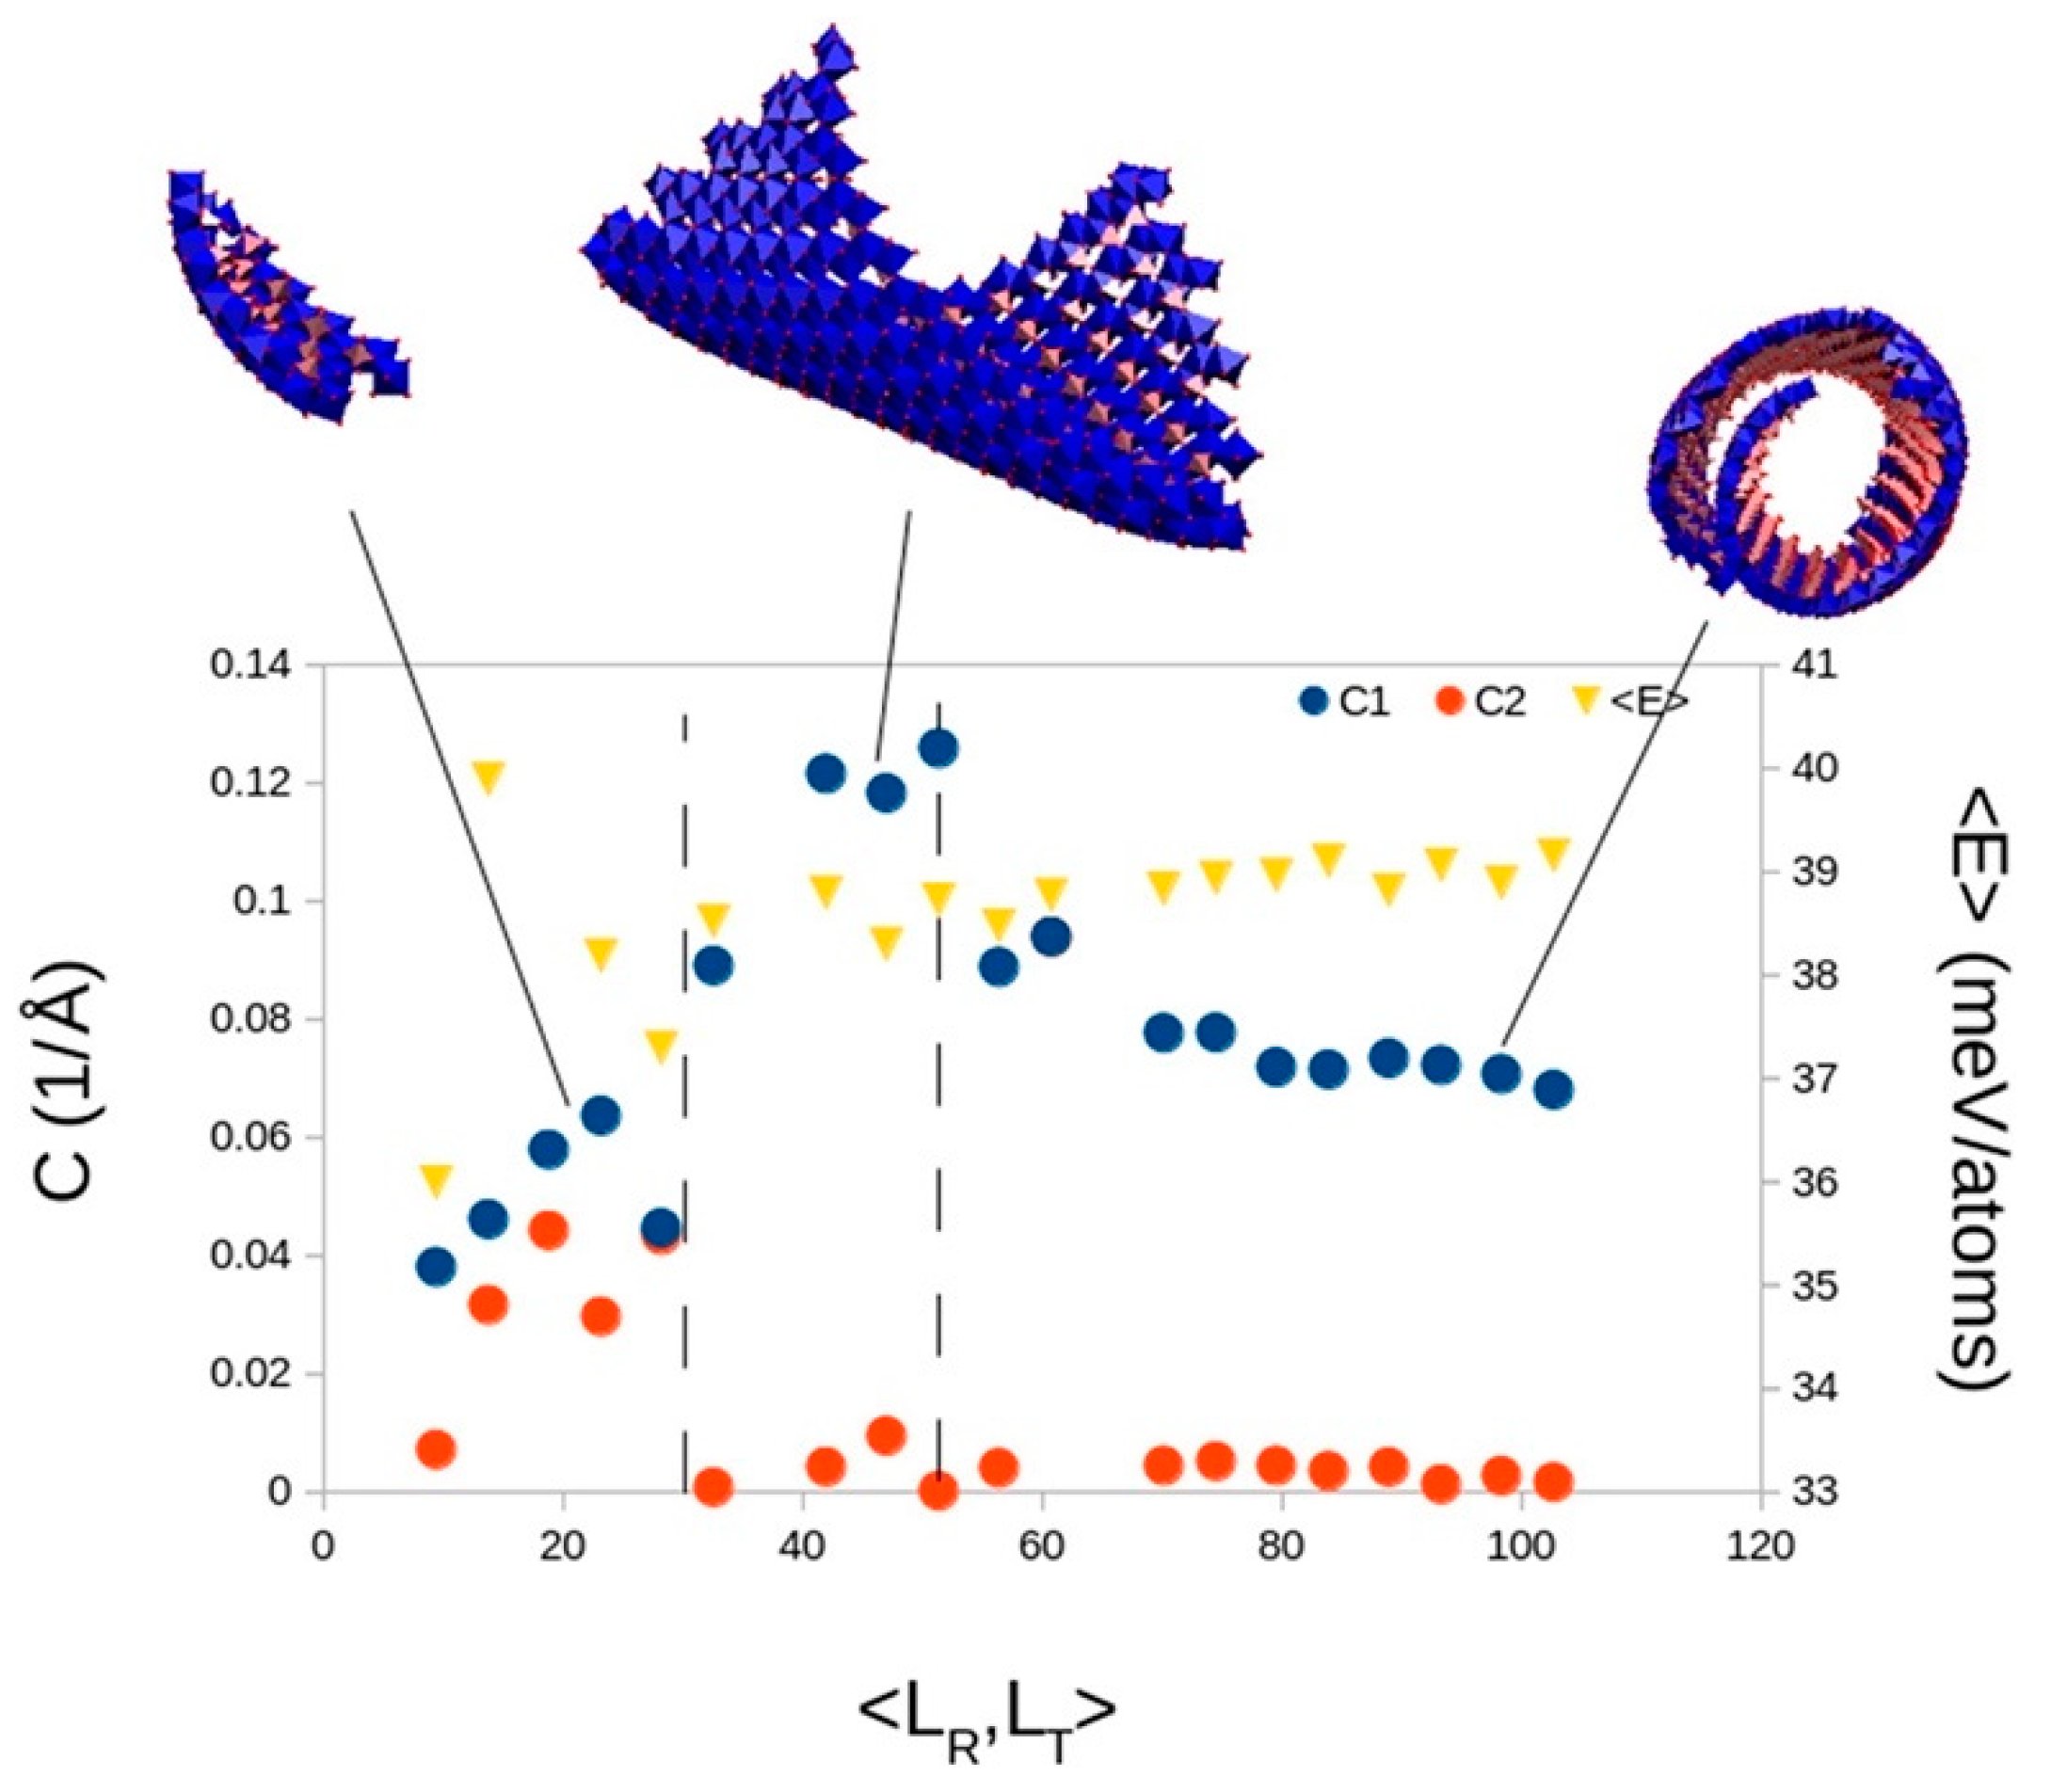
Another group of models has focused on the dynamics of imogolite layer scrolling. Using the MD approach, González et al. [46] revealed a high level of diversity in the manner of scrolling (Figure 8), including single, double and highly disordered spirals. An important result was that, in some cases, one complex spiral could be energy comparable to a system of two separate imogolite nanotubes. Perhaps this was caused by the interaction between adjacent layers, which is interpreted as adhesion by some phenomenological models of scrolling. A generalised model of graphite, MoS2 and imogolite layer bending was proposed in [47]. According to that research, a short imogolite layer, whose length was not enough to form a tube, gained almost the same curvature as the optimised tubes from previous studies (Figure 9). Thill et al. [22] extended the case of small imogolite layer bending in two possible directions in order to study the formation of spherical allophane. The authors demonstrated that the growing layer curved in both directions, forming the sphere’s segment below a certain size threshold (Figure 10). Above this threshold, a sudden drop in curvature occurred, indicating the transition to a tubular growth regime. A probable allophane formation mechanism could be the self-organisation of a number of the sphere’s segments by a kind of oriented attachment. According to [21], individual allophane particles usually were 4–5 nm in diameter, which might be formed of 6–9 sphere segments, 3 nm in size. Perhaps the resulting morphology (sphere or tube) could be a matter of kinetic competition between oriented attachment and recrystallisation, or between different modes of oriented attachment (attachment to edge or side surfaces of proto-imogolites).
Finally, there are a number of theoretical papers with an accent on the mechanical and optical [48,49] properties of imogolite. The series of papers by D.Y. Kang et al. [50,51] relate to the classification of proposed models, because they combine DFT structure optimisation with Nanoscale Continuum Mechanics (NCM) for simulated mechanical tests. The authors revealed a dependence of the Young’s and the share moduli on the single-walled imogolite nanotube’s length during tensile, bending (Figure 11) and torsion loads. On the other hand, the presence of defects decreased both the Young’s (340 GPa) and the shear (160 GPa) moduli of the tube. Liu and Kang [52] considered the mechanics of double-walled Ge-imogolite, highlighting the important role of the hydrogen bonds’ interaction between the adjacent layers. Unfortunately, single- and double-layered cases were not compared, and this would have been of great value for the interpretation of diameter (number of layers) dependence of the Young’s modulus observed in some nanomechanical experiments [53,54]. The pure MD simulation of imogolite nanotube compression was carried out in [55]. During the model experiment, the nanotube exhibited linear deformation with the Young’s modulus around 200 GPa, then it lost stability and kinked in several places after reaching a critical curvature radius of around 100 nm.
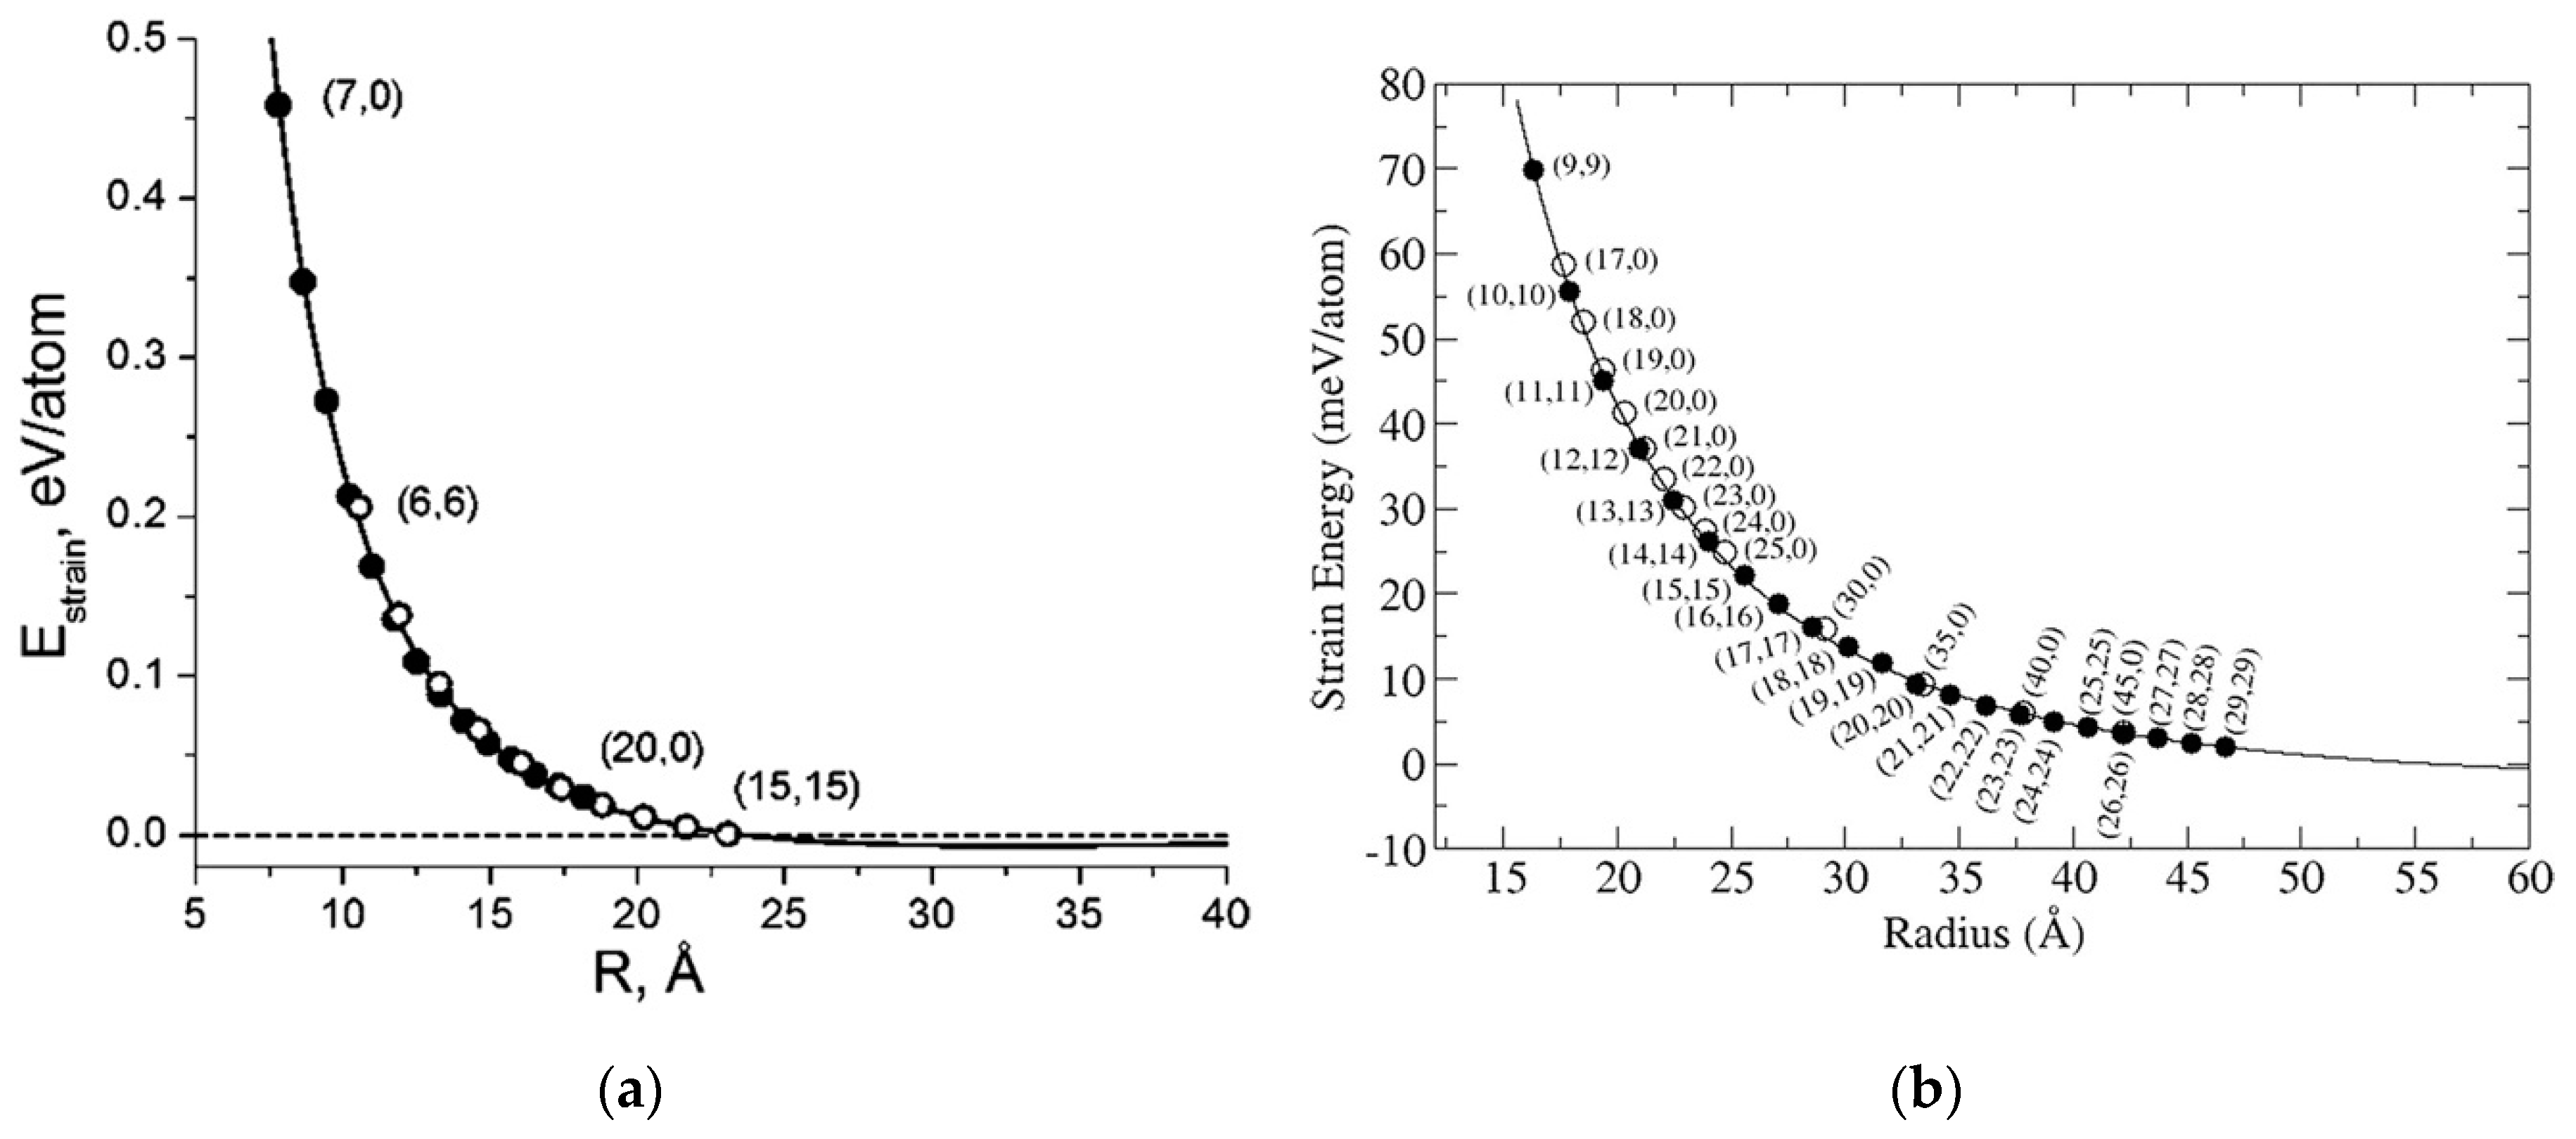
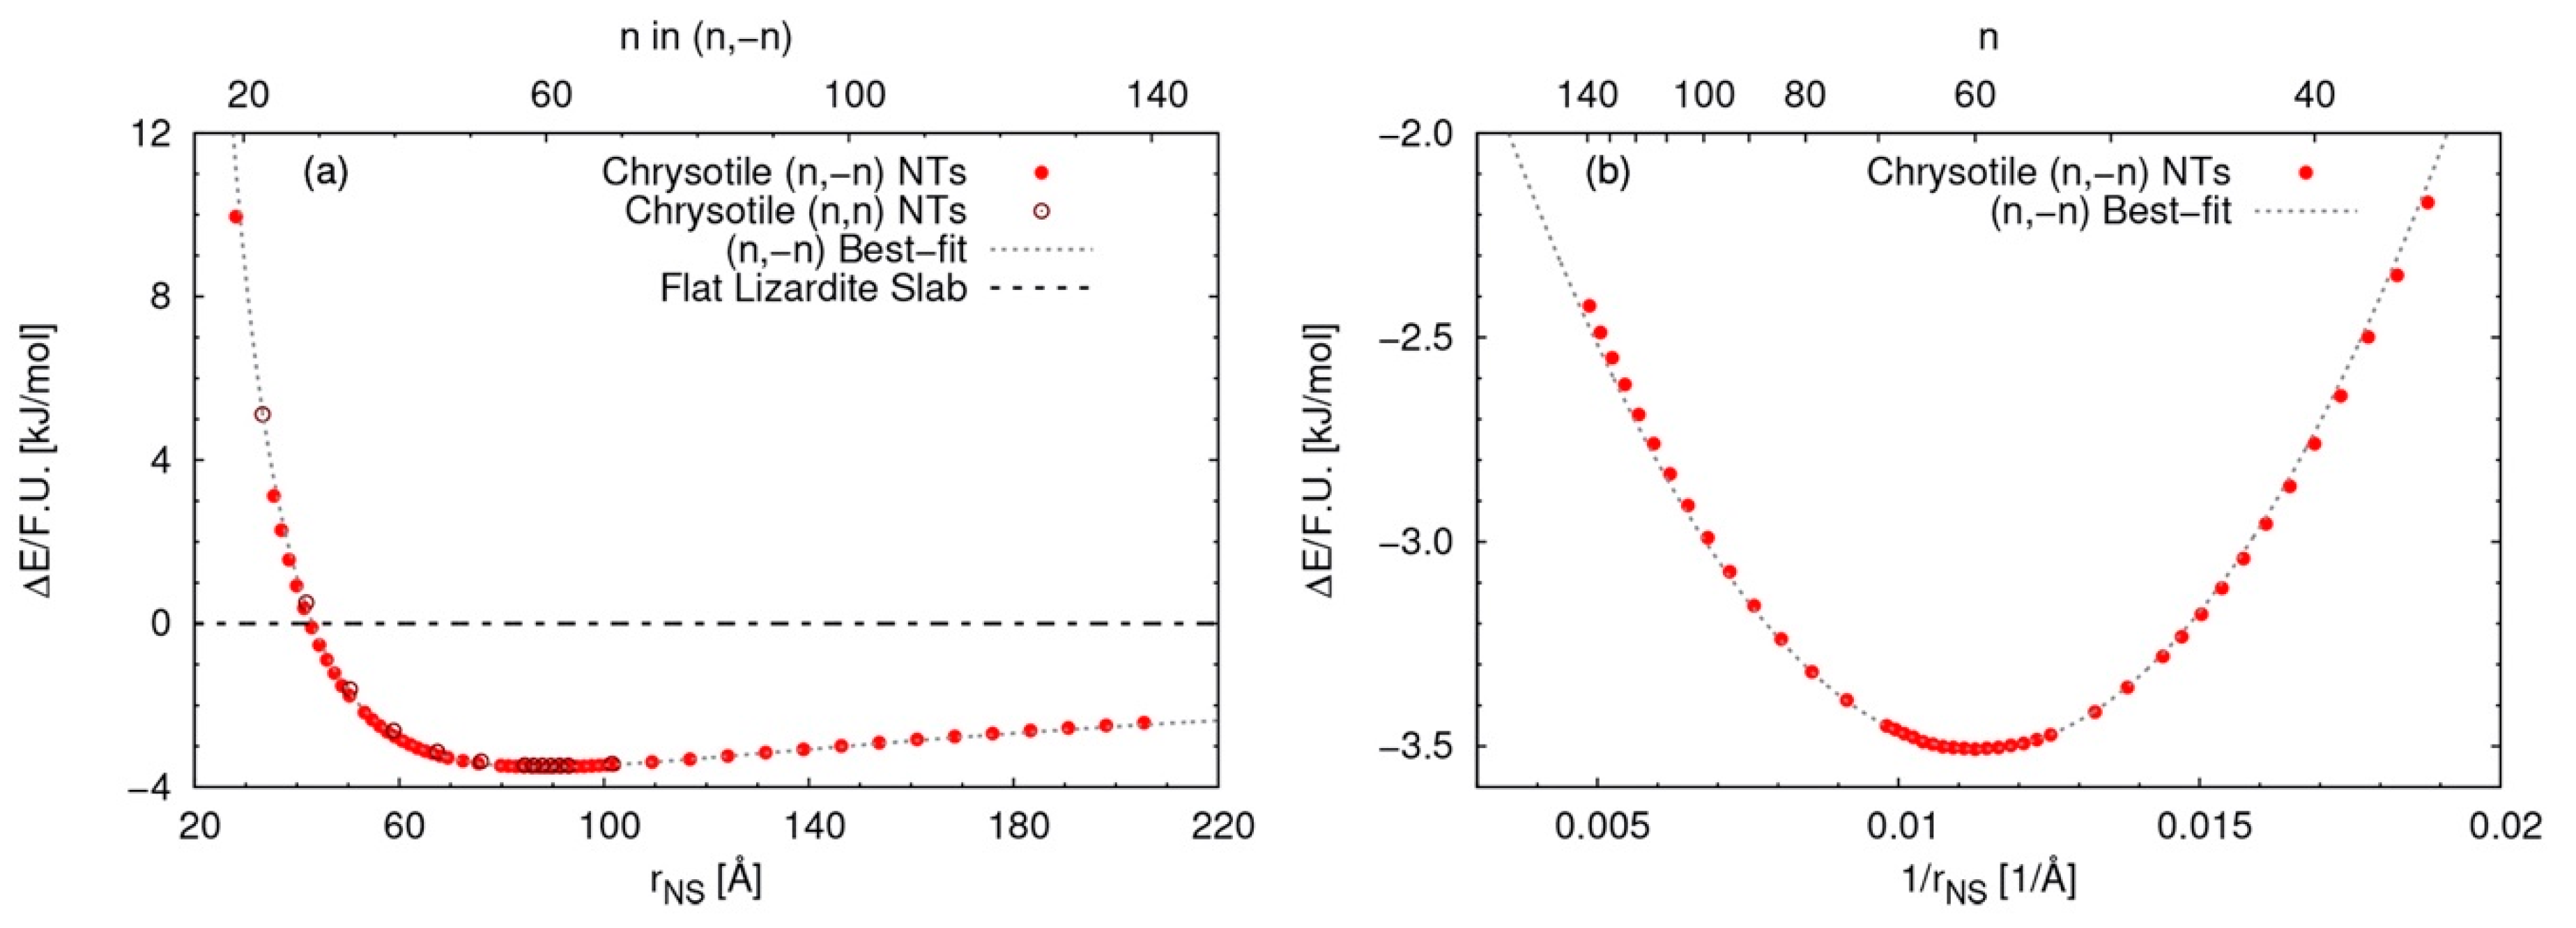
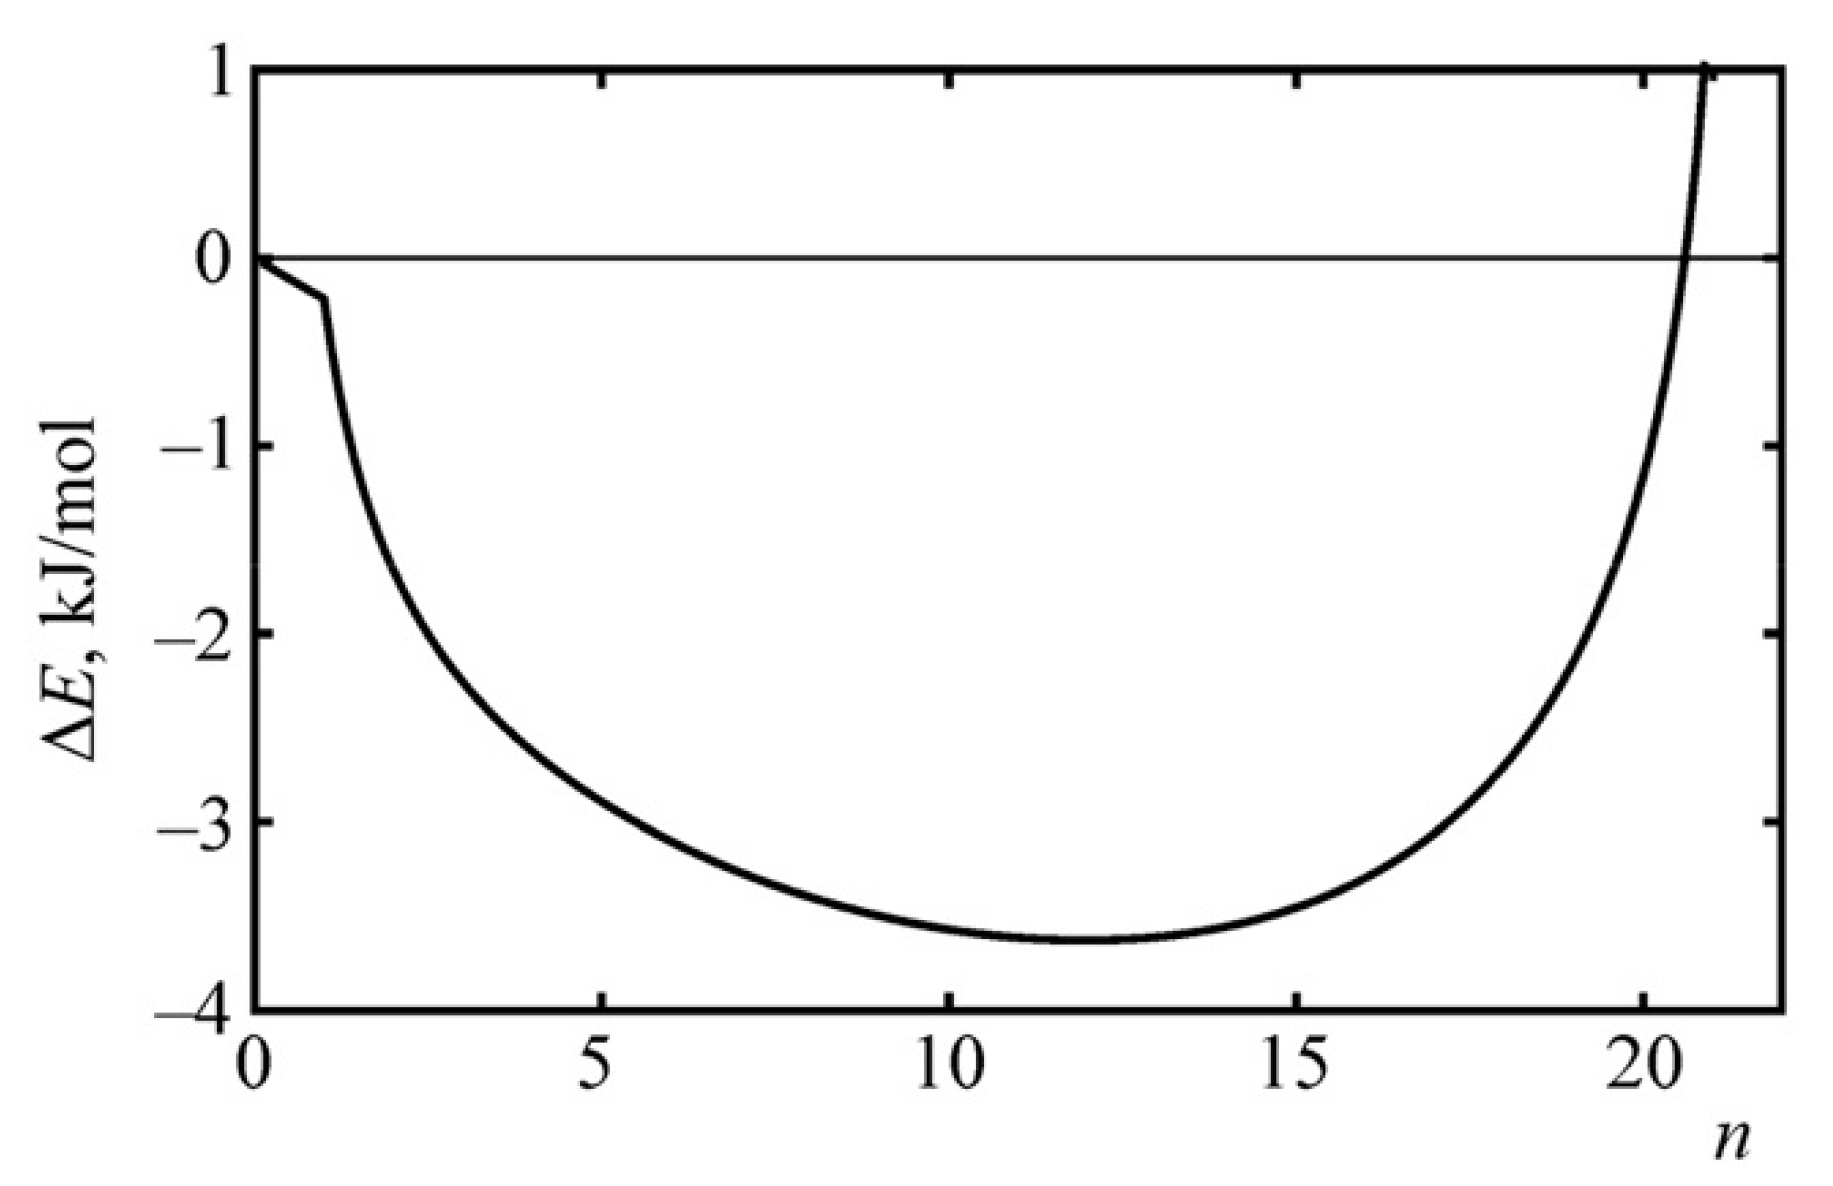
The number of theoretical papers that consider halloysite and chrysotile is relatively small. The structural, electronic and mechanical properties of single-walled halloysite and chrysotile were considered in [56,57]. The first issue identified for both hydrosilicates was that the cell size typical for imogolite was not enough to reach the energy minimum. The authors of [56,57] fitted the calculations with an empirical equation (Figure 12):
taking into account the strain and surface energy differences in the form of the parameters and . Solving that equation relative to the energy minimum with specified parameters for halloysite and chrysotile returned radii of 3.3 nm and 11.2 nm (absolute values), respectively. The latter was overestimated in comparison to the work of Whittaker [13], who obtained the stress-free radius of 8.8 nm on the basis of X-ray pattern analysis. As for Young’s modulus, the calculations yielded a value of around 300 GPa, which was comparable with imogolite. A recent large-scale DFT simulation of single-walled chrysotile [58] and other serpentine layers obtained the preferred radius of 8.8 nm (Figure 13), and this was in perfect agreement with [13].
The optimisation of 7 Å- and 10 Å-halloysite spirals, which accounted for no more than two layers (wraps), was carried out in [59]. One of the important results of this paper was a small distortion of the layer polyhedrons that was distributed across the entire supercell. Comparing two directions of scrolling, the authors revealed an energy preference of bending around the b axis due to the configuration of the hydrogen bond network. The scrolling of a flat halloysite layer was studied by means of the MD approach [60]. The authors revealed that scrolling occurred in both a and b crystallographic directions, but at a different speed. Intriguingly, the final inner radius of 5–15 nm significantly exceeded the value of 3.3 nm obtained by fitting the calculations of Guimarães et al. [56].
Very few papers have focused on the substituted versions of halloysite and chrysotile. Alvarez-Ramírez et al. [61] carried out a DFT structure optimisation of Ni3Si2O5(OH)4 nanoscrolls and demonstrated that the lattice constants were close to the Mg3Si2O5(OH)4, except they operated with a P31m space group. Fu and Yang [62] considered the cation doping of kaolinite layers with Cr, Mn, Fe and Co, regardless of its scrolling ability. Cation doping initiated the cell volume expansion (except the Co substitution) and tuned the band gap of the layer. In addition, different cations preferred an anti- or ferromagnetic state.
2.2.2. Phenomenological ‘Macroscopic’ Models
In contrast to the group considered above, ‘macroscopic’ models consider the layer as, generally, a continuous medium, and attempt to describe scrolling using the analytical equations of mechanics and both thermo- and hydrodynamics. Some early papers considered probable ways of size difference compensation in a 1:1 hydrosilicate layer. Singh [63] compared the mechanism of tetrahedra rotation with whole layer rolling. The author came to the conclusion that the rotation mechanism might be less energy efficient due to the increasing Coulomb repulsion of the nearest Si atoms. In support of this conclusion, it seems that while the tetrahedral sheet distortion would decrease the size difference in one direction, it would simultaneously increase the difference in the other direction. However, the tetrahedral rotation mechanism could encourage nanotube form stabilisation after the scrolling, as the hydrogen bonds arrangement did.
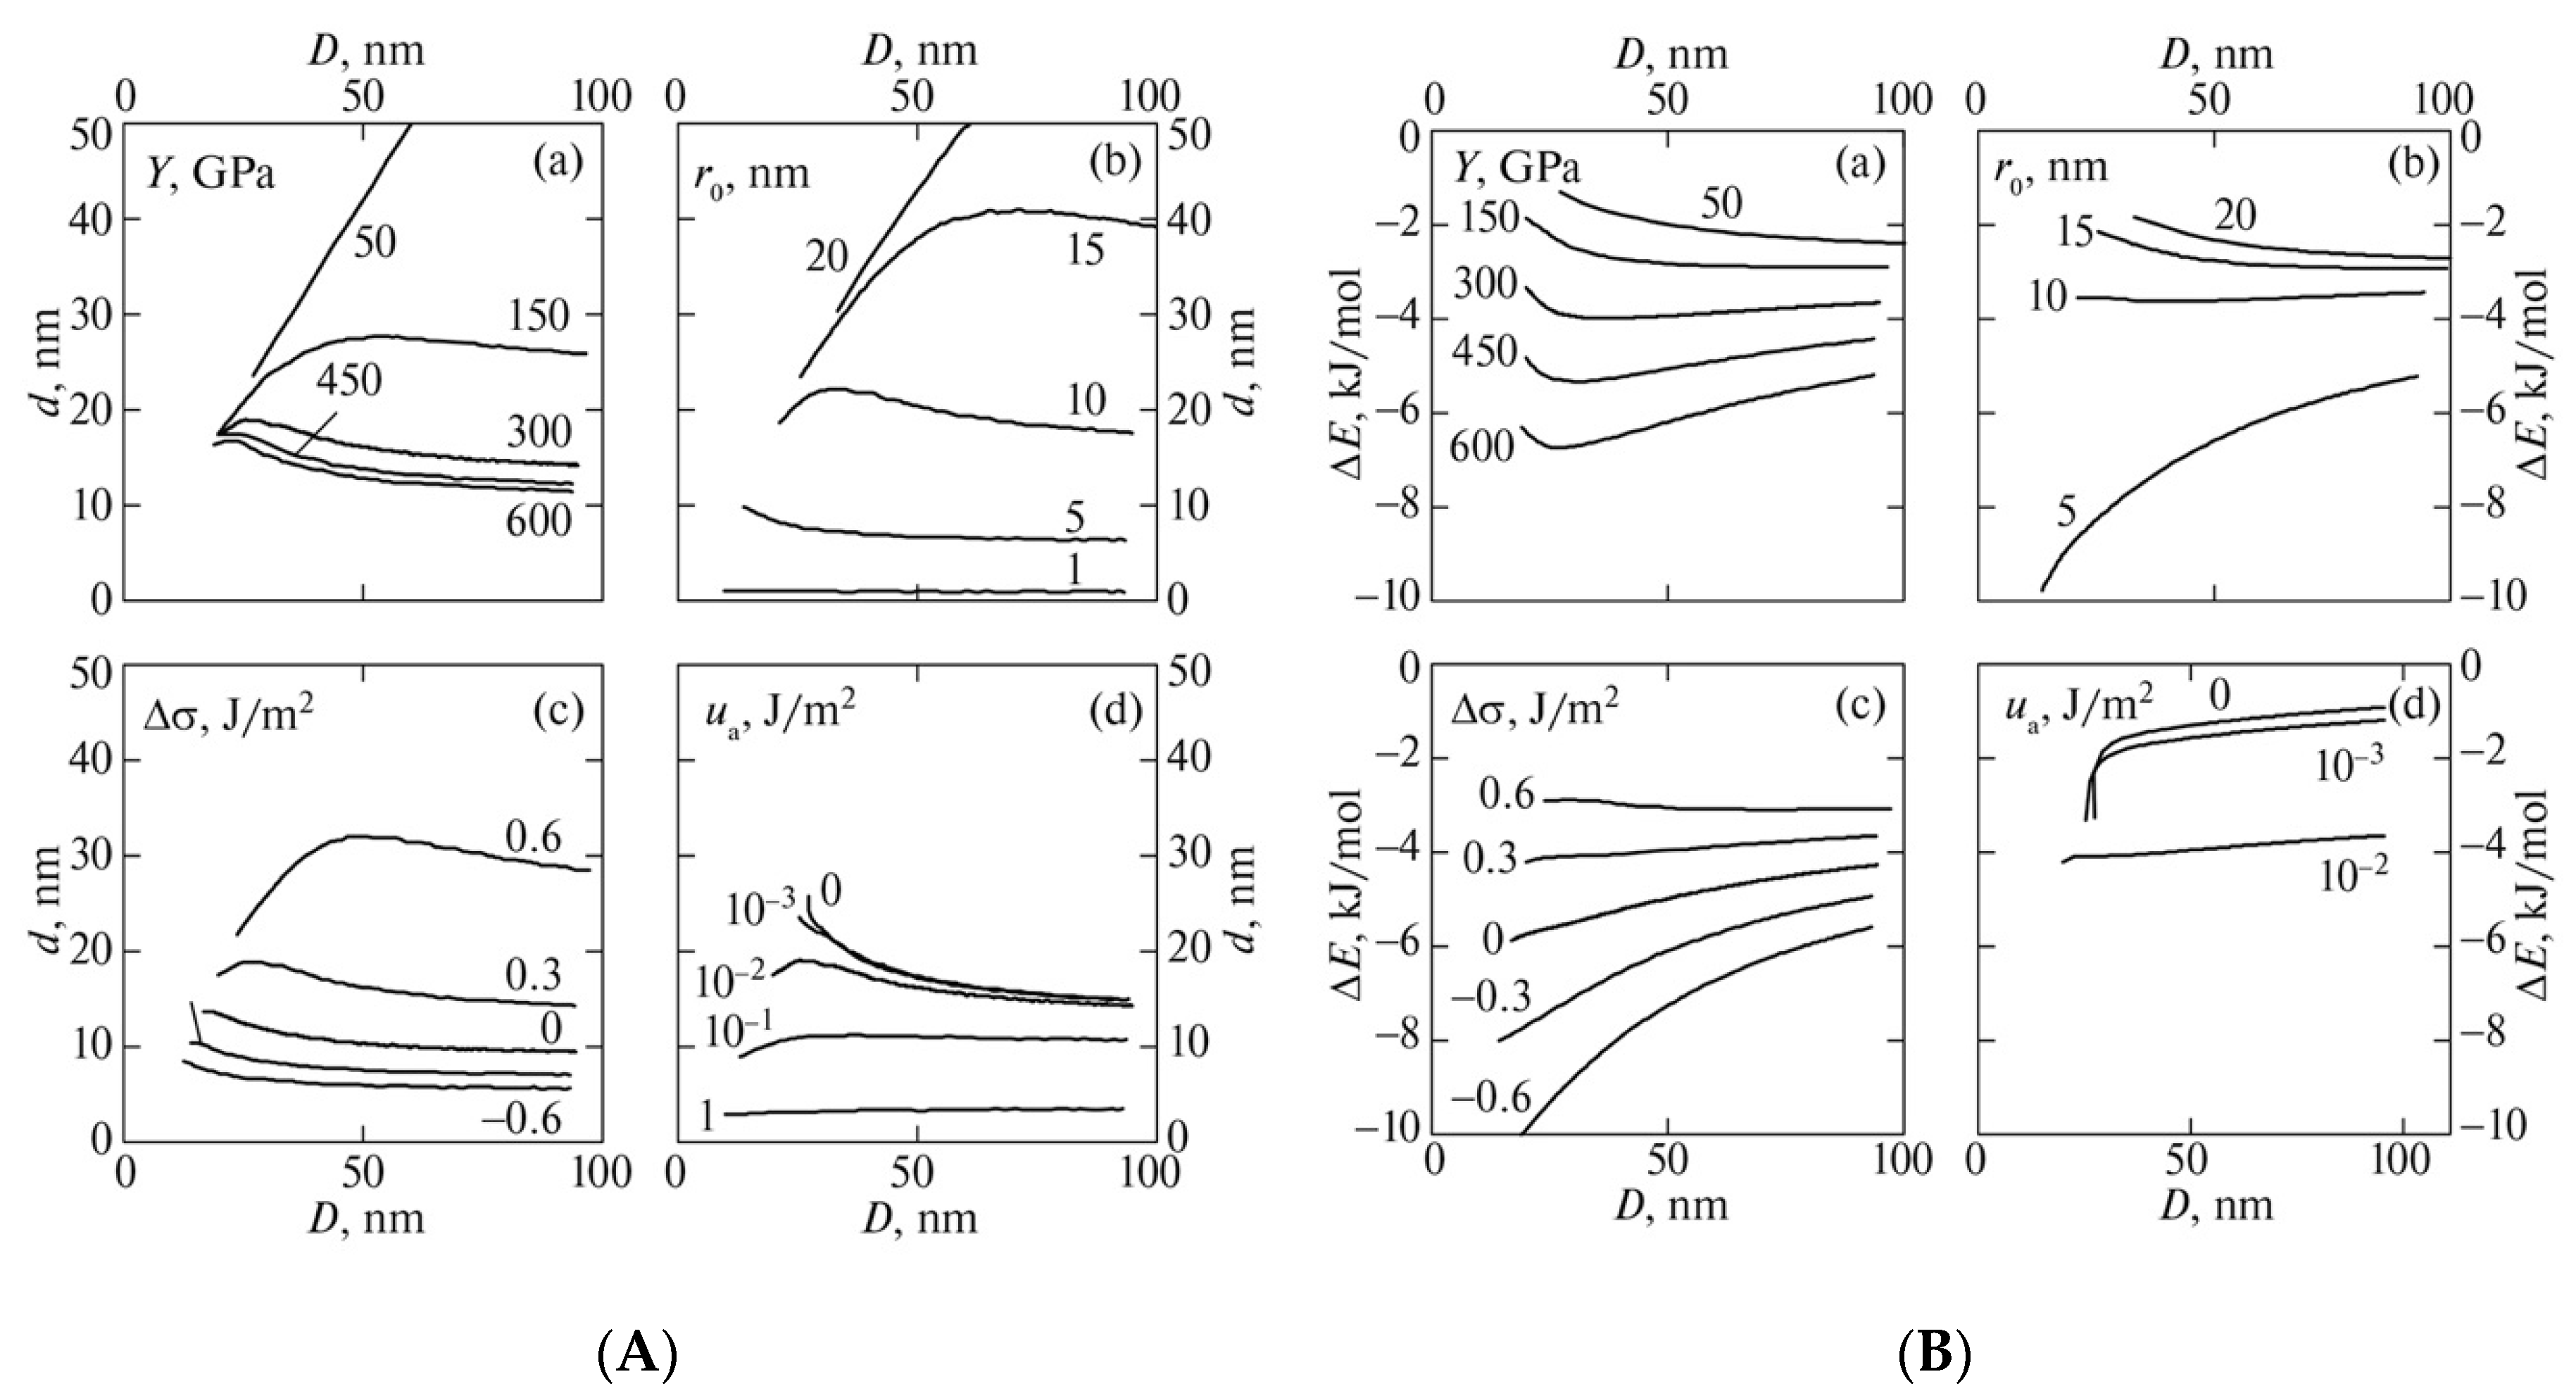
One of the first studies of the energy aspects of substitutions was reported in [64]. The authors described the morphological transition of Ni3(Si1–xGex)2O5(OH)4 from tubes to plates in terms of the elastic theory of thin plates. A notable outcome of this research was the estimation of the preferred radius of curvature of Ni3Si2O5(OH)4 to be 9.13 nm, as well as the 1.068 J/m2 surface stress difference between the opposite sides of the layer. In addition, using the concept of the size difference between the two sheets driven by an ionic radius of the cations, the authors estimated the molar fraction of Ge needed to eliminate the size difference to be . This value was well correlated with the synthetic experiment, which yielded . An energy model explaining the nanotubes’ curvature was further developed in [65,66]. The authors considered the case of Si to Ge substitutions in imogolite, accompanied by the formation of double-walled nanotubes and multi-walled nanoscrolls. The authors enhanced Equation (1) with the adhesion term in order to describe the multi-walled morphology:
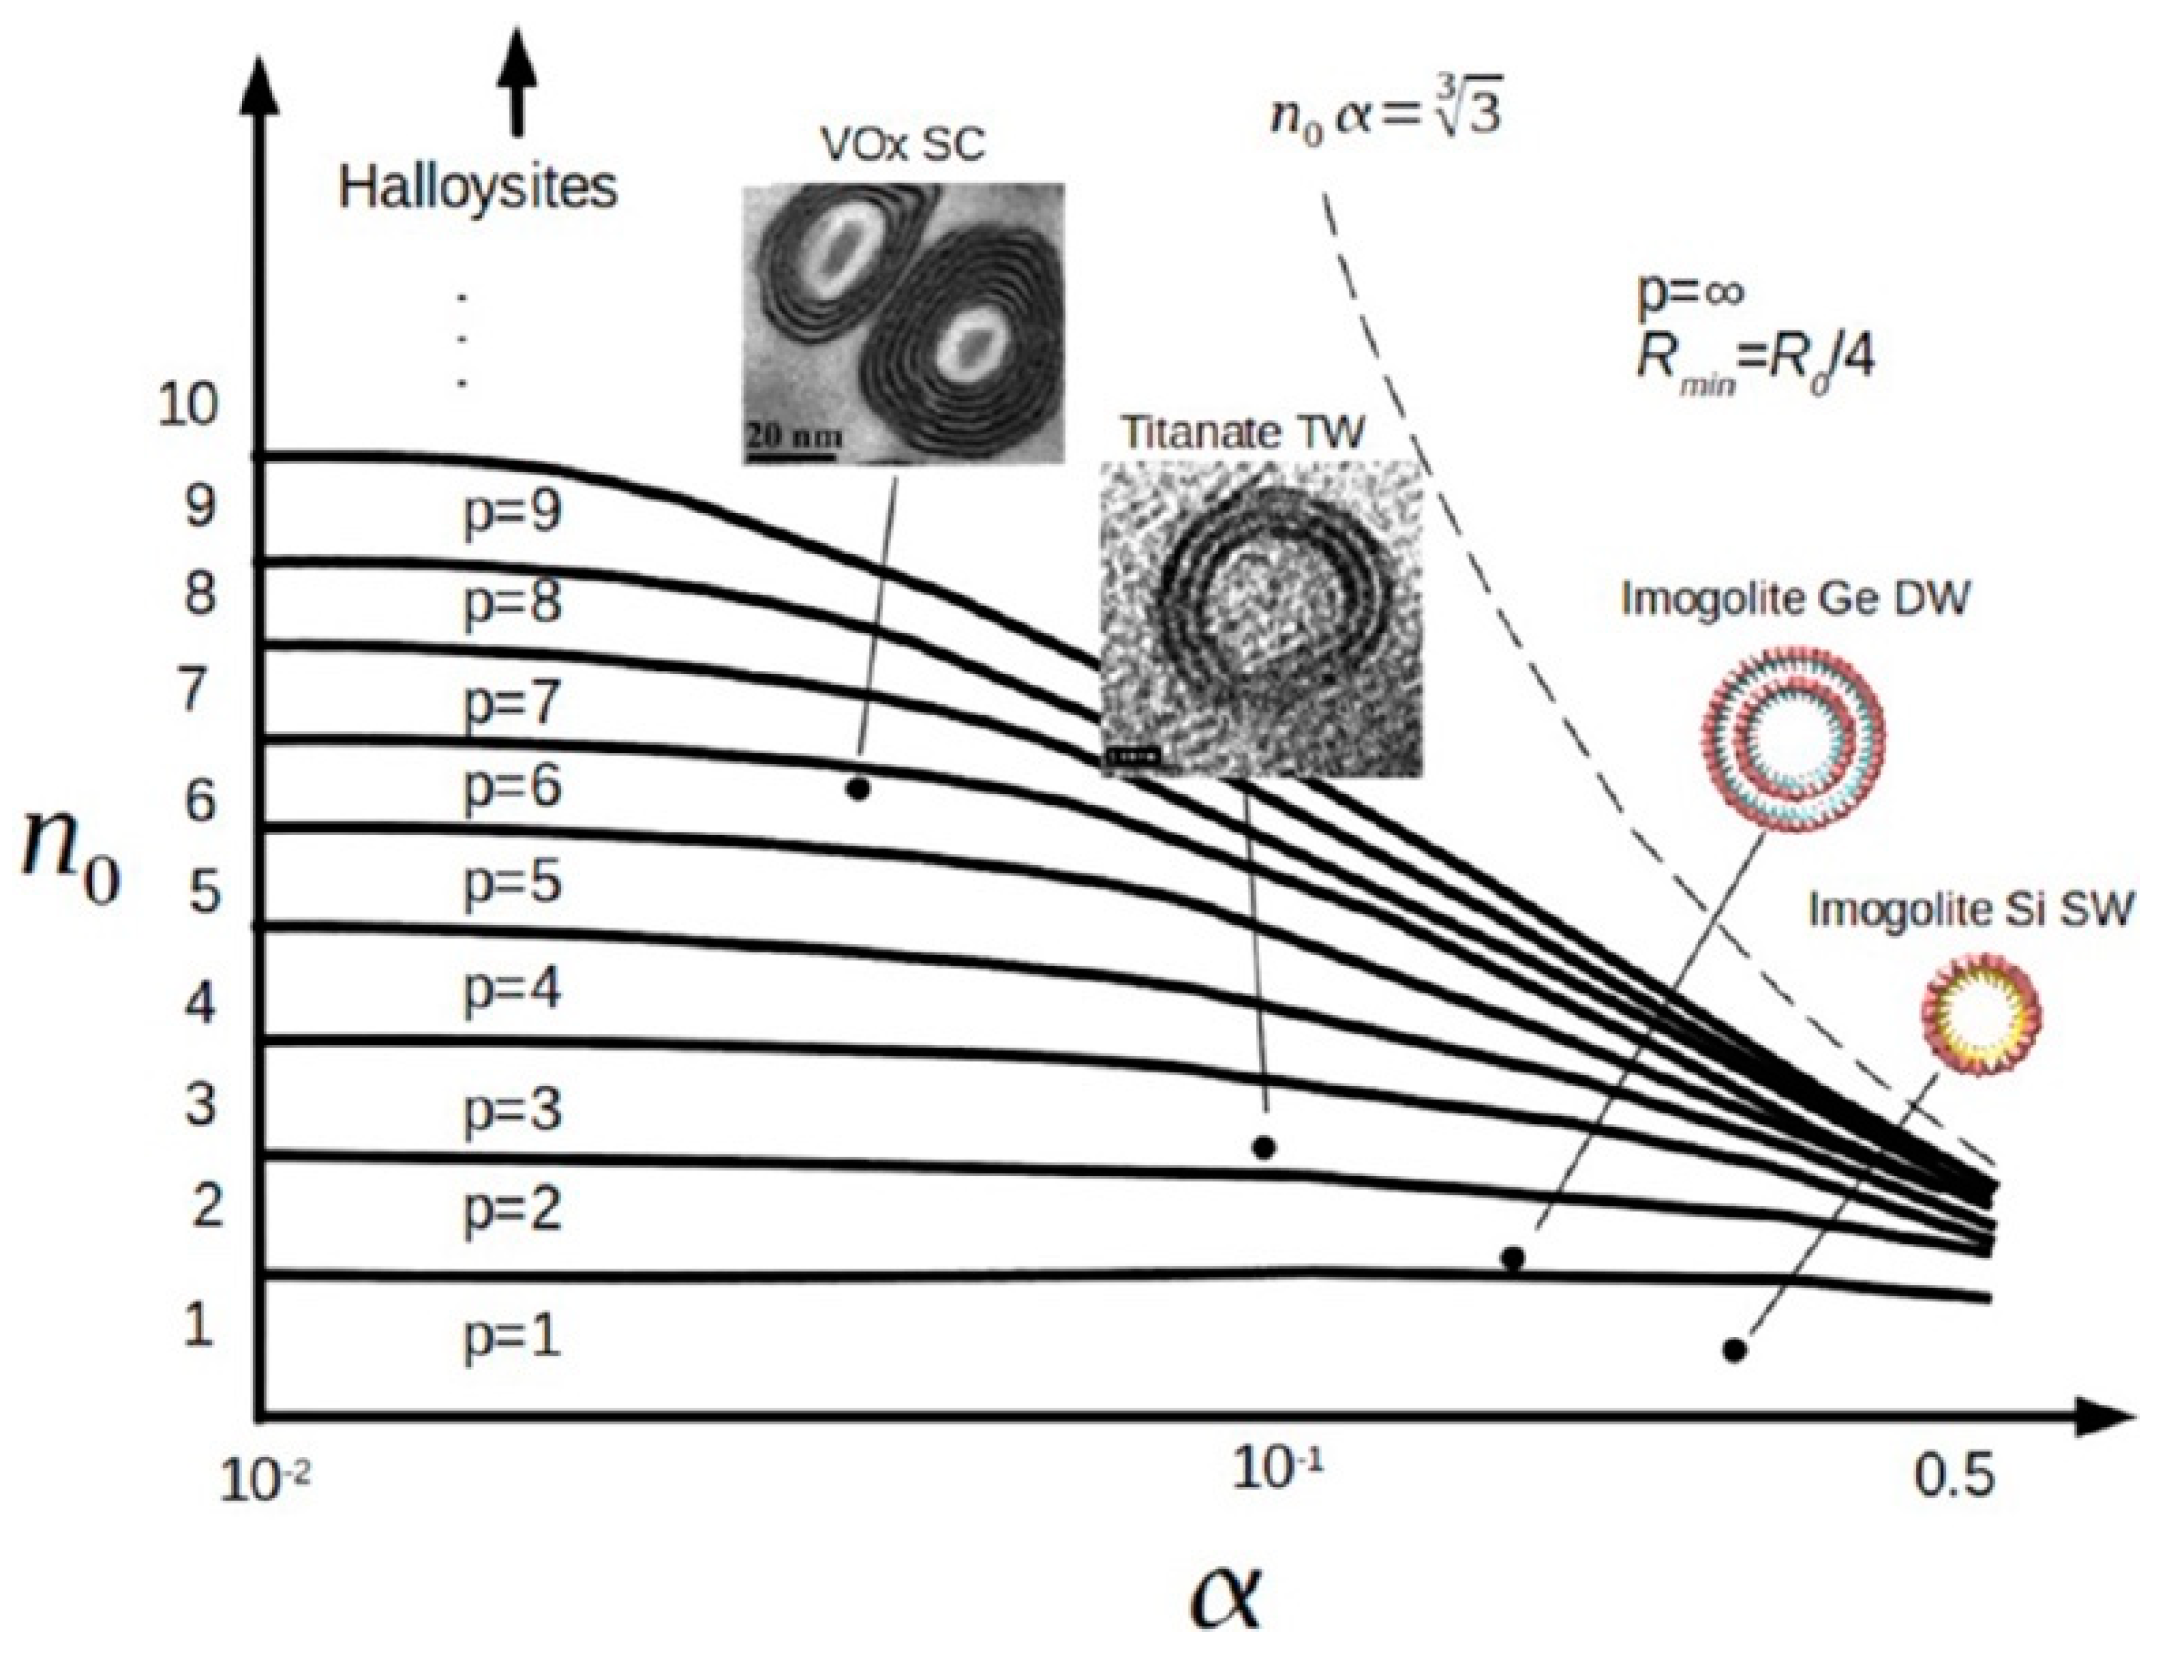
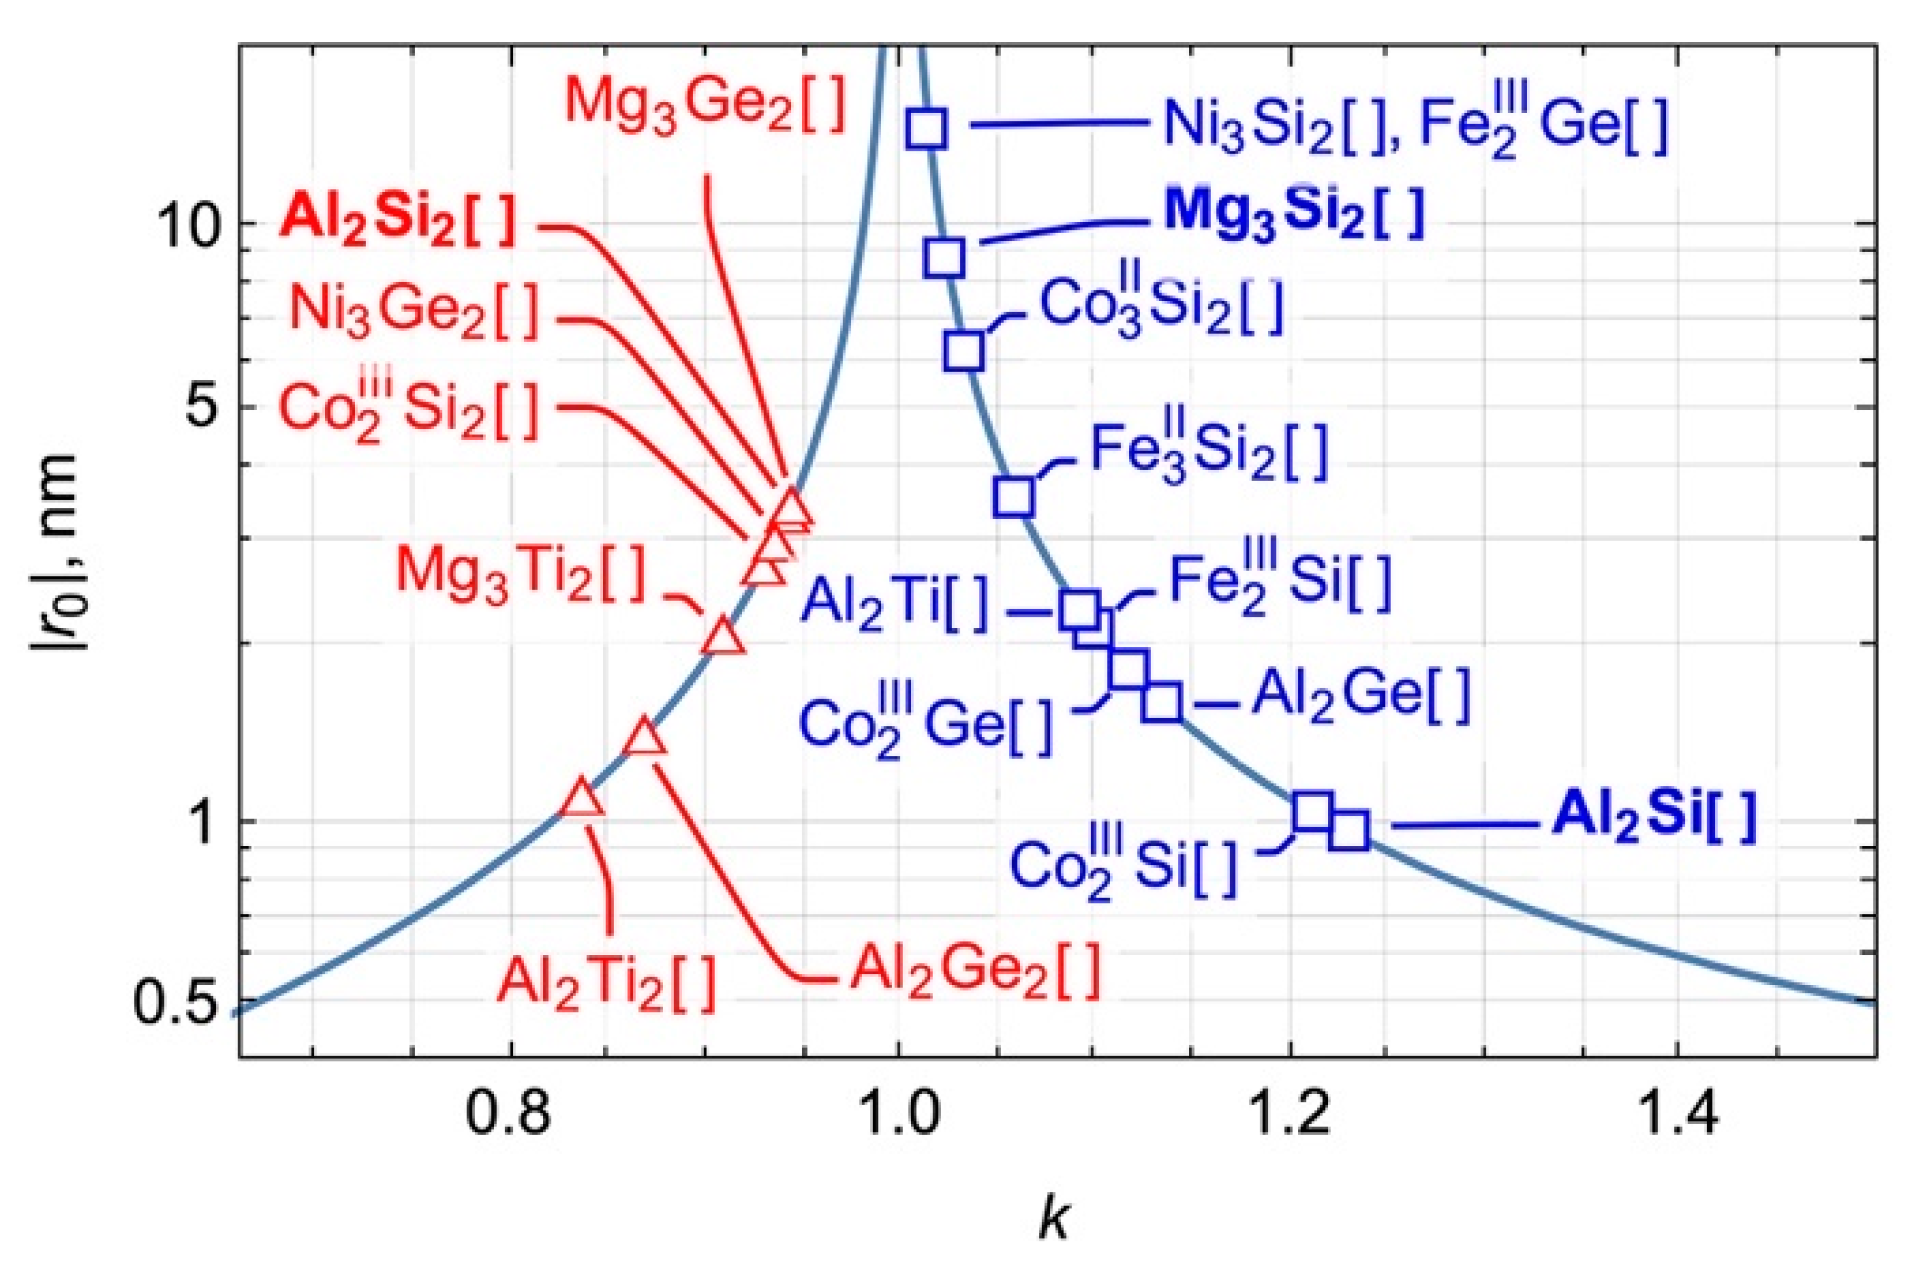
where is Young’s modulus, is a half of the layer’s thickness, is the mean radius of the ensemble, is the number of layers, is the curvature radius of the layer, and are the surface tension of the internal and external imogolite surfaces, is total surface tension and is the adhesion energy. Numerical calculation on the basis of this formula demonstrated the increased energy preference of multi-walled nanotubes and nanoscrolls with an increase in Ge content (Figure 14). In addition, an analytical approximation of this equation allowed authors to draw a sort of phase diagram (Figure 15) that described the competition between adhesion-associated () and strain/surface-associated () parameters for a wide range of nanotubular materials.
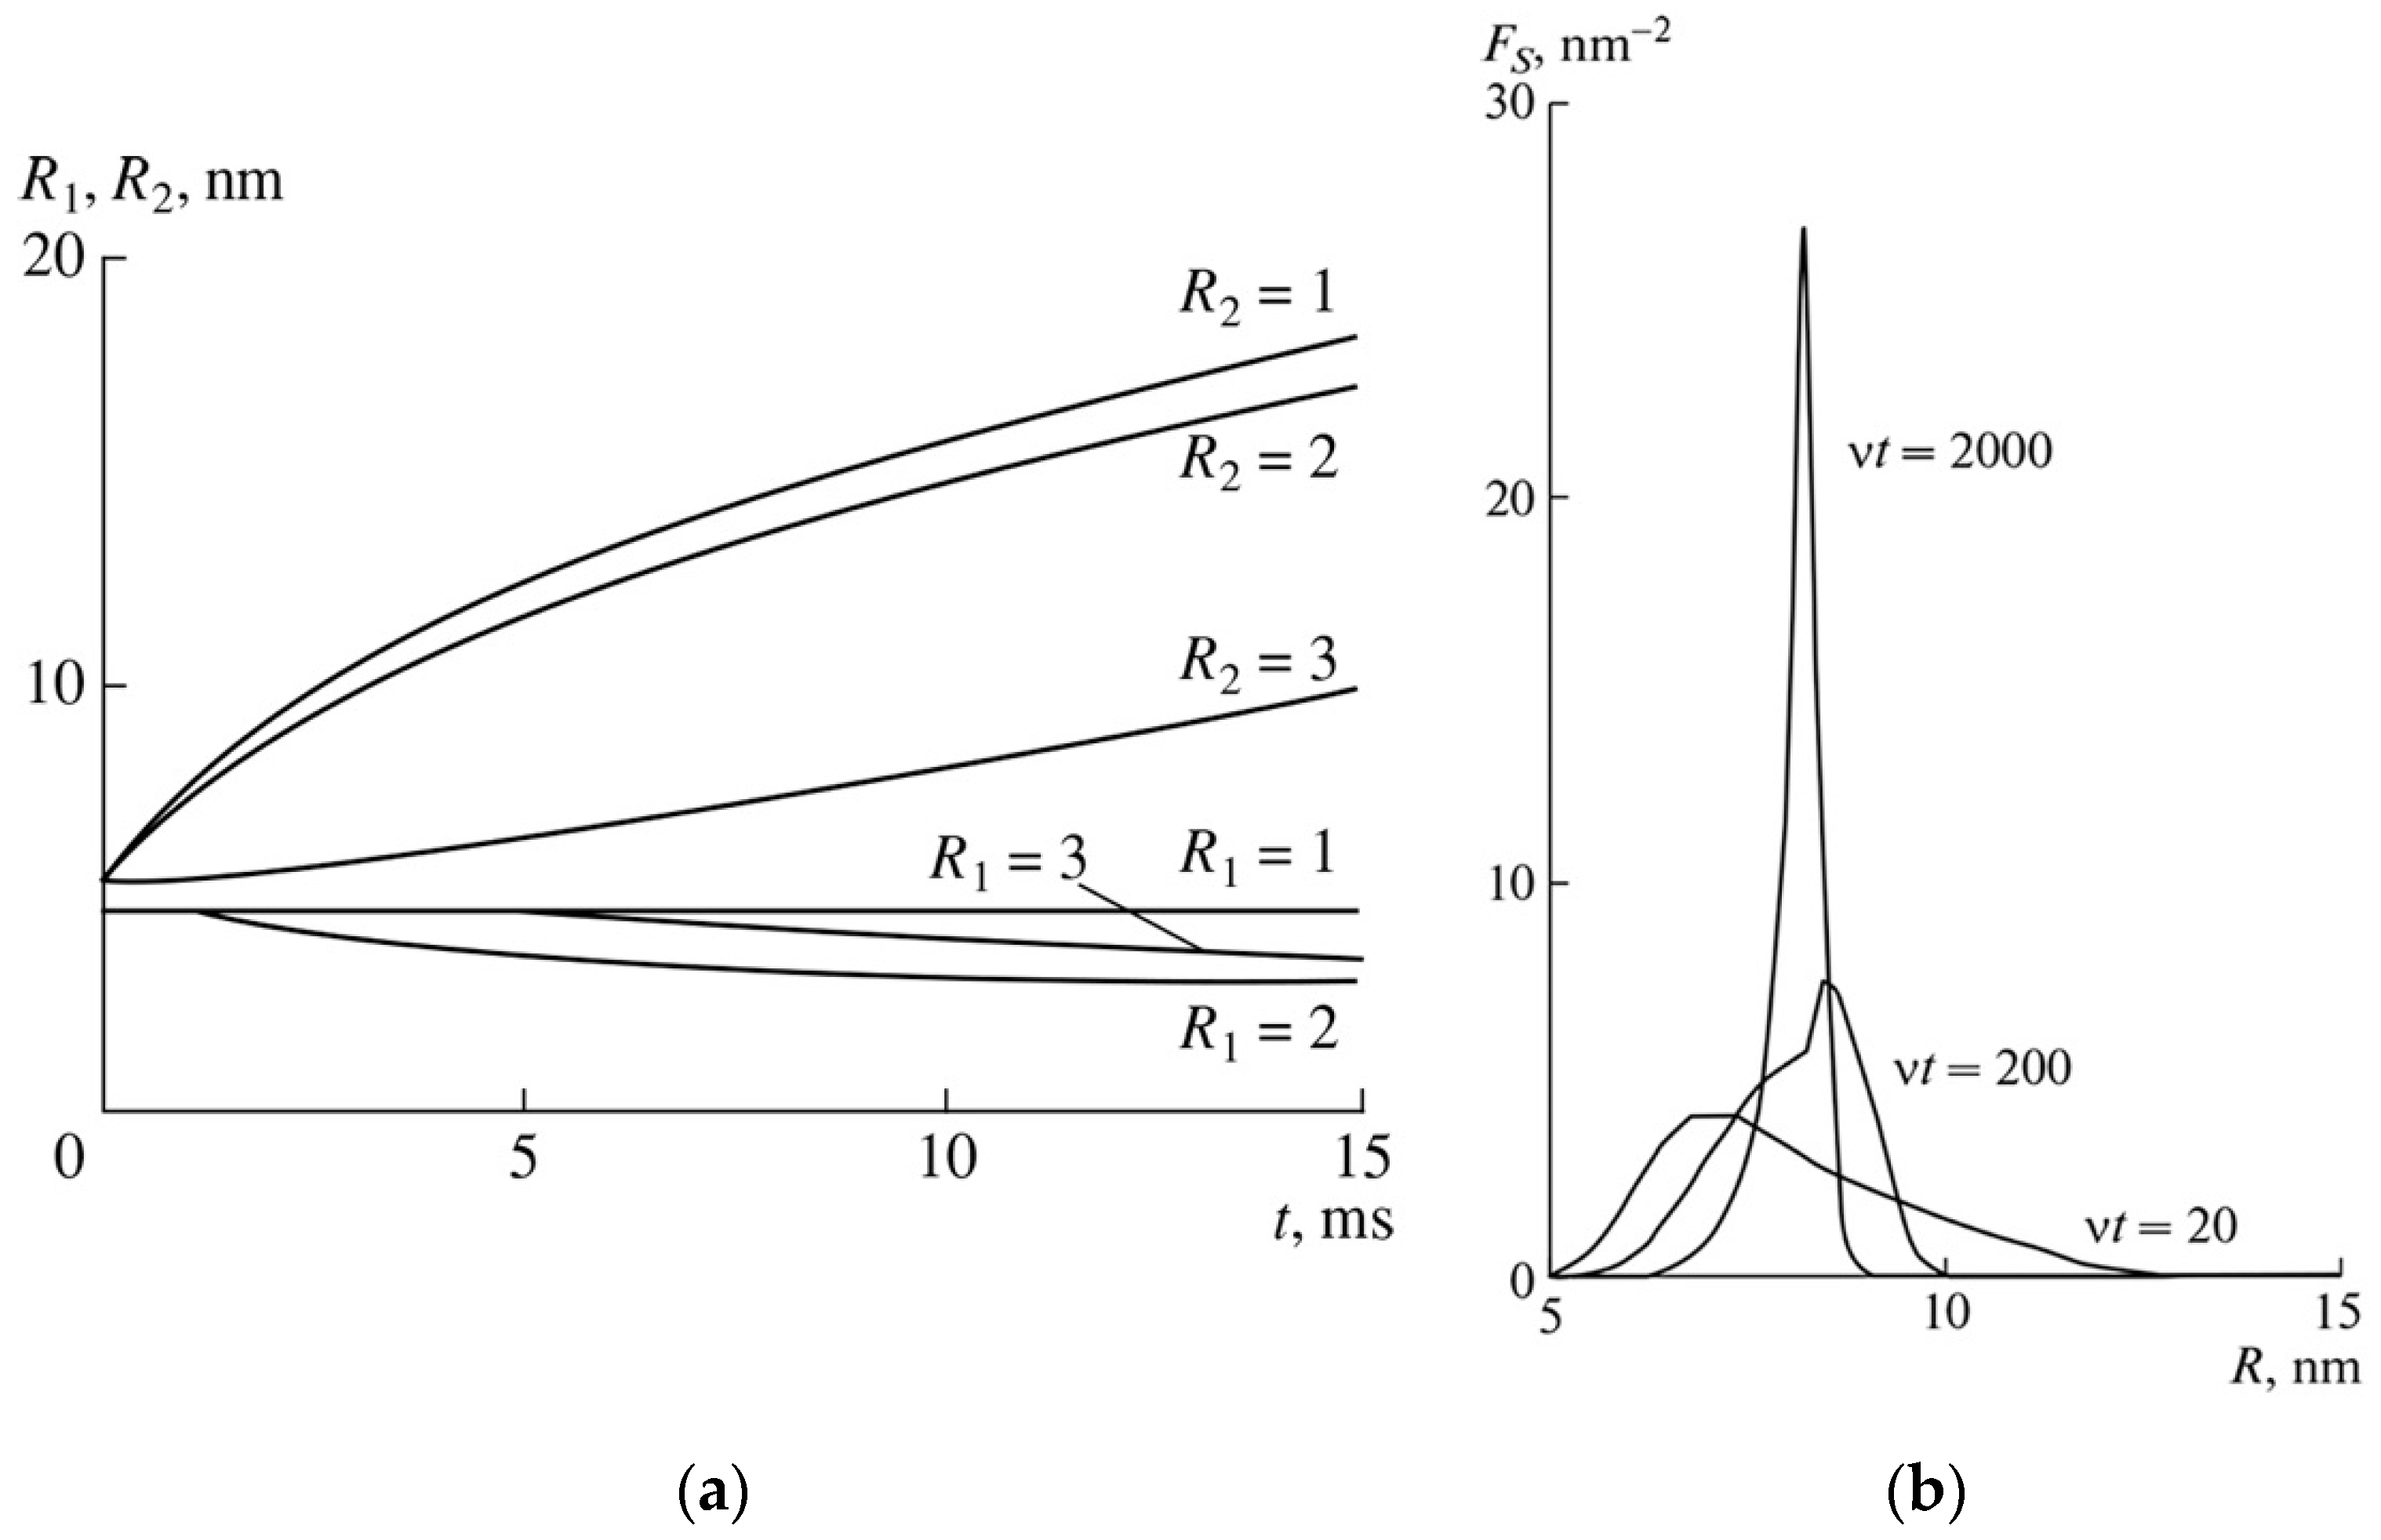
A group of phenomenological models used different time-dependent expressions in order to describe the scrolling process or nanotube growth. Chivilikhin et al. [67] studied the exfoliation and scrolling process of a chrysotile layer using a hybrid MD and continuous model. This approach made it possible to demonstrate the dynamics of the scrolling process once a part of the layer has been detached from the adjacent flat layer, and this is typical of a number of exfoliation processes. Depending on the allowances for spiral slip during the scrolling, the inner radius of the scroll remained constant or decreased continuously during the scrolling (Figure 16a) in order to compensate for the stress gain in the outer layers. According to the model, scrolling in a viscous liquid was quite a fast process that took tens of milliseconds. Later, the model was expanded to the case of nanoscrolls’ ensemble [68] in order to track down the evolution of radius distribution (Figure 16b). The authors showed that, during recrystallisation, the nanoscrolls tried to reach some model equilibrium radius .
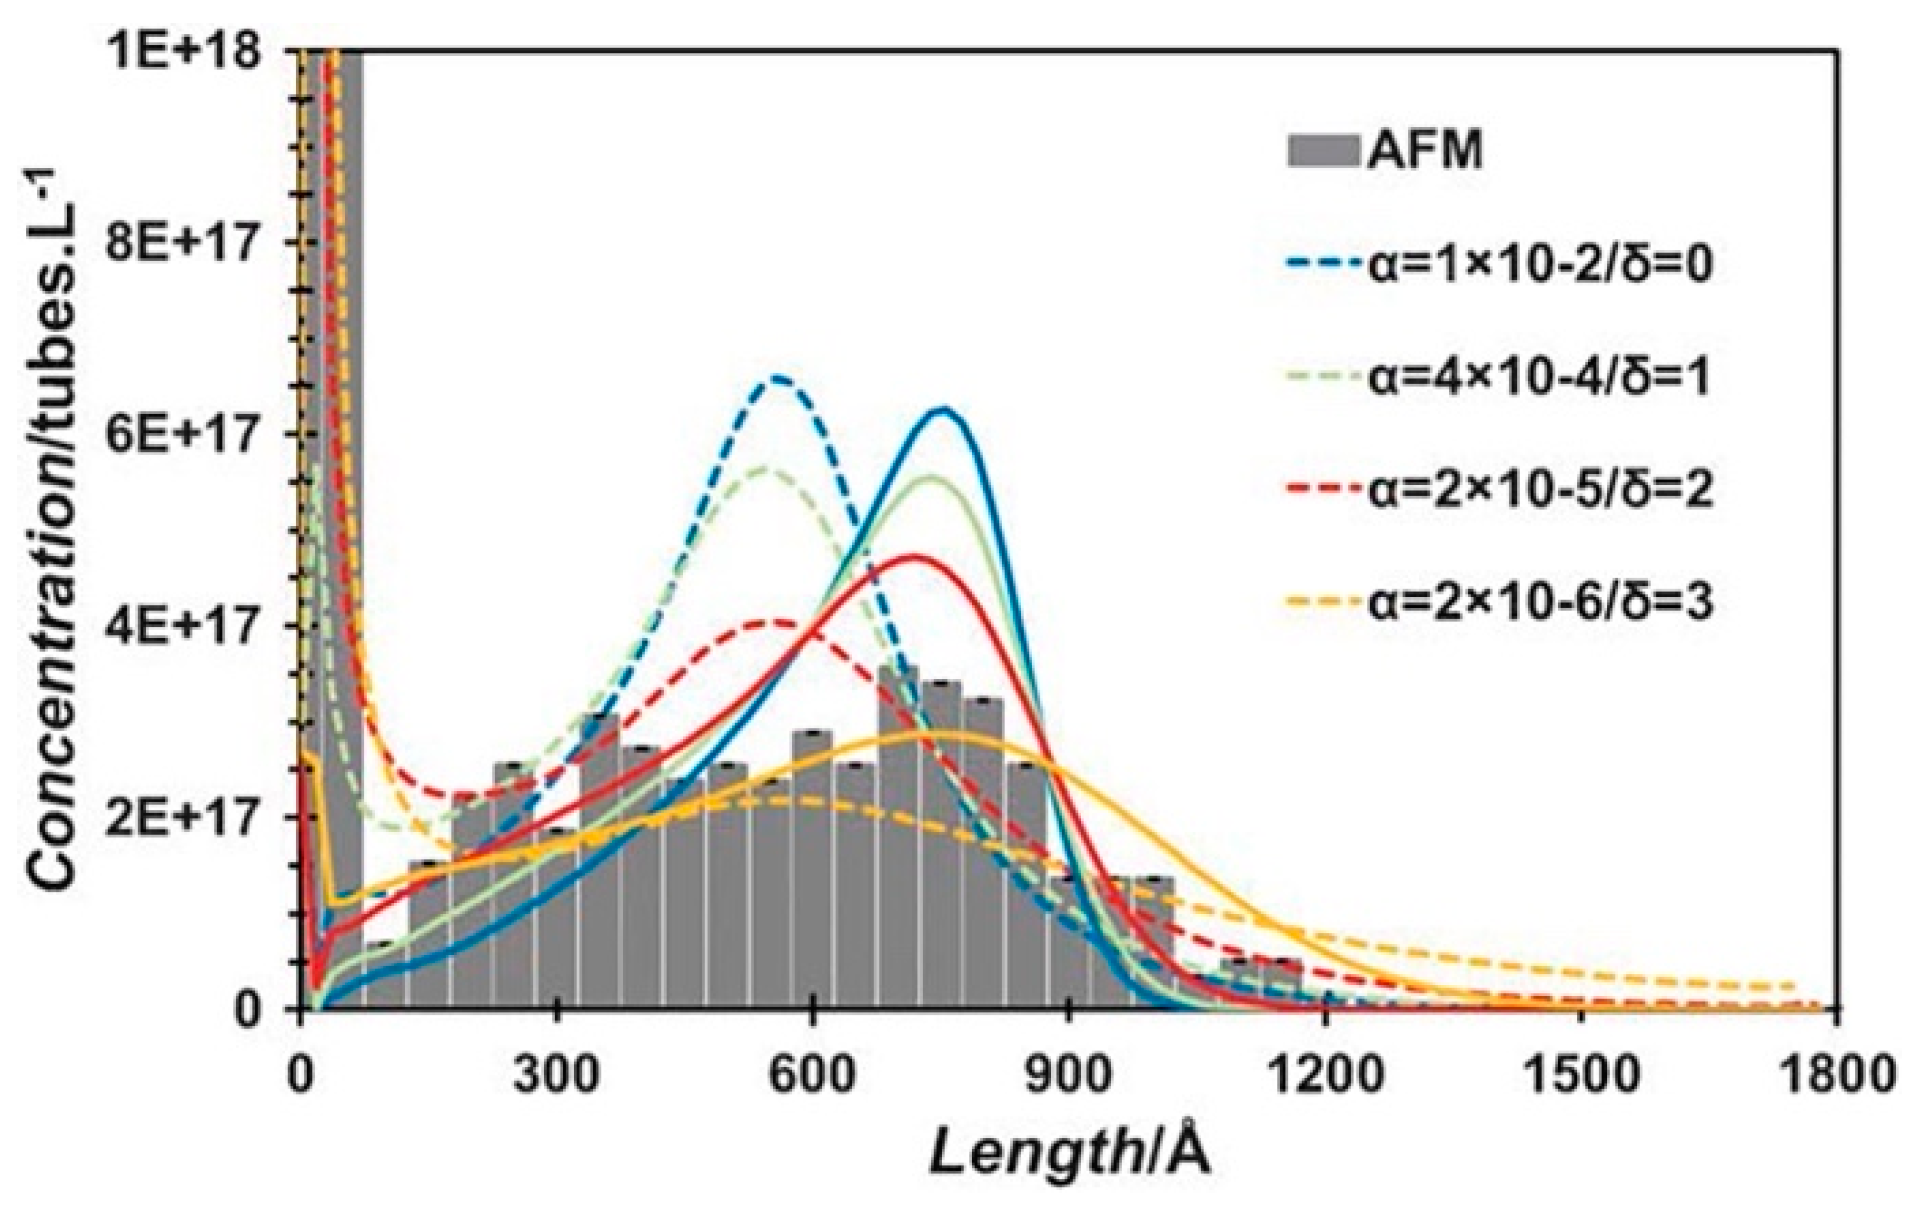
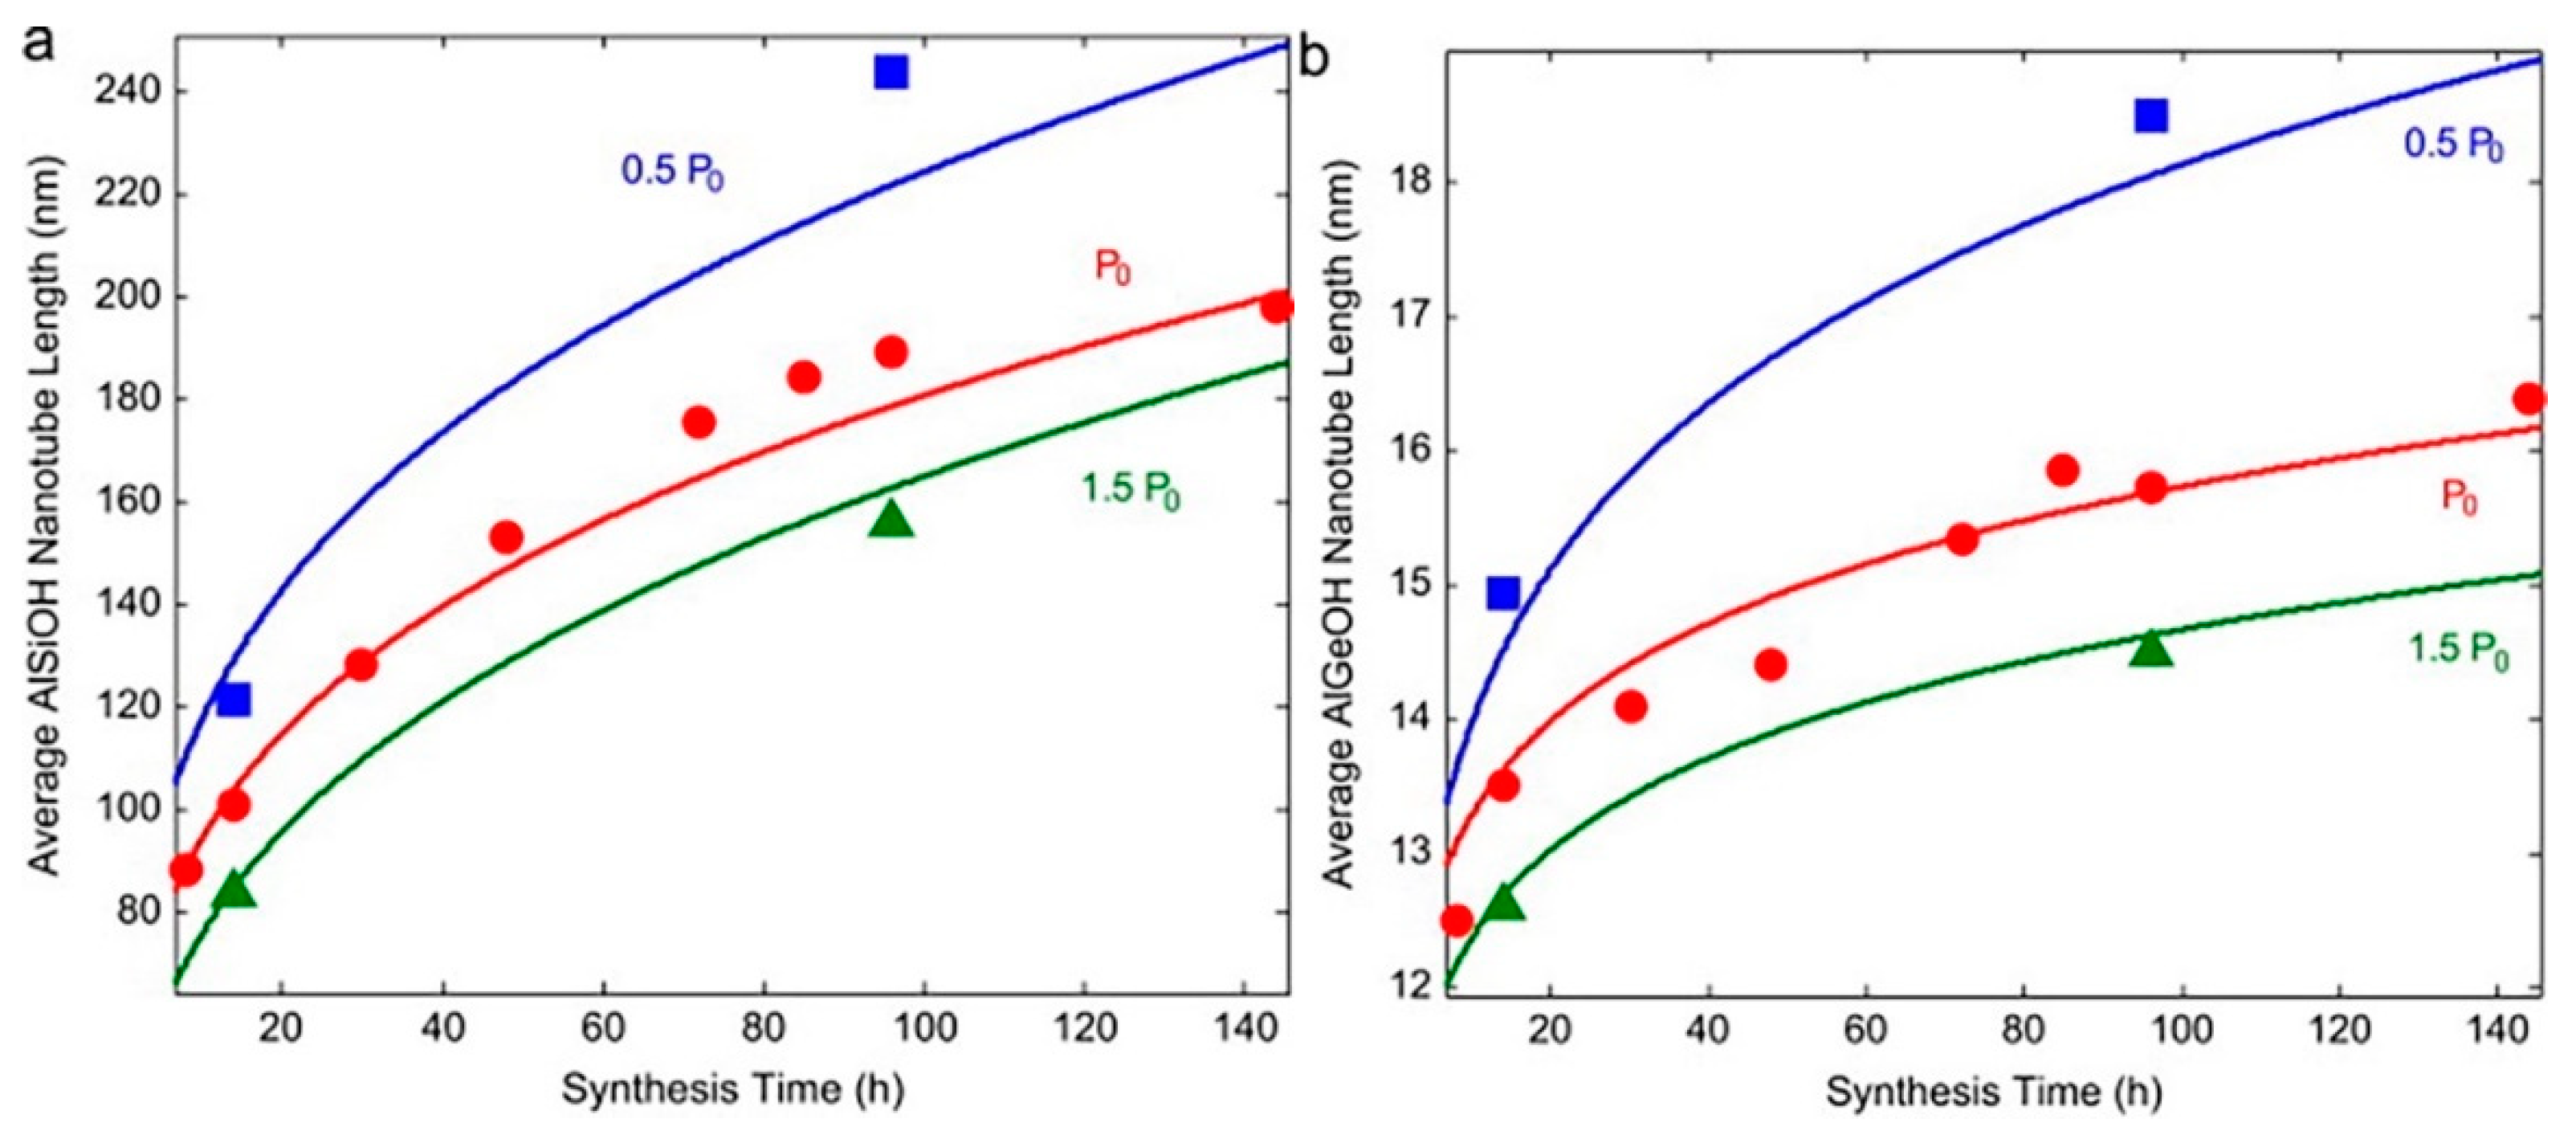
While nanoscrolls’ growth in diameter (‘radial’ growth) required additional model amendments in order to account for strain, it seems that the growth in length (‘axial’ growth) obeyed some conventional kinetics. Maillet et al. [69] compared the influence of dissolution (recrystallisation) and tip–tip collision, (it might also be called ‘oriented attachment’), on the Ge-imogolite nanotubes’ length distribution. Both hypotheses yielded theoretical length distribution curves that described experimental results fairly well (Figure 17) for long tubes. However, the model based on recrystallisation drastically lowered the short tubes’ content, which led the authors to conclude that tip–tip collisions had a prime role in the growth process of Ge-imogolites. Using an analogical approach, Yucelen et al. [70] described the growth kinetics of Si- and Ge-imogolites. The authors shifted from a dissolution–precipitation mechanism to precursor addition growth, which probably had a stronger correlation with the precursor’s initial concentration. However, this might be valid only during the initial growth stages, when this concentration is high. The combination of this mechanism with oriented attachment enabled the description of both the length distribution and average length value evolution for the range of initial precursor concentration (Figure 18).
2.3. Direct Introduction of Sheet Size Difference into the Energy Equations
Very few theoretical papers have been devoted to the study of the cation substitution effect on the morphological features of hydrosilicate nanoscrolls. This was one of the reasons for the modification of the energy Equations (1) and (2) made in [71]. The modification introduced the radius of the mechanically unstressed layer into the strain energy component:
where is the Young’s modulus, is the full thickness of the layer, is the Poisson ratio and is the current radius of curvature. The proportionality in Equations (1) and (2) originated from the analytical modelling of carbon nanotubes’ strain energy. In such a case, the flat carbon layer would indeed be stress-free, but it seems not to be so in the case of the hydrosilicate layer. The introduction of a surface tension difference term does not eliminate the issue completely, because there is a risk of overestimation of the surface tension (specific surface energy) value. The proposed correction effected a kind of role reassignment between strain and surface energy terms and a separation of the two scrolling drivers. For example, there are artificial structures that scroll only due to the lattice misfit between sheets [72,73]. Conversely, there are layers that grow and scroll—with a micron scale diameter—at the gas/liquid interface, merely due to a large surface energy difference [74].
The value could be expressed in terms of the sheet size, in the following approximation, assuming an equal thickness of the outer and inner sheets:
where and are the specific sizes of the two sheets, . The choice of and depends on the particular case. Their values could be equal to the hydroxide lattice constant, or proportional to the number of polyhedrons. Some of the specific sizes are shown in Figure 4. In the case of imogolite, these sizes are the distance between two oxygens in the gibbsite sheet and the size of the side of the silica tetrahedron.
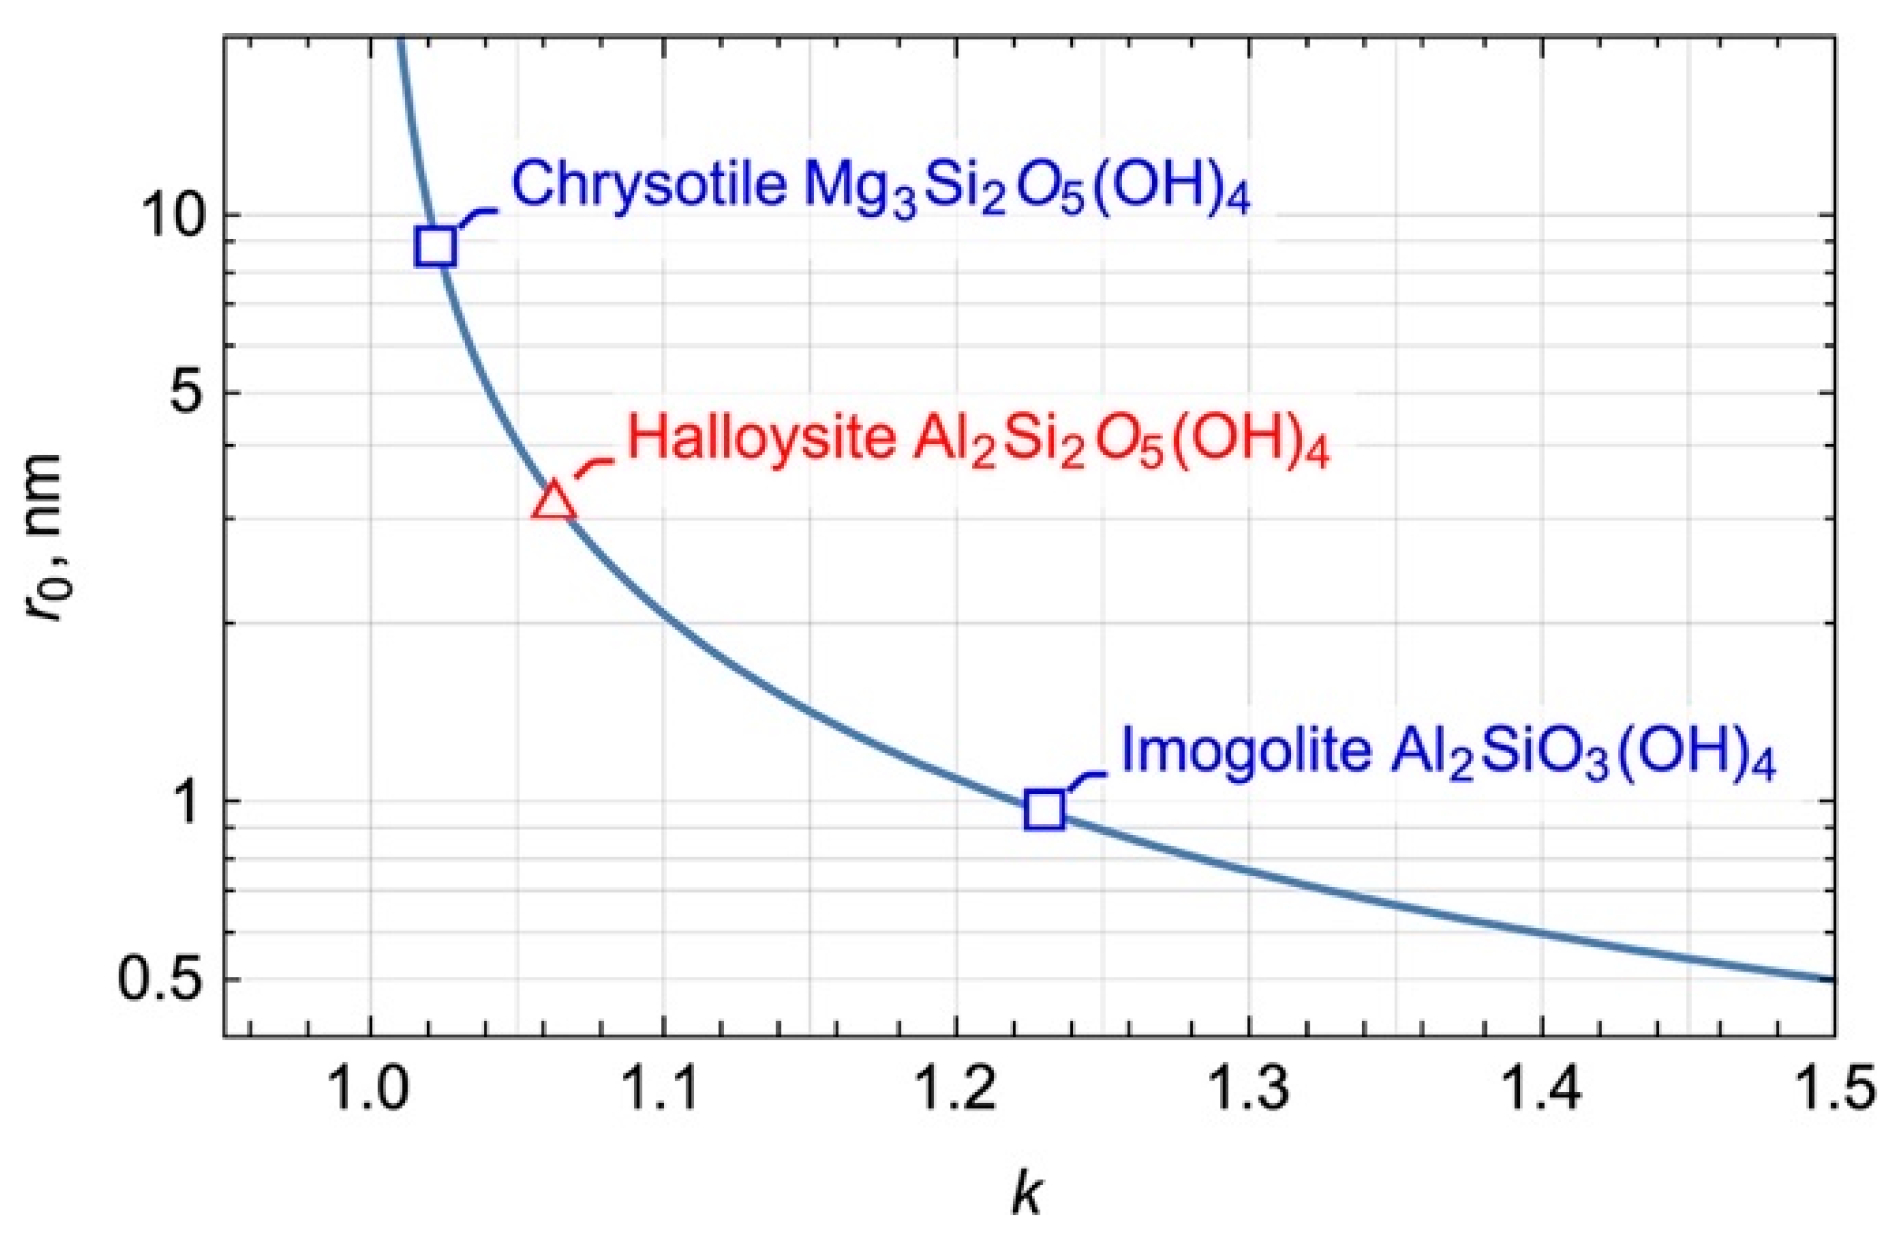
Figure 19 presents as a function of the ratio. The correct value calculation would be the first step for the prediction and design of hydrosilicate nanoscrolls’ morphology. The direct implementation of the sizes taken from Figure 4 yielded nm () for imogolite (compared with 0.99 nm [29,32,41,42]), nm () for halloysite (compared with 3.3 nm [56]) and nm () for chrysotile (compared with 8.8 nm [58]). Obviously, the use of hydroxide lattice constants generates an error that become crucial in the estimation of large values, due to the form of the function. For example, if the lattice constant nm for partially dehydroxylated Mg(OH)2 (dehydroxylation would indeed be needed to attach the silica network) were to be used [75], the value would be nm (), which is much closer to the DFT-obtained value.
Another way to overcome this issue is to use DFT-obtained values, which are more precise as reference points for continuous modelling. Then, the value of a new nanotubular compound obtained by cation substitution could be expressed through the of a starting reference compound, assuming the constant size of one of the sheets. For example, in the case of Ni3Si2O5(OH)4 the value would be [76]:
where nm and and are specific sizes of Ni(OH)2 and Mg(OH)2, respectively. The equation yielded a figure of 15 nm in this case. If the direction of scrolling is opposite with respect to the reference structure [77]:
This equation yielded nm for halloysite (chrysotile as reference), which is in good agreement with the previously published results [56]. The same equations could be obtained in the case of tetrahedral substitution, assuming the constant size of the octahedral sheet. An intermediate compound could be calculated using Vegard’s law approximation.
To conclude, the estimation of the value on the basis of the crystal structure is rather simple but great care must be exercised. The Equations (4)–(6) should be used as a valid initial approximation, followed by DFT refinement, if possible.
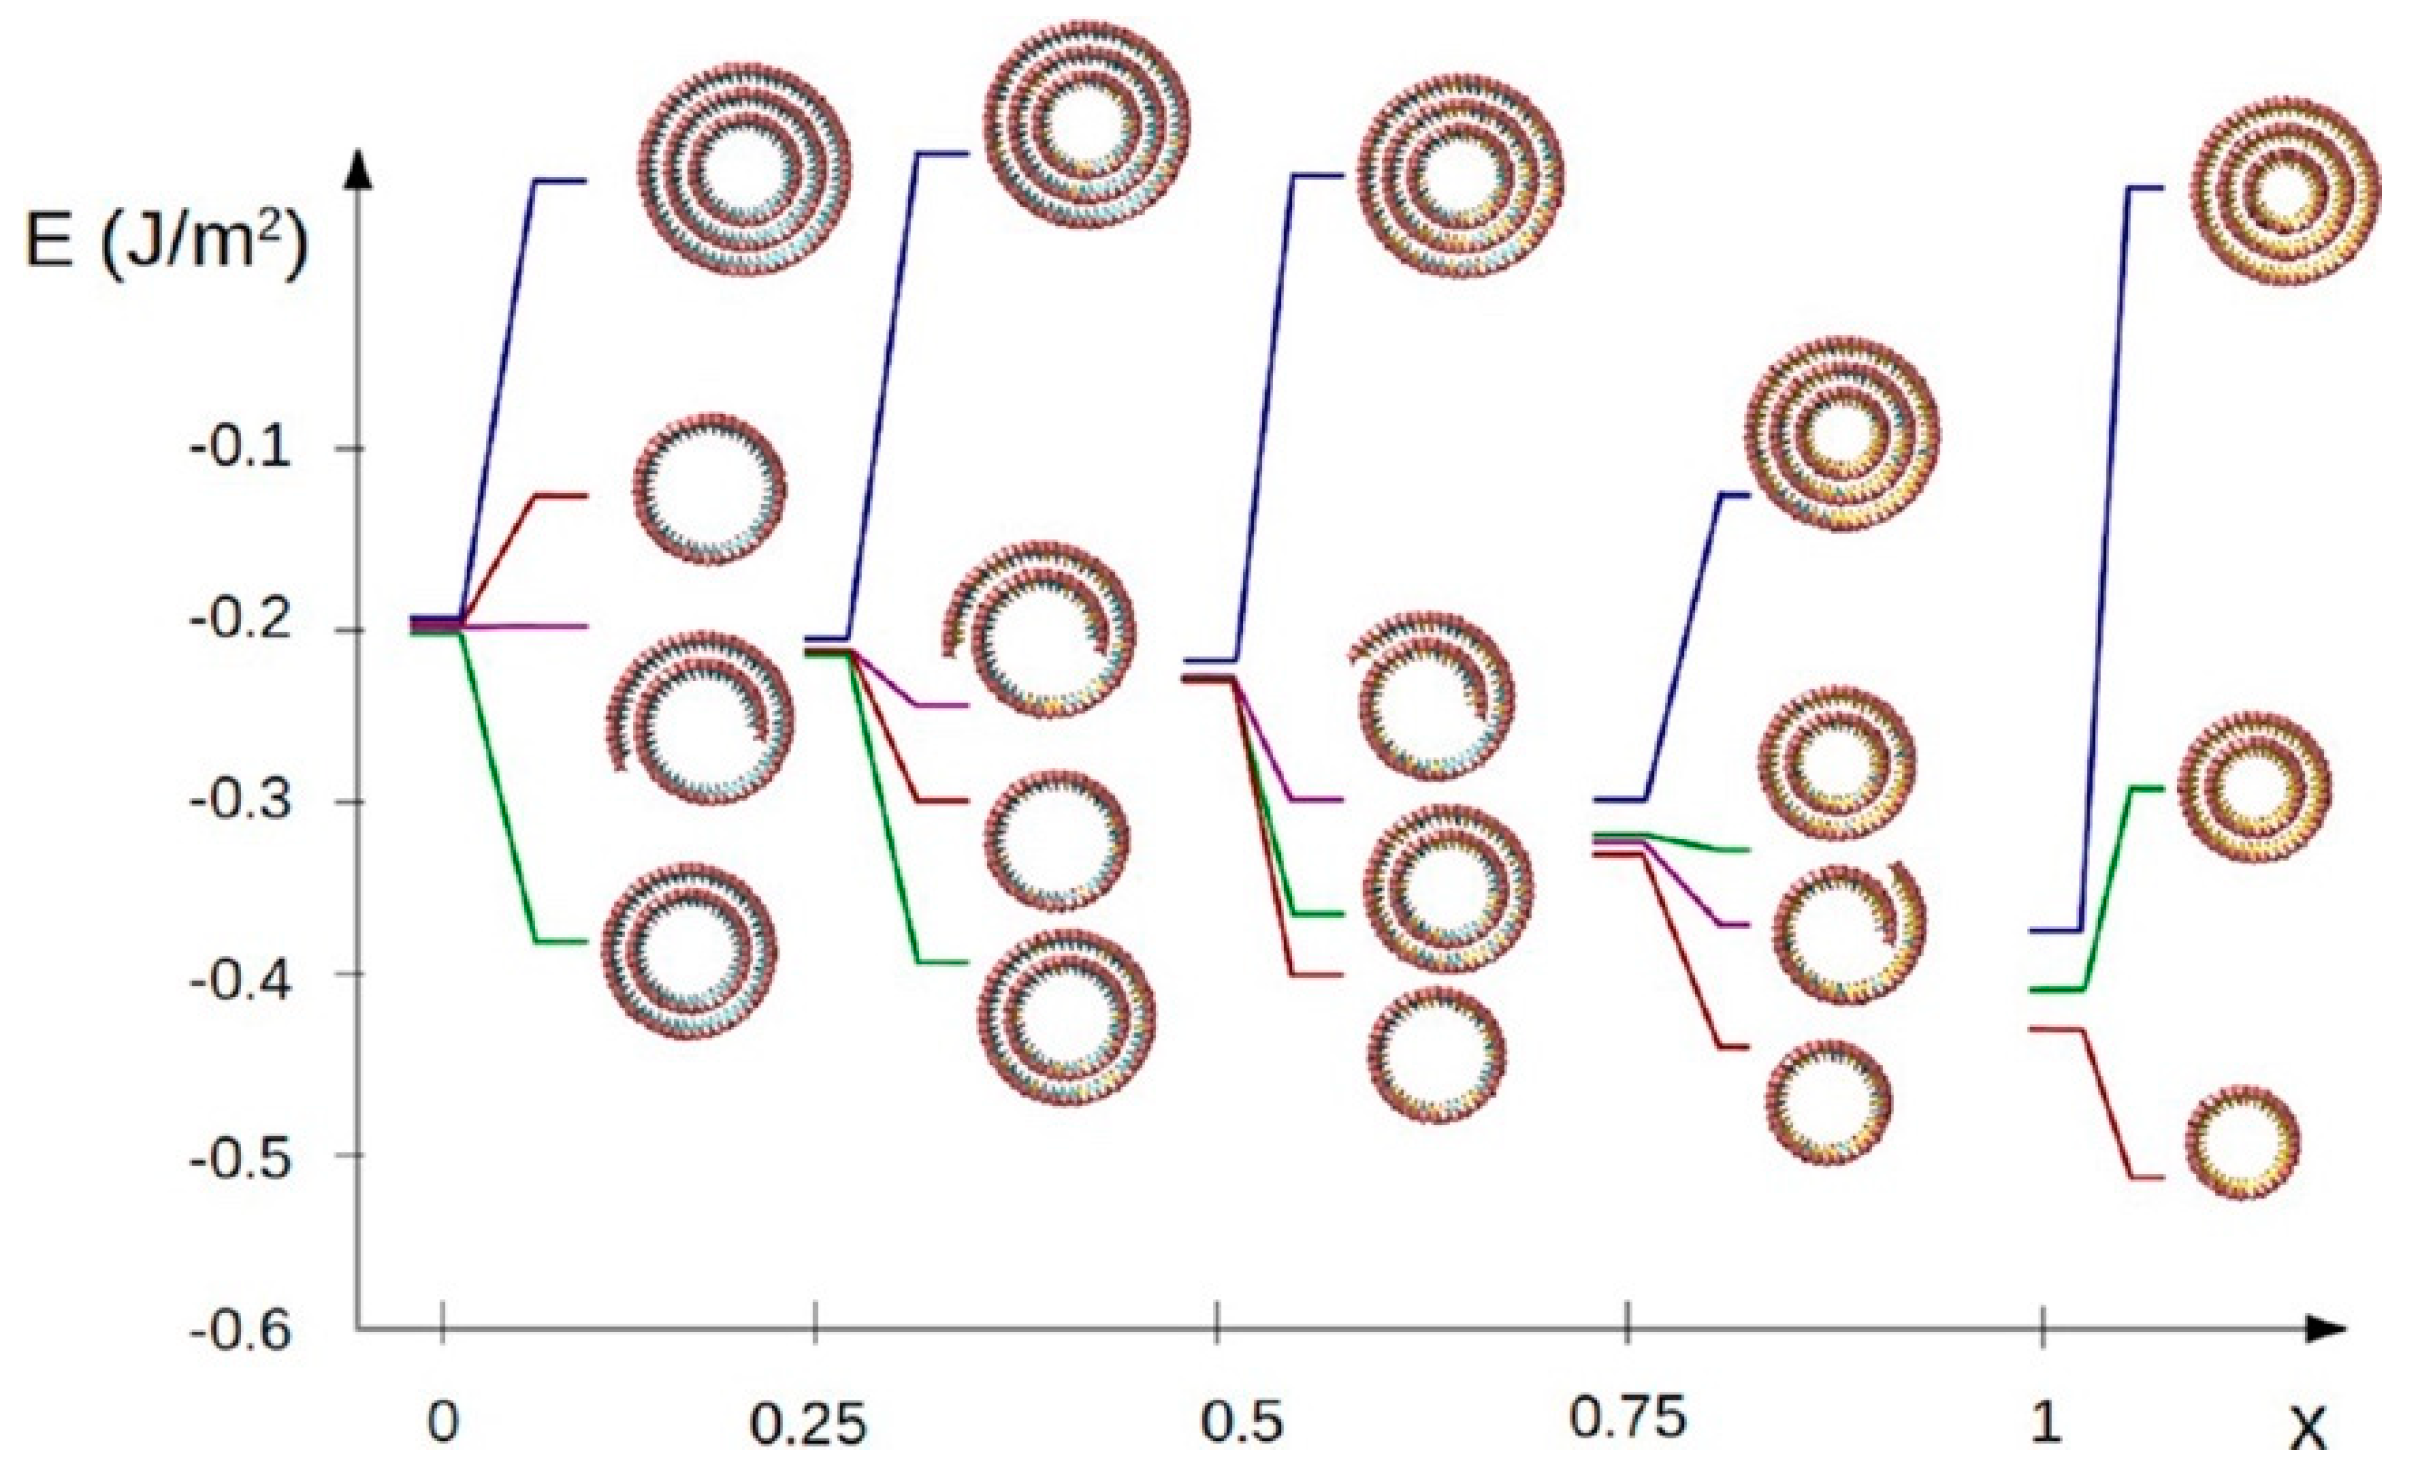
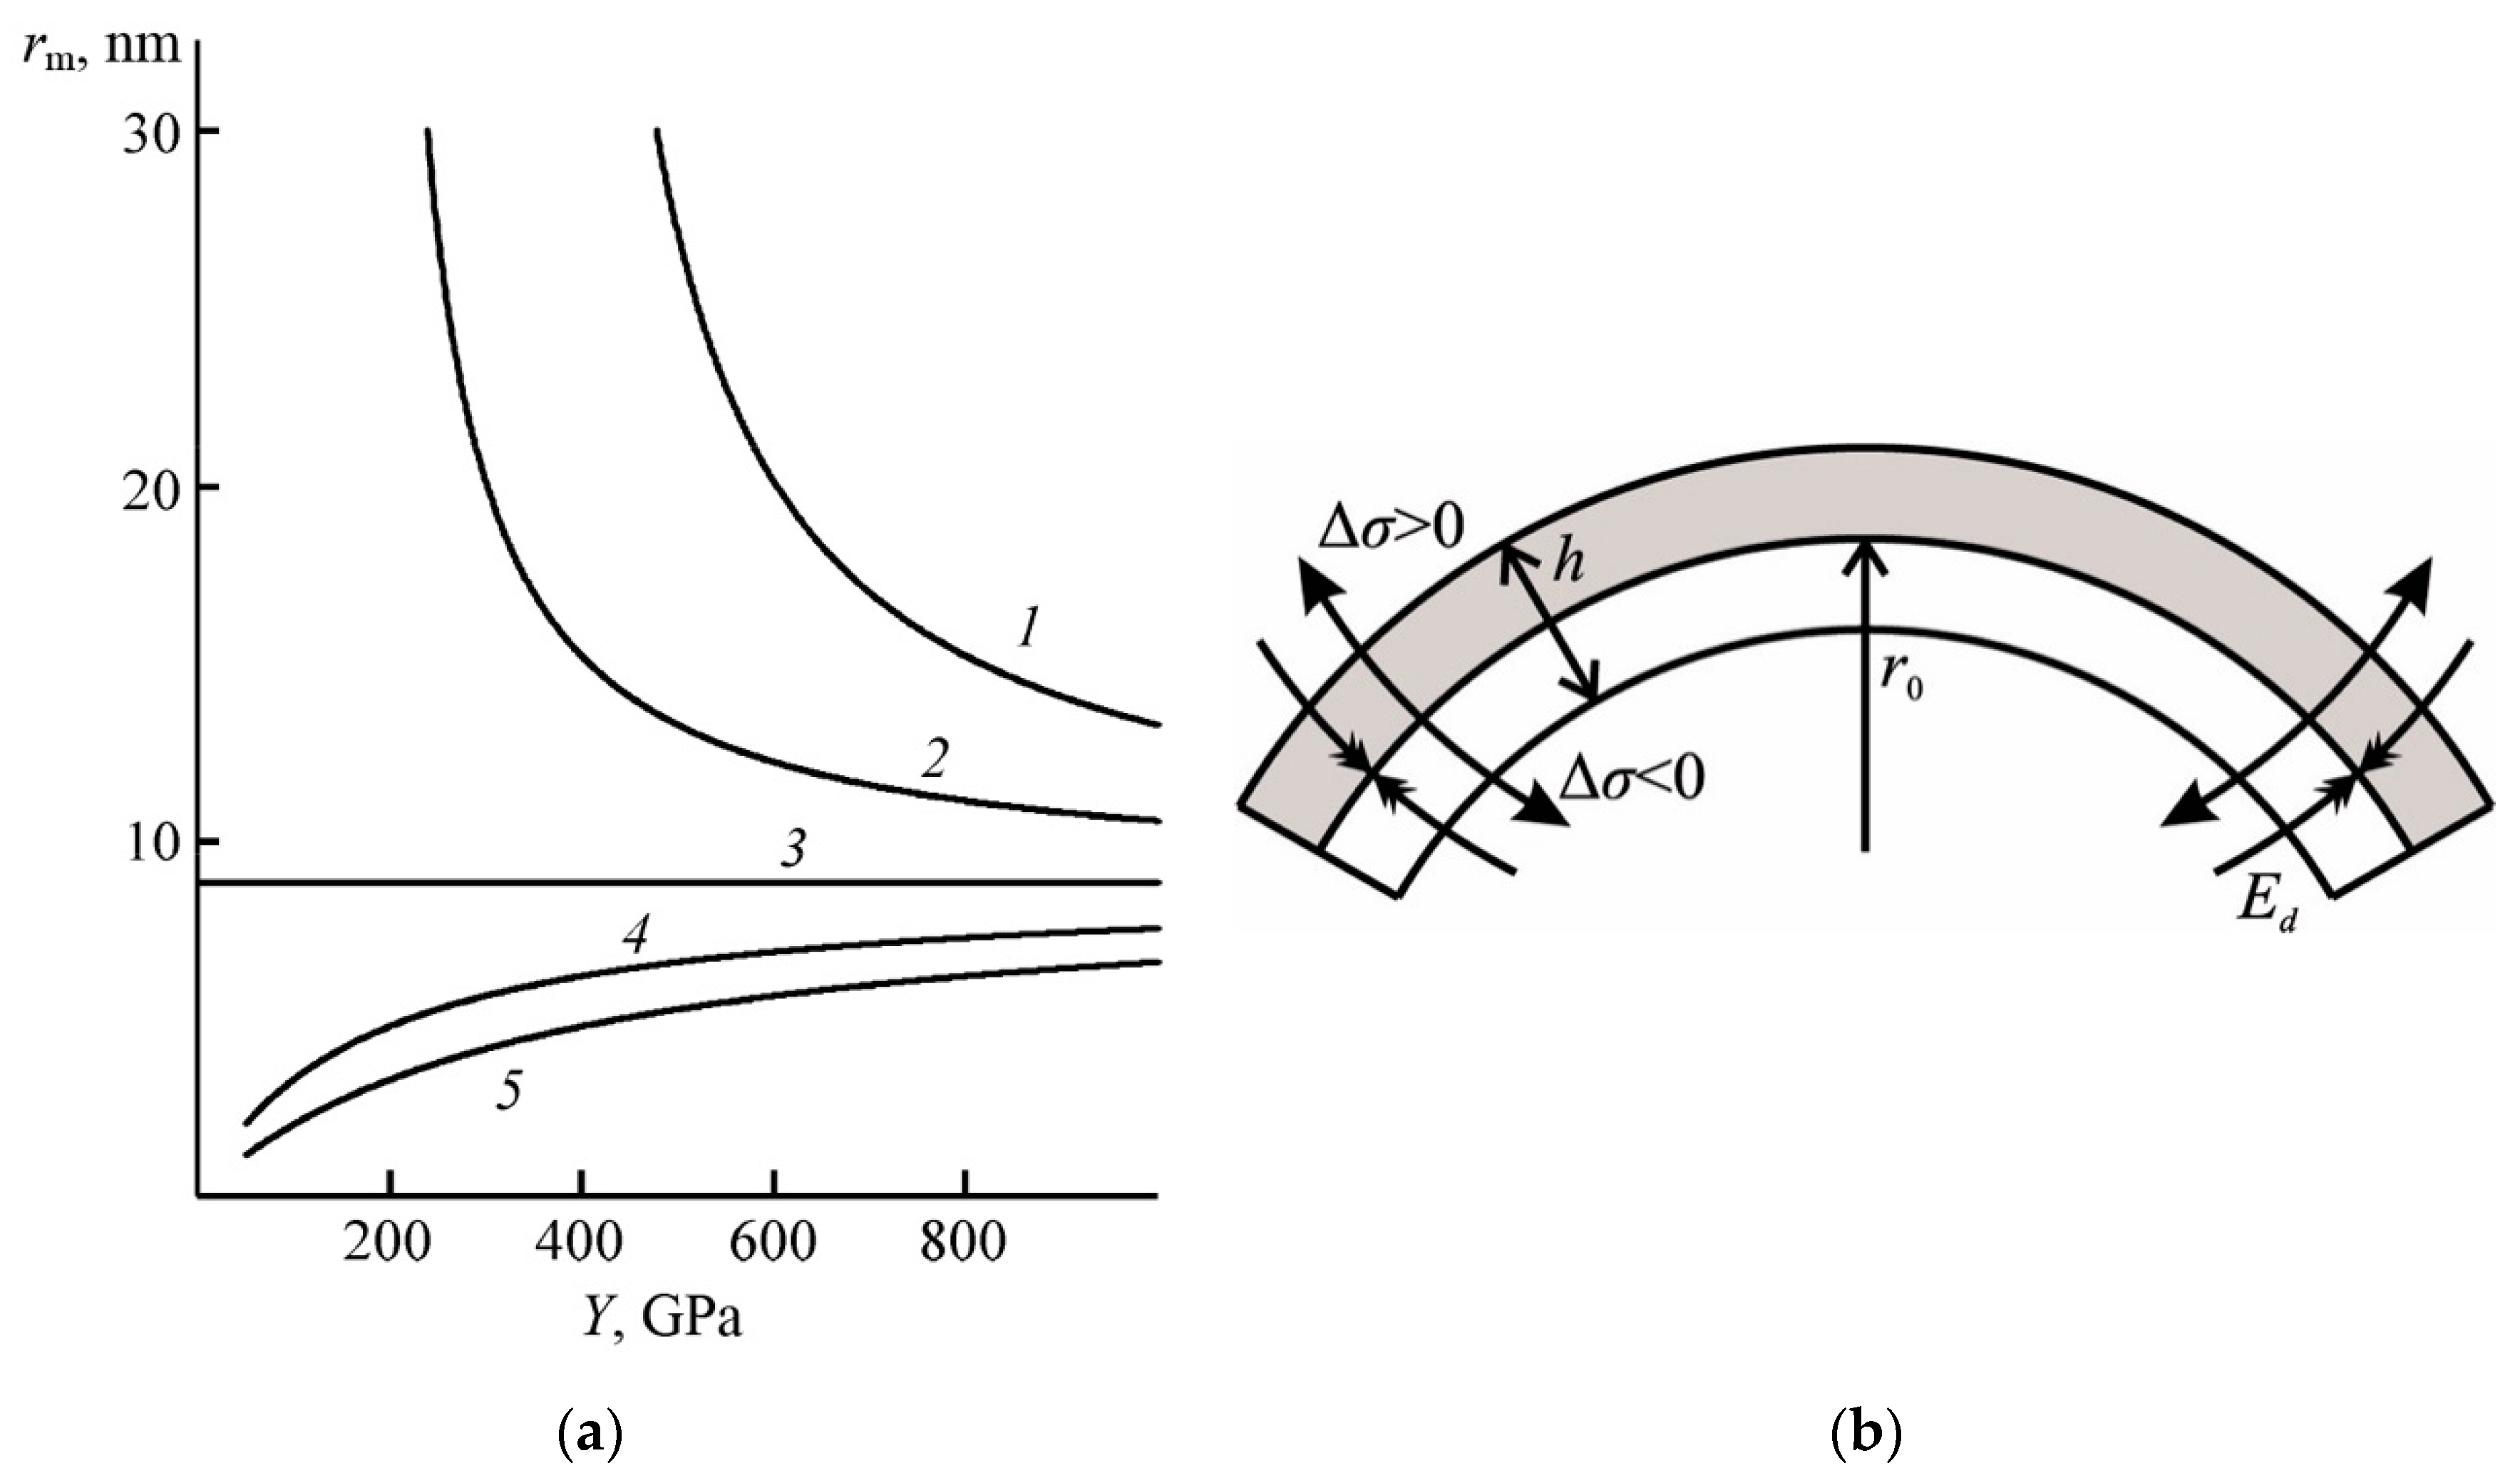
By using Equation (3) together with the surface energy equation (which was almost equal to the second term of Equation (2)), Krasilin and Gusarov [71] revealed two general cases of scrolling (Figure 20). The action of strain attempted to bend the layer in such a way that the larger sheet became the outer one. In addition, it stabilised the radius of curvature around in order to minimise strain. On the other hand, the forces caused by surface energy difference attempted to bend the layer in such a way that the sheet with the higher became the inner one in order to minimise its surface area. With respect to the flat layer, the surface energy difference could amplify bending and scrolling (curves 4 and 5 in Figure 20a) or compete with the action of strain (curves 1 and 2). It is noteworthy that, according to a number of papers devoted to Mg(OH)2, Al(OH)3 and SiO2 specific surface energy calculations [78,79,80,81], hydroxides have J/m2 whereas corresponding oxides have J/m2. Therefore, all of the layers that would prefer halloysite-type scrolling would experience some difficulties because of strain/surface energy competition [77].
Krasilin and Gusarov [82] expanded the single-walled case to multi-walled chrysotile scrolling, assuming an Archimedean spiral form of the cross-section, a cylindrical form of the nanoscroll and the free slipping of adjacent layers. The former assumption made it possible to consider the scroll to be of an unlimited (in terms calculation) number of layers, as mentioned in [65], in order to find its energy minimum (Figure 21). A kink in the curve, shown in Figure 21, corresponded to the beginning of multi-walled scrolling with a large energy effect due to adhesion.
Finally, by increasing the cell size (the length of the Archimedean spiral or the length of the cylinder), the energy model could simulate the equilibrium nanoscroll growth process. The study [83] demonstrated a correlation between the outer and inner diameters of ‘growing’ nanoscrolls that depended on the structural parameters of the model (Figure 22). A simultaneous increase in the outer and inner diameters was caused by the same conflict between the strain and surface energy (Figure 20). An important result was the observation of a general energy minimum of ‘growing’ single- or multi-walled nanoscrolls, which can now be compared with the sizes of multi-walled nanoscrolls obtained in the experiment.
Summarising this part of the review, we would like to underline the need of the adequate parametrisation of the energy model. For example, the model [83], discussed above, includes three energy components: strain, surface, and adhesion energy.
Young’s modulus and the are key parameters for the estimation of the strain energy. The latter can be determined by either using specific sizes and through the Equation (4), or by using the reference structure and the Equations (5)–(6). Metal oxides, metal hydroxides lattice constants, and the sizes of single metal–oxygen polyhedrons can be used as the specific sizes. Young’s modulus has to be chosen on the basis of experiment or theoretical calculations. The DFT calculations [42,56,57] predicted in the range of 200–400 GPa for the hydrosilicate nanotubes. This range can be a reasonable approximation for the energy model.
Specific surface energies of all surfaces have to be determined for the surface energy calculation. It is reasonable to assume that, due to hydroxylation, the specific surface energies of metal hydroxide and silica sheets would be around 0.1 J/m2 [79,80] and 1.5 J/m2 [78], respectively. These values can be obtained firstly by the DFT calculations. Second, assuming the crystal structure is known, the specific surface energy can be calculated as an energy of broken bonds along some plane (hkl), as it was carried out in [78]. Third, the specific surface energy can be determined in a calorimetric experiment. It can be assumed that the specific surface energies of the edge surfaces are at least two times higher than the specific surface energies of outer or inner surfaces. However, the precise estimation of these values is still questionable. Another issue, that should be discussed here, is related to the size (curvature) dependence of the specific surface energy. A decrease in the particle size below 3–5 nm causes a decrease in the specific surface energy down to 0 [84,85]. In the case of multi-walled chrysotile and halloysite nanotubes, this feature can be negligible, but it might have an effect on imogolite morphology. In other words, the imogolite layer can, probably, scroll primarily due to the strain, because specific surface energy difference on the opposite sides of the layer will be eliminated by the high curvature.
In analogy with the surface energy, the specific adhesion energy can be determined as a number of hydrogen bonds per surface area. The energy of a single hydrogen bond can be estimated as a function of interlayer spacing by an empirical equation, proposed, for example, in [86]. Assuming a 0.3 nm interlayer spacing in hydrosilicates, the specific adhesion energy is around 0.1 J/m2. Some particular parametrization cases can be found elsewhere [65,76,77].
3. Morphological Features Related to Cation Doping
Figure 23 shows values for a number of 3:2 chrysotile-, 2:1 imogolite- and 2:2 halloysite-like (Me:Si ratio) structural derivatives, calculated using Equations (4)–(6). It is important to note that the left branch () is shown for the illustrative purpose to underline the opposite direction of scrolling of certain structural derivatives. Formally, all the symbols belong to the right branch (see Figure 19). The synthesis of some of these compounds will be discussed below, in the light of the value change. The specific sizes were adopted from the following papers: Ni(OH)2 [87], Co(OH)2 [88], Fe(OH)2 [89], GeO2 [90], TiO2 [91] and CoOOH [92].
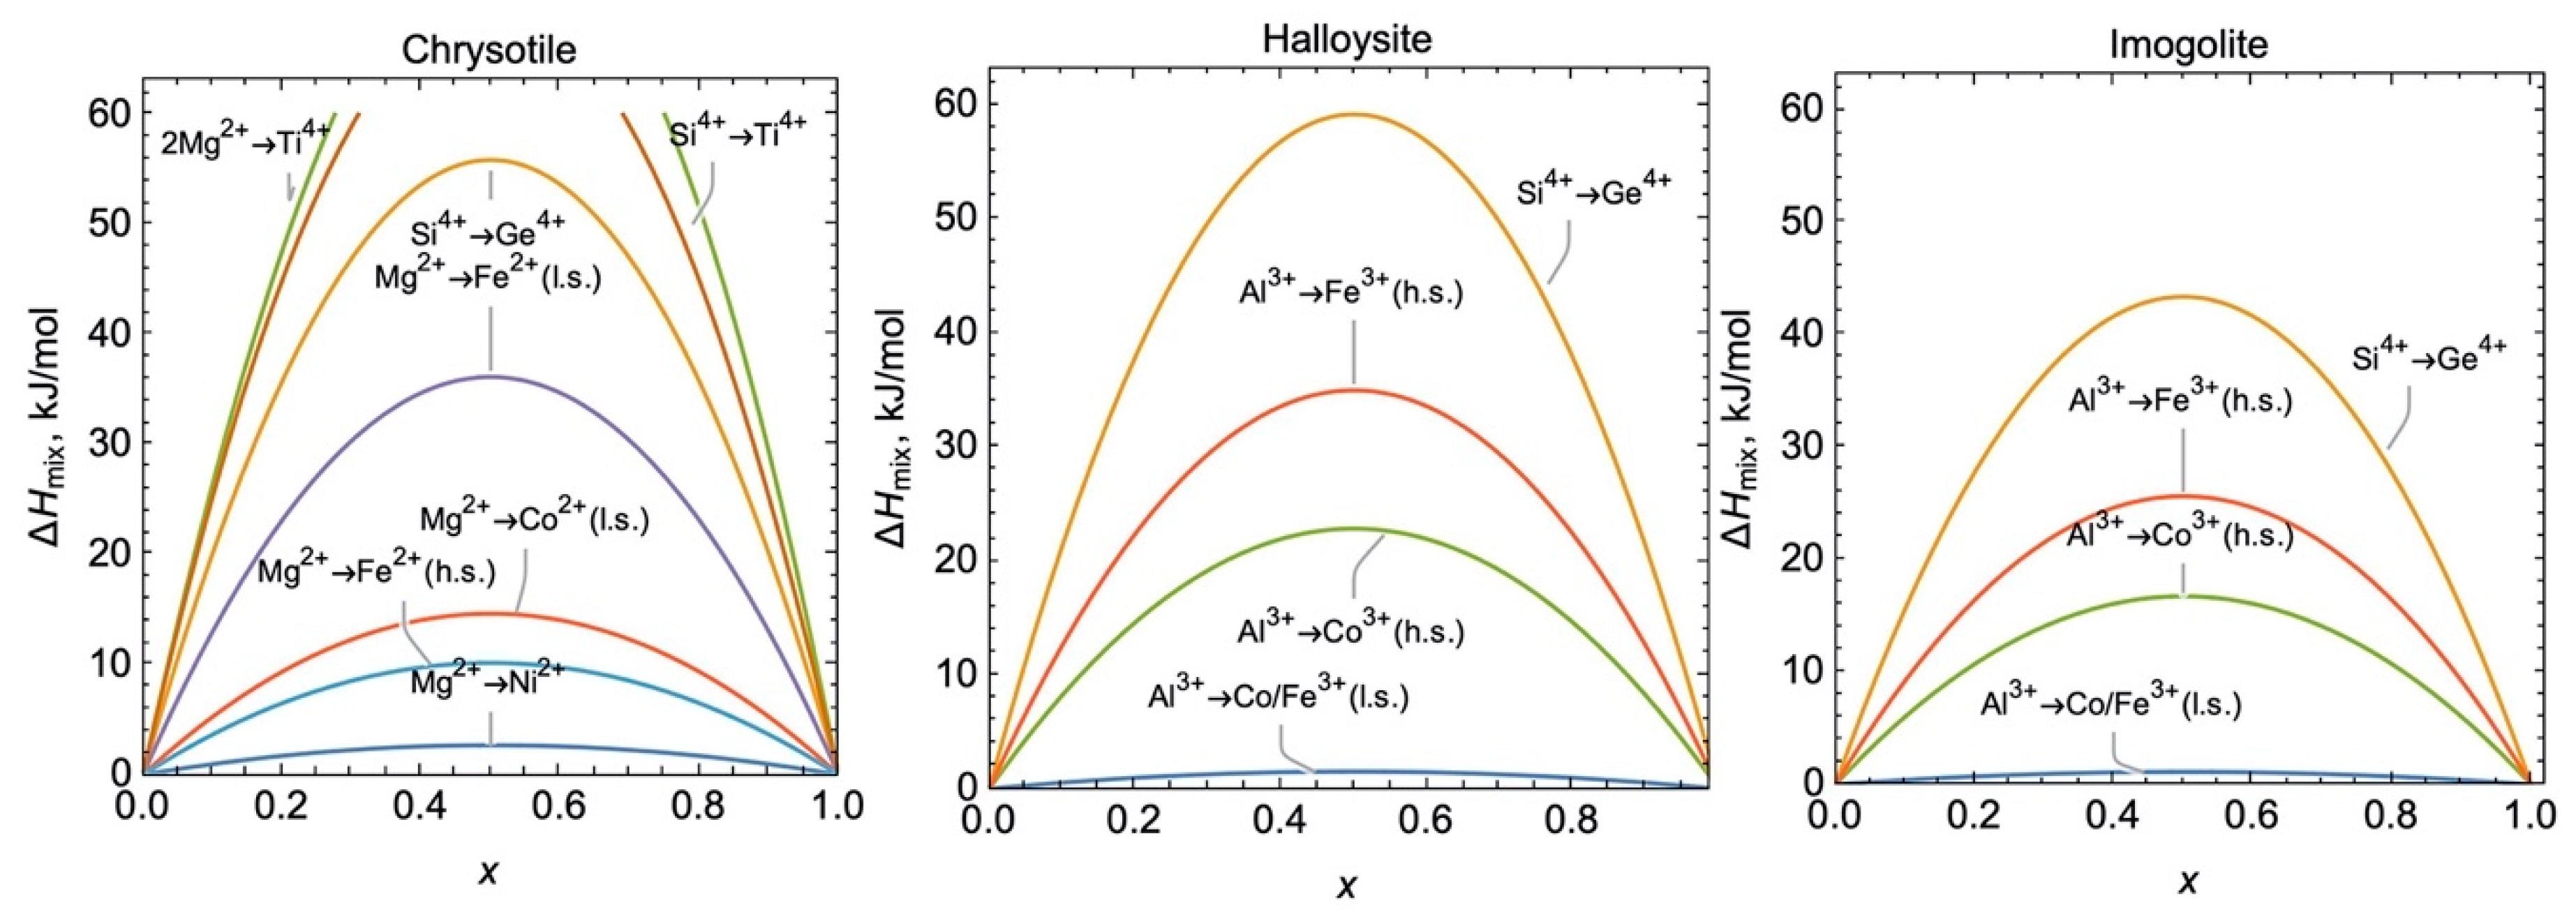
Other useful information can be obtained with the help of the energy theory of isomorphous substitutions. The following equation for an enthalpy of mixing was proposed by Urusov [93]:
where is the mole fraction, kJ/mol is a material-dependent parameter, is the coordination number of the substituted position and and indicate the number of atoms and their valency in the two compounds based on guest and host atoms as , where is the number of atoms and and are the valency of the cation and anion. In the case of a complex oxide, the value can be obtained by decomposition: . is the difference between the cation–anion (metal–oxygen) distances (that are calculated on the basis of effective ionic radii) of the guest and the host cation, and is the maximal distance. These values were calculated on the basis of the effective ionic radii system proposed by Shannon and Prewitt [94]. Figure 24 shows the calculation results, which will be compared with the phase composition of hydrothermal treatment products. Generally, the high enthalpy of mixing speaks in favour of immiscibility and by-product formation.
3.1. Change in Size Parameters, Platy Morphology and Formation of By-Products
Changes in the nanotube diameter and length, the formation of plates instead of tubes and the formation of by-products (usually metal oxides) are among the most common effects of cation doping. First, it is interesting to compare Si4+ to Ge4+ substitutions, because these were made for all three of the hydrosilicates. In the case of imogolite, the substitution led to the formation of double-walled nanotubes with an increased outer diameter [65,95]. The estimated value for Al2GeO3(OH)4 was 1.6 nm (Figure 23), in comparison with 0.96 nm for Al2SiO3(OH)4, which favoured the formation of poly-walled structures. The substitution of Si4+ by Ge4+ in (Mg/Ni)3Si2O5(OH)4 resulted in the formation of platy particles [5,64,96]. In fact, the size difference between the two sheets, here, became even stronger, but the direction of potential scrolling changed to the halloysite-type (Figure 23). We believe that (Mg/Ni)3Ge2O5(OH)4 encounters the same hindrance as synthetic halloysite scrolling, which is, generally, the conflict between strain and surface energy [77]. In the case of Al2Si2O5(OH)4 halloysite (Figure 25), Ge4+ favoured scrolling [97] and decreased the value of the layer down to 1.4 nm. Unfortunately, little attention has been paid to the phase composition of systems with partial Si4+ to Ge4+ substitutions, and this could be important in the context of high values (Figure 24). White et al. [97] claimed that they obtained Ge-doped imogolites with a high Ge content (Figure 25d); the work [65] assumed unlimited miscibility, and X-ray diffraction was not involved [64]. The probable increase in Si–Ge miscibility in imogolite could be related to a decrease in dimension, from a 2D SiO2 network in halloysite and chrysotile to 1D or even 0D [98,99].
The next case is cation substitution by Ti4+. Although this cation prefers octahedral sites, the difference between Mg2+ and Ti4+ charges would not allow large miscibility. Moreover, the effective ionic radii of Ti4+ in VI and IV coordination did not fit with those of Mg2+ and Si4+, making the value the highest among the other cases shown in Figure 24. Nevertheless, several attempts at Ti-doped chrysotile synthesis were carried out. Bloise et al. [100] synthesised Ti-doped chrysotile by the hydrothermal alteration of Ti-doped forsterite with a TiO2 content in the 0.3–1 wt.% range (X-ray spectroscopy analysis). The authors estimated the mean outer diameter of 200 nanotubes to be 70 nm. The highly crystalline forsterite required an increased hydrothermal treatment time up to 384 h. The role of pressure was also studied: an increase in the pressure shortened the nanotubes’ length from a maximum of 30 µm at 1 kbar to 3 µm at 2 kbar. At the end of the treatment, the system contained several phases together with nanotubes. Maslennikova and Gatina [101] performed the synthesis (Figure 26) using Ni(OH)2, NiSiO3 and TiF4 as starting components. At the minimum TiF4 content of 10 wt.%, the system already contained montmorillonite and nickel titanate as by-products.
Doping by Fe2+/3+ could occur in both the octahedral and tetrahedral sites of the structure. The calculated value strongly depended on the type of cation configuration (low spin or high spin). With Fe2+, the main problem was that the oxidation process was intensified by high pressure hydrothermal conditions. Korytkova et al. [102] studied (Mg,Fe)3Si2O5(OH)4 formation, choosing (Mg,Fe)SiO3 and (Mg,Fe)O as starting components. The authors mentioned an increase in Fe3+ content with an increase in the total Fe content in the system. It was nevertheless possible to obtain single-phase (Mg,Fe)3Si2O5(OH)4 tubes or plates if the initial FeO content was below 15–20 wt.%. The average outer diameter of the tubes increased from 30 to 60 nm with an increase in Fe content, whereas the for (Mg,Fe2+)3Si2O5(OH)4 was lower than that for pure chrysotile (Figure 23). This means that a sufficient amount of Fe2+ was oxidised, (or another effect, discussed in Section 3.2, below, took place): this affected at least half of the total iron content, according to the author’s estimation. Another attempt at Fe2+ stabilisation was reported in [103]. The authors used several types of starting mixture containing FeO and FeCl2·4H2O, sealed in Pt ampules by an arc welding technique. Most probably, the presence of a shielding gas inhibited (but did not exclude) the subsequent oxidation of iron during hydrothermal treatment. The authors reported on Fe3Si2O5(OH)4 nanotube formation with diameters in the 8–70 nm range. Others [104,105] have considered the effect of Fe3+ doping on chrysotile structure and morphology. The authors estimated the molar content of Fe3+, normalised to the sum of Mg and 1.5Fe (including one vacancy per two iron cations), at which the stabilisation of plates occurred, to be 7 at.%. A further increase in Fe3+ up to 22 at.% led to the formation of Fe2O3. Mössbauer spectroscopy determined the maximum Fe3+ content in hydrosilicate at 12 at.%. Unfortunately, the spectra did not allow a distinction to be made between the octahedral and the possible tetrahedral positions of iron. The authors assumed that the increased width of the Mössbauer peaks originated from Fe3+ distributed along a number of slightly different positions, due to at least four possible substitution schemes, and possible distortion because of the curvature effect. The spectroscopic experiments of Borghi et al. [106] and Shafia et al. [107] demonstrated that Fe3+ preferred a high spin configuration in both Fe-doped chrysotile and imogolite. This can explain the Fe2O3 formation along with Fe-doped imogolite after reaching around 3 at.% of iron content [107], because otherwise (in the case of a low-spin configuration) the components should have been easily miscible (Figure 24). In another research study [108], the average diameter of 450 Fe-doped imogolite nanotubes was estimated as 4.4 nm, and this value was at least two times larger than that of pure imogolite. This fact is in good agreement with the value calculation (Figure 23) in the case of imogolite doping by Fe3+.
Only a few papers have been devoted to Co2+/3+ substitutions in chrysotile [109,110]. Korytkova et al. [109] reported a continuous decrease in the outer (from 25 to 10 nm) and inner diameters (from 5 to 2 nm) with an increase in Co content in the system, and this was in accordance with the value change (Figure 23). Most synthesis products contained additional phases, such as cobalt silicate, oxides and platy particles. The latter were formed, probably, due to partial cobalt oxidation in hydrothermal conditions, which is analogous to the case of iron. It is interesting to note an idea related to Fe2+/3+ and Co2+/3+ transition. The oxidation process leads to a stepwise change in the effective ionic radii of these cations and in turn, to a change in the size difference between the sheets. Could the morphology of Co2+- or Fe2+-doped nanoscrolls be further tuned—transformed into a plate or scrolled even more, depending on the case—by oxidation?
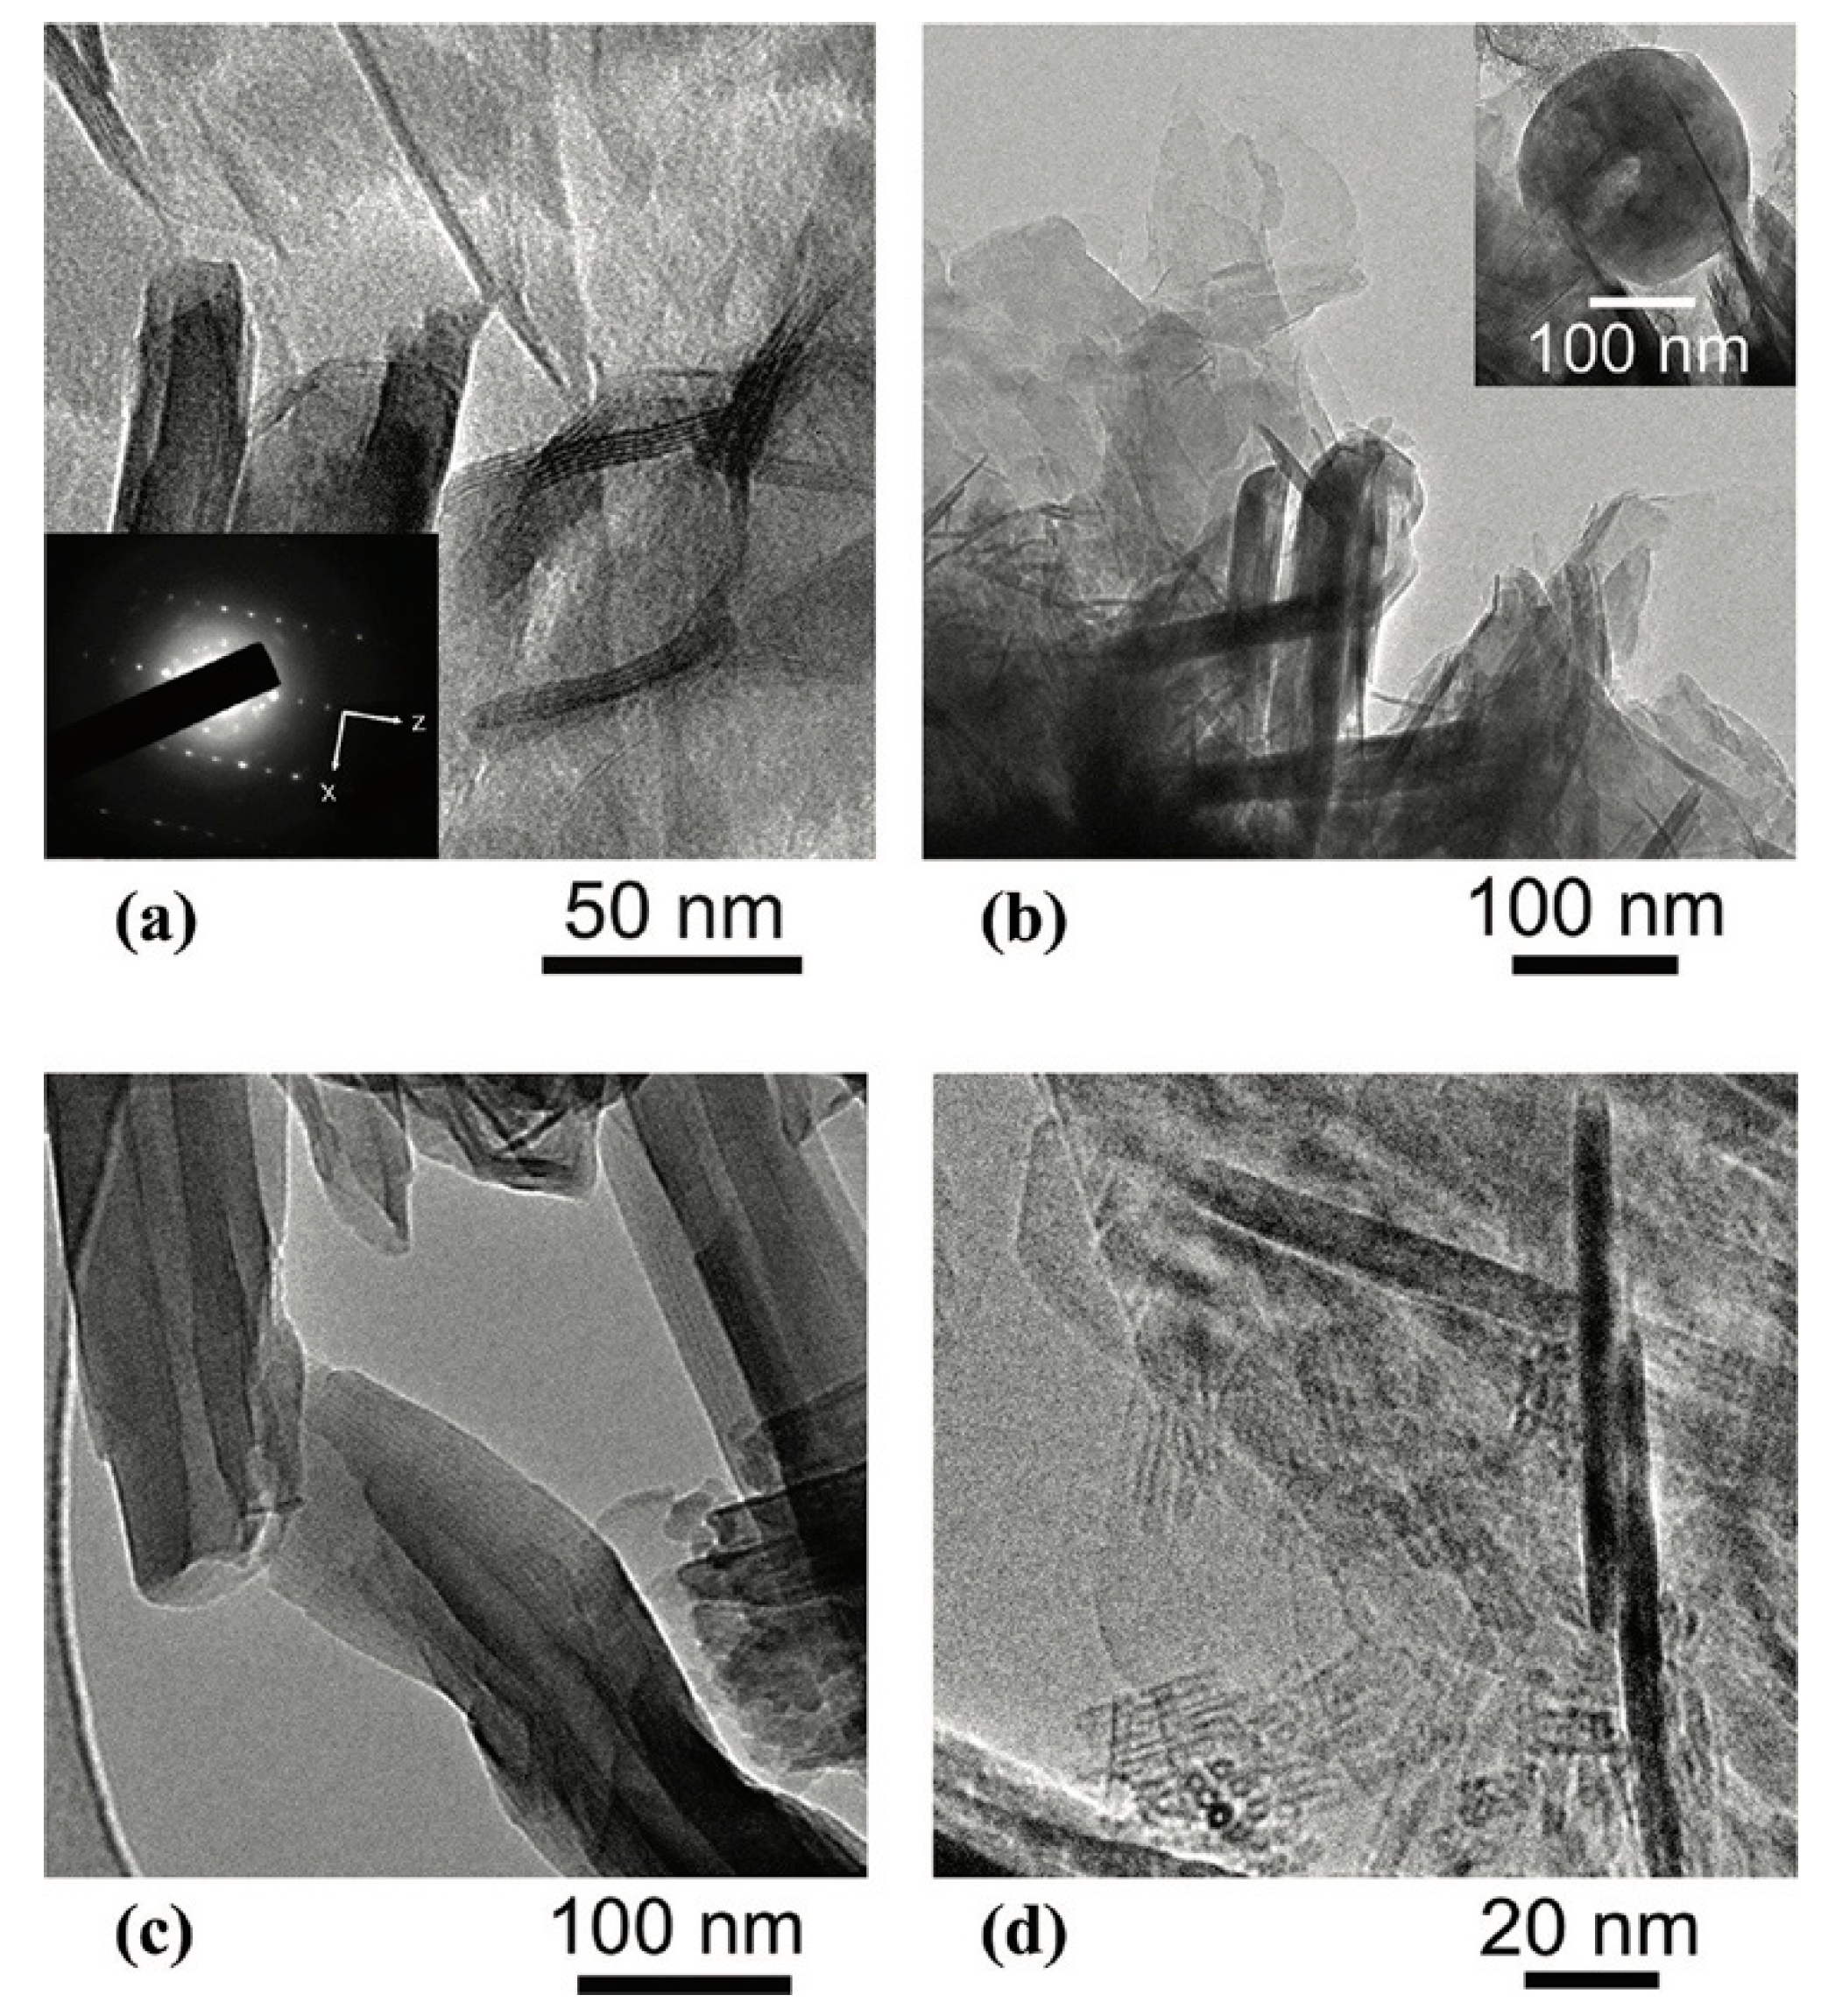
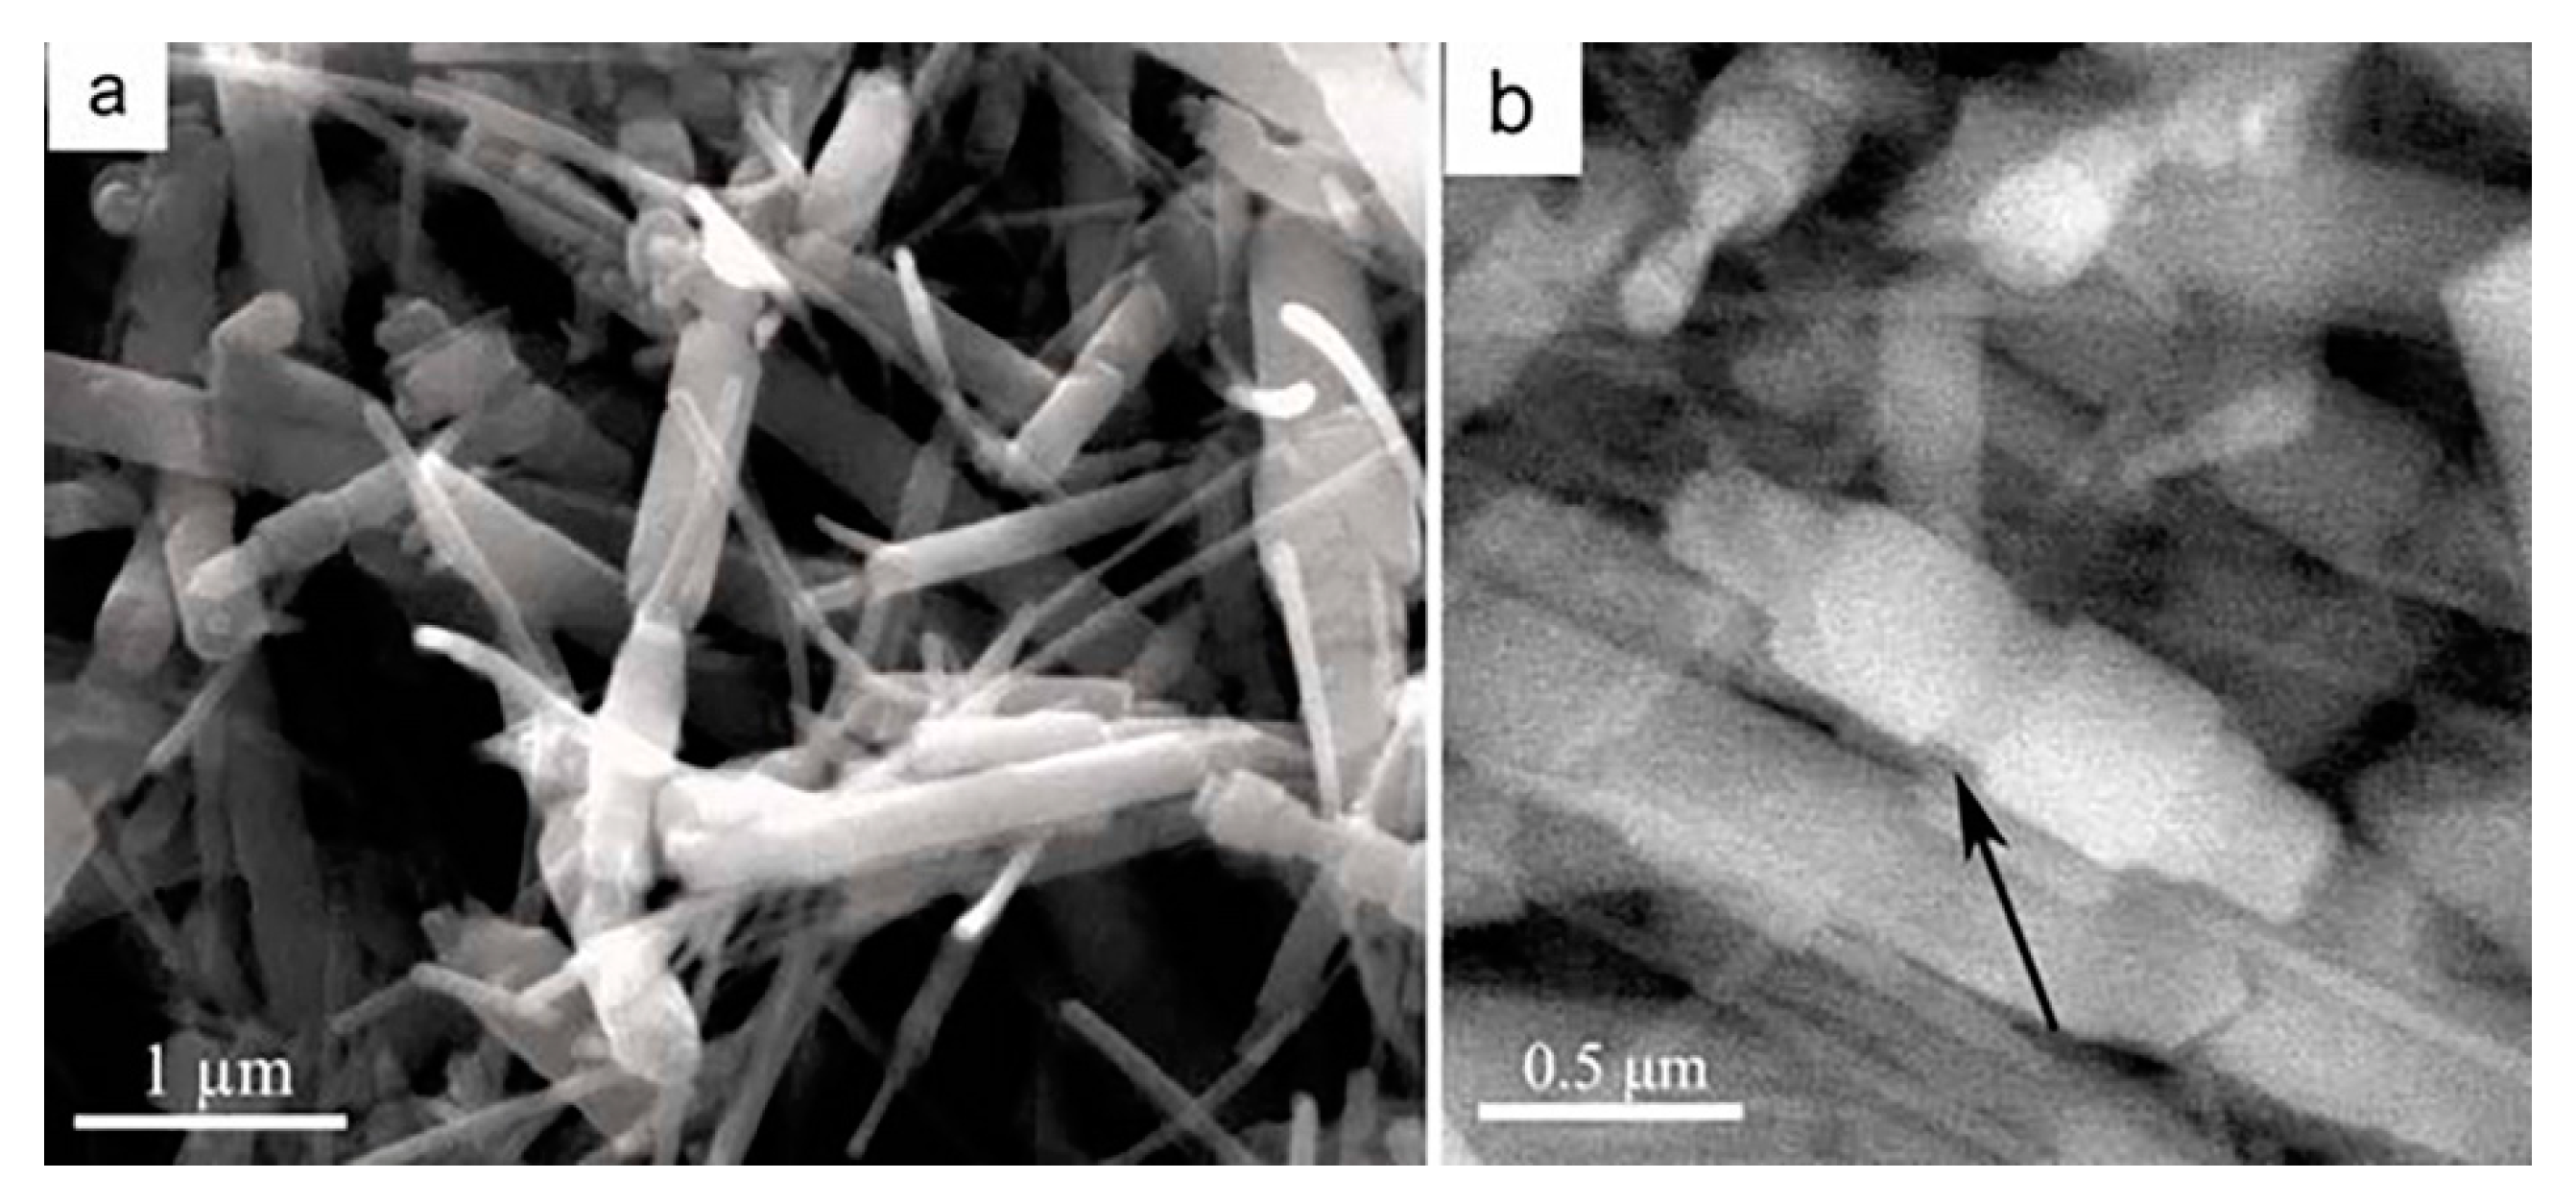
Nickel is a frequently used dopant in chrysotile synthesis. The ionic radius, which is close to Mg2+, and low make two cations miscible in any ratio. The reported data on its nanotube diameter are fairly controversial. Korytkova et al. [111] observed a decrease in the outer diameter from 30 to 15 nm, and a decrease in the inner diameter from 5 to 3 nm as the Ni content in the system increased. McDonald et al. [112] obtained Ni3Si2O5(OH)4 nanotubes with an outer diameter of 25–30 nm and an inner diameter of about 10 nm (Figure 27). White et al. [113] reported on the following Ni3Si2O5(OH)4 sizes: 20–35 nm outer diameter and 7–25 nm inner diameter.
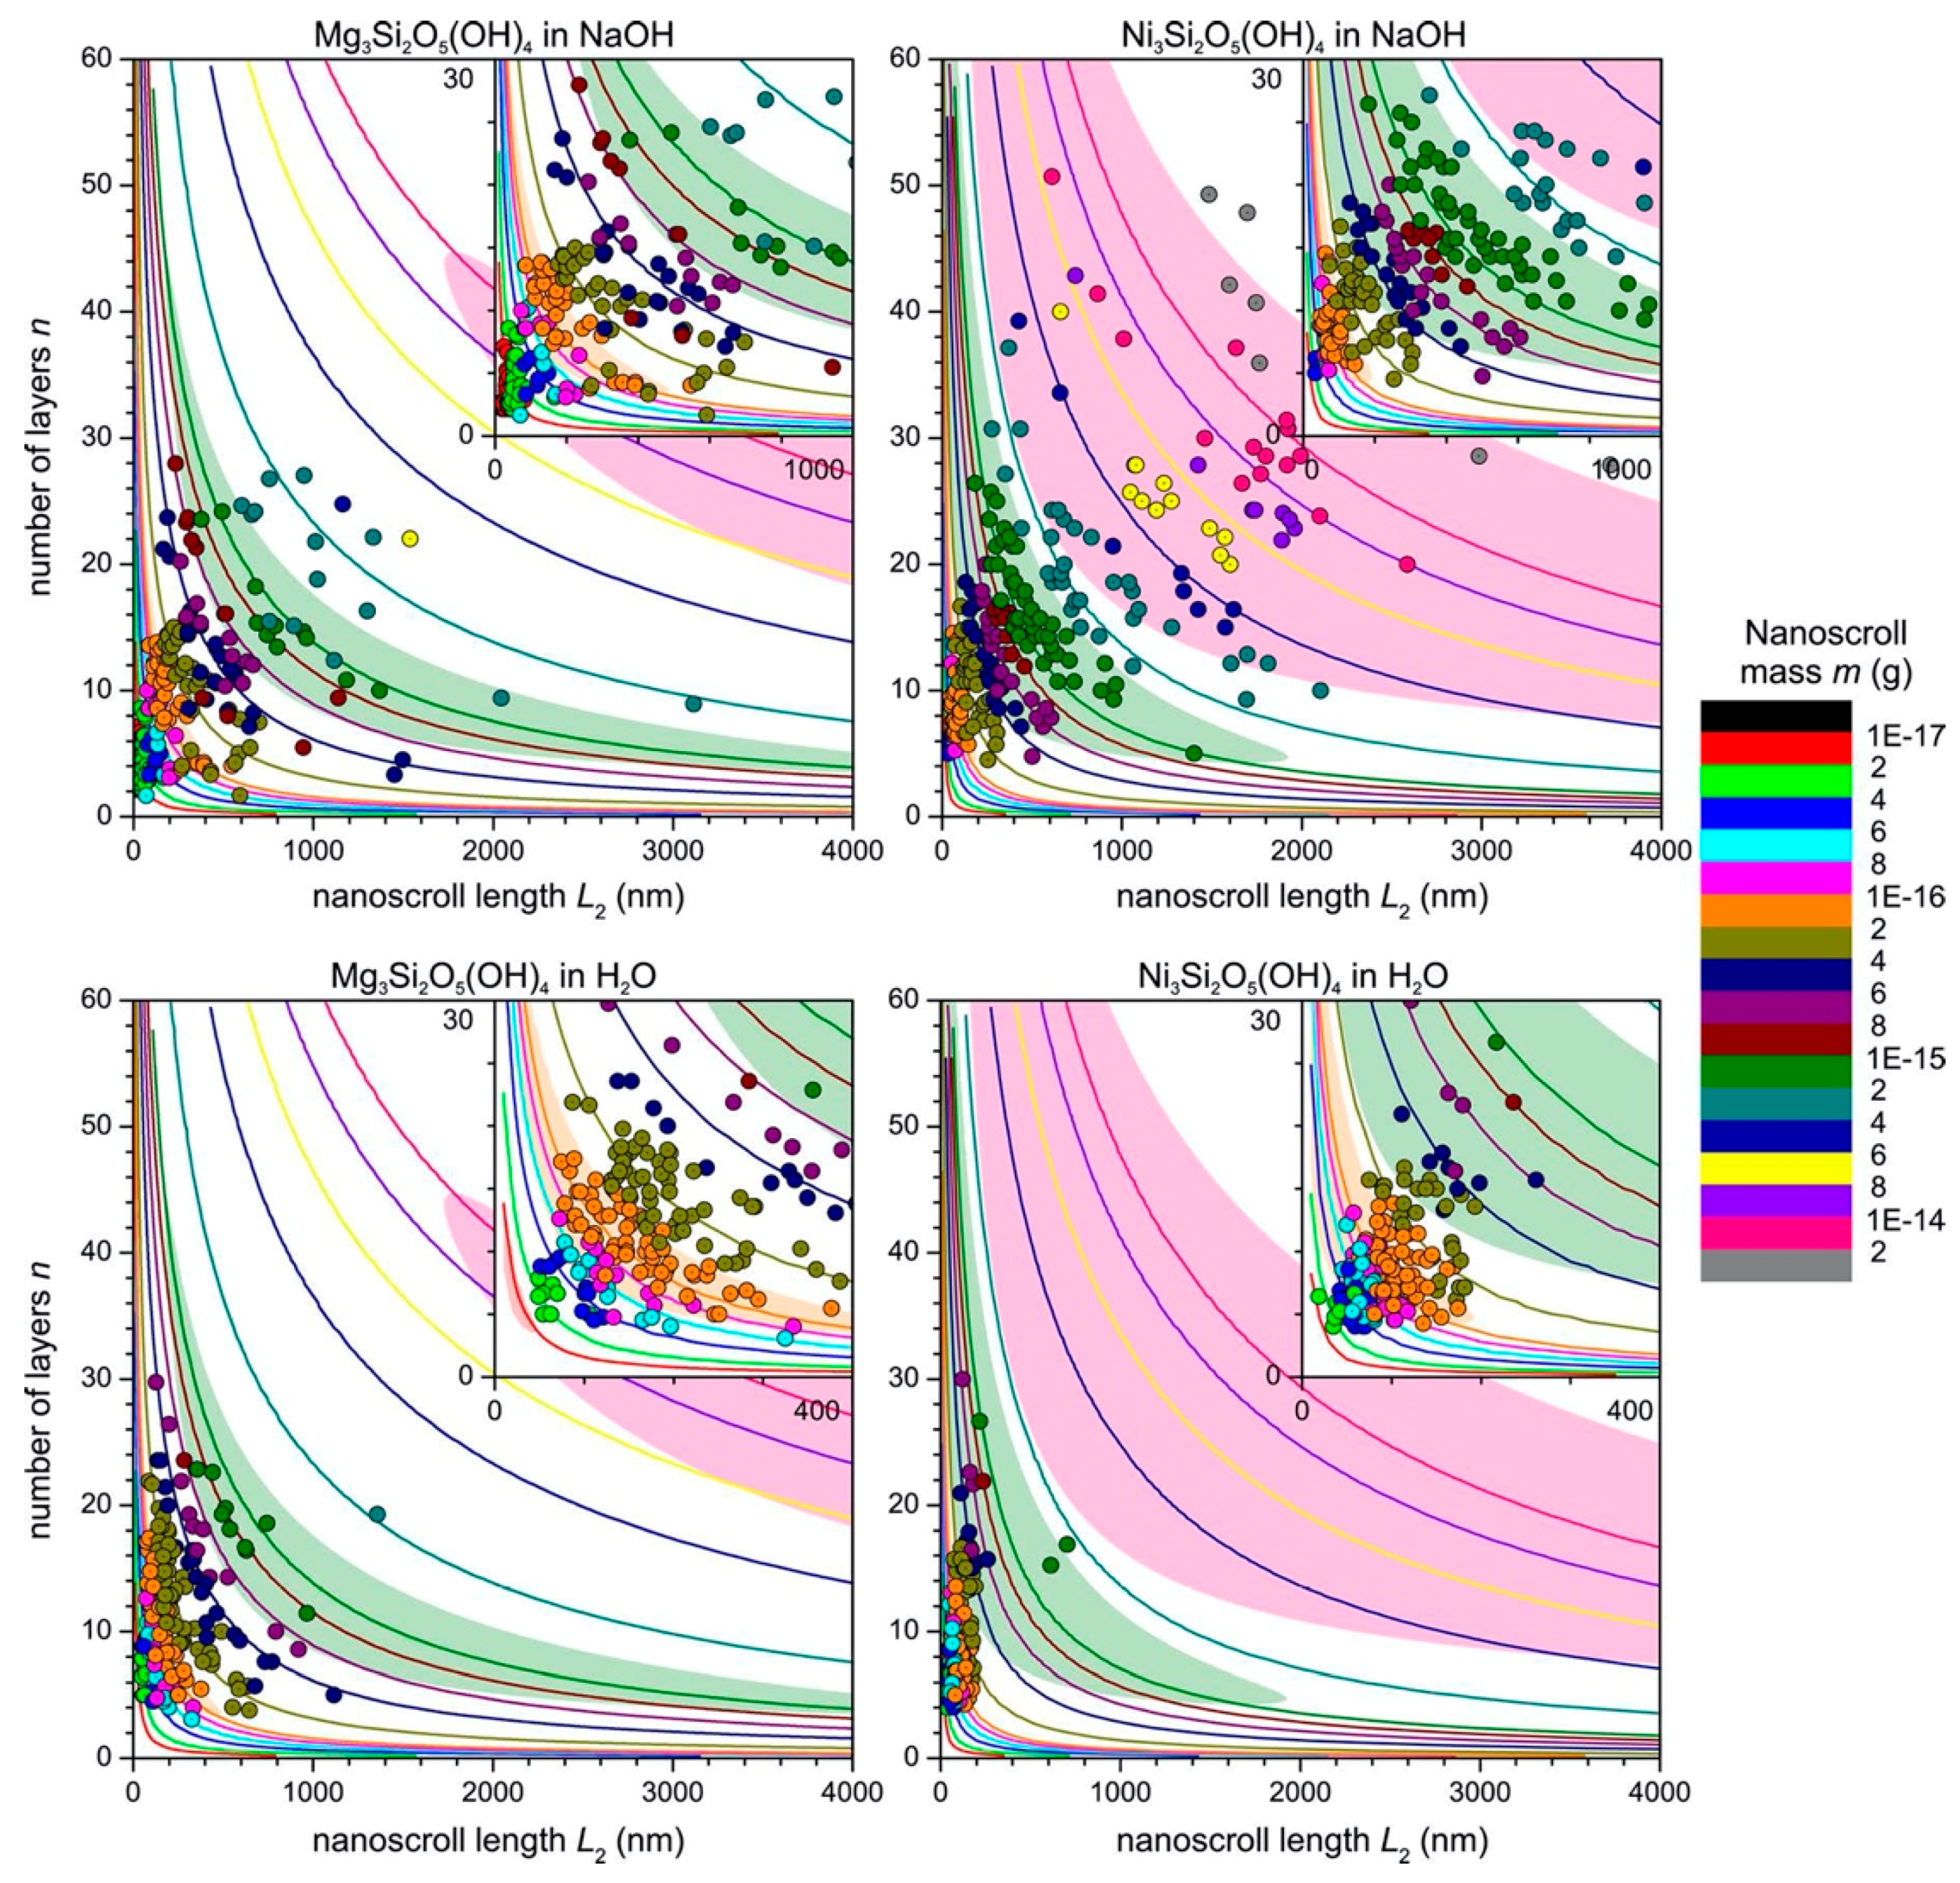
Finally, Krasilin et al. [114] synthesised tubes with mean outer and inner diameters of 40 nm and 10 nm, respectively. The estimation of the value (Figure 23) predicted a diameter increase during the Mg2+ to Ni2+ substitution in the chrysotile structure. Most probably, the opposite tendency was caused by the choice of starting components and the hydrothermal synthesis conditions. The influence of the presence of NaOH during the synthesis of Mg3Si2O5(OH)4 and Ni3Si2O5(OH)4 nanotubes was demonstrated in [76]. Figure 28 combines electron microscopy statistics with the energy modelling of finite mass layers scrolling [76]. The preferable number of layers was 12–13 in the case of the Mg- and 25–26 in the case of the Ni-based layer, independent of mass. The size parameters of all the nanoscrolls of a certain mass were situated within an energy equal area close to the energy minimum. In this area, short nanoscrolls with and long nanoscrolls were equal in terms of the energy effect of scrolling. According to the model, the area grew continuously with an increase in mass. Scatter plots showed the differing response of Mg- and Ni-containing systems to the presence of NaOH. Apart from the difference in Mg(OH)2 and Ni(OH)2 solubilities, the distance between the ‘starting point’ of nanoscroll growth (approximately 3–4 layers, 20–50 nm length) and the energy minimum could matter. Synthesis in the water allowed the nanoscrolls of both compositions to grow up to 30 layers thick, and the mean diameter of the Ni3Si2O5(OH)4 nanoscrolls was indeed smaller than that of Mg3Si2O5(OH)4. In the case of Mg3Si2O5(OH)4, growing up to 30 layers was enough to occupy both the energy equal states with and . Conversely, most of the Ni3Si2O5(OH)4 nanoscrolls still had . The addition of NaOH intensified recrystallisation, but because Mg3Si2O5(OH)4 nanoscrolls had already occupied both types of equal states, only an increase in length was observed. In turn, Ni3Si2O5(OH)4 nanoscrolls demonstrated an increase in both the diameter and length in order to occupy both types of energy states. The resulting average diameter of Ni3Si2O5(OH)4 was larger, in that case.
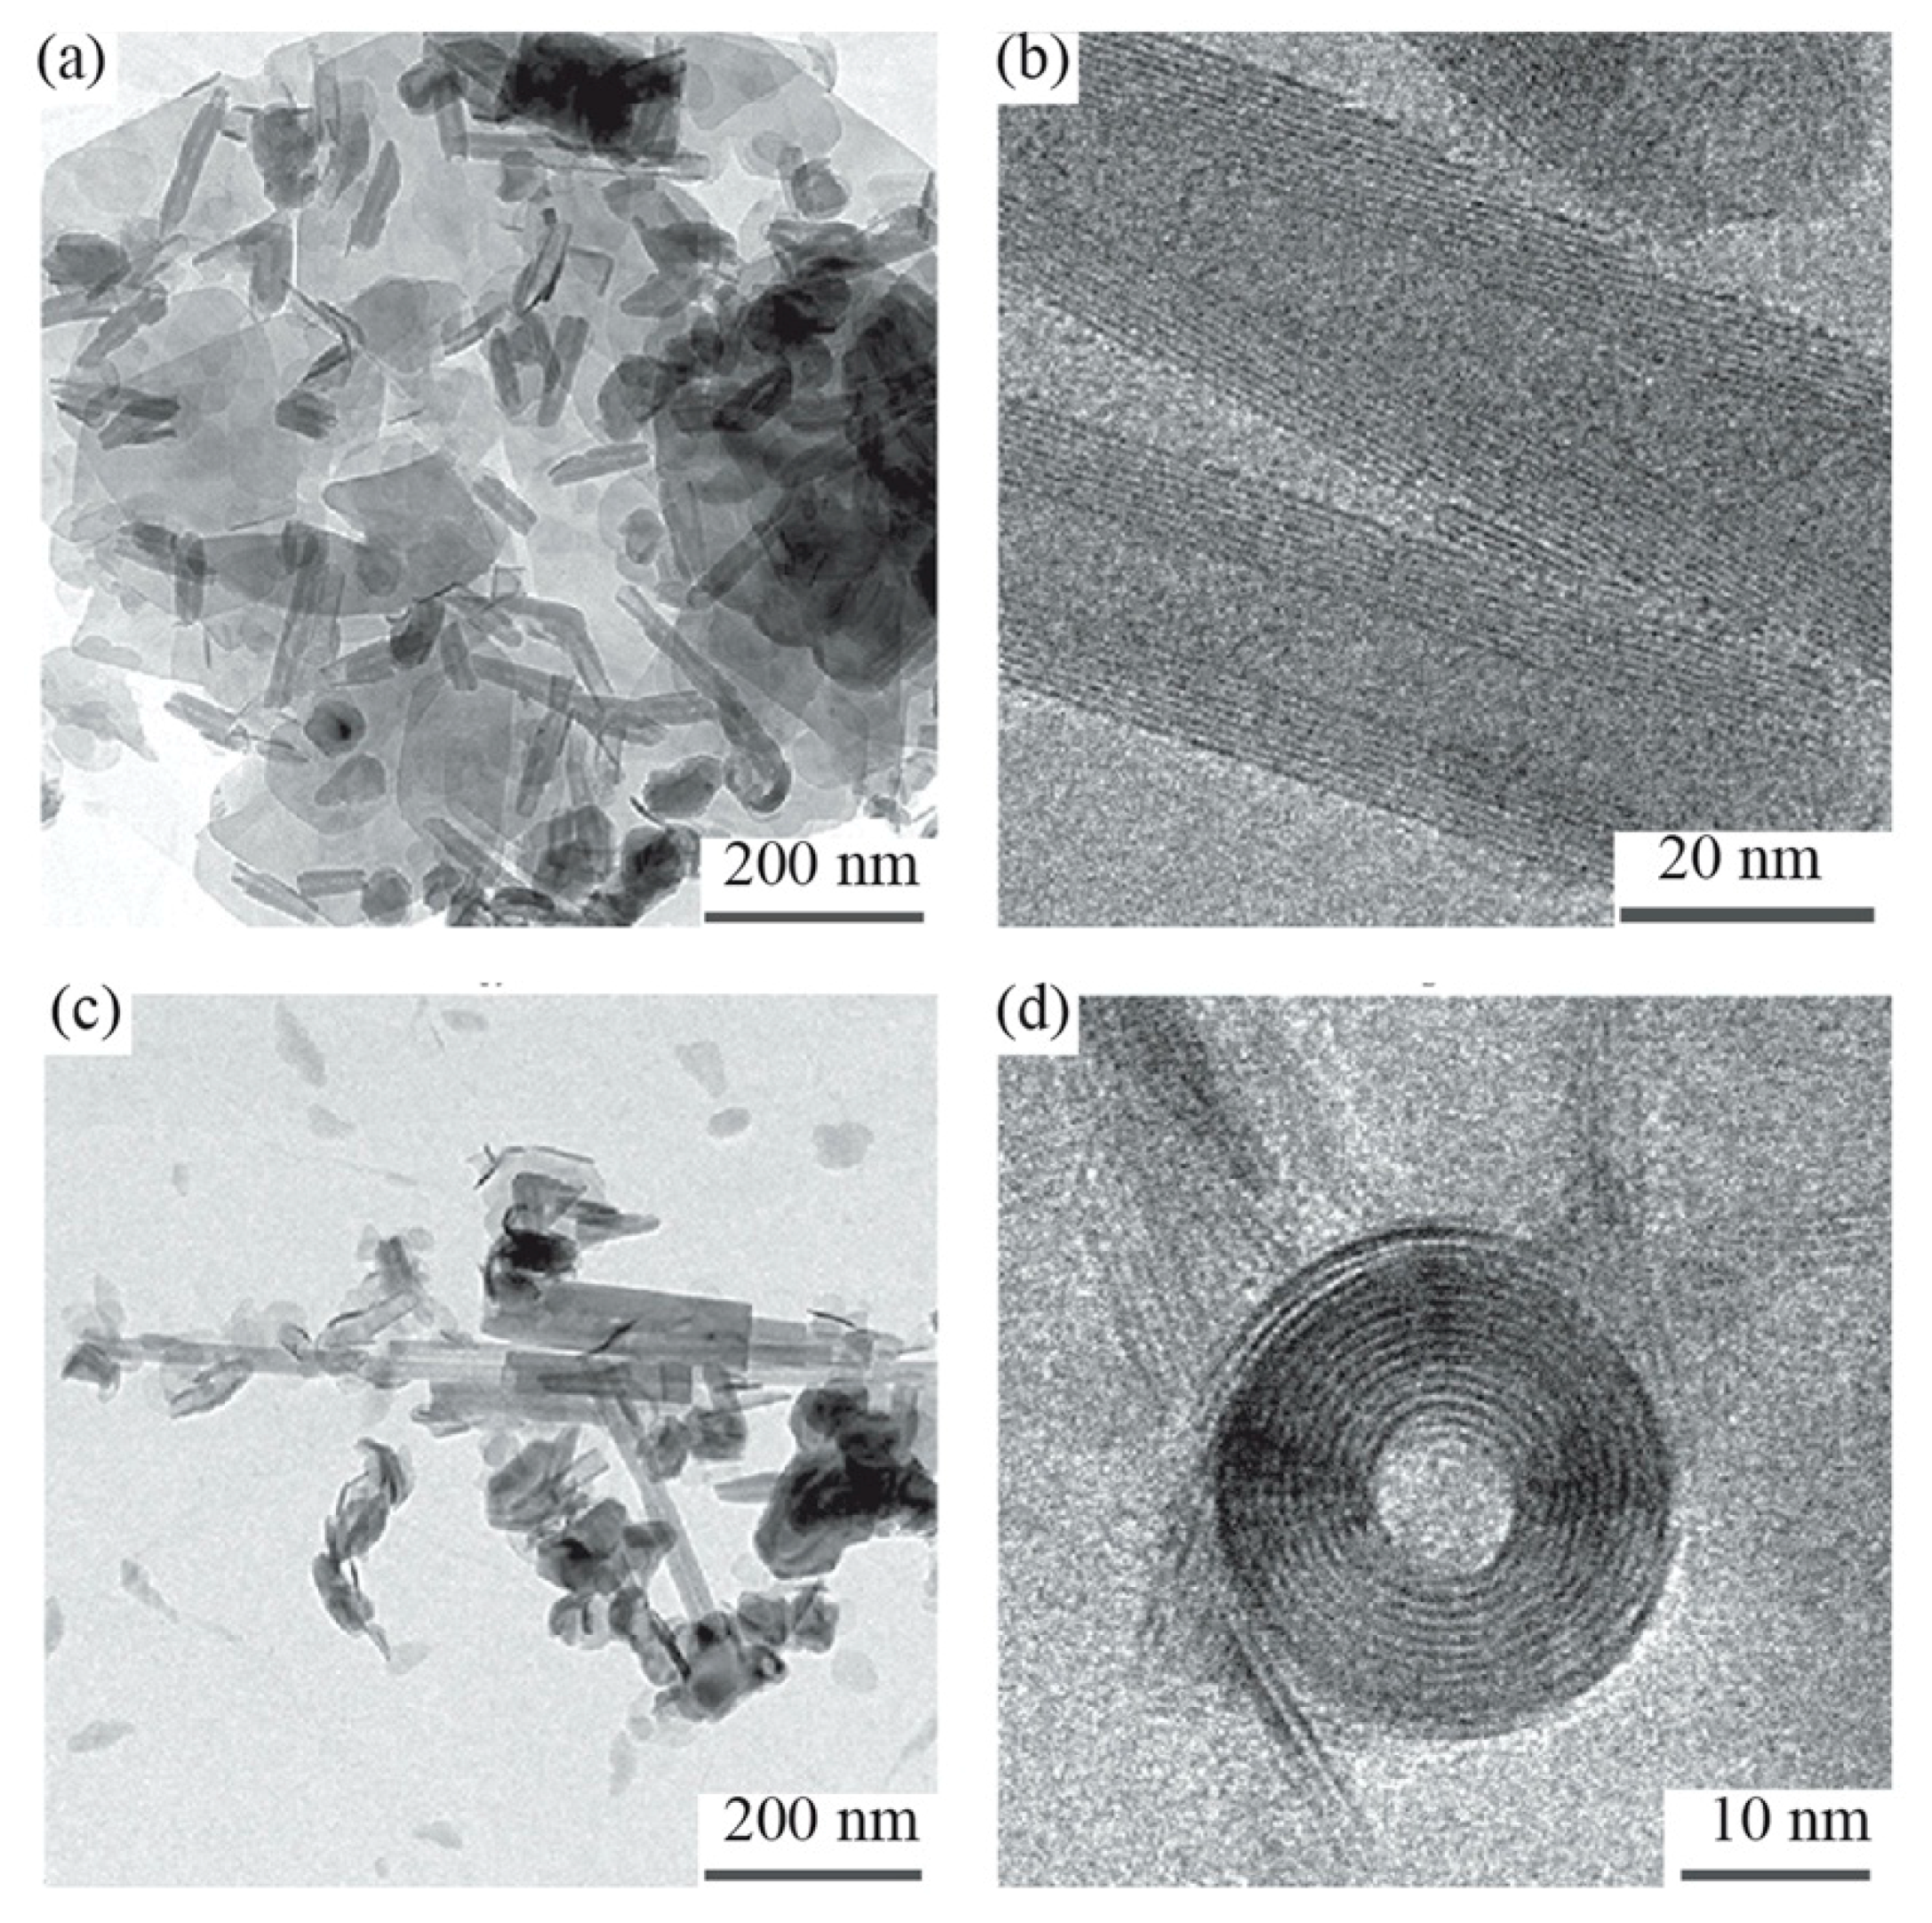
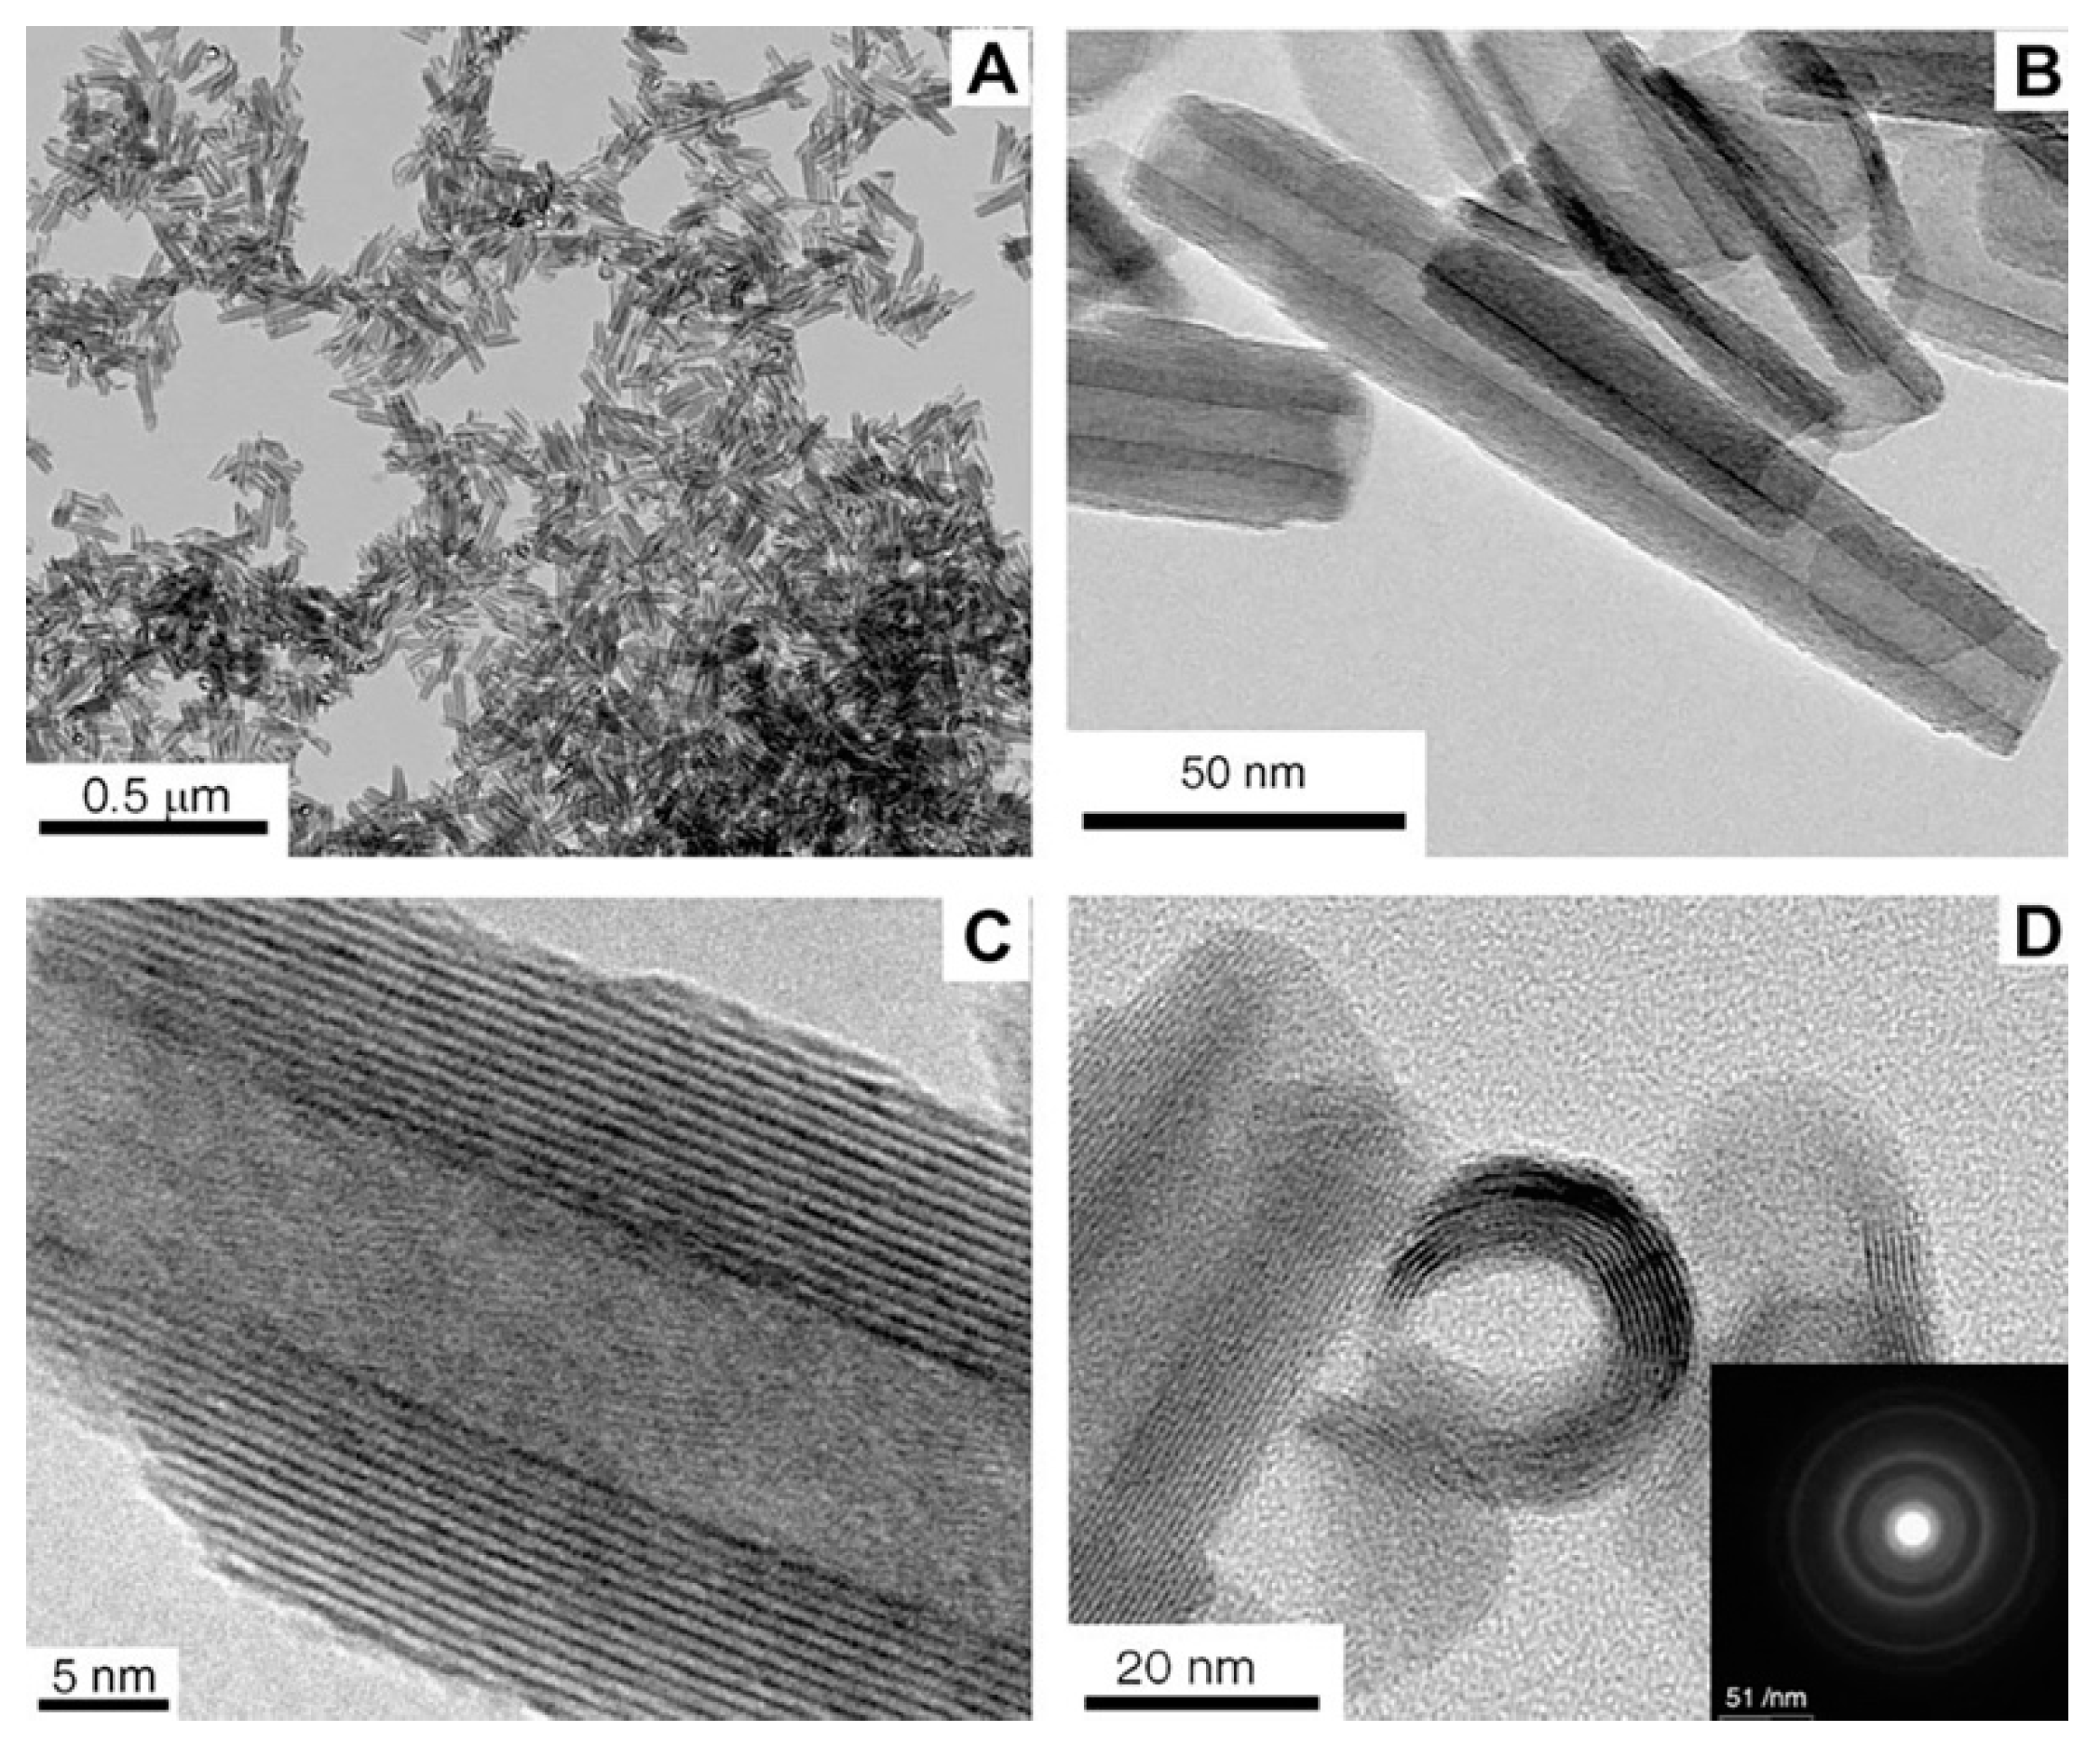
3.2. Tubes-in-Tubes, Cones and Cation Distribution
Often, the simultaneous presence of several isomorphous cations gives rise to several additional morphological features. One of these features is the increased diameter of the mixed composition nanotubes in comparison with single cation-based nanoscrolls. This effect was observed in the case of substitutions by Ge in imogolite [65], and Fe2+/3+ and Ni2+ in chrysotile [102,115]. In addition, partial substitution resulted in the appearance of nanoscrolls with a complex tube-in-tube (Figure 29) and conical (Figure 30) morphology. Krasilin et al. [116] revealed that partial Mg2+ to Ni2+ substitution in chrysotile increased conical scroll content from 10% to 40%. We believe that this growth in morphological diversity was supported by some kind of spatial distribution of isomorphous cations along the layer. In the view of the energy model based on the value, the strain energy of a multi-walled spiral cross-section could be further minimised, assuming angular dependence [117,118]:
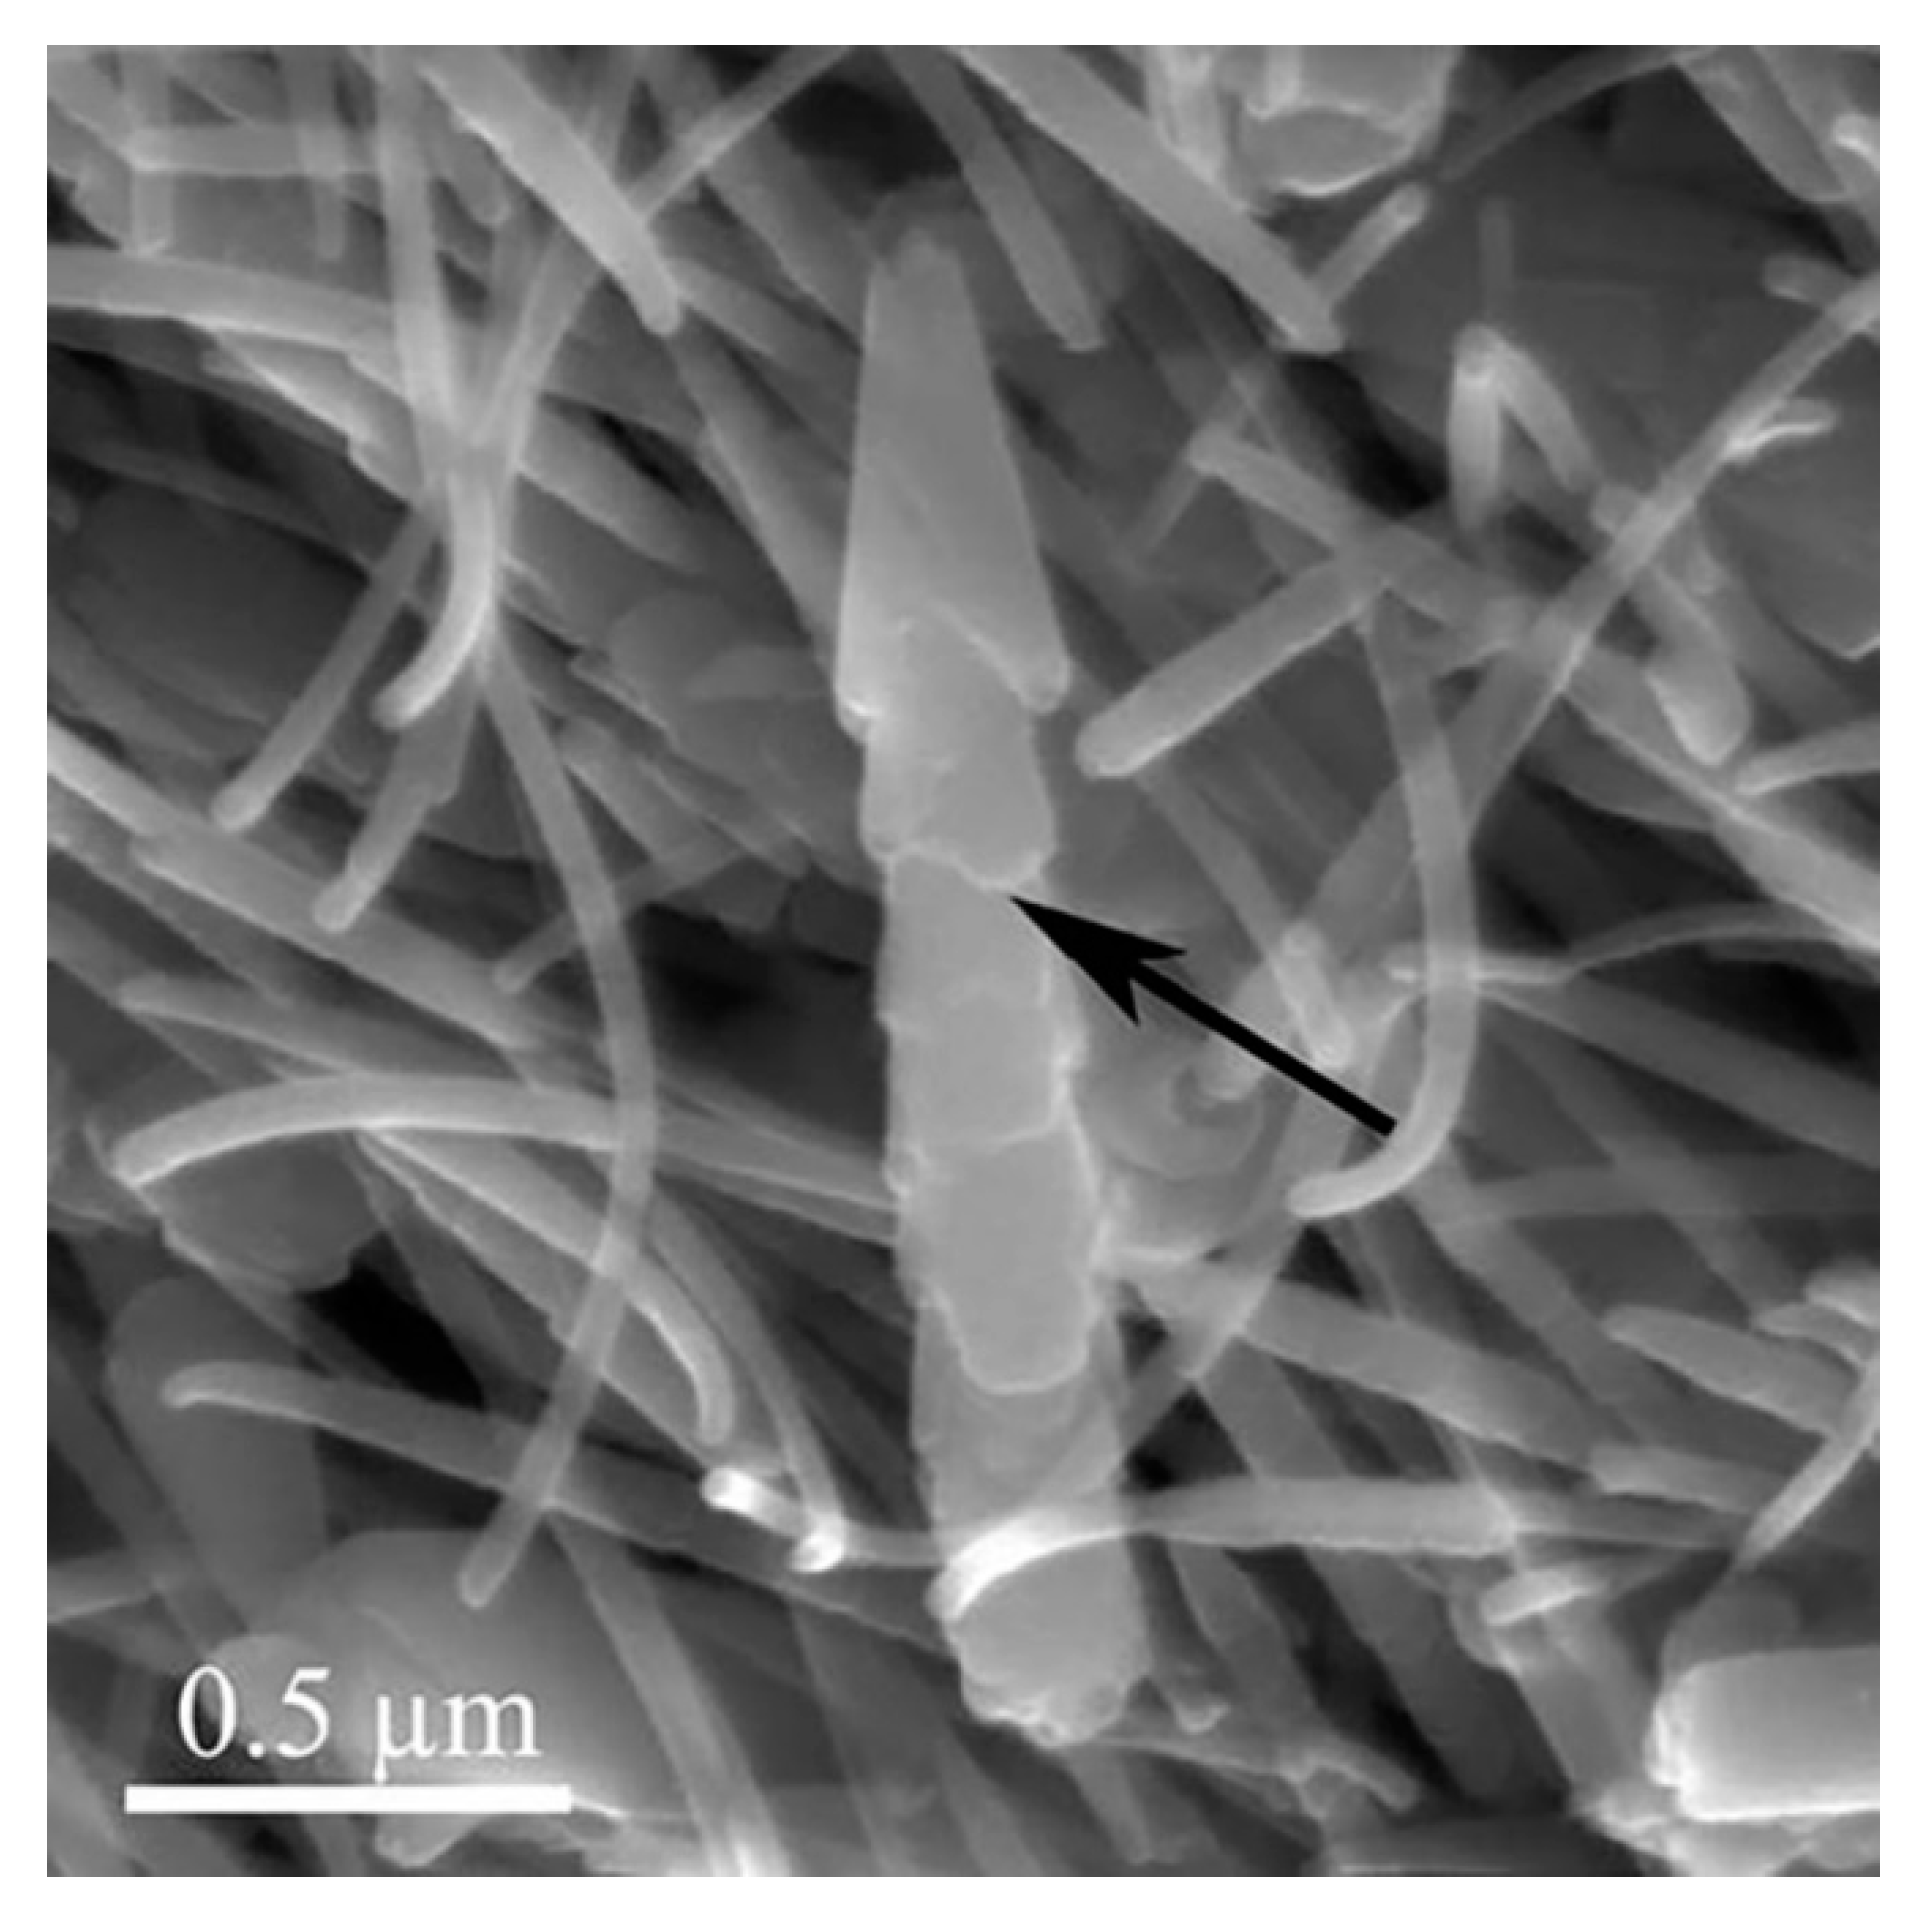
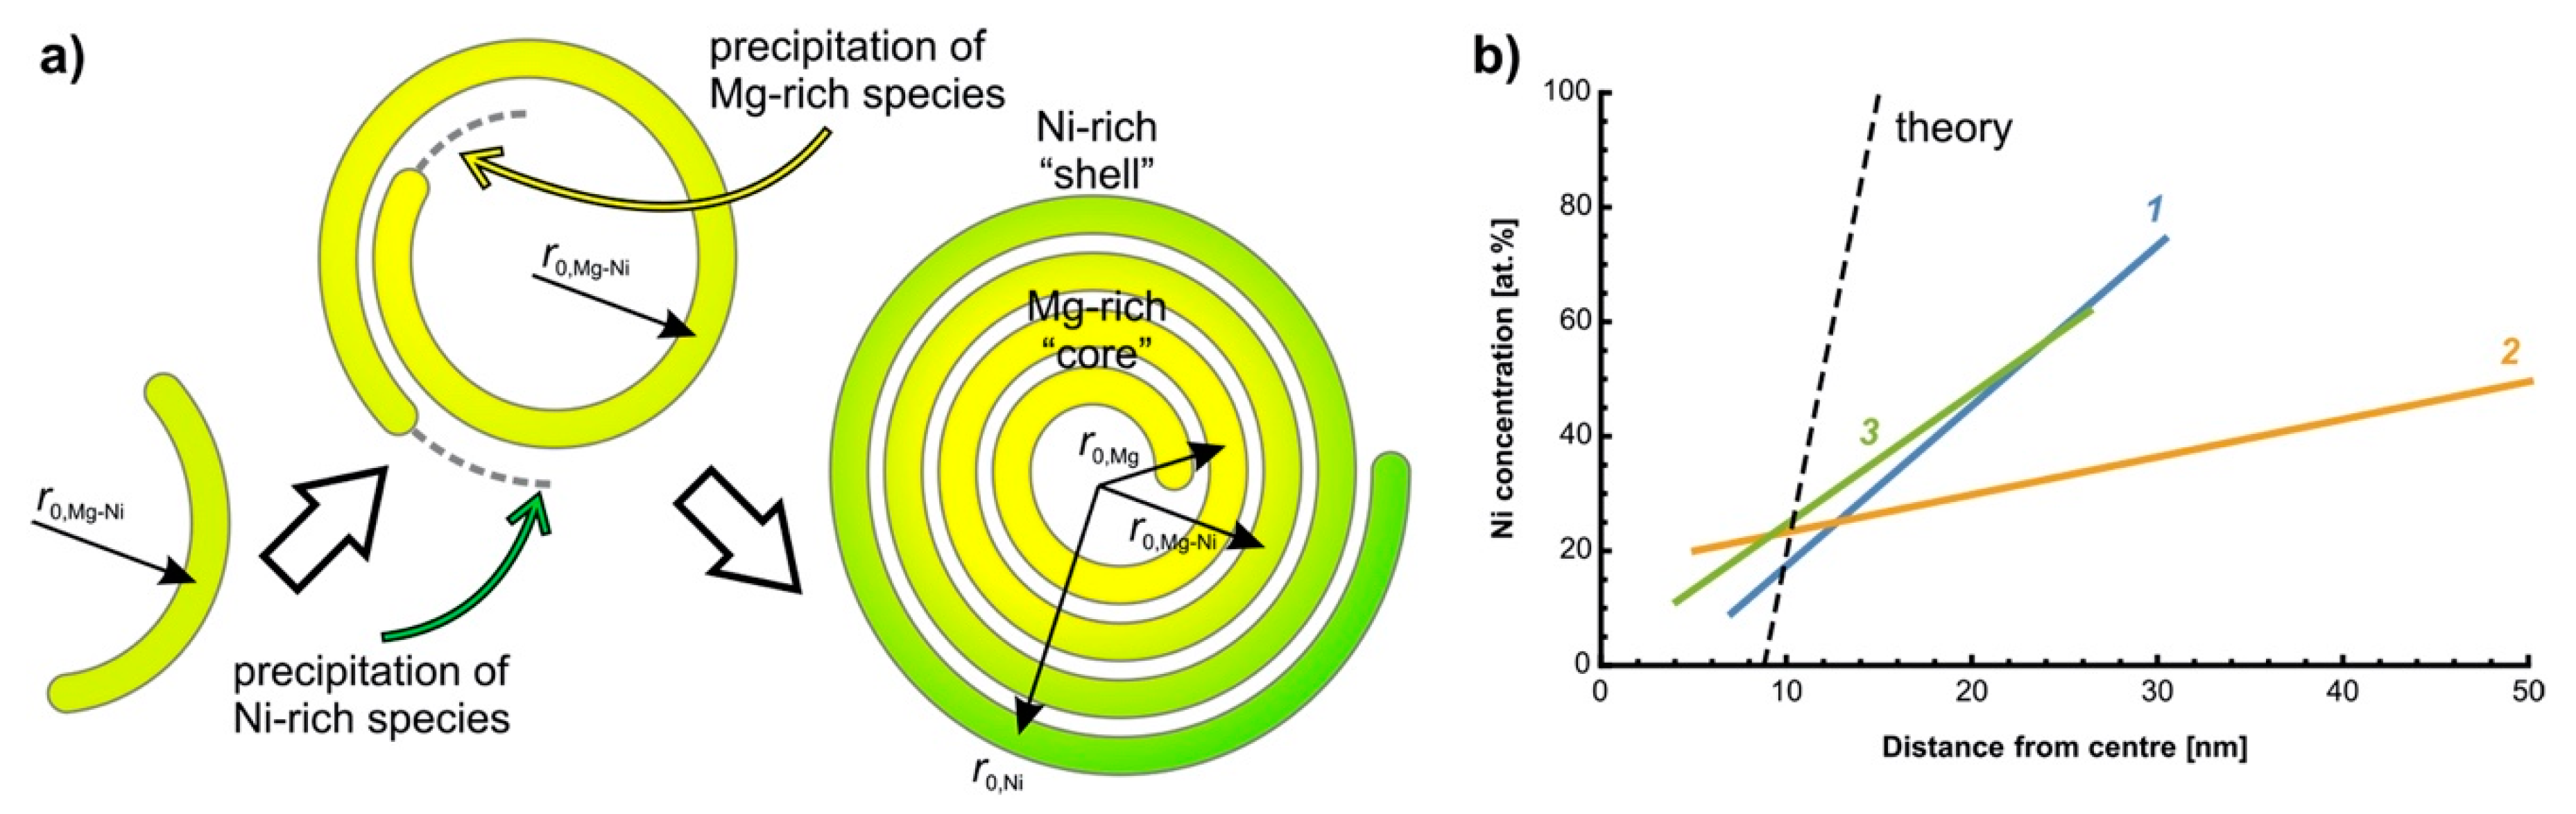
where is the Archimedean spiral constant, and is the current radius of curvature. Thus, the cation, which would cause a larger value, would concentrate in the outer layers of the scroll, and vice versa. This assumption was confirmed [118,119] by the X-ray spectroscopy of several (Mg0.5Ni0.5)3Si2O5(OH)4 nanoscrolls. Figure 31 demonstrates the linear fit of the spectroscopy data with the maximum possible concentration gradient predicted by Equation (8). The spatial distribution along the layer could also cause nonuniform bending momentum and scrolling with an angle, resulting in the formation of cones. Nanotubes and nanoscrolls that have already been formed could serve as seeds for the precipitation of substances enriched with another cation (Figure 29). Korytkova et al. [120] demonstrated that the presence of nanotubular seeds systematically increased the average diameter of Mg3Si2O5(OH)4 nanotubes.
3.3. P.S.: Polygonal Serpentine
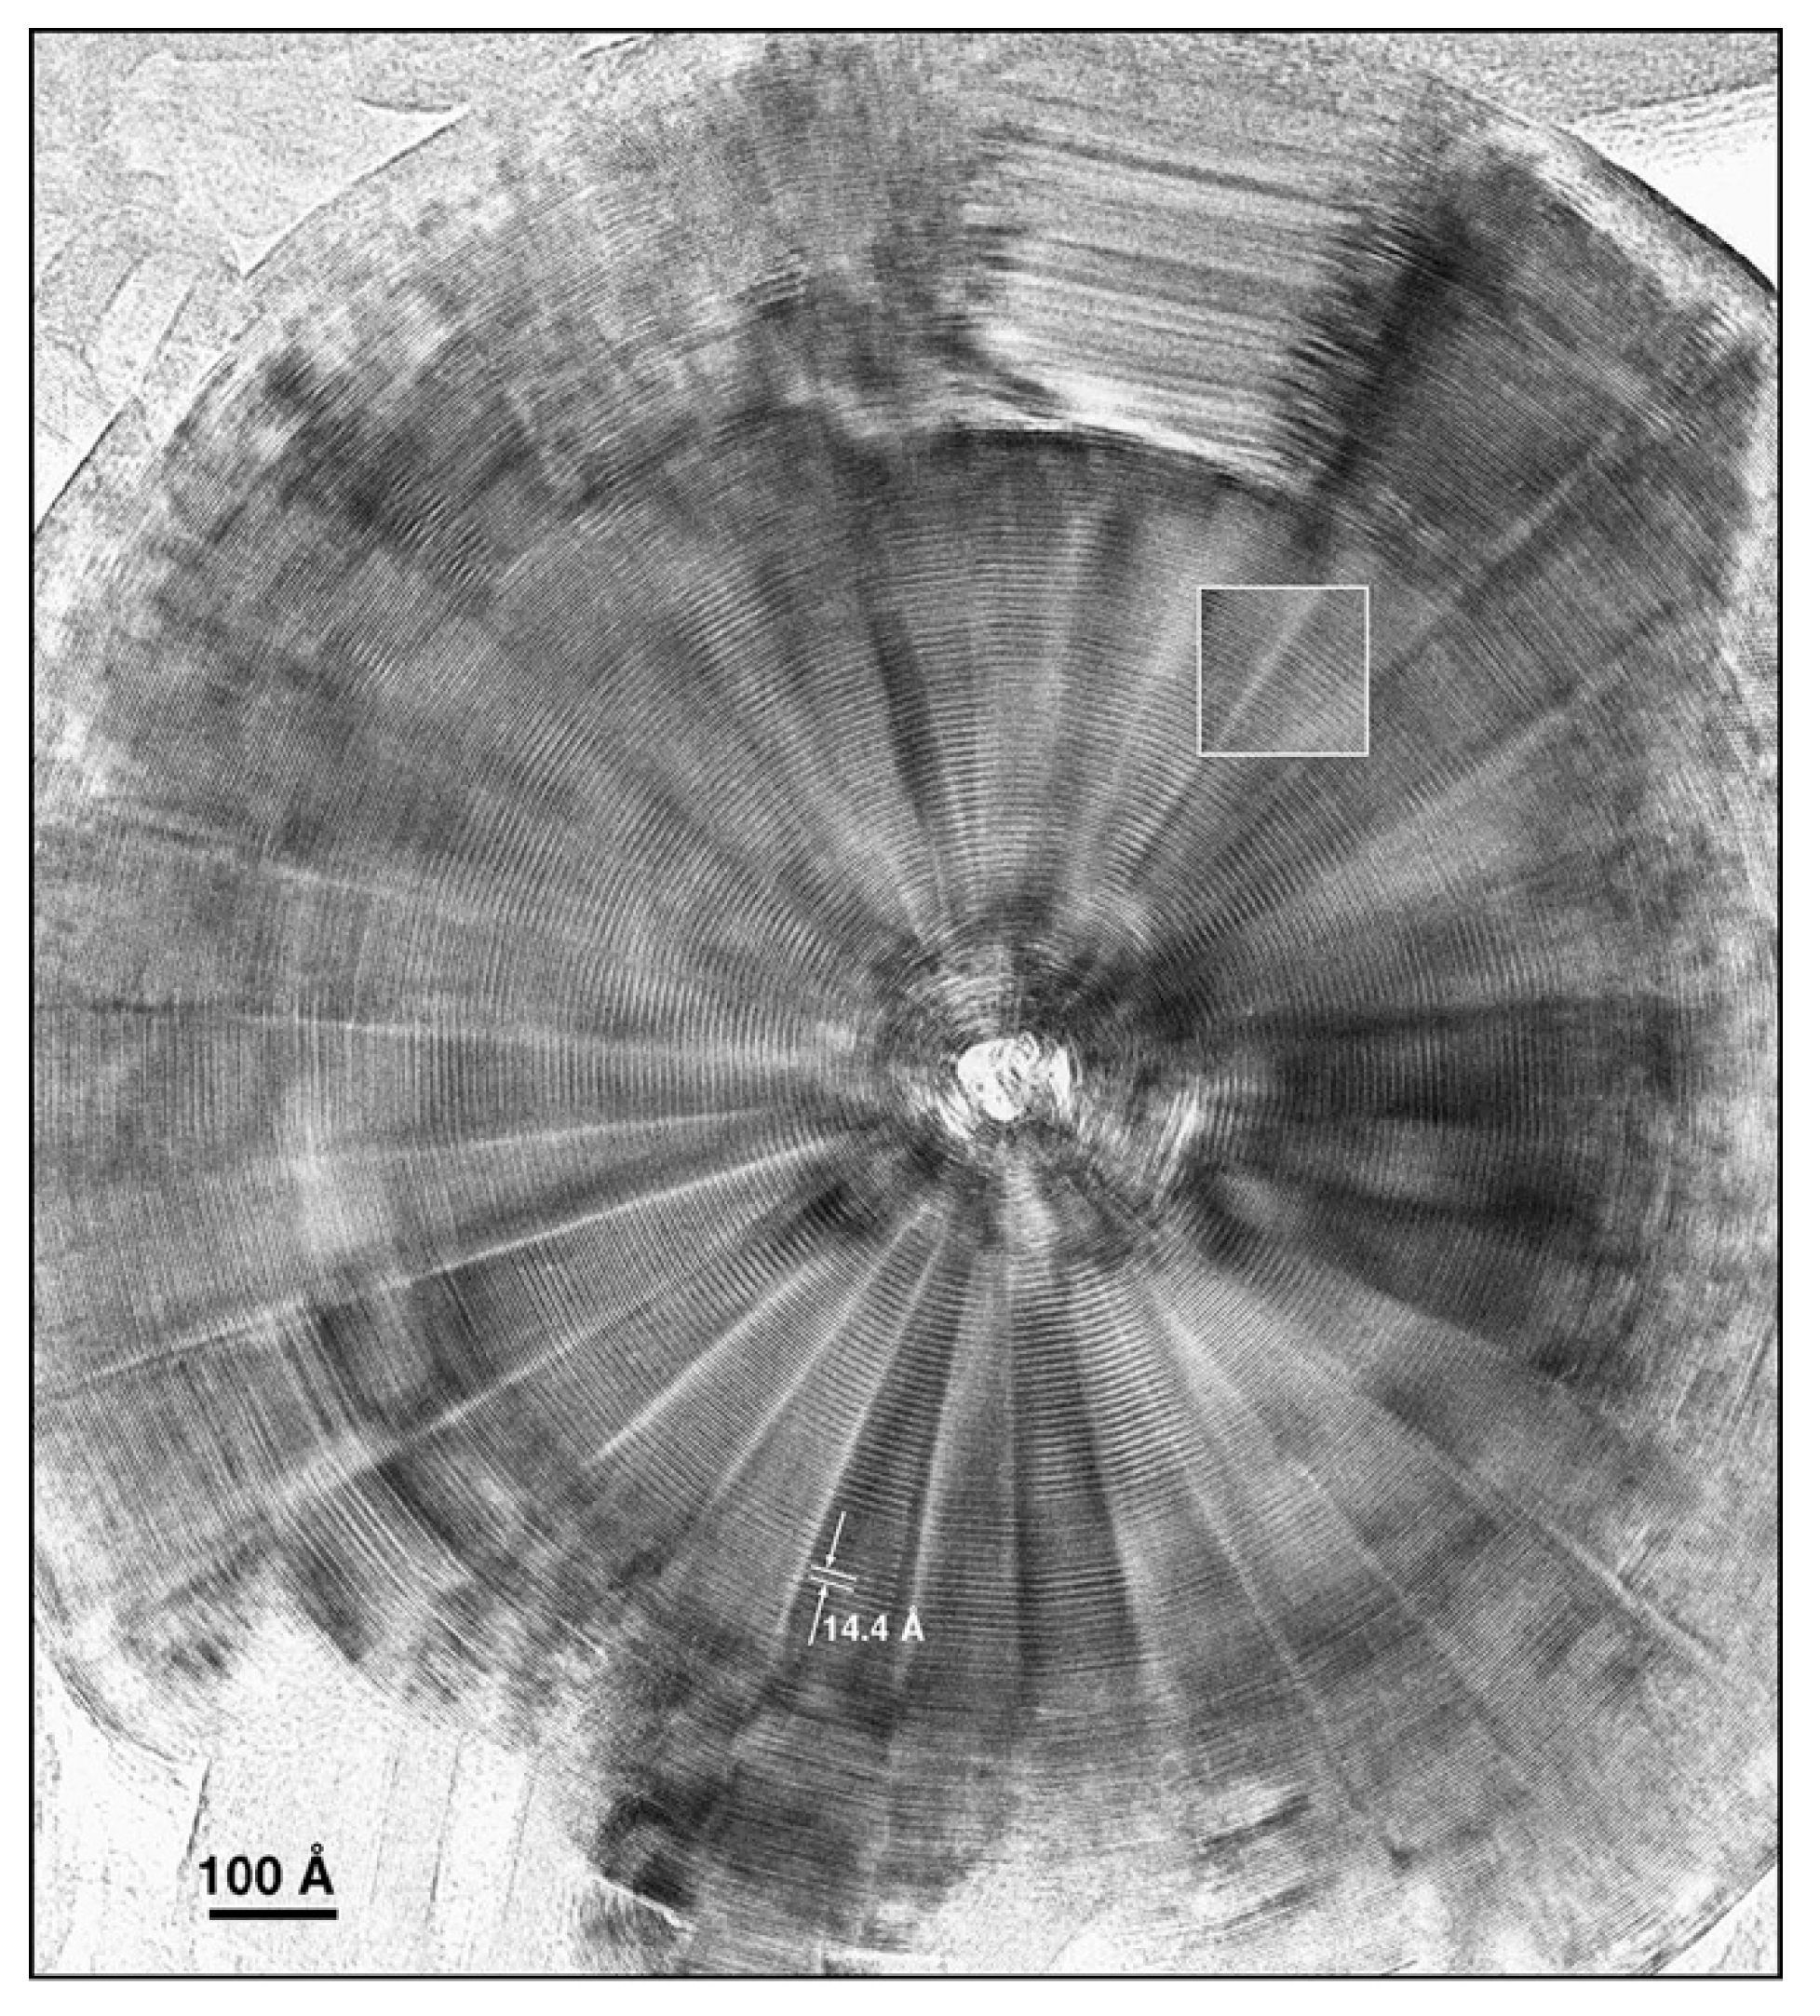
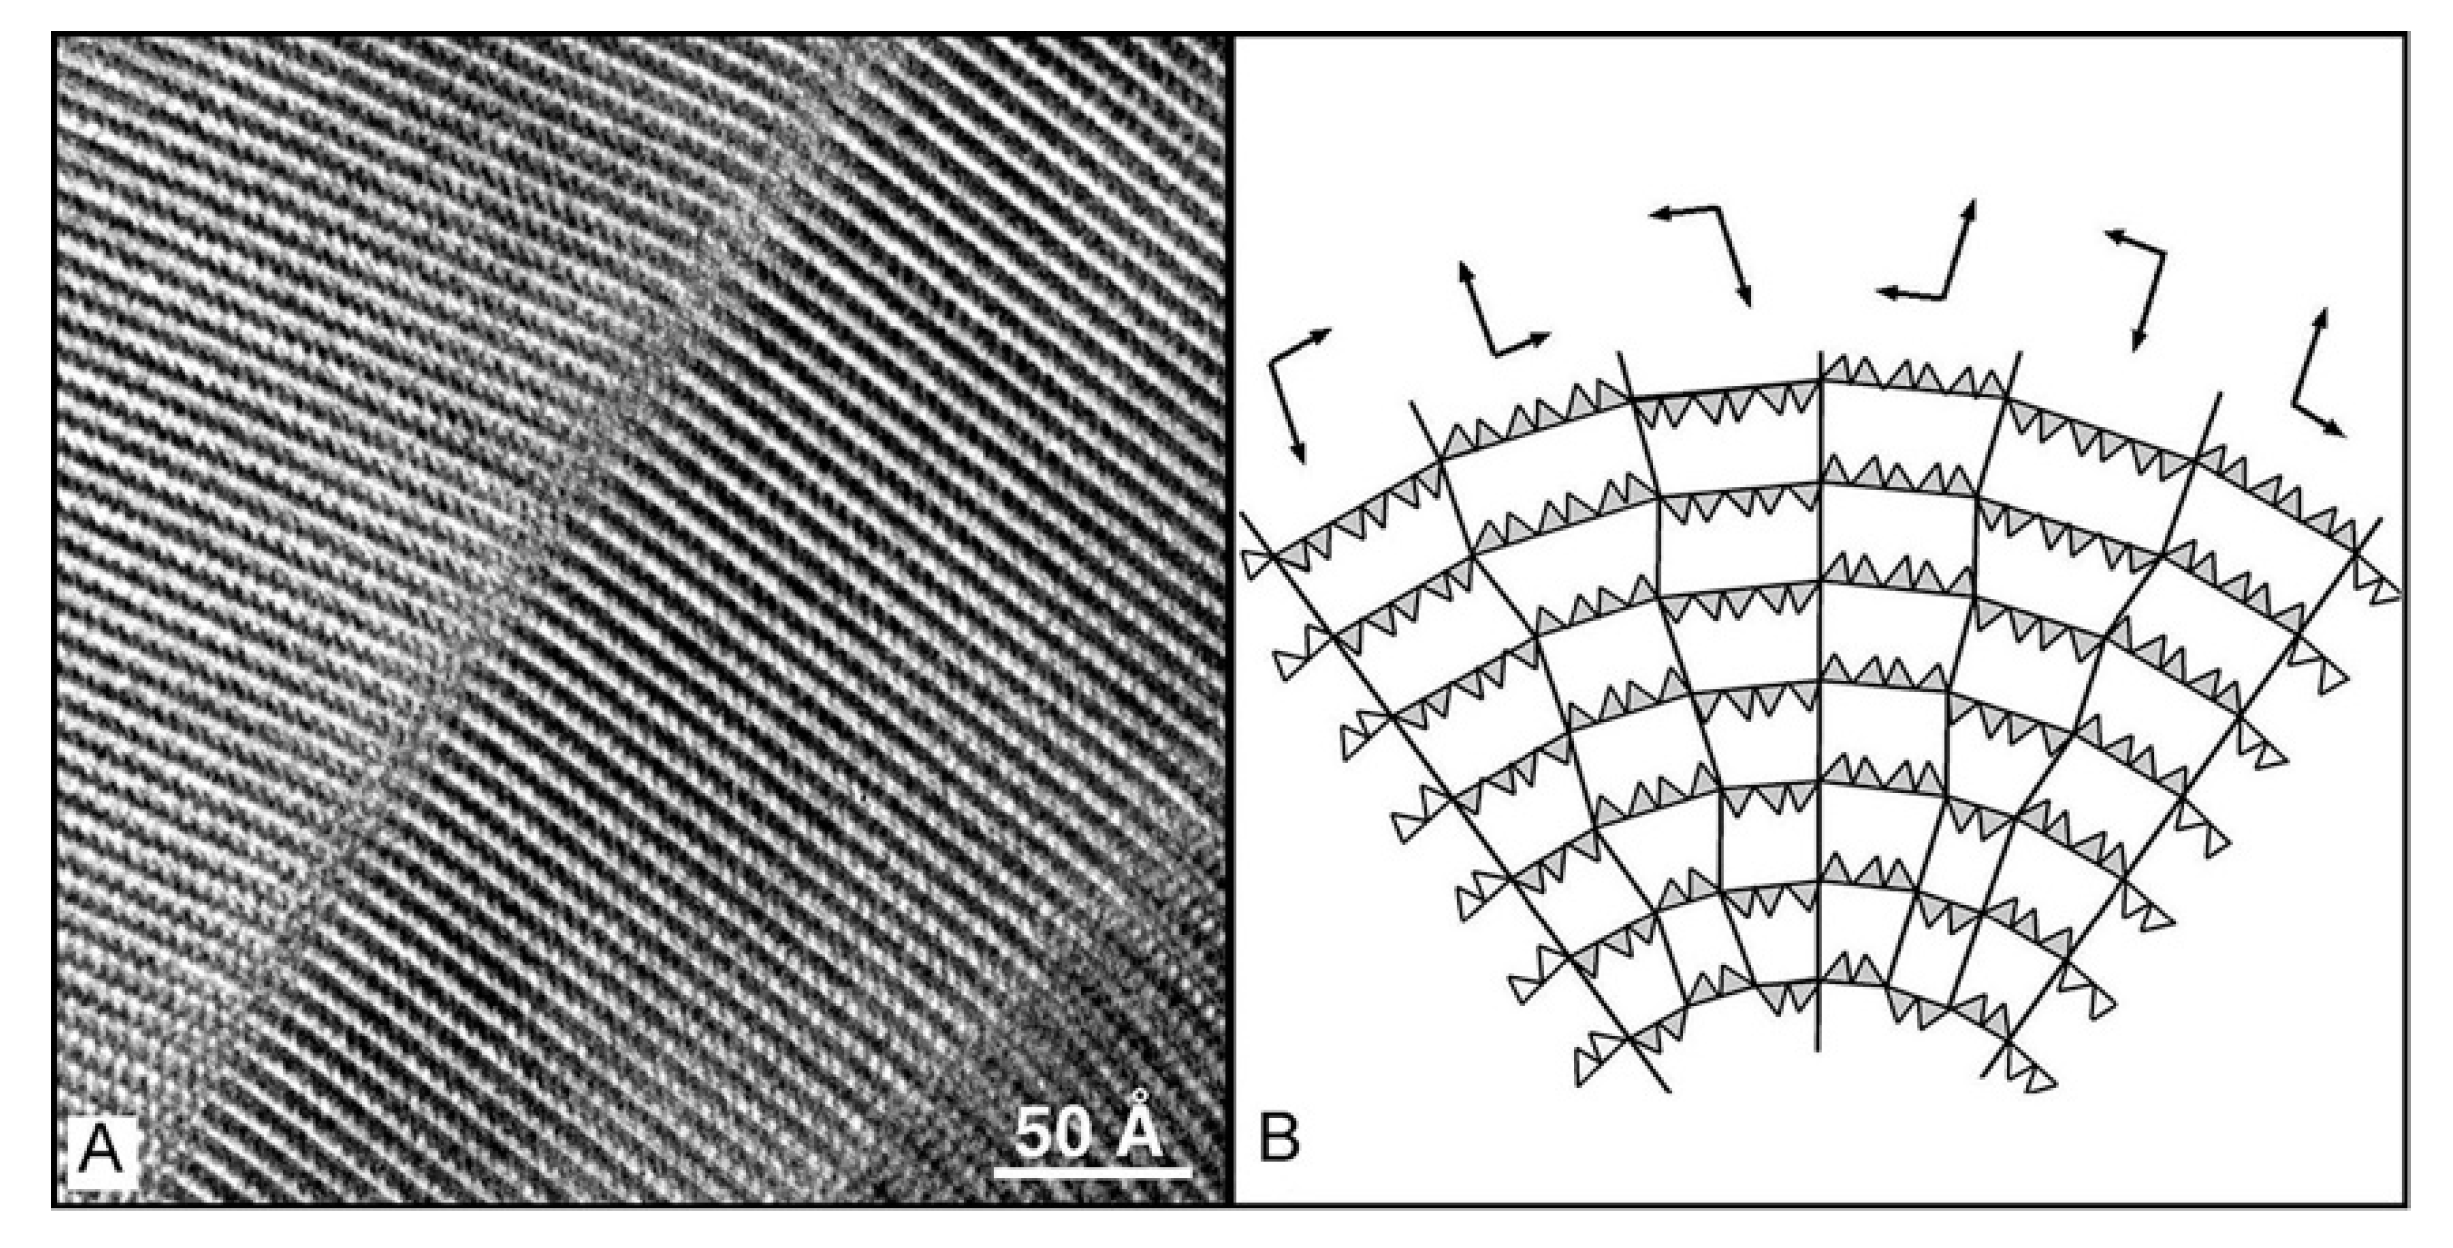
Polygonal serpentine (PS) is an exotic morphology of a nanotube’s cross-section, which was first observed in natural chrysotile samples [25,27,121,122]. However, there was a report which demonstrated the possibility of PS synthesis [123]. Usually, the structure consists of a classic nanotubular core and a polygonal shell of 15–30 sectors (Figure 32). The size of the cross-section can exceed 200 nm. It is interesting to note that the diameter of the nanotubular part is approximately equal to the energy preferable part size predicted in [83]. We believe that polygonisation is one of the stress compensation mechanisms that is activated when the growth in diameter dominates, (for example, in the case of the high oversaturation of a hydrothermal medium). Dódony and Buseck [27] proposed a scheme of sheet rotation in the adjacent PS sectors (Figure 33). According to that scheme, the direction of bending would be opposite in the two adjacent sectors, which would have analogies with antigorite [58]. However, in contrast to wavy antigorite, PS layers remain flat. Another reason for polygonisation could be the spatial distribution of cations discussed in Section 3.2. For example, the doping of chrysotile by a small amount of Al3+ (which is very common in nature) resulted in the formation of lizardite plates [124]. The cation can efficiently substitute both Mg2+ and Si4+ and neutralise the size difference between the sheets. Unfortunately, there is a lack of information regarding the tubular and polygonal parts of PS.
4. Properties and Applications Related to Cation Doping
Here, we limited the review to four areas in which cation doping has already been used or could be used in the nearest future. The first area concerns the nanotube porosity design for the adsorption, uptake and release of functional substances. In the second area, nanotubes are used as reinforcing fillers of, generally, different polymers. The third area focuses on the magnetic properties of doped nanotubes. The fourth area is devoted to a number of catalytical applications.
4.1. Tuning Nanotubes’ Diameter for Uptake and Release
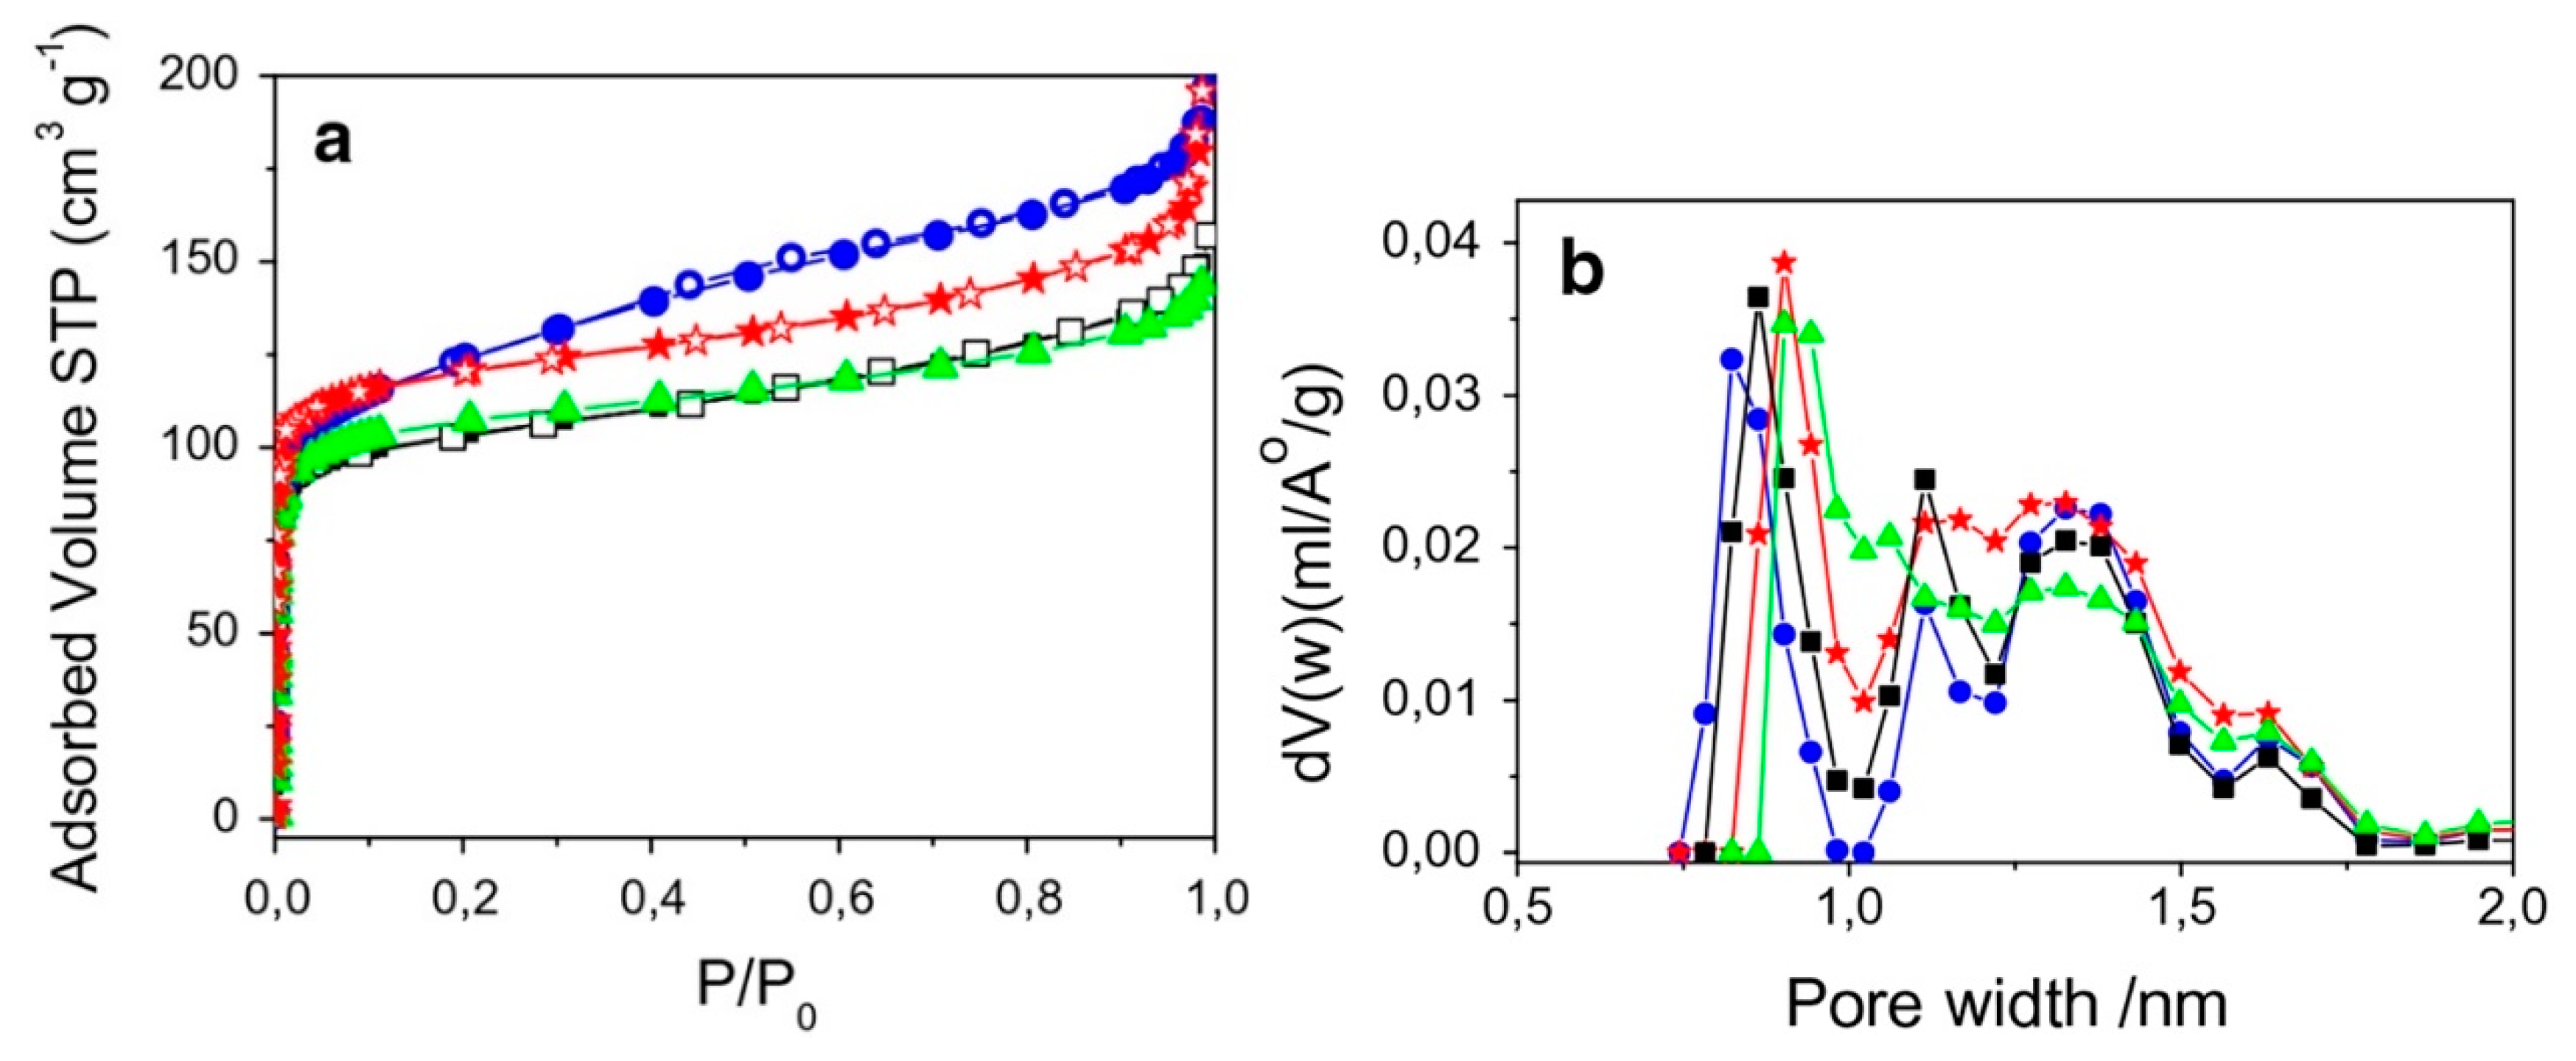
Section 2 and Section 3 demonstrated the theoretical basis for, and the experimental possibility of, tuning hydrosilicate nanotubes’ curvature (or even changing the direction of scrolling) by cation doping. This feature could be used for specific surface area (SSA) and pore size control and hence, the control over the amount and speed of uptake and/or release of different substances. From the point of view of the relative impact on morphology and control precision, imogolite seems to be the preferred option: its diameter can be increased almost double by Ge4+ doping [65,95,125,126]. Shafia et al. [107] reported on the diameter increase in Fe-doped imogolite, which was in correlation with DFT pore size distribution (Figure 34). Intriguingly, specific surface area also increased, (383 m2/g for pure imogolite against 455 m2/g for imogolite doped with 1.4 wt.% Fe), and this might be attributed to the slight change in the contribution of micro- and mesopores observed by the authors. Fe3+ doping in chrysotile led to an increase in diameter and a slight decrease in the SSA value from 64 to 54 m2/g. It is worth noting that the multi-walled nature of chrysotile and halloysite erodes their surface area remarkably in comparison to imogolite. In order to increase those values (up to 200–300 m2/g), selective acid leaching is often applied [127,128,129]. It is important to note that variation in synthesis conditions—the type of precursors, the temperature/pressure/time and the hydrothermal medium—can help to tune the diameter and the SSA value of nanotubes [76,113,130,131].
The nanotubes’ porous structure was found to be attractive for the adsorption, uptake and release of a large number of substances, despite systematic studies on the role of the dopant’s content not having been carried out. The first group of adsorbed species are gases. Ackerman et al. [132] demonstrated that the uptake of CO2 and CH4 decreased by 1.6 times, while 50% of Si was substituted by Ge in imogolite, despite a slight increase in the SSA value. One study [133] achieved 50.6 mg/mL of CH4 storage capacity at 4.05 MPa by using synthetic imogolite. Gas storage capacity could be further improved by the modification (methylation, for example) of the nanotubes’ surface [126,134]. A thorough review [135] considered Mg-containing systems, including chrysotile, as CO2 capture and recycling materials. In this case, the SSA value remained one of the key parameters.
An additional structural feature of the hydrosilicate nanotubes is their outer and inner surface charge. Depending on the direction of scrolling, halloysite-type nanotubes demonstrate SiO2-like negative zeta potential value, while chrysotile-type nanotubes have a metal oxide-like positive value [136]. This difference could prioritise the charged species’ adsorption from the solution on the outer or inner nanotube surface. Those species could be surfactants [137,138,139,140], metal cations [141,142,143,144,145,146,147], anions [148] or dyes [136,149,150]. Thus, the nanotubes could be successfully used as water remediation agents. Applications for compounds that can be loaded into nanotubes vary, from corrosion and the inhibition of unfavourable processes [151,152,153,154,155], to antimicrobial activity [156,157,158] and medical treatments [159,160,161,162,163].
4.2. Mechanical Properties of Composite Materials
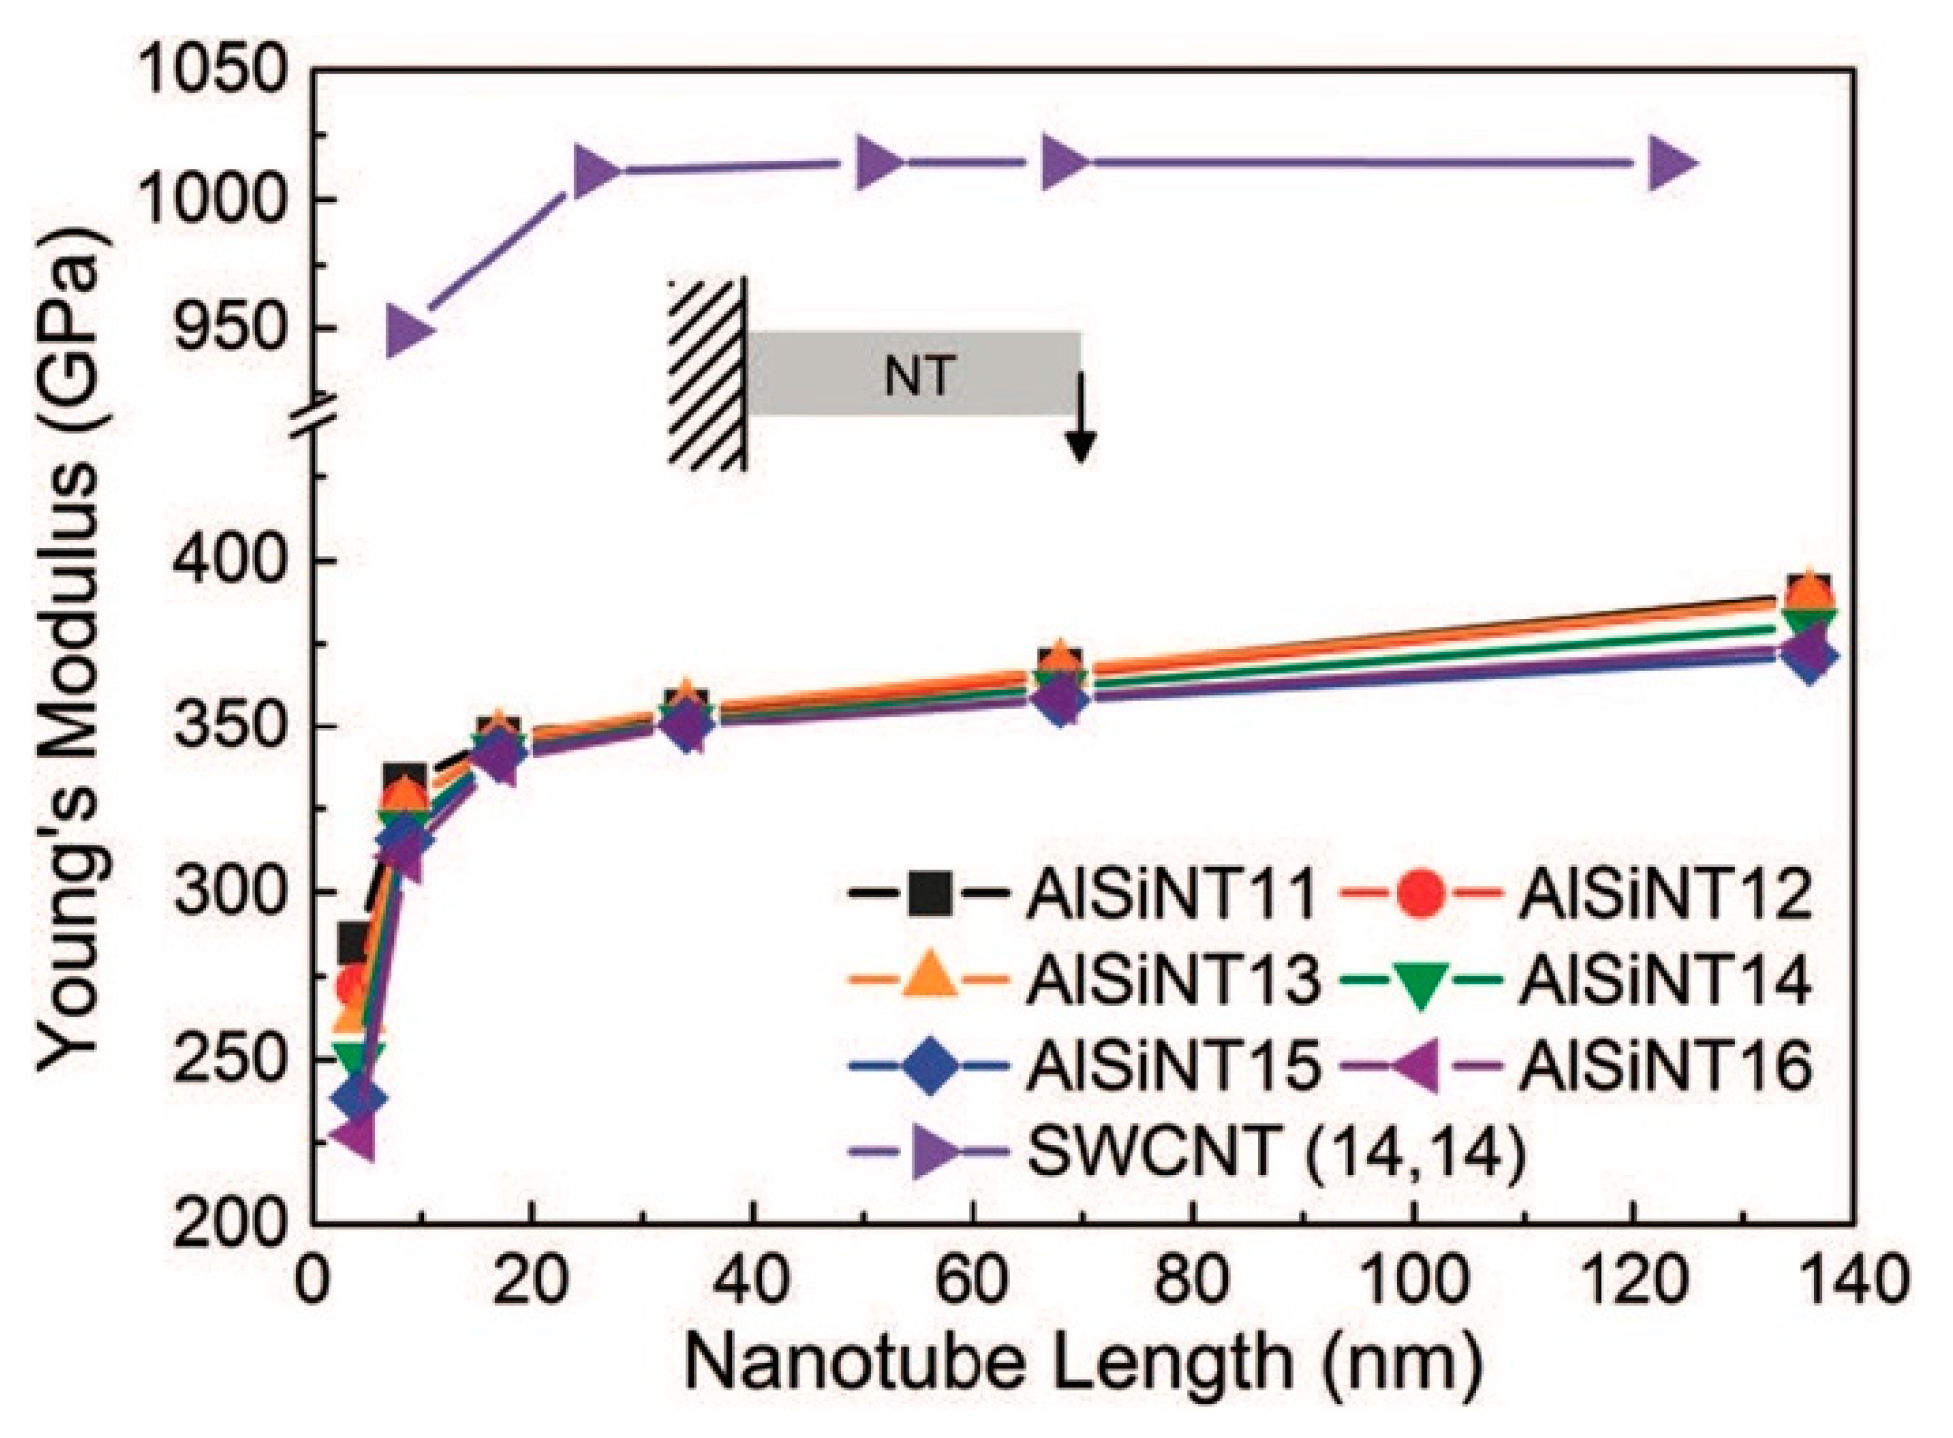
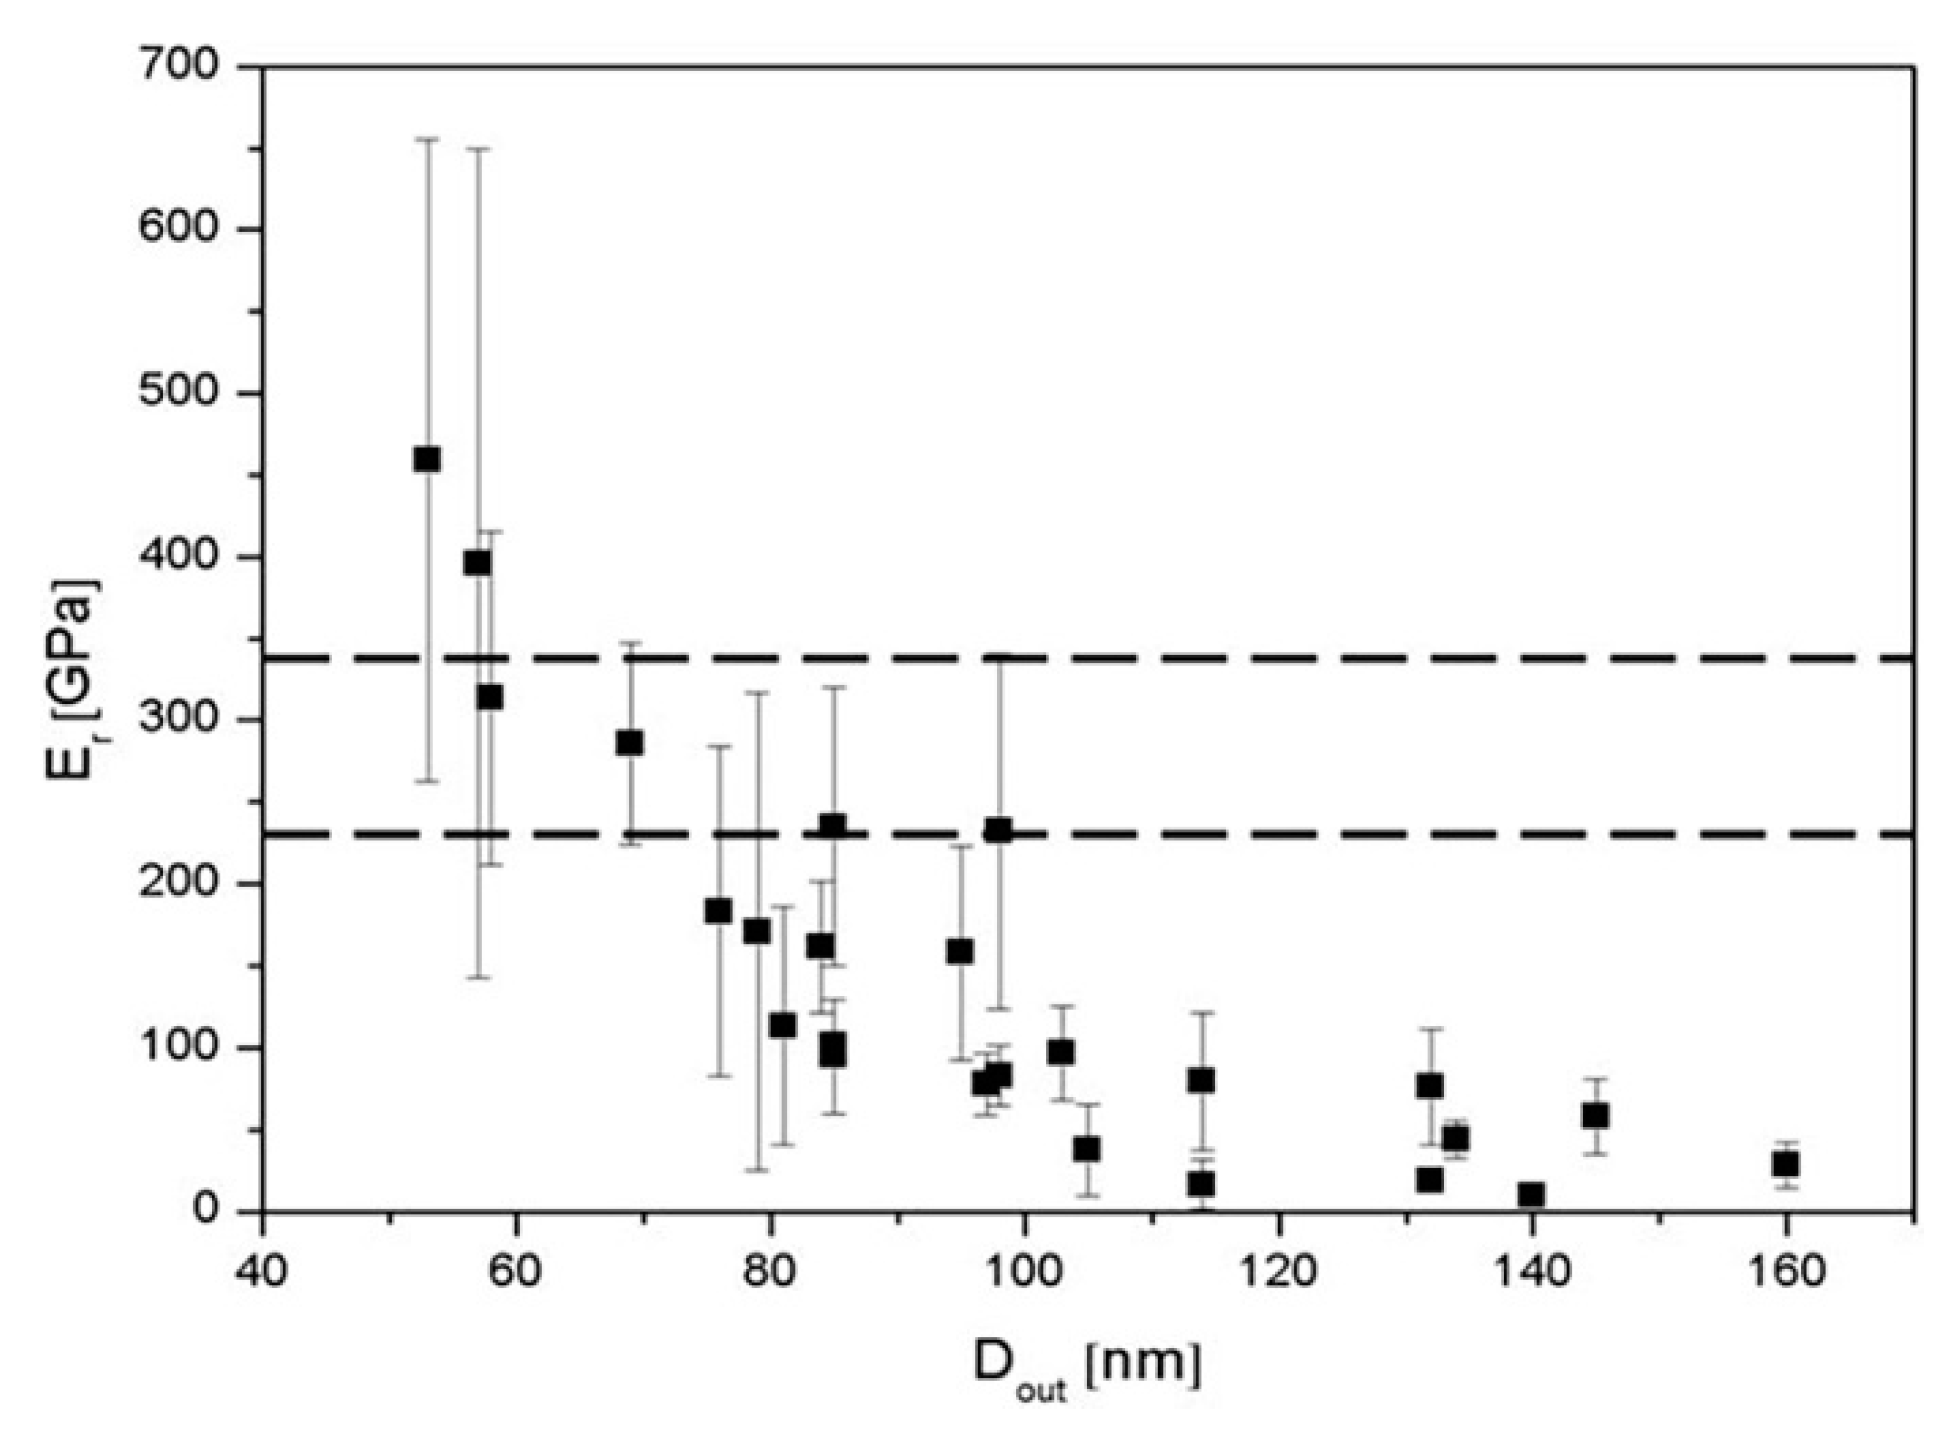
Although the mechanical properties of chrysotile, imogolite and halloysite have been studied theoretically [42,56,57], few experimental data are available. Piperno et al. [53] determined the Young’s modulus of pure and Fe3+-doped chrysotile, using an atomic force microscope (AFM), to be 159 ± 125 GPa and 279 ± 260 GPa. Assuming 3Mg2+ to 2Fe3+ substitution with the formation of vacancies, an increase in the Young’s modulus might appear to contradict some MD calculations [51] discussed in Section 2.2.1. The mean values appeared to depend upon the presence of Fe3+, although the measurements generated a large error. This type of experiment remains very challenging, because of a number of methodological and physical hindrances. One of these is the diameter dependence of the Young’s modulus (Figure 35), which has been frequently observed for a wide range of tubular (Mg3Si2O5(OH)4 and Ni3Si2O5(OH)4) and rod-like materials (ZnO, carbon nanotubes) [164,165,166]. Lecouvet et al. [54] measured the Young’s modulus of halloysite nanotubes situated in a pore of a track filter membrane by bending. The authors attributed the increase in small halloysite nanotubes’ elastic modulus to the increase in the contribution of surface tension, and a decrease in the elastic modulus in the case of large tubes—to the shear of adjacent layers. In addition, the deformation of large tubes would require a considerable applied force, which could disrupt the nanotube’s position by its displacement.
A second set of uncertainties originates from the Young’s modulus equation:
where takes into account boundary conditions, is bending stiffness, is the nanotube’s length that experiences bending and and are the outer and inner diameter, respectively. Regardless of any error in the value measurement (which could be around 20%), varies from 1 to 4, depending on whether the ends are clamped or free, and, in practice, it can take on an intermediate value. The value can be substantially different from the geometric length of a nanotube over a pore and might have to be determined on the basis of a bending stiffness profile. The error in the outer diameter measurement becomes crucial in the case of small nanotubes, whereas the inner diameter cannot be measured directly using the AFM method. Thirdly, the type of nanotube/AFM tip contact can also affect the results [167]. To conclude, cation doping can be used for tuning the Young’s modulus, although great effort must be devoted to obtaining consistent data.
Despite the issues with determining experimental mechanical properties, hydrosilicate nanotubes have been intensively used as reinforcing fillers for polymer composites. A review [168] has highlighted the enhancement of a number of composite functional properties, including mechanics, in comparison to a pristine polymer. In particular, poly(methyl methacrylate) (PMMA) containing 1 wt.% of imogolite nanotubes has demonstrated a 37% increase in the Young’s modulus and a 39% increase in tensile strength. Halloysite nanotubes, when injected into different polymers, can also substantially improve mechanical properties [169]. The greatest impact, probably, can be made by ethylene propylene diene monomer (EPDM), a rubber/halloysite composite that can create a tensile strength increase of 874%. Jiang et al. [170] reported a 20% increase in the Young’s modulus and tensile strength of the PMMA copolymer/0.5–1 wt.% halloysite nanotubes composite. Synthetic chrysotile nanotubes and natural halloysite were used as fillers for chitosan fibres [171]. The authors demonstrated that the tensile strength increase in the chrysotile-containing composite was remarkably higher (67%) than that of the halloysite-containing composite (5%). Wu et al. [172] reported a 25% Young’s modulus increase in the case of a polyimide filling with 4 vol.% of synthetic chrysotile.
Of course, the evidence of polymer reinforcement with nanotubes is not limited to the papers reviewed above, but a thorough investigation would be beyond the scope of the current paper. Despite cation doping’s influence on nanoscrolls’ mechanical properties, a systematic study of its role in the preparation of composite materials is yet to be carried out.
4.3. Magnetic Properties
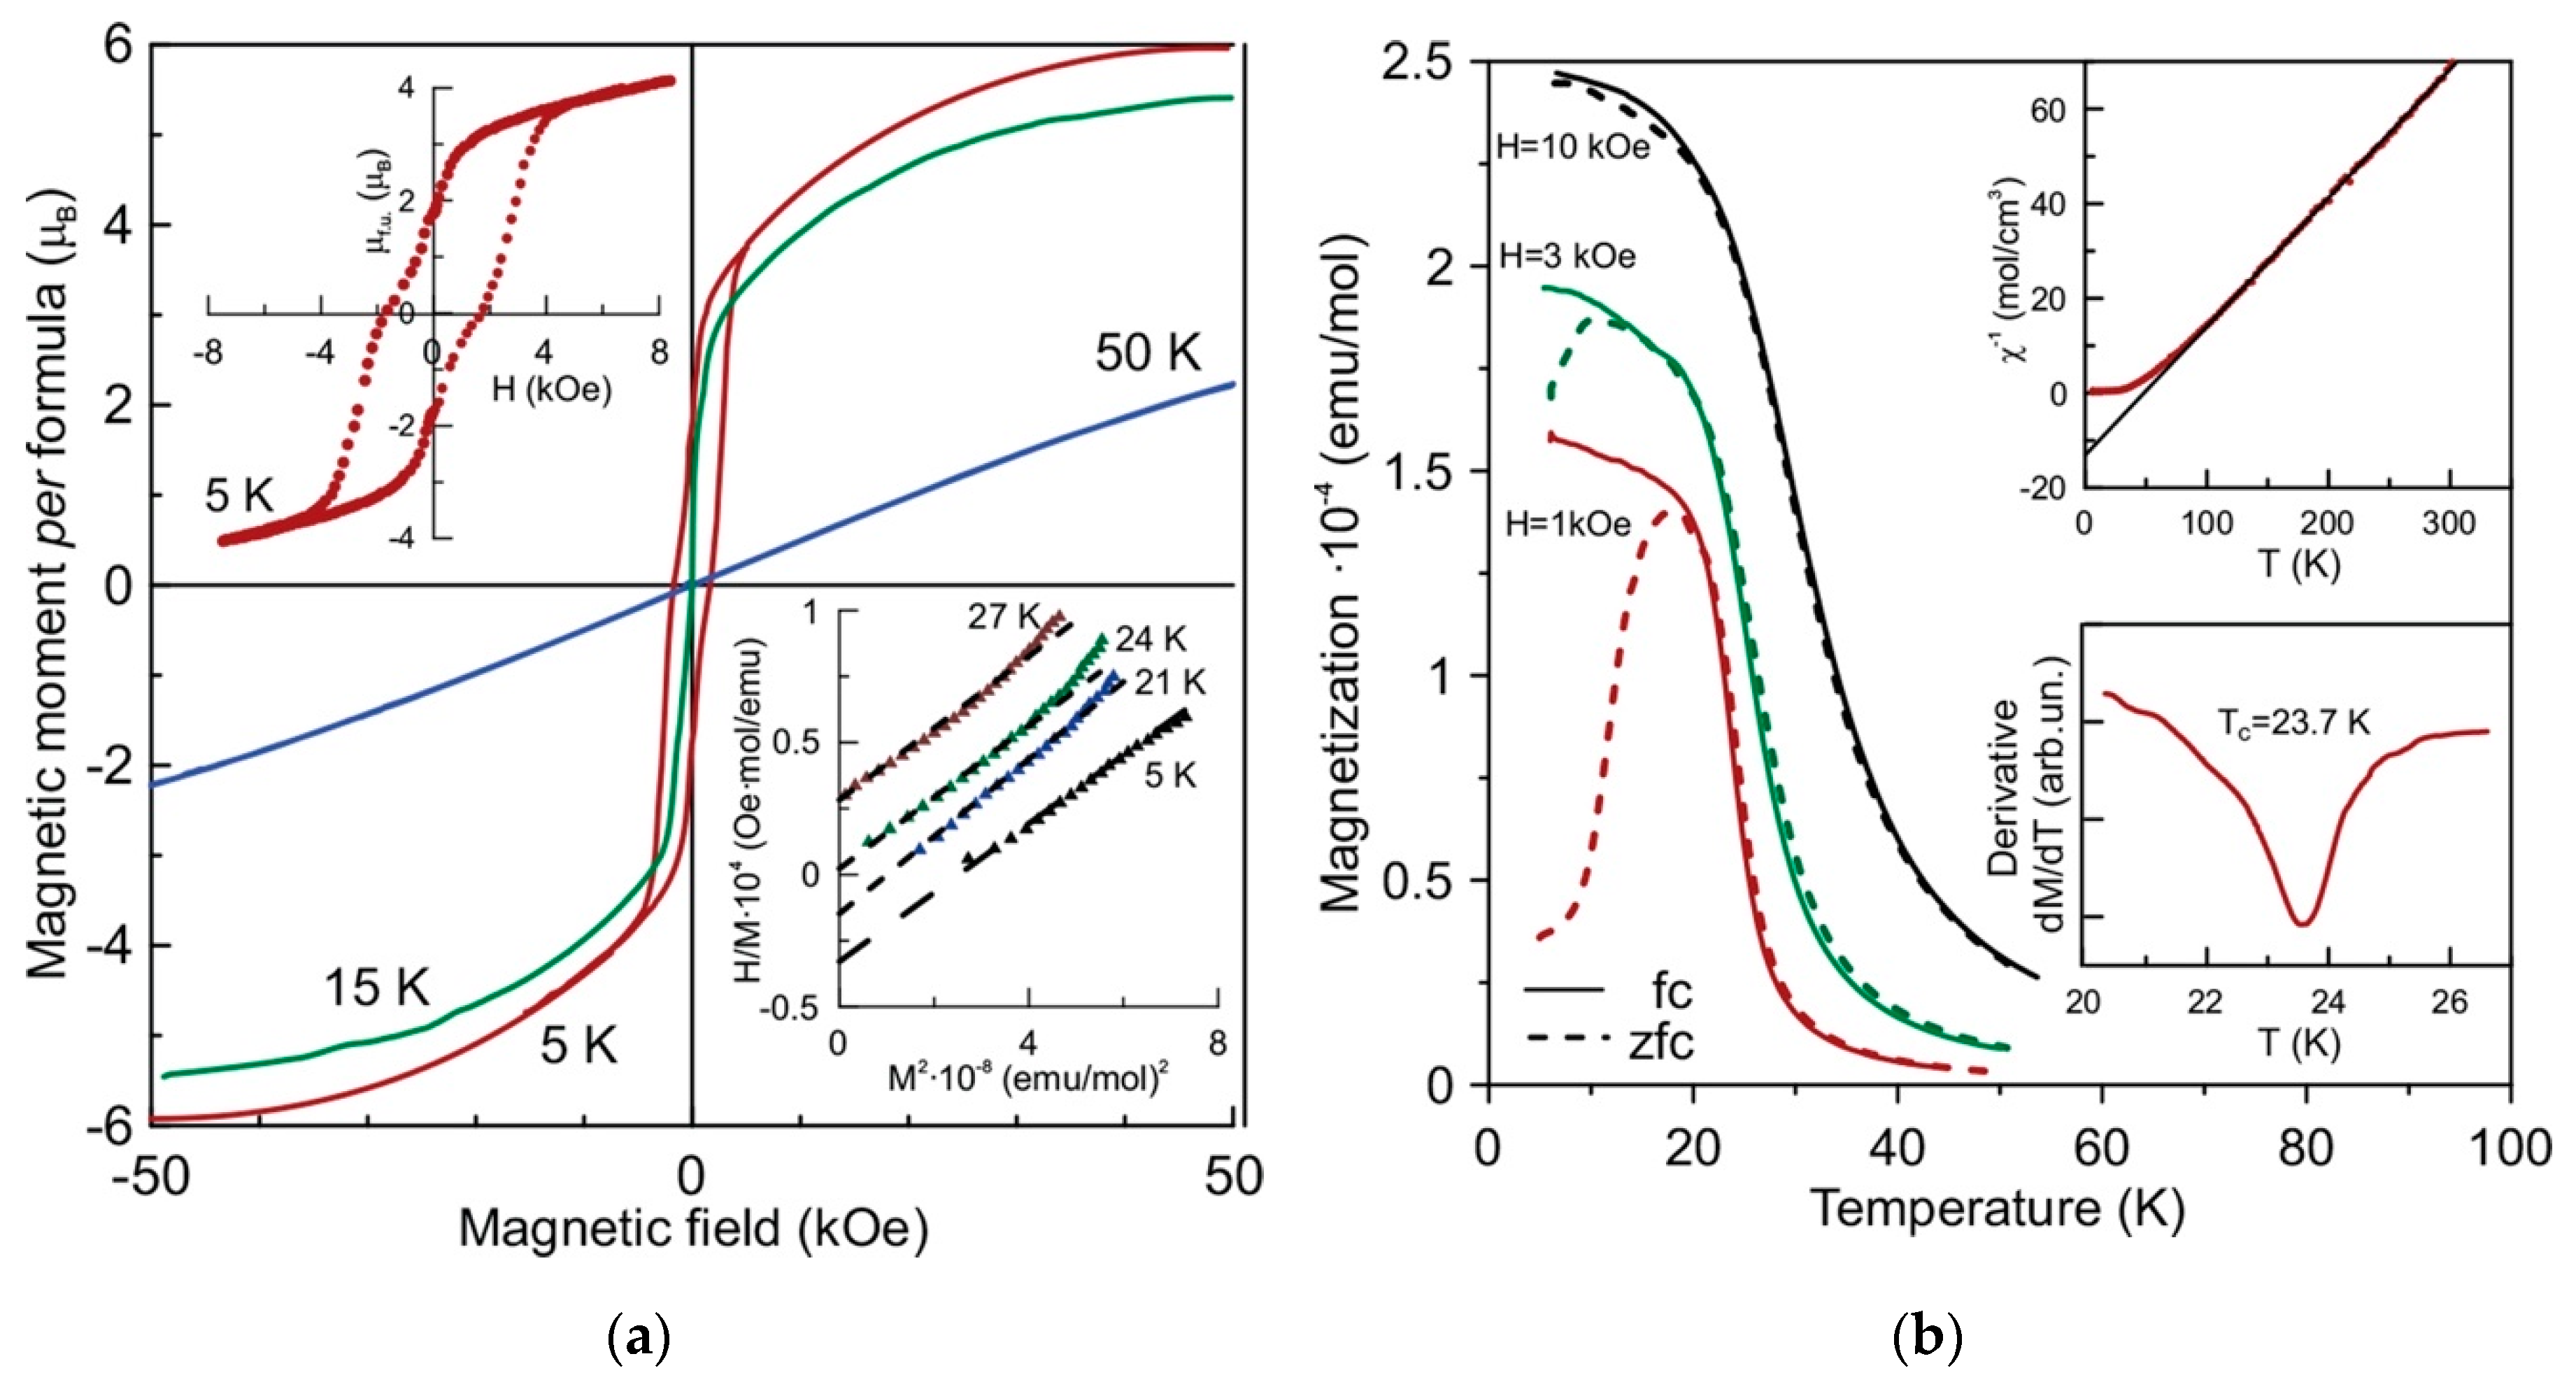
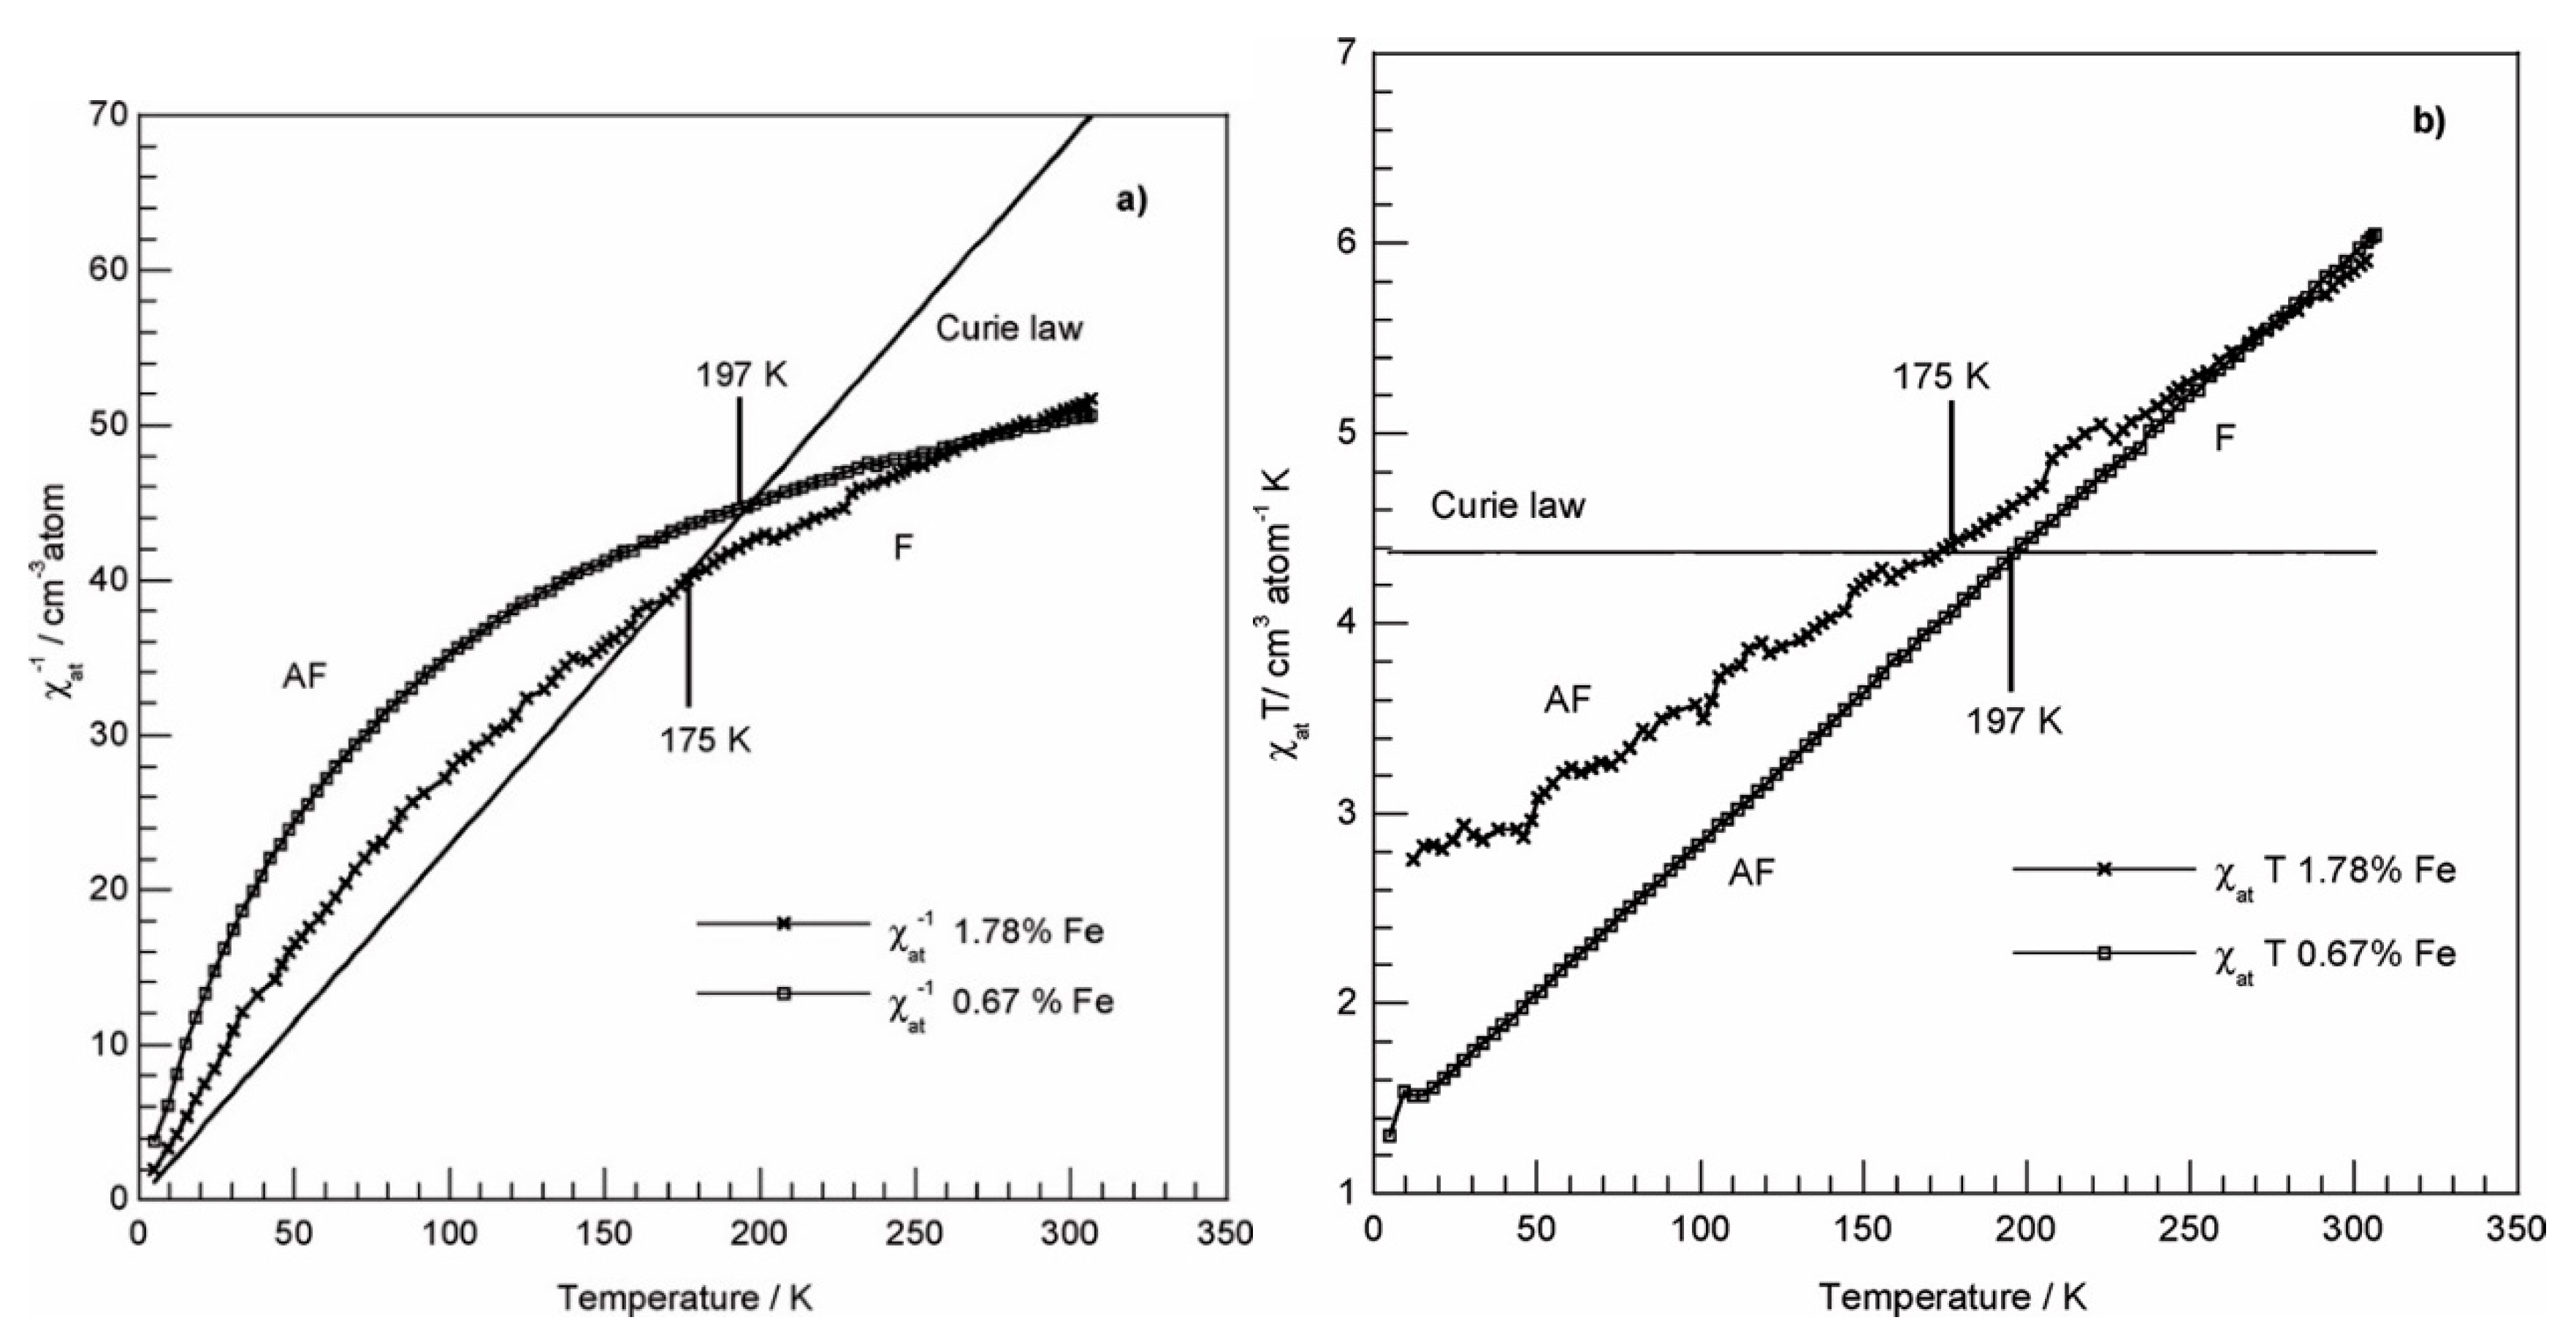
Being composed of p-elements, chrysotile, imogolite and halloysite are diamagnetic materials. However, the substitution of Mg2+, Al3+ and Si4+ cations by elements with uncoupled electrons could enhance the magnetic properties of those nanotubes. The case of Ni3Si2O5(OH)4 nanotubes’ magnetic response was studied in [114]. The particles demonstrated a ferromagnetic order (Figure 36) with the Curie point at 23.7 K. Magnetic ordering occurred through a large interlayer distance of 0.73 nm between the adjacent octahedral sheets. The type of ordering qualitatively correlated with that of α-Ni(OH)2 in terms of there being a relatively large interlayer distance. According to [173], the type of magnetism depended on the crystal modification (α or β) of the hydroxide. β-Ni(OH)2 had a smaller interlayer distance (4.6 Å) than α-Ni(OH)2 (8.7 Å) and demonstrated an antiferromagnetic order instead. The α-Ni(OH)2 Curie point of 16 K was lower than that of Ni3Si2O5(OH)4 nanotubes, which might, again, be associated with the larger interlayer period of the latter, as if the proximity of Ni-containing octahedral sheets interfered with their magnetic ordering.
Borghi et al. [106] reported on the complex nature of magnetism in the case of Mg2+ and Si4+ substitution by Fe3+, related to the probable presence of antiferromagnetic and ferromagnetic coupling (Figure 37). In contrast to Ni2+ substitution, Fe3+ can occupy both octahedral and tetrahedral sites in an uncontrollable ratio, complicating magnetic response. Meanwhile, some analogy has been found in the comparison of the magnetic properties of Fe(OH)2 and Ni(OH)2. Miyamoto [174] demonstrated antiferromagnetic ordering in Fe(OH)2 with a lattice constant (distance between adjacent layers) of 4.605 Å, which is close to β-Ni(OH)2. Perhaps, Fe3+ situated in tetrahedral sites acted like a close-lying hydroxide layer inducing antiferromagnetic coupling in Fe-doped Mg3Si2O5(OH)4. If Fe3+ were to occupy only the octahedral sites of the structure, there would be a ferromagnetic-type coupling only.
Another interesting example of obtaining a magnetic response is structure modification through the reduction of dopants by hydrogen or another chemical agent. Ni nanoparticles were obtained by the NaBH4 reduction of Ni3Si2O5(OH)4 nanotubes [175] for application in Li-ion batteries. Obviously, the appearance of nickel metal makes the composite sensitive to a magnetic field even at room temperature (Figure 38). The dopant reduction reveals the additional applications of nanotubes, for example, as magnetically guided adsorbents, or catalysts.
4.4. Metal Reduction and Catalysis
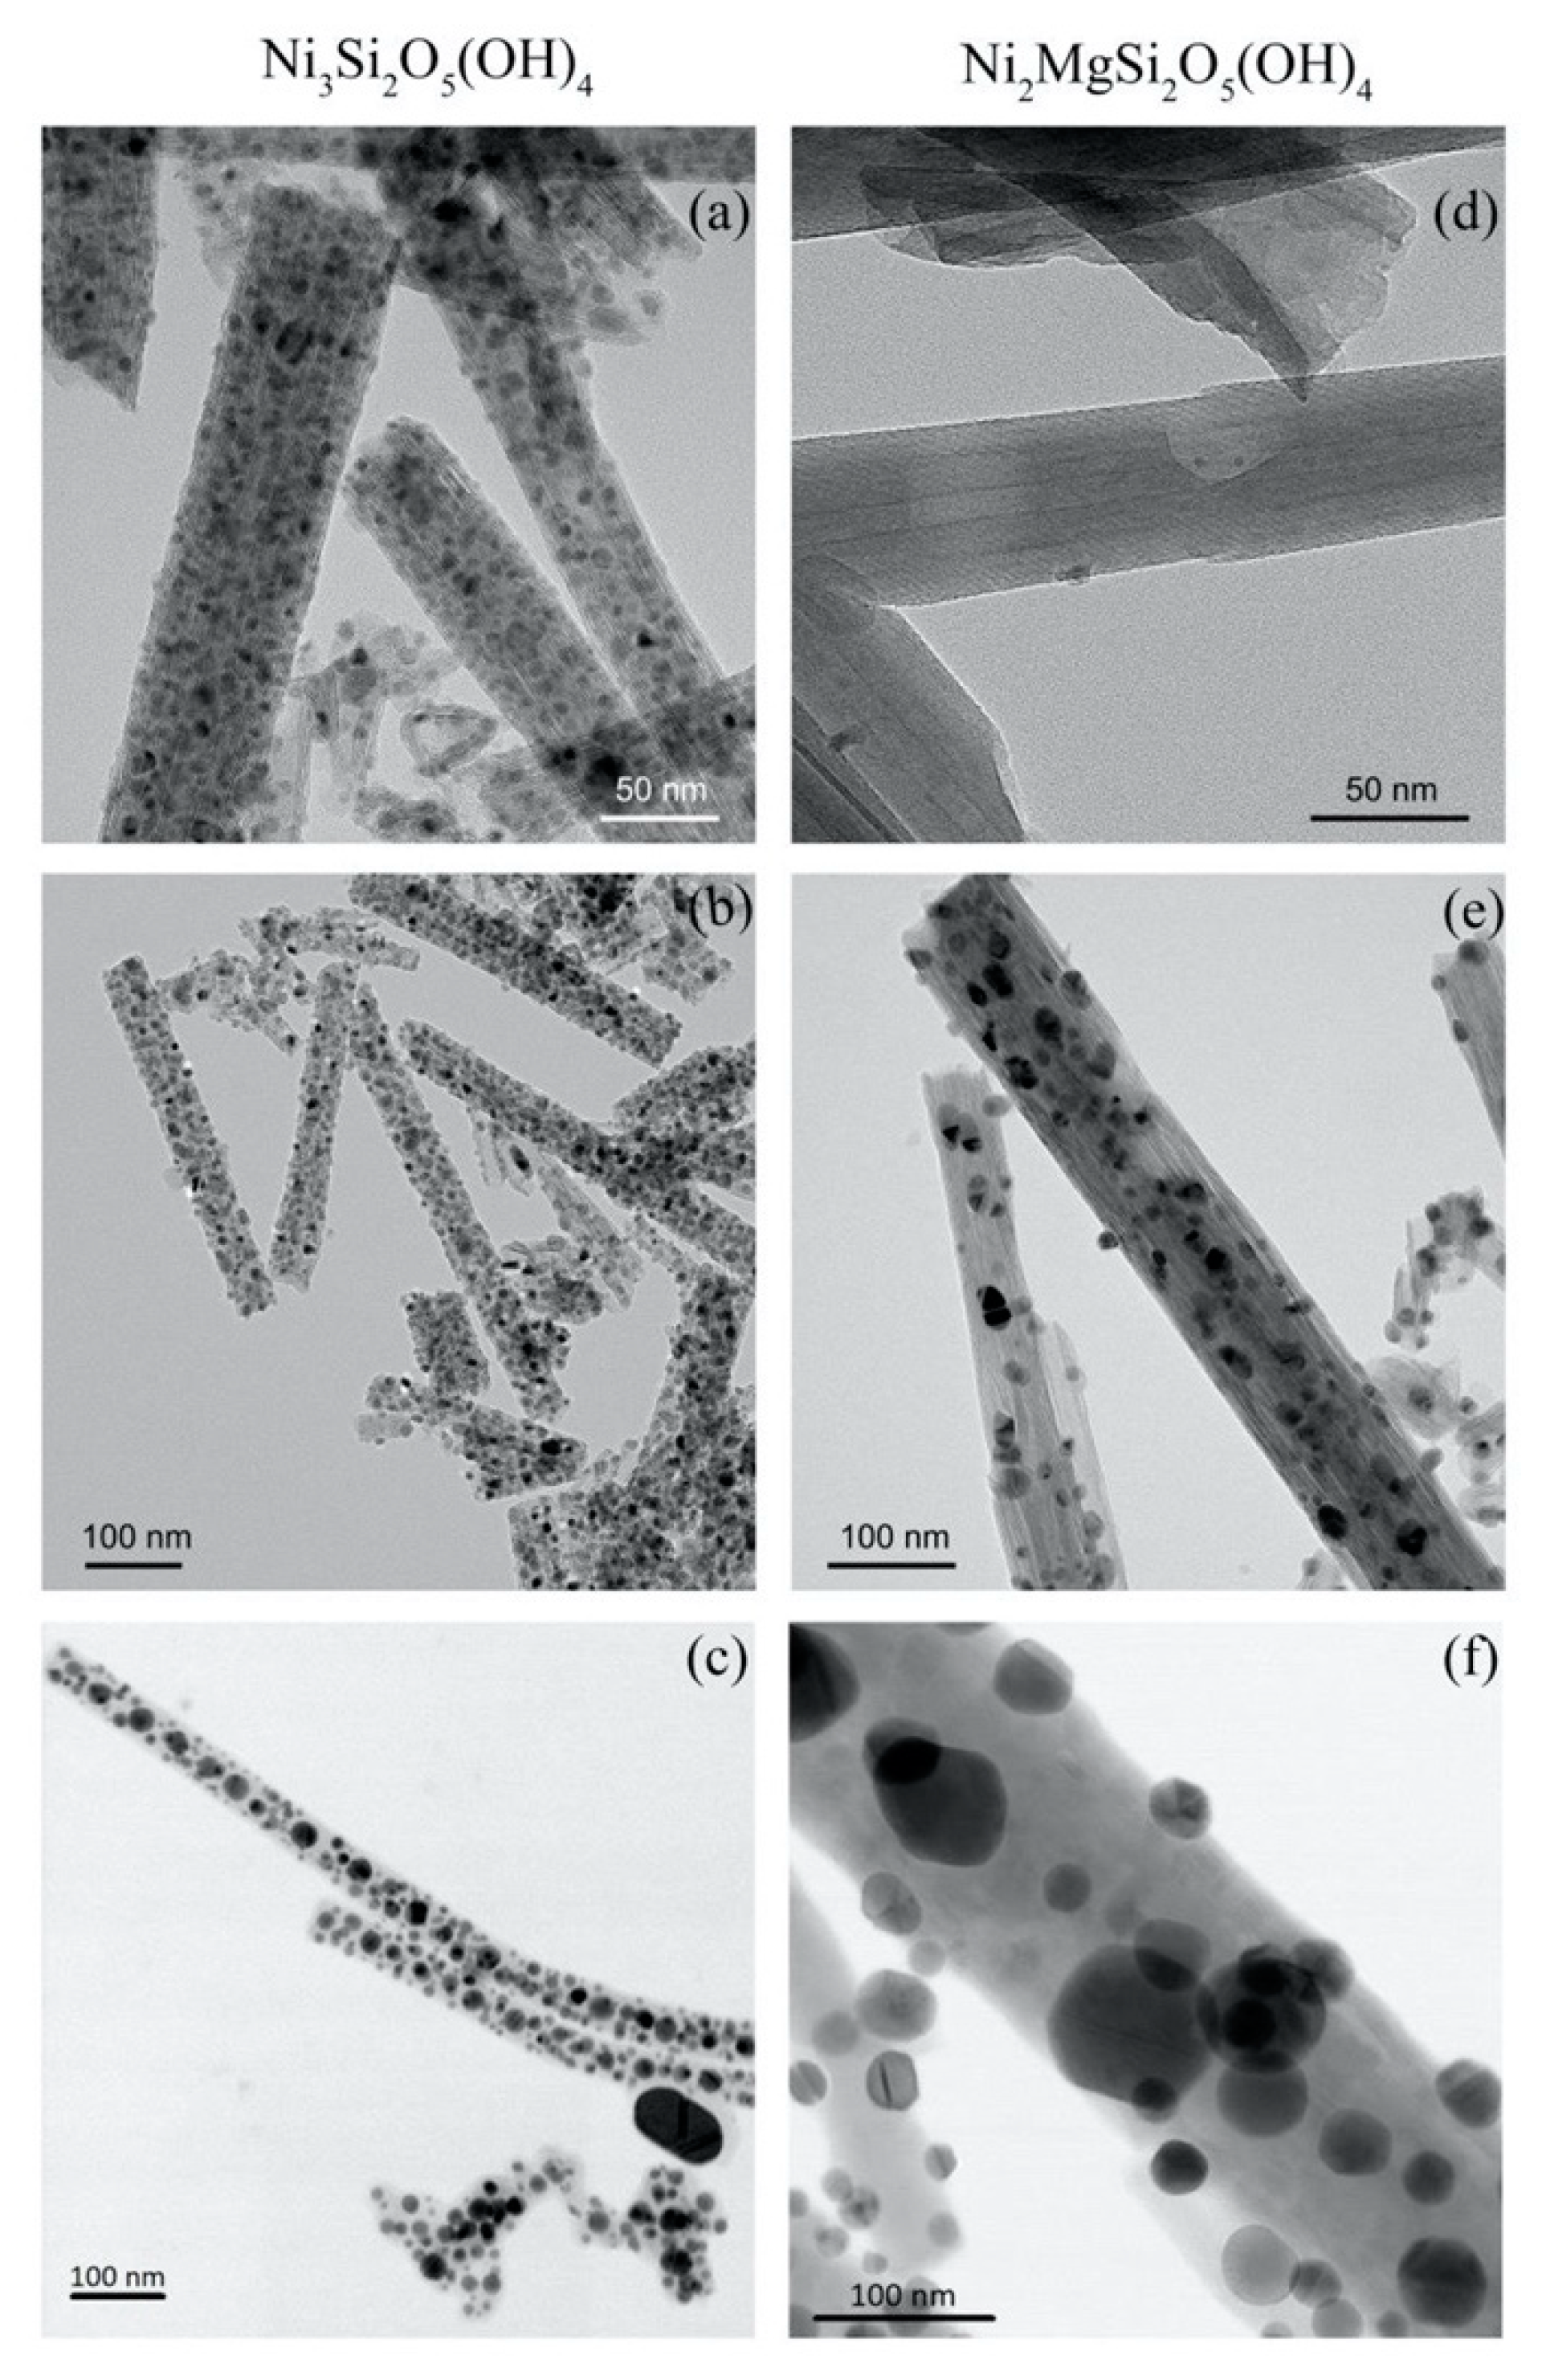
Among the three hydrosilicates, the hydrogen reduction of doped chrysotile and the related phyllosilicates for catalytical applications constitute the most developed field. Early studies determined the starting temperatures for d-elements reduction in chrysotile—they were 400 °C for Ni [176] or Co [177] cations, and around 350 °C in the case of Fe [178]—whereas the major reduction occurred at higher temperatures, around 550–700 °C. The reduction range could be shifted, depending on chemical composition. For example, the presence of Mg cations shifted the temperature of the Ni reduction peak (on a temperature-programmed reduction profile) in Ni-doped chrysotile from 580 to 650–700 °C [179]. The reduction process was accompanied by the structural transformations of hydrosilicate, including dehydroxylation and the formation of metal silicate or crystalline SiO2 in the high temperature range. Figure 39 shows Ni metal nanoparticles embedded in a residual nanotubular matrix [180]. The size of nanoparticles (NPs) also depended on the initial chemical composition, as well as on the reduction temperature and time. The typical Ni and Co NP size, that could be obtained with a 500 °C reduction, was around 5 nm [110,181]. At the same time, the SSA value of a metal/silicate composite could be preserved at a relatively high level of around 100 m2/g. The metal NPs obtained by reduction are catalysts with a wide range of applications, including hydrogenation [176,177,182], the Fischer–Tropsch process [110], the water–gas shift reaction [179,183] and reforming [184,185,186]. The high stability and resistivity to the carbon deposition of these materials is considered to be a consequence of the strong coupling between metal NPs and the silicate matrix.
Metal extraction from the nanotube structure is less abundant in the case of imogolite and halloysite. To the best of our knowledge, there have not been any attempts to reduce, for example, iron in Fe-doped imogolite, in spite of the synthesis of this material having been successful. However, halloysite is frequently used as a traditional catalyst in conjunction with a metal [187,188,189,190,191], an oxide [192,193,194,195] or another type of NP [196].
Furthermore, hydrosilicate nanotubes can be involved in a number of catalytic processes without preliminary reduction or decoration by NPs (although additional acid or heat treatment are still required). Heat-treated chrysotile has been successfully used for reforming benzene [197], biodiesel synthesis [198], esterification [199] and aldol condensation [200]. Bonelli et al. [201] demonstrated the acidic character of imogolite nanotubes and their performance in gas-phase phenol methylation. Ookawa [202] showed the catalytic activity of heat-treated imogolite in cyclohexane oxidation with H2O2. Halloysite nanotubes can be modified by sulfuric acid in order to strengthen their acidic properties [203] for use in the oligomerisation process.
5. Conclusions
Let us summarise some key points from this review: The modelling of hydrosilicate nanotubes enables a study of their morphology and of their mechanical and electronic properties. The preferred morphological parameters of single- and multi-walled chrysotile, halloysite and imogolite, as well as their cation doped derivatives, can be predicted as a function of strain, surface and adhesion energy.
Cation doping affects the size differences between the sheets and can change the direction of the scrolling. The lack of pure halloysite nanotubes synthesis reports suggests some hindrances; if these could be overcome, this should open a path for the synthesis of a number of halloysite-type scrolling hydrosilicates. Nanotubes’ size can demonstrate nonlinear behaviour in relation to increases in guest cation concentration, because of the possible strain- and curvature-driven distribution of cations among, and within, single nanotubes. The formation of non-cylindrical morphologies also increases in the case of partial cation substitution. To date, the most significant impact of cation doped hydrosilicate nanotubes has occurred in the catalytic field. Other applications considered have generally involved pristine nanotubes. However, the cation doping approach can be fruitful for tuning the adsorption properties and mechanical response of hydrosilicate nanotubes.
Author Contributions
Conceptualisation, A.A.K.; writing—original draft preparation, A.A.K., E.K.K. and T.P.M.; writing—review and editing, E.K.K. and T.P.M.; visualisation, A.A.K.; supervision, A.A.K. All authors have read and agreed to the published version of the manuscript.
Funding
The research was supported by Russian Science Foundation Grant 16-13-10252.
Acknowledgments
The authors would like to thank V.V. Gusarov for fruitful discussions.
Conflicts of Interest
The authors declare no conflict of interest.
References
- Pauling, L. The Structure of the Chlorites. Proc. Natl. Acad. Sci. USA 1930, 16, 578–582. [Google Scholar] [CrossRef] [Green Version]
- Bowen, N.L.; Tuttle, O.F. The system MgO-SiO2-H2O. Geol. Soc. Am. Bull. 1949, 60, 439–460. [Google Scholar] [CrossRef]
- Bates, T.F.; Hidebrand, F.A.; Swineford, A. Morphology and structure of endellite and halloysite. Am. Mineral. 1950, 35, 463–484. [Google Scholar]
- Bates, T.F.; Sand, L.B.; Mink, J.F. Tubular crystals of chrysotile asbestos. Science 1950, 111, 512–513. [Google Scholar] [CrossRef] [PubMed]
- Roy, D.M.; Roy, R. An experimental study of the formation and properties of synthetic serpentines and related layer silicate minerals. Am. Mineral. 1954, 53, 957–975. [Google Scholar]
- Yang, J.C.-S. The growth of synthetic chrysotile fiber. Am. Mineral. 1961, 46, 748–752. [Google Scholar]
- Saito, H.; Yamai, I. The Effect of Iron Ions on the Formation of Chrysotile under Hydrothermal-Dehydration Process. J. Ceram. Assoc. Jpn. 1968, 76, 331–337. [Google Scholar] [CrossRef] [Green Version]
- Saito, H.; Yamai, I.; Kato, N. Conditions of Synthesis of Chrysotile Fibers under Hydrothermal-Dehydration Process. J. Ceram. Assoc. Jpn. 1968, 76, 247–253. [Google Scholar] [CrossRef] [Green Version]
- Yada, K.; Iishi, K. Growth and microstructure of synthetic chrysotile. Am. Mineral. 1977, 62, 958–965. [Google Scholar]
- Whittaker, E.J.W. The structure of chrysotile. II. Clino-chrysotile. Acta Crystatllogr. 1956, 9, 855–862. [Google Scholar] [CrossRef] [Green Version]
- Whittaker, E.J.W. The structure of chrysotile. III. Ortho-chrysotile. Acta Crystatllogr. 1956, 9, 862–864. [Google Scholar] [CrossRef]
- Whittaker, E.J.W. The structure of chrysotile. IV. Para-chrysotile. Acta Crystatllogr. 1956, 9, 865–867. [Google Scholar] [CrossRef]
- Whittaker, E.J.W. The structure of chrysotile. V. Diffuse reflexions and fibre texture. Acta Crystatllogr. 1957, 10, 149–156. [Google Scholar] [CrossRef]
- Yoshinaga, N.; Aomine, S. Imogolite in some ando soils. Soil Sci. Plant Nutr. 1962, 8, 22–29. [Google Scholar] [CrossRef]
- Cradwick, P.D.G.; Farmer, V.C.; Russell, J.D.; Masson, C.R.; Wada, K.; Yoshinaga, N. Imogolite, a Hydrated Aluminium Silicate of Tubular Structure. Nat. Phys. Sci. 1972, 240, 187–189. [Google Scholar] [CrossRef]
- Farmer, V.C.; Fraser, A.R.; Tait, J.M. Synthesis of imogolite: A tubular aluminium silicate polymer. J. Chem. Soc. Chem. Commun. 1977, 12, 462–463. [Google Scholar] [CrossRef]
- Iijima, S. Helical microtubules of graphitic carbon. Nature 1991, 354, 56–58. [Google Scholar] [CrossRef]
- Yuan, P.; Tan, D.; Annabi-Bergaya, F. Properties and applications of halloysite nanotubes: Recent research advances and future prospects. Appl. Clay Sci. 2015, 112–113, 75–93. [Google Scholar] [CrossRef]
- Mellini, M.; Cressey, G.; Wicks, F.J.; Cressey, B.A. The crystal structure of Mg end-member lizardite-1T forming polyhedral spheres from the Lizard, Cornwall. Mineral. Mag. 2010, 74, 277–284. [Google Scholar] [CrossRef]
- Weck, P.F.; Kim, E.; Jové-Colón, C.F. Relationship between crystal structure and thermo-mechanical properties of kaolinite clay: Beyond standard density functional theory. Dalt. Trans. 2015, 44, 12550–12560. [Google Scholar] [CrossRef]
- Parfitt, R.L. Allophane and imogolite: Role in soil biogeochemical processes. Clay Miner. 2009, 44, 135–155. [Google Scholar] [CrossRef]
- Thill, A.; Picot, P.; Belloni, L. A mechanism for the sphere/tube shape transition of nanoparticles with an imogolite local structure (imogolite and allophane). Appl. Clay Sci. 2017, 141, 308–315. [Google Scholar] [CrossRef] [Green Version]
- Berthonneau, J.; Grauby, O.; Jeannin, C.; Chaudanson, D.; Joussein, E.; Baronnet, A. Native Morphology of Hydrated Spheroidal Halloysite Observed by Environmental Transmission Electron Microscopy. Clays Clay Miner. 2015, 63, 368–377. [Google Scholar] [CrossRef]
- Cravero, F.; Fernández, L.; Marfil, S.; Sánchez, M.; Maiza, P.; Martínez, A. Spheroidal halloysites from Patagonia, Argentina: Some aspects of their formation and applications. Appl. Clay Sci. 2016, 131, 48–58. [Google Scholar] [CrossRef] [Green Version]
- Chisholm, J.E. The number of sections in polygonal serpentine. Can. Mineral. 1992, 30, 355–365. [Google Scholar]
- Cressey, B.A.; Whittaker, E.J.W. Five-Fold Symmetry in Chrysotile Asbestos Revealed by Transmission Electron Microscopy. Mineral. Mag. 1993, 57, 729–732. [Google Scholar] [CrossRef] [Green Version]
- Dódony, I.; Buseck, P.R. Serpentines Close-Up and Intimate: An HRTEM View. Int. Geol. Rev. 2004, 46, 507–527. [Google Scholar] [CrossRef]
- Sprynskyy, M.; Niedojadło, J.; Buszewski, B. Structural features of natural and acids modified chrysotile nanotubes. J. Phys. Chem. Solids 2011, 72, 1015–1026. [Google Scholar] [CrossRef] [Green Version]
- Kato, K.; Inukai, K.; Fujikura, K.; Kasuga, T. Effective encapsulation of laccase in an aluminium silicate nanotube hydrogel. New J. Chem. 2014, 38, 3591–3599. [Google Scholar] [CrossRef]
- Falini, G.; Foresti, E.; Gazzano, M.; Gualtieri, A.F.; Leoni, M.; Lesci, I.G.; Roveri, N. Tubular-shaped stoichiometric chrysotile nanocrystals. Chemistry 2004, 10, 3043–3049. [Google Scholar] [CrossRef]
- Zhang, H.L.; Lei, X.R.; Yan, C.J.; Wang, H.Q.; Xiao, G.Q.; Hao, J.R.; Wang, D.; Qiu, X.M. Analysis on Crystal Structure of 7Å-Halloysite. Adv. Mater. Res. 2011, 415–417, 2206–2214. [Google Scholar] [CrossRef]
- Demichelis, R.; Noël, Y.; D’Arco, P.; Maschio, L.; Orlando, R.; Dovesi, R. Structure and energetics of imogolite: A quantum mechanical ab initio study with B3LYP hybrid functional. J. Mater. Chem. 2010, 20, 10417. [Google Scholar] [CrossRef]
- Mukherjee, S.; Bartlow, V.M.; Nair, S. Phenomenology of the Growth of Single-Walled Aluminosilicate and Aluminogermanate Nanotubes of Precise Dimensions. Chem. Mater. 2005, 17, 4900–4909. [Google Scholar] [CrossRef]
- Alvarez-Ramírez, F. Ab initio simulation of the structural and electronic properties of aluminosilicate and aluminogermanate natotubes with imogolite-like structure. Phys. Rev. B 2007, 76, 125421. [Google Scholar] [CrossRef]
- Saalfeld, H.; Wedde, M. Refinement of the crystal structure of gibbsite, A1(OH)3. Z. Krist. Cryst. Mater. 1974, 139, 129–135. [Google Scholar] [CrossRef]
- Downs, R.T.; Palmer, D.C. The pressure behavior of α cristobalite. Am. Mineral. 1994, 79, 9–14. [Google Scholar]
- Desgranges, L.; Calvarin, G.; Chevrier, G. Interlayer interactions in M(OH)2: A neutron diffraction study of Mg(OH)2. Acta Crystallogr. Sect. B Struct. Sci. 1996, 52, 82–86. [Google Scholar] [CrossRef]
- Krstanović, I. Crystal structure of single-layer lizardite. Z. Krist. Cryst. Mater. 1968, 126, 163–169. [Google Scholar] [CrossRef] [Green Version]
- Momma, K.; Izumi, F. VESTA 3 for three-dimensional visualization of crystal, volumetric and morphology data. J. Appl. Crystallogr. 2011, 44, 1272–1276. [Google Scholar] [CrossRef]
- Enyashin, A.N. Recent Advances in the Theory of Non-carbon Nanotubes. In Computational Materials Discovery; Oganov, A.R., Saleh, G., Eds.; Royal Society of Chemistry: Croydon, UK, 2018; pp. 352–391. ISBN 9781788010122. [Google Scholar]
- Konduri, S.; Mukherjee, S.; Nair, S. Strain energy minimum and vibrational properties of single-walled aluminosilicate nanotubes. Phys. Rev. B 2006, 74, 033401. [Google Scholar] [CrossRef] [Green Version]
- Guimarães, L.; Enyashin, A.N.; Frenzel, J.; Heine, T.; Duarte, H.A.; Seifert, G. Imogolite nanotubes: Stability, electronic, and mechanical properties. ACS Nano 2007, 1, 362–368. [Google Scholar] [CrossRef] [PubMed]
- Lee, S.U.; Choi, Y.C.; Youm, S.G.; Sohn, D. Origin of the Strain Energy Minimum in Imogolite Nanotubes. J. Phys. Chem. C 2011, 115, 5226–5231. [Google Scholar] [CrossRef]
- Alvarez-Ramírez, F. Theoretical Study of (OH)3N2O3MOH, M = C, Si, Ge, Sn and N = Al, Ga, In, with Imogolite-Like Structure. J. Comput. Theor. Nanosci. 2009, 6, 1120–1124. [Google Scholar] [CrossRef]
- Guimarães, L.; Pinto, Y.N.; Lourenço, M.P.; Duarte, H.A. Imogolite-like nanotubes: Structure, stability, electronic and mechanical properties of the phosphorous and arsenic derivatives. Phys. Chem. Chem. Phys. 2013, 15, 4303–4309. [Google Scholar] [CrossRef] [PubMed]
- González, R.I.; Ramírez, R.; Rogan, J.; Valdivia, J.A.; Munoz, F.; Valencia, F.; Ramírez, M.; Kiwi, M. Model for Self-Rolling of an Aluminosilicate Sheet into a Single-Walled Imogolite Nanotube. J. Phys. Chem. C 2014, 118, 28227–28233. [Google Scholar] [CrossRef]
- González, R.I.; Valencia, F.J.; Rogan, J.; Valdivia, J.A.; Sofo, J.; Kiwi, M.; Munoz, F. Bending energy of 2D materials: Graphene, MoS2 and imogolite. RSC Adv. 2018, 8, 4577–4583. [Google Scholar] [CrossRef] [Green Version]
- Poli, E.; Elliott, J.D.; Ratcliff, L.E.; Andrinopoulos, L.; Dziedzic, J.; Hine, N.D.M.; Mostofi, A.A.; Skylaris, C.-K.; Haynes, P.D.; Teobaldi, G. The potential of imogolite nanotubes as (co-)photocatalysts: A linear-scaling density functional theory study. J. Phys. Condens. Matter 2016, 28, 074003. [Google Scholar] [CrossRef] [Green Version]
- Poli, E.; Elliott, J.D.; Chulkov, S.K.; Watkins, M.B.; Teobaldi, G. The Role of Cation-Vacancies for the Electronic and Optical Properties of Aluminosilicate Imogolite Nanotubes: A Non-local, Linear-Response TDDFT Study. Front. Chem. 2019, 7, 1–17. [Google Scholar] [CrossRef] [Green Version]
- Liou, K.-H.; Tsou, N.-T.; Kang, D.-Y. Relationships among the structural topology, bond strength, and mechanical properties of single-walled aluminosilicate nanotubes. Nanoscale 2015, 7, 16222–16229. [Google Scholar] [CrossRef]
- Liou, K.-H.; Kang, D.-Y. Defective Single-Walled Aluminosilicate Nanotubes: Structural Stability and Mechanical Properties. ChemNanoMat 2016, 2, 189–195. [Google Scholar] [CrossRef]
- Liu, C.-H.; Kang, D.-Y. Influence of interwall interaction in double-walled aluminogermanate nanotubes on mechanical properties. Comput. Mater. Sci. 2017, 135, 54–63. [Google Scholar] [CrossRef]
- Piperno, S.; Kaplan-Ashiri, I.; Cohen, S.R.; Popovitz-Biro, R.; Wagner, H.D.; Tenne, R.; Foresti, E.; Lesci, I.G.; Roveri, N. Characterization of Geoinspired and Synthetic Chrysotile Nanotubes by Atomic Force Microscopy and Transmission Electron Microscopy. Adv. Funct. Mater. 2007, 17, 3332–3338. [Google Scholar] [CrossRef]
- Lecouvet, B.; Horion, J.; D’Haese, C.; Bailly, C.; Nysten, B. Elastic modulus of halloysite nanotubes. Nanotechnology 2013, 24, 105704. [Google Scholar] [CrossRef] [PubMed] [Green Version]
- González, R.I.; Rogan, J.; Bringa, E.M.; Valdivia, J.A. Mechanical Response of Aluminosilicate Nanotubes under Compression. J. Phys. Chem. C 2016, 120, 14428–14434. [Google Scholar] [CrossRef]
- Guimarães, L.; Enyashin, A.N.; Seifert, G.; Duarte, H.A. Structural, Electronic, and Mechanical Properties of Single-Walled Halloysite Nanotube Models. J. Phys. Chem. C 2010, 114, 11358–11363. [Google Scholar] [CrossRef]
- Lourenço, M.P.; de Oliveira, C.; Oliveira, A.F.; Guimarães, L.; Duarte, H.A. Structural, Electronic, and Mechanical Properties of Single-Walled Chrysotile Nanotube Models. J. Phys. Chem. C 2012, 116, 9405–9411. [Google Scholar] [CrossRef]
- Demichelis, R.; De La Pierre, M.; Mookherjee, M.; Zicovich-Wilson, C.M.; Orlando, R. Serpentine polymorphism: A quantitative insight from first-principles calculations. CrystEngComm 2016, 18, 4412–4419. [Google Scholar] [CrossRef] [Green Version]
- Ferrante, F.; Armata, N.; Lazzara, G. Modeling of the Halloysite Spiral Nanotube. J. Phys. Chem. C 2015, 119, 16700–16707. [Google Scholar] [CrossRef]
- Prishchenko, D.A.; Zenkov, E.V.; Mazurenko, V.V.; Fakhrullin, R.F.; Lvov, Y.M.; Mazurenko, V.G. Molecular dynamics of the halloysite nanotubes. Phys. Chem. Chem. Phys. 2018, 20, 5841–5849. [Google Scholar] [CrossRef]
- Alvarez-Ramírez, F.; Toledo-Antonio, J.A.; Angeles-Chavez, C.; Guerrero-Abreo, J.H.; López-Salinas, E. Complete Structural Characterization of Ni3Si2O5(OH)4 Nanotubes: Theoretical and Experimental Comparison. J. Phys. Chem. C 2011, 115, 11442–11446. [Google Scholar] [CrossRef]
- Fu, L.; Yang, H. Structure and Electronic Properties of Transition Metal Doped Kaolinite Nanoclay. Nanoscale Res. Lett. 2017, 12, 411. [Google Scholar] [CrossRef] [PubMed]
- Singh, B. Why Does Halloysite Roll?—A New Model. Clays Clay Miner. 1996, 44, 191–196. [Google Scholar] [CrossRef]
- Perbost, R.; Amouric, M.; Olives, J. Influence of Cation Size on the Curvature of Serpentine Minerals: HRTEM-AEM Study and Elastic Theory. Clays Clay Miner. 2003, 51, 430–438. [Google Scholar] [CrossRef]
- Thill, A.; Guiose, B.; Bacia-Verloop, M.; Geertsen, V.; Belloni, L. How the Diameter and Structure of (OH)3Al2O3SixGe1–xOH Imogolite Nanotubes Are Controlled by an Adhesion versus Curvature Competition. J. Phys. Chem. C 2012, 116, 26841–26849. [Google Scholar] [CrossRef]
- Thill, A.; Maillet, P.; Guiose, B.; Spalla, O.; Belloni, L.; Chaurand, P.; Auffan, M.; Olivi, L.; Rose, J. Physico-chemical Control over the Single- or Double-Wall Structure of Aluminogermanate Imogolite-like Nanotubes. J. Am. Chem. Soc. 2012, 134, 3780–3786. [Google Scholar] [CrossRef]
- Chivilikhin, S.A.; Popov, I.Y.; Blinova, I.V.; Kirillova, S.A.; Konovalov, A.S.; Oblogin, S.I.; Tishkin, V.O.; Chernov, I.A.; Gusarov, V.V. Simulation of the formation of nanorolls. Glass Phys. Chem. 2007, 33, 315–319. [Google Scholar] [CrossRef]
- Chivilikhin, S.A.; Popov, I.Y.; Svitenkov, A.I.; Chivilikhin, D.S.; Gusarov, V.V. Formation and evolution of nanoscroll ensembles based on layered-structure compounds. Dokl. Phys. 2009, 54, 491–493. [Google Scholar] [CrossRef]
- Maillet, P.; Levard, C.; Spalla, O.; Masion, A.; Rose, J.; Thill, A. Growth kinetic of single and double-walled aluminogermanate imogolite-like nanotubes: An experimental and modeling approach. Phys. Chem. Chem. Phys. 2011, 13, 2682–2689. [Google Scholar] [CrossRef]
- Yucelen, G.I.; Kang, D.-Y.; Schmidt-Krey, I.; Beckham, H.W.; Nair, S. A generalized kinetic model for the formation and growth of single-walled metal oxide nanotubes. Chem. Eng. Sci. 2013, 90, 200–212. [Google Scholar] [CrossRef]
- Krasilin, A.A.; Gusarov, V.V. Energy of formation of chrysotile nanotubes. Russ. J. Gen. Chem. 2014, 84, 2359–2363. [Google Scholar] [CrossRef]
- Prinz, V.Y. A new concept in fabricating building blocks for nanoelectronic and nanomechanic devices. Microelectron. Eng. 2003, 69, 466–475. [Google Scholar] [CrossRef]
- Mutilin, S.V.; Soots, R.A.; Vorob’ev, A.B.; Ikusov, D.G.; Mikhailov, N.N.; Prinz, V.Y. Microtubes and corrugations fabricated from strained ZnTe/CdHgTe/HgTe/CdHgTe heterofilms with 2D electron–hole gas in the HgTe quantum well. J. Phys. D Appl. Phys. 2014, 47, 295301. [Google Scholar] [CrossRef]
- Gulina, L.B.; Tolstoy, V.P.; Petrov, Y.V.; Danilov, D.V. Interface-Assisted Synthesis of Single-Crystalline ScF3 Microtubes. Inorg. Chem. 2018, 57, 9779–9781. [Google Scholar] [CrossRef] [PubMed]
- Chizmeshya, A.V.G.; McKelvy, M.J.; Sharma, R.; Carpenter, R.W.; Bearat, H. Density functional theory study of the decomposition of Mg(OH)2: A lamellar dehydroxylation model. Mater. Chem. Phys. 2003, 77, 416–425. [Google Scholar] [CrossRef]
- Krasilin, A.A.; Nevedomsky, V.N.; Gusarov, V.V. Comparative Energy Modeling of Multiwalled Mg3Si2O5(OH)4 and Ni3Si2O5(OH)4 Nanoscroll Growth. J. Phys. Chem. C 2017, 121, 12495–12502. [Google Scholar] [CrossRef]
- Krasilin, A.A. Energy modeling of competition between tubular and platy morphologies of chrysotile and halloysite layers. Clays Clay Miner. accepted. [CrossRef]
- Shchipalov, Y.K. Surface Energy of Crystalline and Vitreous Silica. Glass Ceram. 2000, 57, 374–377. [Google Scholar] [CrossRef]
- Churakov, S.V.; Iannuzzi, M.; Parrinello, M. Ab Initio Study of Dehydroxylation−Carbonation Reaction on Brucite Surface. J. Phys. Chem. B 2004, 108, 11567–11574. [Google Scholar] [CrossRef]
- Fleming, S.; Rohl, A.; Lee, M.-Y.; Gale, J.; Parkinson, G. Atomistic modelling of gibbsite: Surface structure and morphology. J. Cryst. Growth 2000, 209, 159–166. [Google Scholar] [CrossRef]
- Evarestov, R.A.; Bandura, A.V. HF and DFT calculations of MgO surface energy and electrostatic potential using two- and three-periodic models. Int. J. Quantum Chem. 2004, 100, 452–459. [Google Scholar] [CrossRef]
- Krasilin, A.A.; Gusarov, V.V. Energy model of bilayer nanoplate scrolling: Formation of chrysotile nanoscroll. Russ. J. Gen. Chem. 2015, 85, 2238–2241. [Google Scholar] [CrossRef]
- Krasilin, A.A.; Gusarov, V.V. Energy Model of Radial Growth of a Nanotubular Crystal. Tech. Phys. Lett. 2016, 42, 55–58. [Google Scholar] [CrossRef]
- Tolman, R.C. The Effect of Droplet Size on Surface Tension. J. Chem. Phys. 1949, 17, 333. [Google Scholar] [CrossRef] [Green Version]
- Vollath, D.; Fischer, F.D.; Holec, D. Surface energy of nanoparticles—Influence of particle size and structure. Beilstein J. Nanotechnol. 2018, 9, 2265–2276. [Google Scholar] [CrossRef]
- Wendler, K.; Thar, J.; Zahn, S.; Kirchner, B. Estimating the Hydrogen Bond Energy. J. Phys. Chem. A 2010, 114, 9529–9536. [Google Scholar] [CrossRef]
- Ramesh, T.N.; Kamath, P.V.; Shivakumara, C. Classification of stacking faults and their stepwise elimination during the disorder → order transformation of nickel hydroxide. Acta Crystallogr. Sect. B Struct. Sci. 2006, 62, 530–536. [Google Scholar] [CrossRef]
- Koza, J.A.; Hull, C.M.; Liu, Y.-C.; Switzer, J.A. Deposition of β-Co(OH)2 Films by Electrochemical Reduction of Tris(ethylenediamine)cobalt(III) in Alkaline Solution. Chem. Mater. 2013, 25, 1922–1926. [Google Scholar] [CrossRef]
- Wyckoff, R.W.G. Crystal Structures, 2nd ed.; Interscience Publishers: New York, NY, USA, 1963; Volume 1, p. 467. [Google Scholar]
- Smith, G.S.; Isaacs, P.B. The crystal structure of quartz-like GeO2. Acta Crystallogr. 1964, 17, 842–846. [Google Scholar] [CrossRef]
- Lacks, D.J.; Gordon, R.G. Crystal-structure calculations with distorted ions. Phys. Rev. B 1993, 48, 2889–2908. [Google Scholar] [CrossRef]
- Deliens, M.; Goethals, H. Polytypism of heterogenite. Mineral. Mag. 1973, 39, 152–157. [Google Scholar] [CrossRef]
- Urusov, V.S. The phenomenological theory of solid solutions. Solid Solut. Silic. Oxide Syst. 2001, 3, 121–153. [Google Scholar] [CrossRef]
- Shannon, R.D.; Prewitt, C.T. Effective ionic radii in oxides and fluorides. Acta Crystallogr. Sect. B Struct. Crystallogr. Cryst. Chem. 1969, 25, 925–946. [Google Scholar] [CrossRef]
- Maillet, P.; Levard, C.; Larquet, E.; Mariet, C.; Spalla, O.; Menguy, N.; Masion, A.; Doelsch, E.; Rose, J.; Thill, A. Evidence of double-walled Al-Ge imogolite-like nanotubes. A cryo-TEM and SAXS investigation. J. Am. Chem. Soc. 2010, 132, 1208–1209. [Google Scholar] [CrossRef] [PubMed] [Green Version]
- Krasilin, A.A.; Khrapova, E.K. Effect of hydrothermal treatment conditions on formation of nickel hydrogermanate with platy morphology. Russ. J. Appl. Chem. 2017, 90, 22–27. [Google Scholar] [CrossRef]
- White, R.D.; Bavykin, D.V.; Walsh, F.C. Spontaneous Scrolling of Kaolinite Nanosheets into Halloysite Nanotubes in an Aqueous Suspension in the Presence of GeO2. J. Phys. Chem. C 2012, 116, 8824–8833. [Google Scholar] [CrossRef]
- Landau, L.D.; Lifshitz, E.M. Statistical Physics, 3rd ed.; Elsevier Butterworth-Heinemann: Oxford, UK, 1980; Volume 5, p. 544. ISBN 9780080570464. [Google Scholar]
- Almjasheva, O.V.; Krasilin, A.A.; Gusarov, V.V. Formation mechanism of core-shell nanocrystals obtained via dehydration of coprecipitated hydroxides at hydrothermal conditions. Nanosyst. Phys. Chem. Math. 2018, 9, 568–572. [Google Scholar] [CrossRef]
- Bloise, A.; Barrese, E.; Apollaro, C. Hydrothermal alteration of Ti-doped forsterite to chrysotile and characterization of the resulting chrysotile fibers. Neues Jahrb. Mineral. Abh. 2009, 185, 297–304. [Google Scholar] [CrossRef]
- Maslennikova, T.P.; Gatina, E.N. Hydrothermal Synthesis of Ti-Doped Nickel Hydrosilicates of Various Morphologies. Russ. J. Appl. Chem. 2018, 91, 286–291. [Google Scholar] [CrossRef]
- Korytkova, E.N.; Pivovarova, L.N.; Semenova, O.E.; Drozdova, I.A.; Povinich, V.F.; Gusarov, V.V. Hydrothermal synthesis of nanotubular Mg-Fe hydrosilicate. Russ. J. Inorg. Chem. 2007, 52, 338–344. [Google Scholar] [CrossRef]
- Bloise, A.; Belluso, E.; Barrese, E.; Miriello, D.; Apollaro, C. Synthesis of Fe-doped chrysotile and characterization of the resulting chrysotile fibers. Cryst. Res. Technol. 2009, 44, 590–596. [Google Scholar] [CrossRef]
- Krasilin, A.A.; Suprun, A.M.; Gusarov, V.V. Influence of Component Ratio in the Compound (Mg,Fe)3Si2O5(OH)4 on the Formation of Nanotubular and Platelike Particles. Russ. J. Appl. Chem. 2013, 86, 1633–1637. [Google Scholar] [CrossRef]
- Krasilin, A.A.; Panchuk, V.V.; Semenov, V.G.; Gusarov, V.V. Formation of Variable-Composition Iron(III) Hydrosilicates with the Chrysotile Structure. Russ. J. Gen. Chem. 2016, 86, 2581–2588. [Google Scholar] [CrossRef]
- Borghi, E.; Occhiuzzi, M.; Foresti, E.; Lesci, I.G.; Roveri, N. Spectroscopic characterization of Fe-doped synthetic chrysotile by EPR, DRS and magnetic susceptibility measurements. Phys. Chem. Chem. Phys. 2010, 12, 227–238. [Google Scholar] [CrossRef] [PubMed]
- Shafia, E.; Esposito, S.; Manzoli, M.; Chiesa, M.; Tiberto, P.; Barrera, G.; Menard, G.; Allia, P.; Freyria, F.S.; Garrone, E.; et al. Al/Fe isomorphic substitution versus Fe2O3 clusters formation in Fe-doped aluminosilicate nanotubes (imogolite). J. Nanopart. Res. 2015, 17, 336. [Google Scholar] [CrossRef]
- Shafia, E.; Esposito, S.; Armandi, M.; Manzoli, M.; Garrone, E.; Bonelli, B. Isomorphic substitution of aluminium by iron into single-walled alumino-silicate nanotubes: A physico-chemical insight into the structural and adsorption properties of Fe-doped imogolite. Microporous Mesoporous Mater. 2016, 224, 229–238. [Google Scholar] [CrossRef]
- Korytkova, E.N.; Pivovarova, L.N.; Drosdova, I.A.; Gusarov, V.V. Hydrothermal synthesis of nanotubular Co-Mg hydrosilicates with the chrysotile structure. Russ. J. Gen. Chem. 2007, 77, 1669–1676. [Google Scholar] [CrossRef]
- Park, J.C.; Kang, S.W.; Kim, J.-C.; Kwon, J.I.; Jang, S.; Rhim, G.B.; Kim, M.; Chun, D.H.; Lee, H.-T.; Jung, H.; et al. Synthesis of Co/SiO2 hybrid nanocatalyst via twisted Co3Si2O5(OH)4 nanosheets for high-temperature Fischer–Tropsch reaction. Nano Res. 2017, 10, 1044–1055. [Google Scholar] [CrossRef]
- Korytkova, E.N.; Maslov, A.V.; Pivovarova, L.N.; Polegotchenkova, Y.V.; Povinich, V.F.; Gusarov, V.V. Synthesis of Nanotubular Mg3Si2O5(OH)4-Ni3Si2O5(OH)4 Silicates at Elevated Temperatures and Pressures. Inorg. Mater. 2005, 41, 743–749. [Google Scholar] [CrossRef]
- McDonald, A.; Scott, B.; Villemure, G. Hydrothermal preparation of nanotubular particles of a 1:1 nickel phyllosilicate. Microporous Mesoporous Mater. 2009, 120, 263–266. [Google Scholar] [CrossRef]
- White, R.D.; Bavykin, D.V.; Walsh, F.C. Morphological control of synthetic Ni3Si2O5(OH)4 nanotubes in an alkaline hydrothermal environment. J. Mater. Chem. A 2013, 1, 548–556. [Google Scholar] [CrossRef]
- Krasilin, A.A.; Semenova, A.S.; Kellerman, D.G.; Nevedomsky, V.N.; Gusarov, V.V. Magnetic properties of synthetic Ni3Si2O5(OH)4 nanotubes. EPL (Europhys. Lett.) 2016, 113, 47006. [Google Scholar] [CrossRef]
- Bloise, A.; Belluso, E.; Fornero, E.; Rinaudo, C.; Barrese, E.; Capella, S. Influence of synthesis conditions on growth of Ni-doped chrysotile. Microporous Mesoporous Mater. 2010, 132, 239–245. [Google Scholar] [CrossRef]
- Krasilin, A.A.; Suprun, A.M.; Nevedomsky, V.N.; Gusarov, V.V. Formation of Conical (Mg,Ni)3Si2O5(OH)4 Nanoscrolls. Dokl. Phys. Chem. 2015, 460, 42–44. [Google Scholar] [CrossRef]
- Krasilin, A.A.; Gusarov, V.V. Redistribution of Mg and Ni cations in crystal lattice of conical nanotube with chrysotile structure. Nanosyst. Phys. Chem. Math. 2017, 8, 620–627. [Google Scholar] [CrossRef] [Green Version]
- Krasilin, A.A.; Khrapova, E.K.; Nominé, A.; Ghanbaja, J.; Belmonte, T.; Gusarov, V.V. Cation Redistribution along the Spiral of Ni-Doped Phyllosilicate Nanoscrolls: Energy Modelling and STEM/EDS Study. ChemPhysChem 2019, 20, 719–726. [Google Scholar] [CrossRef]
- Krasilin, A.A.; Suprun, A.M.; Ubyivovk, E.V.; Gusarov, V.V. Morphology vs. chemical composition of single Ni-doped hydrosilicate nanoscroll. Mater. Lett. 2016, 171, 68–71. [Google Scholar] [CrossRef]
- Korytkova, E.N.; Brovkin, A.S.; Maslennikova, T.P.; Pivovarova, L.N.; Drozdova, I.A. Influence of the Physicochemical Parameters of Synthesis on the Growth of Nanotubes of the Mg3Si2O5(OH)4 Composition under Hydrothermal Conditions. Glass Phys. Chem. 2011, 37, 161–171. [Google Scholar] [CrossRef]
- Baronnet, A.; Mellini, M.; Devouard, B. Sectors in polygonal serpentine. A model based on dislocations. Phys. Chem. Miner. 1994, 21, 330–343. [Google Scholar] [CrossRef]
- Cressey, G.; Cressey, B.A.; Wicks, F.J.; Yada, K. A disc with fivefold symmetry: The proposed fundamental seed structure for the formation of chrysotile asbestos fibres, polygonal serpentine fibres and polyhedral lizardite spheres. Mineral. Mag. 2010, 74, 29–37. [Google Scholar] [CrossRef]
- Devouard, B.; Baronnet, A.; Van Tendeloo, G.; Amelinckx, S. First evidence of synthetic polygonal serpentines. Eur. J. Mineral. 1997, 9, 539–546. [Google Scholar] [CrossRef]
- Krasilin, A.A.; Gusarov, V.V. Control over morphology of magnesium-aluminum hydrosilicate nanoscrolls. Russ. J. Appl. Chem. 2015, 88, 1928–1935. [Google Scholar] [CrossRef]
- Amara, M.-S.; Paineau, E.; Bacia-Verloop, M.; Krapf, M.-E.M.; Davidson, P.; Belloni, L.; Levard, C.; Rose, J.; Launois, P.; Thill, A. Single-step formation of micron long (OH)3Al2O3Ge(OH) imogolite-like nanotubes. Chem. Commun. 2013, 49, 11284–11286. [Google Scholar] [CrossRef] [PubMed]
- Paineau, E. Imogolite Nanotubes: A Flexible Nanoplatform with Multipurpose Applications. Appl. Sci. 2018, 8, 1921. [Google Scholar] [CrossRef] [Green Version]
- Zhang, A.B.; Pan, L.; Zhang, H.Y.; Liu, S.T.; Ye, Y.; Xia, M.S.; Chen, X.G. Effects of acid treatment on the physico-chemical and pore characteristics of halloysite. Colloids Surf. A Physicochem. Eng. Asp. 2012, 396, 182–188. [Google Scholar] [CrossRef]
- Shu, Z.; Chen, Y.; Zhou, J.; Li, T.; Yu, D.; Wang, Y. Nanoporous-walled silica and alumina nanotubes derived from halloysite: Controllable preparation and their dye adsorption applications. Appl. Clay Sci. 2015, 112–113, 17–24. [Google Scholar] [CrossRef]
- Deng, L.; Yuan, P.; Liu, D.; Du, P.; Zhou, J.; Wei, Y.; Song, Y.; Liu, Y. Effects of calcination and acid treatment on improving benzene adsorption performance of halloysite. Appl. Clay Sci. 2019, 181, 105240. [Google Scholar] [CrossRef]
- Yucelen, G.I.; Kang, D.-Y.; Guerrero-Ferreira, R.C.; Wright, E.R.; Beckham, H.W.; Nair, S. Shaping single-walled metal oxide nanotubes from precursors of controlled curvature. Nano Lett. 2012, 12, 827–832. [Google Scholar] [CrossRef]
- Maslennikova, T.P.; Korytkova, E.N. Influence of Synthesis of Physicochemical Parameters on Growth of Ni3Si2O5(OH)4 Nanotubes and Their Filling with Solutions of Hydroxides and Chlorides of Alkaline Metals. Glass Phys. Chem. 2013, 39, 67–72. [Google Scholar] [CrossRef]
- Ackerman, W.C.; Smith, D.M.; Huling, J.C.; Kim, Y.W.; Bailey, J.K.; Brinker, C.J. Gas/vapor adsorption in imogolite: A microporous tubular aluminosilicate. Langmuir 1993, 9, 1051–1057. [Google Scholar] [CrossRef]
- Ohashi, F.; Tomura, S.; Akaku, K.; Hayashi, S.; Wada, S.-I. Characterization of synthetic imogolite nanotubes as gas storage. J. Mater. Sci. 2004, 39, 1799–1801. [Google Scholar] [CrossRef]
- Bottero, I.; Bonelli, B.; Ashbrook, S.E.; Wright, P.A.; Zhou, W.; Tagliabue, M.; Armandi, M.; Garrone, E. Synthesis and characterization of hybrid organic/inorganic nanotubes of the imogolite type and their behaviour towards methane adsorption. Phys. Chem. Chem. Phys. 2011, 13, 744–750. [Google Scholar] [CrossRef] [PubMed]
- Vitillo, J.G. Magnesium-based systems for carbon dioxide capture, storage and recycling: From leaves to synthetic nanostructured materials. RSC Adv. 2015, 5, 36192–36239. [Google Scholar] [CrossRef]
- Krasilin, A.A.; Danilovich, D.P.; Yudina, E.B.; Bruyere, S.; Ghanbaja, J.; Ivanov, V.K. Crystal violet adsorption by oppositely twisted heat-treated halloysite and pecoraite nanoscrolls. Appl. Clay Sci. 2019, 173, 1–11. [Google Scholar] [CrossRef]
- Cavallaro, G.; Lazzara, G.; Milioto, S.; Parisi, F. Hydrophobically Modified Halloysite Nanotubes as Reverse Micelles for Water-in-Oil Emulsion. Langmuir 2015, 31, 7472–7478. [Google Scholar] [CrossRef]
- Valentim, I.B.; Joekes, I. Adsorption of sodium dodecylsulfate on chrysotile. Colloids Surf. A Physicochem. Eng. Asp. 2006, 290, 106–111. [Google Scholar] [CrossRef]
- Bonini, M.; Gabbani, A.; Del Buffa, S.; Ridi, F.; Baglioni, P.; Bordes, R.; Holmberg, K. Adsorption of Amino Acids and Glutamic Acid-Based Surfactants on Imogolite Clays. Langmuir 2017, 33, 2411–2419. [Google Scholar] [CrossRef]
- Lo Dico, G.; Semilia, F.; Milioto, S.; Parisi, F.; Cavallaro, G.; Inguì, G.; Makaremi, M.; Pasbakhsh, P.; Lazzara, G. Microemulsion Encapsulated into Halloysite Nanotubes and their Applications for Cleaning of a Marble Surface. Appl. Sci. 2018, 8, 1455. [Google Scholar] [CrossRef] [Green Version]
- Yu, S.; Zhai, L.; Wang, Y.; Liu, X.; Xu, L.; Cheng, L. Synthesis of magnetic chrysotile nanotubes for adsorption of Pb(II), Cd(II) and Cr(III) ions from aqueous solution. J. Environ. Chem. Eng. 2015, 3, 752–762. [Google Scholar] [CrossRef]
- Cheng, L.; Yu, S.; Zha, C.; Yao, Y.; Pan, X. Removal of simulated radionuclide Ce(III) from aqueous solution by as-synthesized chrysotile nanotubes. Chem. Eng. J. 2012, 213, 22–30. [Google Scholar] [CrossRef]
- Chiew, C.S.C.; Yeoh, H.K.; Pasbakhsh, P.; Poh, P.E.; Tey, B.T.; Chan, E.S. Stability and reusability of alginate-based adsorbents for repetitive lead (II) removal. Polym. Degrad. Stab. 2016, 123, 146–154. [Google Scholar] [CrossRef]
- Liou, K.-H.; Kang, D.-Y.; Lin, L.-C. Investigating the Potential of Single-Walled Aluminosilicate Nanotubes in Water Desalination. ChemPhysChem 2017, 18, 179–183. [Google Scholar] [CrossRef] [PubMed]
- Cheng, L.L.; Wei, X.D.; Hao, X.L.; Ruan, D.; Yu, S.M. The removal of strontium(II) and neodymium(III) from their aqueous solutions on chrysotile nanotubes. Adv. Mater. Res. 2014, 881–883, 519–524. [Google Scholar] [CrossRef]
- Maslennikova, T.P.; Korytkova, E.N. Aqueous Solutions of Cesium Salts and Cesium Hydroxide in Hydrosilicate Nanotubes of the Mg3Si2O5(OH)4 Composition. Glass Phys. Chem. 2010, 36, 345–350. [Google Scholar] [CrossRef]
- Maslennikova, T.P.; Korytkova, E.N. Regularities of the Filling of Mg3Si2O5(OH)4 Hydrosilicate Nanotubes with Solutions of Sodium Hydroxide and Sodium Chloride. Glass Phys. Chem. 2011, 37, 418–425. [Google Scholar] [CrossRef]
- Saki, H.; Alemayehu, E.; Schomburg, J.; Lennartz, B. Halloysite nanotubes as adsorptive material for phosphate removal from aqueous solution. Water 2019, 11, 203. [Google Scholar] [CrossRef] [Green Version]
- Shu, Z.; Chen, Y.; Zhou, J.; Li, T.; Sheng, Z.; Tao, C.; Wang, Y. Preparation of halloysite-derived mesoporous silica nanotube with enlarged specific surface area for enhanced dye adsorption. Appl. Clay Sci. 2016, 132–133, 114–121. [Google Scholar] [CrossRef]
- Peng, Q.; Liu, M.; Zheng, J.; Zhou, C. Adsorption of dyes in aqueous solutions by chitosan–halloysite nanotubes composite hydrogel beads. Microporous Mesoporous Mater. 2015, 201, 190–201. [Google Scholar] [CrossRef]
- Cavallaro, G.; Milioto, S.; Lazzara, G. Halloysite Nanotubes: Interfacial Properties and Applications in Cultural Heritage. Langmuir 2020, 36, 3677–3689. [Google Scholar] [CrossRef]
- Cavallaro, G.; Milioto, S.; Konnova, S.A.; Fakhrullina, G.; Akhatova, F.; Lazzara, G.; Fakhrullin, R.F.; Lvov, Y. Halloysite/keratin nanocomposite for human hair photoprotection coating. ACS Appl. Mater. Interfaces 2020, 12, 24348–24362. [Google Scholar] [CrossRef]
- Falcón, J.M.; Sawczen, T.; Aoki, I.V. Dodecylamine-Loaded Halloysite Nanocontainers for Active Anticorrosion Coatings. Front. Mater. 2015, 2, 69. [Google Scholar] [CrossRef] [Green Version]
- Zahidah, K.A.; Kakooei, S.; Ismail, M.C.; Raja, P.B. Halloysite nanotubes as nanocontainer for smart coating application: A review. Prog. Org. Coat. 2017, 111, 175–185. [Google Scholar] [CrossRef]
- Mahmoudi, R.; Kardar, P.; Arabi, A.M.; Amini, R.; Pasbakhsh, P. The active corrosion performance of silane coating treated by praseodymium encapsulated with halloysite nanotubes. Prog. Org. Coat. 2020, 138, 105404. [Google Scholar] [CrossRef]
- Jin, X.; Zhang, R.; Su, M.; Li, H.; Yue, X.; Qin, D.; Jiang, Z. Functionalization of halloysite nanotubes by enlargement and layer-by-layer assembly for controlled release of the fungicide iodopropynyl butylcarbamate. RSC Adv. 2019, 9, 42062–42070. [Google Scholar] [CrossRef] [Green Version]
- Patel, S.; Jammalamadaka, U.; Sun, L.; Tappa, K.; Mills, D. Sustained Release of Antibacterial Agents from Doped Halloysite Nanotubes. Bioengineering 2015, 3, 1. [Google Scholar] [CrossRef] [PubMed] [Green Version]
- Stavitskaya, A.; Batasheva, S.; Vinokurov, V.; Fakhrullina, G.; Sangarov, V.; Lvov, Y.; Fakhrullin, R. Antimicrobial Applications of Clay Nanotube-Based Composites. Nanomaterials 2019, 9, 708. [Google Scholar] [CrossRef] [Green Version]
- Santos, A.C.; Ferreira, C.; Veiga, F.; Ribeiro, A.J.; Panchal, A.; Lvov, Y.; Agarwal, A. Halloysite clay nanotubes for life sciences applications: From drug encapsulation to bioscaffold. Adv. Colloid Interface Sci. 2018, 257, 58–70. [Google Scholar] [CrossRef]
- Liu, M.; Chang, Y.; Yang, J.; You, Y.; He, R.; Chen, T.; Zhou, C. Functionalized halloysite nanotube by chitosan grafting for drug delivery of curcumin to achieve enhanced anticancer efficacy. J. Mater. Chem. B 2016, 4, 2253–2263. [Google Scholar] [CrossRef]
- Bediako, E.G.; Nyankson, E.; Dodoo-Arhin, D.; Agyei-Tuffour, B.; Łukowiec, D.; Tomiczek, B.; Yaya, A.; Efavi, J.K. Modified halloysite nanoclay as a vehicle for sustained drug delivery. Heliyon 2018, 4, e00389. [Google Scholar] [CrossRef] [Green Version]
- Fizir, M.; Dramou, P.; Dahiru, N.S.; Ruya, W.; Huang, T.; He, H. Halloysite nanotubes in analytical sciences and in drug delivery: A review. Microchim. Acta 2018, 185, 389. [Google Scholar] [CrossRef]
- Lvov, Y.M.; DeVilliers, M.M.; Fakhrullin, R.F. The application of halloysite tubule nanoclay in drug delivery. Expert Opin. Drug Deliv. 2016, 13, 977–986. [Google Scholar] [CrossRef]
- Stan, G.; Ciobanu, C.V.; Parthangal, P.M.; Cook, R.F. Diameter-Dependent Radial and Tangential Elastic Moduli of ZnO Nanowires. Nano Lett. 2007, 7, 3691–3697. [Google Scholar] [CrossRef]
- Lawrence, J.G.; Berkan, L.M.; Nadarajah, A. Elastic properties and morphology of individual carbon nanofibers. ACS Nano 2008, 2, 1230–1236. [Google Scholar] [CrossRef] [PubMed]
- Krasilin, A.A.; Suprun, A.M.; Ubyivovk, E.V.; Nevedomsky, V.N.; Scherbin, B.O.; Petrov, A.A. Interconnection between composition, morphology and mechanics of chrysotile nanoscroll. In Proceedings of the Multinational Congress on Microscopy MCM 2015, Eger, Hungary, 23–28 August 2015; pp. 459–460. [Google Scholar]
- Ankudinov, A.V. On the accuracy of the probe-sample contact stiffness measured by an atomic force microscope. Nanosyst. Phys. Chem. Math. 2019, 10, 642–653. [Google Scholar] [CrossRef] [Green Version]
- Yah, W.O.; Yamamoto, K.; Jiravanichanun, N.; Otsuka, H.; Takahara, A. Imogolite Reinforced Nanocomposites: Multifaceted Green Materials. Materials 2010, 3, 1709–1745. [Google Scholar] [CrossRef] [Green Version]
- Gaaz, T.; Sulong, A.; Kadhum, A.; Al-Amiery, A.; Nassir, M.; Jaaz, A. The Impact of Halloysite on the Thermo-Mechanical Properties of Polymer Composites. Molecules 2017, 22, 838. [Google Scholar] [CrossRef] [Green Version]
- Jiang, Y.; Wang, P.; Zheng, J. Use of ionic monomers to prepare halloysite polymer nanocomposites with reinforced mechanical performance. Appl. Clay Sci. 2017, 141, 248–256. [Google Scholar] [CrossRef]
- Dobrovol’skaya, I.P.; Popryadukhin, P.V.; Khomenko, A.Y.; Dresvyanina, E.N.; Yudin, V.E.; Elokhovskii, V.Y.; Chvalun, S.N.; Saprykina, N.N.; Maslennikova, T.P.; Korytkova, E.N. Structure and characteristics of chitosan-based fibers containing chrysotile and halloysite. Polym. Sci. Ser. A 2011, 53, 418–423. [Google Scholar] [CrossRef]
- Wu, Y.; Yudin, V.E.; Otaigbe, J.U.; Korytkova, E.N.; Nazarenko, S. Gas barrier behavior of polyimide films filled with synthetic chrysotile nanotubes. J. Polym. Sci. Part B Polym. Phys. 2013, 51, 1184–1193. [Google Scholar] [CrossRef]
- Rall, J.D.; Seehra, M.S. The nature of the magnetism in quasi-2D layered α-Ni(OH)2. J. Phys. Condens. Matter 2012, 24, 076002. [Google Scholar] [CrossRef]
- Miyamoto, H. The Magnetic Properties of Fe(OH)2. Mater. Res. Bull. 1976, 11, 329–335. [Google Scholar] [CrossRef]
- Yang, Y.; Liang, Q.; Li, J.; Zhuang, Y.; He, Y.; Bai, B.; Wang, X. Ni3Si2O5(OH)4 Multi-Walled Nanotubes with Tunable Magnetic Properties and Their Application as Anode Materials for Lithium Batteries. Nano Res. 2011, 4, 882–890. [Google Scholar] [CrossRef]
- Nitta, Y.; Kawabe, M.; Sun, L.; Ohmachi, Y.; Imanaka, T. Preparation of uniformly dispersed nickel/silica catalysts from synthetic nickel-chrysotile. Appl. Catal. 1989, 53, 15–28. [Google Scholar] [CrossRef]
- Nitta, Y.; Ueno, K.; Imanaka, T. Selective Hydrogenation of α,β-Unsaturated Aldehydes on Cobalt-Silica Catalysts Obtained from Cobalt Chrysotile. Appl. Catal. 1989, 56, 9–22. [Google Scholar] [CrossRef]
- Sarvaramini, A.; Larachi, F. Catalytic oxygenless steam cracking of syngas-containing benzene model tar compound over natural Fe-bearing silicate minerals. Fuel 2012, 97, 741–750. [Google Scholar] [CrossRef]
- Bian, Z.; Li, Z.; Ashok, J.; Kawi, S. A highly active and stable Ni–Mg phyllosilicate nanotubular catalyst for ultrahigh temperature water-gas shift reaction. Chem. Commun. 2015, 51, 16324–16326. [Google Scholar] [CrossRef] [PubMed]
- Kunkel, T.S.; Krasilin, A.A.; Khrapova, E.K.; Straumal, E.A.; Nomine, A.; Ghanbaja, J.; Ankudinov, A. V Charge injection into the Ni-phyllosilicate nanoscrolls with reduced Ni nanoparticles using Kelvin force probe microscopy. In Proceedings of the IOP Conference Series: Materials Science and Engineering, Ekaterinburg, Russian, 25–28 August 2019; Volume 699, p. 012023. [Google Scholar] [CrossRef]
- Zhang, C.; Zhu, W.; Li, S.; Wu, G.; Ma, X.; Wang, X.; Gong, J. Sintering-resistant Ni-based reforming catalysts obtained via the nanoconfinement effect. Chem. Commun. 2013, 49, 9383. [Google Scholar] [CrossRef]
- Bian, Z.; Kawi, S. Preparation, characterization and catalytic application of phyllosilicate: A review. Catal. Today 2020, 339, 3–23. [Google Scholar] [CrossRef]
- Ashok, J.; Ang, M.L.; Terence, P.Z.L.; Kawi, S. Promotion of the Water-Gas-Shift Reaction by Nickel Hydroxyl Species in Partially Reduced Nickel-Containing Phyllosilicate Catalysts. ChemCatChem 2016, 8, 1308–1318. [Google Scholar] [CrossRef]
- Sivaiah, M.V.; Petit, S.; Beaufort, M.F.; Eyidi, D.; Barrault, J.; Batiot-Dupeyrat, C.; Valange, S. Nickel based catalysts derived from hydrothermally synthesized 1:1 and 2:1 phyllosilicates as precursors for carbon dioxide reforming of methane. Microporous Mesoporous Mater. 2011, 140, 69–80. [Google Scholar] [CrossRef]
- Zhang, C.; Yue, H.; Huang, Z.; Li, S.; Wu, G.; Ma, X.; Gong, J. Hydrogen Production via Steam Reforming of Ethanol on Phyllosilicate-Derived Ni/SiO2: Enhanced Metal–Support Interaction and Catalytic Stability. ACS Sustain. Chem. Eng. 2013, 1, 161–173. [Google Scholar] [CrossRef]
- Bian, Z.; Suryawinata, I.Y.; Kawi, S. Highly carbon resistant multicore-shell catalyst derived from Ni-Mg phyllosilicate nanotubes@silica for dry reforming of methane. Appl. Catal. B Environ. 2016, 195, 1–8. [Google Scholar] [CrossRef]
- Philip, A.; Lihavainen, J.; Keinänen, M.; Pakkanen, T.T. Gold nanoparticle-decorated halloysite nanotubes—Selective catalysts for benzyl alcohol oxidation. Appl. Clay Sci. 2017, 143, 80–88. [Google Scholar] [CrossRef]
- Vinokurov, V.; Stavitskaya, A.; Glotov, A.; Ostudin, A.; Sosna, M.; Gushchin, P.; Darrat, Y.; Lvov, Y. Halloysite nanotube-based cobalt mesocatalysts for hydrogen production from sodium borohydride. J. Solid State Chem. 2018, 268, 182–189. [Google Scholar] [CrossRef]
- Stavitskaya, A.; Mazurova, K.; Kotelev, M.; Eliseev, O.; Gushchin, P.; Glotov, A.; Kazantsev, R.; Vinokurov, V.; Lvov, Y. Ruthenium-Loaded Halloysite Nanotubes as Mesocatalysts for Fischer–Tropsch Synthesis. Molecules 2020, 25, 1764. [Google Scholar] [CrossRef] [Green Version]
- Sadjadi, S.; Lazzara, G.; Heravi, M.M.; Cavallaro, G. Pd supported on magnetic carbon coated halloysite as hydrogenation catalyst: Study of the contribution of carbon layer and magnetization to the catalytic activity. Appl. Clay Sci. 2019, 182, 105299. [Google Scholar] [CrossRef] [Green Version]
- Zhao, Z.; Ren, P.; Li, W. Supported Ni catalyst on a natural halloysite derived silica–alumina composite oxide with unexpected coke-resistant stability for steam-CO2 dual reforming of methane. RSC Adv. 2016, 6, 49487–49496. [Google Scholar] [CrossRef]
- Zhang, X.; Wang, P.; Wu, X.; Lv, S.; Dai, J. Application of MnOx/HNTs catalysts in low-temperature NO reduction with NH3. Catal. Commun. 2016, 83, 18–21. [Google Scholar] [CrossRef]
- Szczepanik, B. Photocatalytic degradation of organic contaminants over clay-TiO2 nanocomposites: A review. Appl. Clay Sci. 2017, 141, 227–239. [Google Scholar] [CrossRef]
- Abbasov, V.M.; Ibrahimov, H.C.; Mukhtarova, G.S.; Abdullayev, E. Acid treated halloysite clay nanotubes as catalyst supports for fuel production by catalytic hydrocracking of heavy crude oil. Fuel 2016, 184, 555–558. [Google Scholar] [CrossRef]
- Cheng, Z.-L.; Sun, W. Preparation and Solar Light Photocatalytic Activity of N-Doped TiO2-Loaded Halloysite Nanotubes Nanocomposites. J. Mater. Eng. Perform. 2015, 24, 4090–4095. [Google Scholar] [CrossRef]
- Vinokurov, V.A.; Stavitskaya, A.V.; Ivanov, E.V.; Gushchin, P.A.; Kozlov, D.V.; Kurenkova, A.Y.; Kolinko, P.A.; Kozlova, E.A.; Lvov, Y.M. Halloysite Nanoclay Based CdS Formulations with High Catalytic Activity in Hydrogen Evolution Reaction under Visible Light Irradiation. ACS Sustain. Chem. Eng. 2017, 5, 11316–11323. [Google Scholar] [CrossRef]
- Sarvaramini, A.; Larachi, F. Mössbauer Spectroscopy and Catalytic Reaction Studies of Chrysotile-Catalyzed Steam Reforming of Benzene. J. Phys. Chem. C 2011, 115, 6841–6848. [Google Scholar] [CrossRef]
- Teixeira, A.P.C.; Santos, E.M.; Vieira, A.F.P.; Lago, R.M. Use of chrysotile to produce highly dispersed K-doped MgO catalyst for biodiesel synthesis. Chem. Eng. J. 2013, 232, 104–110. [Google Scholar] [CrossRef]
- Narasimharao, K.; Ali, T.T.; Bawaked, S.; Basahel, S. Effect of Si precursor on structural and catalytic properties of nanosize magnesium silicates. Appl. Catal. A Gen. 2014, 488, 208–218. [Google Scholar] [CrossRef]
- López-Salinas, E.; Toledo-Antonio, J.A.; Manríquez, M.E.; Sánchez-Cantú, M.; Cruz Ramos, I.; Hernández-Cortez, J.G. Synthesis and catalytic activity of chrysotile-type magnesium silicate nanotubes using various silicate sources. Microporous Mesoporous Mater. 2019, 274, 176–182. [Google Scholar] [CrossRef]
- Bonelli, B.; Bottero, I.; Ballarini, N.; Passeri, S.; Cavani, F.; Garrone, E. IR spectroscopic and catalytic characterization of the acidity of imogolite-based systems. J. Catal. 2009, 264, 15–30. [Google Scholar] [CrossRef]
- Ookawa, M. Synthesis and Characterization of Fe-Imogolite as an Oxidation Catalyst. In Clay Minerals in Nature—Their Characterization, Modification and Application; Valaskova, M., Martynková, G.S., Eds.; InTech: London, UK, 2012; pp. 239–258. ISBN 978-953-51-0738-5. [Google Scholar]
- Krasilin, A.A.; Straumal, E.A.; Yurkova, L.L.; Khrapova, E.K.; Tomkovich, M.V.; Shunina, I.G.; Vasil’eva, L.P.; Lermontov, S.A.; Ivanov, V.K. Sulfated Halloysite Nanoscrolls as Superacid Catalysts for Oligomerization of Hexene-1. Russ. J. Appl. Chem. 2019, 92, 1251–1257. [Google Scholar] [CrossRef]
Figure 1.
The schematic crystalline structure of chrysotile. From [28]. Copyright ©2011 Elsevier Ltd., Amsterdam, The Netherlands.
Figure 1.
The schematic crystalline structure of chrysotile. From [28]. Copyright ©2011 Elsevier Ltd., Amsterdam, The Netherlands.

Figure 2.
Schematic diagram of (a) the crystalline structure of 10 Å-halloysite, (b) the structure of a halloysite particle, and (c,d) the transmission electron microscope and atomic force microscope (AFM) images of halloysite. From [18]. Copyright ©2015 Elsevier Ltd., Amsterdam, The Netherlands.
Figure 2.
Schematic diagram of (a) the crystalline structure of 10 Å-halloysite, (b) the structure of a halloysite particle, and (c,d) the transmission electron microscope and atomic force microscope (AFM) images of halloysite. From [18]. Copyright ©2015 Elsevier Ltd., Amsterdam, The Netherlands.

Figure 3.
Structural illustration of imogolite, synthesised in [29]. Reproduced with permission from the Centre National de la Recherche Scientifique (CNRS), Paris, France, and The Royal Society of Chemistry, Cambridge, United Kingdom.
Figure 3.
Structural illustration of imogolite, synthesised in [29]. Reproduced with permission from the Centre National de la Recherche Scientifique (CNRS), Paris, France, and The Royal Society of Chemistry, Cambridge, United Kingdom.

Figure 4.
(a) Crystal structure of Al(OH)3 gibbsite according to the data of Saalfeld and Wedde [35]. An averaged size of the cavity is shown. (b) Crystal structure of the SiO2 cristobalite according to the data in [36]. An averaged size of the tetrahedra’s side is shown. (c) Crystal structure and specific size of Mg(OH)2 brucite reported in [37]. (d) An ‘ideal’ silica sheet adopted from the structural data in [38]. Specific size was calculated on the basis of the (b) value. VESTA software was used for visualisation [39].

Figure 5.
Band gap evolution for (a) Γ, (b) K1, (c) K2, and (d) K3 points used in the calculation as a function of the radial dimension of the imogolite tubes. At the Γ(0,0,0) point, the band gaps have their minimum value, increasing with the content of silicon. The same behaviour with silicon content is observed at the other k points. From [34]. Copyright ©2007 American Physical Society, College Park, Maryland, United States.

Figure 6.
(a) Calculated strain energies as a function of the outer diameter for zigzag (red circles) and armchair imogolite (blue squares). (b) Structural relaxation of a hydrogen terminated curved gibbsite-like imogolite patch. From [43]. Copyright ©2011 American Chemical Society, Washington, United States.

Figure 7.
Strain energy per atom as a function of the tube radius of the (9,0)–(19,0) zigzag nanotubes aluminoarsenate (closed triangle), aluminophosphate (closed square), aluminophosphite (open square), aluminoarsenate (open triangle) and aluminosilicate imogolite (closed circle). From [45] with permission from the PCCP Owner Societies.

Figure 8.
Families of imogolite’s cross-sections’ conformations and their energies, obtained using planar initial conditions; (a) at 150 K; (b) at 300 K. is a number of circular sectors, or unit cells. The red dashed line indicates the lowest energies for the various structures. From [46]. Copyright ©2014 American Chemical Society, Washington, United States.

Figure 9.
Energy vs. curvature of an imogolite sheet. The imogolite structure inset corresponds to angular repetitions. The dashed vertical lines, and the numbers that label them, correspond to the curvature radius of a completely closed nanotube with that value. Green Al; red O; yellow Si and light grey H. From [47] with permission from The Royal Society of Chemistry, Cambridge, United Kingdom.

Figure 10.
Average curvature and average stretching energy for planar initial conditions of increasing size from 5 to 100 Å. From [22]. Copyright ©2017 Elsevier B.V., Amsterdam, The Netherlands.
Figure 10.
Average curvature and average stretching energy for planar initial conditions of increasing size from 5 to 100 Å. From [22]. Copyright ©2017 Elsevier B.V., Amsterdam, The Netherlands.

Figure 11.
The Young’s modulus of imogolite nanotubes of 11–16 unit cells, and single-walled (14,14) carbon nanotube as a function of nanotube length deduced from the simulated bending tests. From [50] with permission from The Royal Society of Chemistry, Cambridge, United Kingdom.
Figure 11.
The Young’s modulus of imogolite nanotubes of 11–16 unit cells, and single-walled (14,14) carbon nanotube as a function of nanotube length deduced from the simulated bending tests. From [50] with permission from The Royal Society of Chemistry, Cambridge, United Kingdom.

Figure 12.
(a) Strain energy as a function of the tube radius of (n,0) (closed circles) and (n,n) (open circles) single-walled halloysite nanotubes. Results are shown for the (7,0)–(20,0) and (6,6)–(15,15) nanotubes, from [56]. Copyright ©2010 American Chemical Society, Washington, United States. (b) Strain energy per atom as a function of the tube radius of the (17,0)−(45,0) zigzag (open circles) and the (9,9)−(29,29) armchair chrysotile nanotubes (closed circles), from [57]. Copyright ©2012 American Chemical Society, Washington, United States.

Figure 13.
Energy difference per formula unit of (n; −n) single-walled chrysotile nanotubes with respect to the flat lizardite slab (kJ/mol), as a function of (a) the nanotube radius (Å) and index n, and (b) inverse nanotube radius (Å−1) and index n. The superimposed curve was obtained using a quadratic best-fit over a set of 16 points around the energy minimum. From [58] with permission from The Royal Society of Chemistry, Cambridge, United Kingdom.

Figure 14.
Energies of the (OH)3Al2O3SixGe1–x(OH) shapes for x = 0, 0.25, 0.5, 0.75 and 1. The lowest-energy shape changes from double walled up to x = 0.25 to single walled. The energies are given considering Σ = 0. From [65]. Copyright ©2012 American Chemical Society, Washington, United States.
Figure 14.
Energies of the (OH)3Al2O3SixGe1–x(OH) shapes for x = 0, 0.25, 0.5, 0.75 and 1. The lowest-energy shape changes from double walled up to x = 0.25 to single walled. The energies are given considering Σ = 0. From [65]. Copyright ©2012 American Chemical Society, Washington, United States.

Figure 15.
Minimum-energy diagram of multi-walled nanotubes and nanoscrolls as a function of dimensionless parameters. The positions of Si-imogolite, Ge-imogolite, titanate nanotubes and VOx nanotubes are shown as examples, from [65]. Copyright ©2012 American Chemical Society, Washington, United States.

Figure 16.
(a) Dependences of the inner () and outer ( ) radii of the nanoscroll on twisting time (1) without regard for the mutual slip of the coils, and with the inclusion of the mutual slip of the coils equal to (2) 0 and (3) 0.5, from [67]. Copyright ©2007 Pleiades Publishing, Ltd. (b) Evolution of the density distribution of the nanotube radius for the dimensionless time values , from [68]. Copyright ©2009 Pleiades Publishing Ltd., New York, United States.

Figure 17.
Final single-walled length distribution considering a dissolution mechanism for four different sets of kinetic parameters. Dotted lines are used for calculations using the tip–tip collisions hypothesis and straight lines are used for the dissolution hypothesis. From [69] with permission from the PCCP Owner Societies.

Figure 18.
Comparison between the experimental (symbols) and model predictions (curves) of the mean length of (a) the aluminosilicate nanotubes, and (b) the aluminogermanate nanotubes, as a function of the synthesis time and the initial precursor concentration, from [70]. Copyright ©2012 Elsevier Ltd., Amsterdam, The Netherlands.

Figure 19.
Dependence of the radius of the mechanically unstressed layer on the relative sheet size difference ( nm). The square symbol indicates that the octahedral sheet is the outer one. The triangle symbol indicates that the tetrahedral sheet is the outer one.
Figure 19.
Dependence of the radius of the mechanically unstressed layer on the relative sheet size difference ( nm). The square symbol indicates that the octahedral sheet is the outer one. The triangle symbol indicates that the tetrahedral sheet is the outer one.

Figure 20.
(a) Dependence of the nanotube radius at the total energy minimum on the Young’s modulus at (1) 0.6, (2) 0.3, (3) 0, (4) −0.3 and (5) −0.6 J/m2. (b) Bilayer bending model. Both images are from [71]. Copyright ©2014 Pleiades Publishing, Ltd., New York, United States.
Figure 20.
(a) Dependence of the nanotube radius at the total energy minimum on the Young’s modulus at (1) 0.6, (2) 0.3, (3) 0, (4) −0.3 and (5) −0.6 J/m2. (b) Bilayer bending model. Both images are from [71]. Copyright ©2014 Pleiades Publishing, Ltd., New York, United States.

Figure 21.
Change in the energy effect of scrolling as a function of the number of layers of the nanoscroll, from [82]. Copyright ©2015 Pleiades Publishing, Ltd., New York, United States.
Figure 21.
Change in the energy effect of scrolling as a function of the number of layers of the nanoscroll, from [82]. Copyright ©2015 Pleiades Publishing, Ltd., New York, United States.

Figure 22.
(A) Influence of Young’s modulus, curvature radius, specific surface energy difference and the specific adhesion energy on the relationship between the optimum internal and external diameters of a scroll during its radial growth. (B) The energy effect of the radial growth of nanoscrolls with various values of Young’s modulus, curvature radius, specific surface energy difference and specific adhesion energy. Both images are from [83]. Copyright ©2016 Pleiades Publishing, Ltd., New York, United States.

Figure 23.
Two branches of and the estimated values for a number of hydrosilicate derivates ( nm). Square brackets reduce the standard anionic part, for example: Mg3Si2[O5(OH)4], Al2Si2[O5(OH)4], Al2Si[O3(OH4], etc. The square symbol means that the octahedral sheet is the outer one and the triangle symbol means that the tetrahedral sheet is the outer one.

Figure 24.
The calculated enthalpies of mixing in chrysotile, halloysite and imogolite vs. the mole fraction of a guest cation x. ‘l.s.’ means low spin configuration, ‘h.s.’ means high spin configuration.
Figure 24.
The calculated enthalpies of mixing in chrysotile, halloysite and imogolite vs. the mole fraction of a guest cation x. ‘l.s.’ means low spin configuration, ‘h.s.’ means high spin configuration.

Figure 25.
Electron microscope and electron diffraction images of the nanostructures obtained after 7 days of hydrothermal reaction between Al(OH)3 and SiO2 in the presence of GeO2, at pH 2 and a temperature of 220 °C. The molar fraction of added GeO2 was (a) 0, (b) 0.05, (c) 0.1 and (d) 0.5. The inset in (b) shows a spheroidal kaolinite particle, from [97]. Copyright ©2012 American Chemical Society, Washington, United States.

Figure 26.
(a–d) Transmission electron microscopy of the Ti-doped chrysotile nanotubes, from [101]. Copyright ©2018 Pleiades Publishing Ltd., New York, United States.
Figure 26.
(a–d) Transmission electron microscopy of the Ti-doped chrysotile nanotubes, from [101]. Copyright ©2018 Pleiades Publishing Ltd., New York, United States.

Figure 27.
TEM micrographs of nickel 1:1 phyllosilicate: (A) the general view, (B) the side view of a tubular particle, (C) the higher magnification view showing the hollow multiwall tubular structure and (D) the end-on view of one of the tubes (Inset: electron diffraction pattern). From [112]. Copyright ©2008 Elsevier Inc., Amsterdam, The Netherlands.

Figure 28.
Growth of Mg-chrysotile and Ni-pecoraite. The points are nanoscrolls, measured using an electron microscope, and the solid curves are modelling results. The coloured areas are 500 J/mol regions around the energy minimum modelled for nanoscrolls of different mass, from [76]. Copyright ©2017 American Chemical Society, Washington, United States.

Figure 29.
(a,b) Secondary electron micrographs of Fe-doped chrysotile, from [103]. Copyright ©2009 WILEY-VCH Verlag GmbH & Co. KGaA, Weinheim, Germany.
Figure 29.
(a,b) Secondary electron micrographs of Fe-doped chrysotile, from [103]. Copyright ©2009 WILEY-VCH Verlag GmbH & Co. KGaA, Weinheim, Germany.

Figure 30.
Secondary electron SEM image of the Ti-doped cone-in-cone chrysotile nanotube, from [100]. Copyright ©2009 E. Schweizerbart’sche Verlagsbuchhandlung, Stuttgart, Germany.
Figure 30.
Secondary electron SEM image of the Ti-doped cone-in-cone chrysotile nanotube, from [100]. Copyright ©2009 E. Schweizerbart’sche Verlagsbuchhandlung, Stuttgart, Germany.

Figure 31.
(a) Possible mechanism of the Mg2+ and Ni2+ cation redistribution as a result of the nanoscroll growth process. (b) Results of the linear regression of the data obtained by energy-dispersive X-ray spectroscopy in comparison with the maximal gradient (dashed line) predicted by Equation (8), from [118]. Copyright ©2019 Wiley-VCH Verlag GmbH & Co. KGaA, Weinheim, Germany.

Figure 32.
Polygonal serpentine (PS) electron microscope image of a 30-sectored polygonal serpentine viewed down its fibre axis. The inner part of the fibre consists of chrysotile surrounded by a ring of sectors with two-layered lizardite polytypes. The outermost zone of the fibre consists of disordered lizardite. The area in the white box is enlarged in Figure 33, from [27]. Copyright ©2004 by V.H. Winston & Son, Inc., Palm Beach, United States.

Figure 33.
(A) Enlarged area indicated in Figure 32, showing offsets of lizardite layers at sector boundaries. (B) Schematic sketch of the tetrahedral sheets in a 30-sectored polygonal serpentine. Inversions occur in the sheets at sector boundaries. The polytypes in the adjacent sectors are indicated by their b and c axes, from [27]. Copyright ©2004 by V.H. Winston & Son, Inc., Palm Beach, United States.

Figure 34.
(a) N2 sorption isotherms for the 77 K of pristine imogolite (squares) and imogolite with 0.7 wt.% (stars), and 1.4 wt.% (triangles) Fe3+. Full and hollow symbols refer to the adsorption and desorption branches, respectively. (b) Pore size distributions of pristine imogolite (squares) and imogolite with 0.7 wt.% (stars), and 1.4 wt.% (triangles) Fe3+, as obtained by the Non-local Density Functional Theory (NL-DFT) approach method. Both images are from [107]. Copyright ©2015 Springer Science+Business Media Dordrecht, Berlin, Germany.

Figure 35.
Reduced elastic modulus of the halloysite nanotubes deduced from the force curve measurements as a function of the outer diameter, (error bars indicate one standard deviation). As a comparison, the range of values predicted for the elastic modulus of single-walled halloysite is bounded by the dashed lines, from [54]. Copyright ©2013 IOP Publishing Ltd., Bristol, United Kingdom.

Figure 36.
(a) Magnetisations vs. the applied magnetic field, measured at various temperatures. Upper inset: zoomed low-field part of the hysteresis loop measured at 5 K. Bottom inset: Arrott plots. (b) Field-cooled (solid line) and zero field-cooled (dashed line) dc magnetisations vs. the temperature measured in various magnetic fields. Upper inset: reciprocal susceptibility vs. temperature. Red symbols: experimental data; black dashed line: Curie–Weiss fitting. Bottom inset: derivative vs. temperature. Both images are from [114]. Copyright ©2016 IOP Publishing Ltd., Bristol, United Kingdom.

Figure 37.
(a) Representation of the magnetic behaviour of iron-doped synthetic chrysotile in comparison with the Curie law for the Fe3+ high spin ion (, Curie Constant emu mol–1 K): (a) vs. experimental data and the representation of the Curie law as . (b) vs. experimental data and the representation of the Curie law as . AF–antiferromagnetic coupling; F–ferromagnetic coupling. From [106] with permission from the PCCP Owner Societies.

Figure 38.
(a) Magnetisation curves of the Ni3Si2O5(OH)4 nanotubes after the hydrothermal reduction treatment: (Ⅰ) 120 °C, 10 h; (Ⅱ) 150 °C, 5 h; (Ⅲ) 180 °C, 10 h; the inset images in (Ⅰ) and (Ⅱ) show partial enlargements. (b) Images of the sample of the Ni3Si2O5(OH)4 nanotubes after reduction at 180 °C for 10 h in water, before and after the attraction by a permanent magnet. Both images are from [175]. Copyright ©2011 Tsinghua University Press and Springer-Verlag Berlin Heidelberg, Berlin, Germany.

Figure 39.
Electron micrographs of the nanoscrolls after annealing: (a–c) Ni3Si2O5(OH)4, (d–f) Ni2MgSi2O5(OH)4. Annealing temperatures: (a–c) 540, 670, 900 °C, respectively; (d–f) 400, 600, 900 °C, respectively, from [180].
Figure 39.
Electron micrographs of the nanoscrolls after annealing: (a–c) Ni3Si2O5(OH)4, (d–f) Ni2MgSi2O5(OH)4. Annealing temperatures: (a–c) 540, 670, 900 °C, respectively; (d–f) 400, 600, 900 °C, respectively, from [180].

© 2020 by the authors. Licensee MDPI, Basel, Switzerland. This article is an open access article distributed under the terms and conditions of the Creative Commons Attribution (CC BY) license (http://creativecommons.org/licenses/by/4.0/).
Share and Cite
MDPI and ACS Style
Krasilin, A.A.; Khrapova, E.K.; Maslennikova, T.P. Cation Doping Approach for Nanotubular Hydrosilicates Curvature Control and Related Applications. Crystals 2020, 10, 654. https://doi.org/10.3390/cryst10080654
AMA Style
Krasilin AA, Khrapova EK, Maslennikova TP. Cation Doping Approach for Nanotubular Hydrosilicates Curvature Control and Related Applications. Crystals. 2020; 10(8):654. https://doi.org/10.3390/cryst10080654
Chicago/Turabian StyleKrasilin, Andrei A., Ekaterina K. Khrapova, and Tatiana P. Maslennikova. 2020. "Cation Doping Approach for Nanotubular Hydrosilicates Curvature Control and Related Applications" Crystals 10, no. 8: 654. https://doi.org/10.3390/cryst10080654
Note that from the first issue of 2016, this journal uses article numbers instead of page numbers. See further details here.