Vibrational Dynamics of a Chiral Smectic Liquid Crystal Undergoing Vitrification and Cold Crystallization


1
Institute of Nuclear Physics Polish Academy of Sciences, PL-31342 Krakow, Poland
2
Institute of Chemistry, Military University of Technology, Kaliskiego 2, 00-908 Warszawa, Poland
*
Author to whom correspondence should be addressed.
Crystals 2020, 10(8), 655; https://doi.org/10.3390/cryst10080655
Submission received: 7 July 2020
/
Revised: 25 July 2020
/
Accepted: 29 July 2020
/
Published: 30 July 2020
(This article belongs to the Special Issue Crystallography of Structural Phase Transformations)
Abstract
:Vibrational dynamics in the glass transition and the cold crystallization process of (S)-4′-(1-methyloctyloxycarbonyl) biphenyl-4-yl 4-[7-(2,2,3,3,4,4,4-heptafluorobutoxy) heptyl-1-oxy]-benzoate (3F7HPhH7) was studied by Fourier transform infrared spectroscopy (FTIR) during cooling/heating experimental runs. The measured spectra processing was supported by quantum chemical density functional theory (DFT) calculations (frequency assignments). The perturbation-correlation moving window two-dimensional analysis (PCMW2D) was performed to examine how the height of individual absorption bands change under with temperature. Two-dimensional correlation analysis (2D-COS) was used to detect freezing-in or activation of the stochastic movements during the vitrification and the cold crystallization processes. Upon cooling, the vitrification process involves freezing-in of the stochastic movements of ester groups. Upon heating, as the cold crystallization process begins, the first to respond are the vibrations of the C–O–C and C=O groups in the rigid core.
1. Introduction
Although the history of liquid crystals goes back more than 130 years [1,2], these substances are still readily studied in hot pursuit for new materials that would meet ever growing application needs, at the same time building up specific knowledge in the field of fundamental science of soft condensed matter. Liquid–crystal displays (LCD) or temperature sensors are probably the best-known examples of their industrial application. Liquid crystals in their nematic phase are mainly used in LCD but displays based on smectic phases with ferro- or antiferro-electric properties are also known [3,4]. In addition, if the liquid crystal phase undergoes a glass transition, then the resulting glass with anisotropic properties can be used in electro-optical devices for selective reflection of light, for manufacturing amorphous pharmaceuticals or drug carriers, assuring a better bioavailability of active substances [5,6].
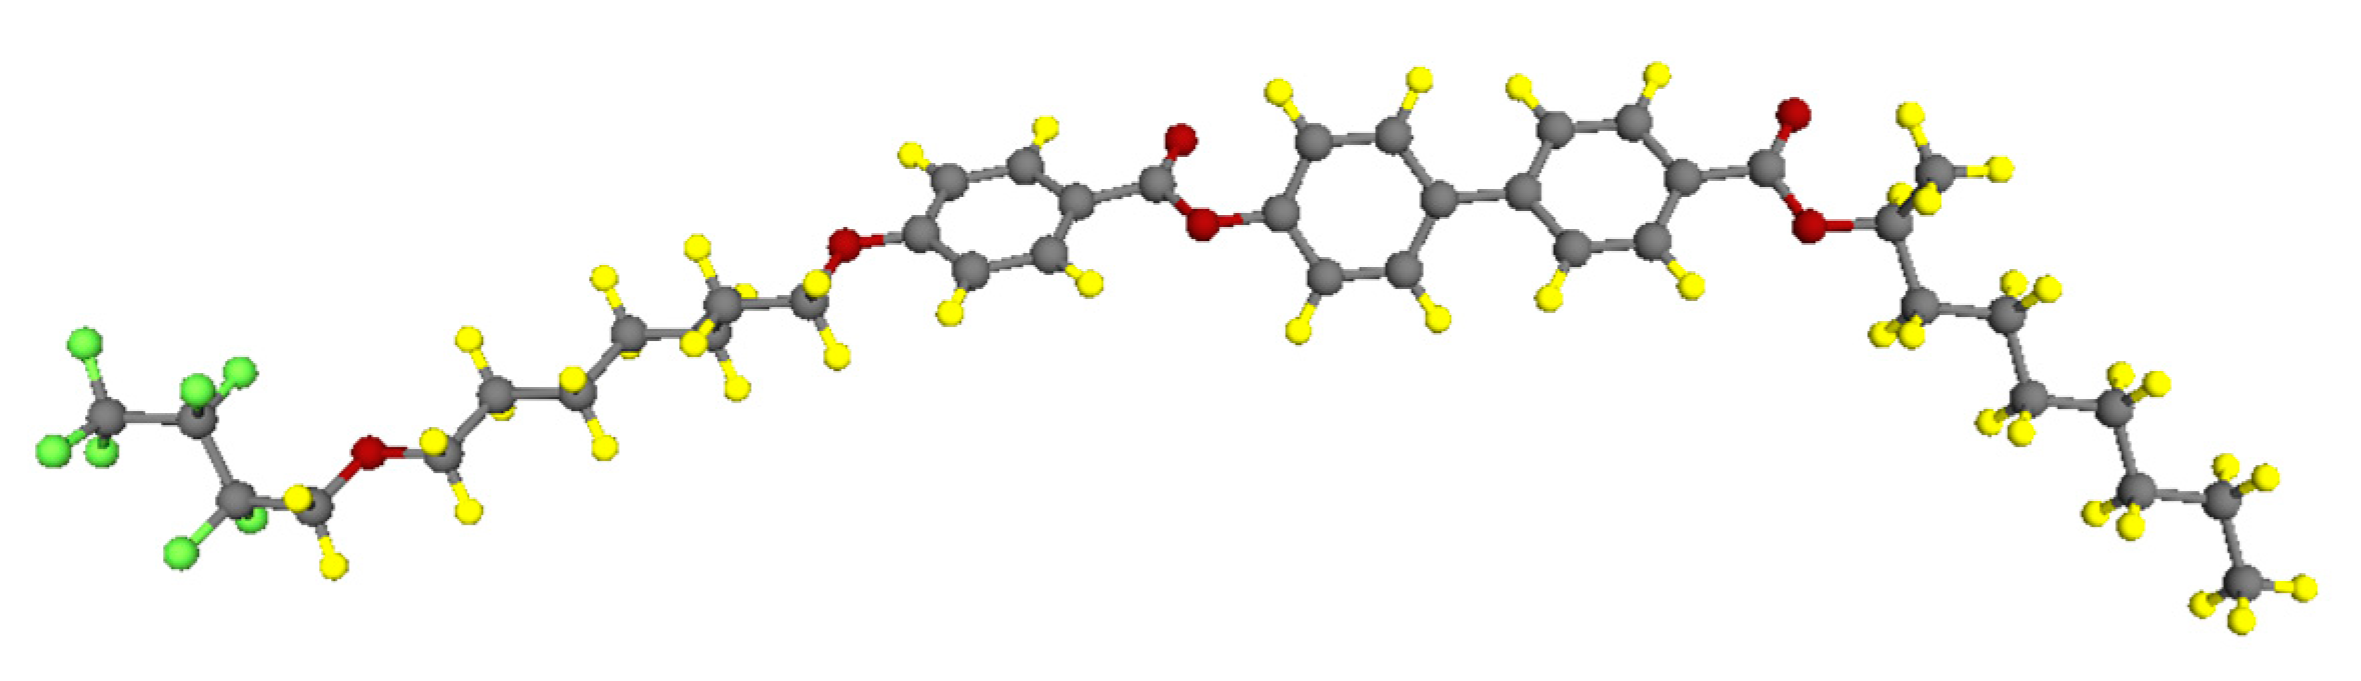
Liquid crystal compounds often exhibit a fairly rich polymorphism. It is not uncommon to observe vitrification and cold crystallization [7,8,9,10]. One of such compounds is (S)-4′-(1-methyloctyloxycarbonyl) biphenyl-4-yl 4-[7-(2,2,3,3,4,4,4-heptafluorobutoxy) heptyl-1-oxy]-benzoate, abbreviated as 3F7HPhH7 (Figure 1).
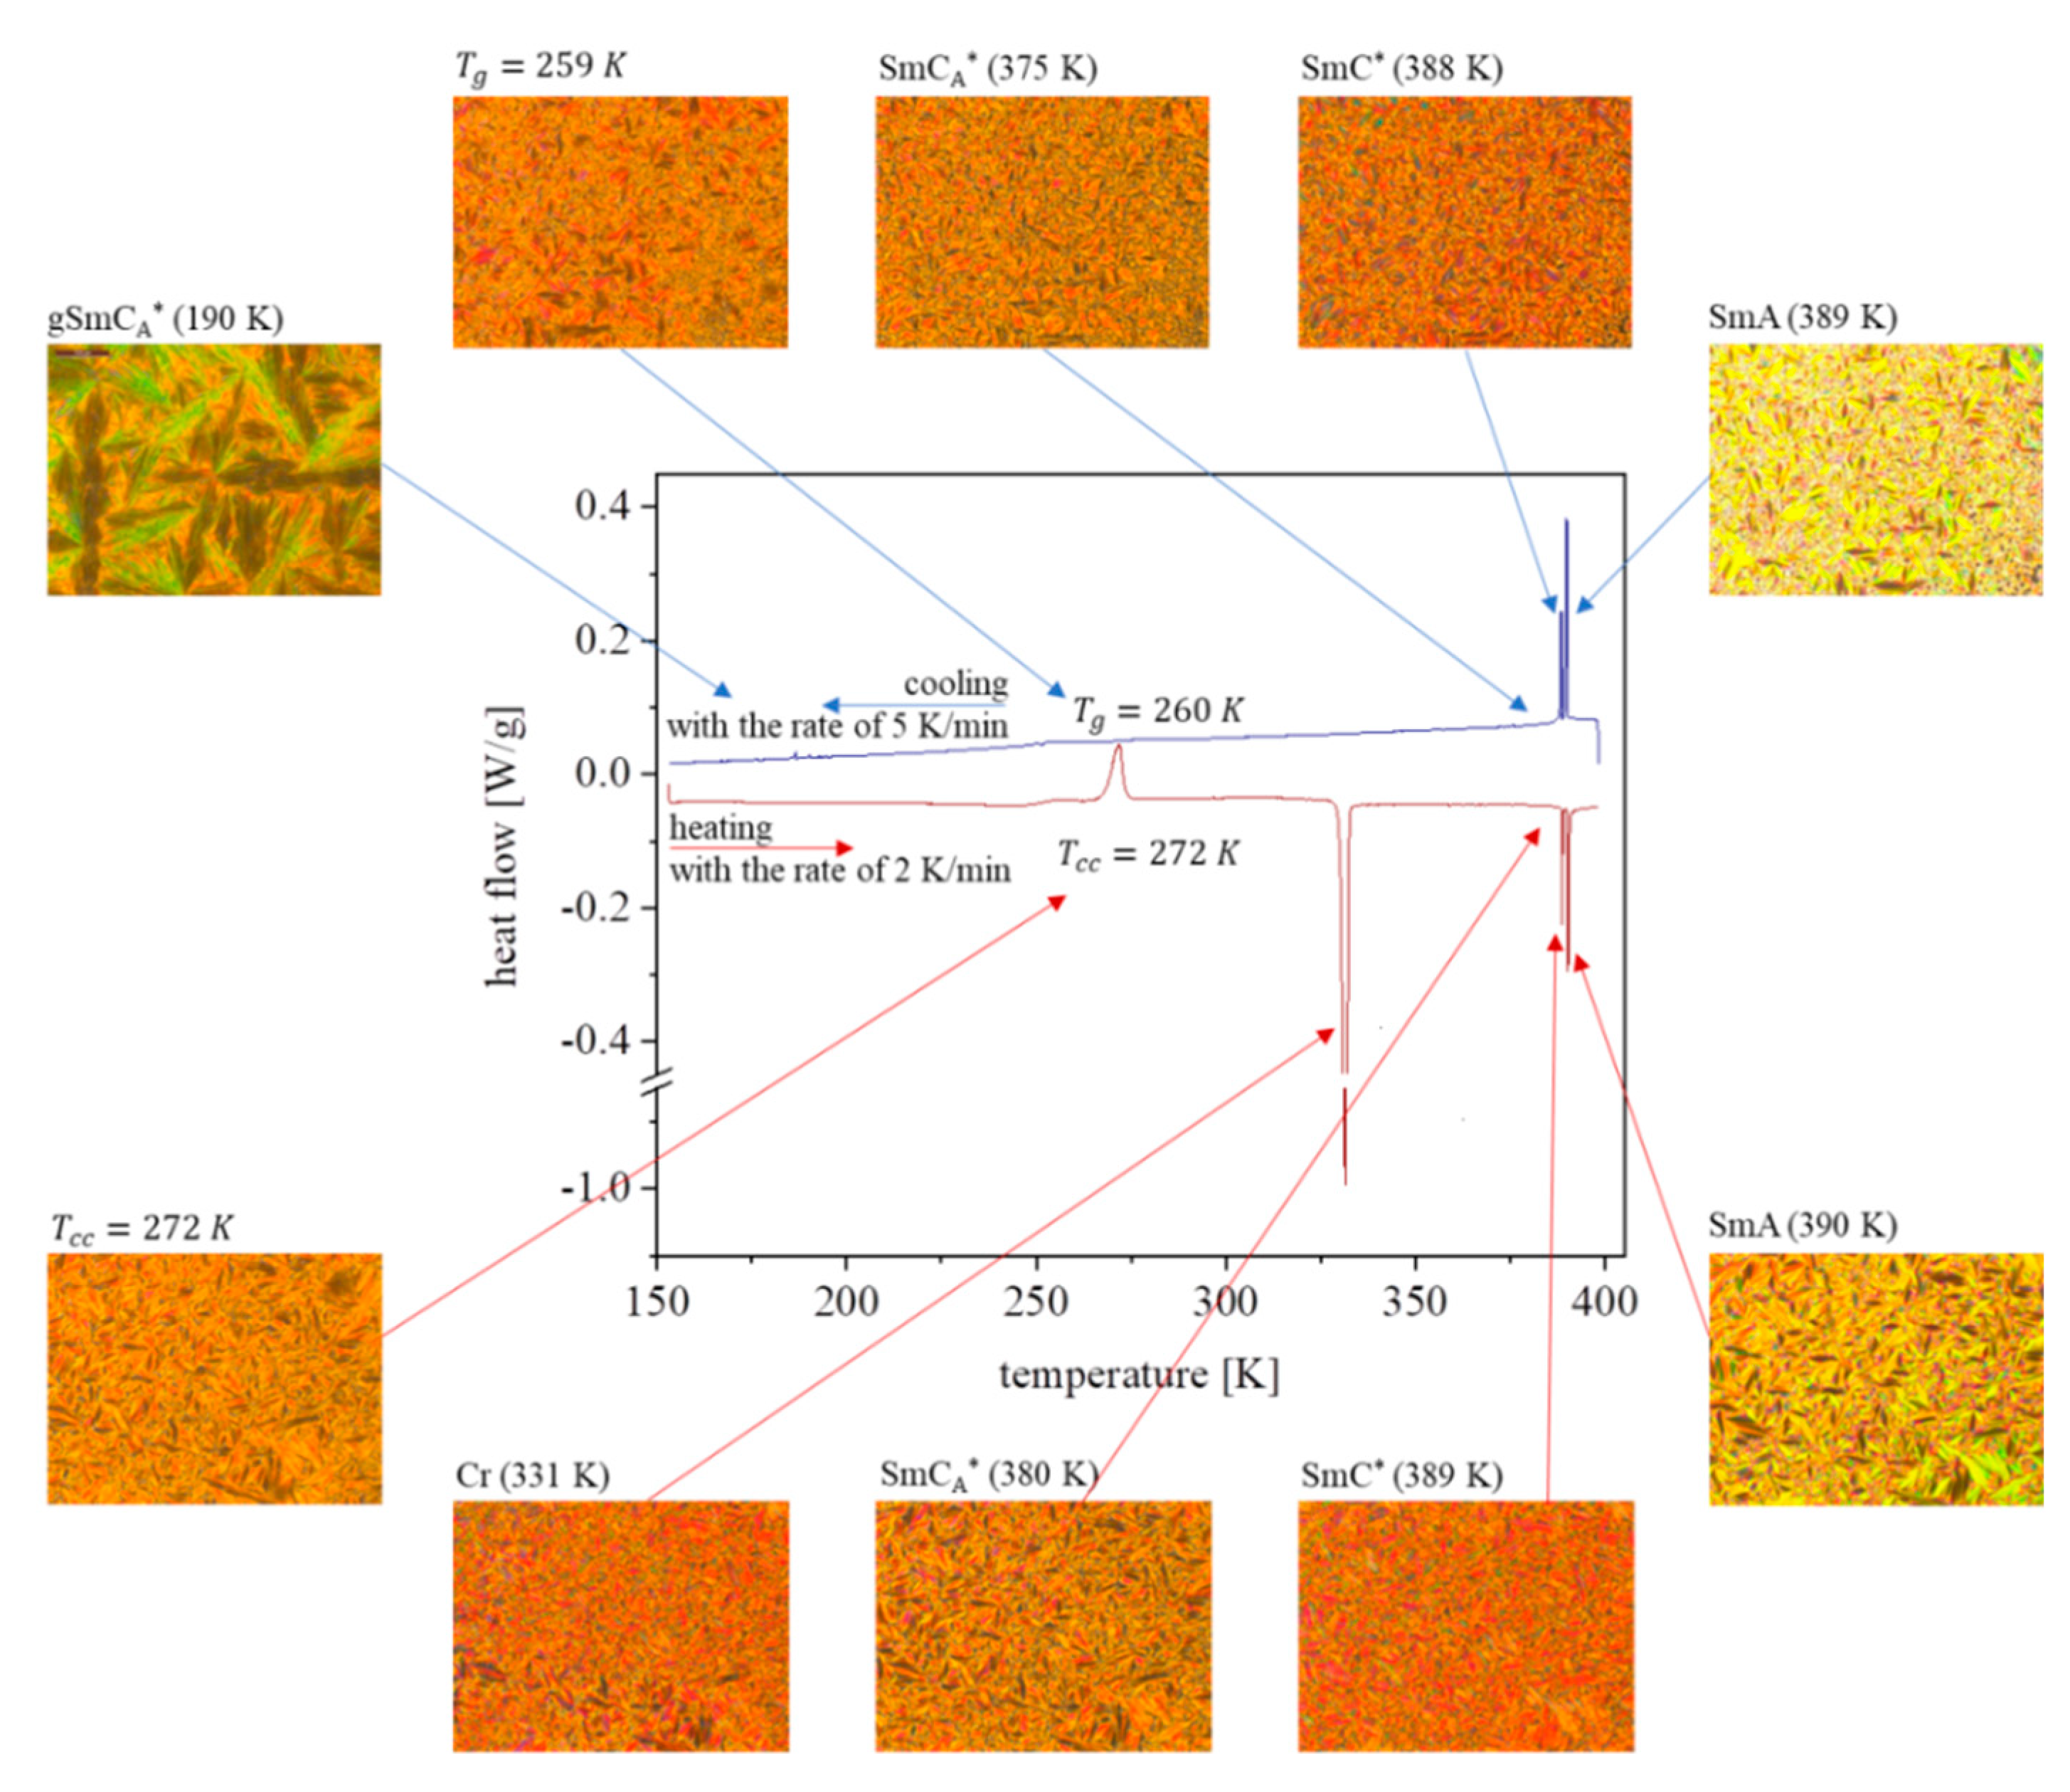
Differential scanning calorimetry (DSC) thermograms as well as the images of polarized light microscopic (POM) textures of 3F7HPhH7 are shown in Figure 2. During cooling, the compound under study transits at 389 K from the isotropic phase to the SmA phase with the characteristic fan-shaped texture, then (at 388 K) it immediately proceeds to the SmC* phase with the broken fan-shaped texture. At 375 K, the transition to the SmCA* phase with the striated fan-shaped texture was visible. At approximately 259 K, the SmCA* phase vitrified. The characteristic signature of glass transition are sharp discontinuities in the heat flow, seen on the DSC thermogram between 250 and 180 K, as well as the appearance of cracks on POM images [11], just as it was noticed in References [12,13]. During heating, the process of a cold crystallization at 272 K was observed. After the transition between crystal phase and the SmCA* phase (at 331 K), the enantiotropic system previously detected during cooling was observed in the reverse order: SmCA*–380 K–SmC*–389 K–SmA–390 K–Iso. It is worth adding that in the vitrification process of the SmCA* phase, the active stochastic movements are frozen. Upon heating, the glass softens and passes to the supercooled SmCA* phase, which then crystallizes. Thus, during the cycle of the vitrification—glass softening—cold crystallization, we do not go back to the starting point. While the vitrification and softening processes involve the same stochastic movements, the same cannot be said of cold crystallization. More information on polymorphism of 3F7HPhH7 is available in Reference [14].
Fourier transform infrared spectroscopy (FTIR) has been widely used to elucidate changes that on a microscopic, molecular level, accompany the phase transitions [15,16,17,18]. Such changes affect the vibrational dynamics and become detected as variations of the parameters of absorption bands (e.g., wavenumbers, full width at half maxima (FWHM’s), areas and heights) observed in infrared spectra consecutively measured as a function of temperature [19,20,21]. As far as 3F7HPhH7 is concerned, direct detailed analysis of such properties is difficult because vibrations within the core part, i.e., biphenyl benzoate, especially in the region of 1300–1000 cm−1 associated with ester groups, produce overlapping bands. The two-dimensional correlation analysis (2D-COS), proposed by Noda, opens up new possibilities of interpreting series of vibrational spectra collected as a function of varying external perturbation, such as temperature, pressure, etc., i.e., hyperspectroscopic data [22]. Morita et al. went further, developing a perturbation-correlation moving window two-dimensional analysis (PCMW2D), which is based on 2D-COS analysis and a moving-window two-dimensional correlation analysis (MW2D) [23]. PCMW2D is an elegant method of detecting changes in band characteristics and providing analysis thereof by means of statistical tools [24]. Both correlation analyses were successfully used to interpret the vibrational dynamics of compounds showing glass transition or cold crystallization processes [25,26,27,28].
The aim of the present paper is to study the vibrational dynamics of 3F7HPhH7 during its vitrification and then cold crystallization, using FTIR, supported by quantum chemical density functional theory (DFT) calculations. In the earlier work [14], we introduced the mesomorphic behavior and the kinetics of the isothermal and non-isothermal cold crystallization of 3F7HPhH7, and this work is a continuation of that research. Hyperspectral FTIR data were examined by means of 2D-COS and PCMW2D analyses. FTIR spectra were measured for different cooling-heating cycles to assess how it affects the occurrence of the cold crystallization process in the compound under study.
2. Materials and Methods
2.1. Material
3F7HPhH7 was obtained in the Institute of Chemistry, Military University of Technology, Warsaw, Poland [29]. The purity of the sample was higher than 99.4% (using the ASTM E928 Standard Test Method for Determining Purity by Differential Scanning Calorimetry with the use of DSC TA 2500) and additionally confirmed by high performance liquid chromatography–photo diode array–mass spectrometry (HPLC-PDA-MS) analysis (APCI-ESI-dual source) Shimadzu Prominence HPLC-LCMS 2010EV equipped with a polychromatic UV–VIS detector and MS (ESI/APCI) analyzer using a Kinetex C18 and PFP column.
2.2. Fourier Transform Infrared Absorption Spectra (FTIR)
FTIR absorption spectra were recorded using a Bio-Rad Digilab FTS 3000 Excalibur spectrometer in the wavenumber range of 4000–400 cm−1, with a resolution close to 0.4 cm−1 and taking 64 scans. The sample in the form of a thin film was placed between two zinc selenide ZnSe window discs. The film thickness was approximately 20 μm. During the measurements, the spectrometer was purged with dry nitrogen. Temperature investigations have been performed in three sequences: (i) fast cooling from 403 to 173 K with the rate of 5 K/min, (ii) heating with the rate of 2 K/min (after a previous slow cooling with the rate of 2 K/min) and (iii) heating with the rate of 2 K/min (after a previous fast cooling with the rate of 10 K/min). Additionally, the isothermal crystallization at 261 K for 60 min was examined.
2.3. Two-Dimensional Analysis (2D-COS)
In many cases, the experimenter is interested not only in how the system under study evolves when subjected to an external perturbation, e.g., to changing temperature, pressure, etc., but also how its specific subsystems (such as molecular moieties, functional groups, etc.) are coupled to each other, by unveiling whether and how their response to such perturbation (or dynamic variable) is correlated. The idea of how to do this came from two-dimensional spectroscopy, originally developed, e.g., for the nuclear magnetic resonance (NMR), and after Noda and co-workers, is known as two-dimensional correlation analysis [17,30]. When FTIR spectra are being collected one after another, as the dynamic variable (here: temperature) is changed, a two-dimensional matrix is built, known as hyperspectral data, whose elements are spectral intensities , being functions of the spectral variable , and dynamic variable t. Let the dynamic spectrum be:
where is t-averaged, or otherwise determined reference spectrum defined over the dynamic variable range of interest. Then, the generalized 2D correlation map is calculated for any pair of spectral variable values via Fourier transform in the domain of the dynamic variable t, and hence it becomes a complex function of
The real part, is commonly referred to as synchronous, while the imaginary one, as asynchronous.
The synchronous map carries information about simultaneous (hence the name) changes of spectral intensity corresponding to each pair . Diagonal elements represent the autocorrelation function and are therefore always positive. The maxima on a diagonal are then called autopeaks, and they indicate bands whose intensity changes under the influence of external perturbation. Positive off-diagonal peaks (so called positive cross-peaks) reveal the simultaneous increase or decrease of intensities of two bands under external perturbation, while negative off-diagonal cross-peaks show up whenever the intensity of one band increases while that of the other decreases [31]. The asynchronous map (imaginary part) represents out-of-phase changes of spectral intensities. Therefore, it has no diagonal part. A positive cross-peak in the asynchronous map appears at when the change of maximum band intensity at the spectral variable occurs before changing the maximum band intensity at the spectral variable . Should the opposite happen, a negative cross-peak shows up.
In this work, the 2D-COS analysis of hyperspectral data was carried out by means of the 2D-SHIGE program [32].
2.4. Perturbation-Correlation Moving Window Two-Dimensional Analysis (PCMW2D)
PCMW2D is a step forward and a significant improvement over conventional MW2D analysis, which operates on autocorrelations only. Basically, MW2D consists in plotting autocorrelation intensities calculated within a small window in the dynamic variable domain, which is then “slid” along the dynamic variable range. PCMW2D also employs the concept of a finite-width window sliding down the dynamic variable (perturbation) axis, but this time, both synchronous and asynchronous correlation maps are calculated. Graphical representation can then be either in the form of two three-dimensional (3D) surface plots (synchronous and asynchronous PCMW2D correlations) or the corresponding contour maps on a 2D-plane: the perturbation variable axis (e.g., temperature) vs. the spectral variable axis (e.g., wavenumber) [33]. This type of hyperspectral data analysis allows one to perform an in-depth study of the temperature dependence of vibrational dynamics of the compound under interest.
In the present work, PCMW2D maps were plotted by the 2D-SHIGE program [32]. In PCMW2D correlation maps, the red areas represent positive correlation intensity, which means the increasing of the intensity at a given wavenumber as a function of temperature, while the blue ones represent negative correlation intensity (and thus decreasing of the intensity).
2.5. Computational Details
The quantum chemical DFT calculations were performed using TURBOMOLE v7.3 at the Academic Computer Centre CYFRONET (Cracow) [34]. The calculations were carried out for an isolated molecule of 3F7HPhH7, with the basis set of def2-TZVPPD for all atoms [35], the B3-LYP functional [36] and using the dispersion corrections of D4 [37].
Def2-TZVPPD, the basis set used, is a triple-zeta, property-optimized augmented one. It provides adequate precision at reasonable computational costs. The choice of B3-LYP functional was justified for a number of reasons. It is a hybrid functional (correlation/exchange) known to be one of the best, and certainly the most frequently used one if these type of calculations are expected to deliver precision results. Altogether, def2-TZVPPD + B3-LYP guarantee results that are not only good, but also comparable with those of other researchers, carried out on similar systems. From the many years of experience of the authors, the use of def2-TZVPPD + B3-LYP should be combined with semi-empirical dispersion corrections, as “pure” DFT, for fundamental theoretical reasons, does not include such interactions. They are meaningful in the case of large, flexible molecules, such as rod-like liquid crystals, where middle- and long-range weak non-covalent intra-molecular interactions influence the conformational state of molecules as well as vibrational frequencies, especially those involving light atoms (hydrogen).
3. Results and Discussion
3.1. DFT Calculations vs. FTIR Results
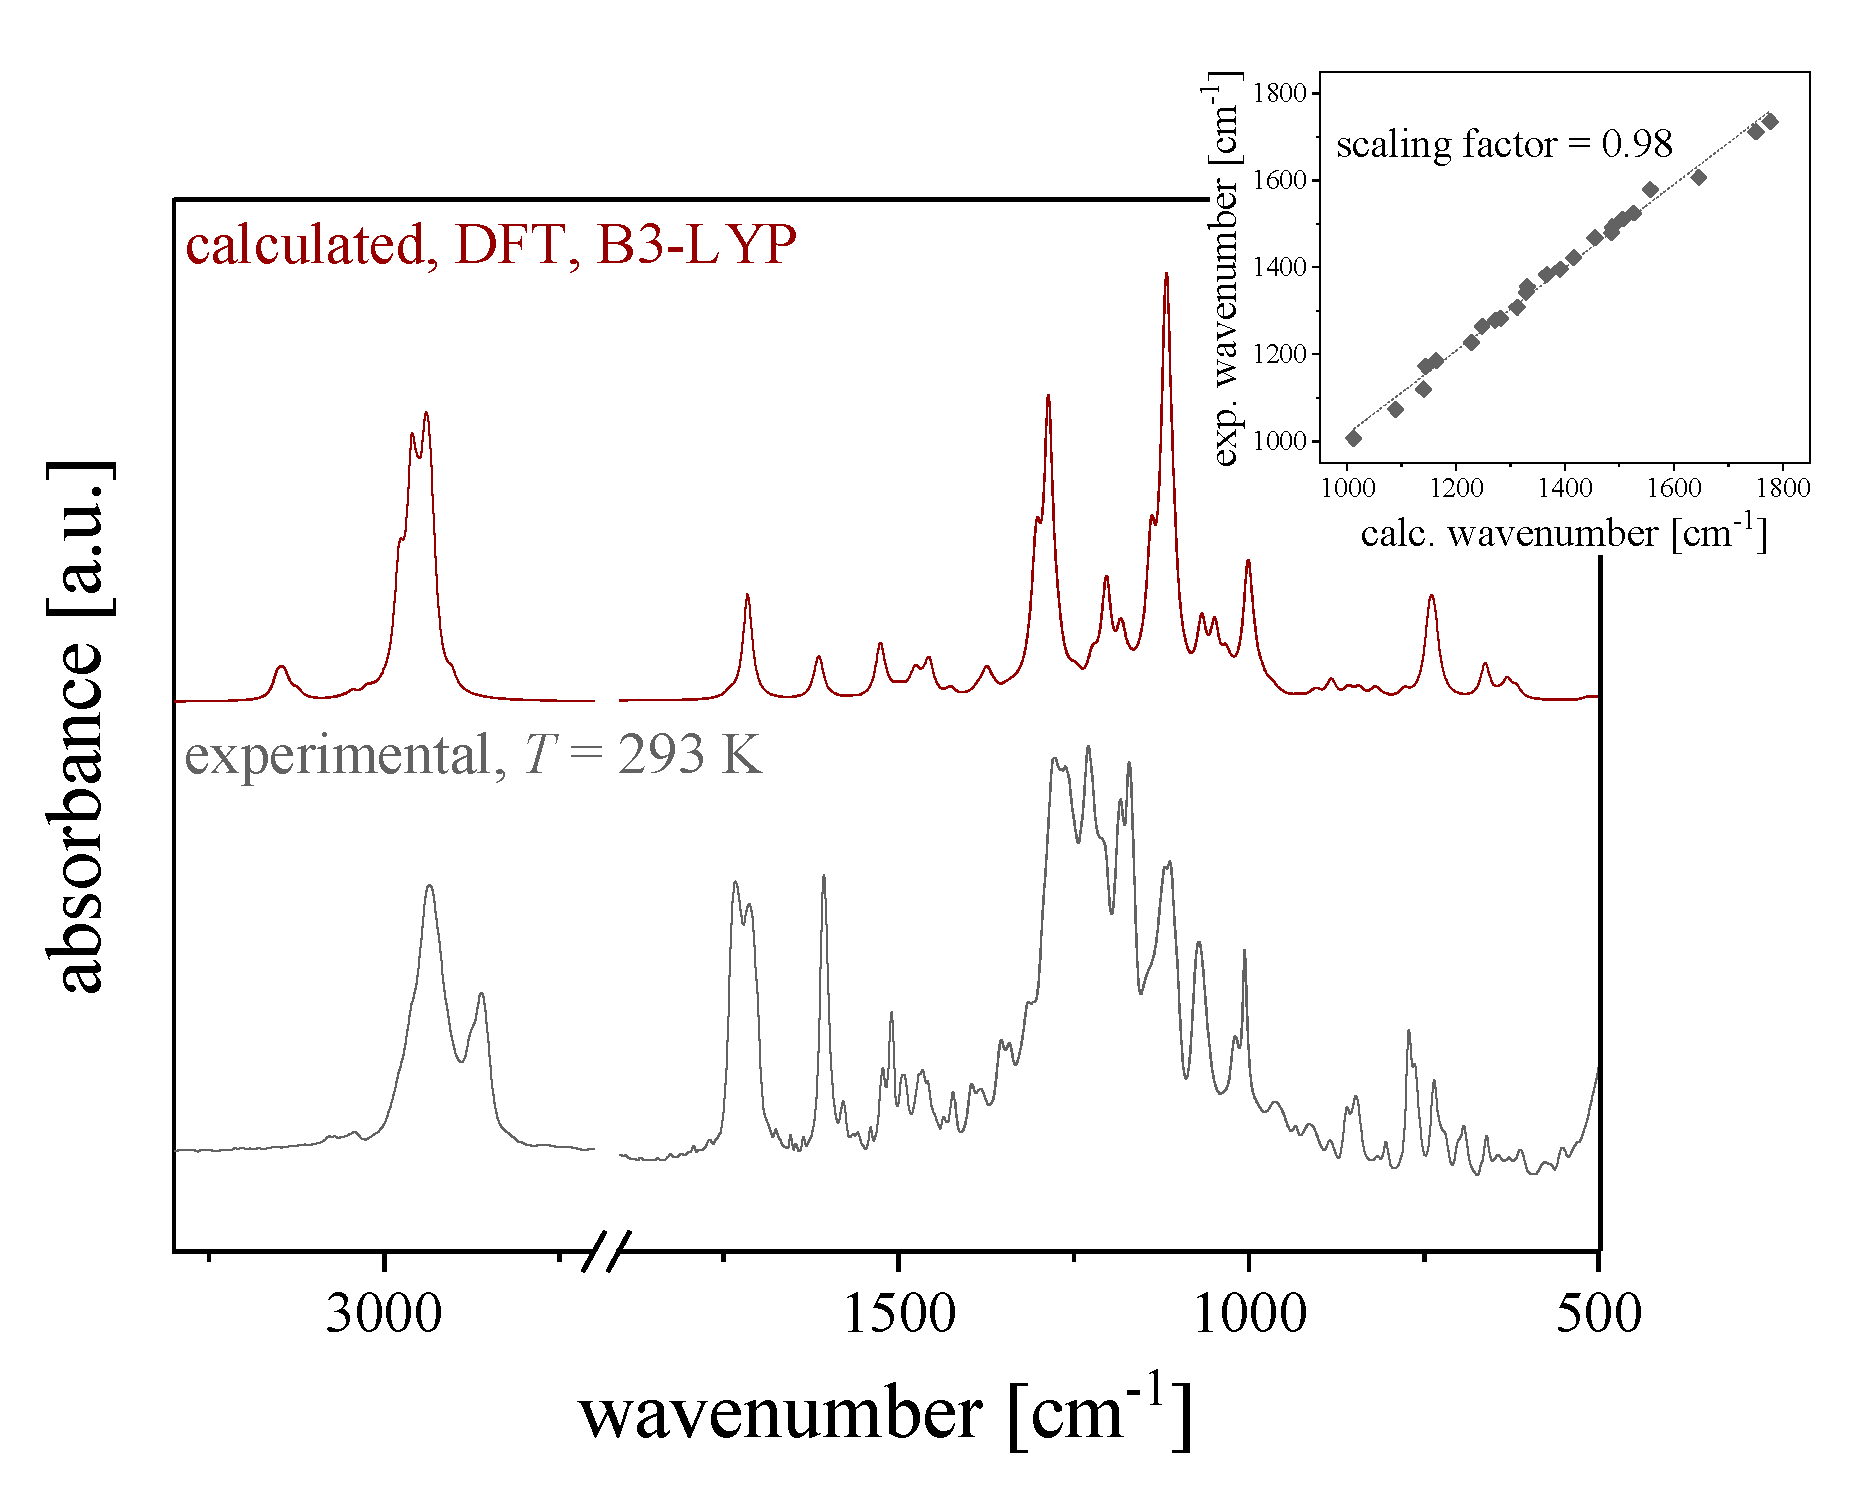
Theoretical calculations for an isolated 3F7HPhH7 molecule in energetically most-favorable conformation (Figure 1) were performed in order to interpret measured infrared absorption spectra, as shown in Figure 3. The description of absorption bands with the assigned types of vibrations is contained in Table 1. The calculated spectrum remains in an acceptable agreement with the measured one (including a scaling factor of 0.98) [38], except the bands associated with stretching vibrations of C–H bonds (the changes of the position of these bands on both spectra are connected with the anharmonic effects occurring in these vibrations). Other slight differences in the position of absorption bands in the region of stretching vibrations may be due to the fact that the spectrum was calculated for a single molecule of a specific conformation, while the measured spectrum was obtained for the real sample in which molecules can take a variety of conformations, affecting the effective frequencies of bands [39]. Since such a complex spectrum consists of many overlapping bands, not all vibrations can be further studied in detail. The most significant bands, taken for the analysis and discussed further on, are those in the region of stretching vibrations of carbonyl groups in the chiral center, ν(C=O)chiral_c., and in the rigid core, ν(C=O)core (at 1750–1700 cm−1). These bands are sensitive to various intra- and inter-molecular interactions, and they can be easily analyzed as they are well-separated from other bands [40,41]. Moreover, also other bands (e.g., in the wavenumber regions of asymmetric ν(C–H)asym and symmetric ν(C–H)sym C–H stretching vibrations, of ρ(C–H) rocking vibrations and of asymmetric ν(C–O–C)asym and symmetric ν(C–O–C)sym C–O–C stretching vibrations) were taken into account.
3.2. Fast Cooling
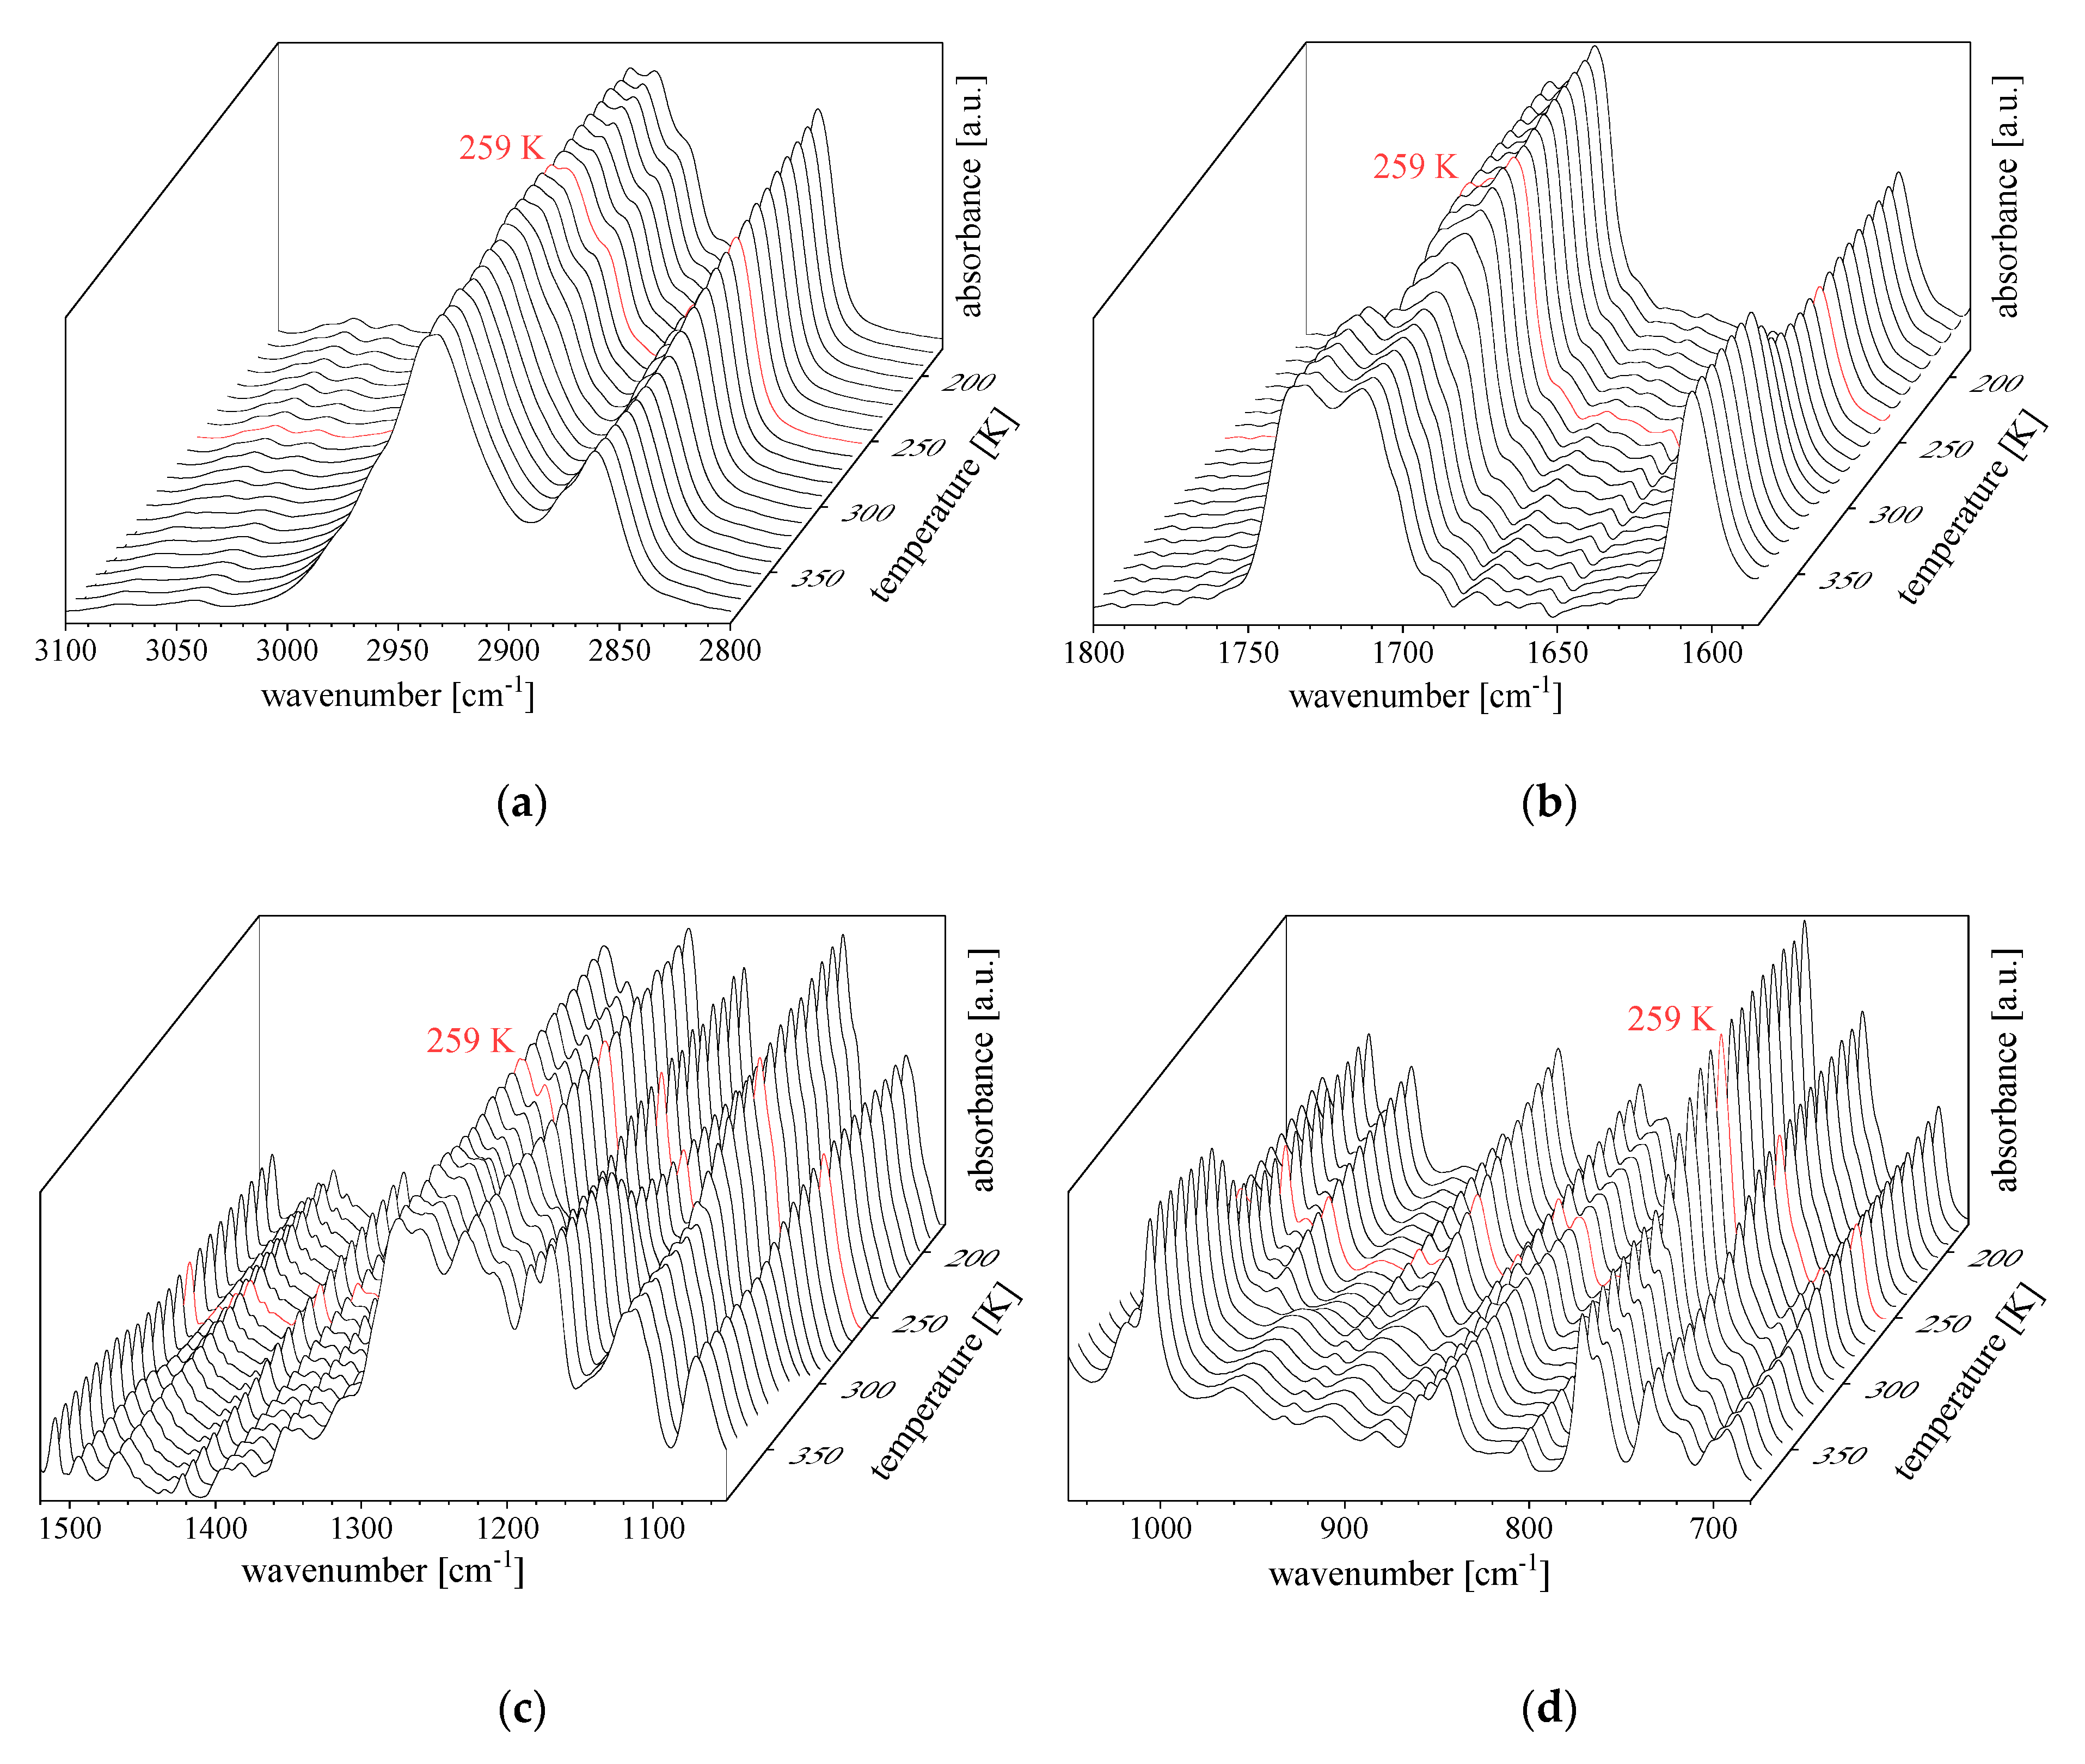
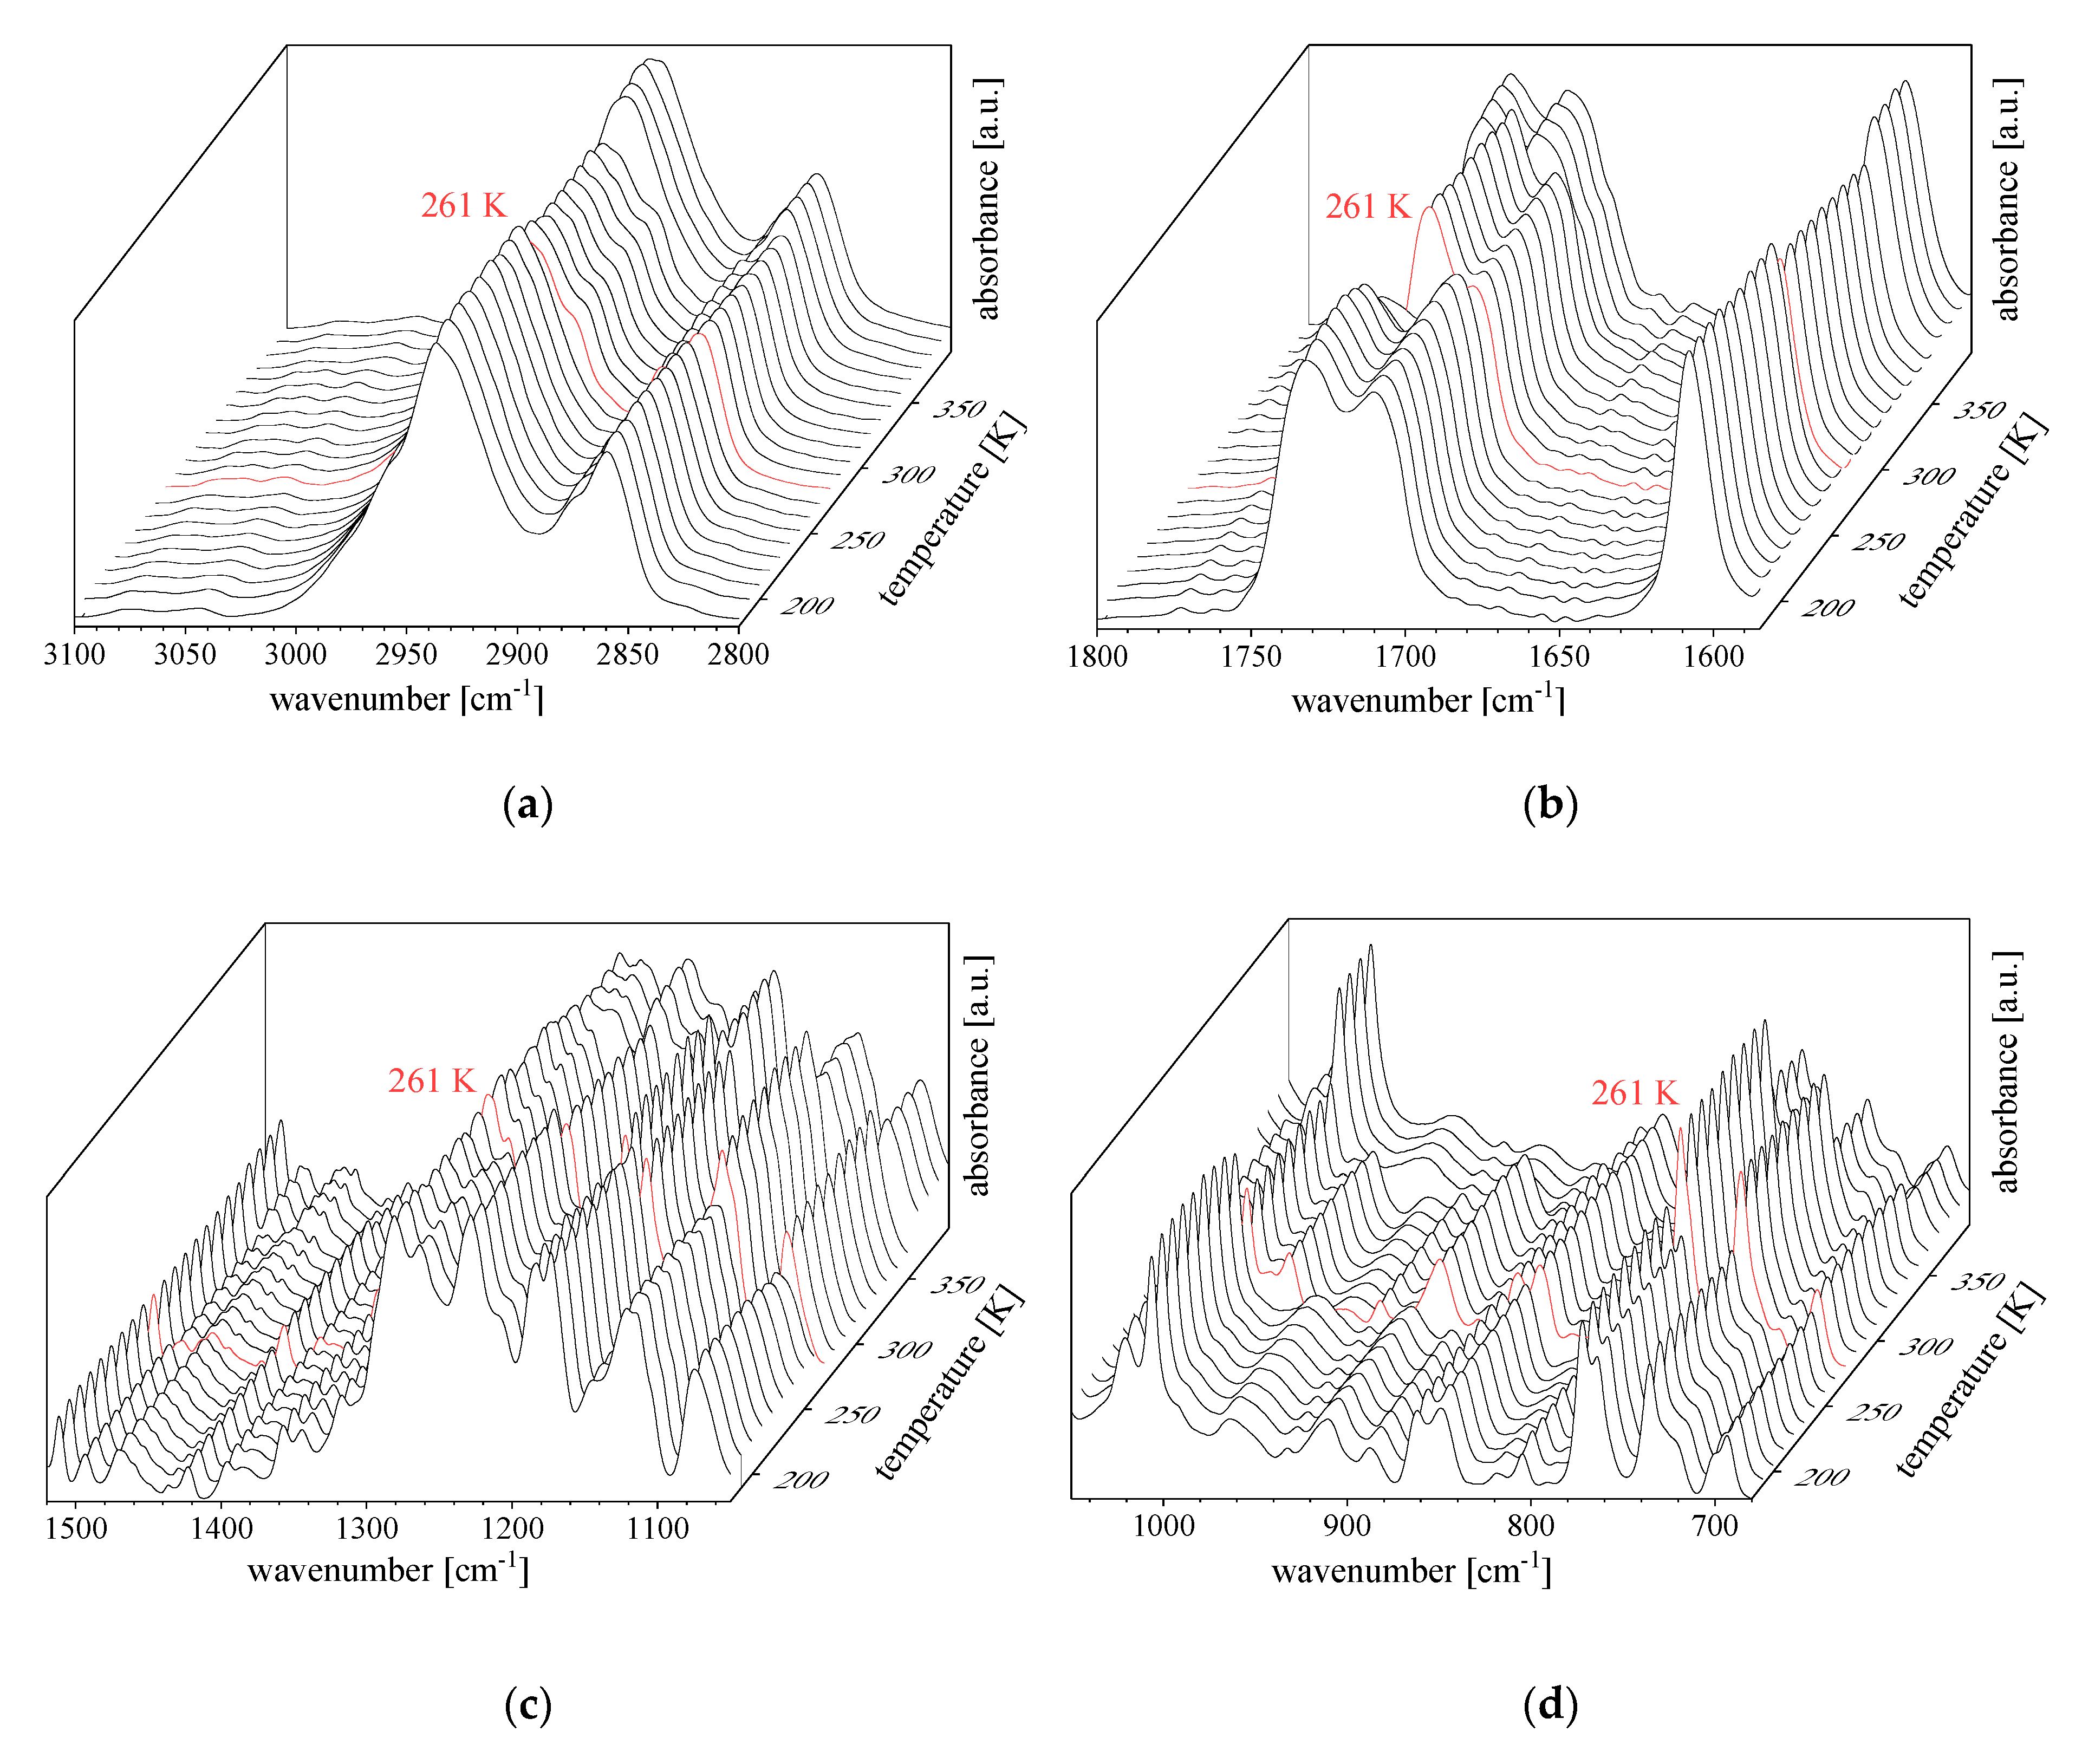
The FTIR spectra changes in the wavenumber regions of ν(C–H) (at 3100–2800 cm−1), ν(C=O) (at 1800–1580 cm−1), ν(C–O–C) (at 1520–1050 cm−1) and ρ(C–H) (at 1050–680 cm−1) vibrations during the cooling process at the rate of 5 K/min from 403 to 173 K are shown in Figure 4. These regions proved sensitive to the structural changes occurring after the vitrification process, but insensitive to the transition between smectic phases.
Comparing the shape of bands in the SmCA* phase and in the gSmCA* state it can be noticed that the bands of ν(C–H)asym (at 2936 cm−1) and ν(C–H)sym (at 2858 cm−1) vibrations split into two partially overlapping ones (Figure 4a). Furthermore, in the glassy state, the band at 1712 cm−1 dominates over that at 1736 cm−1, in contrast to the phase SmCA*, where both bands have similar intensities (Figure 4b). Besides, the splitting and/or the change of intensity in the gSmCA* state have been observed for bands of ν(C–O–C)asym (at 1283–1264 cm−1), ν(C–O–C)asym (at 1185–1172 cm−1), in Figure 4c, and of ρ(C–H) (at 1050–680 cm−1) vibrations, in Figure 4d.
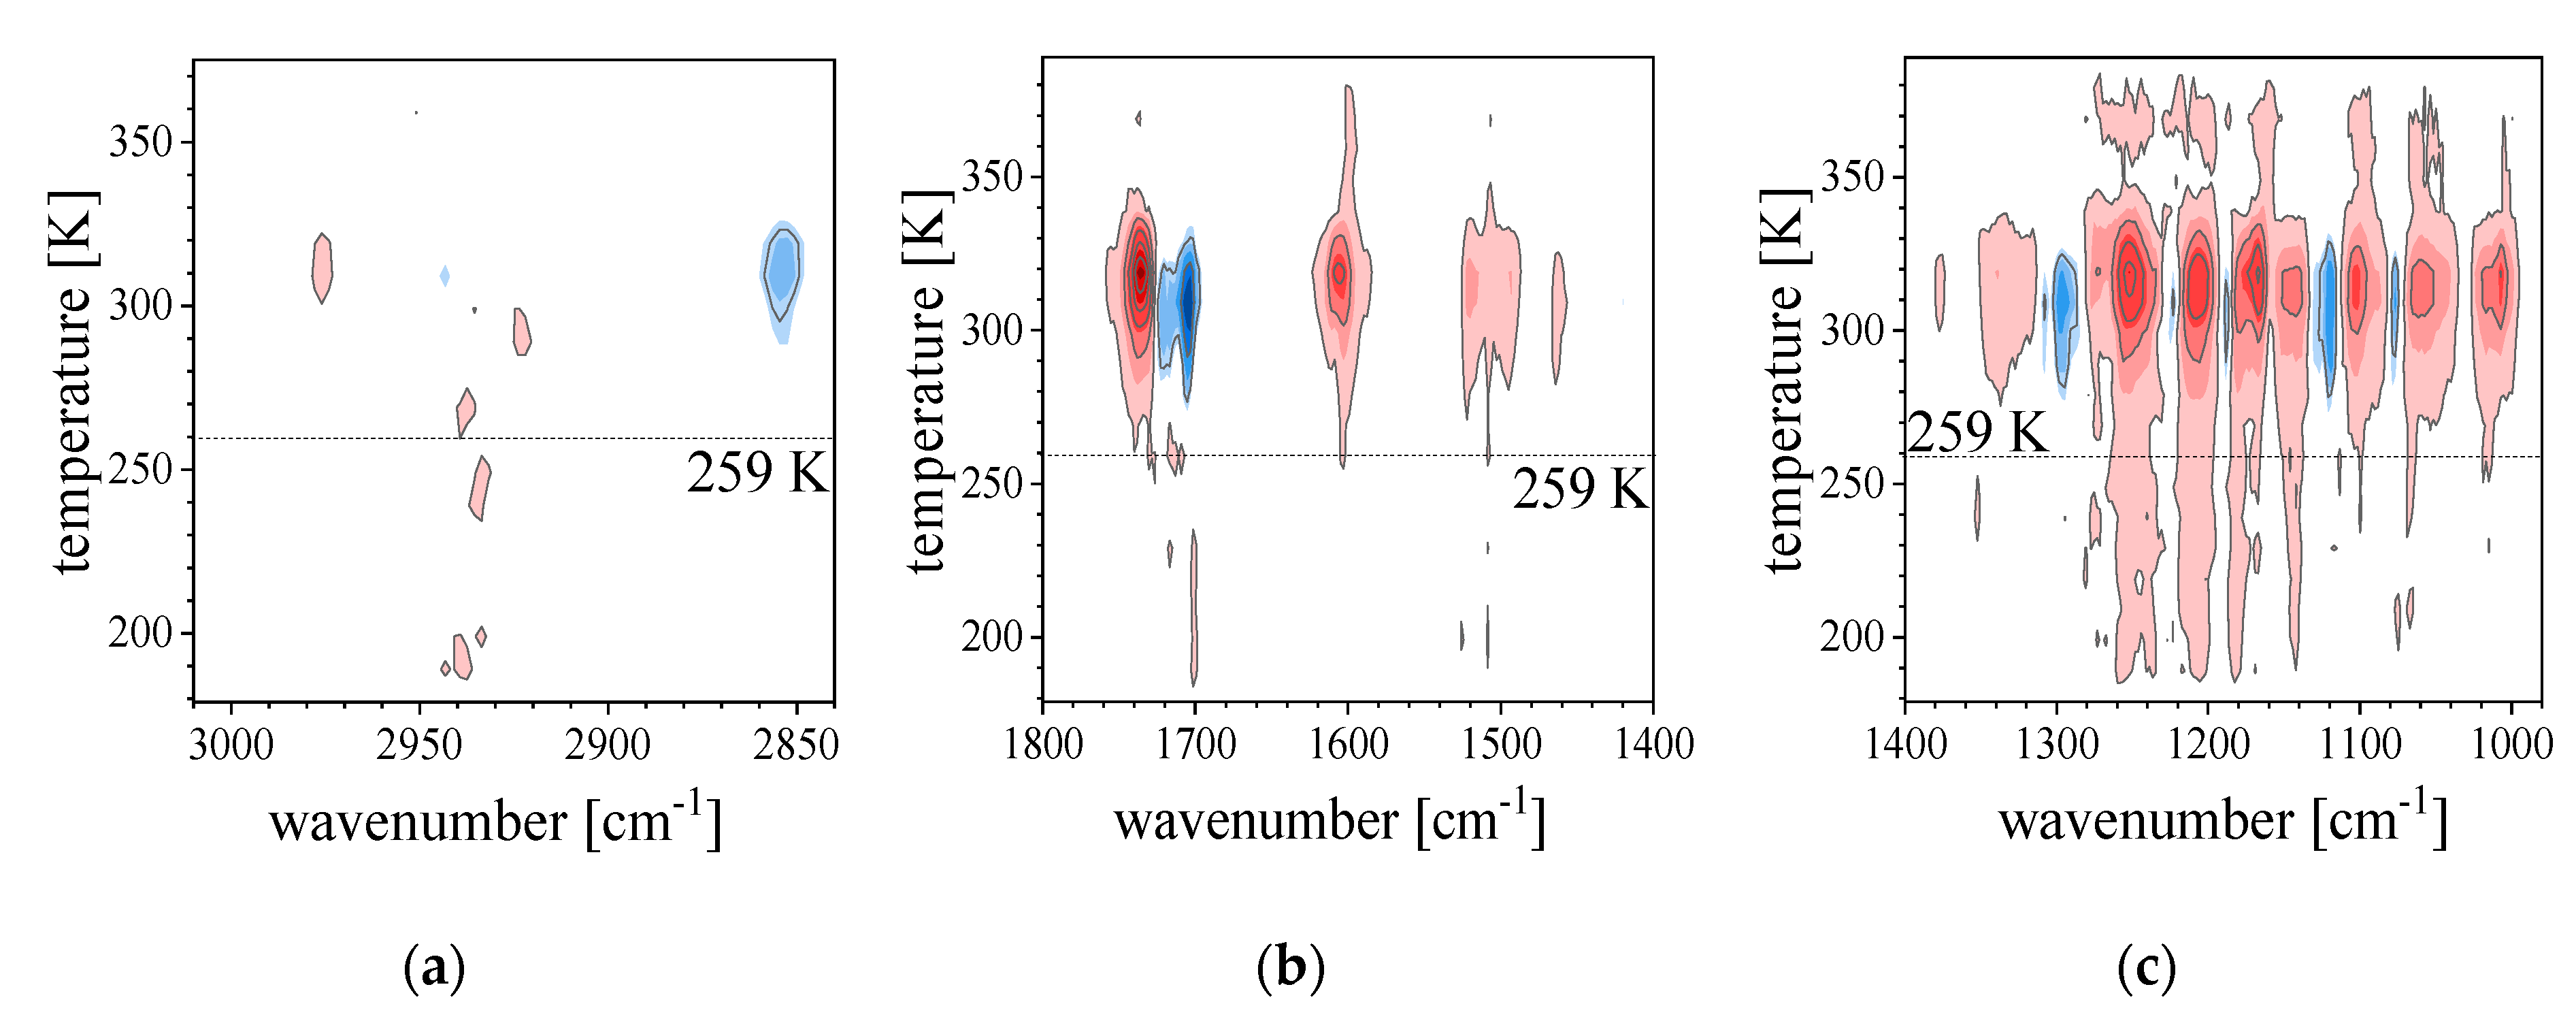
To examine how the parameters of individual absorption bands change under the influence of temperature, the PCMW2D analysis was performed. The red and blue areas in Figure 5 represent positive and negative correlation intensities, respectively. Changes in intensity between the SmCA* phase and the gSmCA* state as a result of cooling are observed on PCMW2D maps at temperatures higher than glass transition temperature , determined from DSC results [14]. These differences probably result from the nature of vitrification, which is a kinetic transition.
The ν(C–H)asym (at 2936 cm−1) band shows positive correlation peaks, while the ν(C–H)sym (at 2858 cm−1) band exhibits negative ones (Figure 5a). Also, negative correlation peaks have been assigned to βPh(C–H) bands (at 1308, 1120, 1073 cm−1). While 3F7HPhH7 is cooled to , the mobility of hydrocarbon chain segments decreases to reach the thermodynamically stable state, which is in agreement with previous observations of long hydrocarbon chains [42]. The bands of ν(C=O)core (at 1736 cm−1), ν(C–O–C)asym (at 1283–1264 cm−1) and ν(C–O–C)asym (at 1185–1172 cm−1) show positive correlation peaks in the synchronous maps, which indicates that the mobility of the C=O group in the rigid core is markedly increased at the temperature higher than (Figure 5b,c). The inverse situation is observed for the second carbonyl group ν(C=O)chiral_c. (at 1712 cm−1).
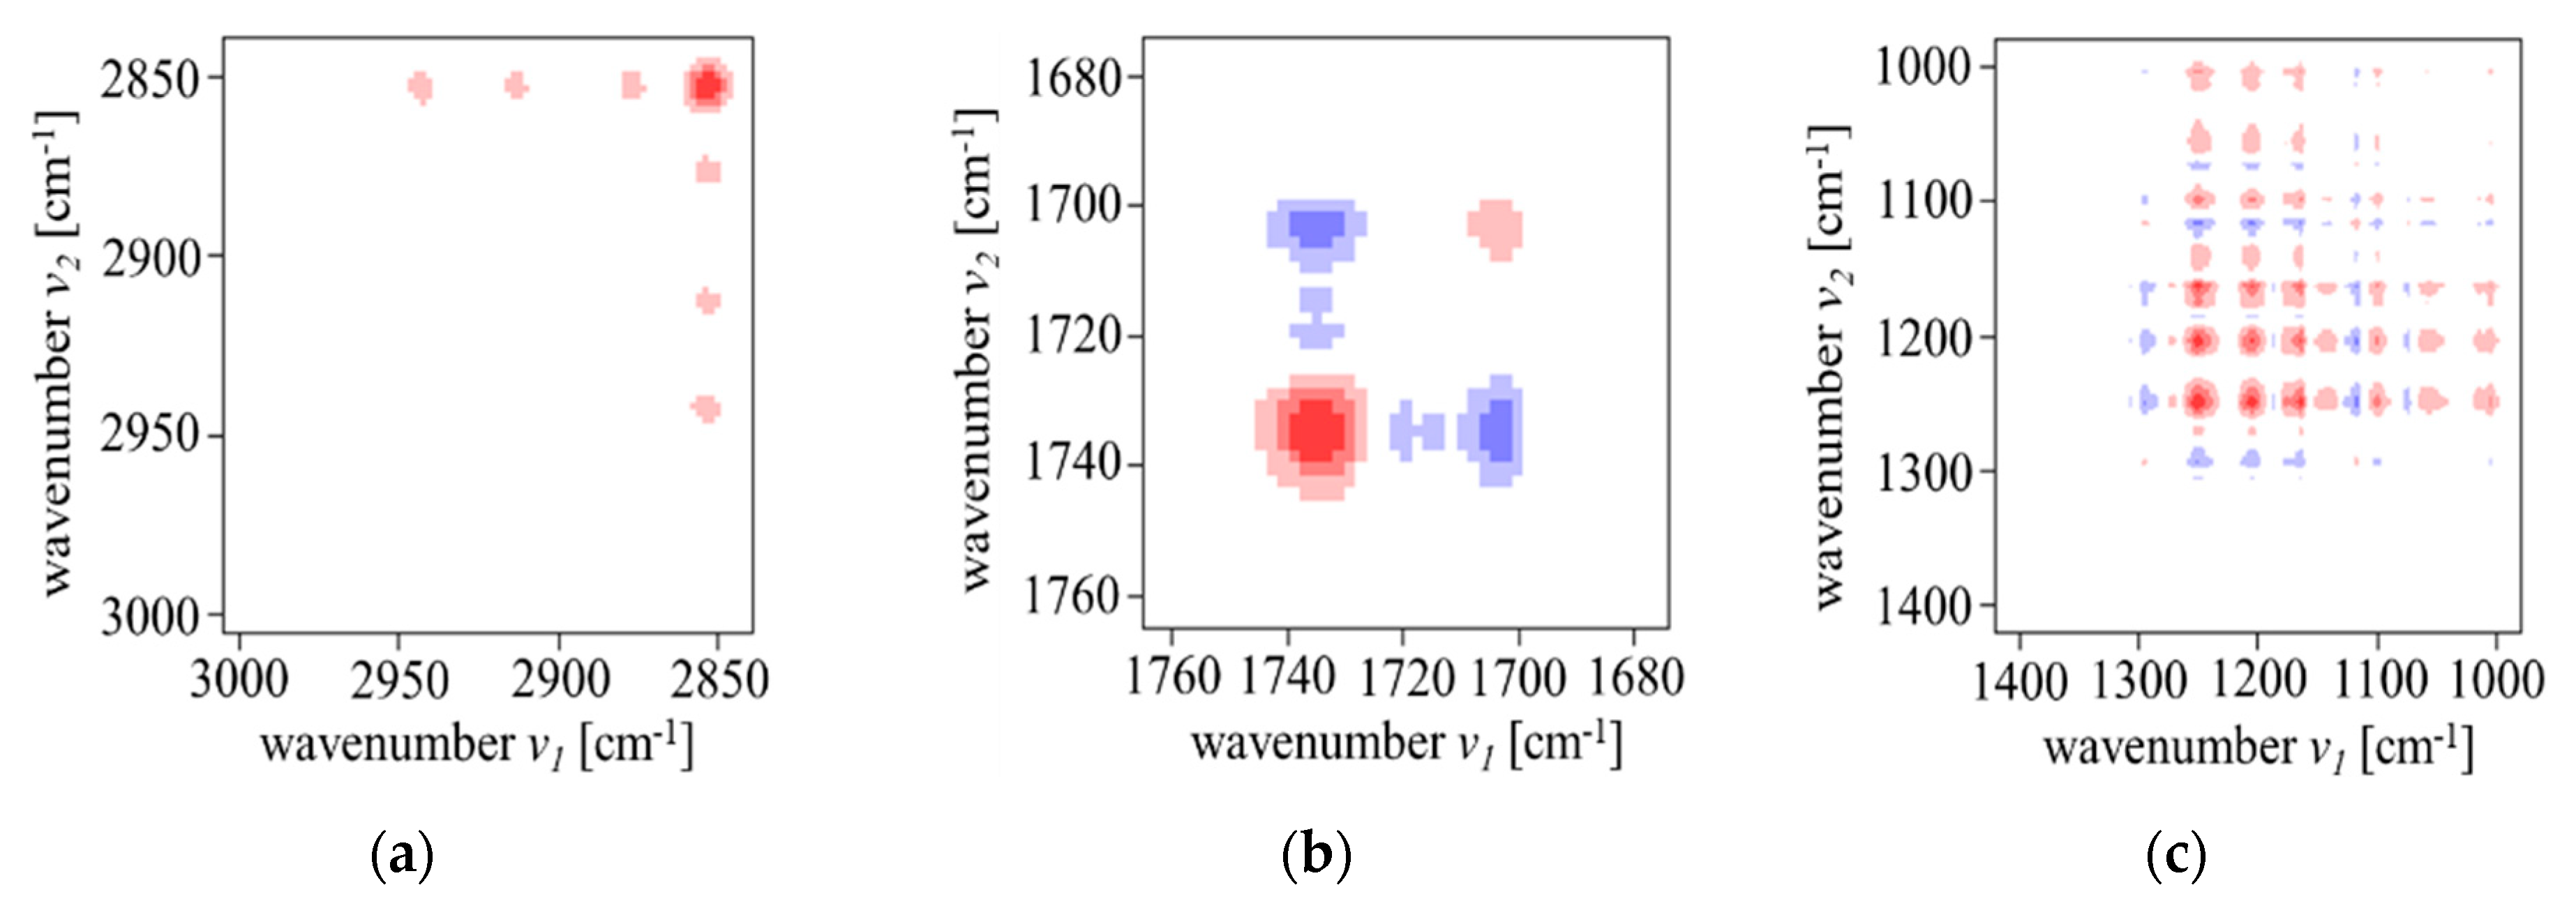
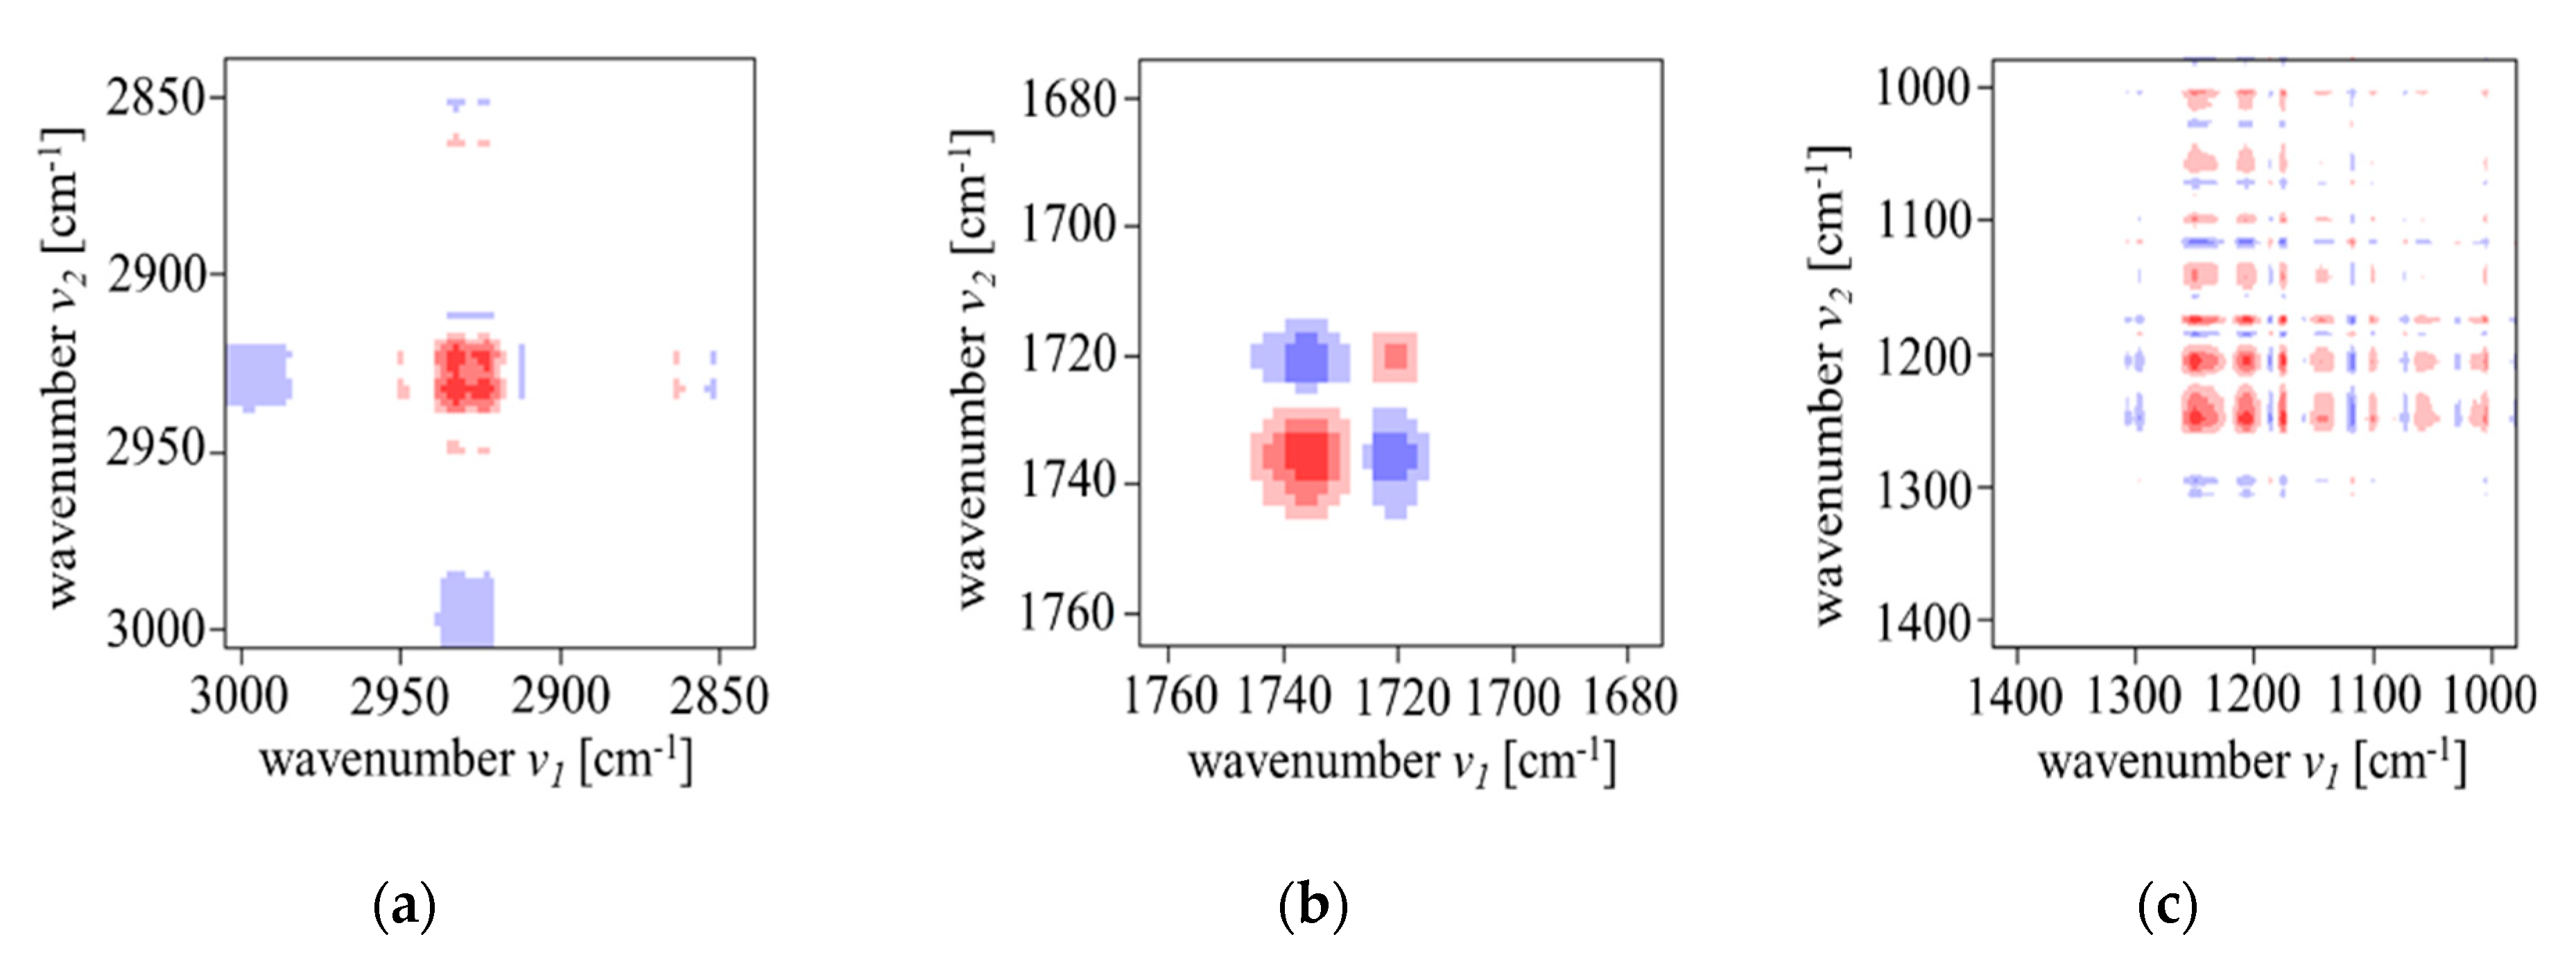
Figure 6 presents the 2D-COS correlation maps, obtained during the cooling in the temperature region from 349 to 259 K in the wavenumber regions of ν(C–H) (at 3100–2800 cm−1) vibrations, in Figure 6a, ν(C=O) (at 1800–1580 cm−1) vibrations, in Figure 6b, and ν(C–O–C) (at 1520–1050 cm−1) vibrations, in Figure 6c. Both synchronous and asynchronous maps are plotted on a plane between two independent wavenumber axes.
For all analyzed bands (except the ν(C–H)asym (at 2936 cm−1) band), the auto-peaks have been observed on the synchronous maps. The positive synchronous cross-peaks for ν(C–H)asym (at 2936 cm−1), ν(C–H)sym (at 2858 cm−1), ν(C–O–C)asym (at 1283–1264 cm−1) and ν(C–O–C)asym (at 1185–1172 cm−1) bands were visible, indicating that these bands’ intensities simultaneously increase or decrease upon cooling (Figure 6a,c). On the other hand, the negative synchronous cross-peaks for ν(C=O)core (at 1736 cm−1), ν(C=O)chiral_c. (at 1712 cm−1) and βPh(C–H) (at 1308, 1120, 1073 cm−1) bands were observed, indicating different nature of changes of bands intensities (Figure 6b,c). According to Noda’s rules, the positive asynchronous cross-peak at suggests that the change of the band intensity occurs before the change of the band intensity. In other words, the vibrations related to the band changes before that associated with the band [21]. During the SmCA*–gSmCA* transition, the ν(C–H)asym (at 2936 cm−1), ν(C=O)chiral_c. (at 1712 cm−1) and βPh(C–H) (at 1308, 1120, 1073 cm−1) vibrations have changed before the ν(C–H)sym (at 2858 cm−1), ν(C=O)core (at 1736 cm−1), ν(C–O–C)asym (at 1283–1264 cm−1) and ν(C–O–C)asym (at 1185–1172 cm−1) vibrations (Figure 6d–f), respectively.
In Figure 7, we show the 2D-COS correlation analysis in the region of 1750–1710 cm−1 vs. 3000–2840 cm−1 (Figure 7a,c) and 1750–1710 cm−1 vs. 1400–1000 cm−1 (Figure 7b,d). The analysis of asynchronous correlation maps suggests the following order of band changes: ν(C–H)asym (at 2936 cm−1), ν(C–H)sym (at 2858 cm−1) and βPh(C–H) (at 1308, 1120, 1073 cm−1) > ν(C=O)chiral_c. (at 1712 cm−1) > ν(C=O)core (at 1736 cm−1) > ν(C–O–C)asym (at 1283–1264 cm−1) and ν(C–O–C)asym (at 1185–1172 cm−1). During the vitrification process, inter- and intra-molecular stochastic movements slow down significantly or get frozen, which is visible on the absorption characteristics. From the 2D-COS data, we conclude that the vitrification process consists in changing the stochastic movements of: firstly, the ester groups, secondly, the C=O groups (because of the strong polarity and intense interaction with other polar groups [43,44]) and then, the side methyl groups (because of the higher mobility).
3.3. Heating after Slow Cooling
After cooling with the rate of 2 K/min, the sample was heated with the same rate to check how the parameters of previously analyzed bands change during the cold crystallization and other phase transitions of 3F7HPhH7. It turned out that when heating the sample after slow cooling, no changes in the characteristics of the absorption bands on the FTIR spectra could be seen in the range corresponding to the cold crystallization or the transitions between smectic phases. However, a change in the intensity of the analyzed bands was visible during transition from the crystal phase to the SmCA* phase (Figure A1, Appendix A). This effect was observed on infrared spectra at temperatures higher than the Cr–SmCA* transition temperature determined by DSC [14]. The reason is that the DSC technique measures the heat flow during the crystallization of the sample, while FTIR spectroscopy is sensitive to a local molecular environment.
The PCMW2D synchronous analysis shows positive correlation peaks for ν(C–H)asym (at 2936 cm−1), ν(C=O)core (at 1736 cm−1), ν(C–O–C)asym (at 1283–1264 cm−1) and ν(C–O–C)asym (at 1185–1172 cm−1) bands, while for ν(C–H)sym (at 2858 cm−1), ν(C=O)chiral_c. (at 1712 cm−1) and βPh(C–H) (at 1308, 1120, 1073 cm−1) bands the correlation is negative (Figure A2, Appendix A), in the region of Cr–SmCA* transition. The diverse nature of the changes testifies that this transition is a complex phenomenon. The absorption band characteristics of analyzed parts of 3F7HPhH7 molecule (alkoxy tails, ester bridges and phenyl rings) are sensitive to the studied phase transition.
The 2D-COS analysis has been performed in the temperature region of Cr–SmCA* transition (Figure A3, Appendix A). On the synchronous maps, the auto-peaks from all bands analyzed (except the ν(C–H)asym (at 2936 cm−1) band) were visible, so these bands dominantly change in the investigated temperature ranges. Like in the cooling cycle, here, also the positive synchronous cross-peaks were observed for ν(C–H)asym (at 2936 cm−1), ν(C–H)sym (at 2858 cm−1), ν(C–O–C)asym (at 1283–1264 cm−1) and ν(C–O–C)asym (at 1185–1172 cm−1) bands and negative synchronous cross-peaks for ν(C=O)core (at 1736 cm−1), ν(C=O)chiral_c. (at 1712 cm−1) and βPh(C–H) (at 1308, 1120, 1073 cm−1) bands. On the asynchronous maps, the ν(C–H)sym (at 2858 cm−1) vibrations changed before the ν(C–H)asym (at 2936 cm−1) vibrations.
3.4. Heating After Fast Cooling
During heating with the rate of 2 K/min (after previous fast cooling with the rate of 10 K/min), cold crystallization from the gSmCA* state occurs before the Cr–SmCA* transition, known from the heating after slow cooling. Both are associated with the changes in the FTIR spectra. Those corresponding to the cold crystallization were observed at temperatures lower than determined by DSC [14]. The reason is that the DSC responds to the three-dimensional order of the crystal structure, whereas the FTIR technique is sensitive to the short-range correlations that show up in the degree to which a given vibrational mode is coupled to adjacent vibrations or affected by a local mean field created by neighboring molecules.
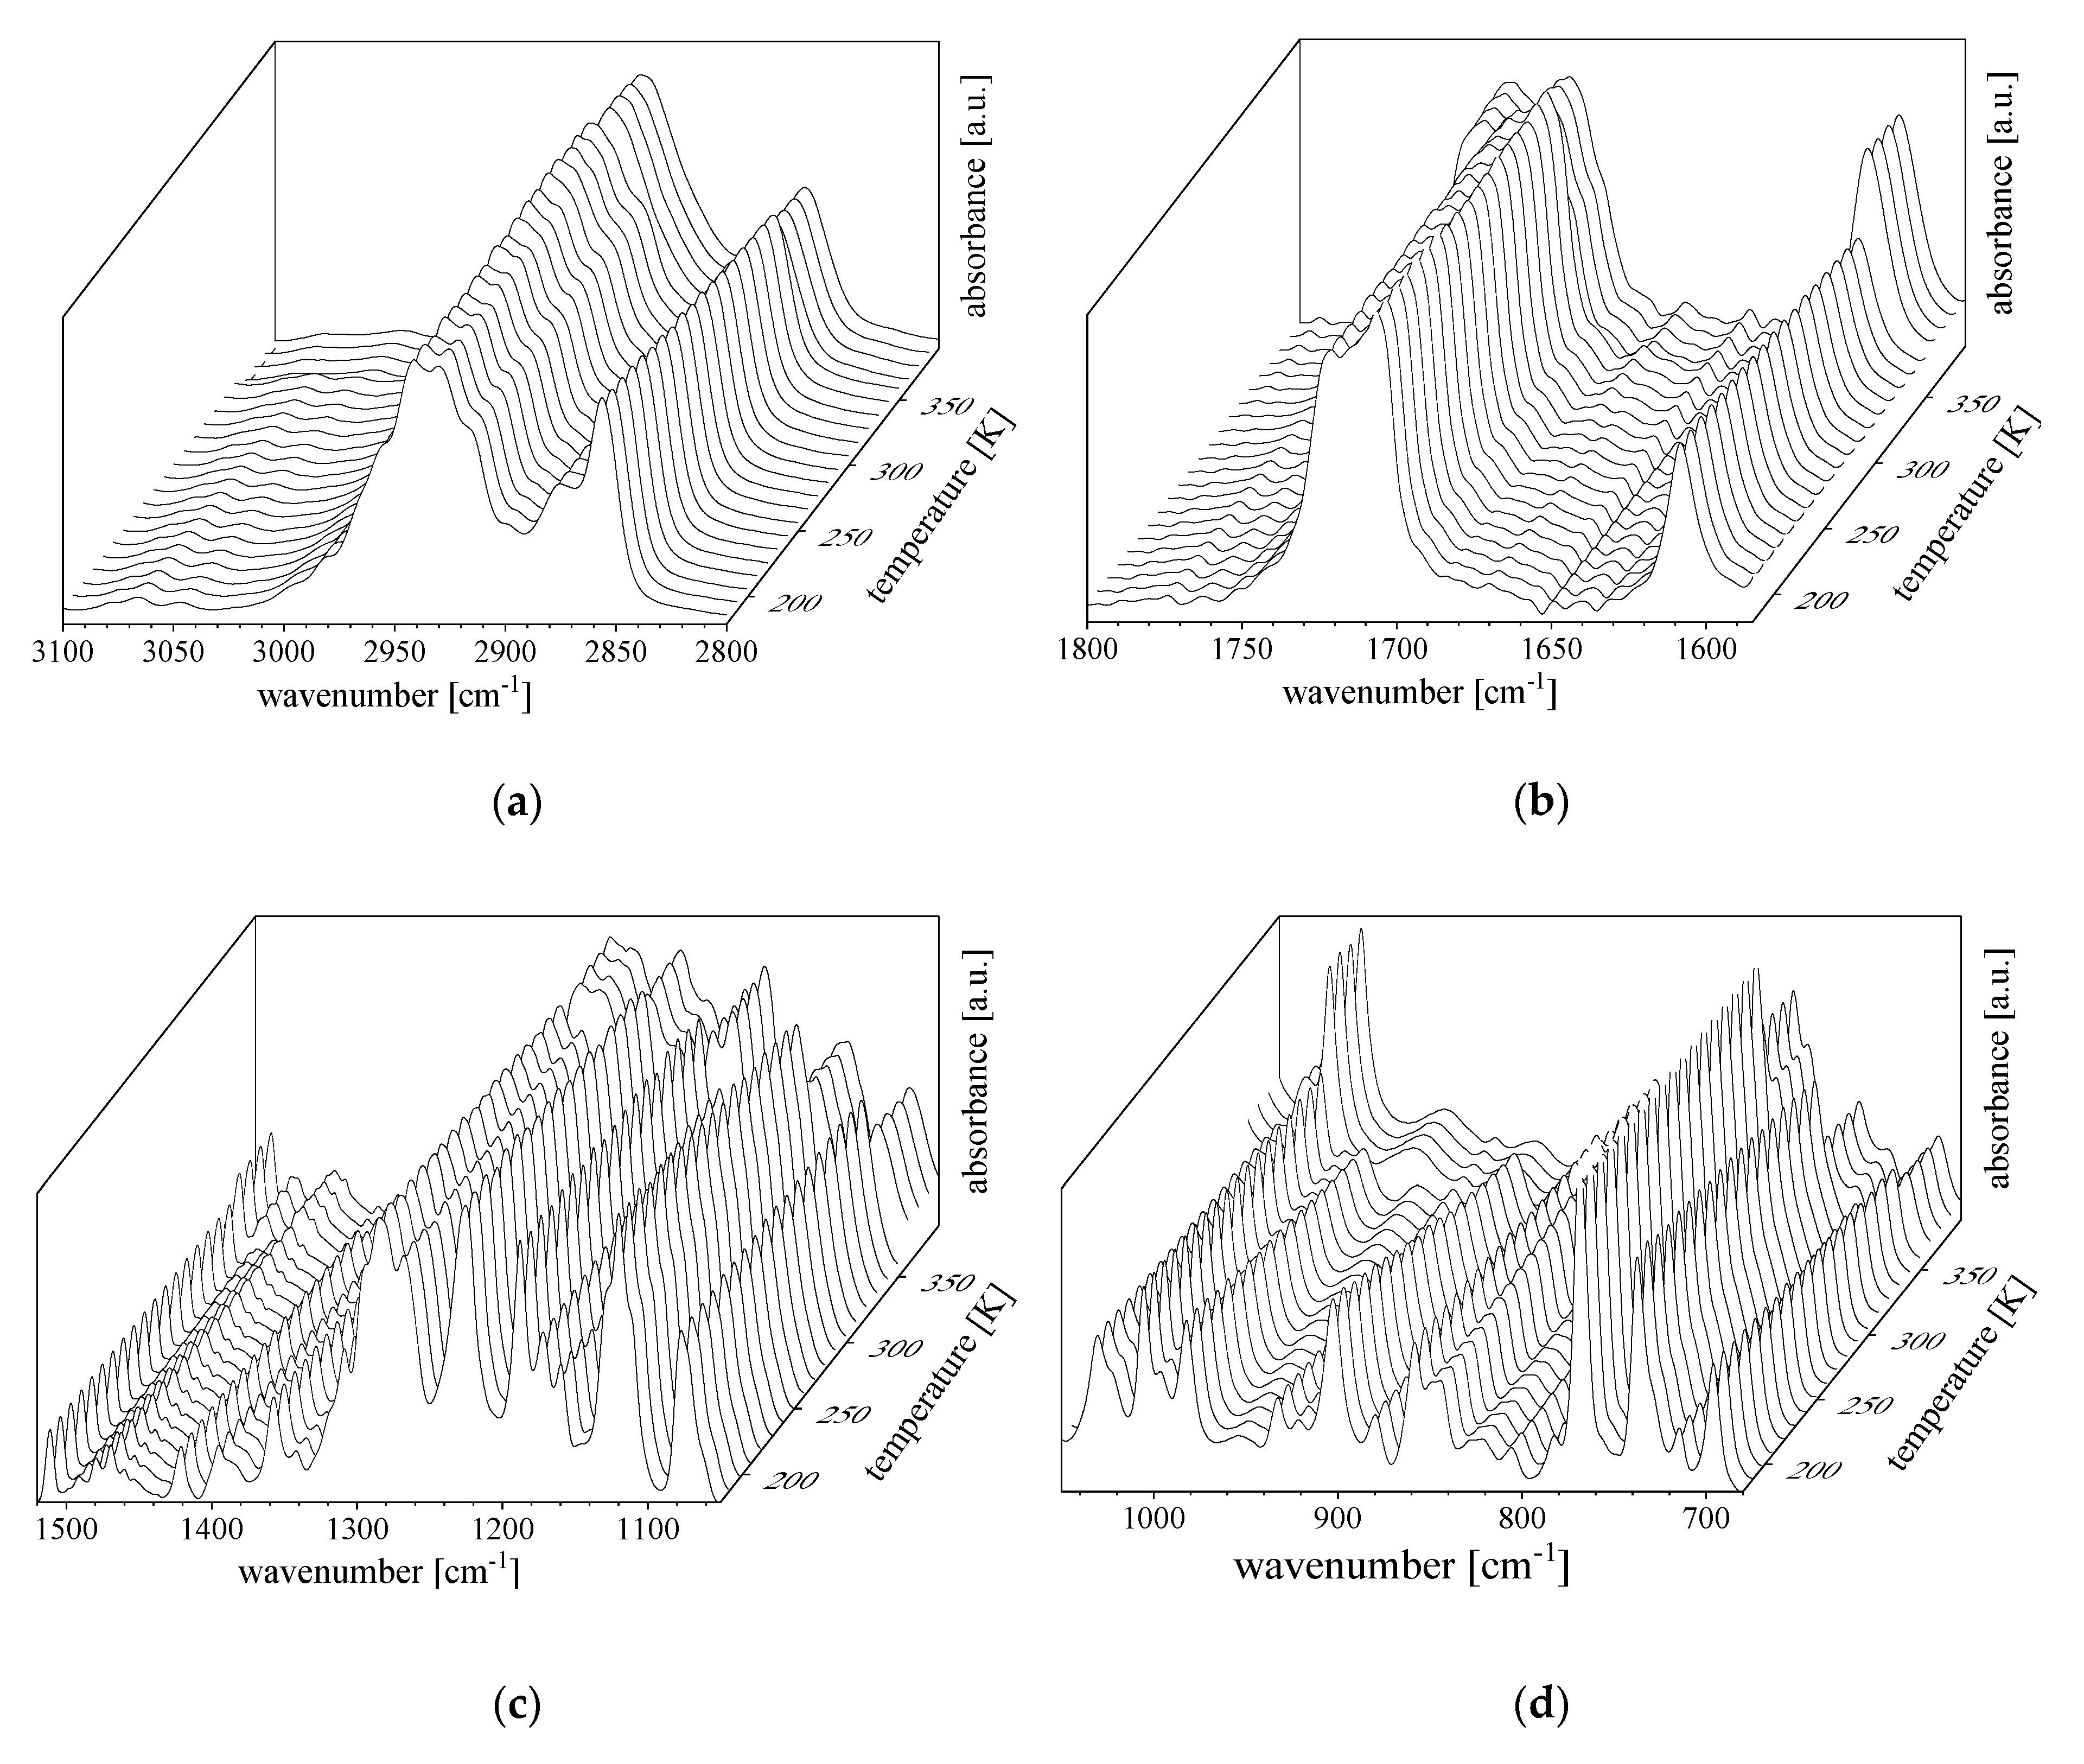
As the changes in absorption bands visible during the transition from the crystal phase to the SmCA* phase are similar to those described earlier for the heating after slow cooling, here, we focus only on the cold crystallization from the gSmCA* state. The splitting and/or the change of intensity during the cold crystallization have been observed in the wavenumber regions of ν(C–H) (at 3100–2800 cm−1), in Figure 8a, ν(C=O) (at 1800–1580 cm−1), in Figure 8b, ν(C–O–C) (at 1520–1050 cm−1), in Figure 8c, and ρ(C–H) (at 1050–680 cm−1) vibrations, in Figure 8d. The observed changes may be explained by the sensitivity of C–H, C=O and C–O vibrations to the short-range order of molecules, which is first built up during the crystallization proceeds.
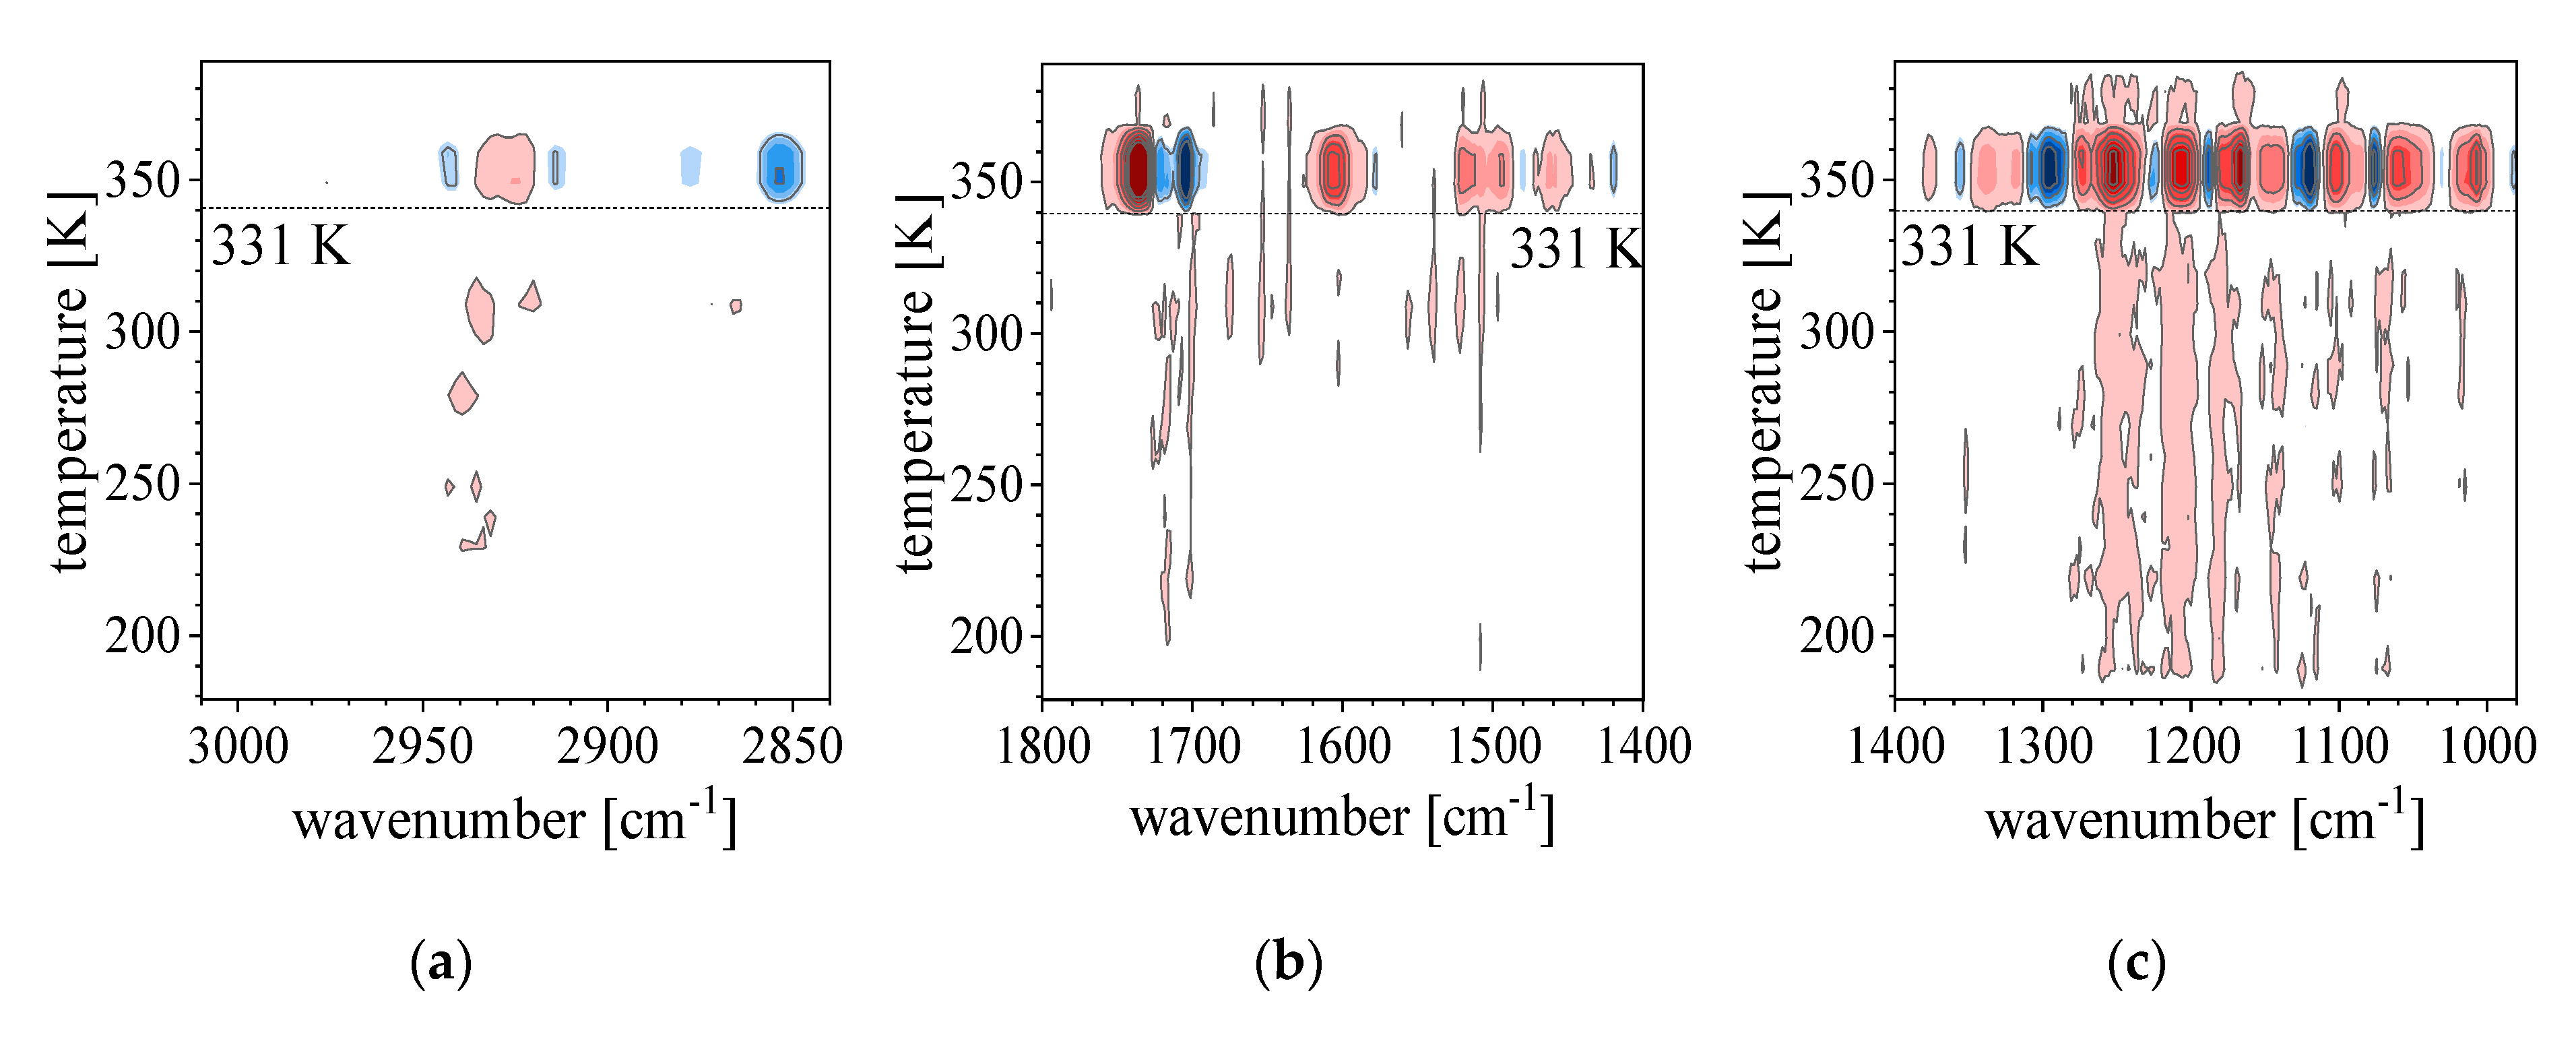
The FTIR spectra respond to the cold crystallization of the sample, which is evidenced on the PCMW2D maps as a feature at approximately 261 K. On these graphs, the positive correlation peaks appear for ν(C–H)sym (at 2858 cm−1), ν(C=O)chiral_c. (at 1712 cm−1) and βPh(C–H) (at 1308, 1120, 1073 cm−1) bands, and the negative ones for ν(C–H)asym (at 2936 cm−1), ν(C=O)core (at 1736 cm−1), ν(C–O–C)asym (at 1283–1264 cm−1) and ν(C–O–C)asym (at 1185–1172 cm−1) bands (Figure 9). It may be concluded that the characteristics of absorption bands of C–H, C=O and C–O–C vibrations of 3F7HPhH7 molecule are sensitive to cold crystallization, as in the case of the previously mentioned Cr–SmCA* transition, although in a different way.
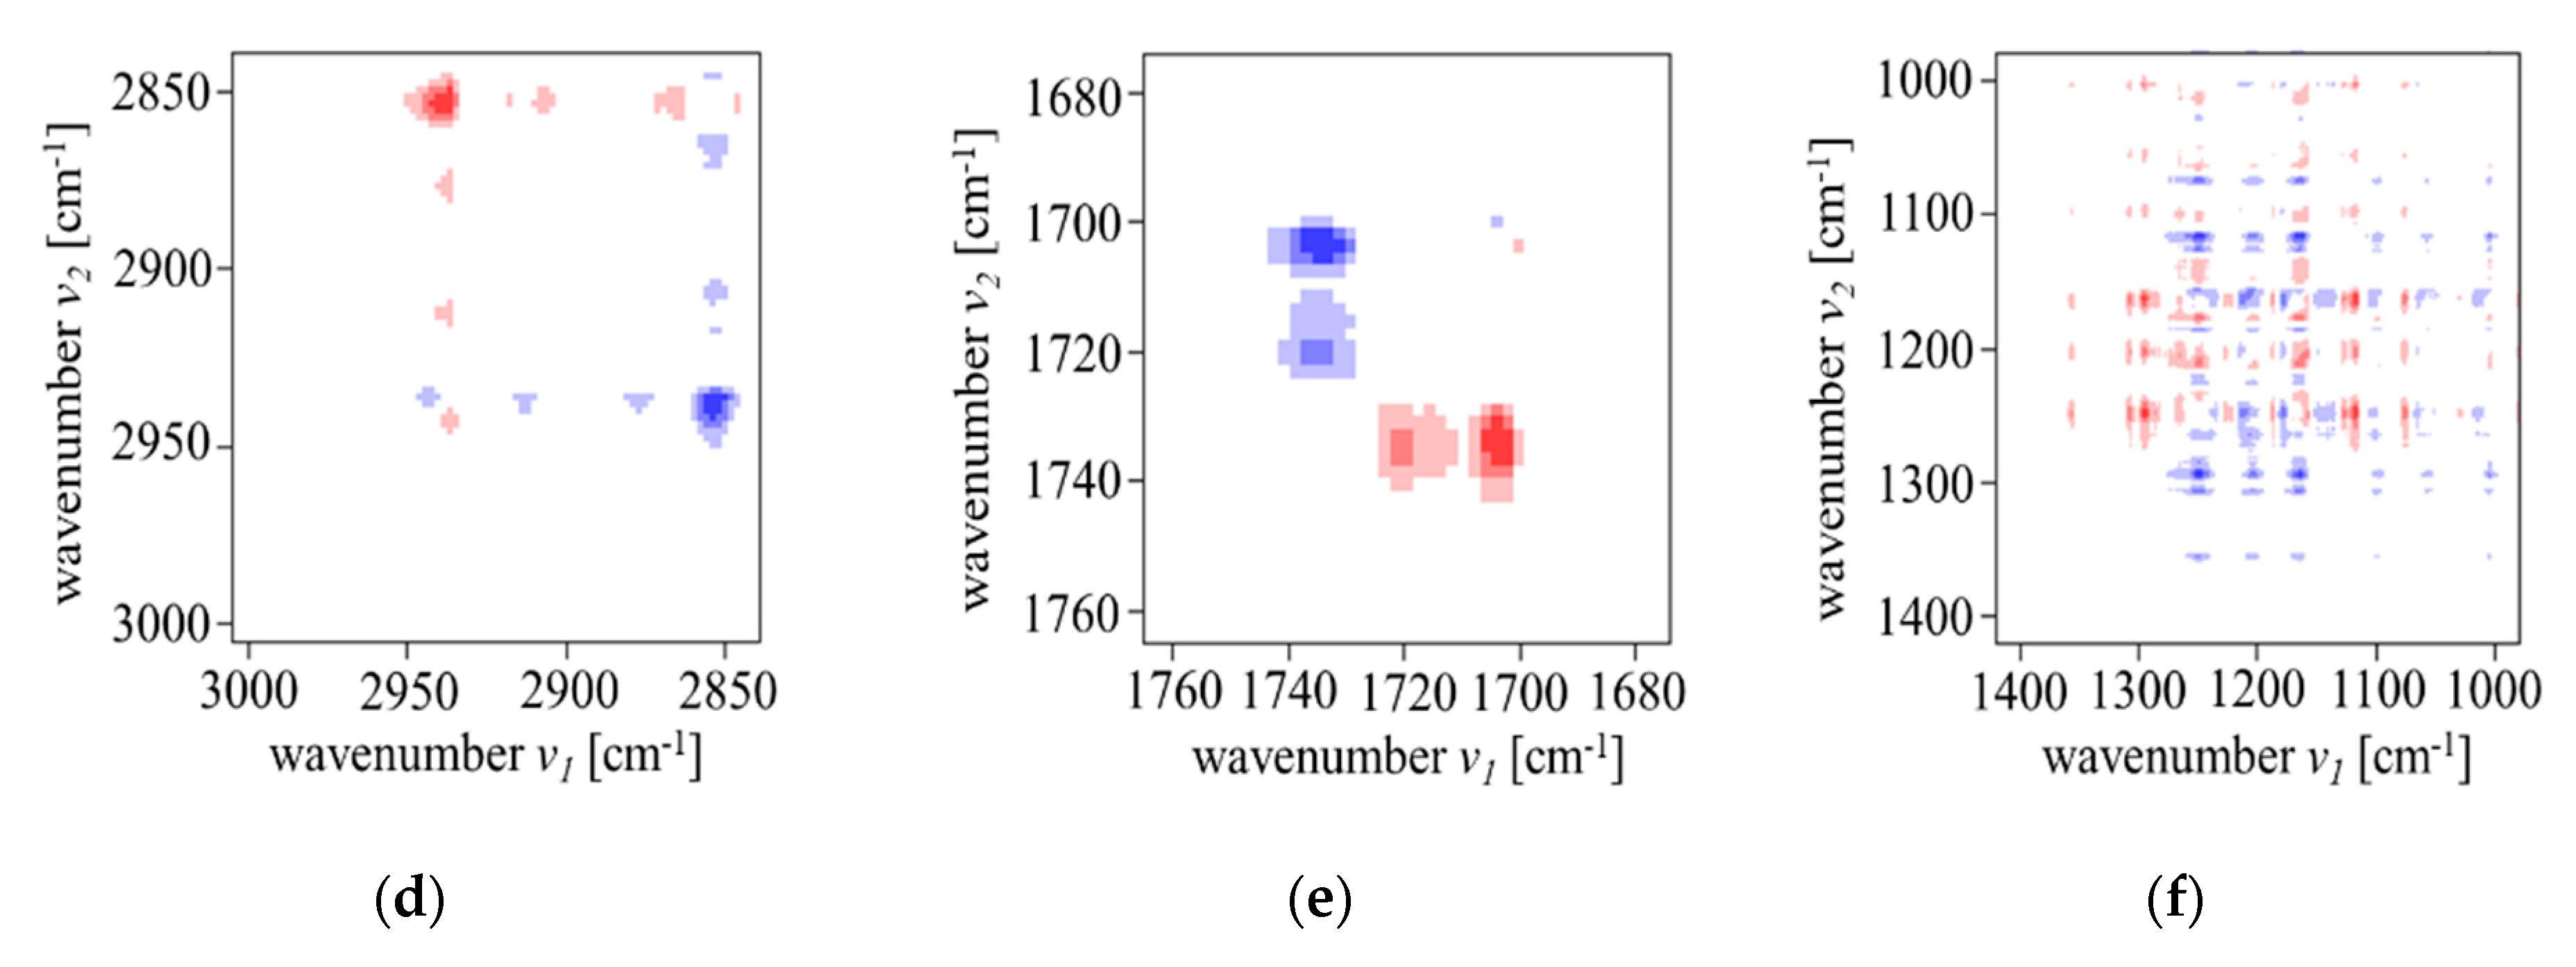
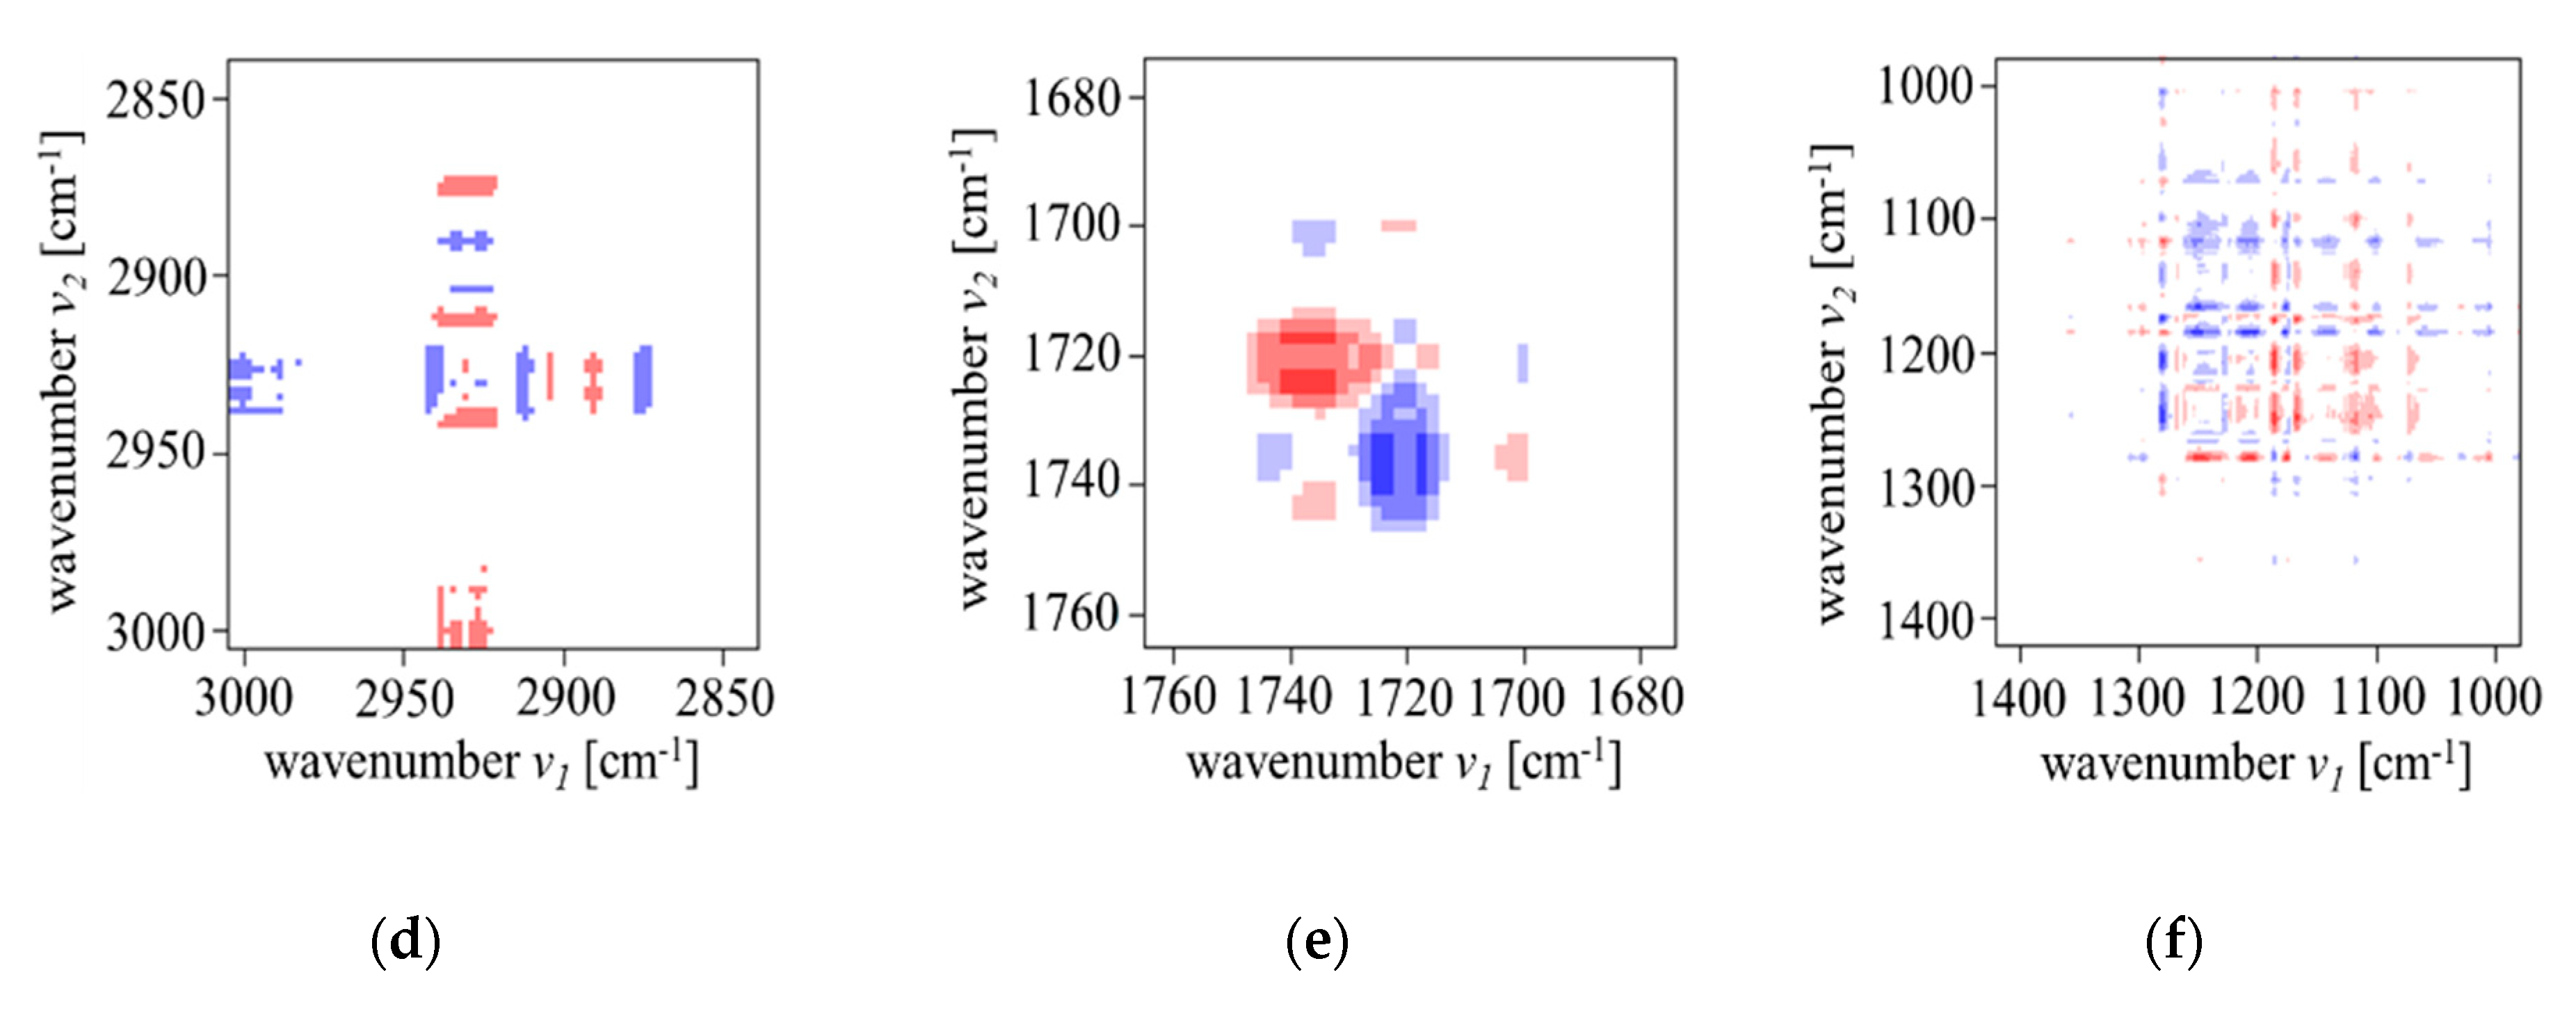
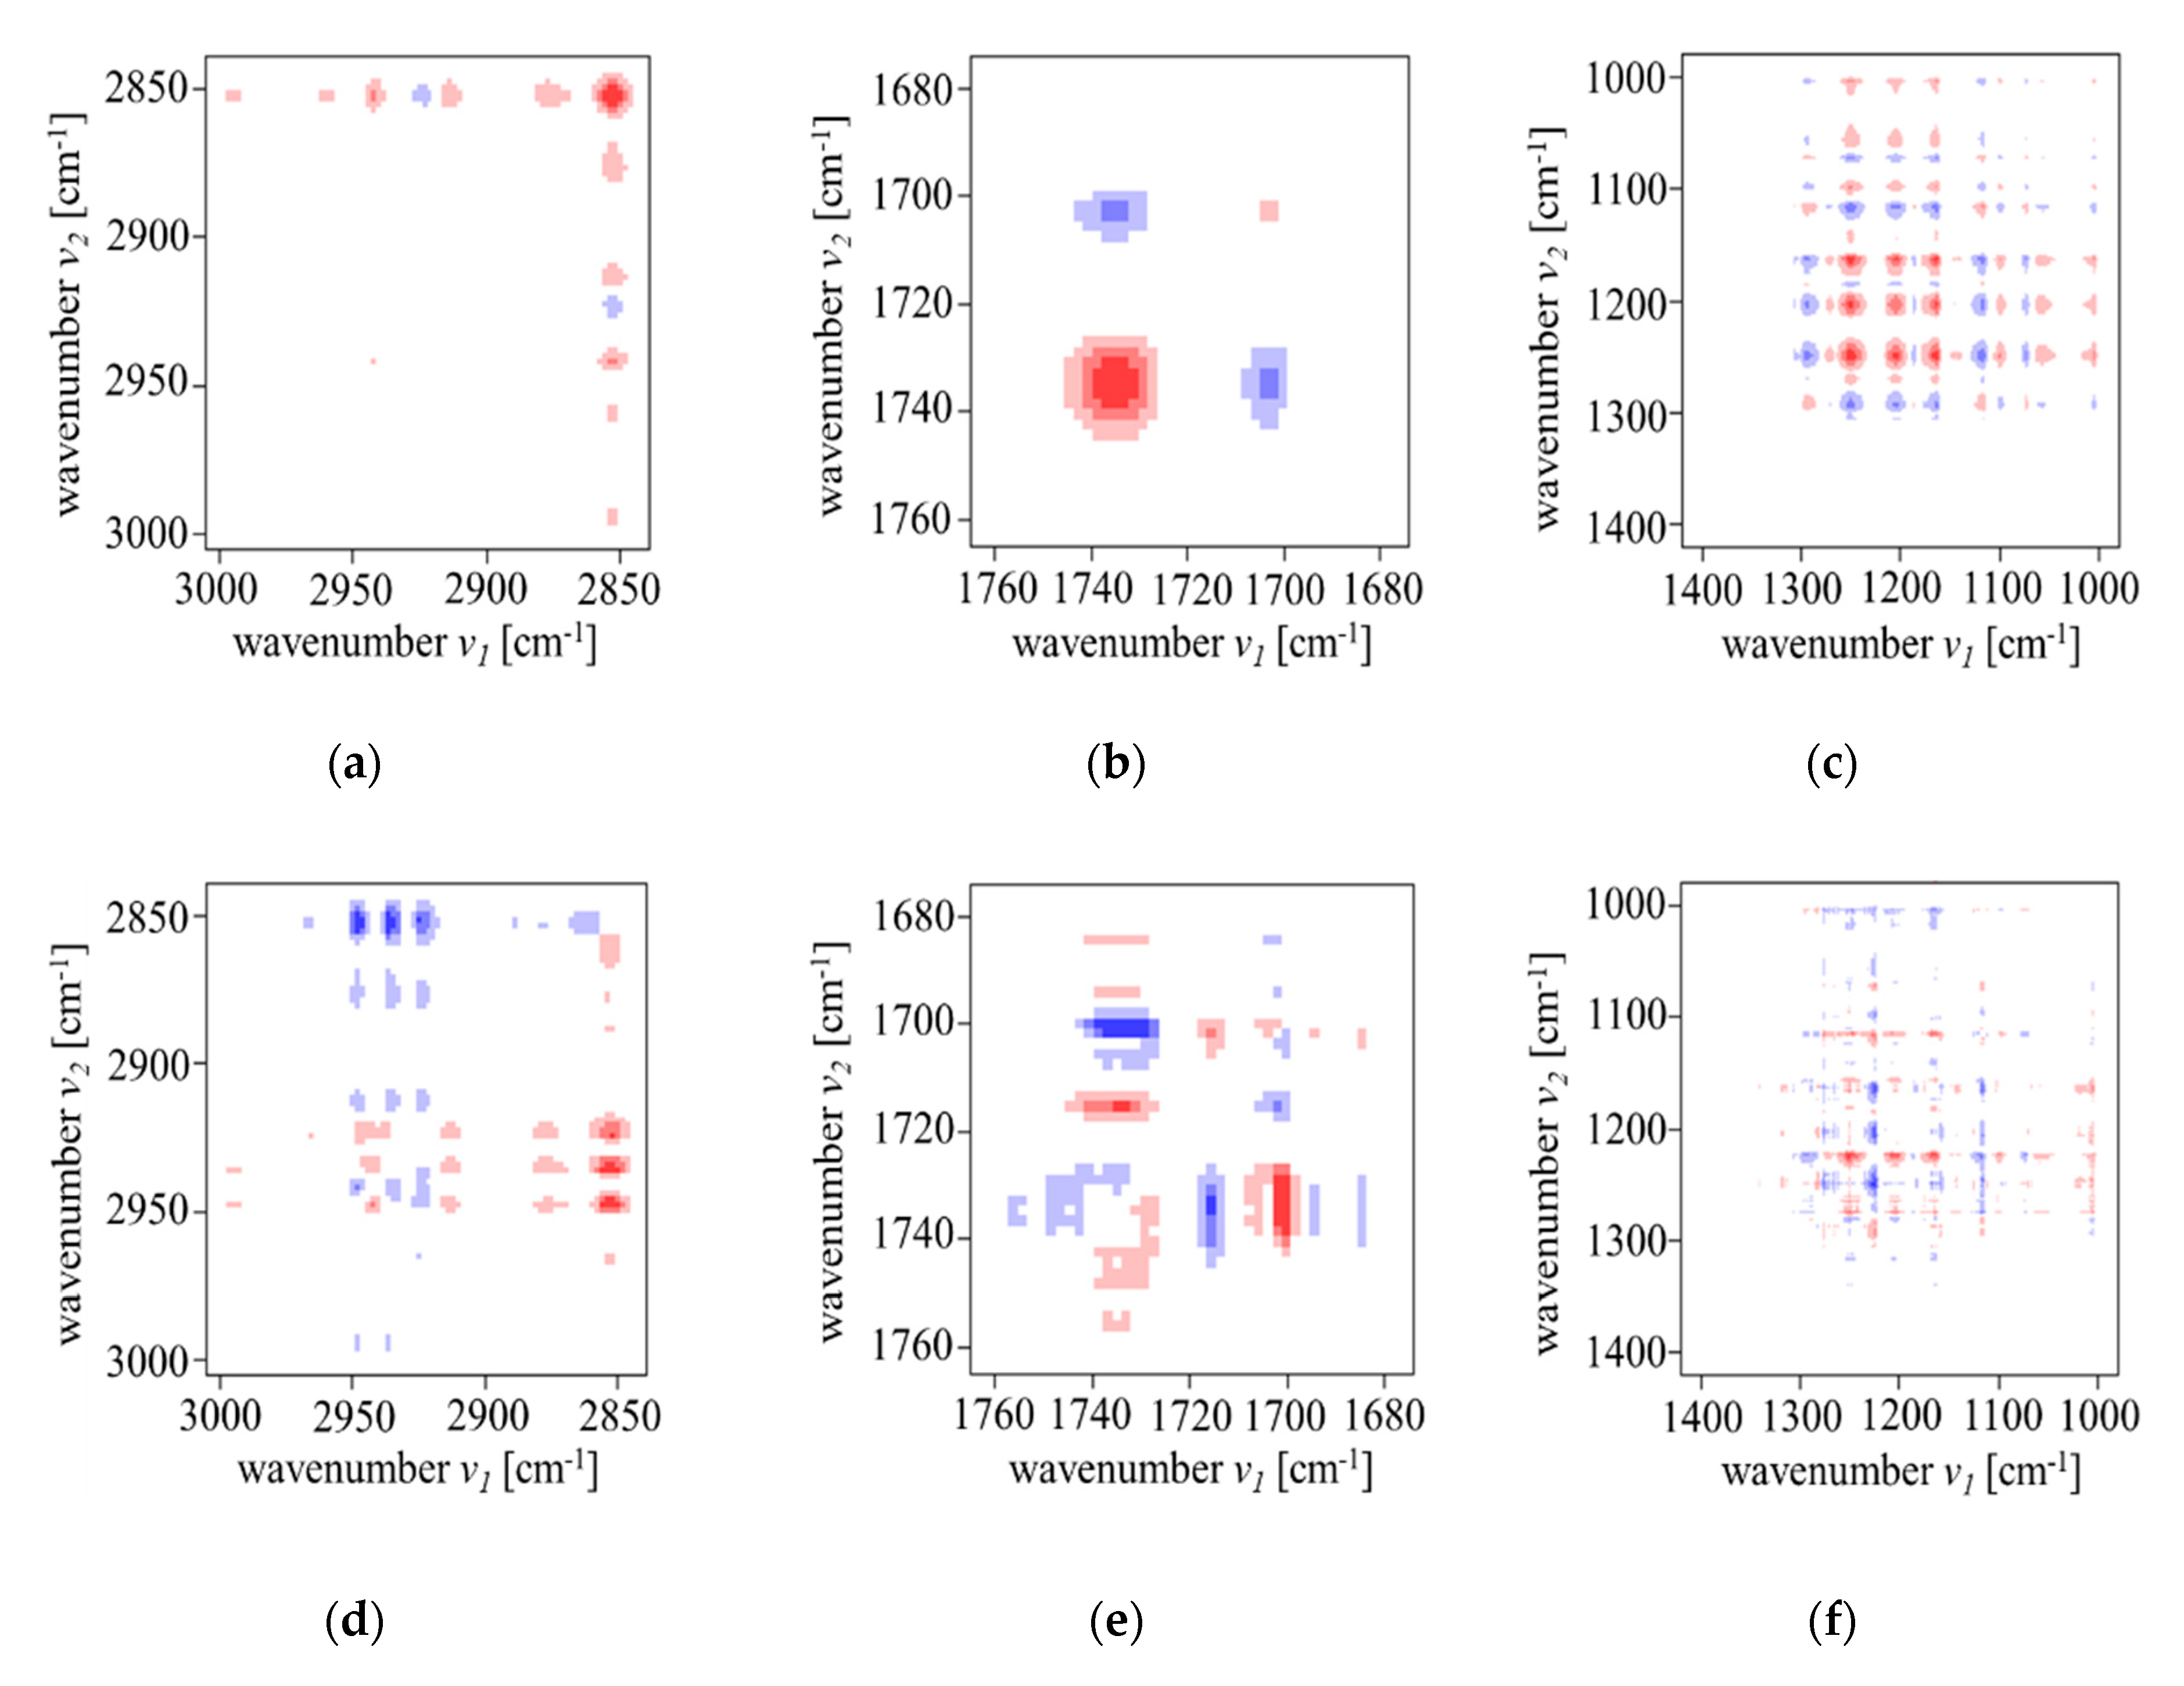
In order to analyze, in more detail, the influence of cold crystallization on the molecular vibrations of 3F7HPhH7, 2D-COS analysis was performed. On the synchronous maps, the auto-peaks were present for all analyzed bands (except the ν(C–H)sym (at 2858 cm−1) band). The positive synchronous cross-peaks were observed for ν(C–H)asym (at 2936 cm−1), ν(C–H)sym (at 2858 cm−1), ν(C–O–C)asym (at 1283–1264 cm−1) and ν(C–O–C)asym (at 1185–1172 cm−1) bands (Figure 10a,c), while the negative ones for ν(C=O)core (at 1736 cm−1), ν(C=O)chiral_c. (at 1712 cm−1) and βPh(C–H) (at 1308, 1120, 1073 cm−1) bands (Figure 10b,c). On the asynchronous maps, the so-called “butterfly pattern” appeared in the C=O stretching region (Figure 10e). Usually, the appearance of such a pattern in an asynchronous map is attributed to a peak shift combined with the intensity changes [45,46]. Moreover, the ν(C–H)asym (at 2936 cm−1) and βPh(C–H) (at 1308, 1120, 1073 cm−1) vibrations changed before the ν(C–H)sym (at 2858 cm−1), ν(C–O–C)asym (at 1283–1264 cm−1) and ν(C–O–C)asym (at 1185–1172 cm−1) vibrations (Figure 10d,f), respectively.
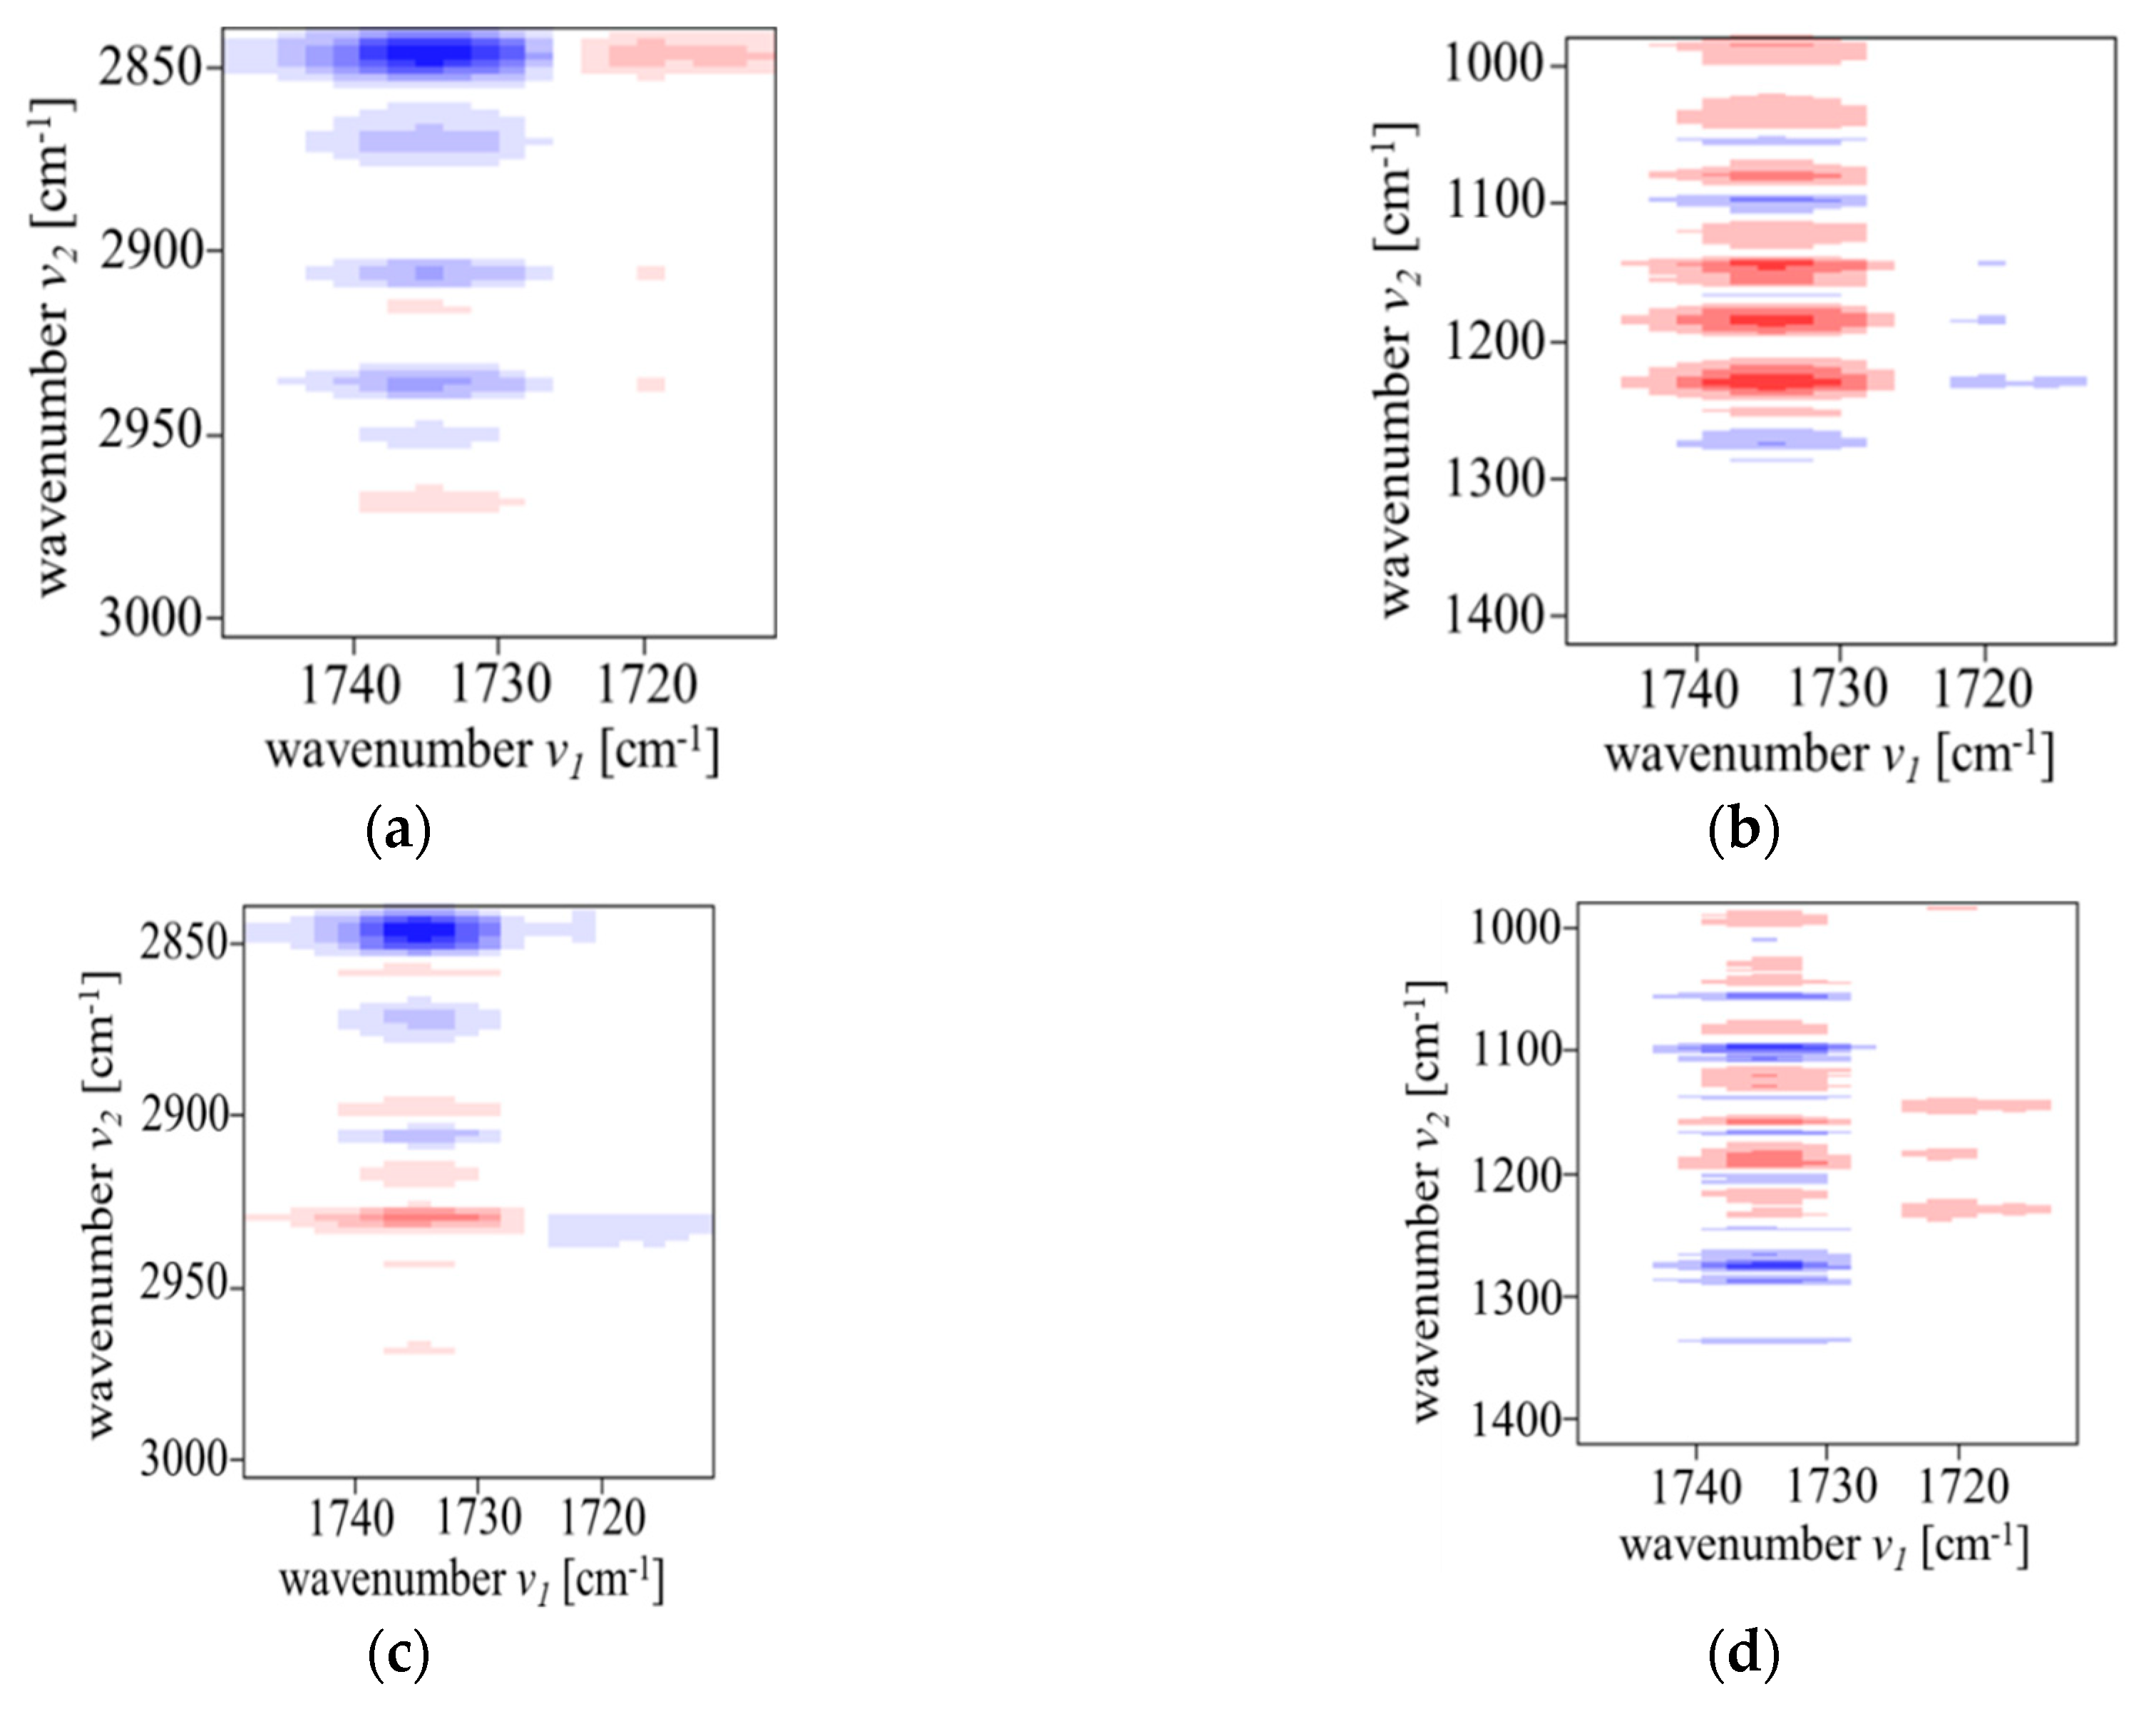
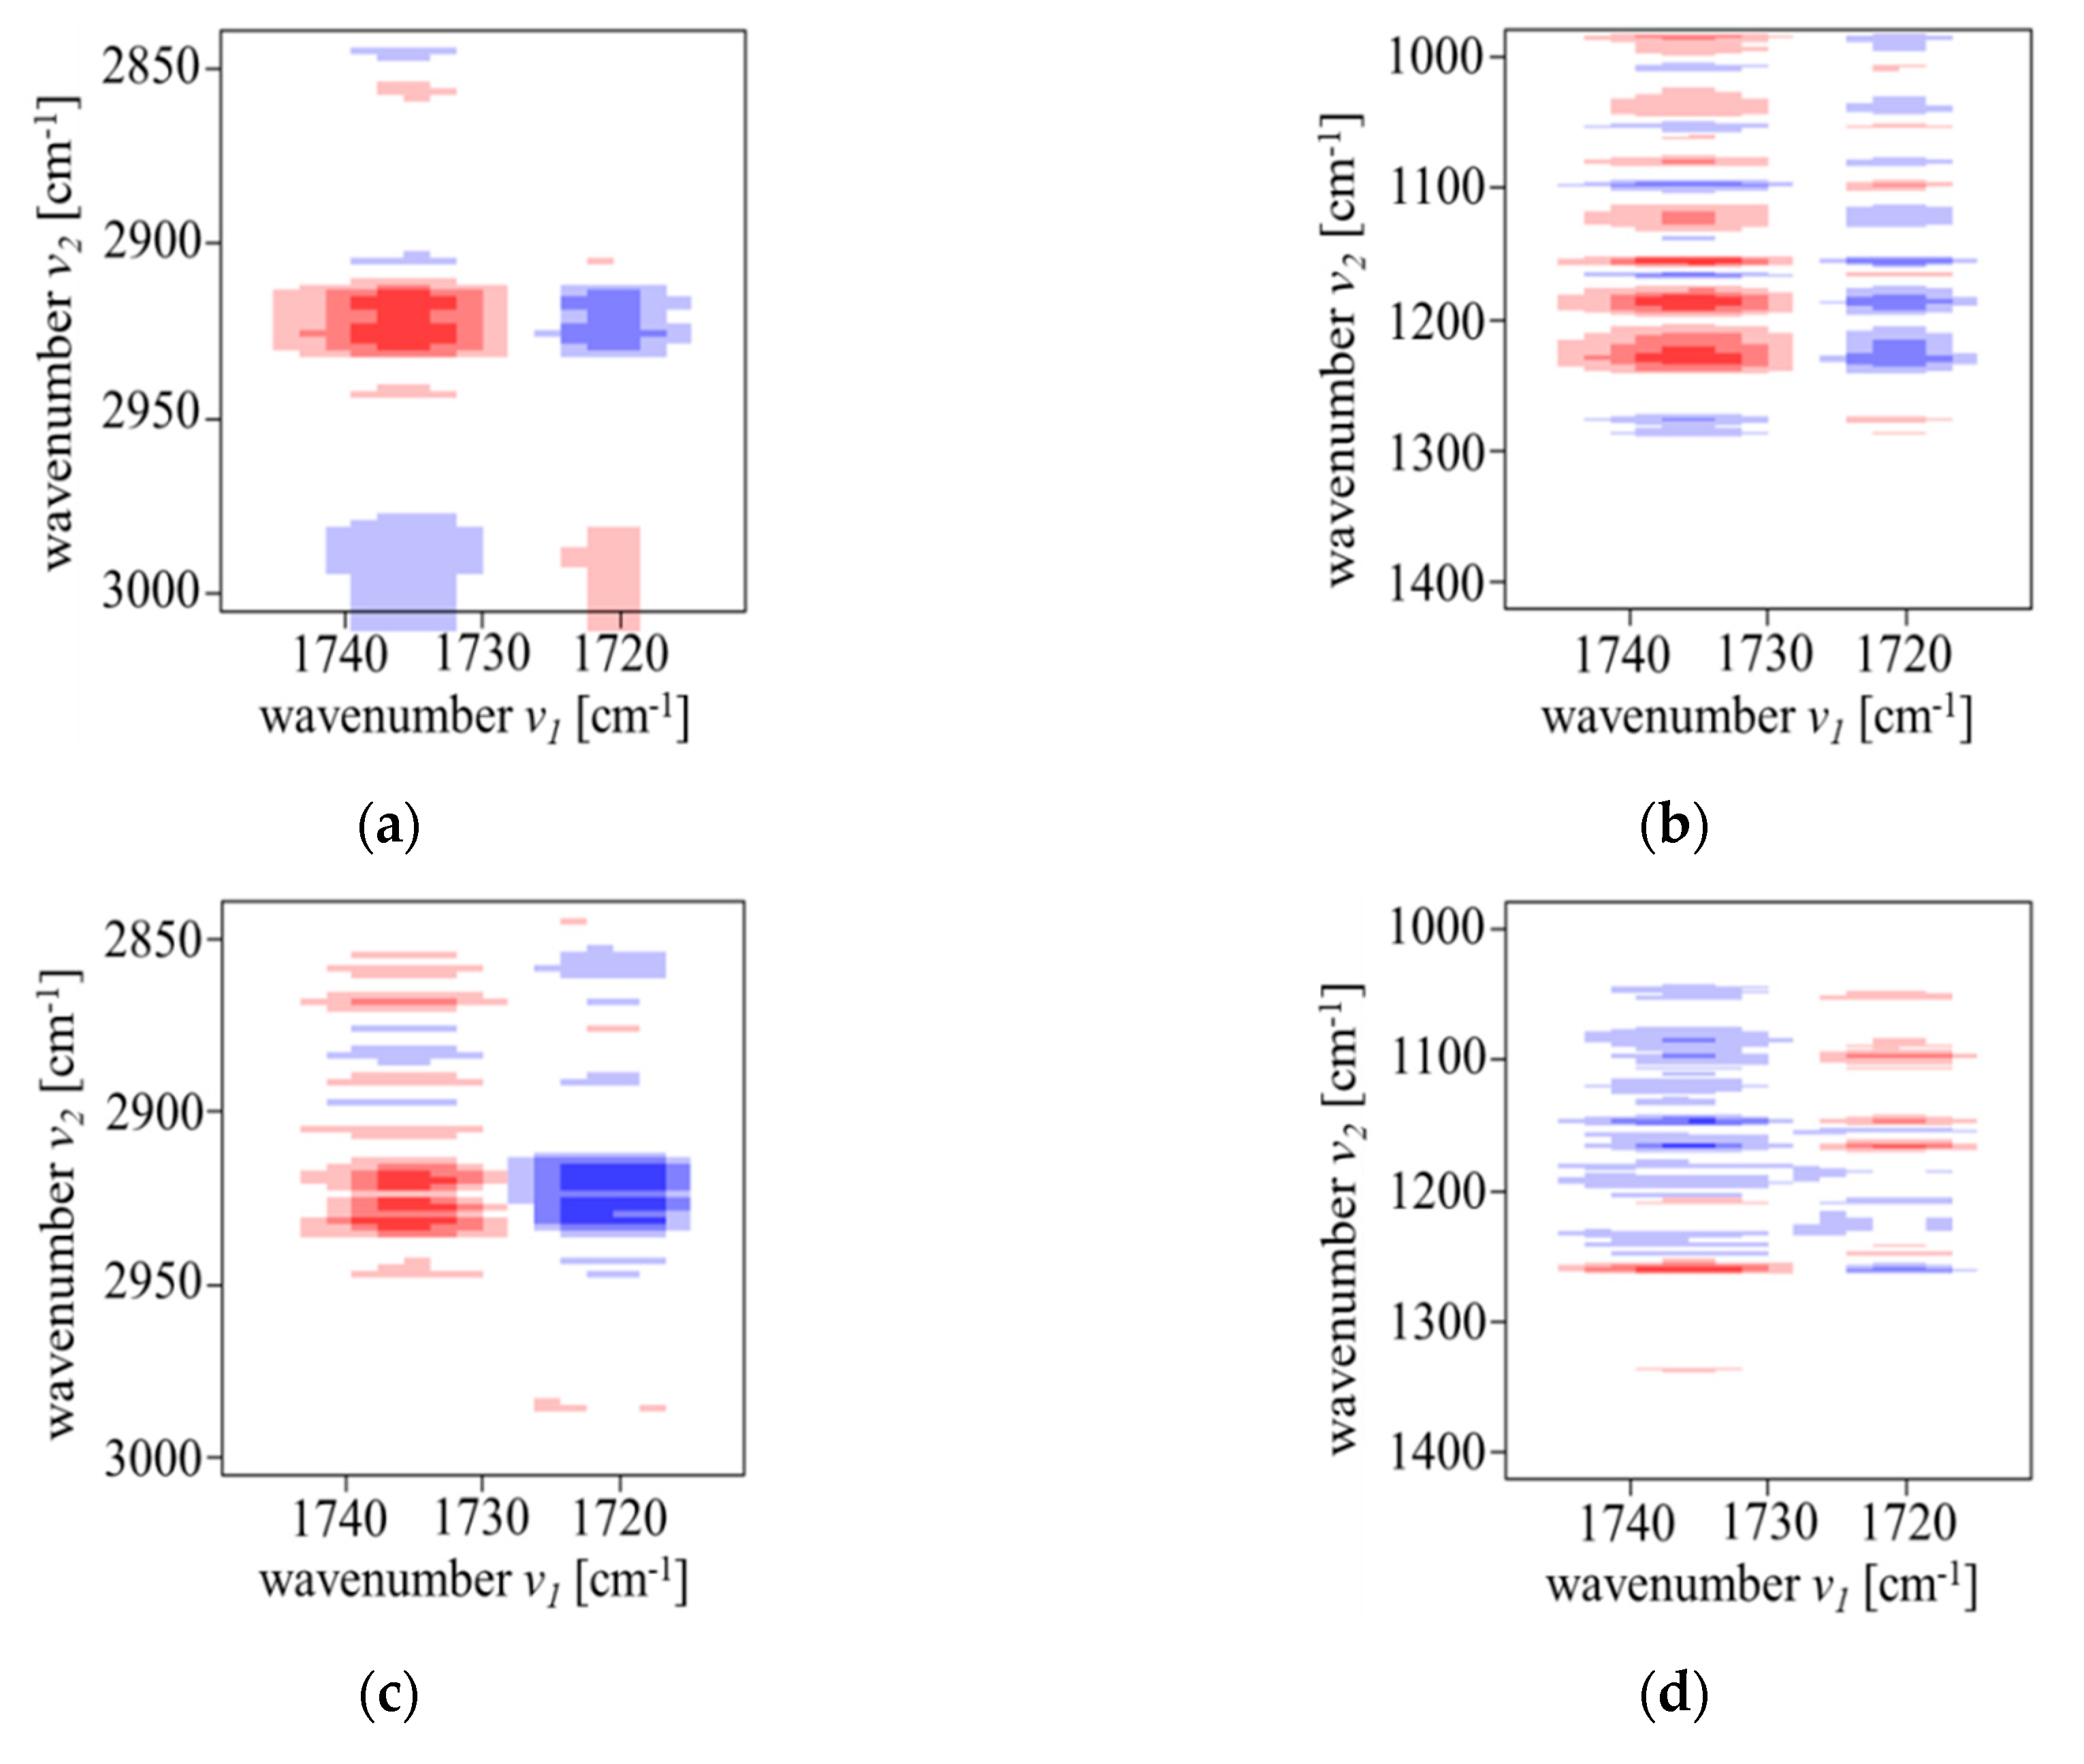
The generalized 2D-COS correlation analysis is presented in Figure 11, in the region of 1750–1710 cm−1 vs. 3000–2840 cm−1 (Figure 11a,c) and 1750–1710 cm−1 vs. 1400–1000 cm−1 (Figure 11b,d). The analysis of asynchronous correlation maps suggests the following order of band changes: ν(C–O–C)asym (at 1283–1264 cm−1) and ν(C–O–C)asym (at 1185–1172 cm−1) > ν(C=O)core (at 1736 cm−1) > ν(C–H)asym (at 2936 cm−1), ν(C–H)sym (at 2858 cm−1) and βPh(C–H) (at 1308, 1120, 1073 cm−1) > ν(C=O)chiral_c. (at 1712 cm−1). As the cold crystallization starts, the first to respond are the vibrations of the C–O–C and C=O groups in the rigid core, and then those of C–O–C groups prior to the C=O group.
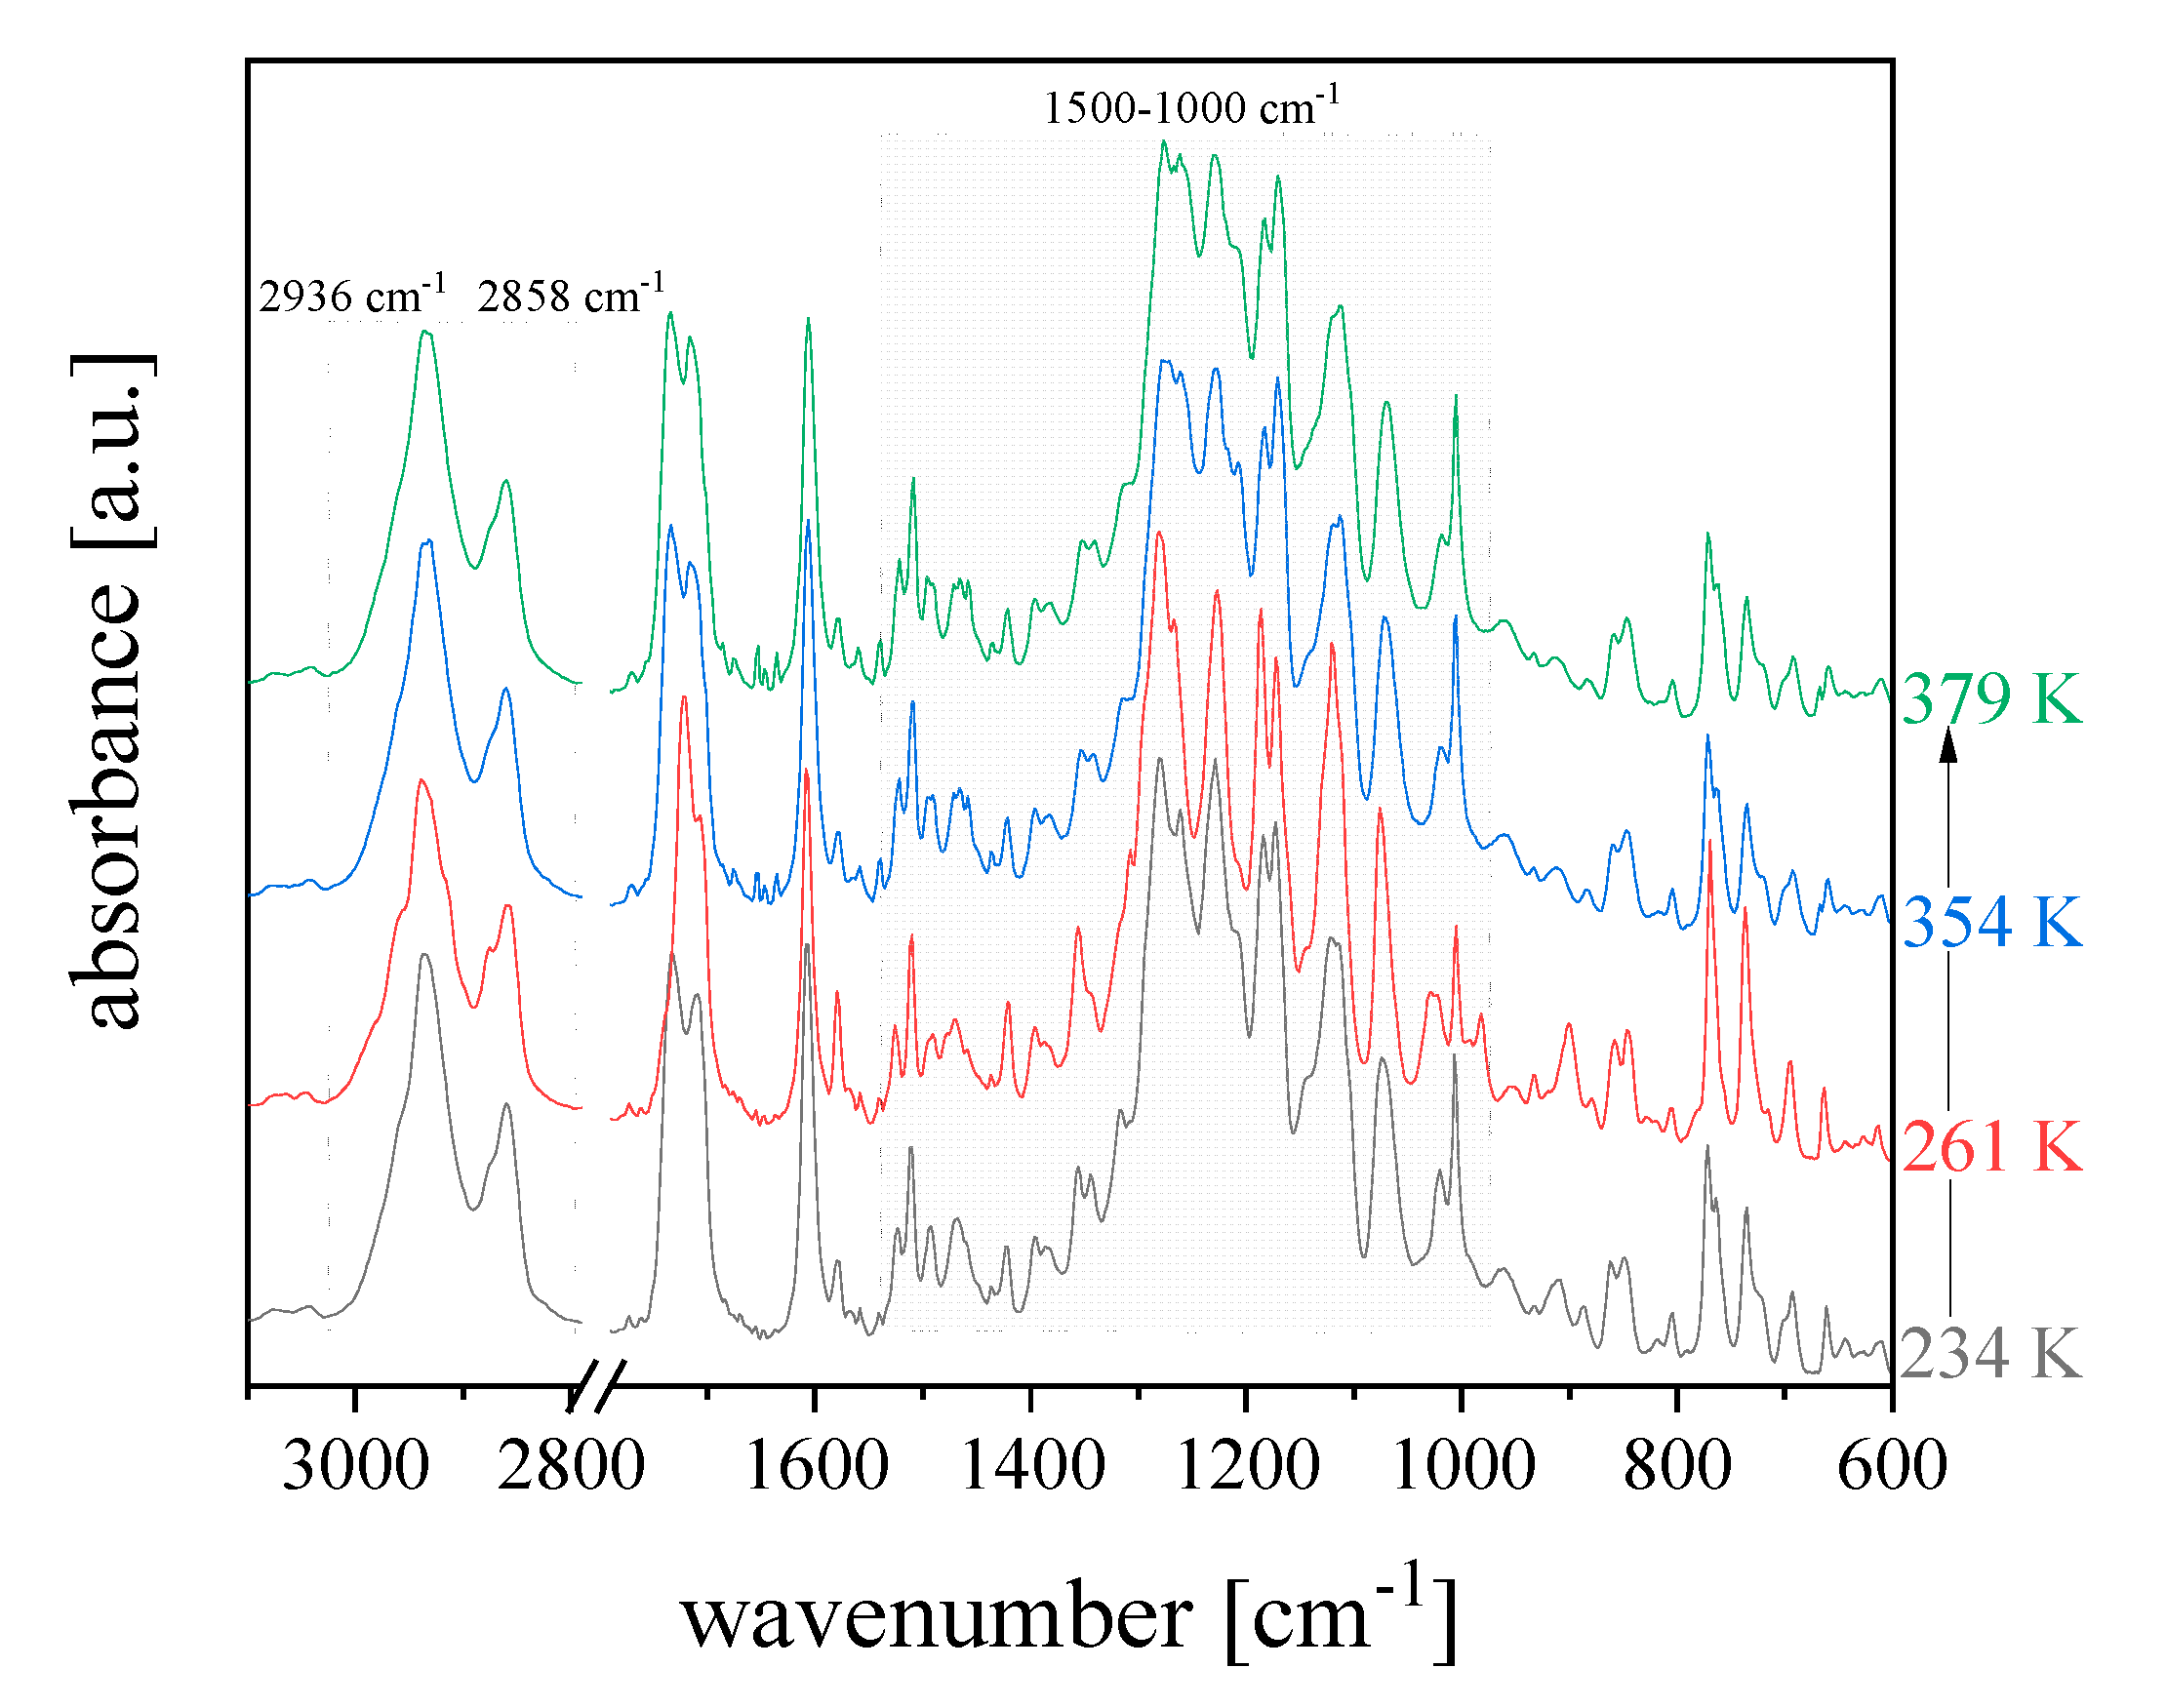
We were also interested in the range of ν(C–H)sym and ν(C–H)asym vibrations, which are sensitive to the cold crystallization. The ν(C–H)asym band shows a small, high-wavenumber shift, and the intensity decreases during the cold crystallization, while the second ν(C–H)sym band behaves oppositely (Figure 12). The shifts are probably caused by the splitting of peaks at , which corresponds to the development of the crystal phase. Also, other bands related to the C–H vibrations exhibit different characteristics during the cold crystallization, e.g., the increase of intensity of the β(C–H)asym band assigned to the CH3 asymmetric deformation mode (at approximately 1450 cm−1), a change of shape of ρ(CH3) and ω(CH3) bands associated with the CH3 rocking and C–CH3 wagging modes (at approximately 1130 and 1040 cm−1, respectively) and the appearance of a new β(C–H)sym band connected with the CH3 symmetric deformation mode (at approximately 1380 cm−1). The new features of previously mentioned bands should be related to the structural order of the methyl side groups during the cold crystallization.
Stretching vibrations of the C=O groups prove an especially sensitive probe of changes to the local surrounding of a molecule, including weak non-covalent interactions, hydrogen bonds, etc. This feature was already made use of above in this work. To continue, also in this case, we turn our attention to the changes of wavenumbers, FWHM’s, areas and heights of ν(C=O)chiral_c. (Figure 13a) and ν(C=O)core (Figure 13b) bands, as a function of temperature. An example of fitting two Lorentz-shaped absorption bands in the carbonyl groups stretching vibrations region was presented in Reference [14]. During cooling with the rate of 5 K/min, a gradual decrease of wavenumber was seen for both bands in the SmCA* phase. Next, the of both bands exhibited inflection points, and so did FWHM of the ν(C=O)chiral_c. band at the temperature of about 320 K, i.e., at the glass transition. At the same temperature, the extremes were observed for the remaining characteristics, i.e., the area under the ν(C=O)chiral_c. band as well as the height of both bands reach their minima, while the area and FWHM of the (C=O)core band are at their maxima. Then, the values of the ν(C=O)chiral_c. band parameters slowly increase during cooling, while for ν(C=O)core, the opposite is observed (except the wavenumber) in the gSmCA* state. During heating with the rate of 2 K/min (after previous fast cooling with the rate of 10 K/min), a rapid decrease of both band parameters was seen at approximately 260 K, i.e., at temperature of the sample crystallization. This effect is associated with the increase of intermolecular interactions that affect the carbonyl groups vibrations. Next, the ν(C=O)chiral_c. band parameters increase upon heating, while the opposite situation is visible for the ν(C=O)core band parameters in the crystal phase. The observed changes could be explained by the sensitivity of C=O groups to the short-range order of molecules, which is first built up during crystallization process. Then, a rapid increase of both band parameters upon heating at approximately 350 K was noticed, which is associated with the Cr–SmCA* phase transition. This growth may be associated with the movements of C=O groups relative to each other, and thus with change of the sensitivity of carbonyl groups to inter-molecular interactions with temperature.
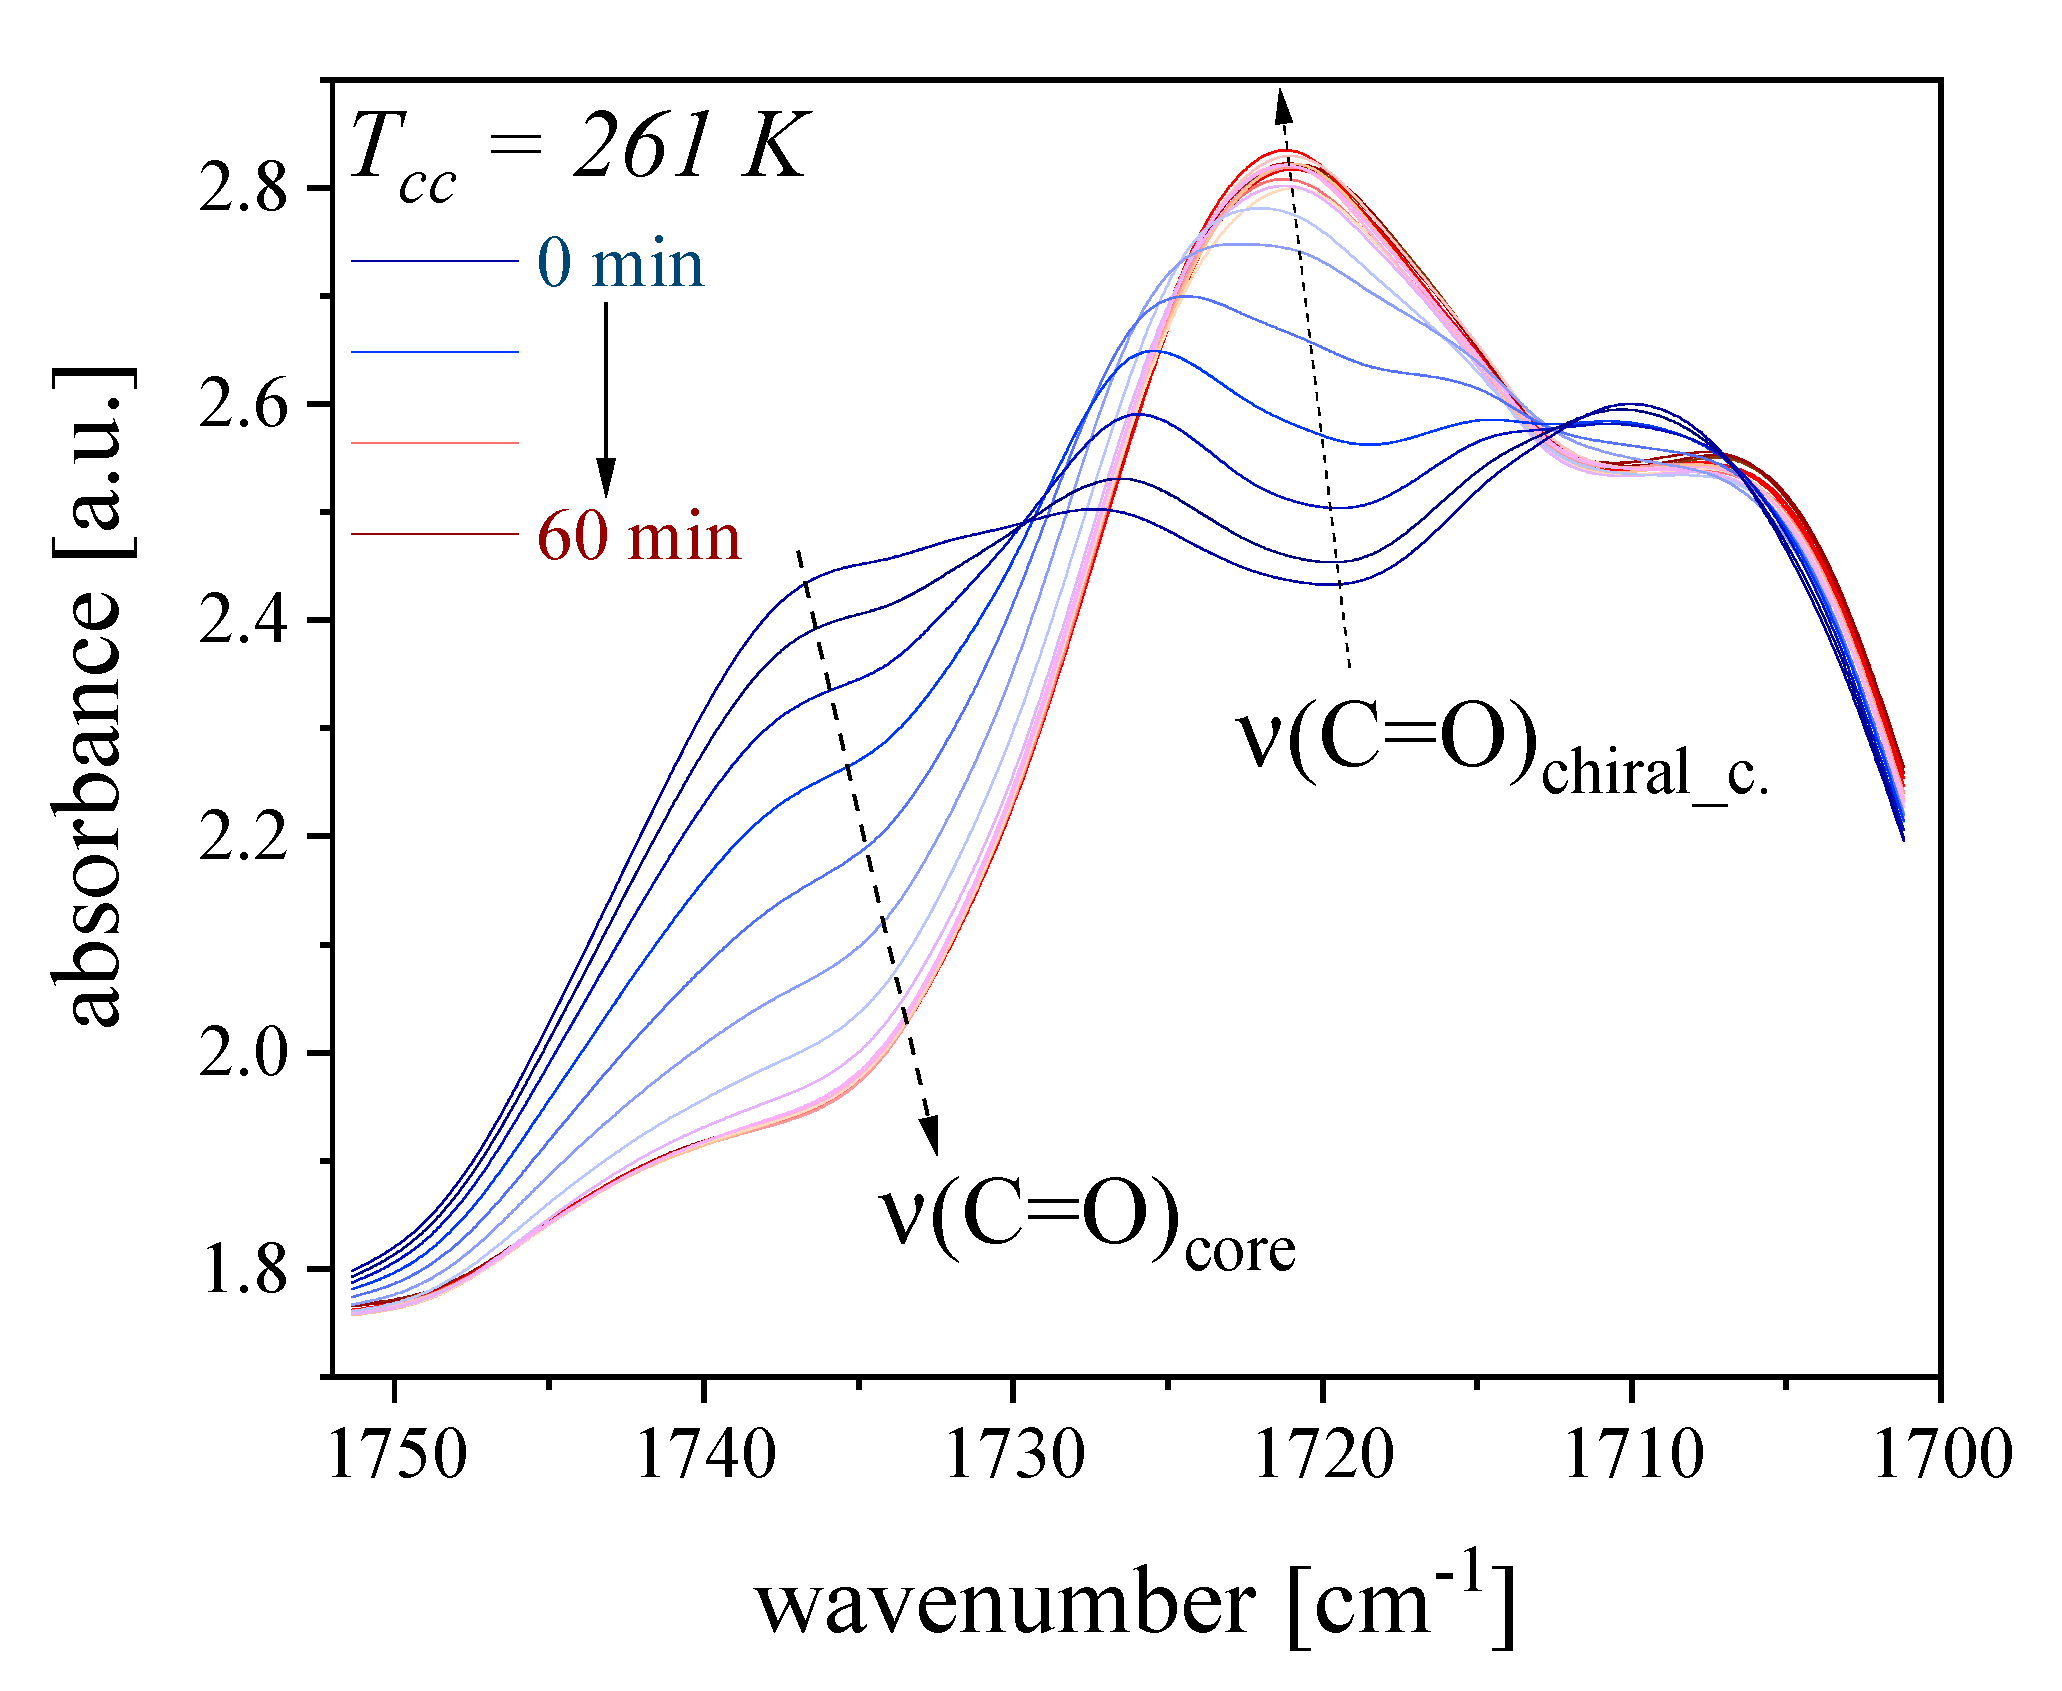
Additionally, we examined the spectral evolution in the carbonyl stretching region during the cold crystallization process at 261 K of 3F7HPhH7, which is shown in Figure 14. The intensity of the ν(C=O)chiral_c. band increases gradually with time at , while that of the ν(C=O)core band decreases. We concluded that, during the cold crystallization, the vibrations related with carbonyl groups behave differently. It seems rational to assign one component (ν(C=O)chiral_c.) as characteristic for the crystal phase, while the other (ν(C=O)core) for the gSmCA* state [28].
4. Conclusions
In this paper, the FTIR spectroscopy followed by the PCMW2D and the 2D-COS analyses were applied to investigate the vitrification and the cold crystallization processes of 3F7HPhH7. DFT quantum chemical calculations (def2-TZVPPD + B3-LYP + dispersion corrections) were carried out to find minimum-energy molecule conformation, and then to assist unambiguous band frequency assignment in the experimental spectra. The infrared spectra were measured in the different heating modes (after slow and fast cooling) to see how the change in rate affects the occurrence of the cold crystallization in the compound under study. During heating after slow cooling, only changes in the absorption band characteristics associated with the Cr–SmCA* transition were observed, while during sample heating after previous fast cooling, additional changes corresponding to the cold crystallization process were additionally visible. The FTIR spectra changes were noticed in the wavenumber regions of C–H stretching vibrations (at 3100–2800 cm−1), C=O stretching vibrations (at 1800–1580 cm−1), C–O–C stretching vibrations (at 1520–1050 cm−1) and C–H rocking vibrations (at 1050–680 cm−1), because these regions are sensitive to the structural changes occurring in the vitrification as well as in the cold crystallization process.
The correlation analysis was performed to study the changes of the stochastic movements (characteristic for partially disordered phases) during the vitrification and cold crystallization processes. The glass transition consists in changing the stochastic movements involving: first, the ester groups, then, the C=O groups and finally, the side methyl groups. As the cold crystallization begins, the first to respond are the vibrations of the C–O–C and C=O groups in the rigid core, and next is the structural order of the methyl side groups.
Author Contributions
A.D.: conceptualization, formal analysis, investigation, writing—original draft preparation, writing—review and editing. E.J.-G.: investigation. W.Z.: investigation. P.K.: investigation. All authors have read and agreed to the published version of the manuscript.
Funding
This research was funded by the Institute of Nuclear Physics Polish Academy of Sciences, Krakow, Poland.
Conflicts of Interest
The authors declare no conflict of interest.
Appendix A
Figure A1.
The FTIR spectra of 3F7HPhH7 upon heating at a rate of 2 K/min (after slow cooling) from 173 to 403 K in the wavenumber regions of: (a) 3100–2800 cm−1, (b) 1800–1580 cm−1, (c) 1520–1050 cm−1 and (d) 1050–680 cm−1.
Figure A1.
The FTIR spectra of 3F7HPhH7 upon heating at a rate of 2 K/min (after slow cooling) from 173 to 403 K in the wavenumber regions of: (a) 3100–2800 cm−1, (b) 1800–1580 cm−1, (c) 1520–1050 cm−1 and (d) 1050–680 cm−1.

Figure A2.
PCMW2D correlation synchronous maps in the heating mode of 3F7HPhH7 in the wavenumber regions of: (a) 3100–2800 cm−1, (b) 1800–1400 cm−1 and (c) 1400–1000 cm−1. The red or blue areas represent positive or negative correlation intensities, respectively.
Figure A2.
PCMW2D correlation synchronous maps in the heating mode of 3F7HPhH7 in the wavenumber regions of: (a) 3100–2800 cm−1, (b) 1800–1400 cm−1 and (c) 1400–1000 cm−1. The red or blue areas represent positive or negative correlation intensities, respectively.

Figure A3.
2D-COS correlation (a–c) synchronous and (d–f) asynchronous maps of 3F7HPhH7 in the heating mode from 339 to 389 K in the wavenumber regions of: (a,d) 3000–2840 cm−1, (b,e) 1770–1670 cm−1 and (c,f) 1400–1000 cm−1. The red or blue areas represent positive or negative correlation intensities, respectively.

References
- Reinitzer, F. Beiträge zur Kenntniss des Cholesterins. Monatsh. Chem. 1888, 9, 421–441. [Google Scholar] [CrossRef]
- Lehmann, O. Über fliessende Krystalle. Z. Phys. Chem. 1889, 4, 462–472. [Google Scholar] [CrossRef]
- Otón, J.M.; Quintana, X.; Castillo, P.L.; Lara, A.; Urruchi, V.; Bennis, N. Antiferroelectric liquid crystal displays. Opto-Electron. Rev. 2004, 12, 263–269. [Google Scholar]
- Kim, K.-H.; Song, J.-K. Technical evolution of liquid crystal displays. NPG Asia Mater. 2009, 1, 29–36. [Google Scholar] [CrossRef] [Green Version]
- Shi, H.; Chen, S.H. Novel glass-forming liquid crystals. III Helical sense and twisting power in chiral nematic systems. Liq. Cryst. 1995, 19, 849–861. [Google Scholar] [CrossRef]
- Dierking, I. Experimental investigations of a chiral smectic glass-forming liquid crystal. Liq. Cryst. 2008, 35, 1015–1022. [Google Scholar] [CrossRef]
- Jasiurkowska-Delaporte, M.; Rozwadowski, T.; Juszyńska-Gałązka, E. Kinetics of Non-Isothermal and Isothermal Crystallization in a Liquid Crystal with Highly Ordered Smectic Phase as Reflected by Differential Scanning Calorimetry, Polarized Optical Microscopy and Broadband Dielectric Spectroscopy. Crystals 2019, 9, 205. [Google Scholar] [CrossRef] [Green Version]
- Jasiurkowska-Delaporte, M.; Napolitano, S.; Leys, J.; Juszyńska-Gałązka, E.; Wübbenhorst, M.; Massalska-Arodź, M. Glass transition Dynamics and crystallization kinetics in the smectic liquid crystal 4-n-butyloxybenzylidene-4′-n′-octylaniline (BBOA). J. Phys. Chem. B 2016, 47, 12160–12167. [Google Scholar] [CrossRef]
- Rozwadowski, T.; Massalska-Arodź, M.; Kolek, Ł.; Grzybowska, K.; Bąk, A.; Chłędowska, K. Kinetics of cold crystallization of 4-cyano-3-fluorophenyl 4-butylbenzoate (4CFPB) glass forming liquid crystal. I. Nonisothermal process as studied by microscopic, calorimetric, and dielectric methods. Cryst. Growth Des. 2015, 15, 2891–2900. [Google Scholar] [CrossRef]
- Jasiurkowska-Delaporte, M.; Rozwadowski, T.; Dmochowska, E.; Juszyńska-Gałązka, E.; Kula, P.; Massalska-Arodź, M. Interplay between Crystallization and Glass Transition in Nematic Liquid Crystal 2,7-Bis(4-pentylphenyl)-9,9-diethyl-9 H-fluorene. J. Phys. Chem. B 2018, 122, 10627–10636. [Google Scholar] [CrossRef]
- Jasiurkowska-Delaporte, M.; Juszyńska, E.; Kolek, Ł.; Krawczyk, J.; Massalska-Arodź, M.; Osiecka, N.; Rozwadowski, T. Signatures of glass transition in partially ordered phases. Liq. Cryst. 2013, 40, 1436–1442. [Google Scholar] [CrossRef]
- Legrand, V.; Descamps, M.; Alba-Simionesco, C. Glassforming m-Toluidine: A thermal and structural analysis of its crystalline polymorphism and devitrification. Thermochim. Acta 1997, 307, 77–83. [Google Scholar] [CrossRef]
- Craveiro, R.; Aroso, I.; Flammia, V.; Carvalho, T.; Viciosa, M.T.; Dionísio, M.; Barreiros, S.; Reis, R.L.; Duarte, A.R.C.; Paiva, A. Properties and thermal behavior of natural deep eutectic solvents. J. Mol. Liq. 2016, 215, 534–540. [Google Scholar] [CrossRef]
- Drzewicz, A.; Juszyńska-Gałązka, E.; Zając, W.; Piwowarczyk, M.; Drzewiński, W. Non-isothermal and isothermal cold crystallization of glass-forming chiral smectic liquid crystal (S)-4’-(1-methyloctyloxycarbonyl) biphenyl-4-yl 4-[7-(2,2,3,3,4,4,4-heptafluorobutoxy) heptyl-1-oxy]-benzoate. J. Mol. Liq. under review.
- Nagasaki, Y.; Yoshihara, T.; Ozaki, Y. Polarized infrared spectroscopic study on changes in molecular orientation and interaction during phase transitions of a ferroelectric liquid crystal with a naphthalene ring. Liq. Cryst. 2001, 28, 327–331. [Google Scholar] [CrossRef]
- Wan, C.-H.; Kuo, J.-K. Infrared spectroscopic and mesomorphic studies of 4,4’-bis(ω-hydroxyalkoxy)-α-methylstilbenes. Liq. Cryst. 2010, 28, 535–548. [Google Scholar] [CrossRef]
- Osiecka, N.; Czarnecki, M.A.; Galewski, Z.; Massalska-Arodź, M. FT-IR and Two-Dimensional Correlation Analysis of the Liquid Crystalline Phase transitions in the 4-Bromobenzylidene-4’-alkyloxyanilines. J. Phys. Chem. B 2013, 117, 10612–10618. [Google Scholar] [CrossRef]
- Drzewicz, A.; Bombalska, A.; Tykarska, M. Impact of molecular structure of smectogenic chiral esters (3FmX1X2r) on vibrational dynamics as seen by IR and Raman spectroscopy. Liq. Cryst. 2018, 46, 754–771. [Google Scholar] [CrossRef]
- Scaife, B.K.; Vij, J.K. Propagation of an electromagnetic wave in an absorbing anisotropic medium and infrared transmission spectroscopy of liquid crystals. J. Chem. Phys. 2005, 122, 174901–174911. [Google Scholar] [CrossRef]
- Bezrodna, T.V.; Nesprava, V.V.; Tomylko, S.V.; Chashechnikova, I.T.; Baran, J. Influence of interphase interactions on electro-optical properties of heterocomposites of 5CB liquid crystal and organomodified montmorillonites doped with carbon nanotubes. J. Appl. Spectrosc. 2013, 80, 232–239. [Google Scholar] [CrossRef]
- Pi, F.; Shinzawa, H.; Czarnecki, M.A.; Iwahashi, M.; Suzuki, M.; Ozaki, Y. Self-assembling of oleic acid (cis-9-octadecenoic acid) and linoleic acid (cis-9, cis-12-octadecadienoic acid) in ethanol studied by time-dependent attenuated total reflectance (ATR) infrared (IR) and two-dimensional (2D) correlation spectroscopy. J. Mol. Struct. 2010, 974, 40–45. [Google Scholar] [CrossRef]
- Lasch, P.; Noda, I. Two-Dimensional Correlation Spectroscopy (2D-COS) for Analysis of Spatially Resolved Vibrational Spectra. Appl. Spectrosc. 2019. [Google Scholar] [CrossRef] [PubMed]
- Morita, S.; Shinzawa, H.; Noda, I.; Ozaki, Y. Perturbation-Correlation Moving-Window Two-Dimensional Correlation Spectroscopy. Appl. Spectrosc. 2006, 60, 398–406. [Google Scholar] [CrossRef] [PubMed]
- Steiner, G. Jaan Laane (Ed.): Frontiers and advances in molecular spectroscopy. Anal. Bioanal. Chem. 2018, 410, 6035–6036. [Google Scholar] [CrossRef]
- Dołęga, A.; Juszyńska-Gałązka, E.; Deptuch, A.; Jaworska-Gołąb, T.; Zieliński, P. Vibrational Dynamics of Carbamazepine: Studies Based on Two-Dimensional Correlation Spectroscopy and X-ray Diffraction. Appl. Spectrosc. 2020. [Google Scholar] [CrossRef]
- Xue, B.; Xie, L.; Zhang, J. Detailed molecular movements during poly(L-lactic acid) cold-crystallization investigated by FTIR spectroscopy combined with two-dimensional correlation analysis. RSC Adv. 2017, 7, 47017–47028. [Google Scholar] [CrossRef] [Green Version]
- Juszyńska-Gałązka, E.; Osiecka, N.; Budziak, A. Fourier transform infrared spectroscopy and X-ray diffraction studies of the molecular motions and structure changes of liquid crystal N-P-(Ethoxybenzylidene) p’-propylaniline (EBPA). Vib. Spectrosc. 2017, 92, 62–69. [Google Scholar] [CrossRef]
- Zhang, J.; Tsuji, H.; Noda, I.; Ozaki, Y. Structural Changes and Crystallization Dynamics of Poly(L-lactide) during the Cold-Crystallization Process Investigated by Infrared and Two-Dimensional Infrared Correlation Spectroscopy. Macromolecules 2004, 37, 6433–6439. [Google Scholar] [CrossRef]
- Milewska, K.; Drzewiński, W.; Czerwiński, M.; Dąbrowski, R. Design, synthesis and mesomorphic properties of chiral benzoates and fluorobenzoates with direct SmCA*-Iso phase transition. Liq. Cryst. 2015, 42, 1601–1611. [Google Scholar] [CrossRef]
- Noda, I.; Dowrey, A.E.; Marcoli, C.; Story, G.M.; Ozaki, Y. Generalized Two-Dimensional Correlation Spectroscopy. Appl. Spectrosc. 2000, 54, 236A–248A. [Google Scholar] [CrossRef]
- Noda, I.; Ozaki, Y. Principle of two-dimensional correlation spectroscopy. In Two-Dimensional Correlation Spectroscopy-Applications in Vibrational and Optical Spectroscopy; Noda, I., Ozaki, Y., Eds.; John Wiley and Sons: Chichester, UK, 2004; pp. 15–38. [Google Scholar]
- 2Dshige (c) Shigeaki Morita; Kwansei-Gakuin University: Nishinomiya, Japan, 2004–2005.
- Thomas, M.; Richardson, H.H. Two-dimensional FT-IR correlation analysis of the phase transitions in a liquid crystal, 4’-n-octyl-4-cyanobiphenyl (8CB). Vib. Spectrosc. 2000, 24, 137–146. [Google Scholar] [CrossRef]
- TURBOMOLE, V7.3; A Development of University of Karlsruhe and Forschungszentrum Karlsruhe GmbH, 1989–2007. TURBOMOLE GmbH: Karlsruhe, Germany, 2018. Available online: http://www.turbomole.com (accessed on 7 July 2020).
- Weigend, F.; Ahlrichs, R. Balanced basis sets of split valence, triple zeta valence and quadruple zeta valence quality for H to Rn: Design and assessment of accuracy. Phys. Chem. Phys. 2005, 7, 3297–3305. [Google Scholar] [CrossRef] [PubMed]
- Stephens, P.J.; Devlin, F.J.; Chabalowski, C.F.; Frisch, M.J. Ab Initio Calculation of Vibrational Absorption and Circular Dichroism Spectra Using Density Functional Force Fields. J. Phys. Chem. 1994, 98, 11623–11627. [Google Scholar] [CrossRef]
- Caldeweyher, E.; Bannwarth, C.; Grimme, S. Extension of the D3 dispersion coefficient model. J. Chem. Phys. 2017, 147, 034112. [Google Scholar] [CrossRef]
- Ozaki, Y.; Wójcik, M.; Popp, J. Molecular Spectroscopy: A Quantum Chemistry Approach; Weinheim, Wiley-VCH Verlag GmbH & Co. KGaA: Weinheim, Germany, 2019. [Google Scholar]
- Juszyńska-Gałązka, E.; Massalska-Arodź, M.; Budziak, A.; Osiecka, N.; Madej, D.; Majda, D. Polymorphism, structure and dynamics investigations of 4-cyano-3-fluorophenyl 4’-n-octylbenzoate (8CFPB) liquid crystal. Vib. Spectrosc. 2017, 92, 119–126. [Google Scholar] [CrossRef]
- Lin-Vien, D.; Colthup, N.B.; Fateley, W.G.; Grasselli, J.G. Compounds containing the carbonyl group. In The Handbook of Infrared and Raman Characteristic Frequencies of Organic Molecules; Colthup, N.B., Ed.; Elsevier Inc.: London, UK, 1991; pp. 117–154. [Google Scholar]
- Drużbicki, K.; Kocot, A.; Mikuli, E.; Ossowska-Chruściel, M.D.; Chruściel, J. Temperature-Dependent Infrared Spectroscopy Studies of a Novel Antiferroelectric Liquid-Crystalline Thiobenzoate. J. Phys. Chem. B 2012, 116, 11332–11343. [Google Scholar] [CrossRef]
- Zhang, J.; Tsuji, H.; Noda, I.; Ozaki, Y. Weak Intermolecular Interactions during the Melt Crystallization of Poly(L-lactide) Investigated by Two-Dimensional Infrared Correlation Spectroscopy. J. Phys. Chem. B 2004, 108, 11514–11520. [Google Scholar] [CrossRef]
- Pan, P.J.; Zhu, B.; Inoue, Y. Enthalpy Relaxation and Embrittlement of Poly(l-lactide) during Physical Aging. Macromolecules 2007, 40, 9664–9671. [Google Scholar] [CrossRef]
- Kang, S.; Hsu, S.L.; Stidham, H.D.; Smith, P.B.; Leugers, A.; Yang, X. A spectroscopic analysis of poly(lactic acid) structure. Macromolecules 2001, 34, 4542–4548. [Google Scholar] [CrossRef]
- Czarnecki, M.A. Interpretation of Two-Dimensional Correlation Spectra: Science or Art? Appl. Spectrosc. 2000, 52, 1583–1590. [Google Scholar] [CrossRef]
- Czarnecki, M.A. Two-Dimensional Correlation Spectroscopy: Effect of Band Position, Width, and Intensity Changes on Correlation Intensities. Appl. Spectrosc. 2000, 54, 986–993. [Google Scholar] [CrossRef]
Figure 1.
The general structure of (S)-4′-(1-methyloctyloxycarbonyl) biphenyl-4-yl 4-[7-(2,2,3,3,4,4,4-heptafluorobutoxy) heptyl-1-oxy]-benzoate (3F7HPhH7), where C-atoms are marked by dark gray, H-atoms by yellow, O-atoms by red and F-atoms by light green.
Figure 1.
The general structure of (S)-4′-(1-methyloctyloxycarbonyl) biphenyl-4-yl 4-[7-(2,2,3,3,4,4,4-heptafluorobutoxy) heptyl-1-oxy]-benzoate (3F7HPhH7), where C-atoms are marked by dark gray, H-atoms by yellow, O-atoms by red and F-atoms by light green.

Figure 2.
DSC thermograms recorded during heating with the rate of 2 K/min (red line) and cooling with the rate of 5 K/min (blue line) cycle. Inset images correspond to the textures of thermodynamic phases of 3F7HPhH observed under polarizing microscope.
Figure 2.
DSC thermograms recorded during heating with the rate of 2 K/min (red line) and cooling with the rate of 5 K/min (blue line) cycle. Inset images correspond to the textures of thermodynamic phases of 3F7HPhH observed under polarizing microscope.

Figure 3.
Calculated and experimental infrared spectra of 3F7HPhH7. The inset shows the determination of a scaling factor.
Figure 3.
Calculated and experimental infrared spectra of 3F7HPhH7. The inset shows the determination of a scaling factor.

Figure 4.
The FTIR spectra of 3F7HPhH7 upon cooling at a rate of 2 K/min from 403 to 173 K in the wavenumber regions of: (a) 3100–2800 cm−1, (b) 1800–1580 cm−1, (c) 1520–1050 cm−1 and (d) 1050–680 cm−1.
Figure 4.
The FTIR spectra of 3F7HPhH7 upon cooling at a rate of 2 K/min from 403 to 173 K in the wavenumber regions of: (a) 3100–2800 cm−1, (b) 1800–1580 cm−1, (c) 1520–1050 cm−1 and (d) 1050–680 cm−1.

Figure 5.
Perturbation-correlation moving window two-dimensional analysis (PCMW2D) correlation synchronous maps in the cooling mode of 3F7HPhH7 in the wavenumber regions of: (a) 3100–2800 cm−1, (b) 1800–1400 cm−1 and (c) 1400–1000 cm−1. The red or blue areas represent positive or negative correlation intensities, respectively.

Figure 6.
Two-dimensional correlation analysis (2D-COS) correlation (a–c) synchronous and (d–f) asynchronous maps of 3F7HPhH7 in the cooling mode from 349 to 259 K in the wavenumber regions of: (a,d) 3000–2840 cm−1, (b,e) 1770–1670 cm−1 and (c,f) 1400–1000 cm−1. The red or blue areas represent positive or negative correlation intensities, respectively.


Figure 7.
2D-COS correlation (a,b) synchronous and (c,d) asynchronous maps of 3F7HPhH7 in the cooling mode from 349 to 259 K in the wavenumber regions of: (a,c) 1750–1710 cm−1 vs. 3000–2840 cm−1 and (b,d) 1750–1710 cm−1 vs. 1400–1000 cm−1. The red or blue areas represent positive or negative correlation intensities, respectively.

Figure 8.
The FTIR spectra of 3F7HPhH7 upon heating at a rate of 2 K/min (after fast cooling) from 173 to 403 K in the wavenumber regions of: (a) 3100–2800 cm−1, (b) 1800–1580 cm−1, (c) 1520–1050 cm−1 and (d) 1050–680 cm−1.
Figure 8.
The FTIR spectra of 3F7HPhH7 upon heating at a rate of 2 K/min (after fast cooling) from 173 to 403 K in the wavenumber regions of: (a) 3100–2800 cm−1, (b) 1800–1580 cm−1, (c) 1520–1050 cm−1 and (d) 1050–680 cm−1.

Figure 9.
PCMW2D correlation synchronous maps in the heating mode of 3F7HPhH7 in the wavenumber regions of: (a) 3100–2800 cm−1, (b) 1800–1400 cm−1 and (c) 1400–1000 cm−1. The red or blue areas represent positive or negative correlation intensities, respectively.
Figure 9.
PCMW2D correlation synchronous maps in the heating mode of 3F7HPhH7 in the wavenumber regions of: (a) 3100–2800 cm−1, (b) 1800–1400 cm−1 and (c) 1400–1000 cm−1. The red or blue areas represent positive or negative correlation intensities, respectively.

Figure 10.
2D-COS correlation (a–c) synchronous and (d–f) asynchronous maps of 3F7HPhH7 in the heating mode from 249 to 299 K in the wavenumber regions of: (a,d) 3000–2840 cm−1, (b,e) 1770–1670 cm−1 and (c,f) 1400–1000 cm−1. The red or blue areas represent positive or negative correlation intensities, respectively.


Figure 11.
2D-COS correlation (a,b) synchronous and (c,d) asynchronous maps of 3F7HPhH7 in the heating mode from 249 to 299 K in the wavenumber regions of: (a,c) 1750–1710 cm−1 vs. 3000–2840 cm−1 and (b,d) 1750–1710 cm−1 vs. 1400–1000 cm−1. The red or blue areas represent positive or negative correlation intensities, respectively.

Figure 12.
The FTIR spectra of 3F7HPhH7 measured during heating after fast cooling for selected temperatures at 234 K (at gSmCA* state), at 261 K (for cold crystallization), at 354 K (for Cr–SmCA* transition) and at 379 K (at SmCA* phase).
Figure 12.
The FTIR spectra of 3F7HPhH7 measured during heating after fast cooling for selected temperatures at 234 K (at gSmCA* state), at 261 K (for cold crystallization), at 354 K (for Cr–SmCA* transition) and at 379 K (at SmCA* phase).

Figure 13.
Temperature dependence of wavenumbers, FWHM’s, areas and heights of the bands associated with stretching vibrations of: (a) (C=O)chiral_c. and (b) (C=O)core registered during cooling (blue) with the rate of 5 K/min and heating (red) with the rate of 2 K/min (after previous fast cooling with the rate of 10 K/min).

Figure 14.
Temporal changes of FTIR spectra in the region of ν(C=O)core and ν(C=O)chiral_c. vibrations during cold crystallization at 261 K.
Figure 14.
Temporal changes of FTIR spectra in the region of ν(C=O)core and ν(C=O)chiral_c. vibrations during cold crystallization at 261 K.


Table 1.
Assignment of vibration modes observed on calculated (calc.) and experimental (exp.) Fourier transform infrared spectroscopy (FTIR) spectra for 3F7HPhH7. Abbreviations: asym—asymmetric, sym—symmetric, ν—stretching, β—bending in-plane, γ—bending out-of-plane, ρ—rocking, τ—twisting, ω—wagging, Ph—in aromatic ring.
| Calculated Wavenumber (cm−1) | Experimental Wavenumber (cm−1) | Assignment |
|---|---|---|
| 1012 | 1006 | βPh(C–H)asym + ω(CH2) + ω(CF2) |
| 1089 | 1073 | βPh(C–H)asym + ν(C–C–O)sym + ω(CH2) + ω(CH3) |
| 1140 | 1120 | βPh(C–H)sym + ρ(CH3) + ω(CF2) |
| 1144 | 1172 | ν(C–O–C)sym + βPh(C–H)sym |
| 1163 | 1185 | ν(C–O–C)sym + τ(CH2) + ω(CH3) |
| 1228 | 1227 | ν(C–F) + βPh(C–H)sym + ω(CH2) |
| 1248 | 1264 | ν(C–O–C)asym + τ(CH2) + ω(CF2) + ω(CH2) |
| 1272 | 1278 | ν(C–O–C)asym + βPh(C–H)asym + τ(CH2) + τ(C*HCH3) |
| 1282 | 1283 | ν(C–O–C)asym + τ(CH2) + ω(CF2) + ω(CH2) |
| 1312 | 1308 | βPh(C–H)asym + τ(CH2) |
| 1329 | 1343 | βPh(C–H)asym + ω(CH2) |
| 1331 | 1355 | ω(CF2) + ω(CH2) |
| 1366 | 1383 | βPh(C–H)asym + ω(CH2) + ω(CH3) + ω(C*HCH3) |
| 1391 | 1396 | τ(CH2) + ω(CH3) + ω(C*HCH3) |
| 1416 | 1422 | ω(CH2) + ω(CH2) + ω(C*HCH3) |
| 1455 | 1468 | βPh(C–H)asym + γ(CH2) |
| 1486 | 1480 | γ(CH2) |
| 1487 | 1493 | βPh(C–H)asym + γ(CH2) |
| 1506 | 1511 | βPh(C–H)asym + γ(CH2) |
| 1526 | 1525 | βPh(C–H)asym |
| 1557 | 1579 | βPh(C–H)asym + ν(C=O) + ω(CH2) |
| 1646 | 1607 | βPh(C–H)sym + ν(C=O) + ω(CH2) |
| 1751 | 1712 | ν(C=O)chiral_c. |
| 1777 | 1736 | ν(C=O)core |
| 2988; 2994 | 2858 | ν(C–H)sym |
| 2996; 3000 | 2936 | ν(C–H)asym |
| 3021 | 3046 | ν(C–H) in C*HCH3 |
| 3038 | 3064 | νPh(C–H)asym |
| 3107 | 3099 | νPh(C–H)sym |
© 2020 by the authors. Licensee MDPI, Basel, Switzerland. This article is an open access article distributed under the terms and conditions of the Creative Commons Attribution (CC BY) license (http://creativecommons.org/licenses/by/4.0/).
Share and Cite
MDPI and ACS Style
Drzewicz, A.; Juszyńska-Gałązka, E.; Zając, W.; Kula, P. Vibrational Dynamics of a Chiral Smectic Liquid Crystal Undergoing Vitrification and Cold Crystallization. Crystals 2020, 10, 655. https://doi.org/10.3390/cryst10080655
AMA Style
Drzewicz A, Juszyńska-Gałązka E, Zając W, Kula P. Vibrational Dynamics of a Chiral Smectic Liquid Crystal Undergoing Vitrification and Cold Crystallization. Crystals. 2020; 10(8):655. https://doi.org/10.3390/cryst10080655
Chicago/Turabian StyleDrzewicz, Anna, Ewa Juszyńska-Gałązka, Wojciech Zając, and Przemysław Kula. 2020. "Vibrational Dynamics of a Chiral Smectic Liquid Crystal Undergoing Vitrification and Cold Crystallization" Crystals 10, no. 8: 655. https://doi.org/10.3390/cryst10080655
Note that from the first issue of 2016, this journal uses article numbers instead of page numbers. See further details here.