Article

Effects of Micro-Arc Oxidation Process Parameters on Characteristics of Calcium-Phosphate Containing Oxide Layers on the Selective Laser Melted Ti13Zr13Nb Alloy

1
Biomaterials Division, Department of Materials Engineering and Bonding, Gdańsk University of Technology, 80-233 Gdańsk, Poland
2
Department of Biomaterials, Faculty of Dental Science, Kyushu University, 3-1-1 Maidashi, Higashi-ku, Fukuoka 812-8582, Japan
3
Institute of Biomaterials and Bioengineering, Tokyo Medical and Dental University, 2-3-10 Kanda-surugadai, Chiyoda-ku, Tokyo 101-0062, Japan
*
Author to whom correspondence should be addressed.
Coatings 2020, 10(8), 745; https://doi.org/10.3390/coatings10080745
Submission received: 29 June 2020 / Revised: 23 July 2020 / Accepted: 24 July 2020 / Published: 30 July 2020
(This article belongs to the Special Issue Recent Developments of Electrodeposition Coating)

Abstract

:
Titania-based films on selective laser melted Ti13Zr13Nb have been formed by micro-arc oxidation (MAO) at different process parameters (voltage, current, processing time) in order to evaluate the impact of MAO process parameters in calcium and phosphate (Ca + P) containing electrolyte on surface characteristic, early-stage bioactivity, nanomechanical properties, and adhesion between the oxide coatings and substrate. The surface topography, surface roughness, pore diameter, elemental composition, crystal structure, surface wettability, and the early stage-bioactivity in Hank’s solution were evaluated for all coatings. Hardness, maximum indent depth, Young’s modulus, and Ecoating/Esubstrate, H/E, H3/E2 ratios were determined in the case of nanomechanical evaluation while the MAO coating adhesion properties were estimated by the scratch test. The study indicated that the most important parameter of MAO process influencing the coating characteristic is voltage. Due to the good ratio of structural and nanomechanical properties of the coatings, the optimal conditions of MAO process were found at 300 V during 15 min, at 32 mA or 50 mA of current, which resulted in the predictable structure, high Ca/P ratio, high hydrophilicity, the highest demonstrated early-stage bioactivity, better nanomechanical properties, the elastic modulus and hardness well close to the values characteristic for bones, as compared to specimens treated at a lower voltage (200 V) and uncoated substrate, as well as a higher critical load of adhesion and total delamination.

1. Introduction

Titanium and its alloys are widely used for medical applications. Among them, pure Ti (cp-Ti) or Ti with Al, V, and Mo alloying elements are still among the most common materials used for implantation. However, due to the reported mismatch in mechanical properties between bones and those materials, leading to the stress-shielding and implant loosening, as well as the toxicity of Al and V, new solutions are considered. Finally, among the perspective materials are β-type titanium alloys [1,2,3] known as low modulus and bioinert metals containing Ti, Zr, Nb, Hf, Ta alloying elements [4,5]. Although the material ensures preferable mechanical properties, which has been proved as an effective factor in inhibiting bone atrophy [6] there is still a problem with its bioactivity. Many articles have reported that the composite layer can increase the surface area and roughness of the implant, and promote the ingrowth of the tissue while improving the adhesion between the bone tissue and implant. There are many methods which can enhance the bone tissue response, such as plasma spray, magnetron sputtering, ion implantation, and anodic treatment [7]. However, micro-arc oxidation (MAO), also called plasma electrochemical oxidation (PEO), has gained special attention due to its applicability to biocompatible coating deposition with a gradient structure, rough and porous morphology on such metals as Ti, Al, Mg, Nb, Zr, and their alloys. According to the literature, the MAO technique combines many advantages and exhibits better improvement of surface properties compared to other conventional methods. Laser surface modification improves the wear and corrosion resistance of Ti alloys, however the coatings exhibit low bond strength and the residual stresses produced during remelting and solidification which lead to many cracks in the laser treated coatings [8]. Similarly, plasma spraying improves biocompatibility, wear resistance, and thermal stability, but the formation of tensile forces between the substrate and coatings cause cracks and weaken the bonds. On the other hand, physical vapour deposition (PVD) and chemical vapour deposition (CVD) brings out the coatings of high density and strong adhesion to the substrate; however, such hard coatings also exhibit a large mismatch between mechanical properties of the substrate and coatings and in consequence may cause delamination. The sol-gel films demonstrate that the low adhesion strength to the substrate, possess a limited bioactivity, and their thickness is difficult to control. The friction stir processing (FSP) method improves biofunctionality, corrosion, and wear resistance, but due to the low processing rate and inferior flexibility, it has limitation for the use on complex-geometry [9]. Conventional electrochemical modification is able to produce a reproducible and well-defined coatings, nevertheless the improvement in hardness and wear resistance of Ti alloys by this technique is seldom reported. Compared to the modification method presented above, the micro-arc oxidation (MAO) technique improves the corrosion and wear resistance of titanium alloys, significantly enhances biocompatibility and bioactivity, provides a better bonding between the substrate and coating, and it has the capability to coat the complex-shape objects what constitutes a big advantage for biomedical applications [10]. The MAO process has been investigated by several research groups in recent years, mainly concerned with the biologic behavior, corrosion behavior [11,12], and the characteristics of the surface layer in terms of crystalline structure, topography, porosity or composition [13]. According to the literature, the coating formed in the electrolyte containing Ca and P ions can significantly improve the bioactivity of titanium implants [14,15,16,17]. What is more, the structure and properties of MAO coatings can be easily controlled by different MAO process parameters such as applied voltage, current density, time processing, as well as various electrolyte compositions [18,19,20]. Du et al. [19] and Wei et al. [13] have reported that the applied voltage has significant influence on the structureal parameters such as thickness, the atomic ratio of Ca to P, micropore number, and size of the MAO film on Ti and Zr1Nb alloy [19] and Ti6Al4V alloy [13]. Komarova et al. [21] has shown that the coating thickness, roughness, and the average size of the structural elements grow linearly with increasing the MAO voltage from 200 to 370 V. While, the MAO time effects only the coating thickness. Another research report [22] described the morphology, elemental composition, phase components, and bioactivity in four types of electrolytic solutions and the applied voltage in the range of 200–500 V. Among the sodium carbonate, sodium phosphate, acetate monohydrate (CA), and a mixture of CA and β-glycerophosphate disodium salt pentahydrate (GP), only the last mixture treated by high voltage could induce apatite on the titanium surface and exhibited bioactivity. Alves et al. [7] also evaluated the MAO process duration and electrolyte composition on topography, morphology, chemical composition, crystalline structure, biological and tribocorrosion behavior of the Ca- and P-coatings on cp-Ti. Finally, Tsutsumi et al. [23,24] have already described the characteristic of MAO coatings in various electrolytes and electrochemical conditions on β-type titanium alloys. The results [23] have shown that the titanium with Nb, Ta, Zr elements (TNTZ) under the MAO treatment (with a positive voltage, constant-current condition of 12 mA, and time processing of 8 min) in a mixture of calcium glycerophosphate and magnesium acetate, results in thick calcium phosphate layers formed on the TNTZ after immersion in Hank’s solution. The same research group investigated the structure, hardness, and Young’s modulus after the MAO process on Ti15Zr7.5Mo with a positive maximum voltage of 400 V and current density of 31.2 mA/cm2 applied for 10 min. The electrolyte for MAO treatment was 0.1 mol L−1 calcium glycerophosphate and 0.15 mol L−1 calcium acetate. The research has shown larger hardness (420 HV) compared to the commonly used Ti-5Al-4V alloy (320 HV) and TNTZ (180 HV), as well as higher Young’s modulus (104–112 GPa) compared to TNTZ (80 GPa) [24]. Similarly, Wang et al. [25] while studying the differences of MAO coating on Ti6Al4V and Ti35Nb2Ta3Zr, proved that titanium with Zr and Nb alloying elements possessed a better characteristic in terms of excellent corrosion resistance, hydrophilic, and film-forming properties. It can be noticed, that the most previous research with the effect of MAO process parameters on oxidized coatings has been mostly focused on the morphological features, corrosion and/or biological properties, and the studies on nanomechanical and adhesion properties of MAO coatings have been seldom reported [26]. What is more, many reports have been published on the micro-arc oxidation of titanium and its various alloys, but only little of these concern the MAO process of the very promising alloy Ti13Zr13Nb, which is characterized by excellent biocompatibility, corrosion resistance, high strength/weight ratio, good fatigue resistance, and lower Young’s modulus as compared to most of the metals [27]. Additionally, there is still very little reports on the micro-arc oxidation coatings deposited on the selective-laser melted (SLM) substrate [28]. Designing personalized implants can improve their longevity. Among others, selective laser melting (SLM) shows several advantages over conventional manufacturing techniques as a method for customized mechanical properties [29,30]. Some authors indicate that the high thermal gradient and high solidification of SLM-made alloys may affect MAO coating characteristics. For example, Yao et al. [28] obtained higher porosity with relatively smaller pores on the surface of the MAO coating applied on TC4 alloy produced by SLM, compared to other works. Some authors explained this phenomenon by an appearance of many small micro-arc oxidation discharges related to small grains size obtained by the SLM manufacturing process [31]. There are also studies, which indicate that the SLM/MAO process improves the osseointegration capacity [32,33]; however, the improvement of surface properties is rather related to the ability of additive manufacturing to produce the 3D structure which optimizes the contact interface with a human bone, than with a special microstructure characteristic.
To our best knowledge, there are no reports of the complex correlations between the MAO process parameters and growth mechanism, structural characteristics, adhesion strength, and nanomechanical behavior of MAO coatings on the selective-laser melted β-rich Ti13Zr13Nb alloy.
The main aim of this study was to investigate the complex effect of micro-arc oxidation process parameters (applied voltage, current, and duration time) in Ca- and P-containing electrolyte on the surface characteristics, early-stage bioactivity, nanomechanical properties, and adhesion between the MAO coatings and SLM-made Ti13Zr13Nb alloy. The MAO process was performed on the SLM-made and mechanically polished Ti13Zr13Nb alloy. Specimens were treated in 0.1 mol·L−1 of calcium glycerophosphate C3H7CaO6P (GP) and 0.15 mol·L−1 of calcium acetate Ca(CH3COO)2 (CA) by the DC power supply under various voltages 200, 300, and 400 V and a constant current of 32 mA for 10 and 15 min, and a constant current of 50 mA for 10 min. In order to obtain the characteristics of coatings, the topography, surface roughness, pore diameter, elemental composition, crystal structure, and surface wettability were evaluated. The ability of calcium phosphate formation on oxide coatings was examined to obtain the bioactivity characterization. Hardness, maximum indent depth, Young’s modulus, and Ecoating/Esubstrate, H/E, and H3/E2 ratios were determined with the nanomechanical evaluation while the MAO coating adhesion was estimated by the scratch test.

2. Materials and Methods

2.1. Specimens Preparation

The cylindrical specimens (discs 20 mm in diameter and 3 mm thick) were manufactured by the selective laser melting (SLM) additive technique while using Ti13Zr13Nb spherical powder (TLS Technik GmbH & Co. Spezialpulver KG, Bitterfeld-Wolfen, Germany) with particle size ranging from 20 to 70 µm. Samples were designed using the Materialise Magics (Materialise NV, Ghent, Belgium) software. The used SLM 100 apparatus (Realizer GmbH, Borchen, Germany) was equipped with the ytterbium one mode fiber laser CW YLR-100-SM (IPG Laser GmbH, Burbach, Germany) using a 1070 nm wavelength. The laser melting process was carried under a protective argon atmosphere and other process parameters (i.e., spot diameter, laser power and scanning speed, and layer thickness) are patent pending. The samples were mechanically polished using #150, #320, #600, and #800 grid SiC abrasive papers and ultrasonically cleaned with acetone, isopropanol, and distilled water for 10 min each. After ultrasonication, the specimens were dried in ambient air.

2.2. MAO Coating Preparation

The micro-arc oxidation process was performed with a DC power supply (PL-650-0.1, Matsusada Precision Inc., Shiga, Japan) under various voltages 200, 300, and 400 V and a constant current of 32 mA for 10 and 15 min, and a constant current of 50 mA for 10 min. The labels of MAO coatings formed at the different parameters are shown in Table 1. The MAO was conducted in 1 L of an aqueous electrolyte with contents of 0.1 mol·L−1 calcium glycerophosphate C3H7CaO6P (GP) and 0.15 mol·L−1 calcium acetate Ca(CH3COO)2 (CA), as P and Ca ions source, based on previous studies [34,35]. Ti13Zr13Nb was used as an anode and a cylinder made of AISI 304 stainless steel as a cathode. Each disk was fixed onto a polytetrafluoroethylene holder with an O-ring. Details of the working electrode were as described in [36]. A magnetic stirrer rotating at 200 rpm was used to create a turbulent flow regime, and the glass container was kept in a water-cooled bath at room temperature. After the MAO treatment, the surfaces were washed in ultrapure water and dried. The control group called “control” are represented by the Ti13Zr13Nb SLM-made specimens after polishing without the MAO treatment.

2.3. MAO Coating Characterization

Process parameters (current and voltage) were continuously recorded at intervals of 0.1 s by a sensor interface (PCD-300A; Kyowa Electronic Instruments Co., Ltd., Tokyo, Japan). The content of the ripples was controlled to less than 0.1%. Scanning electron microscopy (SEM; S-3400NX, Hitachi High-Technologies Corp., Tokyo, Japan) was used to characterize the surface morphology. The samples’ topography, surface roughness, and pore diameter, were evaluated by the laser scanning microscope (LSM; Olympus LEXT OLS4100 3D, Tokyo, Japan). The thickness of MAO coating was measured by the coating thickness gauges Elcometer 456 (Elcometer, 456, Elcometer Inc, Michigan, MI, USA) in a range of 0–1500 μm and ±1% accuracy. The elemental compositions of the samples were analyzed using energy dispersive X-ray spectrometry (EDS; S-3400NX, Hitachi High-Technologies Corp., Tokyo, Japan). X-ray diffraction (XRD, BRUKER D8 DISCOVER, Bruker AXS KK, Yokohama, Japan) was performed to characterize the crystal structure of the specimens. The surface wettability was determined by the contact angle (CA) measurements with the falling drop method while using an optical tensiometer (Attention Theta Life, Biolin Scientific, Espoo, Finland). The volume of the liquids was about 1 μL/sample. Measurement was carried out immediately after the deposition of the drop of the liquid while using the OneAttension program (Biolin Scientific, Espoo, Finland).

2.4. Bioactivity of the MAO Coatings

The ability of calcium phosphate formation on the oxide coatings was evaluated by an immersion test in Hank’s solution (0.005 L) with a pH value of 7.4 and concentration similar to the extracellular fluid. The composition of the fluid is shown in Table 2. The specimens were immersed in the solution at 310 K for 72 h. After the test, specimens were rinsed in ultrapure water. Calcium phosphate formation on the specimens was evaluated with the scanning electron microscopy (SEM; S-3400NX, Hitachi High-Technologies Corp., Tokyo, Japan) and energy dispersive X-ray spectrometry (EDS; S-3400NX, Hitachi High-Technologies Corp., Tokyo, Japan).

2.5. Nanomechanical Properties of MAO Coatings

Nanomechanical properties of MAO coatings, i.e., hardness, maximum indent depth, Young’s modulus, and Ecoating/Esubstrate, H/E, H3/E2 ratios were determined using a nanoindenter (NanoTest Vantage, Micro Materials Ltd., Wrexham, UK) with Berkovich three-sided pyramidal diamond with an apex angle equal to 124.4°. The tests were performed with a maximum force of 50 mN, loading and unloading times equaled to 20 and 15 s, respectively, and the cycle had 5 s dwell at a maximum load. Hardness (H), reduced Young’s modulus (Er), and Young’s modulus values were determined using the Oliver-Pharr method [37] based on the NanoTest results analysis program. In order to convert the reduced Young’s modulus into Young’s modulus, a Poisson coefficient of 0.3 was assumed for the coatings [38]. For all tested specimens, the twenty-five independent measurements were performed.

2.6. MAO Coatings Adhesion Properties

The adhesion strength of the MAO coatings was estimated by NanoTest™ Vantage (Micro Materials, Wrexham, UK) using the Berkovich three-sided pyramidal diamond the same as mentioned above. The test parameters were as follows: Load equal was 400 mN, the loading rate was 1.3 mN/s, and scratch length was 10 μm. The way of loading was linear and continuous. The adhesion of the coating was assessed based on the observation of an abrupt change in frictional force during the test. The failure events were examined by an optical microscope.

2.7. Statistical Analysis

Statistical analysis of the data was performed with the commercial software OriginPro 64 (OriginLab, Northampton, MA, USA). The Shapiro-Wilk test was used to assess the normal distribution of the data. All of the results were presented as the mean ± standard deviation (SD), and they were statistically analyzed with a one-way analysis of variance (one-way ANOVA). Multiple comparisons versus the control group between means were performed using the Bonferroni t-test with the statistical significance set at p < 0.05.

3. Results and Discussion

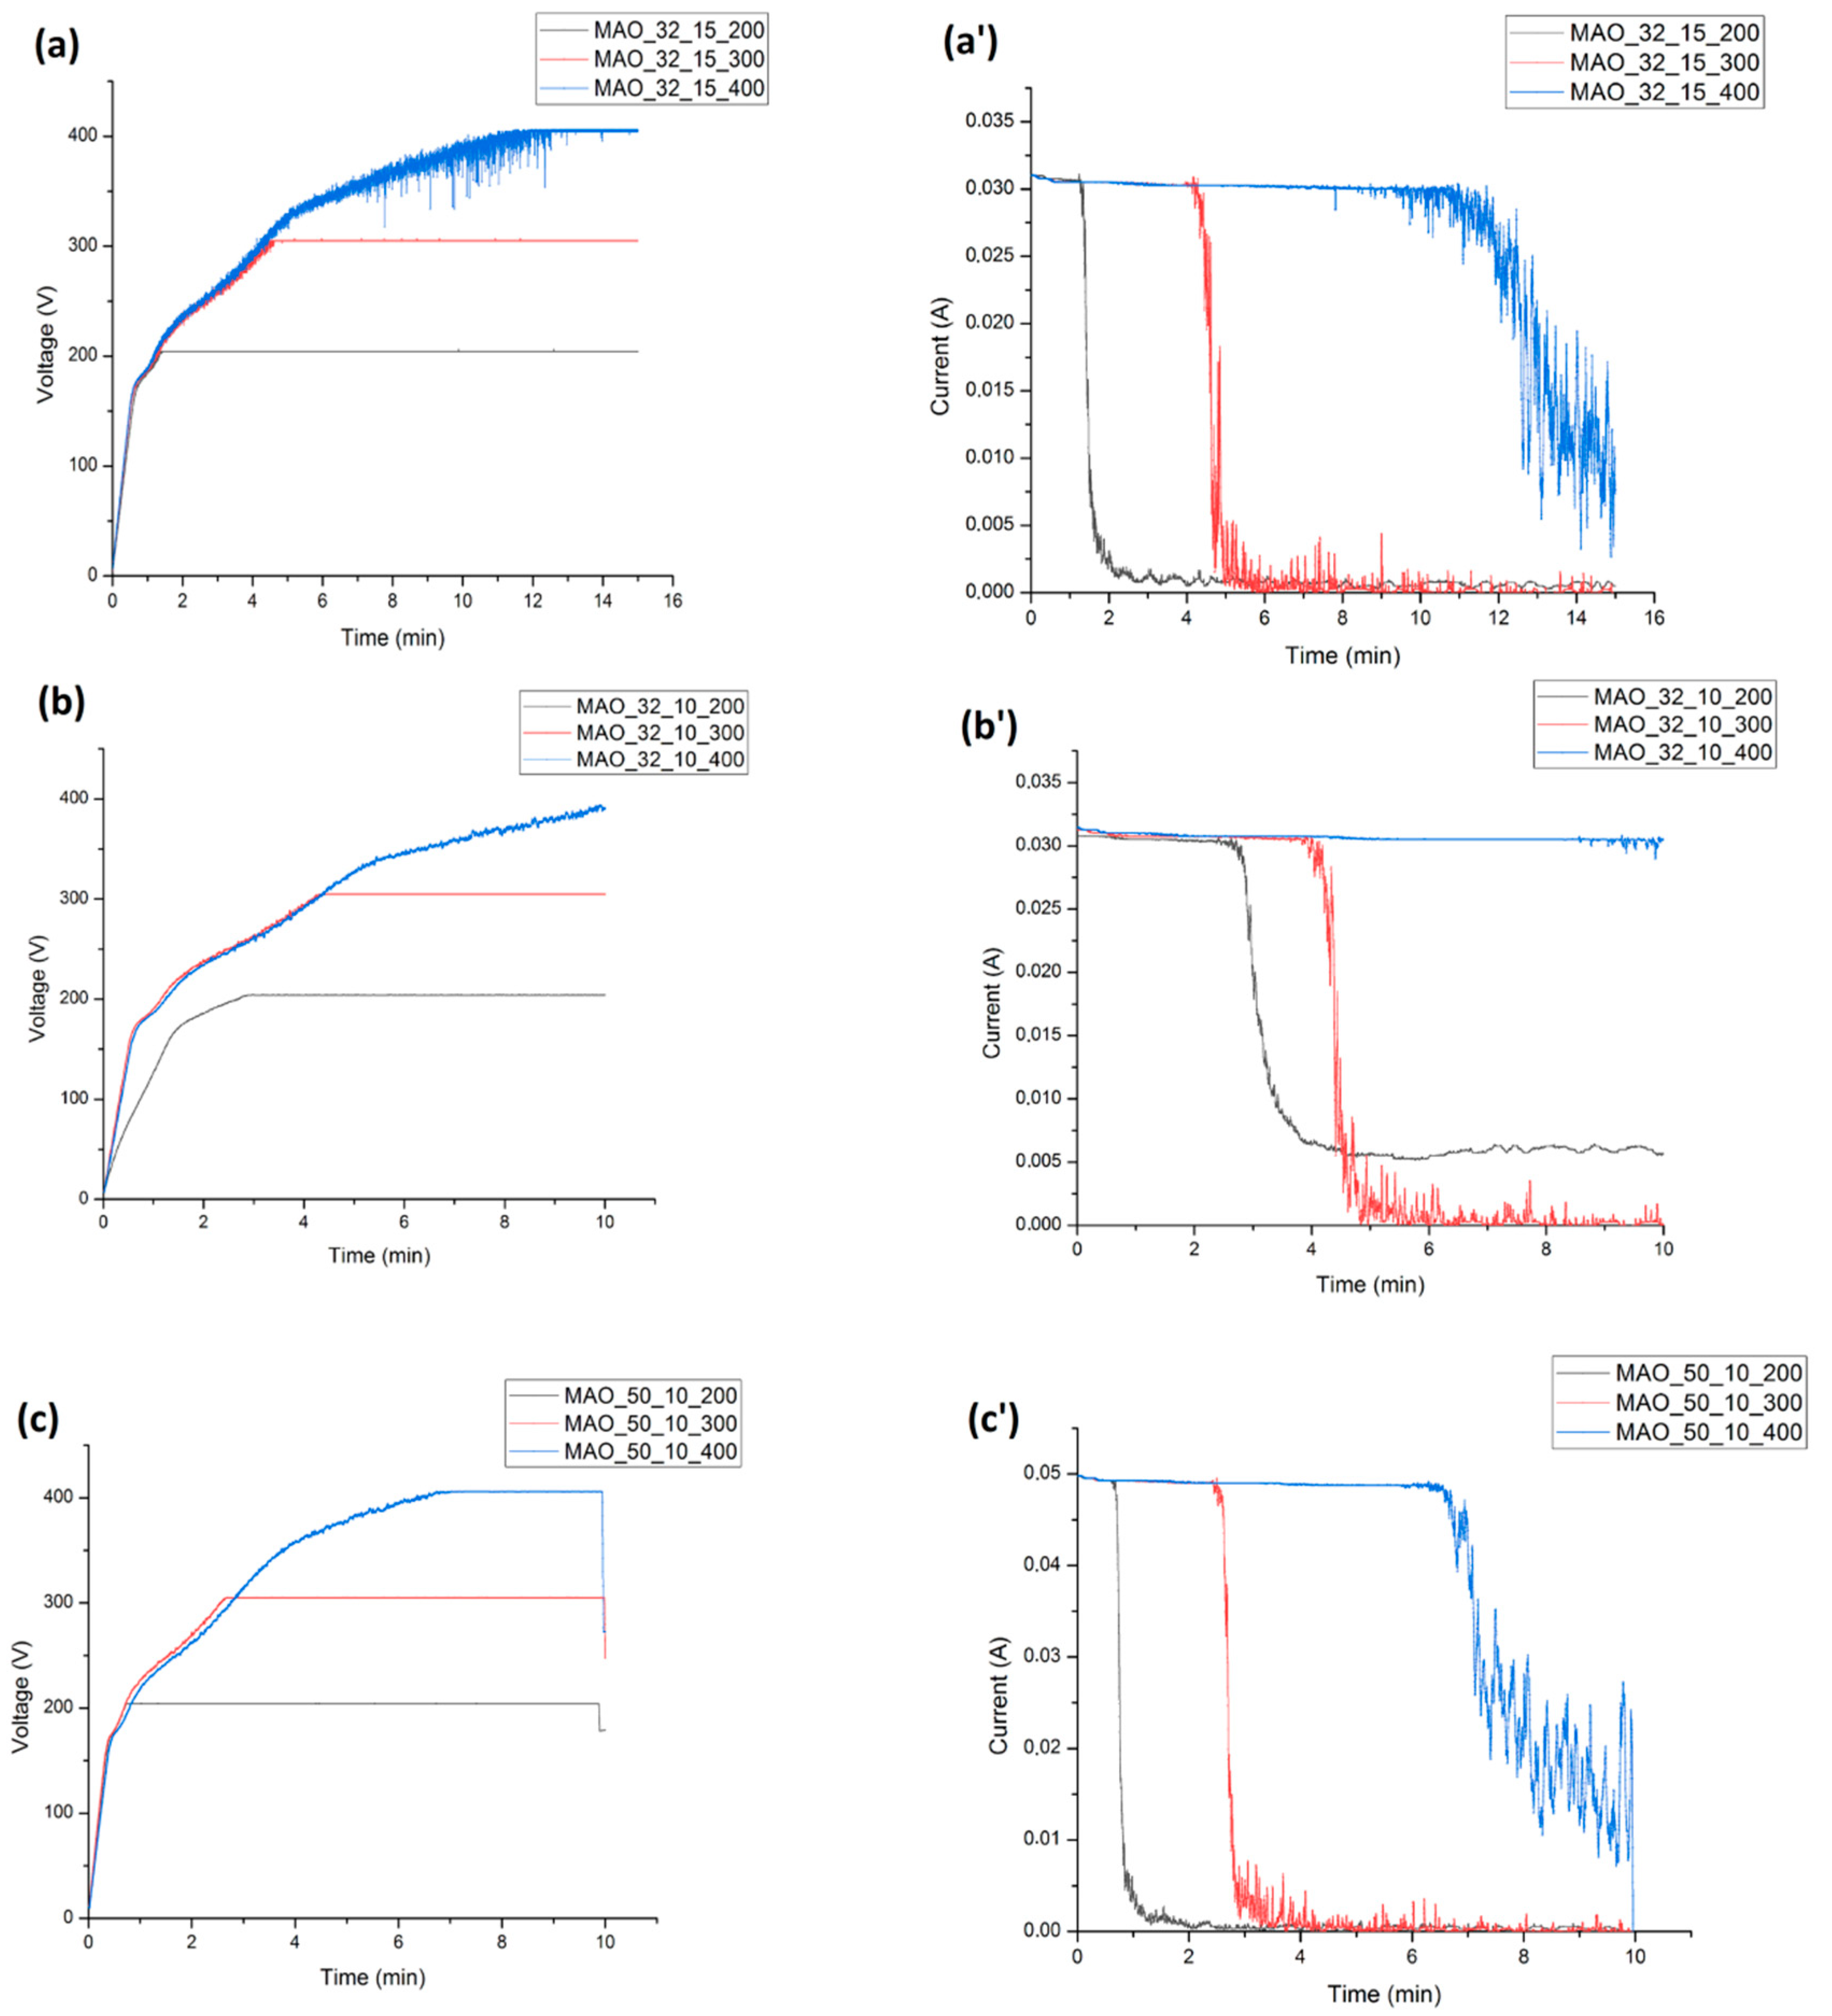
3.1. MAO Process Characterization

The MAO process characterization was analyzed by the time-dependent relations of voltage and current, as shown in Figure 1. The curve characteristic is typical for the MAO process, where the variation of voltage can be divided into three stages [39]. First, the voltage increases linearly due to the formation of an initial dioxide film. During the second stage, the voltage increases slowly, which corresponds to the beginning of the micro-arc oxidation process, where the oxide layer is broken down to form a discharge channel. As the reaction progresses, with the increase of layer thickness, the voltage keeps increasing. During the last stage of the MAO process, the voltage fluctuates near the plateau with numerous sparks on each sample surface until the end of the treatment. A similar behavior was also observed by Qian [40]. Similarly, during analyzing the current-to-time curve, we can notice that the current decreases with increasing the MAO treatment time. In the first stage, the current is constant and stays on its highest value due to the formation of a compact and thin oxide layer (resulting in a better surface conductivity). When the system reaches the selected potential, a dielectric breakdown of these films and micro-arc discharge start to occur. With layer growing, the conductivity decreases, the sample electric resistance increases, and the current density decreases intensively [12]. Finally, the thickness of a coating prevents dielectric breakdown, and the current takes the minimum values near a plateau section of the current. This behavior is confirmed by the reports of Sobolev et al. [41] and Komarova et al. [21], and is correlated with optical observations. During the first stage, gas bubbles on the materials’ surface could be seen. During the second stage, white and tiny electric sparks appear, and with increasing time, they become larger and more intense. In the third stage, the MAO process varies in different conditions. When the MAO treatment was conducted at 400 V, the arcs became stronger while their number decreased. In contrast, when oxidation was performed at 200 V, after reaching the maximum voltage, the micro-arc sparks became weak and fewer in number. It can be seen that the intensity of the micro-arc oxidation increases while the value of maximum voltage increases. The presence of pulses on the curves indicates the periodic nature of electrical discharges. The highest dielectric breakdown behavior of the process at an applied maximum voltage of 400 V could be observed.
From a comparison of curves, it can be noticed that at current 32 mA and time 15 min, the maximum voltage of 200, 300, and 400 V is reached after 80, 261, and 641 s, respectively (the accuracy of determining the time was estimated at 2 s and current value at 0.001 A. When the time of the MAO process was reduced from 15 to 10 min, the relations of MAO_200 and MAO_300 were similar to those observed for 15 min (Figure 1a,a’ and b,b’), while for MAO_400, the limited time of 10 min occurred to be too short to obtain an expected voltage (the maximum registered value was 391 V). The incomplete MAO process significantly affected the coatings’ characteristics. The time needed to obtain the final voltage 200, 300, and 400 V was about two-times shorter (42, 153, and 381 s, respectively), when the initial current increased from 32 to 50 mA (Figure 1b,b’ and c,c’) indicating that the film could be faster formed at these process parameters. The average value of current obtained in the third stage of the process was similar under voltage 200 and 300 V, but if the treatment voltage was 400 V, the average minimum values near a plateau section were higher compared to those under 200 and 300 V. The effect can be attributed to the changing electrical resistance of the oxide layer.

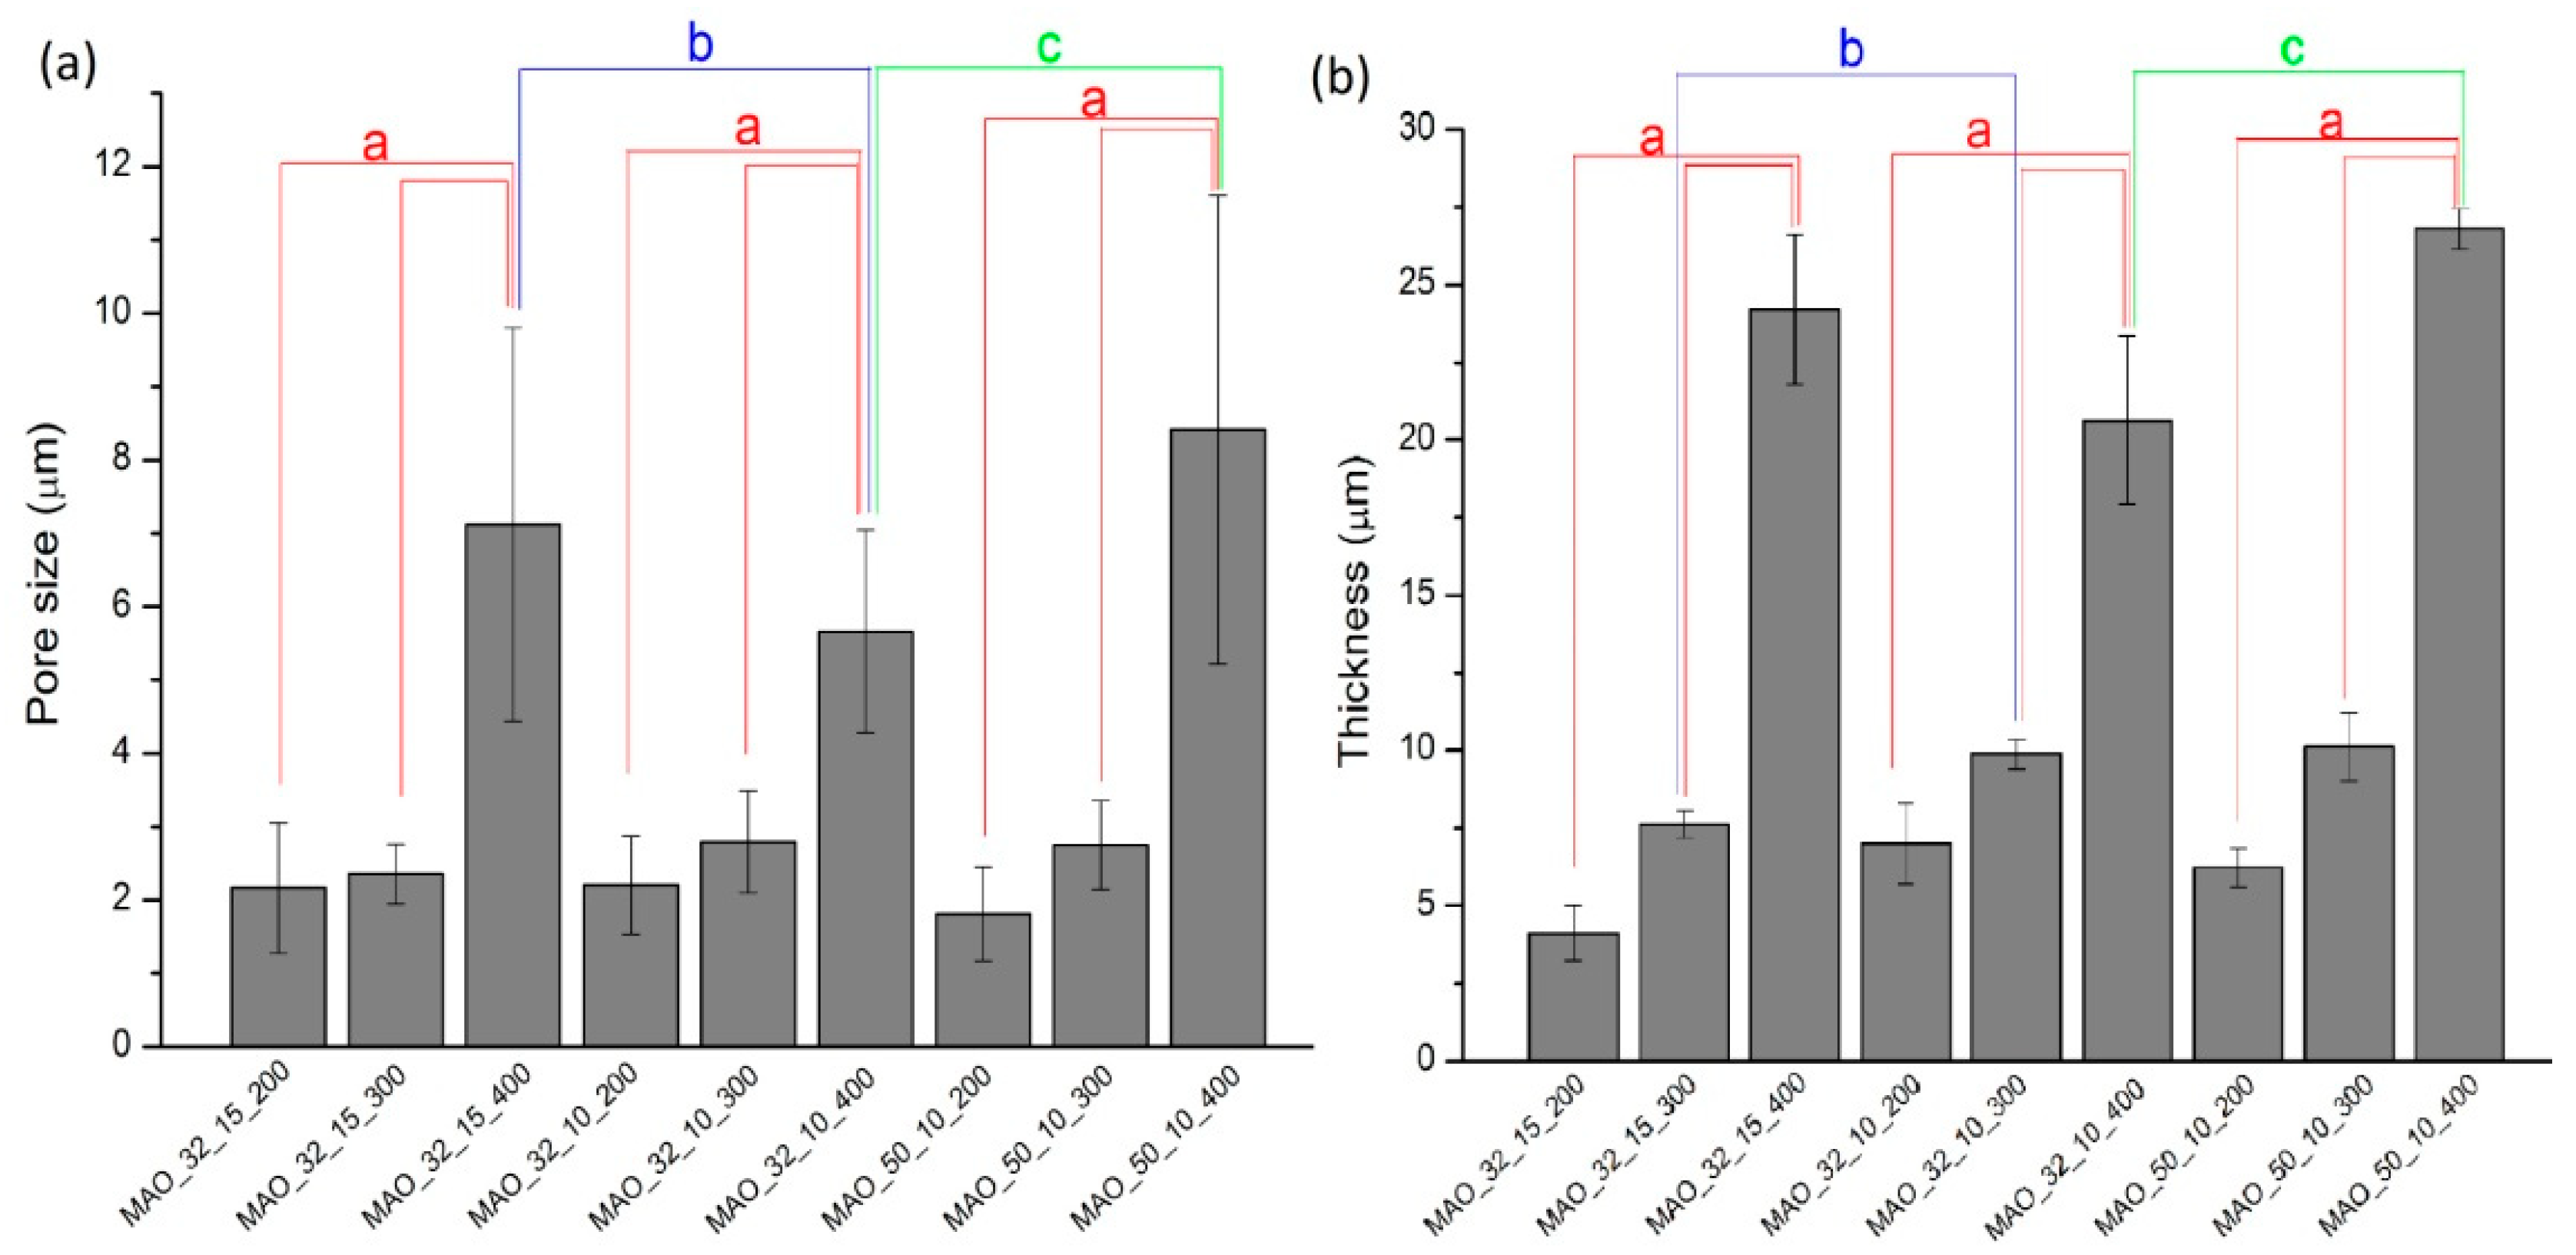
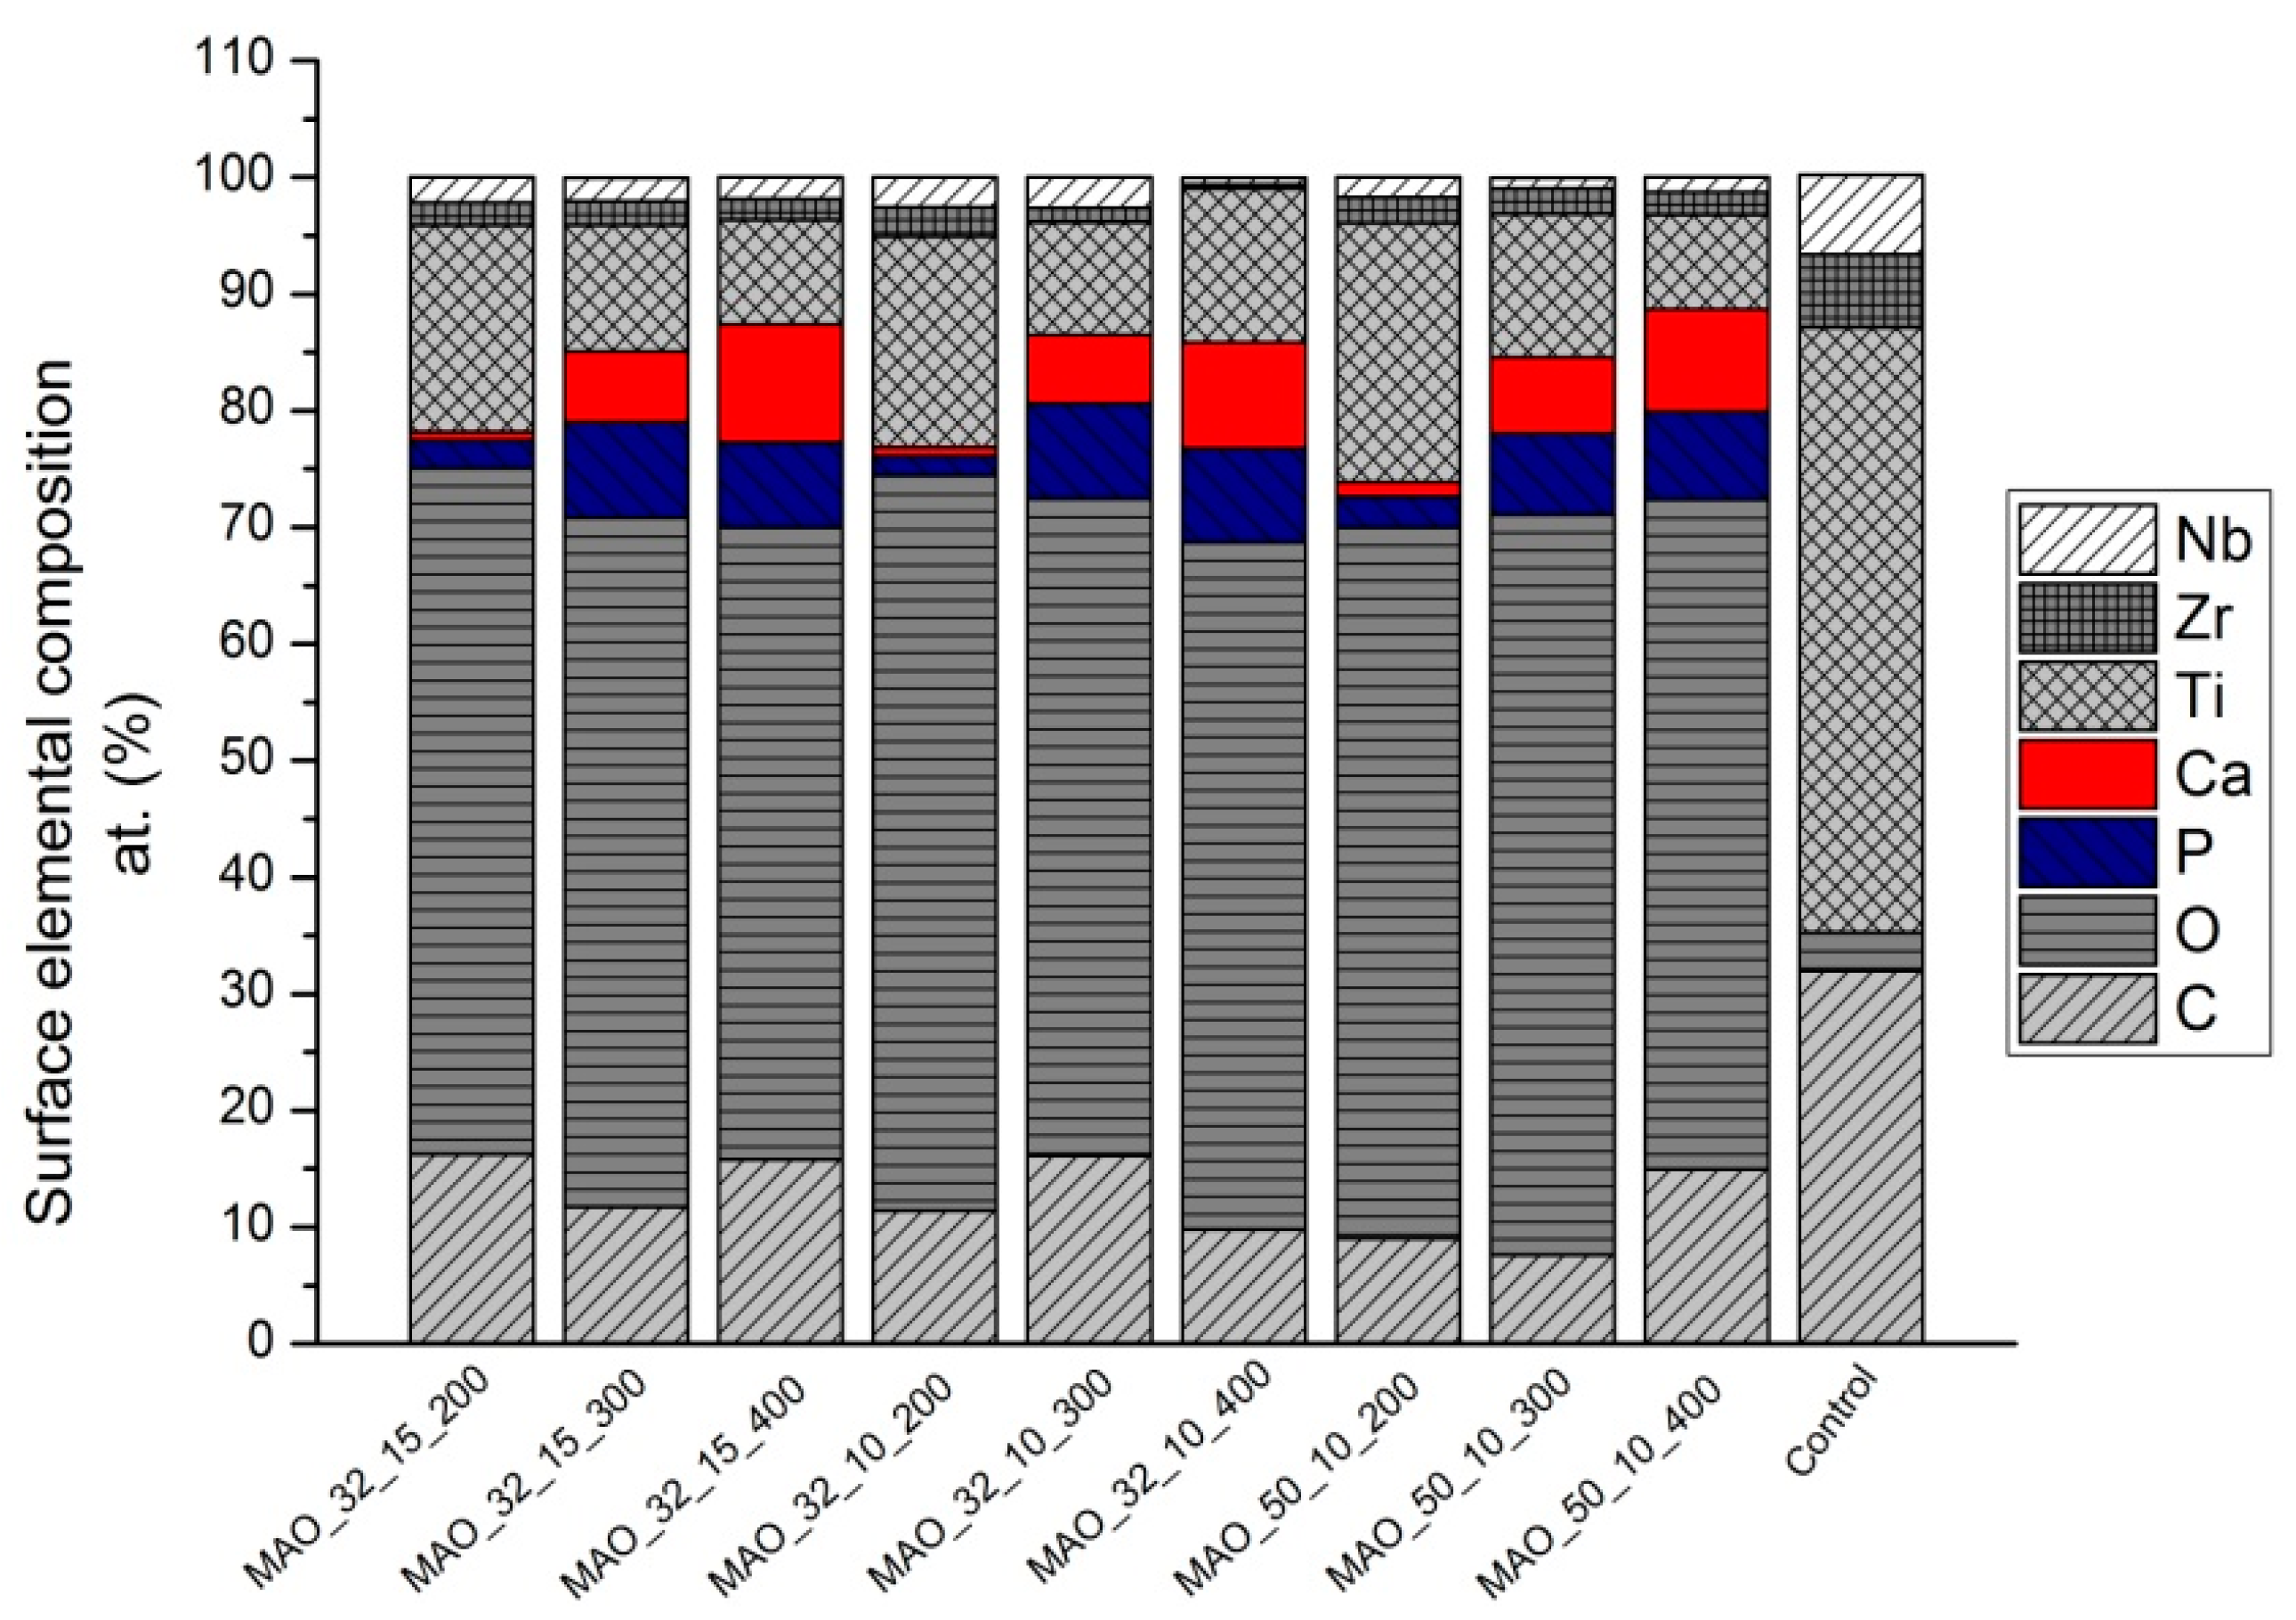
3.2. MAO Coating Surface Evaluation

The surface morphology of the Ti13Zr13Nb alloy samples treated by the MAO in various process conditions was observed by SEM, as shown in Figure 2, the dimensions of the pores were calculated using ImageJ software, while the MAO coating thickness was evaluated by using coating thickness gauges. The average diameter of pores varied from 1.8 to 8.4 μm (Figure 3a), with applied voltage increasing in the range of 200–400 V, for all current and time values. Samples treated under lower maximum voltages, 200 and 300 V, possessed similar average pore sizes, however, their shape and distribution differed from each other significantly. At the lowest voltage (MAO_200), the samples‘ surfaces revealed mainly few irregularly distributed micropores with size equal to 2.17 ± 0.89, 2.20 ± 0.66, and 1.80 ± 0.64 μm (for MAO_32_15, MAO_32_10, and MAO_50_10, respectively). Additionally, on the surface, two characteristic regions can be observed (Figure 2a) with micropores (region II) and without micropores (region I). It could be assumed that at the selected potential 200 V, a dielectric breakdown of films and micro-arc discharge was not effective to form a fully porous coating. When limited voltage was 300 V, the sustainable and stable (Figure 1b) electrolytic plasma discharge resulted in regularly distributed pores over the surface with a relatively uniform pore diameter 2.36 ± 0.4, 2.80 ± 0.67, and 2.75 ± 0.61 μm for MAO_32_15_300, MAO_32_10_300, and MAO_50_10_300, respectively. As the MAO was performed at 400 V, the surfaces showed a crater-like structure with statistically the biggest pores about 7.13 ± 2.68, 5.66 ± 1.38, and 8.41 ± 3.19 μm for MAO_32_15_400, MAO_32_10_400, and MAO_50_10_400, respectively. The size of the micropores increased as some discharge channels connected and became larger. What is more, in these process conditions, the presence of tiny cracks can be observed (Figure 2c). The formation of microcracks may be caused by thermal stress [42] either due to the breakdown of the electrolytic plasma bubbles at the alloy surface which constantly release a large amount of energy, by rapid condensation of the molten compound during their exposition to the cold electrolyte [43] or rapid oxides‘ transformation from amorphous to crystalline form [44]. In a similar study, Correa et al. [14] observed qualitatively similar MAO samples’ morphology of the Ti15ZrxMo alloy subject to the anodic treatment carried out for 10 min at the same electrolyte concentration (Ca + GPa) under the maximum voltage limited to 300, 350, and 400 V. In this case, the pore sizes were smaller as compared to our study and were as follows: 1.6–1.8 μm for 300 V, 2.2–2.8 μm for 350 V, and 2.8–4.5 μm for 400 V. The addition of MO which improves the corrosion resistance may have distinct effects on the dielectric barrier of the films.
Taking into consideration the standard deviation value of pore size, the most extensive and hardly reproducible structure was obtained at the highest maximum voltage, especially at the highest current parameter for MAO_50_10_400. While, the most regular and predictable structure was obtained for the middle value of voltage (300 V), in particular for MAO_32_15_300. It can also be noticed that in the case of MAO coatings treated in 400 V, shortening the process time from 15 to 10 min in the same current conditions, decreases the pore size, while increasing the current from 32 to 50 mA in the same time process conditions results in a bigger pore size (Figure 3).
The anodic treatment resulted in pores with a wide range of sizes. Alves et al. [12], applying the MAO at similar anodic treatment conditions, obtained smaller pore sizes (0.5–5 μm), compared to our results. The decrease of the pore size could be caused by lower electrolyte concentration (GP and CA). The increase in the size of the pores with increasing electrolyte concentration was also reported by Ishizawa et al. [45] for anodic titanium oxide films containing Ca and P.
The MAO coating thickness also increased with increasing voltage and varied from 4.1 to 26.8 μm, for MAO_200 and MAO_400, respectively. Sedelnikova et al. [16] reported that CaP coatings on Ti and Zr1Nb increased linearly from 10 to 110 μm with the voltage rising from 150 to 300 V. Chen et al. [46] obtained the MAO film on Ti39Nb6Zr of 15 μm in thickness during a 10 min treatment at 400 V. While Karbowniczek et al. [47] observed that the MAO coatings ranged from 16 to 60 μm in thickness, depending on the Ca/P ratio in an electrolyte. According to the literature, when a current density grows, the coatings deposition rate increases [48]. However, in our study only MAO_400 fulfills this assumption.
The results of microstructural characterization are in line with the average surface roughness (Ra) where with increasing voltages, the Ra value also increases (Table 3). The significant (p < 0.05) highest value of Ra parameter was observed at 400 V in each time and current conditions. MAO_32_10_400 has a statistically lower Ra parameter compared to other samples treated in 400 V, due to the “unfinished” micro-arc oxidation process (Figure 1b). When the MAO process was carried out at the same time oxidation but under higher current, the Ra parameter increased, its value being close to that of MAO_32_15_400. The obtained results are consistent also with SEM images, in which better surface development is observed at increasing voltage. Increasing values of roughness parameters for MAO_400 are associated with the existence of the additional craters and a hill-like structure caused by aggressive plasma discharge. The obtained results are in line with previous reports [16,25,49]. Karbowniczek et al. [47] using the same electrolyte but under pulsed DC with 400 V and time of 5 min obtained Ra = 1.6 μm. Lin et al. [46] reported on Ra = 1.86 μm for the MAO treated Ti39Nb6Zr alloy after 10 min under 400 V. Sedelnikova et al. [16] showed that alloys containing Zr and Nb demonstrated lower values of roughness compared to pure Ti.
The EDS microanalysis of the MAO coatings revealed the different amounts of elements throughout the coating surface in relation to the MAO process conditions (Figure 4). The MAO coatings formed in the electrolytes are mainly composed of Ti and O. The oxygen concentration on MAO samples is about 60%, which is the result of intense anodization [50]. As seen, in each of the MAO specimens, Ca, P, Ti, Zr, and Nb elements appear. It could be speculated that Ca and P from the electrolyte were incorporated into the oxide layers on the substrates during the arc discharge process, while the Ti, Zr, and Nb elements were detected from the titanium alloy substrate [51]. It can be also noticed that with the increasing applied voltage, the concentration of Ca increases, Ti decreases, while the P compound content first intensively increases with the increasing voltage ranging from 200 to 300 V and then slightly decreases. This phenomenon has been previously observed [52] and can be correlated with an increase in the intensity and temperature of the micro-arc discharges leading to the increase of the reactive capacity of all electrolyte components. It was also found [45] that sodium glycerophosphate and calcium acetate were suitable for the electrolytes to form a coating possessing the Ca/P ratio as that of hydroxyapatite (1.67). In this study, with the increasing voltage, the Ca/P ratio also increased; however, the value was smaller than that of bone-apatite. The highest value was measured for MAO_32_15_400 while the lowest for MAO_32_15_200 specimens (1.38 and 0.31, respectively). On the other hand, Han et al. [22] presented a study showing that specimens with a Ca/P atomic ratio of 1.73 did not exhibit apatite-induced ability, while the specimens with higher Ca and P content, but lower Ca/P atomic ratio induced an apatite appearance on the surface. These observations confirm that the MAO process not only affects the surface morphology but also influences the chemical composition of the oxide films as well.
Additionally, the high value of carbon (C) content, especially for control specimens, can be noticed. According to the literature, it is very difficult to obtain and analyze the reliable value of C content using energy dispersive X-ray spectrometry and the results significantly vary from each other from 2.1–5.7 (wt.%) [6], even to more than 27 (wt.%) [24], depending on the research group. Some authors did not include in their analysis the C content [51] at all. The high value of carbon detected during the EDS examination may be related to the contamination coming from the CO2 atmosphere during the MAO treatment, from the internal walls of the vacuum chamber in SEM, as well as from accidentally improper samples storage [53]. In the future, it is worth considering eliminating the EDS analyses of such elements such as carbon.
In Table 4, the wettability measurements of each specimen are presented. They revealed that all specimens were characterized by hydrophilic surfaces (CA < 90°). The contact angle of the substrate and MAO coatings were in the range 35–64°. As a comparison, Ming-Tzu Tsai [54] obtained for the MAO treated Ti specimens, the contact angle equaled to 50.7° ± 5.6°. The wettability of a surface is crucial for the adsorption of proteins and the cell adhesion [38], with optimal value suggested for 35–85° [55]. Although only the MAO_32_10_400, MAO_50_10_400, MAO_32_10_200, and MAO_32_15_300 specimens significantly (p > 0,05) improved the surface wettability compared to the control group; it could be said that all specimens fulfilled this criterion. The literature [14] discloses that the contact angle of the MAO coatings increases with the rising applied voltages, which may be correlated (among others) with a higher value of roughness [19], and/or capillary forces between volcano-like pores and contacted distilled water [56]. However, in this study, only MAO_32_15_400 is in line with this relation, but surface wettability may be strongly affected by other parameters such as morphology, crystallinity, and chemistry [57].
The XRD patterns of a control group and the micro-arc oxidized samples obtained at various applied voltages, and constant current 32 mA and time processing of 15 min are shown in Figure 5. In a case of a control group (Figure 5d), besides titanium peaks (α-, β-phase) related to the titanium alloy substrate, the rutile and anatase oxides were detected. It confirms a good ability of Ti13Zr13Nb alloy to self-passivation [58]. On the surface after the MAO treatment, among the titanium oxides, rutile, and anatase peaks appeared at all the applied voltages (Figure 5a–d). Additionally, at the lowest values of voltage (200 and 300 V), titanium peaks (α-phase) were also observed (Figure 5a,b). The intensity of the peaks slightly decreased with the increasing limiting voltage, which could be related to the oxide layer growth. For the highest applied voltage (400 V) (Figure 5c), the oxidized surface layer became mainly a mixture of anatase and rutile. The presence of anatase suggests that a vigorous oxidation reaction has occurred on a titanium surface during the MAO process [2]. The Ti peak on the XRD patterns may be correlated with X-ray penetration through the coating. According to the previous study, TiO2 can exist in the three crystalline polymorphs (anatase, rutile, and brookite). The literature also indicates that mostly anatase is formed at lower forming voltages, while the combination of anatase and rutile phases appear at higher forming voltages since anatase as a metastable-phase gradually transforms into rutile at higher temperatures with the increasing dielectric breakdown phenomena [59]. Wang et al. [25] showed that alloys contained Nb ad Zr elements could form a number of anatase phase grains higher than those of rutile phase during high voltage (400 V) oxidation, compared to pure Ti and Ti6Al4V, which enhanced their bioactivity. No more phases were detected by the XRD analysis despite the fact that the EDS analysis also showed incorporation of Ca and P ions. The additional phases may appear in the amorphous or crystalline structure at a content that is below the detection limit of XRD [22]. These phenomena are in line with the literature; Zhang et al. [60] did not find any peaks from hydroxyapatite with the Ti-MAO sample in the CA and GP solution, while Han et al. [22] observed only Ca- and P-containing phase by employing the CA- and β-GP solution at higher voltages, up to 450 V.

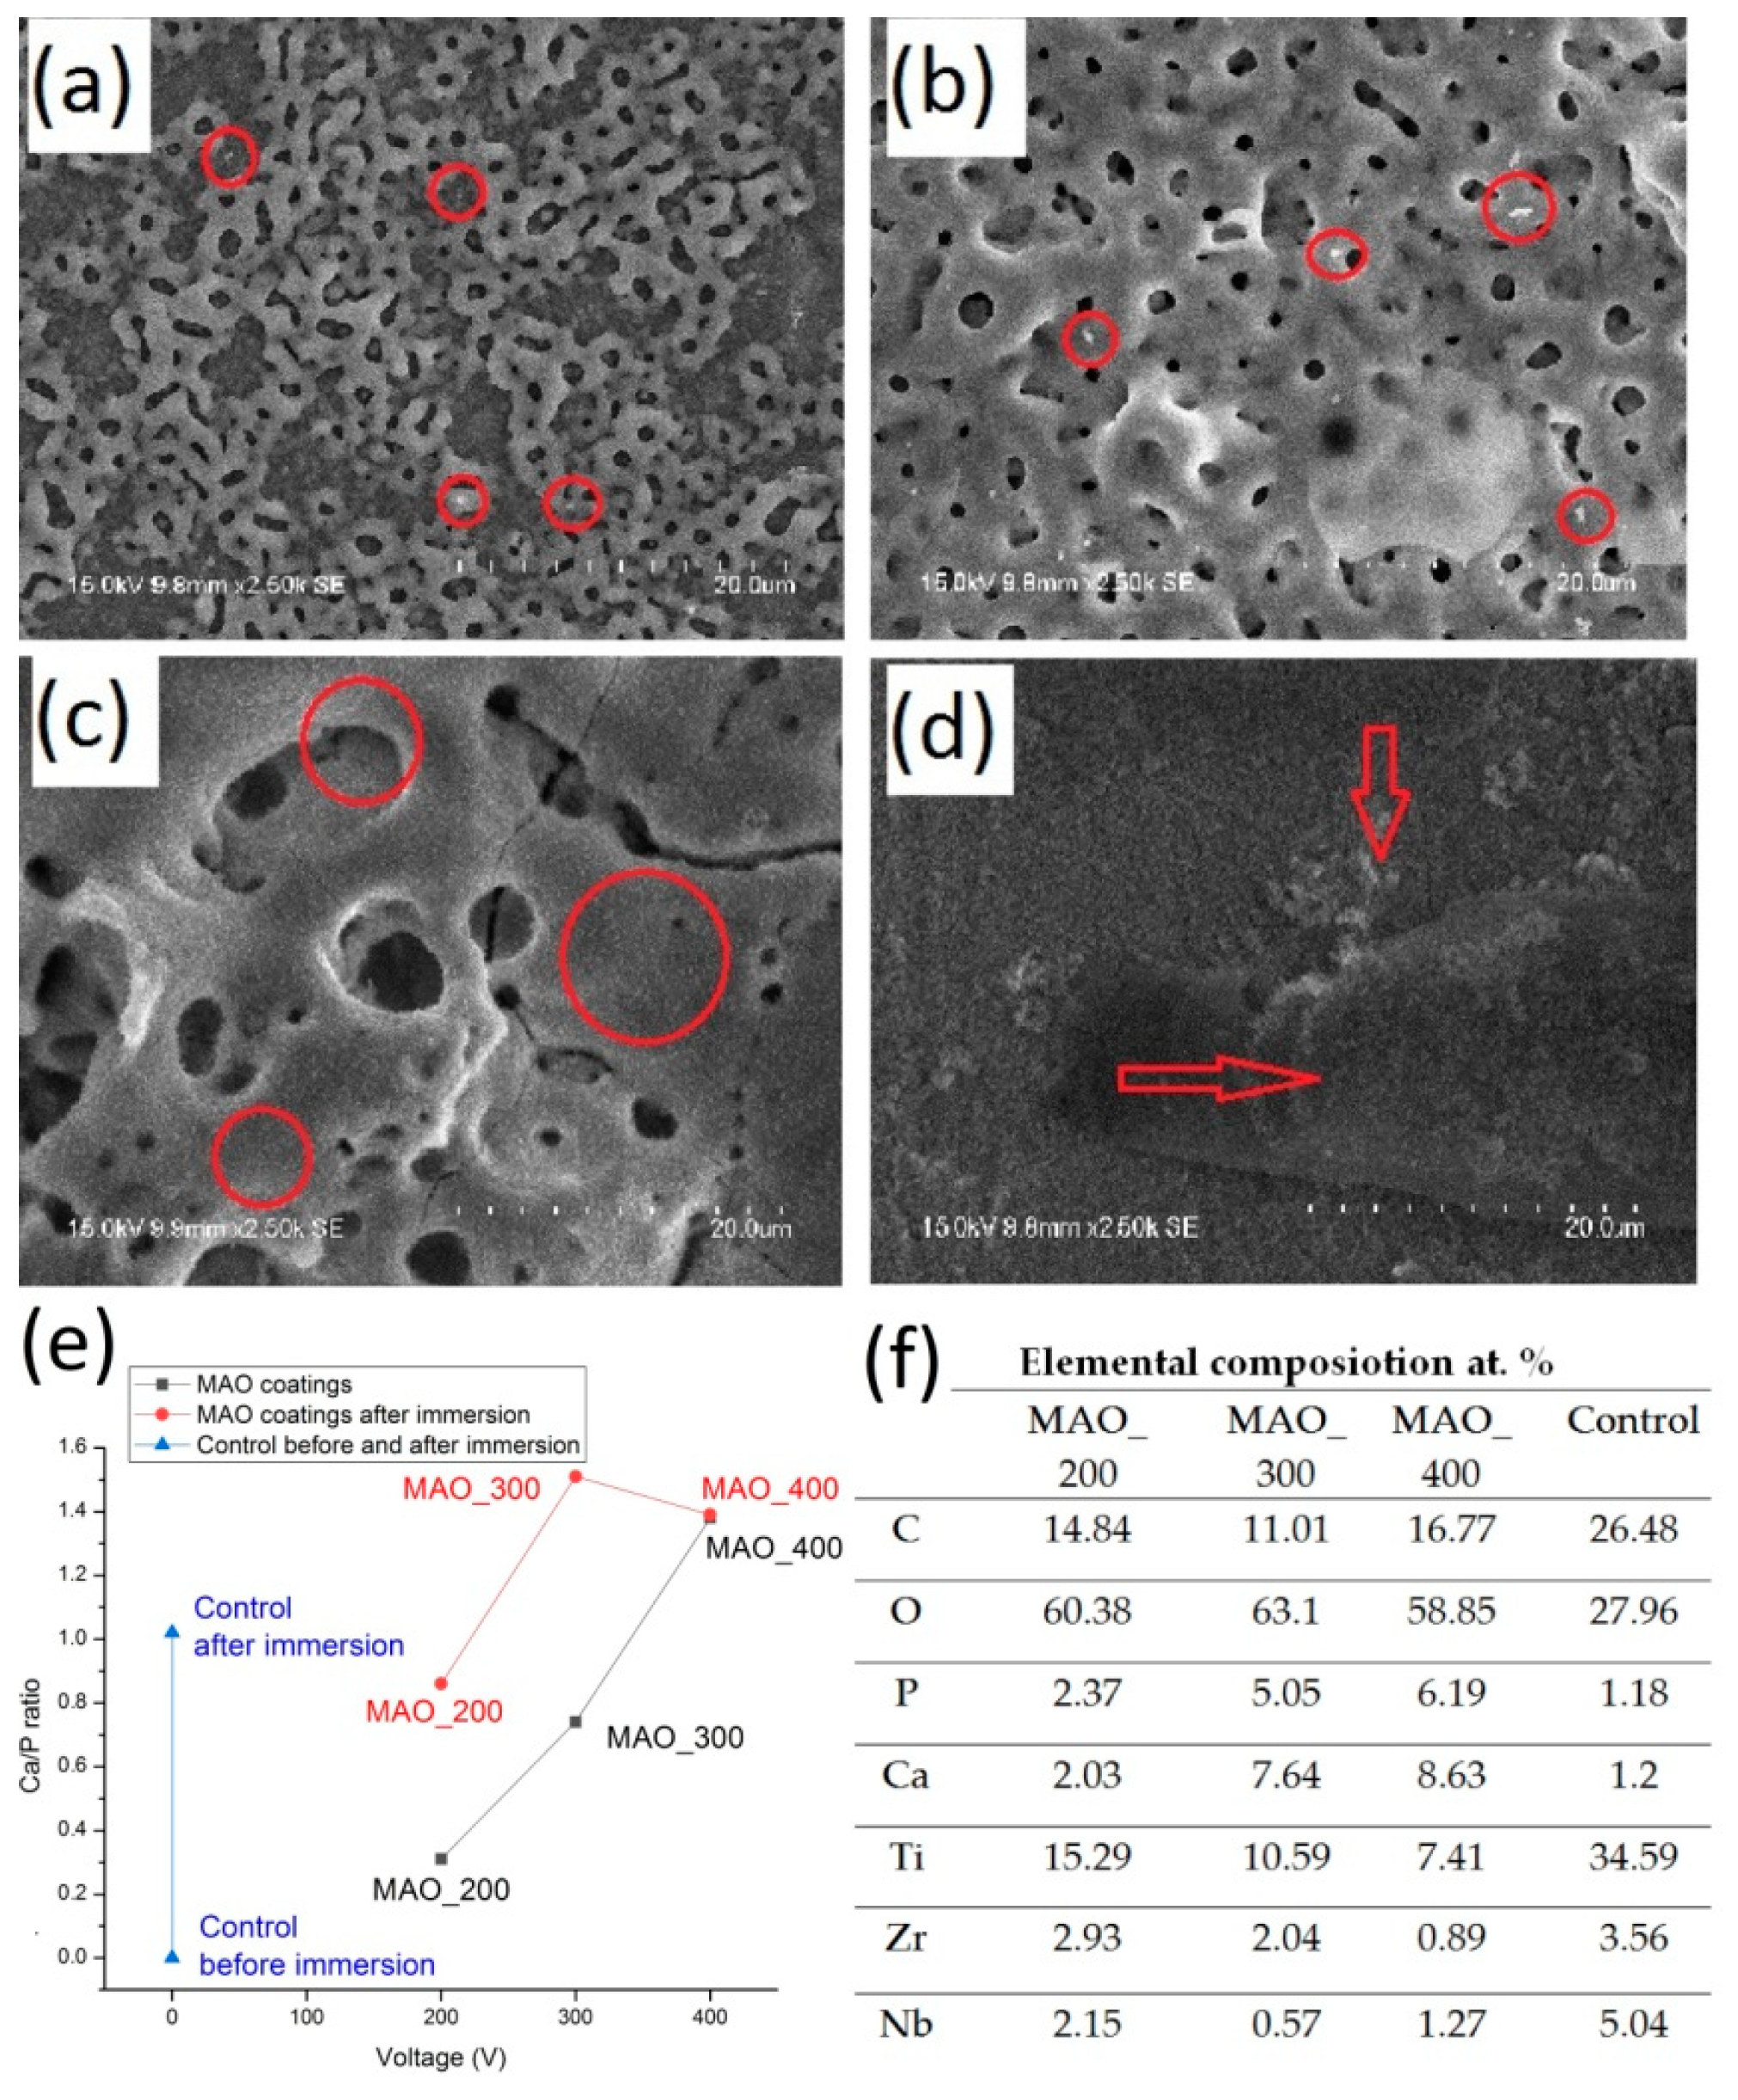
3.3. Early-Stage Bioactivity of the MAO Coating

To investigate the early-stage bioactivity of the substrate and MAO coating under various maximum voltages, the specimens were immersed in Hank’s solution for 72 h. The surface morphologies of the example of the samples after immersion are shown in Figure 6. It can be noticed that there are a few white particles randomly scattered on the sample surface (Figure 6a,b) or riddle-like small particles (Figure 6c,d) rich in Ca and P elements (Figure 6e,f). Other authors also observed similar morphologies with the spherical particles and precipitate layer being reported as apatite [19,60,61].
The elemental composition of the post-immersed substrate and samples with MAO coatings, and Ca/P ratio are shown in Figure 6e,f. It can be observed that with the increasing voltage, the Ca and P values also increase. Additionally, all post-immersed MAO specimens are characterized by a higher Ca/P ratio as compared to a substrate (control). The Ca/P ratio after immersion for specimens treated at 200 and 300 V is about two times higher than before immersion (0.85 and 1.51, respectively). While for specimens treated under 400 V, the Ca/P ratio decreases and is almost the same as the value before immersion. It is difficult now to propose any model explaining the relative decrease in P content with the increasing voltage, but it may be somewhat attributed to the different chemical potentials of deposition of both ions and their different relations of chemical potentials on the electrochemical voltage. The results are in line with a report of Qing et al. [19] that presents that the MAO coating formed at 350 V shows better apatite-inducing ability as compared to the MAO process carried out at higher voltages (400, 450, and 500 V). The value of the Ca/P ratio being the nearest to stoichiometric hydroxyapatite (1.67) was obtained by specimens treated under 300 V (1.51). Anyway, the ratio Ca/P demonstrates the surfaces’ ability to induce the precipitation of calcium phosphate.
According to the literature, due to nucleation of apatite and diffusion of Ca and P ions from the MAO coating into Hank’s solution, the degree of local supersaturation increases, and apatite nuclei are spontaneously growing. Moreover, the increase in the aperture and surface roughness of the MAO coating also accelerate the nucleation of apatite [28]. Thus, the bioactivity of MAO increased with a voltage change from 200 to 300 V. Its further decrease can be, as mentioned above, due to many factors, including relation of chemical potential on the voltage. In a similar study, Tsutsumi et al. [23] observed on MAO-treated Ti29Nb13Ta4.6Zr the newly formed layers rich in Ca and P after seven days of immersion in Hank’s solution. Correa et al. [14] presented that the calcium and phosphate contents increased with the limiting voltage in all samples after immersion. Our results, confirmed also by other research reports [19], indicate only that at high voltage the enhancement of bioactivity may decrease.

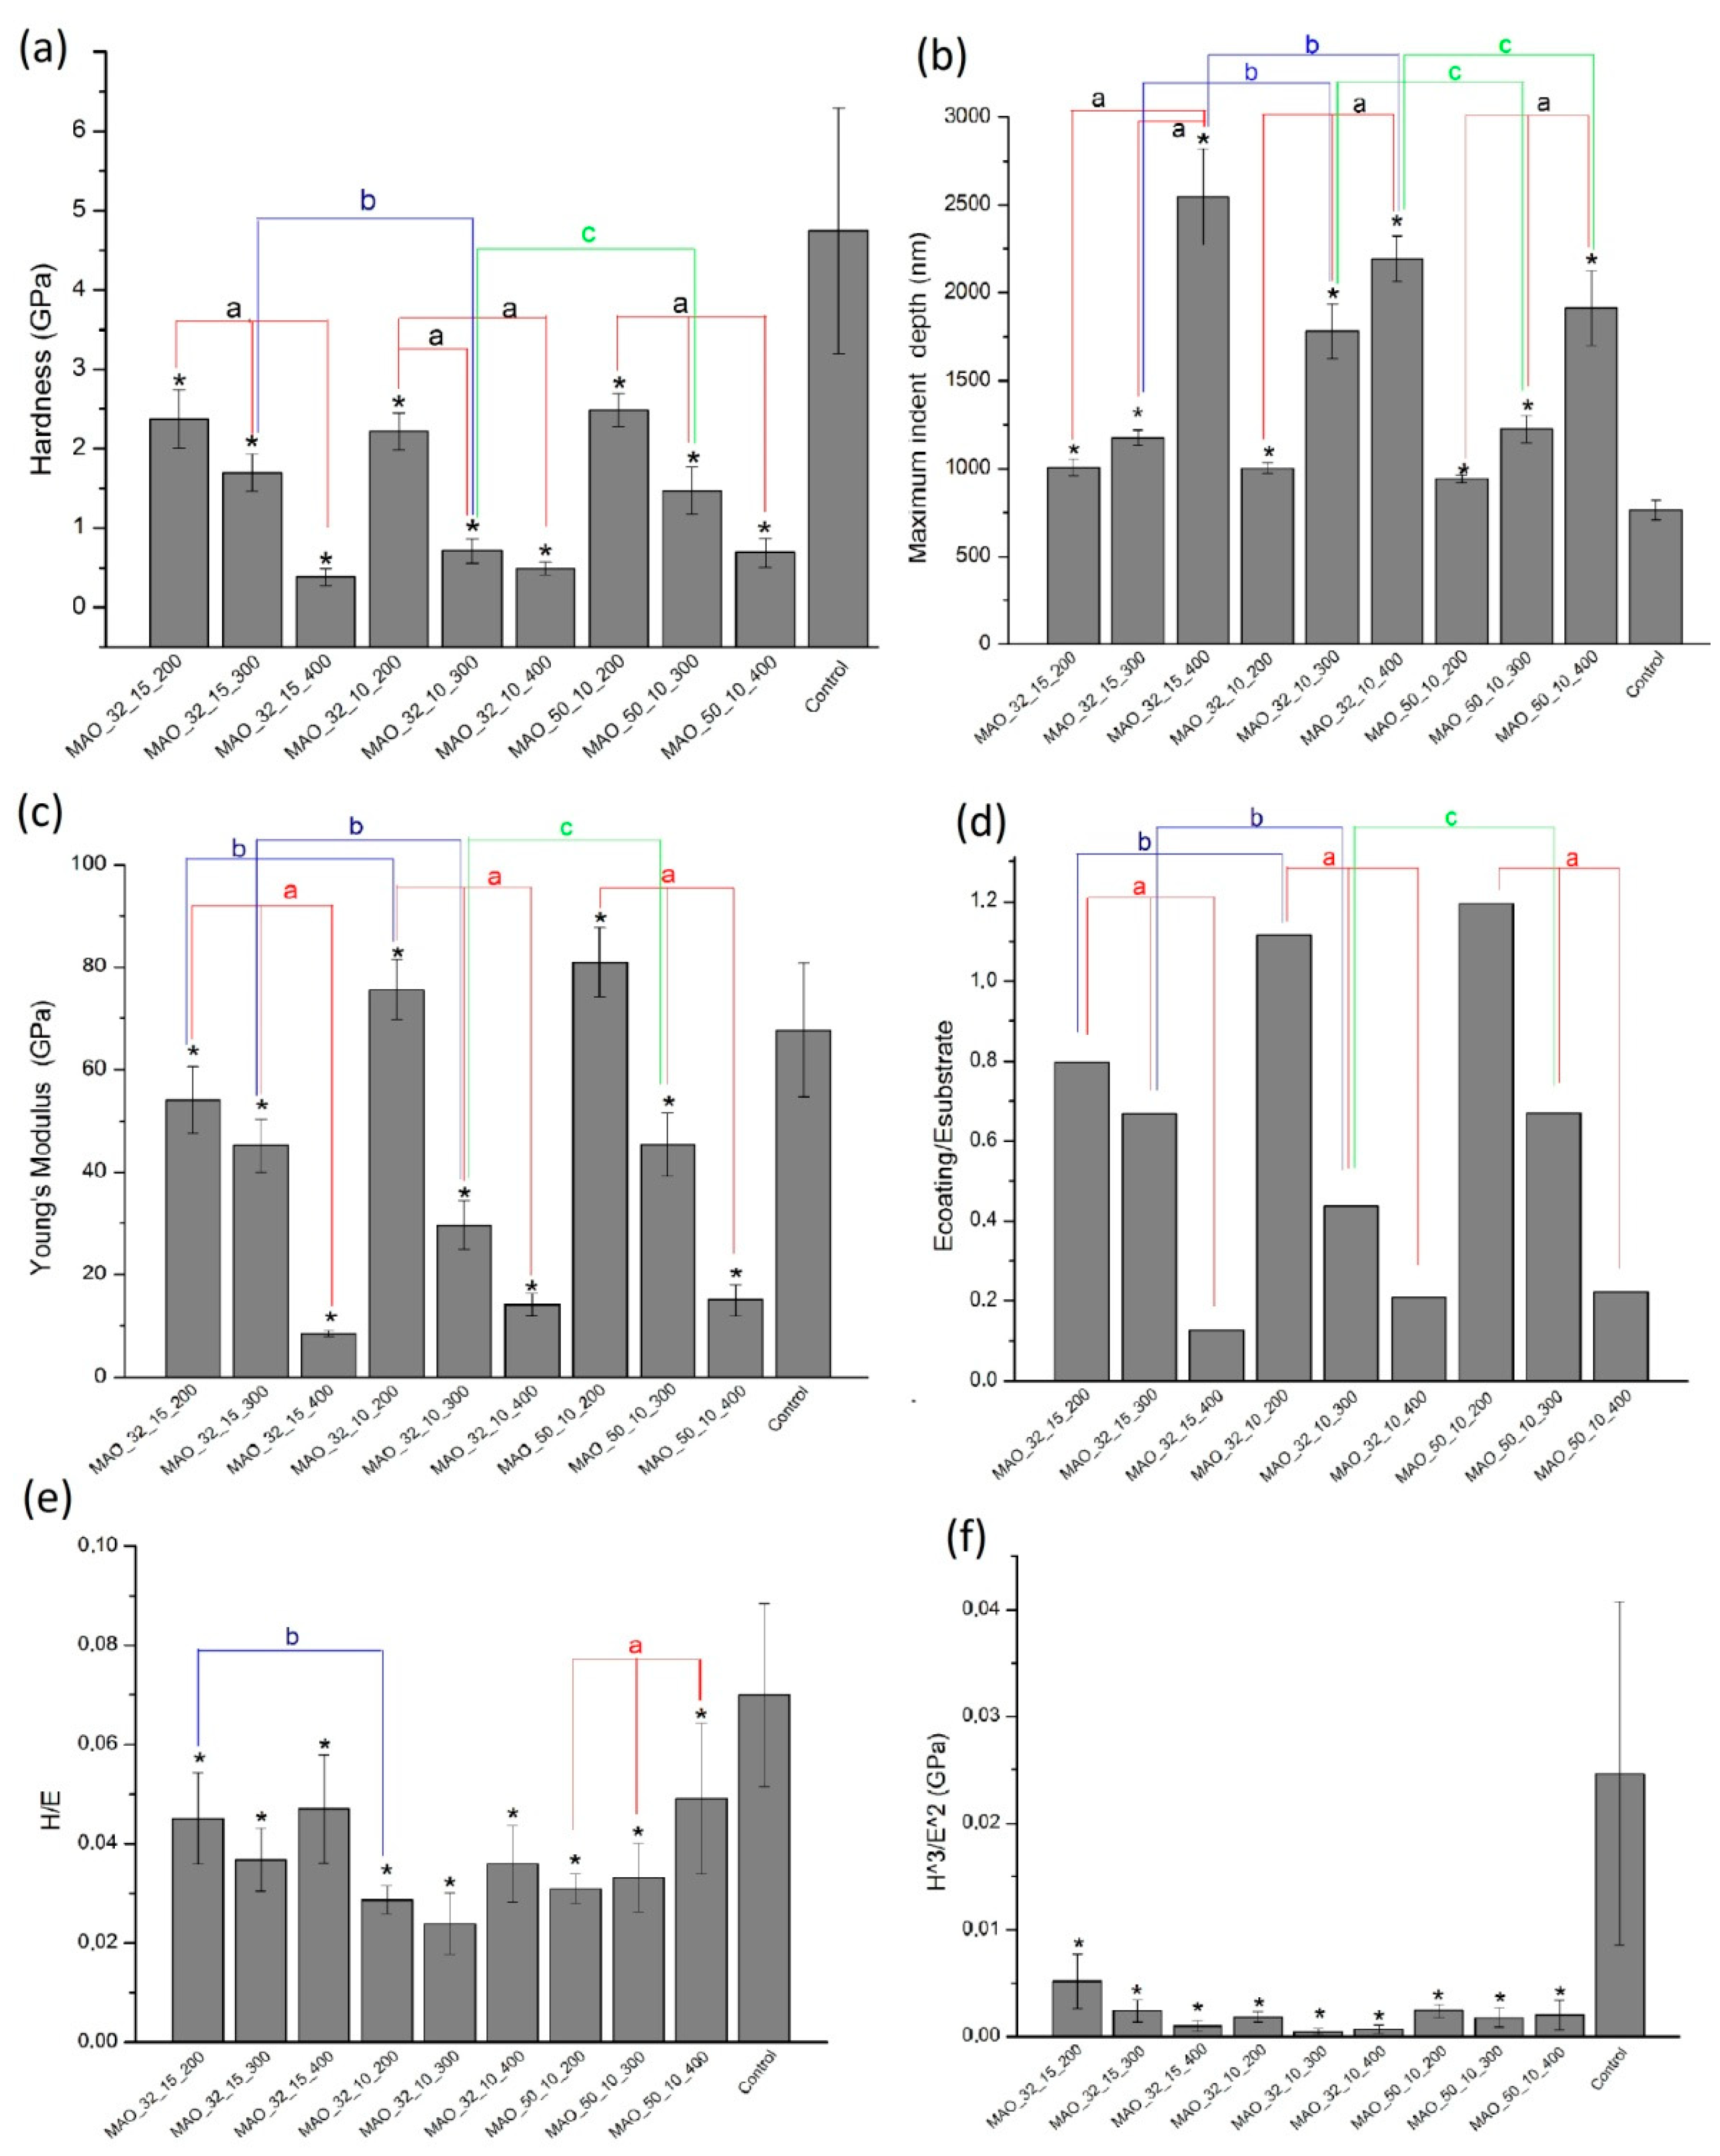
3.4. Nanomechanical Properties of MAO Coatings

The load-displacement hysteresis curve as an example of the results of nanoindentation tests is shown in Figure 7. Three main stages of the nanoindentation test are observed: Loading to a maximum value, pause with maximum value, and unloading. At the end of the loading stage, the maximum indenter displacement connected with elastic and plastic deformation can be observed, while at the end of the unloading phase, the final depth (connected with elastic recovery) of the contact impression can be the measure [37]. Irregularity occurring on the unloading step is correlated with the temperature drift. It can be seen that the elastic recovery of MAO specimens is significantly low when compared to control specimens and decreases with an increasing voltage of the MAO process. The lowest recovery characteristic was obtained by the MAO_32_10_400 treatment, while the greater by MAO_32_10_200. Increasing current values, from 32 to 50 mA, result in lower maximum displacement, while decreasing time of the MAO process from 15 to 10 min leads to higher maximum displacement. What is more, at the higher voltage of the MAO process, the longer displacement during pause time can be observed, which is connected with more distinct creep of these coatings. The results differ from the phenomena shown in the literature, where the MAO process significantly has improved elastic recovery compared to the uncoated substrate [62,63].
Hardness (H), Young’s modulus (E) value, and deformation mechanism of the coating under load are considered as the most important factors for the anti-wear performance of ceramic coatings [64]. Figure 8 presents the surface hardness, Young’s modulus, maximum indent depth, Ecoating/Esubstrate, H/E, and H3/E2 ratio of the MAO coatings. The highest value of hardness and Young’s modulus was obtained for the control group (4.75 ± 1.55 and 67.71 ± 13.09 GPa, respectively). It can be noticed that all modifications had a significant impact on both mechanical indices. Apart from the MAO_32_10_300 and MAO_32_10_400 specimens, with increasing voltages of the MAO process, the hardness significantly decreased, from two times for MAO_200 up to twelve times for MAO_400. In MAO_300 specimens, when the time decreased from 15 to 10 min, the hardness was reduced almost 60% compared to the longer process, while the increment of current from 32 to 50 mA caused almost twice higher hardness of tested coating compared to specimens treated at 32 mA. A similar behavior was noticed for Young’s modulus where MAO_50_10_300 was characterized by a higher value of Young’s modulus in comparison to MAO_32_10_300. In contrast, the time change from 15 to 10 min first decreased (for MAO_200) and then increased (for MAO_300) the Young’s modulus value. A higher parameter of hardness in all cases was related to denser and smoother surface morphologies. Young’s modulus was higher for all specimens treated under 200 V with the highest value equal to 80.94 ± 6.71 GPa obtained during the MAO process in 50 mA conditions, while specimens treated at 300 and 400 V showed the significantly decreased Young’s modulus. The results are in line with the literature, where the lowest values of Young’s modulus and hardness correspond to materials with less dense microstructure and the highest levels of porosity [65,66,67,68]. The MAO process carried out at 400 V indicated from two to four times bigger pore size compared to the MAO process at 200 V. Similarly, Souza et al. [69] suggested that the elastic modulus obtained for porous film was related to the actual elastic response of the film. In the case of biomaterials, lower values of Young’s modulus are often positive. The mismatch between elastic modulus and hardness of an implant and a bone can lead to stress shielding, which may provide implant loosening [27,29]. The obtained results indicate that the elastic modulus values for all MAO coatings are closer to values characteristics of bones (11.4–21.2 GPa) and the best matching is observed for specimens treated at 400 V (8.46 ± 0.59; 14.06 ± 2.11; 15.00 ± 3.07 for MAO_32_15_400, MAO_32_10_400, and MAO_50_10_400, respectively). As presented in Figure 8b, with increasing voltage, maximum indentation depth also increases which is strictly correlated with lower hardness of the coatings. The highest indentation depth reached 2.55 μm (for MAO_32_15_400) and was about 60% higher than the lowest one equal to 0.94 μm (for MAO_50_10_200). According to the literature, the lower the H/E and H3/E2 ratios are, referred to materials elastic strain failure and materials resistance to plastic deformation, respectively, the worst the materials wear performance is [70]. It can be noticed that both ratios are much lower for the MAO coatings compared to the control group, and lower than the optimal declared value of the H/E parameter approx. 0.1 [71], which refers to high plastic deformation of the coating and in consequence, low wear resistance (Figure 8e,f). Some authors proved that a close match between the elastic modulus of the coating and substrate reduced interfacial stress and ensured better adhesion [72]. It is preferable to obtain the value of Ecoating/Esubstrate ratio close to unity, since the higher mismatch, the greater plastic deformation and brittle cracking may be observed [73]. It can be noticed that Ecoating/Esubstrate decreases with increasing applied voltage, and the closest value to the optimum is obtained by all specimens treated under lower voltage (MAO_200), while the highest mismatch between both coating and substrate’s Young modulus occurs in the specimens treated under high voltage (MAO_400).
According to the literature, mechanical parameters depend on many determinants, i.e., porosity, phase composition of the oxide layer, and MAO process parameters. It is suggested that soft calcium phosphate agglomerates have a significant impact on lower mechanical properties. For example, Karbowniczek et al. [47] obtained that the MAO coating containing various Ca/P ratios with hardness ranged between 5.74 to 21.88 GPa and Young’s modulus from 29.3 ± 4.3 to 54.7 ± 11.8 GPa, in line with the results of this study. It is worth noting that the differencess of the mechanical properties and their significant standard deviation values are characteristic of nanoindentation measurements as observed by many authors [74]. Especially, nanoindentation of macro-porous films is challenging due to the experimental errors related to the influence of the substrate, the pore-filling densification effect during indentation, as well as the surface roughness [75,76,77]. Additionally, the methodology to a reliable determining of the mechanical properties of porous coatings has not been well established yet. According to the literature, to minimize the effect of the substrate, the indenting should be provided to a maximum depth (hmax) less than 10% of the coating thickness (tf) (hmax/tf < 0.1) [37], and some authors indicate 20% of the film thickness for the porous thin ceramic films (hmax/tf < 0.2) [78], while others pointed out that for hardness measurements, the substrate effect would be relatively small as long as the indentation depth would be below 50% of the film thickness [79]. On the other hand, taking into consideration the roughness effect, the elastic modulus results are more consistent and reproducible when the indentation depth is bigger, in the range of 10%–20% of the film thickness [65], since when the indenter tip is similar to the value of the surface roughness, the stresses at the initial point are much greater and result in variability in the first stages of indentation [80]. It can be noticed that in our research all MAO coatings fulfill the relations hmax/tf < 0.5, while MAO_300 and 400 fulfill the relations 0.1 < hmax/tf < 0.2, which according to the literature should improve the reliability of the film-only properties. What is more, to eliminate the experimental errors, a series of indentation tests were carried out, the critical values were statistically rejected and the median was taken into consideration. Additionally, due to minimizing the pore-filling densification effect, the experiment was performed with restriction distance of 20 µm offset in the Z and Y axis. In the future, to improve the nanoindentation examination, the spherical indenter tip (with a larger surface area), as well as the nanoindentation tests evaluated at different depths should be considered.

3.5. MAO Coatings’ Adhesion

In scratch testing, three main failures can be observed: Cohesive, adhesive, and mixed cracking [72]. The minimum load at which the first damage occurs is characterized by a critical load (Lc). In the literature usually one [74,81], two [82,83] or three [72,84] critical loads (Lc1, Lc2, Lc3) are presented. In this study, Lc1 is correlated with the first crack (initial cohesion deformation), Lc2 marked the load under which, on the edge of the scratch, the first delamination occurred (initial adhesion deformation), Lc3 presents total coating perforations, where the substrate starts to be seen continuously. According to the literature [85], Lc1 may be identified by the first peak of acoustic emission correlated with a spontaneous shock wave that occurs as a result of the microcrack formations, while Lc2 and Lc3 can be measured in the first and follow high-peaks which indicate the large damage of the coating. To improve the investigation of failures, all results were also analyzed while using other scratch test data, i.e., friction force and penetration depth. Since the literature indicated that isolated damages could be ignored [85], to understand better at which location, the beginning of the failure event was occurring, the optical microscopy was used.
A comparison of the microstructures of the coatings (Figure 9) shows that the scratch behavior is dependent on the MAO process parameters. For specimens treated under 200 V, only a small peeling occurred in the coating (apart of the place where the loading was completed, and bigger peeling could be observed), and only a few circular microcracks, some lateral and arc tensile cracks could be observed. The higher the process voltage, the more transverse semi-circular cracks, chipping, and spalling appear. For 300 and 400 V, conformal-type buckling cracks with local interfacial spallation indicate a highly cohesive failure. In both conditions at the edges of the scratches, two-sided peeling indicates the intense adhesive type of failure. However, the chipping deformations occur much later (farther from the beginning of the scratch path) compared to MAO_200 what may suggest the higher adhesion between substrate and coating. In specimens treated under 300 V conditions, total perforation becomes continuous, and in contrast, the coating’s damage of specimens treated in 400 V presents more cyclic delamination character. Although in all specimens coating breakthrough occurs, the place where the substrate starts to appear along the scratch track, varies; the lower the voltage was, the earlier (closer to the beginning of the scratch path) the total perforations appeared. The example of the relations between friction (F), acoustic emission, penetration depth and load (L) with the indicated critical loads (Lc1, Lc2, Lc3) for the MAO coatings are shown in Figure 9, while the average values of critical loads and critical friction force causing total delamination (Fc (Lc2)) measured during the scratch test for all MAO coatings samples are present in Table 5.
It can be said that for the MAO 200, 300, and 400 V conditions, the critical load of micro-cracking (Lc1) occurs at low force and ranges between 4.97 ± 1.47 to 13.42 ± 3.93 mN (for MAO_32_15_200 and MAO_50_10_300, respectively). According to Figure 9 and Table 5, the scratch resistance of the coatings was improved with the highest voltage of the MAO process, in line with the literature [62]. Some authors [28] suggested that the oxidation time influenced the adhesion; however, in this study, no significant difference could be observed. Lc3 of MAO_400 coatings (~157–178 mN) were approximately 50% higher than Lc3 of the MAO_300 and 70% higher than for the MAO_200. Additionally, MAO_400 remained without being totally damaged for the longest time (total delaminations occurring futher from the beginning of the scratch path) of all analyzed coatings (~370 μm for MAO_32_10_400 and MAO_32_15_400 and ~ 480 μm for MAO_50_10_400). In contrast, the fastest (the total delaminations occurring closer from the beginning of the scratch path) total delamination occurred in MAO_200 (~173, 85, and 101 μm for MAO_32_10_200, MAO_32_15_200, and MAO_50_10_200, respectively). In the specimens oxidized under middle voltages (MAO_300), the average distance from the beginning of the scratch path, where the first delamination occurred, were at ~205, 223, and 187 μm for MAO_32_10_300, MAO_32_15_300, and MAO_50_10_300, respectively. Even though MAO_400 is characterized by lower hardness and higher porosity compared to the MAO_200, better adhesion may be related to the higher P and Ca elements’ incorporation due to a more intense oxidation process. The highest value of the friction force during the first adhesive damage Fc (Lc2) was obtained by the most rough specimens MAO_50_10_400 and MAO_32_15_400. The very high value of Fc (Lc2) of MAO_50_10_300 reflects the highest pill-up effect compared to other specimens (Figure 9b).
Although the MAO has been declared as an effective method to improve adhesion between coatings and substrate compared to other wide known surface modification methods, such as sol-gel [62], or alkaline heat treatment [86], a typical brittle behavior can be still observed. Based on the Zhu et al. [87] study, the tribological performance of the MAO coatings can be improved by an optimal combination of the MAO process parameters as voltage, current, time oxidation, or electrolyte concentration. It is also worth noting that results obtained in scratch tests depend on various independent factors (test conditions, material parameters, and the randomness of measurements), and their direct comparability between various research groups is almost impossible. Therefore, the obtained findings are only approximate and should be mainly used for the qualitative comparison purpose.

4. Conclusions

After the MAO treatment, rutile and anatase peaks appear at all the applied voltages. Mostly anatase is formed at lower forming voltages, while the combination of anatase and rutile phases appears at higher voltages. The time-dependent relations of voltage and current characteristics of the MAO process on SLM-made Ti13Zr13Nb are typical, their dielectric breakdown intensities increasing with the growth of applied voltage. The time 10 min is too short to obtain a maximum voltage of 400 V. The film is faster formed at higher initial current.
The average diameter of pores and thickness of the MAO coating depend on the applied voltage and change from 1.8 to 8.4 and 4.1 to 26.8 μm, respectively, with increasing voltage. For the highest voltage, shortening the processing time in the same current conditions, decreases the pore size, while increasing current results in a bigger pore size. The most roughness, extensive, and hardly reproducible structure is obtained at the highest maximum voltage, while the most regular and predictable structure at the middle voltage (300 V).
With increasing applied voltage, the concentration of Ca increases and that of Ti decreases, while the P compound content first intensively increases and then slightly decreases. With increasing voltage, the Ca/P ratio also increases. The closest value of the Ca/P ratio to bone-apatite is obtained by MAO_32_15_400.
All specimens have hydrophilic surfaces, with values corresponding to optimal values to ensure better adsorption of proteins and the cell adhesion.
After the early-stage bioactivity examination in Hank’s solution, the MAO process results in a high Ca/P what indicates good bioactivity of MAO coatings. The nearest value of the CA/P ratio to stoichiometric hydroxyapatite is obtained by specimens treated at 300 V.
The elastic recovery of the MAO treated specimens is low and decreases with an increasing voltage of the MAO process. The significant elastic recovery appears at higher current values and higher processing time. Young’s modulus is the highest for specimens treated at the lowest voltage 200 V. The elastic modulus values for all MAO coatings are closer to values characteristic of bones with the best matching for specimens treated at 400 V.
The ratios referred to coatings’ wear-resistant performance (H, H3/E2, Ecoating/Esubstrate) show a tendency to higher plastic deformation of the MAO coating and in consequence, lower wear resistance compared to the uncoated Ti13Zr13Nb. The soft calcium phosphate agglomerates have a significant impact on lower mechanical properties. For the higher process voltage, more intense transverse semi-circular cracks, chipping, and spalling appear. The critical loads referred to the first adhesive damage and total delaminations are weaker at the highest voltage of the MAO process, which can be correlated with higher thickness of those coatings.
The results of the research indicate that there are no significant differences between MAO coating on the SLM substrate compared to MAO coating on titanium alloys produced by conventional methods. The differences in MAO coating properties were mainly correlated with micro-arc oxidation process parameters.
The most important parameter of the MAO process influencing the coating characteristic is the voltage. The optimal conditions of the MAO process include the voltage 300 V for 15 min at 32 mA or 50 mA of the current. As a consequence, the coating is characterized by the most regular and predictable structure, high Ca/P ratio, high hydrophilicity, highest demonstrated early-stage bioactivity, better nanomechanical properties, such elastic modulus and hardness with higher matching to the values of bones, compared to MAO_200 and uncoated substrate, as well as the higher critical force of adhesion and total delaminations compared to MAO_200. Despite the perspective properties, the relatively low critical load presented during the scratch test is still a certain problem; however, it is also an interesting opportunity to evaluate the issue of adhesion strength in further research. The authors plan to improve the adhesion properties, while adding some components (i.e., silica) to the one-step MAO process.

Author Contributions

Conceptualization, M.D., M.S., and A.Z.; methodology, M.D., M.S., T.H., A.Z. and T.S.; resources, T.H., M.S. and T.S.; software, T.S.; validation, M.D., M.S., T.S., A.Z. and T.H.; formal analysis, M.D. and A.Z.; investigation, M.D., M.S. and T.S.; writing—original draft preparation, M.D. and A.Z.; writing—review and editing, M.D., M.S., T.S., A.Z. and T.H.; visualization, M.D.; supervision, A.Z, T.H. and M.S. All authors have read and agreed to the published version of the manuscript.

Funding

This research was supported by the Polish National Agency for Academic Exchange, PROM Programm, International scholarship exchange of PhD candidates and academic staff.

Acknowledgments

The authors would like to thank all those whose contributed to preparing this paper, i.e., the research group from the Department of Metallic Biomaterials Institute of Biomaterials and Bioengineering, Tokyo Medical and Dental University (especially Manaka Tomoyo and Tatsuya Tsuyuzaki), and the research group from the Department of Materials Engineering and Bonding, Gdańsk University of Technology (especially Grzegorz Gajowiec and Michał Bartmański) for their technical and scientific support. Moreover, our appreciation, in particular, goes to the Sincor Company for support in thickness measurements.

Conflicts of Interest

The authors declare no conflict of interest.

References

  1. Niinomi, M.; Nakai, M.; Hieda, J. Development of new metallic alloys for biomedical applications. Acta Biomater. 2012, 8, 3888–3903. [Google Scholar] [CrossRef]
  2. Yu, S.; Yu, Z.T.; Wang, G.; Han, J.Y.; Ma, X.Q.; Dargusch, M.S. Preparation and osteoinduction of active micro-arc oxidation films on Ti-3Zr-2Sn-3Mo-25Nb alloy. Trans. Nonferrous Met. Soc. China (Engl. Ed.) 2011, 21, 573–580. [Google Scholar] [CrossRef]
  3. Legostaeva, E.V.; Sharkeev, Y.P.; Epple, M.; Prymak, O. Structure and properties of microarc calcium phosphate coatings on the surface of titanium and zirconium alloys. Russ. Phys. J. 2014, 56, 1130–1136. [Google Scholar] [CrossRef]
  4. Abdel-Hady Gepreel, M.; Niinomi, M. Biocompatibility of Ti-alloys for long-term implantation. J. Mech. Behav. Biomed. Mater. 2013, 20, 407–415. [Google Scholar] [CrossRef]
  5. Elias, L.M.; Schneider, S.G.; Schneider, S.; Silva, H.M.; Malvisi, F. Microstructural and mechanical characterization of biomedical Ti–Nb–Zr(–Ta) alloys. Mater. Sci. Eng. A 2006, 432, 108–112. [Google Scholar] [CrossRef]
  6. Ha, J.Y.; Tsutsumi, Y.; Doi, H.; Nomura, N.; Kim, K.H.; Hanawa, T. Enhancement of calcium phosphate formation on zirconium by micro-arc oxidation and chemical treatments. Surf. Coat. Technol. 2011, 205, 4948–4955. [Google Scholar] [CrossRef]
  7. Alves, S.A.; Bayón, R.; de Viteri, V.S.; Garcia, M.P.; Igartua, A.; Fernandes, M.H.; Rocha, L.A. Tribocorrosion Behavior of Calcium- and Phosphorous-Enriched Titanium Oxide Films and Study of Osteoblast Interactions for Dental Implants. J. Bio- Tribo-Corros. 2015, 1. [Google Scholar] [CrossRef] [Green Version]
  8. Zaraska, L.; Gawlak, K.; Gurgul, M.; Gilek, D.; Kozieł, M.; Socha, R.P.; Sulka, G.D. Morphology of nanoporous anodic films formed on tin during anodic oxidation in less commonly used acidic and alkaline electrolytes. Surf. Coat. Technol. 2019, 362, 191–199. [Google Scholar] [CrossRef]
  9. Zhang, L.-C.; Chen, L.-Y.; Wang, L. Surface Modification of Titanium and Titanium Alloys: Technologies, Developments, and Future Interests. Adv. Eng. Mater. 2020, 22, 1901258. [Google Scholar] [CrossRef]
  10. Tao, X.J.; Li, S.J.; Zheng, C.Y.; Fu, J.; Guo, Z.; Hao, Y.L.; Yang, R.; Guo, Z.X. Synthesis of a porous oxide layer on a multifunctional biomedical titanium by micro-arc oxidation. Mater. Sci. Eng. C 2009, 29, 1923–1934. [Google Scholar] [CrossRef]
  11. Alves, A.C.; Costa, A.I.; Toptan, F.; Alves, J.L.; Leonor, I.; Ribeiro, E.; Reis, R.L.; Pinto, A.M.P.; Fernandes, J.C.S. Effect of bio-functional MAO layers on the electrochemical behaviour of highly porous Ti. Surf. Coat. Technol. 2020, 386, 125487. [Google Scholar] [CrossRef]
  12. Alves, A.C.; Wenger, F.; Ponthiaux, P.; Celis, J.P.; Pinto, A.M.; Rocha, L.A.; Fernandes, J.C.S. Corrosion mechanisms in titanium oxide-based films produced by anodic treatment. Electrochim. Acta 2017, 234, 16–27. [Google Scholar] [CrossRef]
  13. Wei, D.; Zhou, Y.; Jia, D.; Wang, Y. Effect of applied voltage on the structure of microarc oxidized TiO2-based bioceramic films. Mater. Chem. Phys. 2007, 104, 177–182. [Google Scholar] [CrossRef]
  14. Correa, D.R.N.; Rocha, L.A.; Ribeiro, A.R.; Gemini-Piperni, S.; Archanjo, B.S.; Achete, C.A.; Werckmann, J.; Afonso, C.R.M.; Shimabukuro, M.; Doi, H.; et al. Growth mechanisms of Ca- and P-rich MAO films in Ti-15Zr-xMo alloys for osseointegrative implants. Surf. Coat. Technol. 2018, 344, 373–382. [Google Scholar] [CrossRef] [Green Version]
  15. Yerokhin, A.; Parfenov, E.V.; Matthews, A. In situ impedance spectroscopy of the plasma electrolytic oxidation process for deposition of Ca- and P-containing coatings on Ti. Surf. Coat. Technol. 2016, 301, 54–62. [Google Scholar] [CrossRef]
  16. Sedelnikova, M.B.; Komarova, E.G.; Sharkeev, Y.P.; Tolkacheva, T.V.; Khlusov, I.A.; Litvinova, L.S.; Yurova, K.A.; Shupletsova, V.V. Comparative investigations of structure and properties of micro-arc wollastonite-calcium phosphate coatings on titanium and zirconium-niobium alloy. Bioact. Mater. 2017, 2, 177–184. [Google Scholar] [CrossRef]
  17. Wang, Y.; Lou, J.; Zeng, L.; Xiang, J.; Zhang, S.; Wang, J.; Xiong, F.; Li, C.; Zhao, Y.; Zhang, R. Osteogenic potential of a novel microarc oxidized coating formed on Ti6Al4V alloys. Appl. Surf. Sci. 2017, 412, 29–36. [Google Scholar] [CrossRef]
  18. Sowa, M.; Łastówka, D.; Kukharenko, A.I.; Korotin, D.M.; Kurmaev, E.Z.; Cholakh, S.O.; Simka, W. Characterisation of anodic oxide films on zirconium formed in sulphuric acid: XPS and corrosion resistance investigations. J. Solid State Electrochem. 2017, 21, 203–210. [Google Scholar] [CrossRef] [Green Version]
  19. Du, Q.; Wei, D.; Wang, Y.; Cheng, S.; Liu, S.; Zhou, Y.; Jia, D. The effect of applied voltages on the structure, apatite-inducing ability and antibacterial ability of micro arc oxidation coating formed on titanium surface. Bioact. Mater. 2018, 3, 426–433. [Google Scholar] [CrossRef]
  20. Wang, J.; Pan, Y.; Feng, R.; Cui, H.; Gong, B.; Zhang, L.; Gao, Z.; Cui, X.; Zhang, H.; Jia, Z. Effect of electrolyte composition on the microstructure and bio-corrosion behavior of micro-arc oxidized coatings on biomedical Ti6Al4V alloy. J. Mater. Res. Technol. 2020, 9, 1477–1490. [Google Scholar] [CrossRef]
  21. Effect of Micro-Arc Oxidation Time and Applied Voltage on Formation of Strontium- and Silicon-Incorporated Biocoatings—NASA/ADS. Available online: https://ui.adsabs.harvard.edu/abs/2018JPhCS1115c2074K/abstract (accessed on 26 April 2020).
  22. Han, Y.; Hong, S.H.; Xu, K. Structure and in vitro bioactivity of titania-based films by micro-arc oxidation. Surf. Coat. Technol. 2003, 168, 249–258. [Google Scholar] [CrossRef]
  23. Tsutsumi, Y.; Niinomi, M.; Nakai, M.; Tsutsumi, H.; Doi, H.; Nomura, N.; Hanawa, T. Micro-arc oxidation treatment to improve the hard-tissue compatibility of Ti-29Nb-13Ta-4.6Zr alloy. Appl. Surf. Sci. 2012, 262, 34–38. [Google Scholar] [CrossRef]
  24. Tsutsumi, Y.; Ashida, M.; Nakahara, K.; Serizawa, A.; Doi, H.; Grandini, C.R.; Rocha, L.A.; Hanawa, T. Micro arc oxidation of Ti-15Zr-7.5Mo alloy. Mater. Trans. 2016, 57, 2015–2019. [Google Scholar] [CrossRef] [Green Version]
  25. Wang, C.; Ma, F.; Liu, P.; Chen, J.; Liu, X.; Zhang, K.; Li, W.; Han, Q. The influence of alloy elements in Ti–6Al–4V and Ti–35Nb–2Ta–3Zr on the structure, morphology and properties of MAO coatings. Vacuum 2018, 157, 229–236. [Google Scholar] [CrossRef]
  26. Liu, S.; Li, B.; Liang, C.; Wang, H.; Qiao, Z. Formation mechanism and adhesive strength of a hydroxyapatite/TiO2 composite coating on a titanium surface prepared by micro-arc oxidation. Appl. Surf. Sci. 2016, 362, 109–114. [Google Scholar] [CrossRef]
  27. Dziaduszewska, M.; Wekwejt, M.; Bartmański, M.; Pałubicka, A.; Gajowiec, G.; Seramak, T.; Osyczka, A.M.; Zieliński, A. The Effect of Surface Modification of Ti13Zr13Nb Alloy on Adhesion of Antibiotic and Nanosilver-Loaded Bone Cement Coatings Dedicated for Application as Spacers. Materials 2019, 12, 2964. [Google Scholar] [CrossRef] [Green Version]
  28. Yao, J.; Wang, Y.; Wu, G.; Sun, M.; Wang, M.; Zhang, Q. Growth characteristics and properties of micro-arc oxidation coating on SLM-produced TC4 alloy for biomedical applications. Appl. Surf. Sci. 2019, 479, 727–737. [Google Scholar] [CrossRef]
  29. Dziaduszewska, M.; Zielinski, A. Titanium Scaffolds-Hopes and Limitations. Am. J. Biomed. Sci. Res. 2019, 4, 390–391. [Google Scholar] [CrossRef]
  30. Zhang, B.; Pei, X.; Zhou, C.; Fan, Y.; Jiang, Q.; Ronca, A.; D’Amora, U.; Chen, Y.; Li, H.; Sun, Y.; et al. The biomimetic design and 3D printing of customized mechanical properties porous Ti6Al4V scaffold for load-bearing bone reconstruction. Mater. Des. 2018, 152, 30–39. [Google Scholar] [CrossRef]
  31. Yang, J.; Yu, H.; Yin, J.; Gao, M.; Wang, Z.; Zeng, X. Formation and control of martensite in Ti-6Al-4V alloy produced by selective laser melting. Mater. Des. 2016, 108, 308–318. [Google Scholar] [CrossRef]
  32. van Hengel, I.A.J.; Riool, M.; Fratila-Apachitei, L.E.; Witte-Bouma, J.; Farrell, E.; Zadpoor, A.A.; Zaat, S.A.J.; Apachitei, I. Selective laser melting porous metallic implants with immobilized silver nanoparticles kill and prevent biofilm formation by methicillin-resistant Staphylococcus aureus. Biomaterials 2017, 140, 1–15. [Google Scholar] [CrossRef]
  33. Liu, Z.; Jia, Z.; Lv, J.; Yin, C.; Cai, H.; Song, C.; Leng, H.; Zheng, Y.; Liu, Z.; Cheng, Y. Hierarchical Micropore/Nanorod Apatite Hybrids In-Situ Grown from 3-D Printed Macroporous Ti6Al4V Implants with Improved Bioactivity and Osseointegration. J. Mater. Sci. Technol. 2017, 33, 179–186. [Google Scholar] [CrossRef]
  34. Nyan, M.; Tsutsumi, Y.; Oya, K.; Doi, H.; Nomura, N.; Kasugai, S.; Hanawa, T. Synthesis of novel oxide layers on titanium by combination of sputter deposition and micro-arc oxidation techniques. Dent. Mater. J. 2011, 30, 754–761. [Google Scholar] [CrossRef] [Green Version]
  35. Shimabukuro, M.; Tsutsumi, Y.; Nozaki, K.; Chen, P.; Yamada, R.; Ashida, M.; Doi, H.; Nagai, A.; Hanawa, T. Chemical and biological roles of zinc in a porous titanium dioxide layer formed by micro-arc oxidation. Coatings 2019, 9, 705. [Google Scholar] [CrossRef] [Green Version]
  36. Tanaka, Y.; Kobayashi, E.; Hiromoto, S.; Asami, K.; Imai, H.; Hanawa, T. Calcium phosphate formation on titanium by low-voltage electrolytic treatments. J. Mater. Sci. Mater. Med. 2007, 18, 797–806. [Google Scholar] [CrossRef]
  37. Oliver, W.C.; Pharr, G.M. An improved technique for determining hardness and elastic modulus using load and displacement sensing indentation experiments. J. Mater. Res. 1992, 7, 1564–1583. [Google Scholar] [CrossRef]
  38. Ehlert, M.; Radtke, A.; Jedrzejewski, T.; Roszek, K.; Bartmanski, M.; Piszczek, P. In vitro studies on nanoporous, nanotubular and nanosponge-like titania coatings, with the use of adipose-derived stem cells. Materials 2020, 13, 1574. [Google Scholar] [CrossRef] [Green Version]
  39. Li, J.; Cai, H.; Jiang, B. Growth mechanism of black ceramic layers formed by microarc oxidation. Surf. Coat. Technol. 2007, 201, 8702–8708. [Google Scholar] [CrossRef]
  40. Qian, B.-Y.; Miao, W.; Qiu, M.; Gao, F.; Hu, D.-H.; Sun, J.-F.; Wu, R.-Z.; Krit, B.; Betsofen, S. Influence of Voltage on the Corrosion and Wear Resistance of Micro-Arc Oxidation Coating on Mg–8Li–2Ca Alloy. Acta Metall. Sin. (English Lett.) 2019, 32, 194–204. [Google Scholar] [CrossRef] [Green Version]
  41. Sobolev, A.; Kossenko, A.; Borodianskiy, K. Study of the effect of current pulse frequency on Ti-6Al-4V alloy coating formation by micro arc oxidation. Materials 2019, 12, 3983. [Google Scholar] [CrossRef] [Green Version]
  42. Wang, J.H.; Wang, J.; Lu, Y.; Du, M.H.; Han, F.Z. Effects of single pulse energy on the properties of ceramic coating prepared by micro-arc oxidation on Ti alloy. Appl. Surf. Sci. 2015, 324, 405–413. [Google Scholar] [CrossRef]
  43. Heimann, R.B. Structure, properties, and biomedical performance of osteoconductive bioceramic coatings. Surf. Coat. Technol. 2013, 233, 27–38. [Google Scholar] [CrossRef]
  44. Kashyap, S.; Griep, K.; Nychka, J.A. Crystallization kinetics, mineralization and crack propagation in partially crystallized bioactive glass 45S5. Mater. Sci. Eng. C 2011, 31, 762–769. [Google Scholar] [CrossRef]
  45. Ishizawa, H.; Ogino, M. Formation and characterization of anodic titanium oxide films containing Ca and P. J. Biomed. Mater. Res. 1995, 29, 65–72. [Google Scholar] [CrossRef]
  46. Chen, L.; Jin, X.; Qu, Y.; Wei, K.; Zhang, Y.; Liao, B.; Xue, W. High temperature tribological behavior of microarc oxidation film on Ti-39Nb-6Zr alloy. Surf. Coat. Technol. 2018, 347, 29–37. [Google Scholar] [CrossRef]
  47. Karbowniczek, J.; Muhaffel, F.; Cempura, G.; Cimenoglu, H.; Czyrska-Filemonowicz, A. Influence of electrolyte composition on microstructure, adhesion and bioactivity of micro-arc oxidation coatings produced on biomedical Ti6Al7Nb alloy. Surf. Coat. Technol. 2017, 321, 97–107. [Google Scholar] [CrossRef]
  48. Kazek-Kesik, A.; Krok-Borkowicz, M.; Jakóbik-Kolon, A.; Pamuła, E.; Simka, W. Biofunctionalization of Ti-13Nb-13Zr alloy surface by plasma electrolytic oxidation. Part II. Surf. Coat. Technol. 2015, 276, 23–30. [Google Scholar] [CrossRef]
  49. Wang, Y.H.; Ouyang, J.H.; Liu, Z.G.; Wang, Y.M.; Wang, Y.J. Microstructure and high temperature properties of two-step voltage-controlled MAO ceramic coatings formed on Ti 2 AlNb alloy. Appl. Surf. Sci. 2014, 307, 62–68. [Google Scholar] [CrossRef]
  50. Chien, C.S.; Hung, Y.C.; Hong, T.F.; Wu, C.C.; Kuo, T.Y.; Lee, T.M.; Liao, T.Y.; Lin, H.C.; Chuang, C.H. Preparation and characterization of porous bioceramic layers on pure titanium surfaces obtained by micro-arc oxidation process. Appl. Phys. A Mater. Sci. Process. 2017, 123, 1–10. [Google Scholar] [CrossRef]
  51. Wang, Y.M.; Guo, J.W.; Zhuang, J.P.; Jing, Y.B.; Shao, Z.K.; Jin, M.S.; Zhang, J.; Wei, D.Q.; Zhou, Y. Development and characterization of MAO bioactive ceramic coating grown on micro-patterned Ti6Al4V alloy surface. Appl. Surf. Sci. 2014, 299, 58–65. [Google Scholar] [CrossRef]
  52. Planell, J.A.; Navarro, M.; Altankov, G.; Aparicio, C.; Engel, E.; Gil, J.; Ginebra, M.P.; Lacroix, D. Materials Surface Effects on Biological Interactions. In Advances in Regenerative Medicine: Role of Nanotechnology, and Engineering Principles; Springer: Dordrecht, The Netherlands, 2010; pp. 233–252. [Google Scholar] [CrossRef]
  53. Love, G.; Scott, V.D.; Dennis, N.M.T.; Laurenson, L. Sources of contamination in electron optical equipment. Scanning 1981, 4, 32–39. [Google Scholar] [CrossRef]
  54. Tsai, M.T.; Chang, Y.Y.; Huang, H.L.; Wu, Y.H.; Shieh, T.M. Micro-arc oxidation treatment enhanced the biological performance of human osteosarcoma cell line and human skin fibroblasts cultured on titanium–zirconium films. Surf. Coat. Technol. 2016, 303, 268–276. [Google Scholar] [CrossRef]
  55. Cordero-Arias, L.; Cabanas-Polo, S.; Gao, H.; Gilabert, J.; Sanchez, E.; Roether, J.A.; Schubert, D.W.; Virtanen, S.; Boccaccini, A.R. Electrophoretic deposition of nanostructured-TiO2/chitosan composite coatings on stainless steel. RSC Adv. 2013, 3, 11247. [Google Scholar] [CrossRef] [Green Version]
  56. Durdu, S. Characterization, bioactivity and antibacterial properties of copper-based TiO2 bioceramic coatings fabricated on titanium. Coatings 2019, 9, 1. [Google Scholar] [CrossRef] [Green Version]
  57. Wang, L.; Wang, K.; Erkan, N.; Yuan, Y.; Chen, J.; Nie, B.; Li, F.; Okamoto, K. Metal material surface wettability increase induced by electron beam irradiation. Appl. Surf. Sci. 2020, 511, 145555. [Google Scholar] [CrossRef]
  58. Acharya, S.; Panicker, A.G.; Laxmi, D.V.; Suwas, S.; Chatterjee, K. Study of the influence of Zr on the mechanical properties and functional response of Ti-Nb-Ta-Zr-O alloy for orthopedic applications. Mater. Des. 2019, 164, 107555. [Google Scholar] [CrossRef]
  59. Hanaor, D.A.H.; Sorrell, C.C. Review of the anatase to rutile phase transformation. J. Mater. Sci. 2011, 46, 855–874. [Google Scholar] [CrossRef] [Green Version]
  60. Zhang, P.; Zhang, Z.; Li, W.; Zhu, M. Effect of Ti-OH groups on microstructure and bioactivity of TiO2 coating prepared by micro-arc oxidation. Appl. Surf. Sci. 2013, 268, 381–386. [Google Scholar] [CrossRef]
  61. Tang, H.; Tao, W.; Wang, C.; Yu, H. Fabrication of hydroxyapatite coatings on AZ31 Mg alloy by micro-arc oxidation coupled with sol-gel treatment. RSC Adv. 2018, 8, 12368–12375. [Google Scholar] [CrossRef] [Green Version]
  62. Cheng, S.; Wei, D.; Zhou, Y.; Guo, H. Characterization and properties of microarc oxidized coatings containing Si, Ca and Na on titanium. Ceram. Int. 2011, 37, 1761–1768. [Google Scholar] [CrossRef]
  63. Szesz, E.M.; de Souza, G.B.; de Lima, G.G.; da Silva, B.A.; Kuromoto, N.K.; Lepienski, C.M. Improved tribo-mechanical behavior of CaP-containing TiO2 layers produced on titanium by shot blasting and micro-arc oxidation. J. Mater. Sci. Mater. Med. 2014, 25, 2265–2275. [Google Scholar] [CrossRef]
  64. Bhushan, B.; Gupta, B.K.; Azarian, M.H. Nanoindentation, microscratch, friction and wear studies of coatings for contact recording applications. Wear 1995, 181–183, 743–758. [Google Scholar] [CrossRef]
  65. Chen, Z. Nanoindentation of Macro-porous Materials for Elastic Modulus and Hardness Determination. In Applied Nanoindentation in Advanced Materials; Tiwari, A., Natarajan, S., Eds.; John Wiley & Sons, Ltd.: Hoboken, NJ, USA, 2017; pp. 135–156. [Google Scholar] [CrossRef]
  66. Savchenko, N.; Sevostyanova, I.; Sablina, T.; Gömze, L.; Kulkov, S. The Influence of porosity on the Elasticity and Strength of Alumina and Zirconia Ceramics. In Proceedings of the International Conference on Physical Mecomechanics of Multilevel System, Tomsk, Russia, 3–5 September 2014; Panin, V.E., Psakhie, S.G., Fomin, V.M., Eds.; AIP Publishing LLC: Melville, NY, USA, 2014; pp. 547–550. [Google Scholar] [CrossRef] [Green Version]
  67. Chen, Z.; Wang, X.; Bhakhri, V.; Giuliani, F.; Atkinson, A. Nanoindentation of Porous Bulk and Thin Films of La0.6Sr0.4Co0.2Fe0.8O3−δ. Acta Mater. 2013, 61, 5720–5734. [Google Scholar] [CrossRef] [Green Version]
  68. Herrmann, M.; Richter, F.; Schulz, S.E. Study of nano-mechanical properties for thin porous films through instrumented indentation: SiO2 low dielectric constant films as an example. Microelectron. Eng. 2008, 85, 2172–2174. [Google Scholar] [CrossRef]
  69. de Souza, G.B.; Lepienski, C.M.; Foerster, C.E.; Kuromoto, N.K.; Soares, P.; de Araújo Ponte, H. Nanomechanical and nanotribological properties of bioactive titanium surfaces prepared by alkali treatment. J. Mech. Behav. Biomed. Mater. 2011, 4, 756–765. [Google Scholar] [CrossRef]
  70. Solis, J.; Zhao, H.; Wang, C.; Verduzco, J.A.; Bueno, A.S.; Neville, A. Tribological performance of an H-DLC coating prepared by PECVD. Appl. Surf. Sci. 2016, 383, 222–232. [Google Scholar] [CrossRef]
  71. Zimowski, S. Wpływ twardości i modułu sprężystości powłok kompozytowych na ich odporność na zużycie. Tribologia 2014, 6, 149–160. [Google Scholar]
  72. Lȩpicka, M.; Grldzka-Dahlke, M. The initial evaluation of performance of hard anti-wear coatings deposited on metallic substrates: Thickness, mechanical properties and adhesion measurements—A brief review. Rev. Adv. Mater. Sci. 2019, 58, 50–65. [Google Scholar] [CrossRef]
  73. Huang, X.; Etsion, I.; Shao, T. Effects of elastic modulus mismatch between coating and substrate on the friction and wear properties of TiN and TiAlN coating systems. Wear 2015, 338–339, 54–61. [Google Scholar] [CrossRef]
  74. Bartmański, M.; Pawłowski, Ł.; Strugała, G.; Mielewczyk-Gryń, A.; Zieliński, A. Properties of nanohydroxyapatite coatings doped with nanocopper, obtained by electrophoretic deposition on Ti13Zr13Nb alloy. Materials 2019, 12, 3741. [Google Scholar] [CrossRef] [Green Version]
  75. Jiang, W.G.; Su, J.J.; Feng, X.Q. Effect of surface roughness on nanoindentation test of thin films. Eng. Fract. Mech. 2008, 75, 4965–4972. [Google Scholar] [CrossRef]
  76. Chen, X.; Vlassak, J.J. Numerical study on the measurement of thin film mechanical properties by means of nanoindentation. J. Mater. Res. 2001, 16, 2974–2982. [Google Scholar] [CrossRef] [Green Version]
  77. Saha, R.; Nix, W.D. Effects of the substrate on the determination of thin film mechanical properties by nanoindentation. Acta Mater. 2002, 50, 23–38. [Google Scholar] [CrossRef]
  78. Xiang, Y.; Chen, X.; Tsui, T.Y.; Jang, J.I.; Vlassak, J.J. Mechanical properties of porous and fully dense low-κ dielectric thin films measured by means of nanoindentation and the plane-strain bulge test technique. J. Mater. Res. 2006, 21, 386–395. [Google Scholar] [CrossRef] [Green Version]
  79. Chen, X.; Xiang, Y.; Vlassak, J.J. Novel technique for measuring the mechanical properties of porous materials by nanoindentation. J. Mat. Res. 2006, 21, 715–724. [Google Scholar] [CrossRef]
  80. Bouzakis, K.D.; Michailidis, N.; Hadjiyiannis, S.; Skordaris, G.; Erkens, G. The effect of specimen roughness and indenter tip geometry on the determination accuracy of thin hard coatings stress-strain laws by nanoindentation. Mater. Charact. 2002, 49, 149–156. [Google Scholar] [CrossRef]
  81. Aydin, I.; Bahçepinar, A.I.; Kirman, M.; Çipiloğlu, M.A. HA coating on Ti6Al7Nb alloy using an electrophoretic deposition method and surface properties examination of the resulting coatings. Coatings 2019, 9, 402. [Google Scholar] [CrossRef] [Green Version]
  82. Cai, X.; Xu, Y.; Zhao, N.; Zhong, L.; Zhao, Z.; Wang, J. Investigation of the adhesion strength and deformation behaviour of in situ fabricated NbC coatings by scratch testing. Surf. Coat. Technol. 2016, 299, 135–142. [Google Scholar] [CrossRef]
  83. Krawiec, H.; Vignal, V.; Krystianiak, A.; Gaillard, Y.; Zimowski, S. Mechanical properties and corrosion behaviour after scratch and tribological tests of electrodeposited Co-Mo/TiO2 nano-composite coatings. Appl. Surf. Sci. 2019, 475, 162–174. [Google Scholar] [CrossRef]
  84. Lenz, B.; Hasselbruch, H.; Großmann, H.; Mehner, A. Application of CNN networks for an automatic determination of critical loads in scratch tests on a-C:H:W coatings. Surf. Coat. Technol. 2020, 393, 125764. [Google Scholar] [CrossRef]
  85. Randall, N.X. The current state-of-the-art in scratch testing of coated systems. Surf. Coat. Technol. 2019, 380, 125092. [Google Scholar]
  86. Su, Y.; Komasa, S.; Sekino, T.; Nishizaki, H.; Okazaki, J. Nanostructured Ti6Al4V alloy fabricated using modified alkali-heat treatment: Characterization and cell adhesion. Mater. Sci. Eng. C 2016, 59, 617–623. [Google Scholar] [CrossRef]
  87. Zhu, X.; Kim, K.H.; Jeong, Y. Anodic oxide films containing Ca and P of titanium biomaterial. Biomaterials 2001, 22, 2199–2206. [Google Scholar] [CrossRef]
Figure 1. Time-dependent curves of voltage (ac) and current (a’c’) of the MAO process for MAO_32_15 (a,a’), MAO_32_10 (b,b’), and MAO_50_10 (c,c’).
Coatings 10 00745 g001
Figure 2. SEM microstructure images of the MAO coatings with various MAO process parameters: MAO_32_15_200 (a), MAO_32_15_300 (b), MAO_32_15_400 (c), MAO_32_10_200 (d), MAO_32_10_300 (e), MAO_32_10_400 (f), MAO_50_10_200 (g), MAO_50_10_300 (h), MAO_50_10_400 (i) with two various marked regions (I, II) obtained in MAO_200 (a) and microcracks obtained in MAO_400 (c) (the presented results are representative for three analyses of each surface treatment specimens).
Coatings 10 00745 g002
Figure 3. Pore size (a) and thickness (b) of the investigated MAO coatings with various MAO process parameters measured by ImageJ software and coating thickness guages, respectively (n = 25; data are the means ± SD; (a) significantly different in groups (p < 0.05), (b) significantly different between time groups (p < 0.05), (c) significantly different between current groups (p < 0.05)).
Coatings 10 00745 g003
Figure 4. Surface elemental composition analysis (at.%) of the investigated control specimens and MAO coatings with various MAO process parameters measured by energy dispersive X-ray spectrometry EDS (the presented results are representative for three analyses of each surface treatment specimens).
Coatings 10 00745 g004
Figure 5. X-ray diffractograms of samples: The control group (d) and MAO coatings obtained at various applied voltages in a constant current of 32 mA and time processing equal to 15 min: MAO_32_15_200 (a), MAO_32_15_300 (b), MAO_32_15_400 (c) (the presented results are representative for three analyses of each surface treatment specimens).
Coatings 10 00745 g005
Figure 6. Surface morphologies of the samples after soaking in Hank’s solutions for 72 h: The control group (d) and the MAO coatings obtained at various applied voltages in a constant current of 32 mA and time processing equal to 15 min (ac): MAO_32_15_200 (a), MAO_32_15_300 (b), and MAO_32_15_400 (c). The Ca/P ratio (e) and elemental composition (f) of the post-immersed specimens (the presented results are representative for three analyses of each surface treatment specimens).
Coatings 10 00745 g006
Figure 7. Nanoindentation load-displacement curve obtained for the investigated MAO coatings with various MAO process parameters and control specimens obtained by the nanoindentation test (ac): MAO_32_15 (a), MAO_32_15 (b), and MAO_32_15 (c) (the presented results are representative for twenty-five analyses of each surface treatment specimens).
Coatings 10 00745 g007
Figure 8. Nanomechanical properties: Nanohardness (a), maximum indent depth (b), Young’s modulus (c), Ecoating/Esubstrate ratio (d), H/E ratio (e), H3/E2 ratio (f), of investigated MAO coatings with various MAO process parameters and control specimens (n = 10; * significantly different from control (p < 0.05), (a) significantly different in groups (p < 0.05), (b) significantly different between time groups (p < 0.05), (c) significantly different between current groups (p < 0.05)).
Coatings 10 00745 g008
Figure 9. The scratch path with cohesion and adhesion failures after scratch testing (ac), and the relation of friction (F), acoustic emission, and penetration depth on load (L) with the indicated critical loads (Lc1, Lc2, Lc3) (a’c’) of the investigated MAO coatings obtained at various MAO process parameters: MAO_32_15_200 (a,a’), MAO_32_15_300 (b,b’), and MAO_32_15_400 (c,c’) (the presented results are representative for ten analyses of each surface treatment specimens).
Coatings 10 00745 g009
Table 1. The labels of micro-arc oxidation (MAO) coatings formed at different process conditions.
Applied Voltage (V)Current (mA)MAO-Treatment Time (min)Lebels in GroupsLabels in Subgroups
2003215MAO_200MAO_32_15_200
3210MAO_32_10_200
5010MAO_50_10_200
3003215MAO_300MAO_32_15_300
3210MAO_32_10_300
5010MAO_50_10_300
4003215MAO_400MAO_32_15_400
3210MAO_32_10_400
5010MAO_50_10_400
Table 2. Ion concentration of Hank’s solution.
IonConcentration (mol·L−1)
Na+1.42 × 10⁻¹
K+5.81 × 10⁻³
Mg2+8.11 × 10⁻⁴
Ca2+1.26 × 10⁻³
Cl1.45 × 10−1
PO43−7.78 × 10⁻⁴
SO43−8.11 × 10⁻⁴
CO32−4.17 × 10⁻³
Table 3. Average surface roughness Ra (µm) of the investigated control specimens and MAO coatings with various MAO process parameters measured by laser microscopy.
SampleAverage Surface Roughness Ra (µm)Control
200 V300 V400 V
MAO_32_150.41 ± 0.050.52 ± 0.012.67 ± 0.25 *,a0.19 ± 0.04
MAO_32_100.37 ± 0.030.54 ± 0.261.84 ± 0.17 *,a,b
MAO_50_100.36 ± 0.020.51 ± 0.032.67 ± 0.18 *,a
(n = 5; data are the means ±SD; * significantly different from control (p < 0.05); a significantly different from MAO_200 and MAO_300 (p < 0.05); b significantly different from MAO_400 (p < 0.05)).
Table 4. Surface wettability of the investigated control specimens and MAO coatings with various MAO process parameters determined by the measurements of the contact angle of distilled water.
SampleSurface Wettability—The Value of Contact Angle (°)Control
200 V300 V400 V
MAO_32_1556.65 ± 6.9835.63 ± 4.35 *,b64.31 ± 7.9460.83 ± 3.34
MAO_32_1053.99 ± 2.56 *57.40 ± 1.839.16 ± 5.18 *,a
MAO_50_1064.82 ± 4.95 d62.13 ± 2.5846.55 ± 3.57 *,c
(n = 5; data are the means ±SD; * significantly different from control (p < 0.05); a significantly different from MAO_32_10_200 and _300, MAO_32_15_400 (p < 0.05); b significantly different from MAO_32_15_200 and _400; MAO_32_10_300 (p < 0.05), c significantly different from MAO_50_10_200 and _300 (p < 0.05) d significantly different from MAO_32_10_200 (p < 0.05)).
Table 5. Critical loads and critical friction force caused total delamination (Fc (Lc2)) measured during the scratch test for all MAO coatings samples (the presented results are representative for five analyses of each surface treatment specimens).
Critical Load (mN)
SampleLc1Lc2Lc3Fc (Lc2)
MAO_32_15_2004.97 ± 1.4712.34 ± 4.943.27 ± 8.16220.68 ± 16.95
MAO_32_15_3007.19 ± 4.1727.41 ± 12.7880.62 ± 11.39134.48 ± 25.53
MAO_32_15_40010.51 ± 1.6863.49 ± 28.01163.35 ± 42.13368.332 ± 40.85
MAO_32_10_2005.07 ± 1.9429.70 ± 10.4959.39 ± 9.5639.064 ± 14.56
MAO_32_10_30010.27 ± 3.6331.28 ± 13.4683.50 ± 8.0645.14 ± 21.56
MAO_32_10_4008.52 ± 2.2646.63 ± 16.88157.76 ± 36.69138.42 ± 43.69
MAO_50_10_2008.12 ± 1.8917.63 ± 7.1444.73 ± 4.26131.80 ± 16.91
MAO_50_10_30013.42 ± 3.9325.56 ± 5.6776.38 ± 6.98477.37 ± 19.93
MAO_50_10_40012.02 ± 3.9943.13 ± 15.39178.23 ± 43.81520.08 ± 48

