Valorization of Brick and Glass CDWs for the Development of Geopolymers Containing More Than 80% of Wastes


School of Chemical Engineering, National Technical University of Athens, 15773 Athens, Greece
*
Author to whom correspondence should be addressed.
Minerals 2020, 10(8), 672; https://doi.org/10.3390/min10080672
Submission received: 19 June 2020
/
Revised: 24 July 2020
/
Accepted: 27 July 2020
/
Published: 29 July 2020
(This article belongs to the Special Issue Alkali Activated Materials: Advances, Innovations, Future Trends)
Abstract
:One of the areas of priority in a circular economy, regarding waste management, regards the valorization of construction and demolition wastes (CDW). This study suggests the synthesis of geopolymeric binders based almost entirely on construction and demolition wastes. Ceramic waste was used as the aluminosilicate precursor of the geopolymer synthesis, while glass waste was applied in the preparation of the activation solution. A fractional experimental design defined the optimum synthesis parameters, based on compressive strength values. The final products were characterized by means of X-Ray Diffraction (XRD), Fourier-Transform Infrared Spectroscopy (FTIR) and Scanning Electron Microscopy (SEM). The glass waste was appropriately processed in order to prepare the activation solution for the geopolymerization of brick waste. In this work, CDW-based geopolymers were produced with a compressive strength in the range 10–44 MPa. The developed products contained 80–90 wt.% CDWs, depending on the method of activator preparation.
1. Introduction
Nowadays, there is an imperative need to transform our economies into more sustainable ones. The model of the “linear economy”, which has been adopted globally up till now, is based on the “make–take–dispose” concept, whereby natural materials and resources are transformed into products that our societies use until they are finally discarded as wastes. However, the scarcity of natural resources, the high energy demand of production processes and the high rate of waste landfilling indicate that this type of economy is coming to an end. For this reason, a new economic system, called “circular economy” [1], has emerged, aiming to preserve natural resources for as long as possible, by keeping the generation of waste to its minimum [2]. In other words, the goal of such economies is to create closed-loop systems by reusing, recycling, sharing, repairing and remanufacturing, and therefore to minimize the use of natural resources and the generation of waste, pollution and greenhouse gas emissions [3].
Speaking of the construction sector, Portland cement is the most widespread material, used as the main component of concrete or other cementitious materials. It is well established that Portland cement production is one of the most energy-intensive and non-environmentally friendly production processes, since it requires significant consumptions of natural resources in clinker manufacturing and rotary kiln operation. In numerical terms, 6–7% of the total CO2 emissions are attributed to the cement industry. Furthermore, 1.7 tons of natural materials are consumed and 0.8 tons of CO2 are emitted for the production of only 1 ton of cement [4,5,6].
From the circular economy point of view, efforts to find alternatives to Portland cement are necessary. In recent years, great emphasis has been placed on building materials called geopolymeric or alkali-activated binders. Purdon [7], V. Glukhovsky [8], J. Davidovits [9] and J.S.J. Van Deventer [10] were the first to address this field, and developed the first alkali-activated cements. These materials exhibit competitive properties compared to conventional building materials, such as rapid strength development and resistance to corrosive environments. The geopolymerization process involves the reaction of an aluminosilicate raw material and a silicate solution in an alkaline medium, and then the curing of the mixture under mild conditions. The above process has significant environmental benefits, such as the utilization of industrial by-products and wastes as raw materials, natural resource and energy savings, and the reduction of CO2 emissions [11,12].
In addition to the unsustainable cement products, the construction sector accounts also for one of the biggest waste sources globally, namely, construction and demolition wastes (CDWs). These wastes are mostly generated by construction, renovation, repair or demolition activities, and often contain bulky and heavy materials including concrete, wood, asphalt, gypsum, metals, bricks, glass, plastics, etc. Most of these wastes are not reused/recycled, and are mainly deposited in the environment, causing disposal problems. According to Eurostat, the construction sector in the EU-28 produced 920 million tons of waste, representing 36% of the total waste generation in the year 2016 [13]. According to the binding legislation set by the EU, 70% by weight of non-hazardous CDW must be reused, recycled or recovered by the year 2020 [14]. A major part of these wastes (30%) is of ceramic origin (bricks, tiles, etc.), and their structure is characterized by a high degree of disorder, since they have been treated in high temperatures at the production stage. From this perspective, aluminosilicate-based CDWs can be reused as precursors for the preparation of high added value materials via geopolymerization [15,16,17,18,19]. Furthermore, CDW glass can be applied in the preparation of the activation solution, due to its high Si and Na amorphous content [20,21,22,23,24]. Conventionally, the preparation of the activation solution involves the use of commercial alkali silicates, the production of which is significantly energy-intensive [25]. Thus, the development of glass waste activation solution will provide a significant reduction in the environmental footprint of geopolymerization.
This study deals with the development of a green building material based almost entirely on construction and demolition wastes through the geopolymerization process. The research was carried out in three stages:
- Synthesis optimization of CDW-based geopolymers, using the conventional activation solution. In this stage, the assessment of the effects of synthesis factors, such as Si/Al, R/Al (R: Na or K) and Na/Na + K molar ratios, on the microstructures and mechanical properties of the products, was performed;
- Development of an activation solution based on glass waste. In this stage, dissolution studies of the glass waste were performed, and the effect of parameters such as the alkalinity of the extracting solution, the temperature and the duration of the dissolution were assessed;
- Testing of the efficiency of the glass waste solutions when used as activators for CDW-based geopolymers.
It must be noted that the thorough study of alkaline glass dissolution was not within the scope of this work, as it has been extensively studied [26,27,28,29]. The target of this work was to obtain a glass waste solution, under relatively mild conditions, that can be used for the geopolymerization of CDWs.
2. Materials and Methods
2.1. Raw Materials
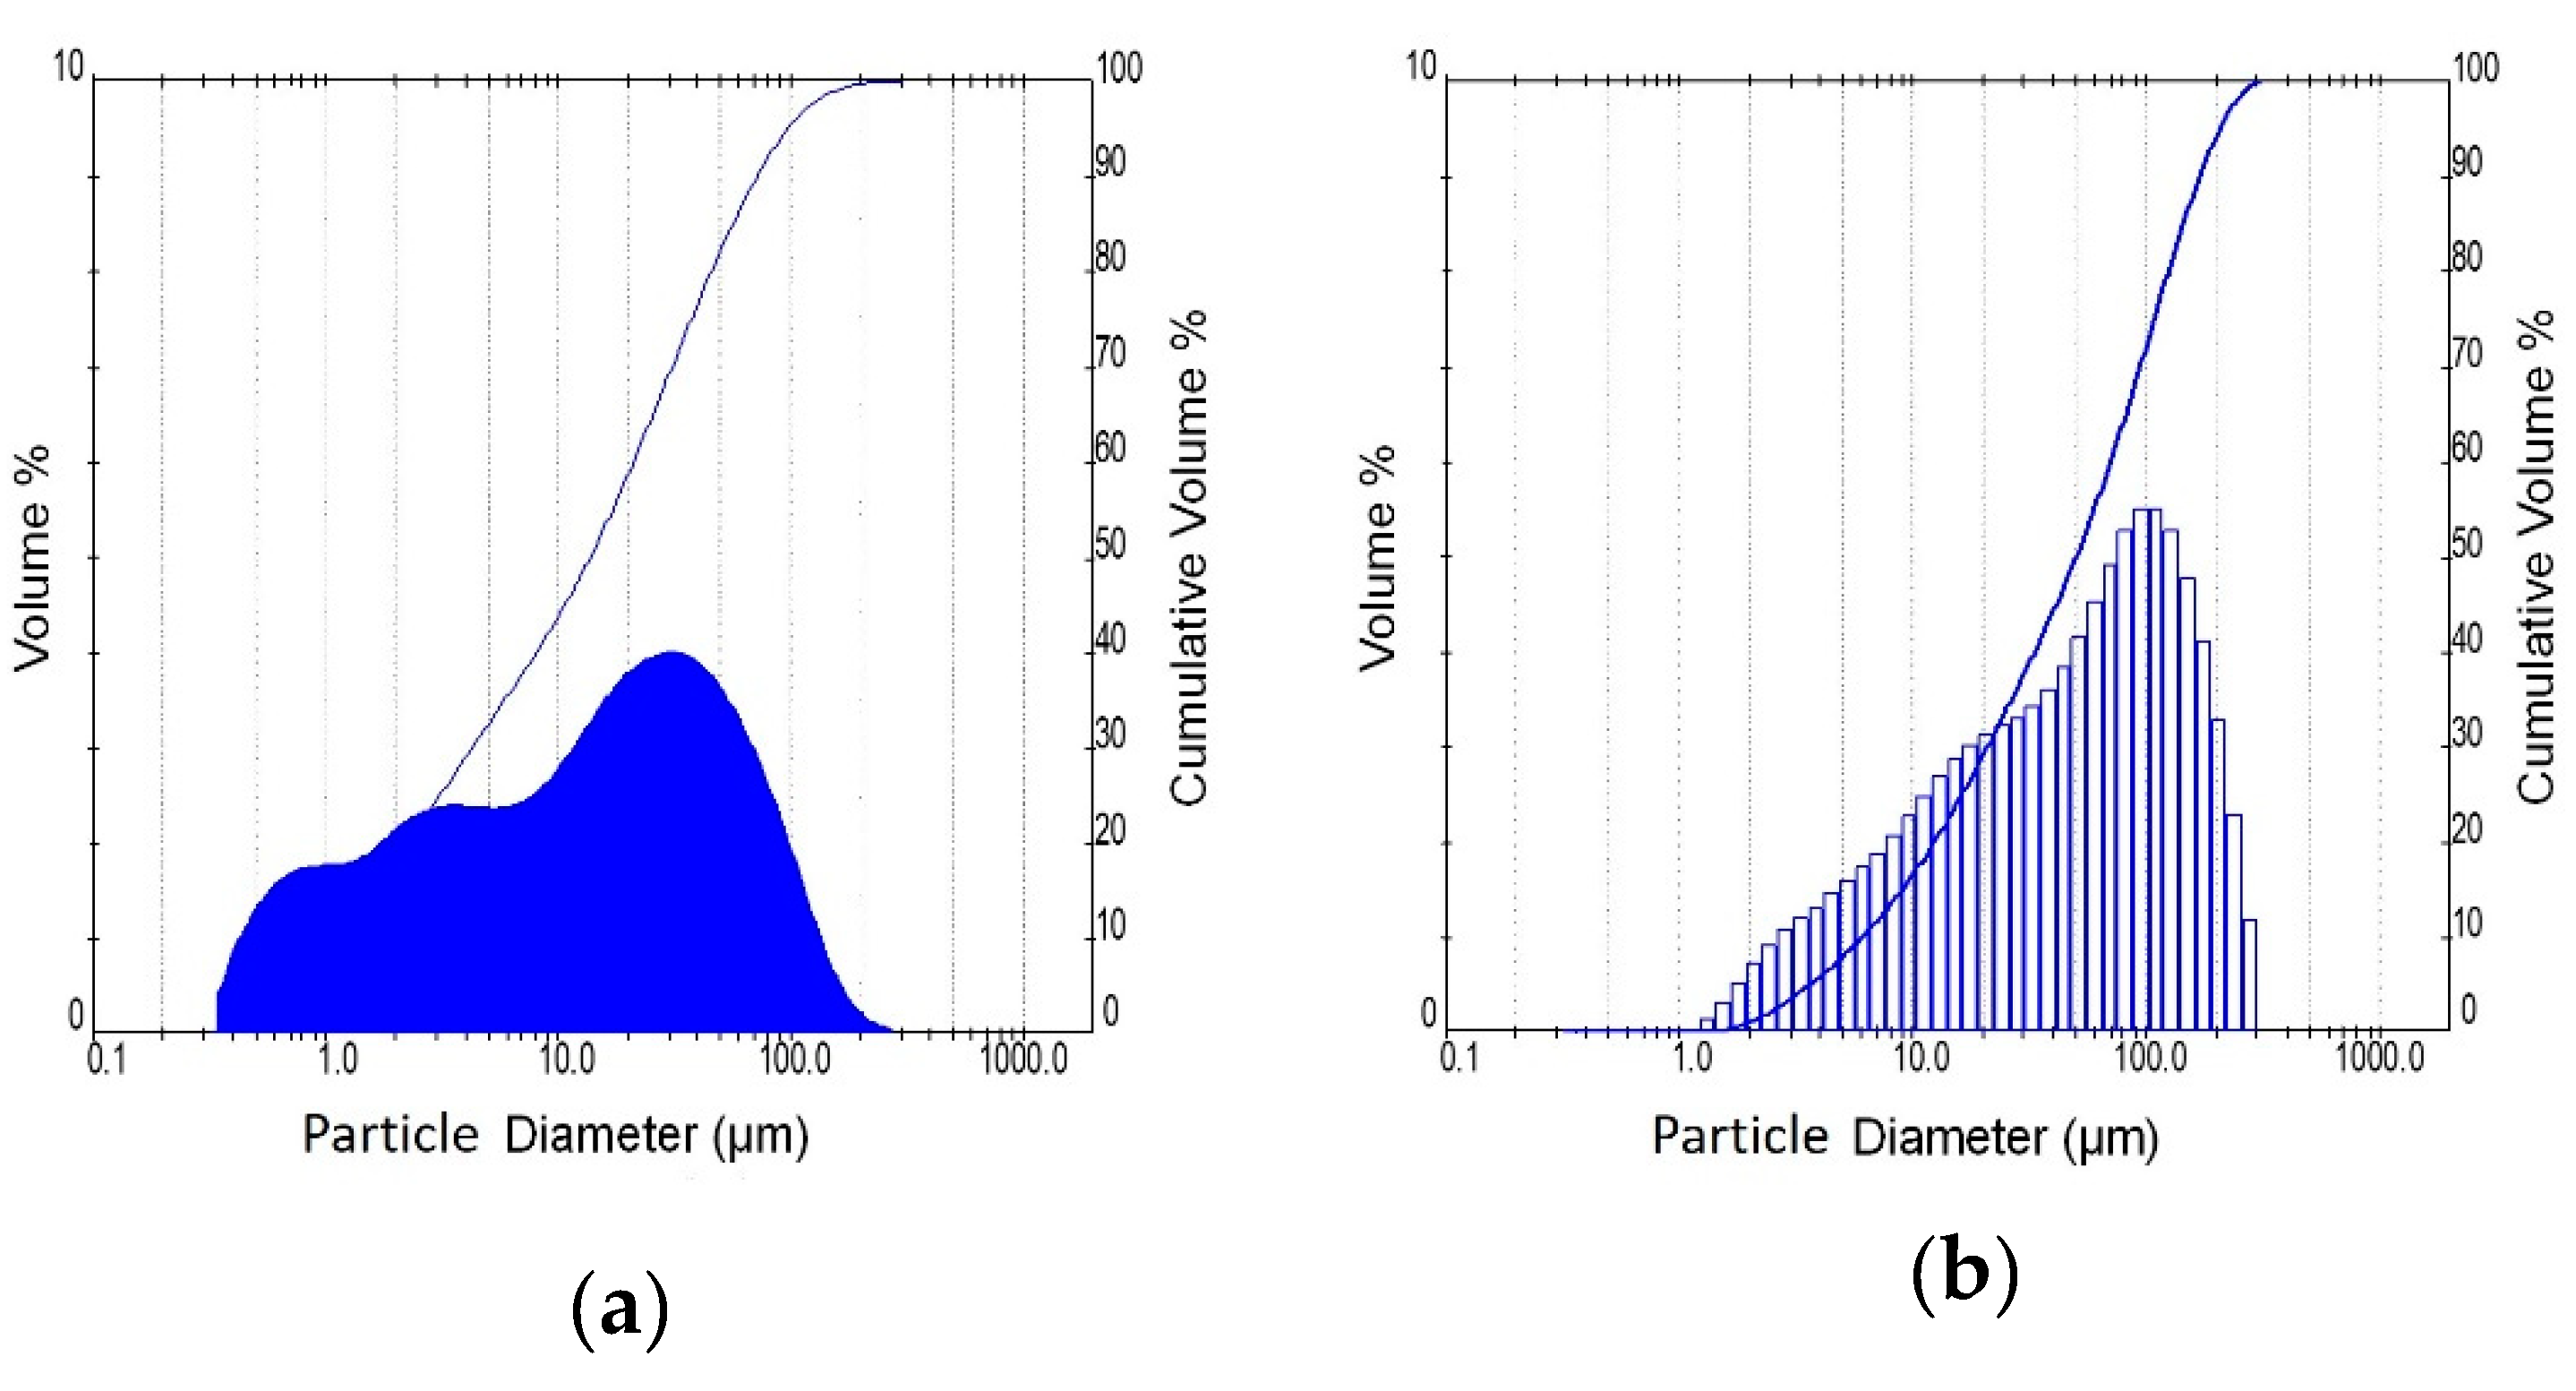
The brick precursor used in this study originates from bricks rejected at the industrial site because they do not conform to the quality control standards of the brick industry. This type of waste belongs also to CDWs, and its composition is very close to that of waste originating from construction and demolition activities. The utilized glass waste is a typical glass used in the fabrication of windowpanes. Brick and glass wastes were pulverized (pro-pilot plant ball mill, L = 480 mm, D = 380 mm) in order to enhance their reactivity. Table 1 and Figure 1 present the fineness characteristics of the waste materials. In the case of glass waste, only the fraction below 56 μm was used for the preparation of sodium silicate solutions.
The chemical composition of waste materials was determined by means of X-ray fluorescence spectroscopy (Table 2). The selected brick waste is a promising aluminosilicate precursor since it contains sufficient amounts of SiO2 and Al2O3 that are necessary for the reactions of geopolymerization. Furthermore, glass waste according to its chemical composition can be classified as a soda-lime glass.
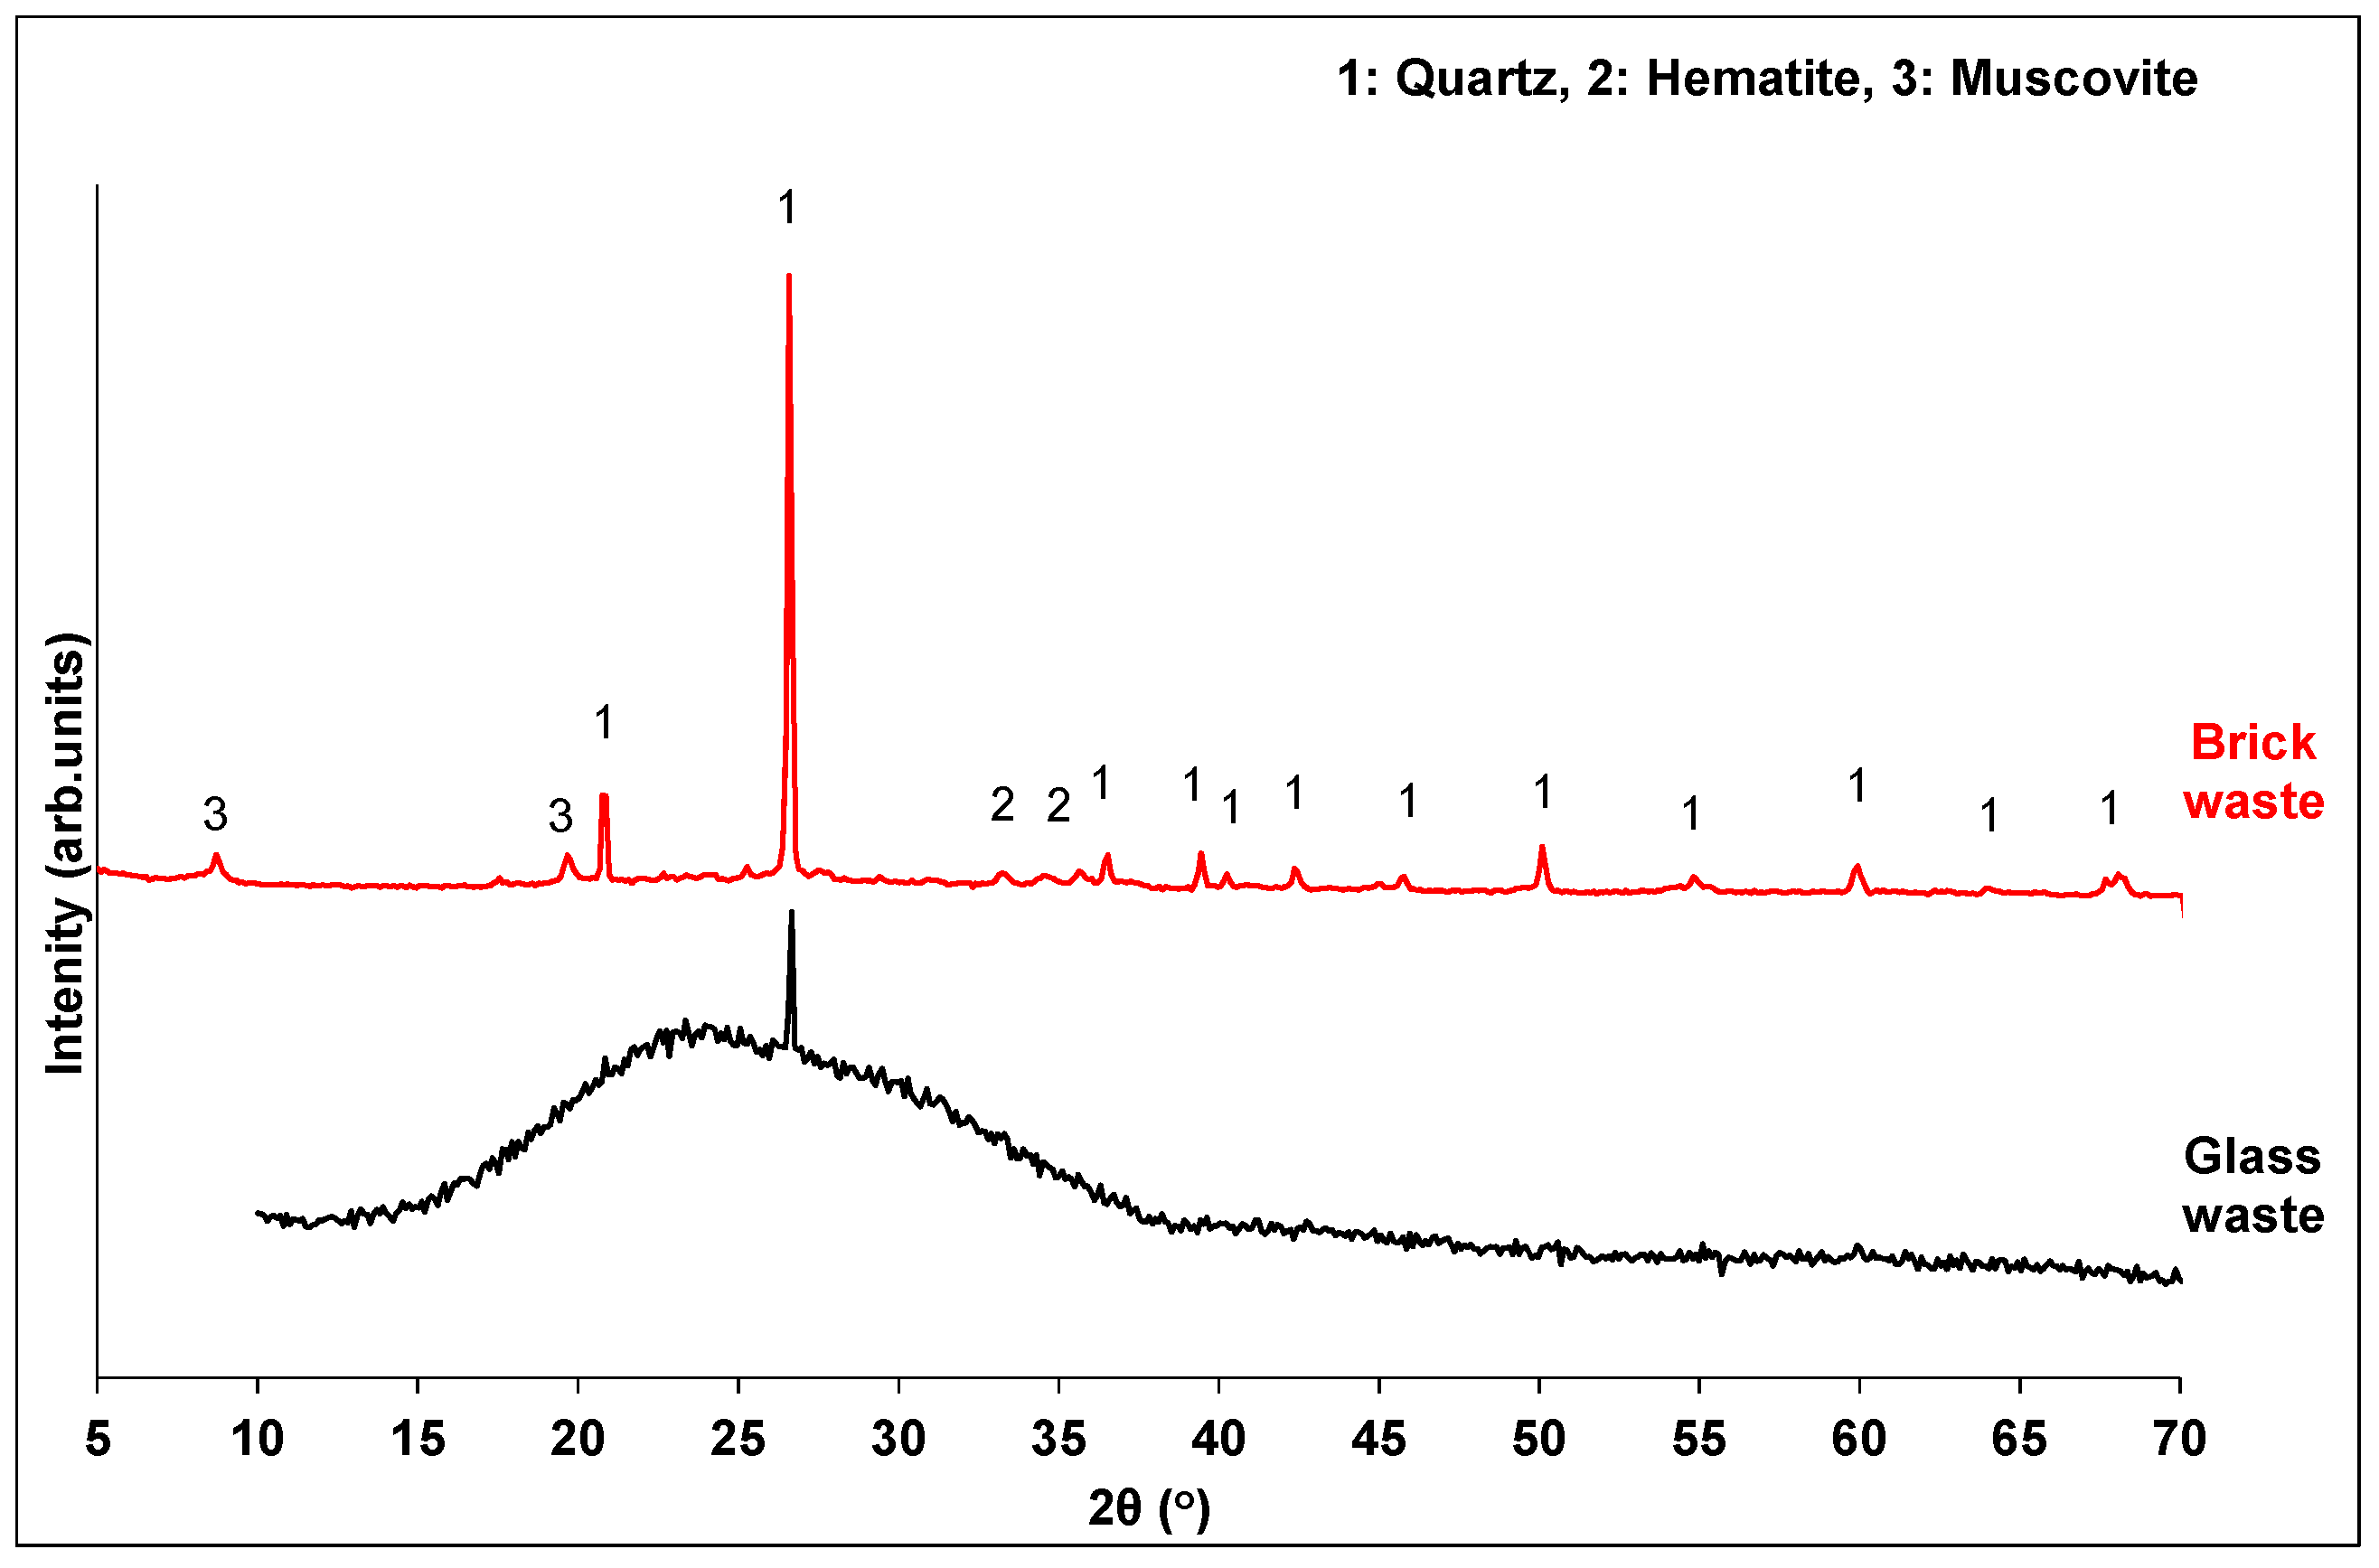
XRD analysis (Figure 2) revealed that brick waste possesses the typical mineral composition of a calcined-clay brick. The predominant mineral phase is quartz, along with small amounts of hematite and muscovite. The amorphous content of the brick waste was calculated through quantitative XRD analysis by DIFFRAC.TOPAS V5.0 software, and it was found to be 43.9% w/w. Glass waste is mainly amorphous (74.7%), with a broad hump in the range 15–35°, indicating the vitrified silicate phases.
2.2. Geopolymer Synthesis
The activation solution used in this study was either based on commercial chemicals or derived from the CDW glass dissolution. Concerning the preparation of the conventional activation solution, the appropriate amounts of alkali hydroxides (NaOH ≥ 98.0%, CAS No. 1310-73-2 and KOH ≥ 85.0%, CAS No.1310-58-3) were dissolved in water, and then soluble Si in the form of SiO2 solution (silica colloidal dispersion in water, 50% w/w, CAS: 7631-86-9) was added. The solutions were stirred for 1 h prior to use. Then, the waste brick powder and the alkali silicate activator were mixed (standard mortar mixer: Controls 65-L0005) until a homogenous slurry was formed. The prepared pastes were casted in 50 mm × 50 mm × 50 mm cubic molds and compacted on a vibrating table. The specimens were sealed with plastic film to prevent drastic moisture loss, cured at 80 °C for 3 days and then were kept in plastic bags at room temperature until mechanical testing was performed.
Due to the complexity of the geopolymerization process, the application of a multifactorial design of experiments (DoE), called the Taguchi method [30], was selected for the optimization of geopolymer synthesis. The major advantage of this DoE is that it can fully describe the examined process or product by conducting a minimum number of experiments, and thus saves valuable time and cost. In this study, MinitabTM software was used to design the experiments and statistically analyze the results.
In this study, the DoE target was to maximize the compressive strength of the produced geopolymers. Then, the factors affecting the geopolymer synthesis, as well as their value range, were defined. The selected factors were the following: i) the overall amount of Si involved in the geopolymerization process originating from both brick precursor and activation solution, expressed as the Si/Al molar ratio; ii) the alkalinity of the activation solutions expressed as alkali to aluminum molar ratio (R/Al, R: Na or K); and iii) the kind of alkali in the activation solution (Na/Na + K). It is well established in the literature that these factors have a major effect on the geopolymeric synthesis [31,32,33]. The orthogonal array L16 was applied in the design of the experiments. This array involves the variation of the above factors at four levels, and keeps the number of the needed experiments to 16, while a full factorial design requires the performance of 64 experiments in order to fully describe the same system. The various levels of the selected factors are presented in Table 3. The factor value range is determined by physical and chemical restrictions.
The analysis of the data obtained from the tests and the interpretation of the results was done through ANOVA (Analysis of Variance). The results are graphically illustrated and the percent contribution of each factor to the development of the compressive strength was exported. Finally, verification experiments were performed in order to confirm the results of the DoE. The application of fractional multifactorial DoE for the geopolymer synthesis is well described in previously published studies [34,35].
2.3. Glass Waste Dissolution
The glass waste was thermally treated in alkaline media in order to achieve high dissolution rates. The experiments performed are presented in Table 4. The dissolution of the glass was investigated through the study of the following parameters: (i) the content of sodium hydroxide in the extracting solution, denoted as NaOH/SiO2 molar ratio (experiments GL2, GL3 and GL4); (ii) the water amount of the extracted solution, H2O/SiO2 molar ratio (experiments GL4 and GL5); (iii) the temperature of the dissolution process (experiments GL1 and GL2); and (iv) the duration of the dissolution process (experiments GL5 and GL6). According to the literature, the aforementioned parameters are crucial to the glass dissolution [22,36,37].
Concerning the procedure that was followed, the CDW glass was milled and sieved to obtain a certain fineness (particle size ≤56 μm). Then, the appropriate amounts of CDW glass, sodium hydroxide and water (Table 4) were mixed and heated under stirring. At the end of each trial, the solutions were filtered in order to separate the liquid phase from the solid residue. The Si content in the solution was measured by means of ICP-OES, while the Na content was determined through titration with 1 M HCl.
2.4. Characterization Techniques
The geopolymer specimens were tested under unconfined compression according to ASTM C 109 requirements (loading rate: 1.5 kN/s) on a Toni-Technik uniaxial testing press. The compression tests were performed 7 days after the specimens’ preparation. It has been found that at this age, oven-cured geopolymers have almost reached the maximum compressive strength [38]. In each experiment, three specimens were prepared and tested under compression. In cases where there was more than ±10% variation from the mean value, the measurement was discarded and new specimens were prepared.
Mineralogical characterization of the CDW precursors and the final products was carried out by X-ray diffraction, using a Bruker D8 ADVANCE X-ray diffractometer (Bruker, Billerica, MA USA). The measuring conditions were the following: 2θ range 5–70°, step size 0.1°/sec. The data were evaluated using Diffrac. Eva v3.1 software.
FTIR measurements were performed on a Fourier Transform IR Spectrophotometer (Jasco 4200 Type A, Jasco, Easton, MD, USA). The FTIR spectra were obtained within a wavenumber range from 400 to 4000 cm−1 and resolution of 4 cm−1. The FTIR measurements were carried out by the KBr pellet technique. The pellets were prepared by pressing a mixture of the sample and dried KBr (sample:KBr equal to 1:200, approximately) at 7.5 t/cm2.
The final products’ morphology and phase stoichiometry was examined by Scanning Electron Microscopy (SEM) on a JEOL JSM-5600 Microscope equipped with an OXFORD LINK ISIS 300 Energy Dispersive X-ray spectrometer (EDS). The samples examined were gold coated prior to the measurement.
The obtained solutions from the glass waste dissolution studies were diluted to 250 mL and the Si content was measured by means of ICP-OES by the use of a Prodigy–Teledyne, Leeman Labs atomic emission spectrometer with inductively coupled plasma.
3. Results
3.1. Synthesis Optimization
Table 5 presents the synthesis parameters, the compressive strength and the density of the geopolymers. The wide variation in the compressive strength values (20.3–43.7 MPa) indicates that the selected parameters have a significant effect on the development of the compressive strength. In the same table, the solid/liquid mass ratio within the starting mixtures is also shown. This ratio was adjusted in order to obtain the same paste workability in all samples.
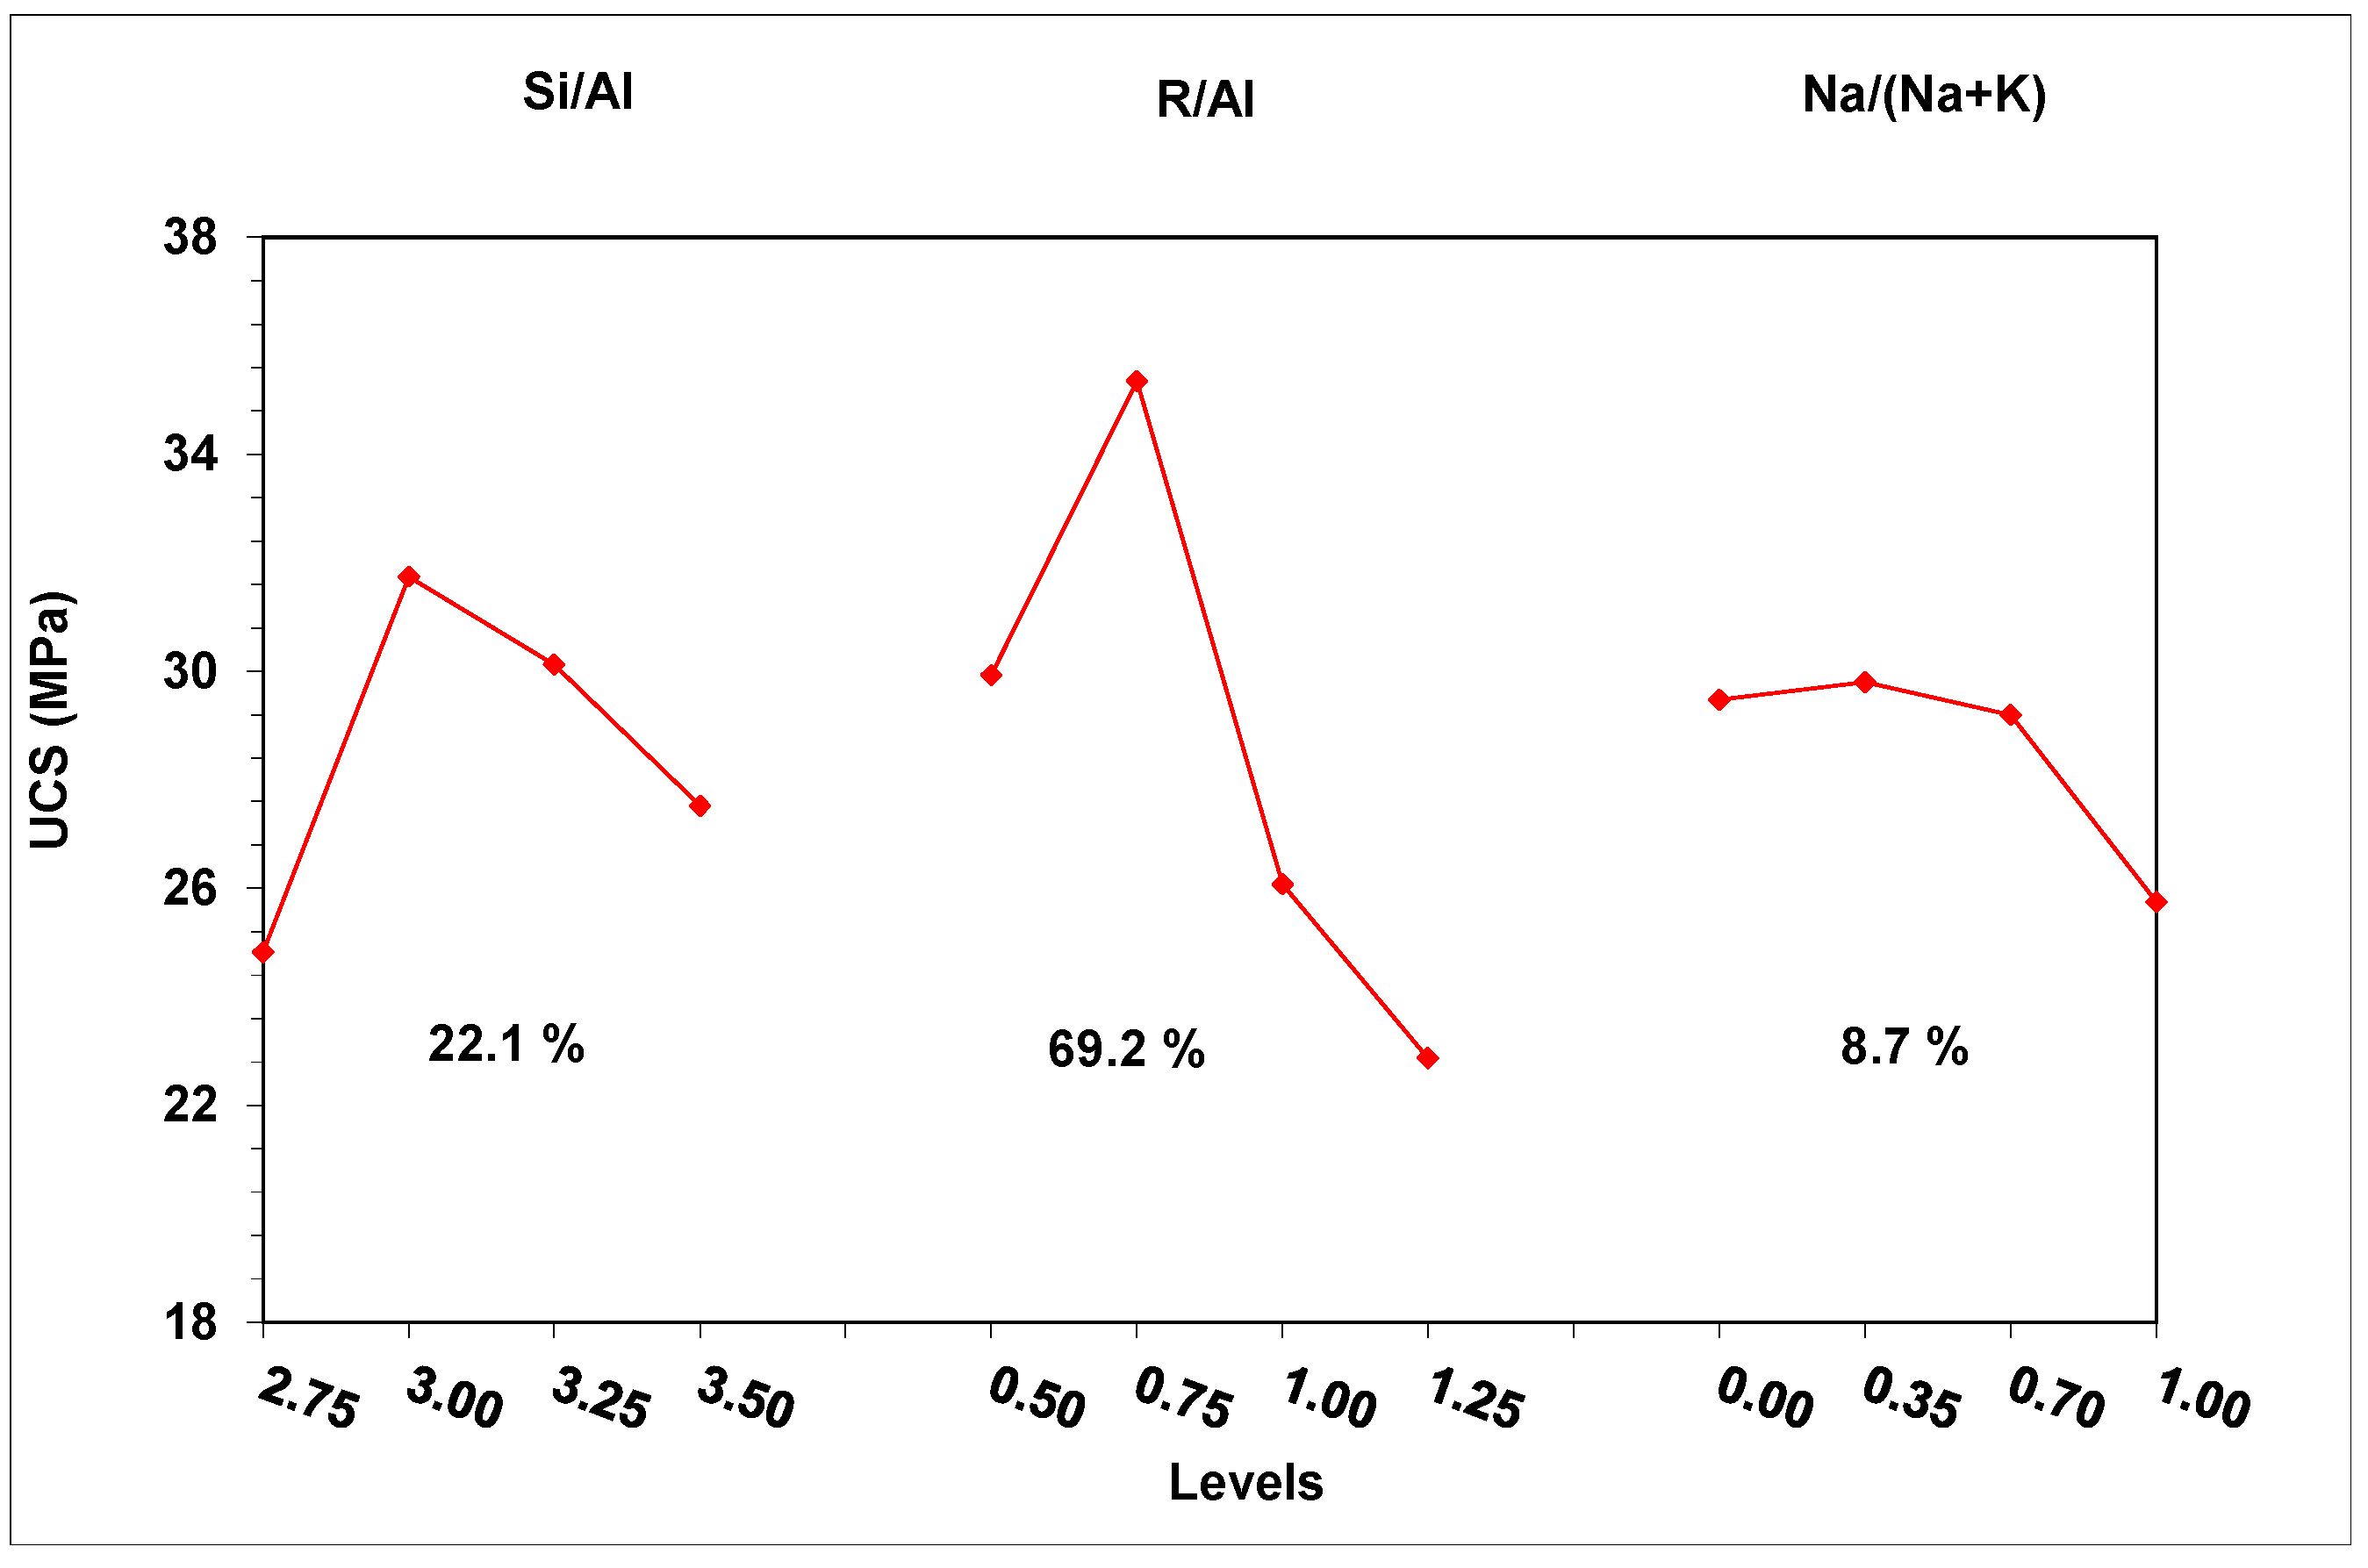
The data of Table 5 was processed through ANOVA statistical analysis, and the effect of the examined parameters on the compressive strength was plotted (Figure 3). Figure 3 also shows the contribution of each parameter to the development of the compressive strength.
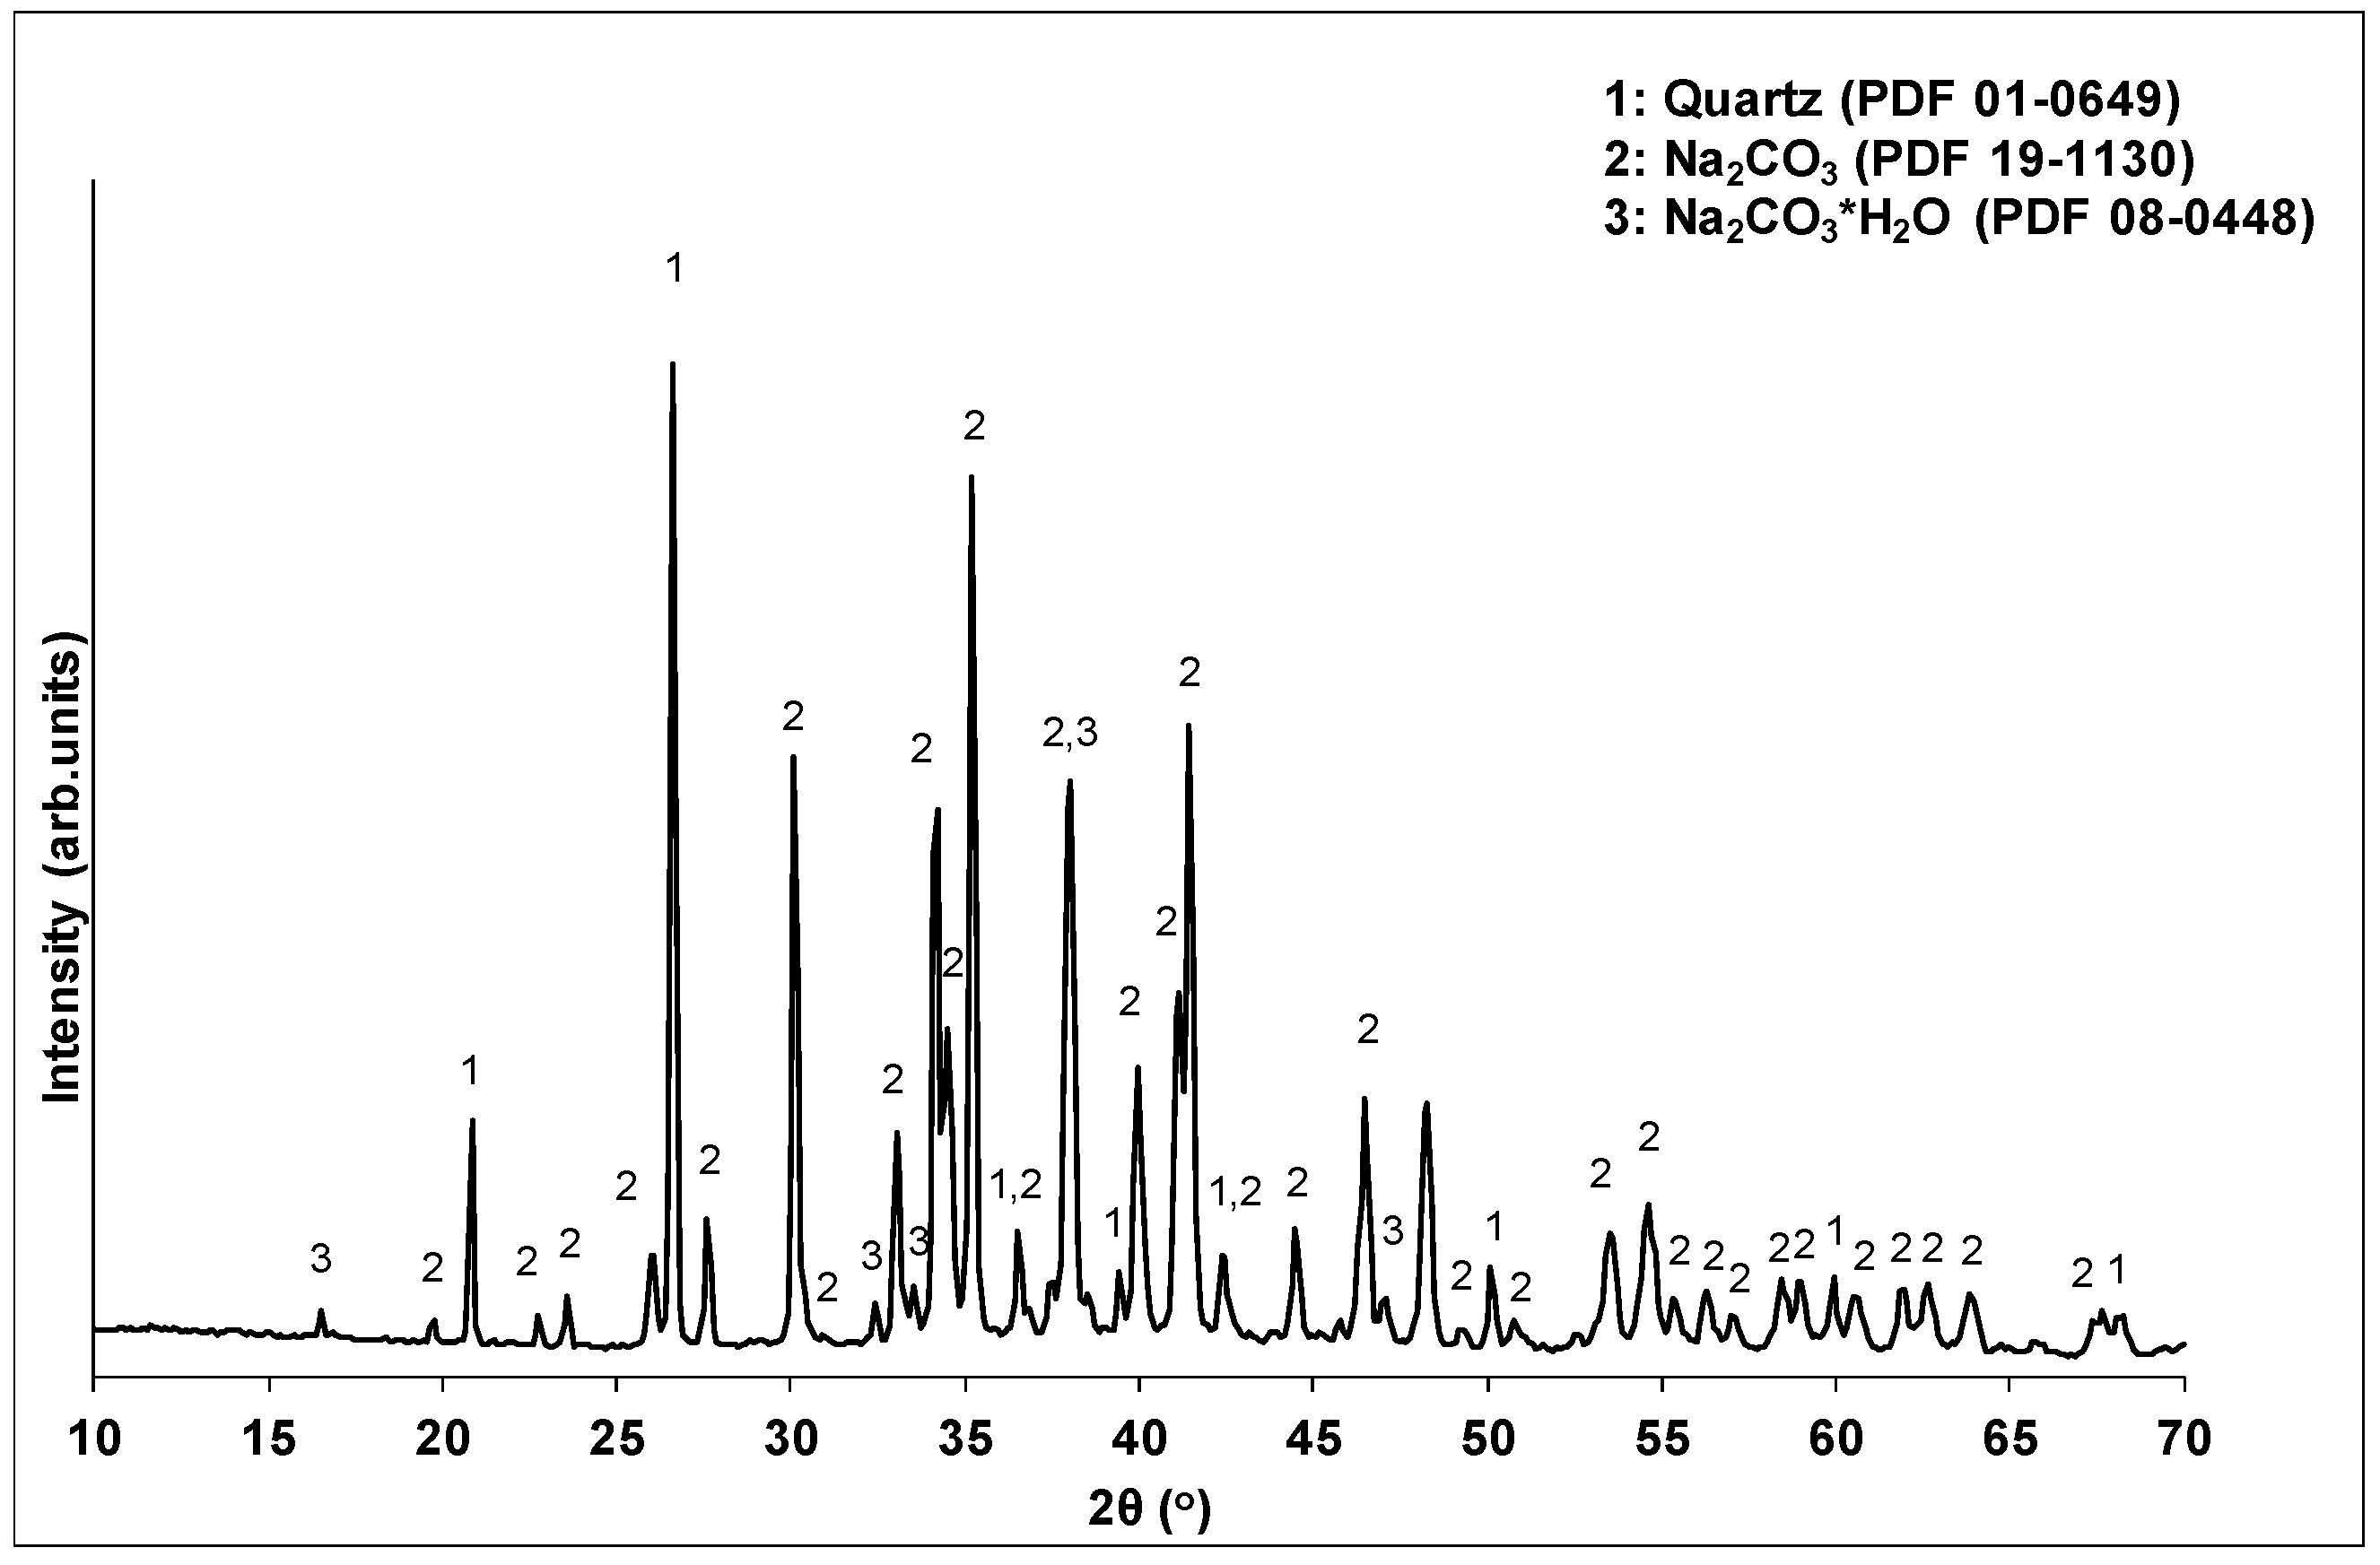
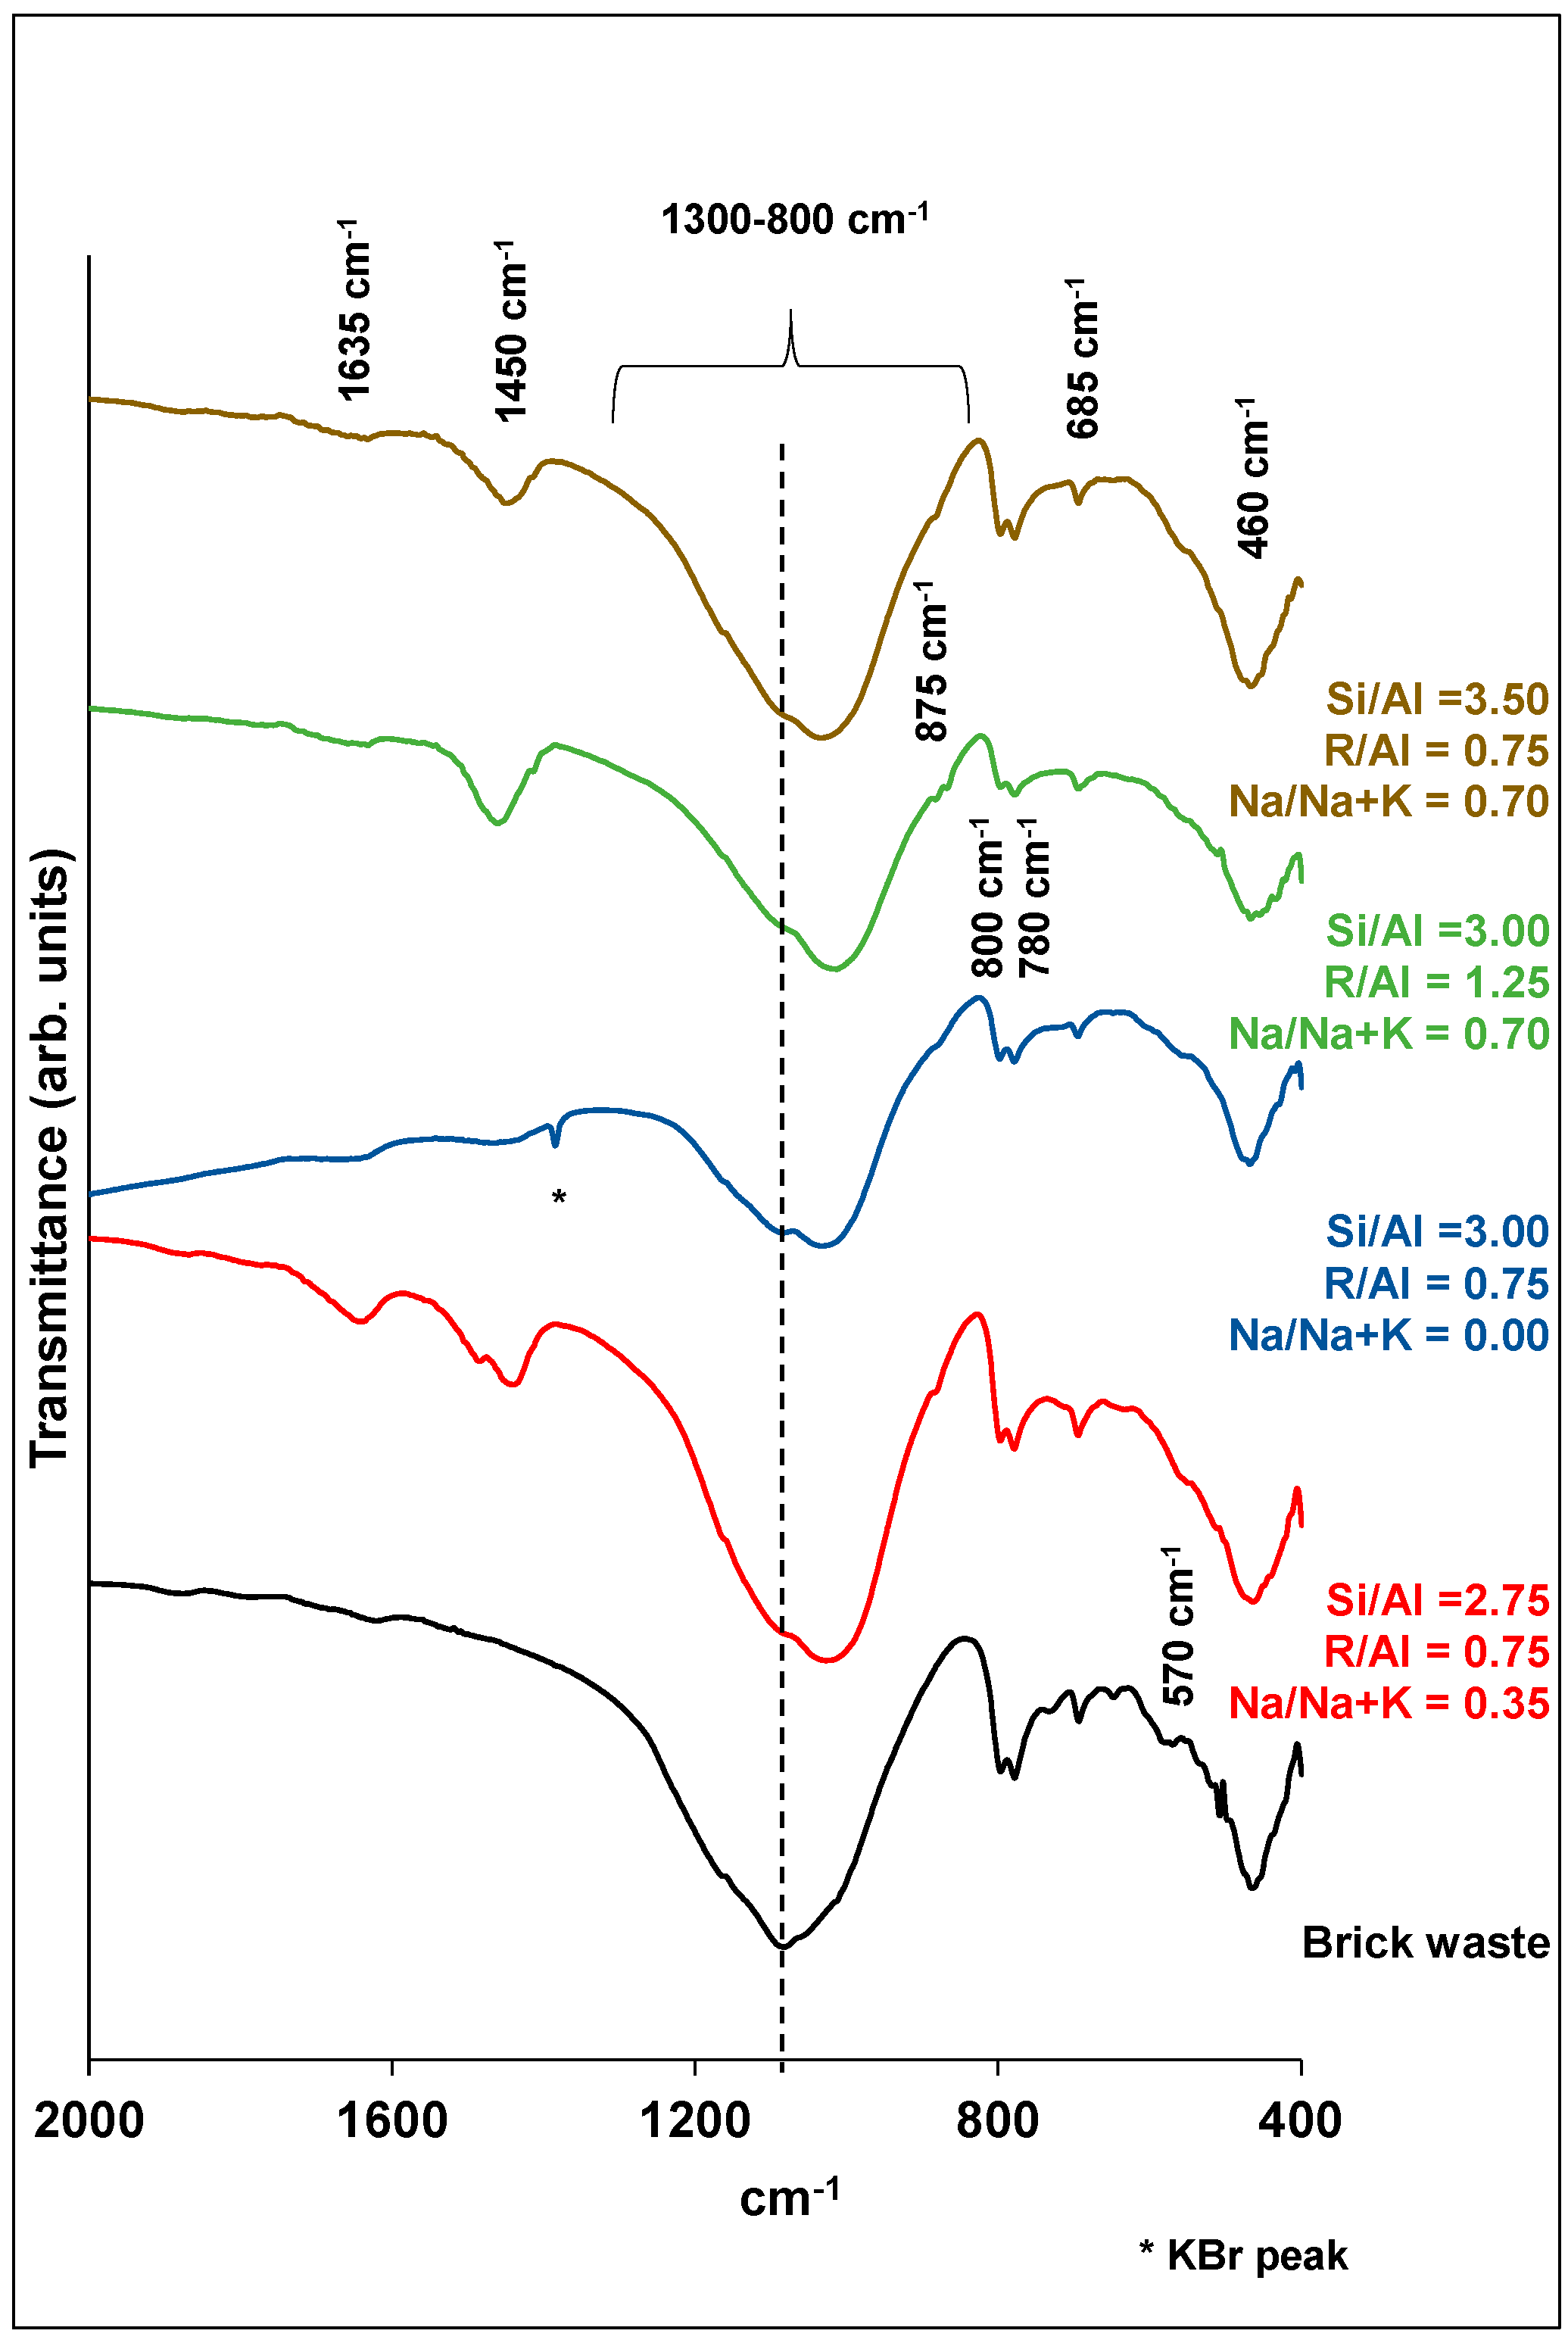
The factor with the major effect on compressive strength development is the alkalinity ratio (69.2%). A limited amount of alkalis (R/Al = 0.50) resulted in decreased pH values in the activating solutions, and thus in a reduction in the dissolution of the brick waste precursor. Indeed, a decrease of R/Al from 1.25 to 0.5 led to a corresponding decrease of pH values from 14.26 to 11.65. The absence of adequate amounts of solubilized Si and Al ions in the system restricts the formation of the geopolymeric matrix, leading to products with poor mechanical behavior. Apart from that, the lack of alkaline ions may affect the participation of Al ions in the geopolymerization reactions, since each Al ion involved in the geopolymer network requires an alkaline ion for charge balance [39,40]. The presence of higher amounts of alkalis (R/Al = 0.75) during geopolymerization led to the formation of products with high structural integrity. However, in high concentrations (R/Al = 1.25), alkalis cannot be incorporated into the geopolymeric matrix, and react with the CO2 in the atmosphere, forming carbonates that degrade the mechanical performance of the geopolymeric matrix. In the literature, carbonate formation is also reported to negatively affect the development of the mechanical strength of geopolymers [35,41]. The XRD analysis of the white powder deposited on the specimens’ surface confirmed the formation of carbonate phases. Figure 4 presents the XRD pattern of the white powder collected from the surface of WBG_4 (shown in Figure 5d).
The Si/Al molar ratio is the second most influential parameter (22.1%). The introduction of extra silicon into the synthesis, through the activation solution, favors the preparation of geopolymeric products with enhanced mechanical performance. The extra silicon ions favor the formation of the geopolymer matrix by acting as nucleation points for the polycondensation reactions [39]. Further increases in the Si in the activation solution (Si/Al > 3.00) have a negative effect on strength development. It seems that excesses of silicon ions in the activation solution restrict the dissolution of the aluminosilicate precursor by shifting the dissolution reaction to the left.
The type of alkali (K or Na) makes a limited contribution to the mechanical strength development. Higher strength is achieved by using activation solutions rich in potassium ions (Na/Na + K = 0.35), while the gradual substitution of potassium by sodium leads to strength reduction. The alkali species affect both the initial dissolution of the raw material and the polycondensation of the geopolymeric gel. In particular, the presence of smaller alkali ions, such as sodium, is proven to be more efficient with regard to aluminosilicate material dissolution, while potassium ions, which are heavier, favor the formation of disordered structures that positively affect the geopolymeric matrix formation [39,40].
ANOVA analysis also defined the optimum combination of the parameters (Si/Al = 3.00, R/Al = 0.75 and Na/Na + K = 0.35) for achieving the maximum compressive strength. This strength was predicted to be 39.8 ± 3.0 MPa (95% confidence interval). The above conditions were applied for the preparation of specimens (confirmation test) in order to validate the predictions of the experimental designing model. The results showed that the measured strength falls within the predicted range (42.5 MPa), and thus confirms the validity of the applied DoE.
Due to the fact that the solubilization of glass waste took place with the use of sodium hydroxide solutions, a synthesis which contains only sodium hydroxide in its activation solution was used for comparison reasons. For that purpose, the synthesis with Si/Al = 3.00, R/Al = 0.75 and Na/Na + K = 1 was performed. The ANOVA analysis predicts a 35.7 ± 3.0 MPa for a 95% confidence interval. The preparation of this geopolymer led to specimens with compressive strengths in the vicinity of 32.9 MPa.
3.2. Physicochemical Characterizations
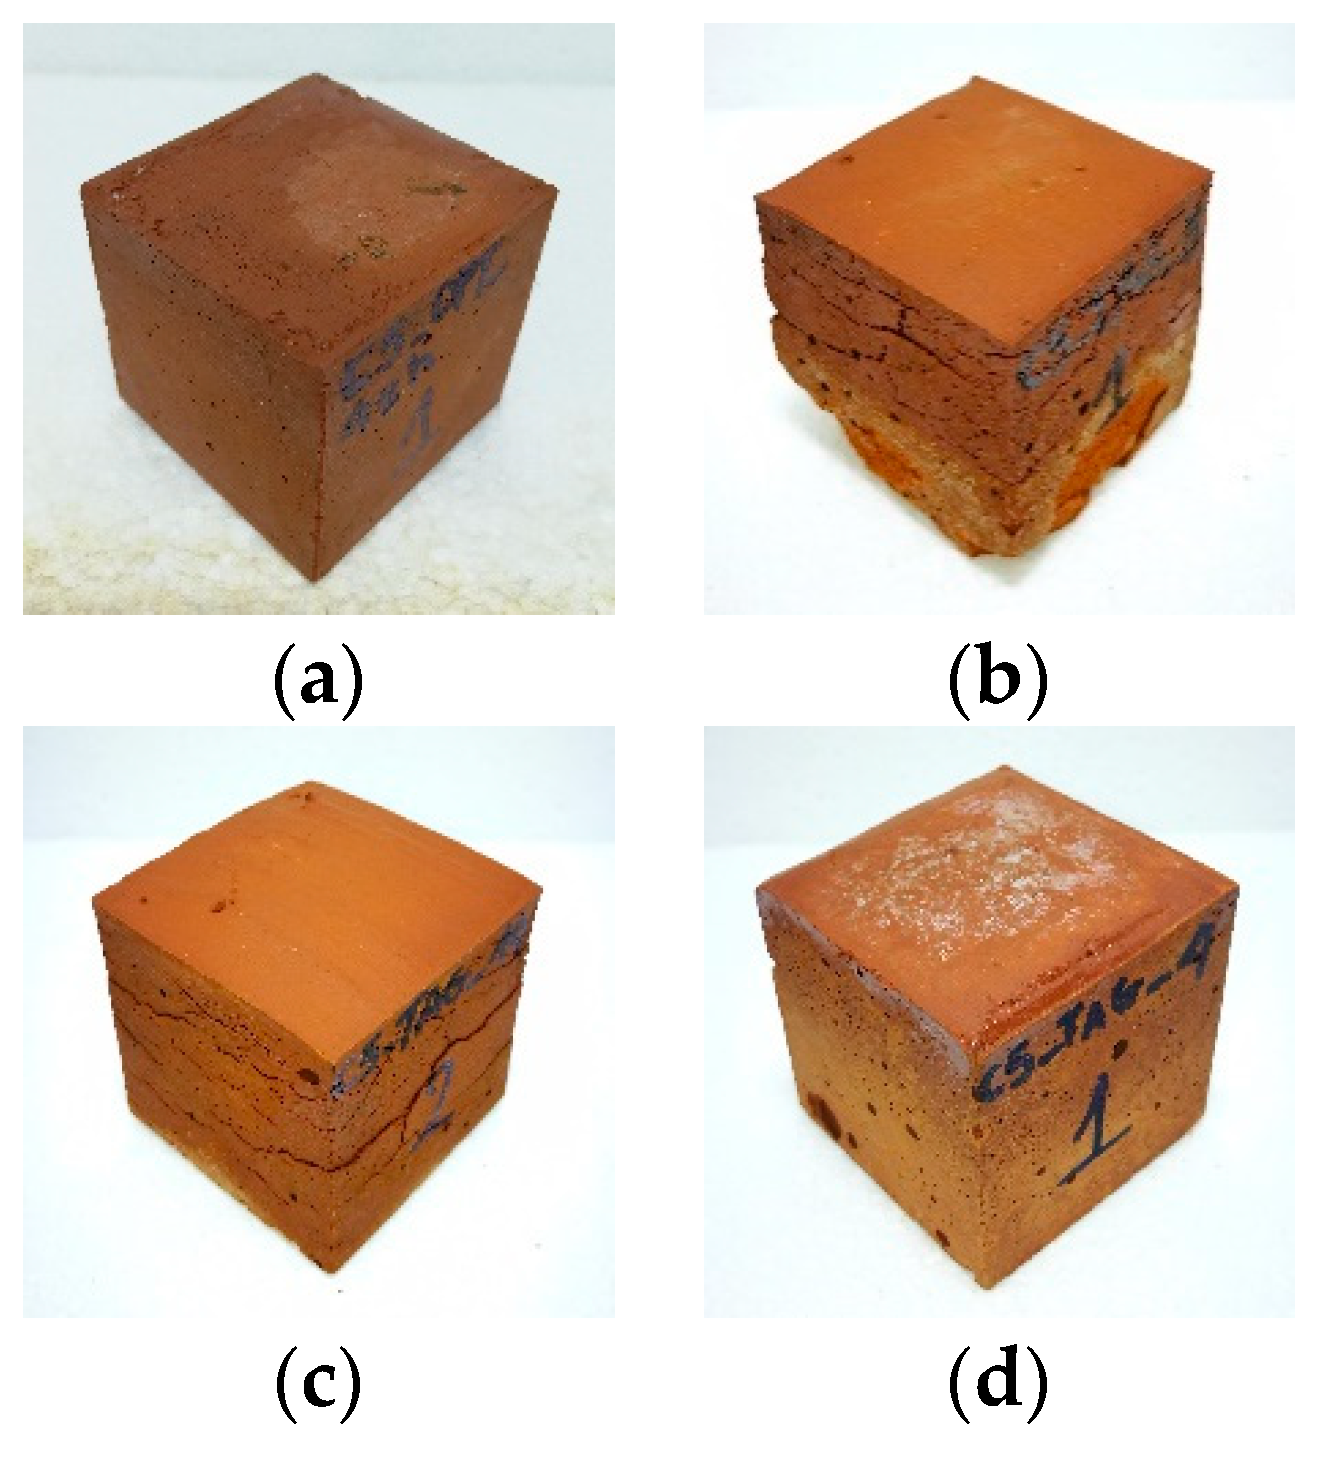
Figure 5 shows photos of selected geopolymer specimens. As is obvious, the geopolymers, prepared under optimum conditions, form compact and well-shaped specimens (Figure 5a). Low quality products, exhibiting increased porosity, cracking and carbonation phenomena, were obtained in the cases of low or high alkalinity, or where soluble Si was lacking (Figure 5b–d).
Analytical techniques, such as XRD, FTIR and SEM, were used in order to characterize the final products. Figure 6; Figure 7 show the XRD patterns and the FTIR spectra of samples corresponding to different experiments of synthesis optimization. The grouping of each diagram was done according to the R/Al and Si/Al ratios. As stated before, these factors make the highest contributions to the development of the compressive strength.
Concerning the XRD analysis (Figure 6), all products contain the mineral phases of the brick precursor (quartz, muscovite and hematite). The absence of soluble silicon (Si/Al = 2.75) or the high alkali content (R/Al = 1.25) in the activation solution favors the formation of zeolites (phillipsite) that downgrade the mechanical performance of the products. The relationship between low soluble silicon content or high alkali content and the formation of zeolites in geopolymers has also been reported in the literature [42,43]. The alkali type modifies the stoichiometry of the formed zeolites. In particular, high potassium content favors the formation of the phillipsite K, syn (PDF 16-0715). The increase in sodium content favors the formation of a mixed phillipsite with chemical formula KNaCaFeAlSiO6·39H2O (PDF 20-0923).
The FTIR spectrum of the brick precursor is mainly characterized by the presence of a broad absorption peak in the range 800–1300 cm−1 (Figure 7). This absorption is attributed to the asymmetric stretching vibrations of Si-O-Si and/or Si-O-Al bonds, while the lack of sharpness is indicative of the glassy and heterogeneous nature of brick waste. The shift of this absorption peak to smaller wavenumbers, in the case of geopolymers, indicates an increased substitution of Si by tetrahedral Al. The above changes are consistent with the formation of an aluminosilicate network in the polymeric structures [16,35,42,44,45].
The vibrations at ~1400 cm−1 are characteristic of the [CO3]2− ions, indicating carbonization. This peak is absent in the case of the brick precursor. The absorbance at 875 cm−1 is related to symmetric stretching vibrations of Al-O, and it constitutes a sign of geopolymerization [35]. As for the 800, 780 and 685 cm−1 peaks, these are connected with the symmetric stretching vibrations of Si-O-T bonds. As the Si/Al ratio increases, the latter band shifts to higher wavenumbers in relation to the brick waste, showing the enrichment of the alumino-silicate network in silicon [35,42]. The band at 570 cm−1 is assigned to the Fe-O bond vibrations of hematite [46], which is present in the brick precursor. Finally, the absorption peak at ~460 cm−1 corresponds to the O-Si-O asymmetric bending vibrations, which do not show any changes in the case of geopolymer products. In general, the bending vibrations are not sensitive to changes in the form of the aluminosilicate network [35,47].
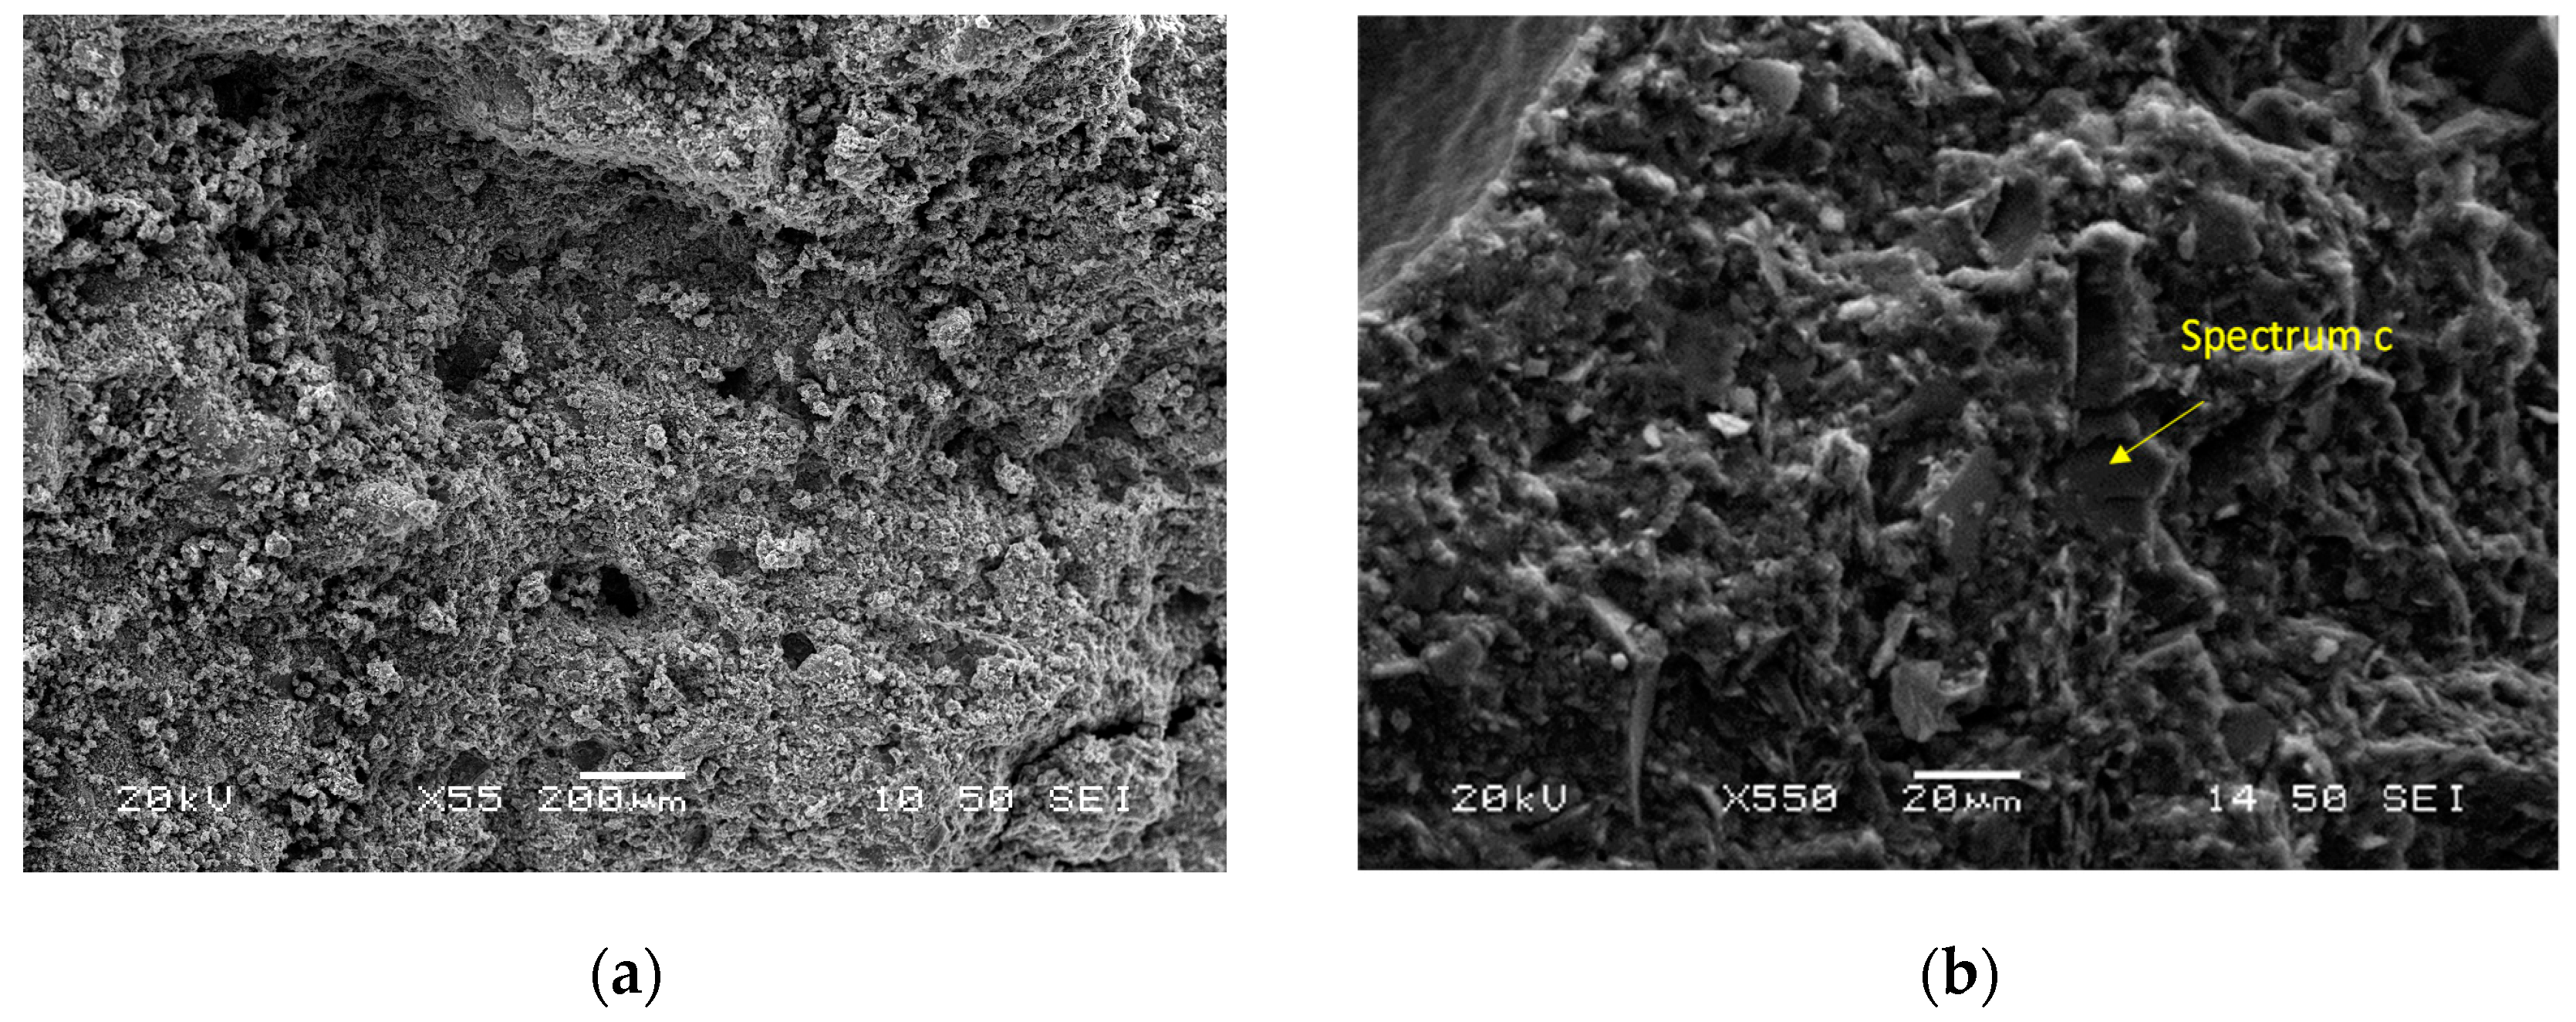
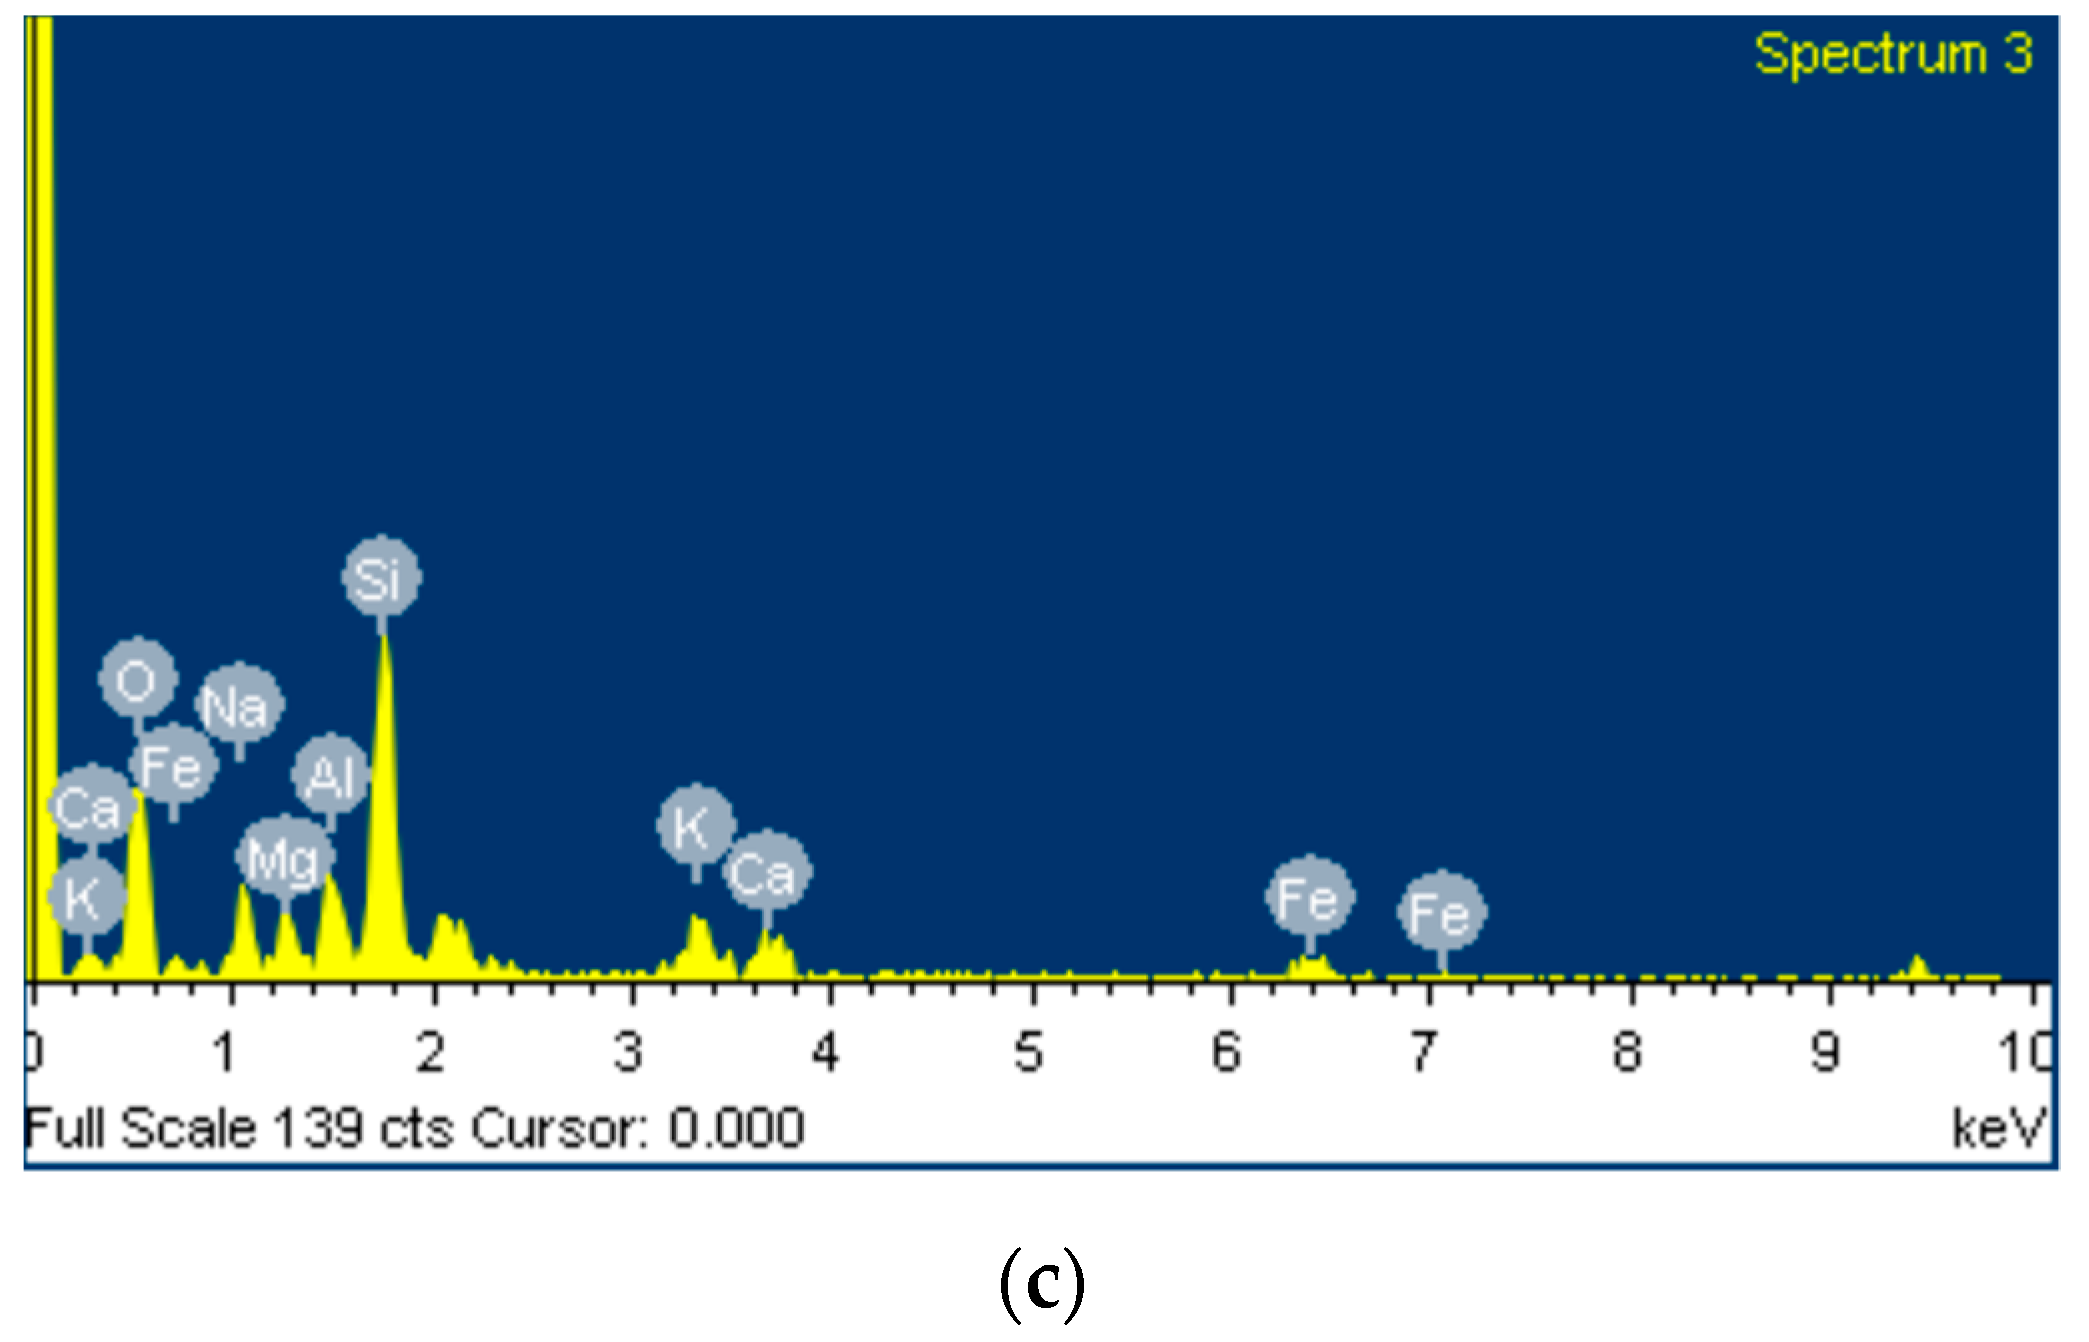
Figure 8 shows SEM micrographs of different magnifications, and the phase stoichiometry of the geopolymer prepared under the optimum conditions of synthesis (Si/Al = 3.00, R/Al = 0.75 and Na/Na + K = 0.35). The products consist of unreacted grains surrounded by a homogenous and compact binding matrix. The polygonal grains (size: 10–20 μm) are mainly quartz, as is confirmed by EDS analysis. These grains act as microaggregates and enhance the strength of the specimens. These photos are from the sample with the highest strength, so it is assumed that the binding matrix is mainly a geopolymeric matrix. EDS analysis at different points of this matrix showed that its stoichiometry is Si:Al:R = 24.6:5.6:13.5 (R = Na + K).
3.3. Glass Waste Dissolution
Table 6 presents the Si and Na contents in the liquid products (mg/250 mL), the SiO2/Na2O molar ratio of the liquid products as well as the conversion yield of SiO2.
As shown in Table 6, the increase of the dissolution temperature from 100 °C (GL1) to 150 °C (GL2) increases the glass conversion by 15%. An increase in yield of 6% is also observed when the dissolution time increases from 24 h (GL4) to 96 h (GL6). Nevertheless, the effect of the dissolution temperature is at least two times greater than that of the dissolution time. This is possibly attributed to the fact that the experiments with varied dissolution times were performed in extracting solutions with low NaOH content. In general, intense dissolution conditions (temperature, time) help the depolymerization and destruction of the glass network, and therefore its gradual dissolution.
The introduction of sodium hydroxide amounts into the extracting solution (NaOH/SiO2) is beneficial to the glass dissolution, since the increase of NaOH/SiO2 from 1 (GL4) to 2 (GL3) led to an enhancement of conversion yield by about 39%. The extraction mechanism of SiO2 from the glass network in alkaline media is governed by a hydrolysis reaction of OH- groups and Si-O-Si bonds, and it is pH-dependent [25,26,27,28,29]. However, more concentrated extracting solutions (NaOH/SiO2 = 4) inhibited the dissolution of Si. In the literature, it is reported that when a critical amount of NaOH solution is reached, the rate of reaction becomes constant [48,49]. Nevertheless, the NaOH concentration (1 M) of such solutions is much lower than that used in GL2 (10 M). It seems that the high concentration of -OH groups available in this system disrupts the equilibrium of the hydrolysis reaction. This fact is supported by the XRD analysis showing that higher amounts of calcium silicate and quartz phases are precipitated in GL2.
Denser extracting solutions were also tested, to see how the amount of water (H2O/SiO2) affects the glass dissolution. As was expected, the reduction of H2O/SiO2‘s molar ratio to 9 (GL5) from 23 (GL6) had a negative effect, since the water, apart from playing the role of the diluent of the sodium hydroxide, supplies the system with H+ ions, which react with Si-O- and enhance the destruction of the glass network.
More or less the same trend was followed for the SiO2/Na2O ratio of the produced sodium silicate solutions. Intense extracting conditions (T = 150 °C, t = 96 h) and diluted starting solutions (H2O/SiO2 = 23) led to sodium silicate solutions with higher values of SiO2/Na2O ratio. Concerning sodium hydroxide content, the highest SiO2/Na2O ratio was achieved for NaOH/SiO2 = 2 (GL3). As mentioned before, this ratio value maximizes the dissolution of silica from glass waste. Higher values of NaOH/SiO2 (= 4) led to decreased SiO2/Na2O ratio values, since the sodium ion content in the extracting solution is significantly high.
The parameters that maximized glass waste dissolution are the following: NaOH/SiO2 = 2, H2O/SiO2 = 23, T = 150 °C and t = 24 h (GL2 sample). In particular, 72% of the solid SiO2 in the waste glass was dissolved. The resulting liquid phase is a sodium silicate-rich aqueous product with a SiO2/Na2O molar ratio close to 0.7. This value is very close to the molar ratio of SiO2 to Na2O (0.68) in the activation solution of the CDW brick-based geopolymer preparation.
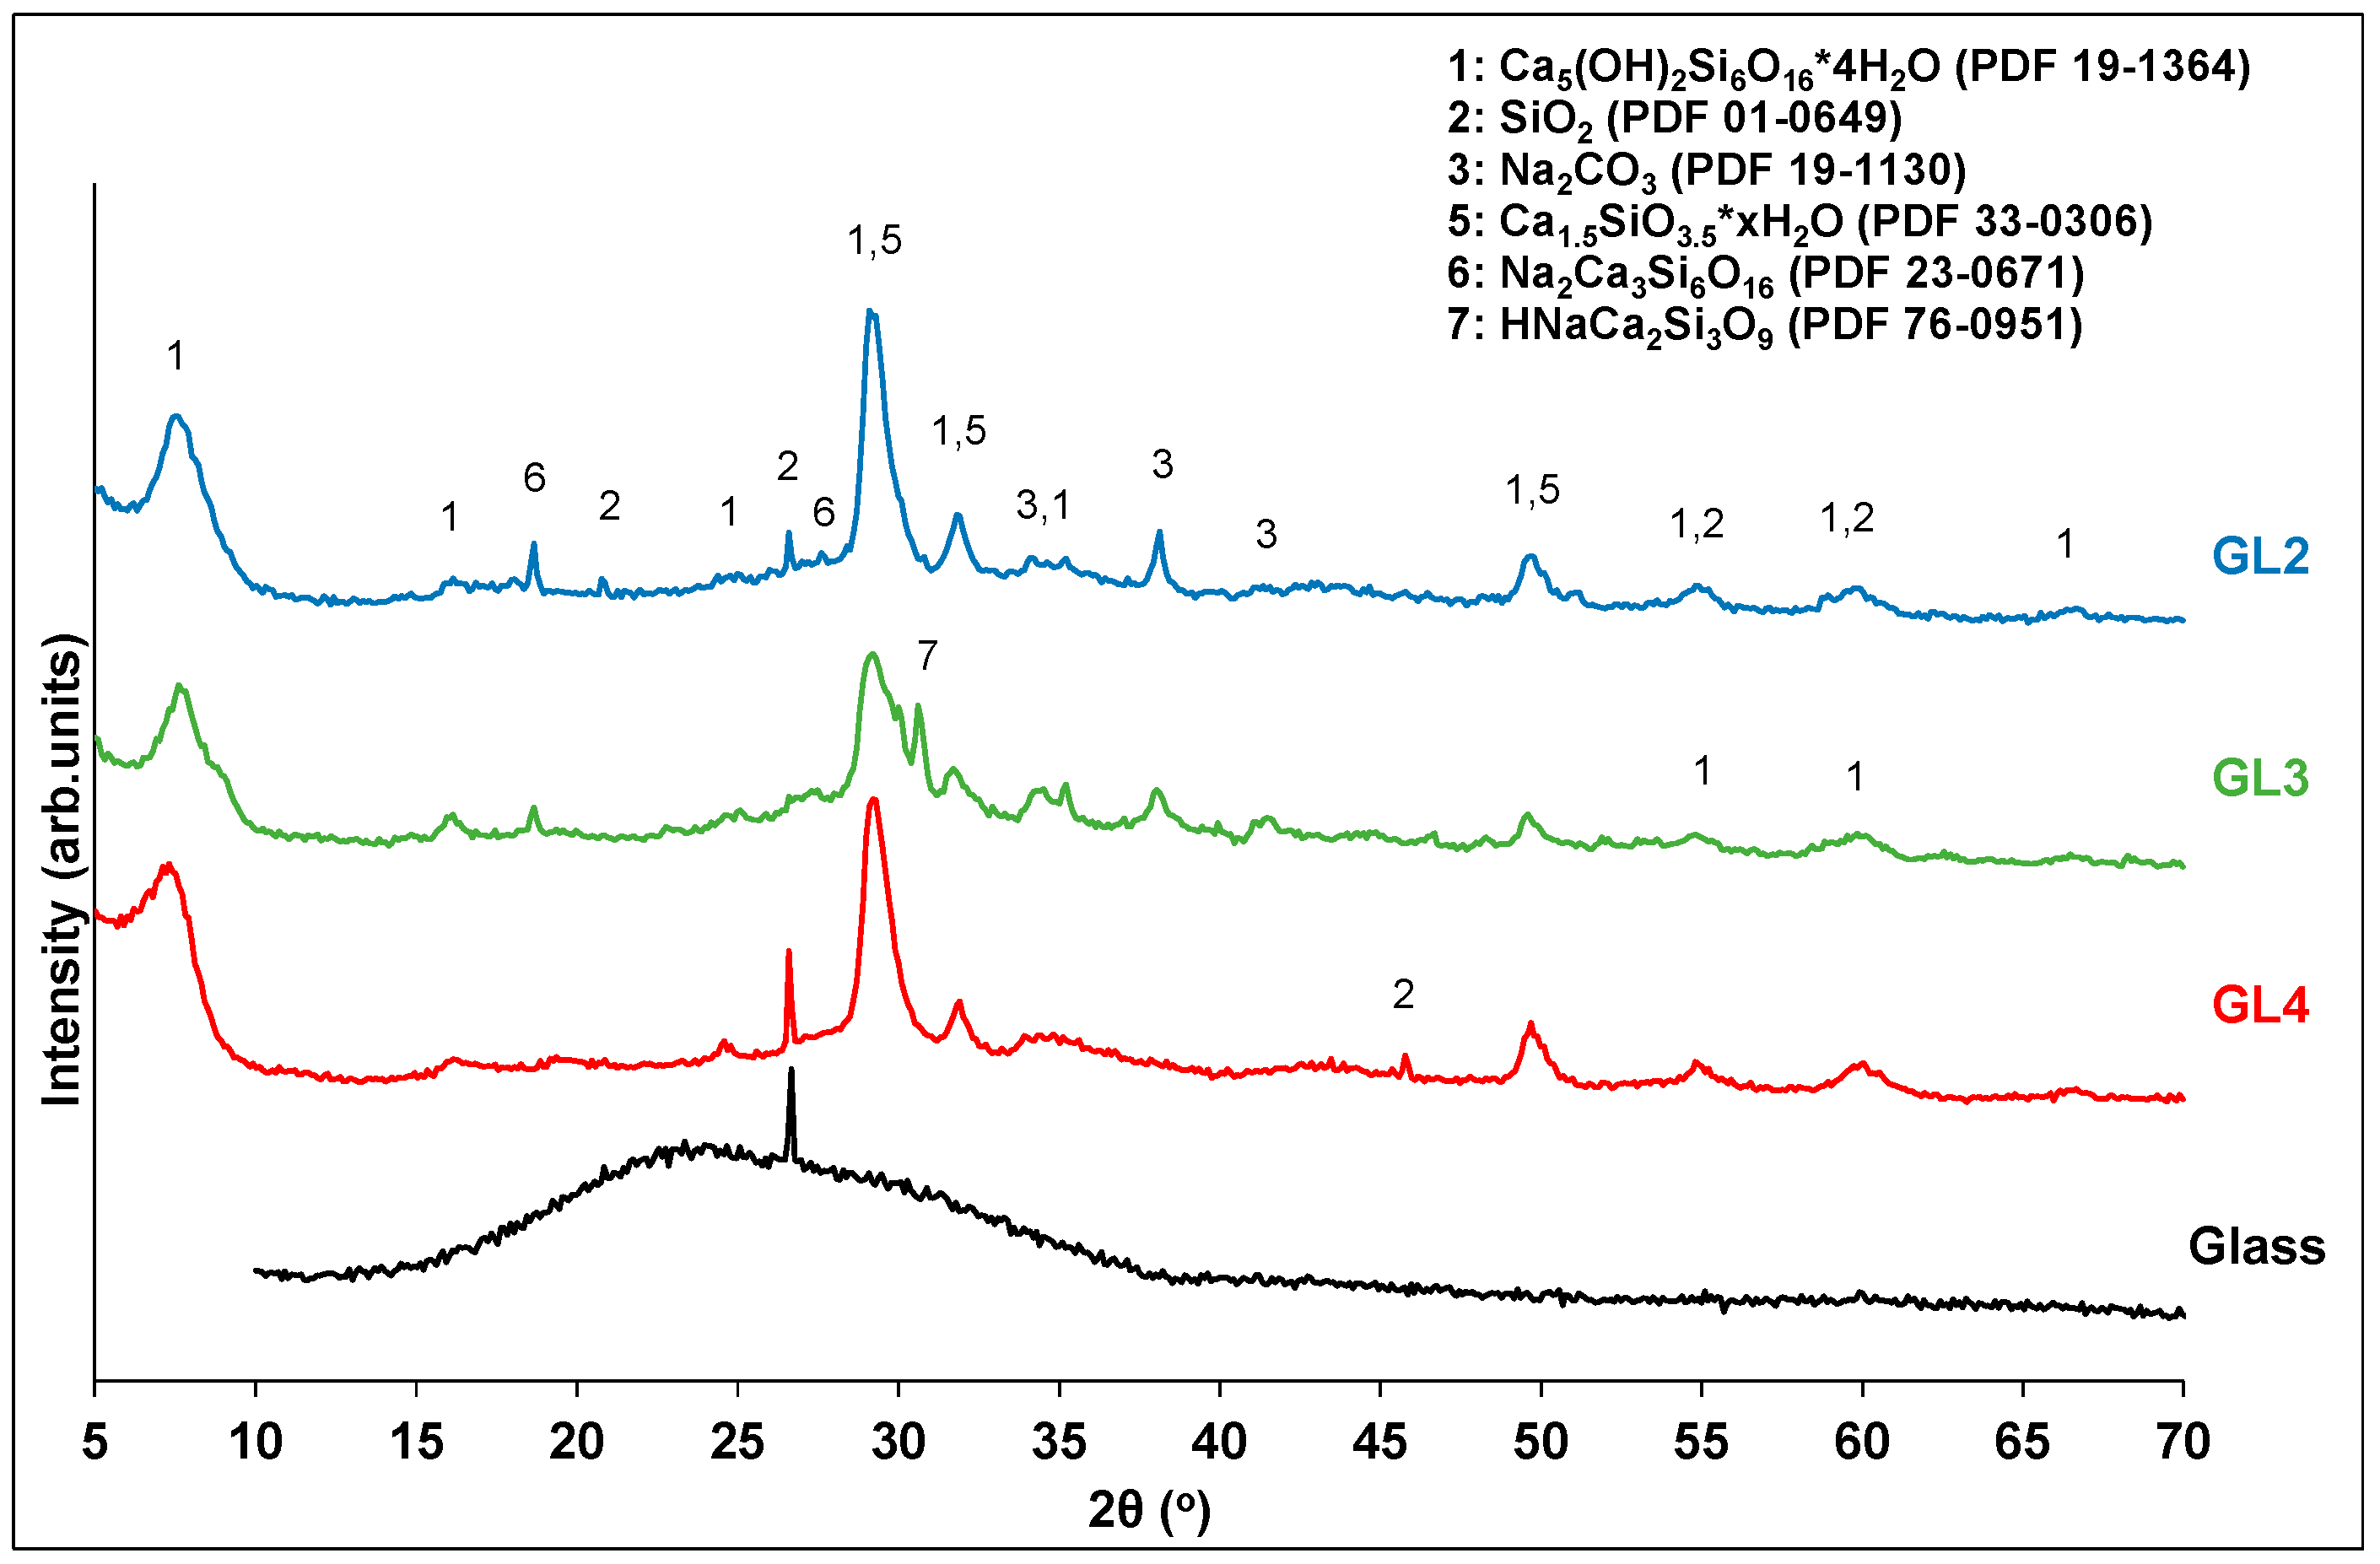
The solid residues of the glass treatment were characterized by XRD (Figure 9). In all cases, the residues contain a mixture of calcium silicates and quartz from unreacted glass particles. When the sodium hydroxide content increases, the peak intensities of the quartz phase gradually decrease, revealing its partial decomposition. In the case of GL3, the quartz phase appears to have been almost completely consumed, while extra calcium silicate phases containing sodium are still present. A further increase in sodium hydroxide content (GL2) leads to solid products that are more crystallized, with small amounts of quartz still visible. This observation may explain the decrease in the silicon conversion yield of GL2.
3.4. Preparation of Geopolymers Using Glass Waste Activators
The glass waste solutions GL3 and GL6 have Si2O/Na2O ratios close to that of the activation solution used for the optimum geopolymeric synthesis (0.68), and they were further tested as activators. The GL2 solution was also tested, as it exhibits a high silica yield. Prior to use, a condensation process of the glass waste solutions took place in order to evaporate excess water and achieve the same solid/liquid ratio in the precursor mixture. The applied synthesis factors and curing conditions were based on the optimum synthesis prepared with the conventional activation solution (R/Al = 0.75, Na/Na + K = 1, T = 80 °C and t = 3 d).
Figure 10 presents the compressive strength of the produced geopolymers using either the conventional activation solution (GEO_REF) or glass waste solutions. It is obvious that the use of the GL3 solution in the preparation of geopolymeric samples achieves a similar mechanical performance to that of the reference synthesis. On the contrary, the GL6 solution leads to geopolymers with reduced mechanical strengths. The low conversion yield of GL6 results in lower Si and Na contents than those required for the geopolymer synthesis. In a similar manner, the GL2-based product possesses degraded compressive strength values, since its Si content is considerably lower than needed. In all cases, geopolymers with compressive strength values higher than 10 MPa were prepared. The robustness of the produced geopolymers is also indicated by the density values (Figure 10). Specimens with high mechanical strength are coupled with high density, and vice versa.
The reference geopolymer (CDW brick and conventional activation solution) has an 82% w/w CDW content in the solid precursors’ base, and a content of 76% w/w in the final product. The joint exploitation of CDW brick and glass in geopolymer synthesis increases the CDW content to 91% w/w and 85% w/w, in a solid precursors’ base and in the final product, respectively.
4. Conclusions
This study suggests a way to maximize the valorization of construction and demolition wastes in geopolymer technology. CDW brick is used as the aluminosilicate precursor, while CDW glass is appropriately processed to obtain the activation solution. The geopolymer products contain as high as 91% CDWs (on solid precursors’ base), in accordance with the demands of EU legislation and the principles of the circular economy. The following conclusions can be drawn:
- CDW brick can be successfully reused in the production of green building materials, since products with a wide range of compressive strength values were obtained (20.3–43.7 MPa). The geopolymer synthesis was efficiently optimized by the application of the Taguchi method, a fractional multifactorial design methodology;
- The silicon and alkali contents in the activation solution greatly affect the performance of the brick-based geopolymers. Very low or high amounts of these species are responsible for the formation of extra phases, such as zeolites and carbonates that degrade the mechanical performance of the products;
- CDW glass can be effectively processed and then used as an activator for geopolymer synthesis. The treatment of glass waste at 150 °C, for 24 h, in an alkaline solution with molar ratios NaOH/SiO2 = 2 and H2O/SiO2 = 23, leads to 72% silica yield;
- Glass waste solutions can effectively substitute conventional activators based on commercial chemicals, as in both cases the final products have the same compressive strength (32 MPa).
A study on the development of a solid activator based on glass waste for the preparation of one-part geopolymer mixtures will be the next step in this research. In this case, the corrosive reagents needed for the preparation of the traditional liquid activators will be replaced by low-cost, solid activators, originating from CDWs. One-part synthesis will be simpler, safer and more practical, since the aluminosilicate precursor is premixed with the solid activator, and then just with water, in a process very similar to that of Portland cement-based materials.
Author Contributions
Conceptualization, D.K., A.S., G.K., S.T.; methodology, D.K., A.S.; resources, A.S.; writing—original draft preparation, D.K.; writing—review and editing, S.T., G.K.; project administration, S.T. and G.K.; funding acquisition, G.K. All authors have read and agreed to the published version of the manuscript.
Funding
This research work was funded by the European Union Horizon 2020 (H2020-EEB-2016-2017, “Green Integrated Structural Elements for Retrofitting and New Construction of Buildings—GreenINSTRUCT”, Grant No.: 723825).
Acknowledgments
The authors gratefully acknowledge L. Isufai and A. Karamperi for their valuable assistance in performing experiments on geopolymer synthesis, XRF and ICP-OES measurements.
Conflicts of Interest
The authors declare no conflict of interest.
References
- Ellen MacArthur Foundation. Towards the Circular Economy: An Economic and Business Rationale for an Accelerated Transition; Ellen MacArthur Foundation: Cowes, UK, 2012; pp. 21–34. [Google Scholar]
- Geissdoerfer, M.; Savaget, P.; Bocken, N.M.P.; Hultink, E.J. The circular economy—A new sustainability paradigm? J. Clean. Prod. 2017, 143, 757–768. [Google Scholar] [CrossRef] [Green Version]
- Murray, A.; Skene, K.; Haynes, K. The circular economy: An interdisciplinary exploration of the concept and application in a global context. J. Bus. Ethics 2017, 140, 369–380. [Google Scholar] [CrossRef] [Green Version]
- PBL Netherlands Environmental Assessment Agency. Trends in Global CO2 Emissions: 2016 Report; PBL Netherlands Environmental Assessment Agency: Hague, The Netherlands, 2016.
- Huntizinger, D.N.; Eatmon, T.D. A life-cycle assessment of Portland cement manufacturing: Comparing the traditional process with alternative technologies. J. Clean. Prod. 2009, 17, 668–675. [Google Scholar] [CrossRef]
- Andrew, R.M. Global CO2 emissions from cement production. Earth Syst. Sci. Data 2019, 11, 1675–1710. [Google Scholar] [CrossRef] [Green Version]
- Purdon, A.O. The action of alkalis on blast-furnace slag. J. Soc. Chem. Ind. 1940, 59, 191–202. [Google Scholar]
- Glukhovsky, V.D.; Zaitsev, Y.; Pakhomow, V. Slag-alkaline cements and concretes structures, properties, technological and economic aspects of the use. Silic. Ind. 1983, 10, 197–200. [Google Scholar]
- Davidovits, J. Geopolymers and geopolymeric materials. J. Therm. Anal. 1989, 35, 429–441. [Google Scholar] [CrossRef]
- Van Jaarsveld, J.G.S.; Van Deventer, J.S.J.; Lorenzen, L. Factors affecting the immobilization of metals in geopolymerized fly ash. Metall. Mater. Trans. B 1998, 29, 283–291. [Google Scholar] [CrossRef]
- Provis, J.L.; van Deventer, J.S.J. Geopolymers: Structures, Processing, Properties and Industrial Applications, 1st ed.; Woodhead Publishing: Cambridge, UK, 2009. [Google Scholar]
- Davidovits, J. Geopolymer Chemistry and Applications, 2nd ed.; Institut Geopolymere: Saint-Quentin, France, 2008; pp. 3–12. [Google Scholar]
- Eurostat Statistics Explained. Available online: https://ec.europa.eu/eurostat/statistics-explained/index.php/Waste_statistics#Total_waste_generation (accessed on 25 March 2020).
- Directive 2008/98/EC of the European Parliament and of the Council on Waste and Repealing Certain Directives; O J 312; European Union: Brussels, Belgium, 2008; pp. 3–30.
- De Rossi, A.; Ribeiro, M.J.; Labrincha, J.A.; Novais, R.M.; Hotza, D.; Moreira, R.F.P.M. Effect of the particle size range of construction and demolition waste on the fresh and hardened-state properties of fly ash-based geopolymer mortars with total replacement of sand. Process Saf. Environ. 2019, 129, 130–137. [Google Scholar] [CrossRef]
- Komnitsas, K.; Zaharaki, D.; Vlachou, A.; Bartzas, G.; Galetakis, M. Effect of synthesis parameters on the quality of construction and demolition wastes (CDW) geopolymers. Adv. Powder Technol. 2015, 26, 368–376. [Google Scholar] [CrossRef] [Green Version]
- Soultana, A.; Valouma, A.; Bartzas, G.; Komnitsas, K. Properties of inorganic polymers produced from brick waste and metallurgical slag. Minerals 2019, 9, 551. [Google Scholar] [CrossRef] [Green Version]
- Guo, X.; Shi, H.; Wei, X. Pore properties, inner chemical environment, and microstructure of nano-modified CFA-WBP (class C fly ash-waste brick powder) based geopolymers. Cem. Concr. Comp. 2017, 79, 53–61. [Google Scholar] [CrossRef]
- Dadsetan, S.; Siad, H.; Lachemi, M.; Sahmaran, M. Construction and demolition waste in geopolymer concrete technology: A review. Mag. Concr. Res. 2019, 71, 1232–1252. [Google Scholar] [CrossRef]
- Burciaga-Díaz, O.; Durón-Sifuentes, M.; Díaz-Guillén, J.A.; Escalante-García, J.I. Effect of waste glass incorporation on the properties of geopolymers formulated with low purity metakaolin. Cem. Concr. Comp. 2020, 107, 103492. [Google Scholar] [CrossRef]
- Torres-Carrasco, M.; Puertas, F. Waste glass in the geopolymer preparation. Mechanical and microstructural characterization. J. Clean. Prod. 2015, 90, 397–408. [Google Scholar] [CrossRef]
- Samadi, M.; Shah, K.W.; Huseien, G.F.; Lim, N.H.A.S. Influence of glass silica waste nano powder on the mechanical and microstructure properties of alkali-activated mortars. Nanomaterials 2020, 10, 324. [Google Scholar] [CrossRef] [PubMed] [Green Version]
- Vinai, R.; Soutsos, M. Production of sodium silicate powder from waste glass cullet for alkali activation of alternative binders. Cem. Concr. Res. 2019, 116, 45–56. [Google Scholar] [CrossRef] [Green Version]
- Xiao, R.; Ma, Y.; Jiang, X.; Zhang, M.; Zhang, Y.; Wang, Y.; Huang, B.; He, Q. Strength, microstructure, efflorescence behavior and environmental impacts of waste glass geopolymers cured at ambient temperature. J. Clean. Prod. 2020, 252, 119610. [Google Scholar] [CrossRef]
- Brykov, A.S.; Korneev, V.I. Production and usage of powdered alkali metal silicate hydrates. Metallurgist 2009, 52, 648–652. [Google Scholar] [CrossRef]
- El-Shamy, T.M.; Panteno, C.G. Decomposition of silicate glasses in alkaline solutions. Nature 1977, 266, 704–706. [Google Scholar] [CrossRef]
- El-Shamy, T.M.; Lewis, J.; Douglas, R.W. The dependence on the pH of the decomposition of glasses by aqueous solutions. Glass Technol. 1972, 13, 81–87. [Google Scholar]
- Niibori, Y.; Kunita, M.; Tochiyama, O.; Chida, T. Dissolution rates of amorphous silica in highly alkaline solution. J. Nucl. Sci. Technol. 2000, 37, 349–357. [Google Scholar] [CrossRef]
- Paul, A. Chemical durability of glasses; a thermodynamic approach. J. Mater. Sci. 1977, 12, 2246–2268. [Google Scholar] [CrossRef]
- Taguchi, G.; Konishi, S. Taguchi Methods, Orthogonal Arrays and Linear Graphs, Tools for Quality American Supplier Institute, 1st ed.; American Supplier Institute: Dearborn, MI, USA, 1987; pp. 8–35. [Google Scholar]
- Ken, P.W.; Ramli, M.; Ban, C.C. An overview on the influence of various factors on the properties of geopolymer concrete derived from industrial by-products. Constr. Build. Mater. 2015, 77, 370–395. [Google Scholar]
- Zhang, P.; Wang, K.; Li, Q.; Wang, J.; Ling, Y. Fabrication and engineering properties of concretes based on geopolymers/alkali-activated binders—A review. J. Clean. Prod. 2020, 258, 120896. [Google Scholar] [CrossRef]
- Panagiotopoulou, C.; Tsivilis, S.; Kakali, G. Application of the Taguchi approach for the composition optimization of alkali activated fly ash binders. Constr. Build. Mater. 2015, 91, 17–22. [Google Scholar] [CrossRef]
- Kioupis, D.; Tsivilis, S.; Kakali, G. Development of green building materials through alkali activation of industrial wastes and by-products. Mater. Today Proc. 2018, 5, 27329–27336. [Google Scholar] [CrossRef]
- Kioupis, D.; Kavakakis, C.; Tsivilis, S.; Kakali, G. Synthesis and Characterization of Porous Fly Ash-Based Geopolymers Using Si as Foaming Agent. Adv. Mater. Sci. Eng. 2018, 2018, 1–11. [Google Scholar] [CrossRef] [Green Version]
- Keawthun, M.; Krachodnok, S.; Chaisena, A. Conversion of waste glasses into sodium silicate solutions. Int. J. Chem. Sci. 2014, 12, 83–91. [Google Scholar]
- Foletto, E.L.; Gratieri, E.; Hadlich de Oliveira, L.; Jahn, S.L. Conversion of Rice Hull Ash into Soluble Sodium Silicate. Mater. Res. 2006, 9, 335–338. [Google Scholar] [CrossRef] [Green Version]
- Asprogerakas, A.; Koutelia, A.; Kakali, G.; Tsivilis, S. Durability of fly ash geopolymer mortars in corrosive environments, compared to that of cement mortars. Adv. Sci. Tech. 2014, 92, 84–89. [Google Scholar]
- Duxson, P.; Mallicoat, S.W.; Lukey, G.C.; Kriven, W.M.; van Deventer, J.S.J. The effect of alkali and Si/Al ratio on the development of mechanical properties of metakaolin-based geopolymers. Coll. Surf. A Physicochem. Eng. Asp. 2007, 292, 8–20. [Google Scholar] [CrossRef]
- Xu, H.; Van Deventer, J.S.J. The geopolymerisation of aluminosilicate materials. Int. J. Miner. Process. 2000, 59, 247–258. [Google Scholar] [CrossRef] [Green Version]
- Criado, M.; Palomo, A.; Fernandez-Jimenez, A. Alkali activation of fly ashes. Part I: Effect of curing conditions on the carbonation of the reaction products. Fuel 2005, 84, 2048–2054. [Google Scholar] [CrossRef]
- Bakharev, T. Geopolymeric materials prepared using Class F fly ash and elevated temperature curing. Cem. Concr. Res. 2005, 35, 1224–1232. [Google Scholar] [CrossRef]
- Silva, P.D.; Crenstil, K.S. Medium-term phase stability of Na2O-Al2O3-SiO2-H2O geopolymer systems. Cem. Concr. Res. 2007, 38, 870–876. [Google Scholar] [CrossRef]
- Rees, C.A.; Provis, J.L.; Lukey, G.C.; van Deventer, J.S.J. Attenuated Total Reflectance Fourier Transform Infrared Analysis of Fly Ash Geopolymer Gel Aging. Langmuir 2007, 23, 8170–8179. [Google Scholar] [CrossRef]
- Nenadović, S.S.; Kljajević, L.M.; Nešić, M.A.; Petković, M.Z.; Trivunac, K.V.; Pavlović, V.B. Structure analysis of geopolymers synthesized from clay originated from Serbia. Environ. Earth Sci. 2017, 76, 1–10. [Google Scholar] [CrossRef]
- Sheikh, M.R.; Gohain Barua, A. X-ray diffraction and fourier transform infrared spectra of the bricks of the Kamakhya temple. Indian J. Pure Appl. Phys. 2013, 51, 745–748. [Google Scholar]
- Backarev, T. Resistance of geopolymer materials to acid attack. Cem. Concr. Res. 2005, 35, 658–670. [Google Scholar] [CrossRef]
- Goyal, S.K.; Cutler, I.B. Absorption of water in waste glass as a precursor for foam formation. J. Non Cryst. Solids 1975, 19, 311–320. [Google Scholar] [CrossRef]
- Kalapathy, U.; Proctor, A.; Shultz, J. A simple method for production of pure silica from rice hull ash. Bioresour. Technol. 2000, 73, 257–262. [Google Scholar] [CrossRef]
Figure 1.
Particle size distribution of brick (a) and glass (b).

Figure 2.
XRD pattern of waste precursors.

Figure 3.
Effect of the studied factors on the development of compressive strength.

Figure 4.
XRD pattern of depositions on the specimens’ surface.

Figure 5.
Photos of geopolymers: (a) optimum synthesis, (b) WBG_8, (c) WBG_14 and (d) WBG_4.

Figure 6.
XRD patterns of brick precursor and selected geopolymer samples.

Figure 7.
FTIR spectra of brick precursor and selected brick geopolymers.

Figure 8.
SEM micrographs of the optimum geopolymer synthesis (a,b) along with EDS analysis (c).


Figure 9.
XRD analysis of glass waste and selected solid residues.

Figure 10.
Mechanical performance of the produced geopolymers with different activation solutions.


Table 1.
Fineness characteristics of CDW brick and glass.
| Fraction | Brick | Glass |
|---|---|---|
| d90 (μm) | 71.4 | 169.1 |
| d50 (μm) | 13.7 | 50.0 |
Table 2.
Chemical composition of the CDW precursors (% w/w).
| Waste | SiO2 | Al2O3 | Fe2O3 | CaO | MgO | K2O | Na2O | SO3 | TiO2 | P2O5 | Cl | L.O.I. * |
|---|---|---|---|---|---|---|---|---|---|---|---|---|
| Brick | 61.02 | 18.85 | 7.87 | 1.73 | 3.03 | 3.40 | 1.27 | 0.26 | 0.89 | 0.17 | 0.02 | 1.49 |
| Glass | 71.35 | - | - | 10.10 | 3.80 | - | 14.28 | - | - | - | - | 0.47 |
* L.O.I.: Loss on ignition.
Table 3.
Selected factors and their variation range.
| Factors | Level 1 | Level 2 | Level 3 | Level 4 |
|---|---|---|---|---|
| Si/Al | 2.75 | 3.00 | 3.25 | 3.50 |
| R/Al | 0.50 | 0.75 | 1.00 | 1.25 |
| Na/Na + K | 0.00 | 0.35 | 0.70 | 1.00 |
Table 4.
Experiments on waste glass dissolution.
| Exp. | T(°C) | t(h) | NaOH/SiO2 | H2O/SiO2 | Glass (g) | NaOH (g) | H2O (g) |
|---|---|---|---|---|---|---|---|
| GL1 | 100 | 24 | 4 | 23 | 10.28 | 19.34 | 50.00 |
| GL2 | 150 | 24 | 4 | 23 | 10.28 | 19.34 | 50.00 |
| GL3 | 150 | 24 | 2 | 23 | 10.28 | 9.67 | 50.00 |
| GL4 | 150 | 24 | 1 | 23 | 10.28 | 4.84 | 50.00 |
| GL5 | 150 | 24 | 1 | 9 | 27.27 | 13.07 | 50.00 |
| GL6 | 150 | 96 | 1 | 23 | 10.28 | 4.84 | 50.00 |
Table 5.
Synthesis parameters, compressive strength and density of the final products.
| Sample * | Si/Al | R/Al * | Na/Na + K ‡ | Solid/Liquid † | SiO2/R2O ‡ | H2O/R2O ‡ | Compressive Strength (MPa) | Density (g/cm3) |
|---|---|---|---|---|---|---|---|---|
| WBG_1 | 2.75 | 0.50 | 0.00 | 3.8 | 0.0 | 35 | 24.1 ± 0.6 | 1.72 |
| WBG_2 | 2.75 | 0.75 | 0.35 | 3.9 | 0.0 | 24 | 28.6 ± 0.8 | 1.91 |
| WBG_3 | 2.75 | 1.00 | 0.70 | 3.9 | 0.0 | 19 | 26.3 ± 0.5 | 2.01 |
| WBG_4 | 2.75 | 1.25 | 1.00 | 3.9 | 0.0 | 16 | 20.3 ± 0.2 | 1.92 |
| WBG_5 | 3.00 | 0.50 | 0.35 | 4.2 | 1.0 | 30 | 37.4 ± 1.8 | 1.84 |
| WBG_6 | 3.00 | 0.75 | 0.00 | 5.2 | 0.7 | 16 | 43.7 ± 0.9 | 2.03 |
| WBG_7 | 3.00 | 1.00 | 1.00 | 4.6 | 0.5 | 14 | 21.7 ± 0.4 | 1.83 |
| WBG_8 | 3.00 | 1.25 | 0.70 | 4.6 | 0.4 | 12 | 24.2 ± 0.3 | 1.94 |
| WBG_9 | 3.25 | 0.50 | 0.70 | 4.6 | 2.0 | 25 | 33.3 ± 0.4 | 2.03 |
| WBG_10 | 3.25 | 0.75 | 1.00 | 4.6 | 1.3 | 18 | 36.1 ± 1.7 | 2.03 |
| WBG_11 | 3.25 | 1.00 | 0.00 | 4.8 | 1.0 | 13 | 27.1 ± 0.6 | 2.05 |
| WBG_12 | 3.25 | 1.25 | 0.35 | 4.6 | 0.8 | 12 | 24.0 ± 0.9 | 2.01 |
| WBG_13 | 3.50 | 0.50 | 1.00 | 4.6 | 3.0 | 23 | 24.9 ± 0.6 | 1.88 |
| WBG_14 | 3.50 | 0.75 | 0.70 | 4.6 | 2.0 | 16 | 33.0 ± 0.8 | 1.99 |
| WBG_15 | 3.50 | 1.00 | 0.35 | 5.2 | 1.5 | 10 | 29.2 ± 1.0 | 2.00 |
| WBG_16 | 3.50 | 1.25 | 0.00 | 5.2 | 1.2 | 8 | 23.0 ± 0.5 | 2.00 |
* WBG_x: Waste Brick Geopolymer_number of experiment. † refers to the starting mixtures (brick waste precursor and activation solution). ‡ refers to activation solution.
Table 6.
Composition of the liquid product coming from glass dissolution.
| Sample | Si (mg/250 mL) | Na (mg/250 mL) | SiO2/Na2O | Yield (%) |
|---|---|---|---|---|
| GL1 | 1467.5 | 10,925.0 | 0.22 | 43% |
| GL2 | 1979.6 | 8629.8 | 0.38 | 58% |
| GL3 | 2480.0 | 5922.5 | 0.69 | 72% |
| GL4 | 1123.6 | 3303.7 | 0.56 | 33% |
| GL5 | 894.4 | 6208.7 | 0.24 | 10% |
| GL6 | 1348.3 | 3513.8 | 0.63 | 39% |
© 2020 by the authors. Licensee MDPI, Basel, Switzerland. This article is an open access article distributed under the terms and conditions of the Creative Commons Attribution (CC BY) license (http://creativecommons.org/licenses/by/4.0/).
Share and Cite
MDPI and ACS Style
Kioupis, D.; Skaropoulou, A.; Tsivilis, S.; Kakali, G. Valorization of Brick and Glass CDWs for the Development of Geopolymers Containing More Than 80% of Wastes. Minerals 2020, 10, 672. https://doi.org/10.3390/min10080672
AMA Style
Kioupis D, Skaropoulou A, Tsivilis S, Kakali G. Valorization of Brick and Glass CDWs for the Development of Geopolymers Containing More Than 80% of Wastes. Minerals. 2020; 10(8):672. https://doi.org/10.3390/min10080672
Chicago/Turabian StyleKioupis, Dimitris, Aggeliki Skaropoulou, Sotirios Tsivilis, and Glikeria Kakali. 2020. "Valorization of Brick and Glass CDWs for the Development of Geopolymers Containing More Than 80% of Wastes" Minerals 10, no. 8: 672. https://doi.org/10.3390/min10080672
Note that from the first issue of 2016, this journal uses article numbers instead of page numbers. See further details here.