Fracture Toughness Analysis of Automotive-Grade Dual-Phase Steel Using Essential Work of Fracture (EWF) Method

 ,
,  , , and
Abstract
:1. Introduction
2. Material and Experimental Details
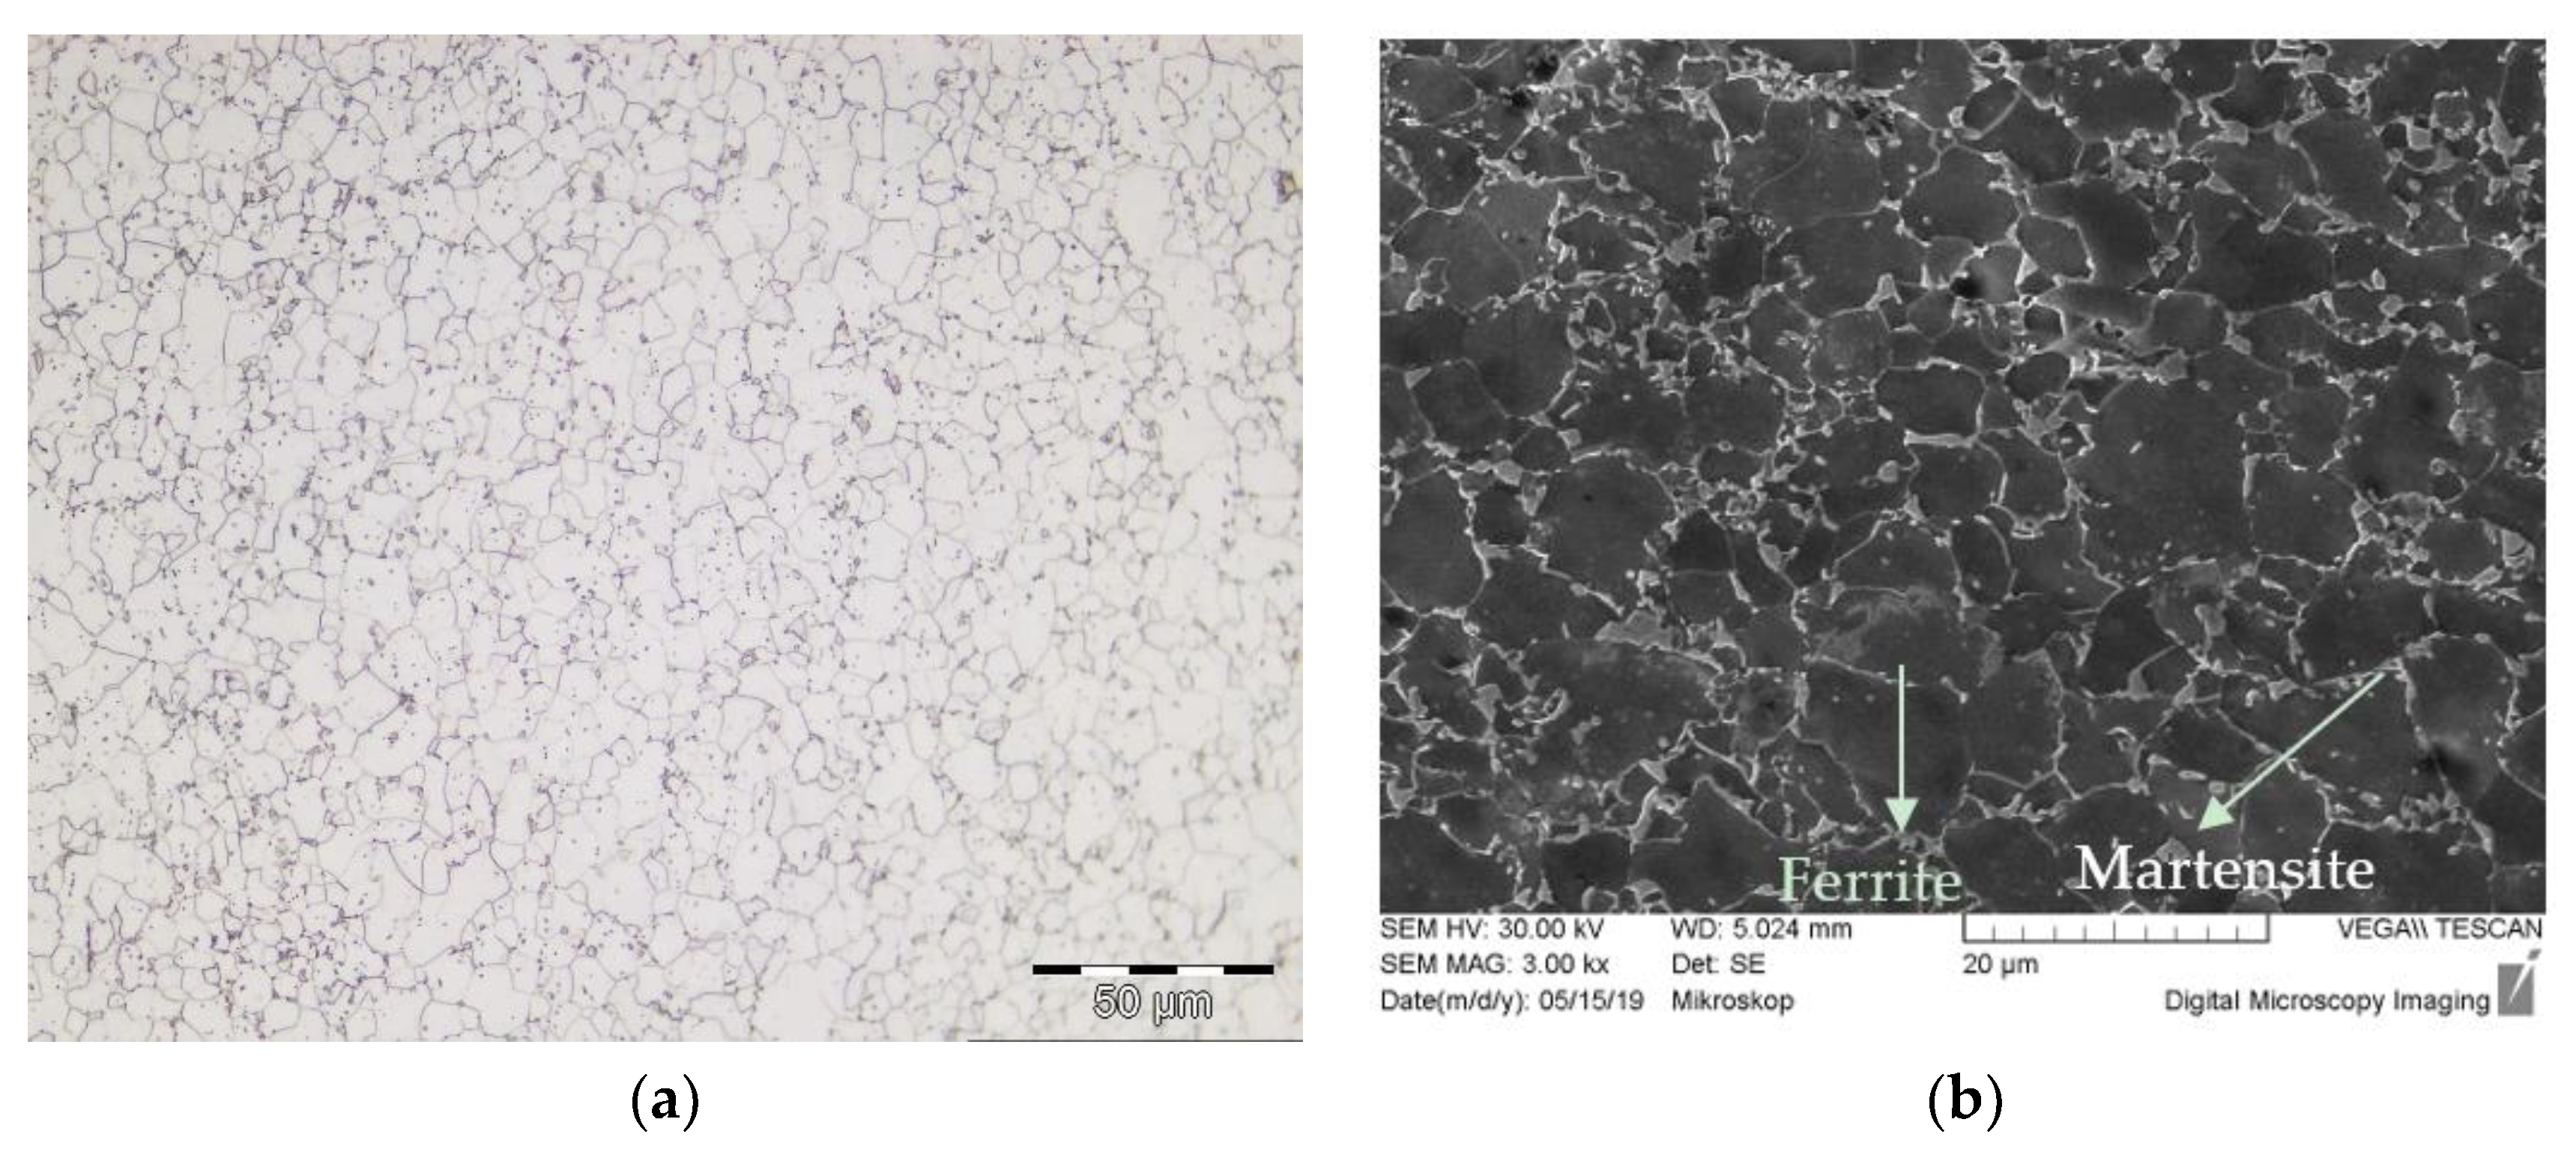
2.1. Material
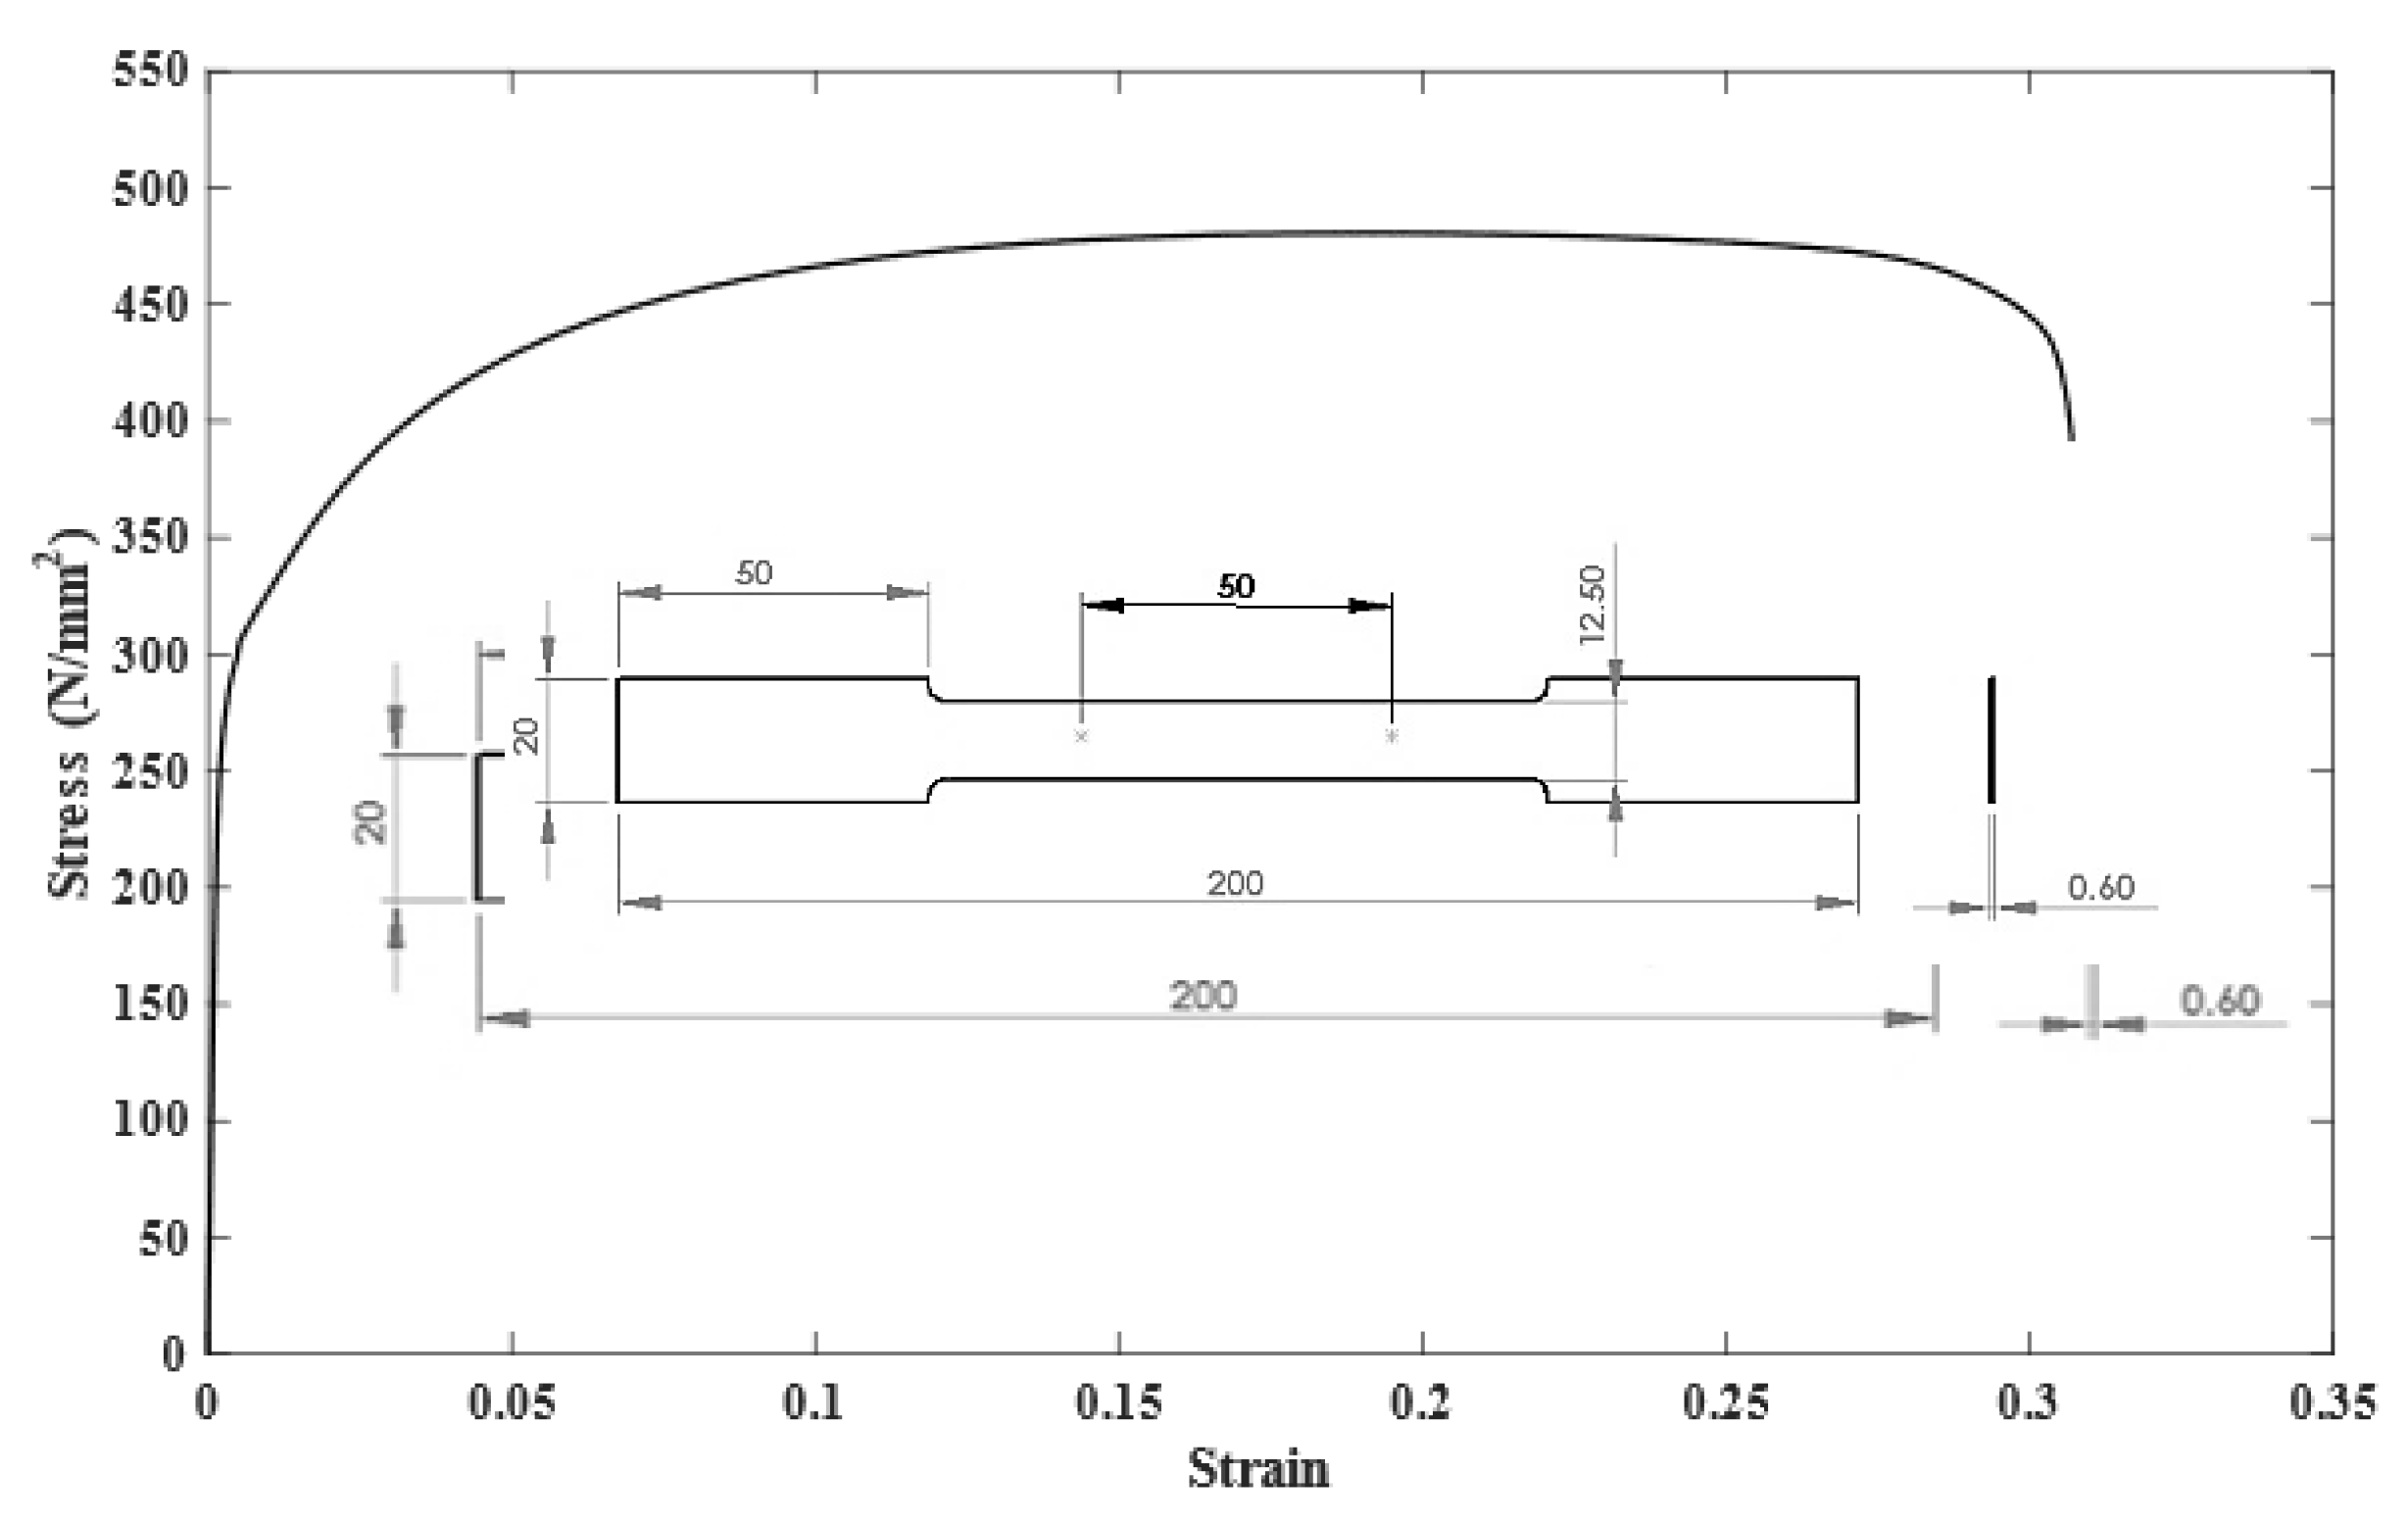
2.2. Specimen
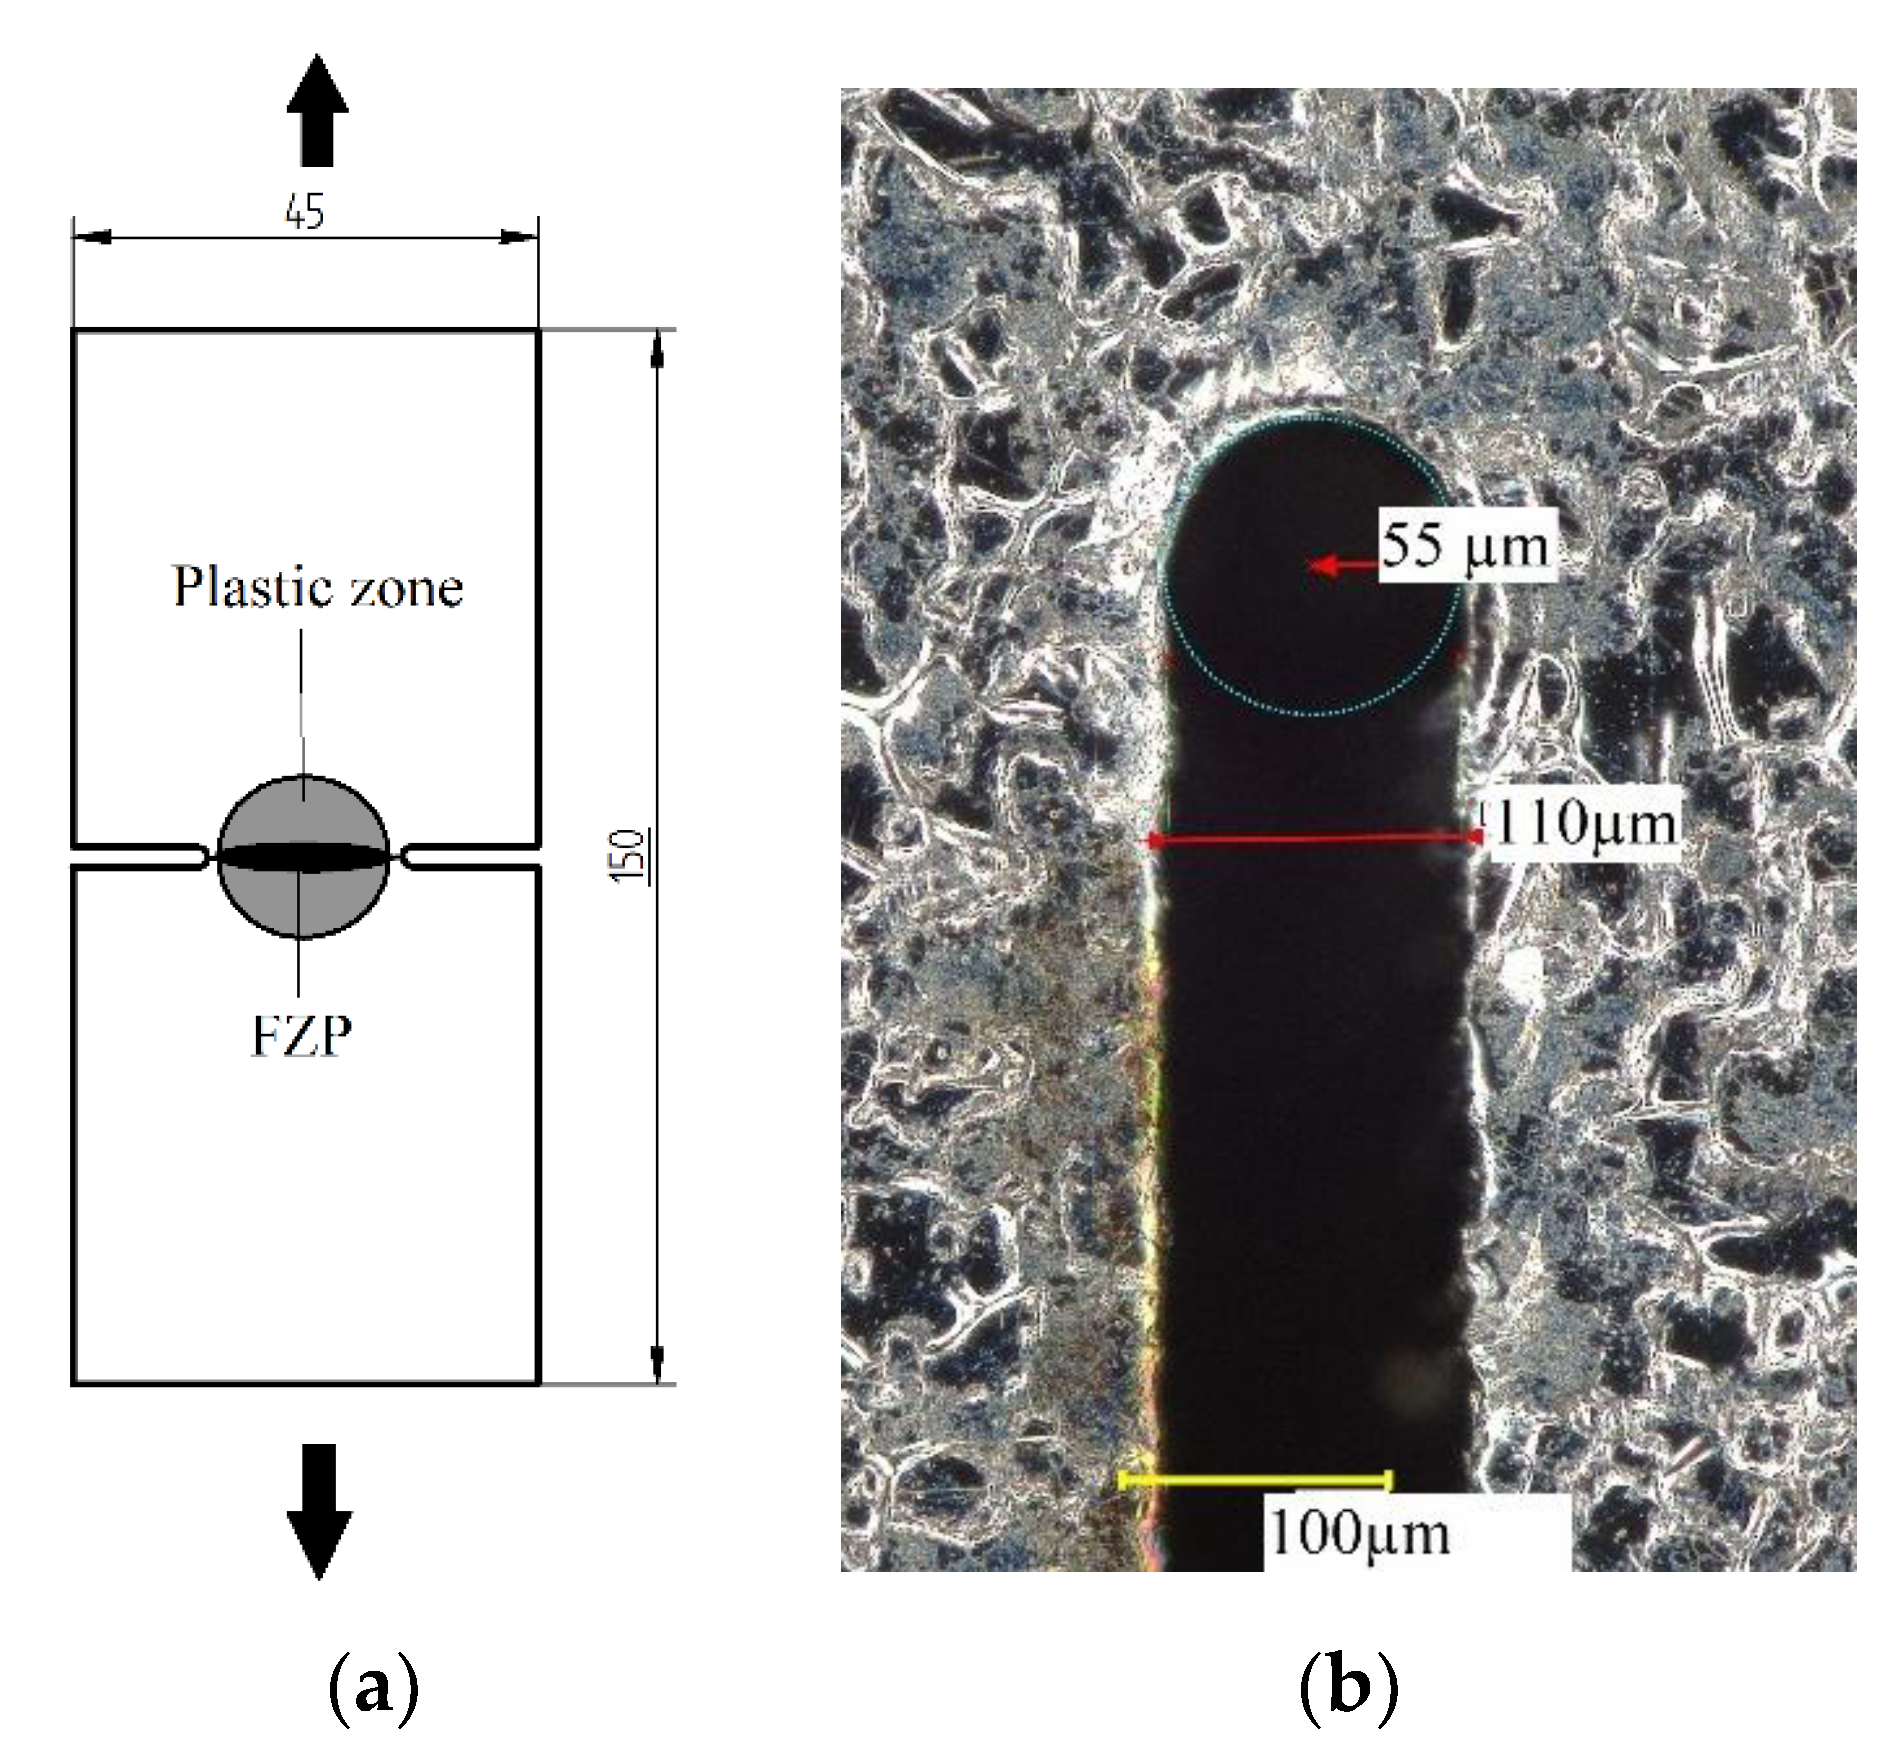
2.3. EWF Testing
3. Results and Discussions
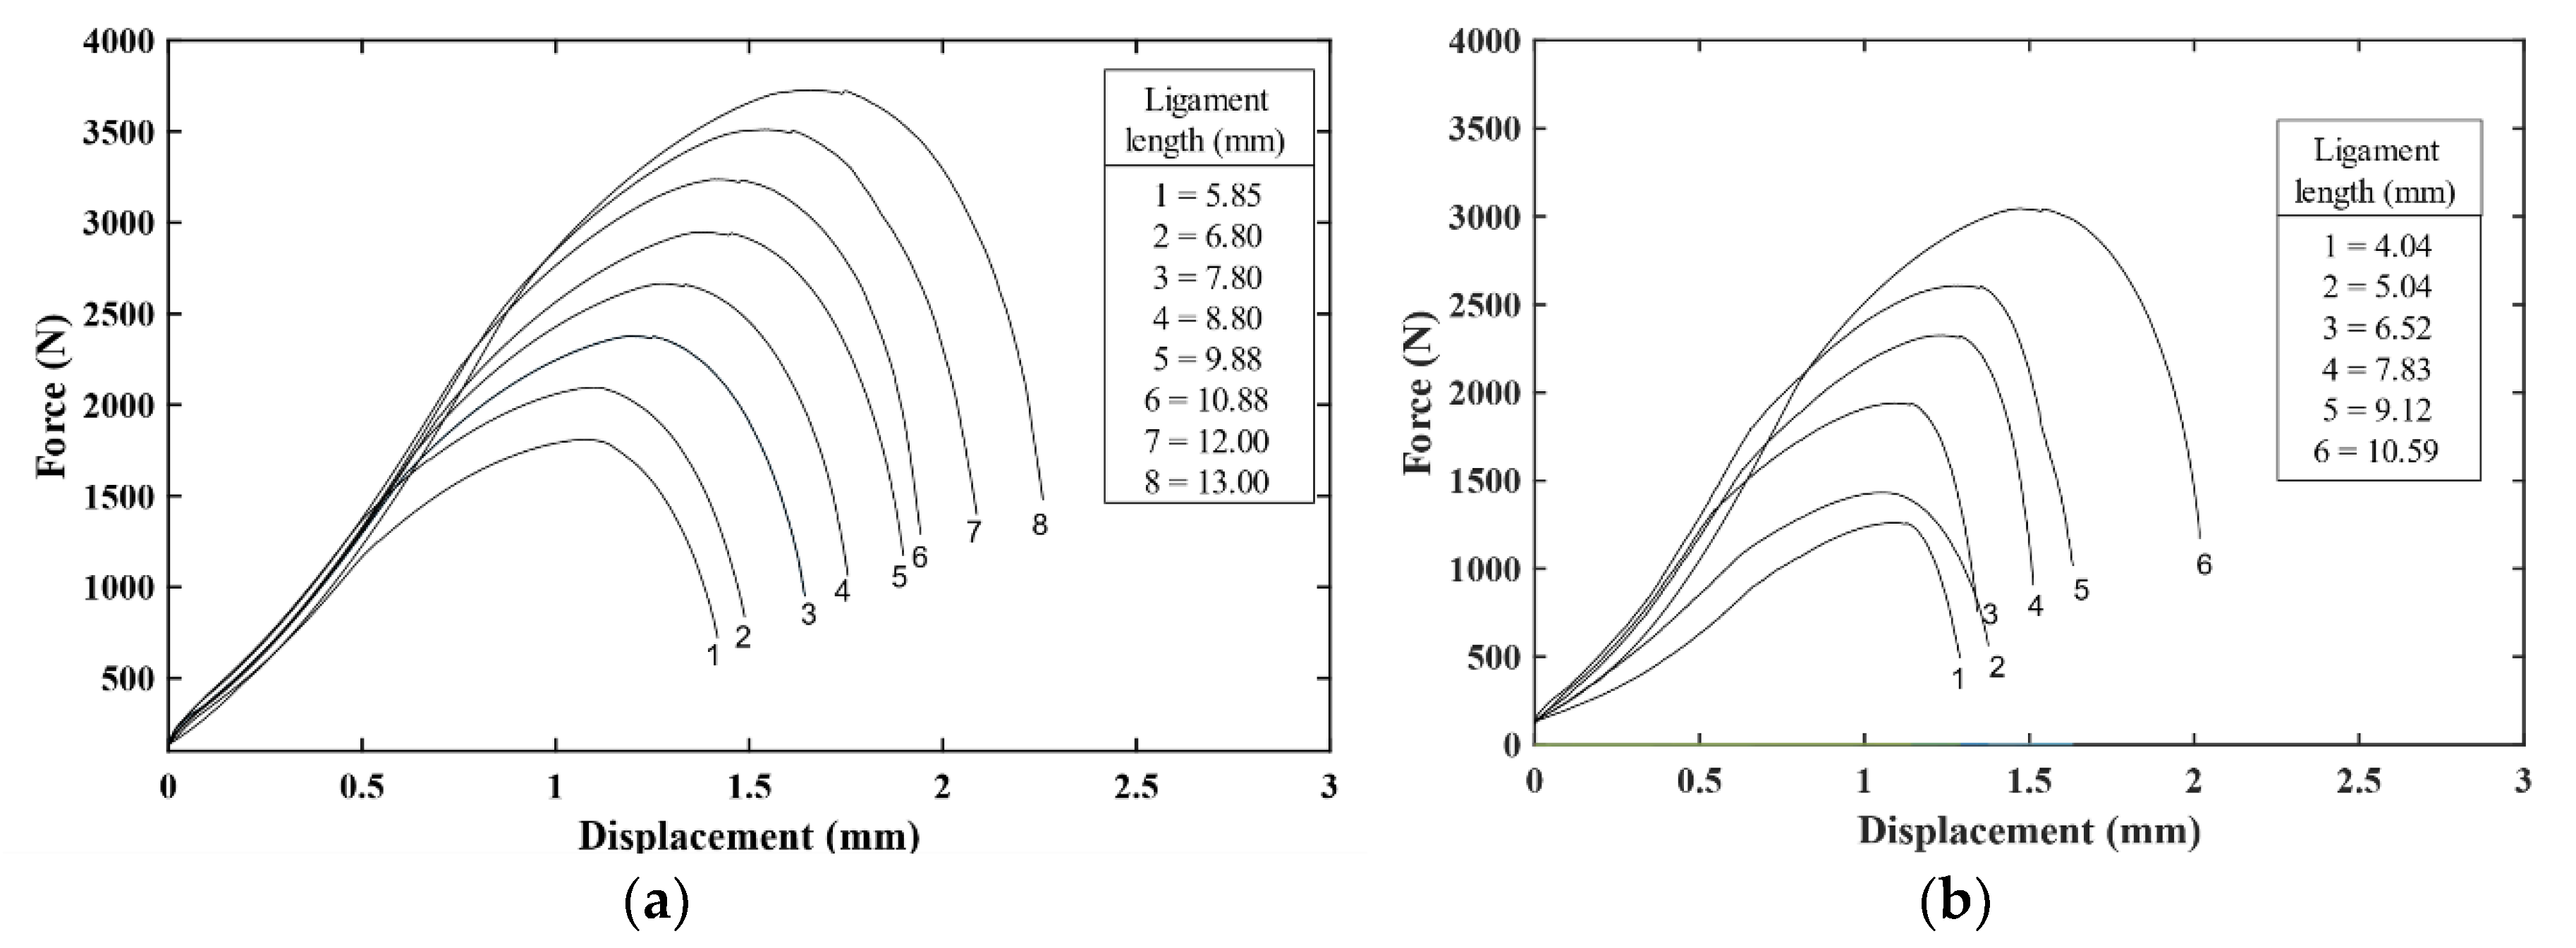
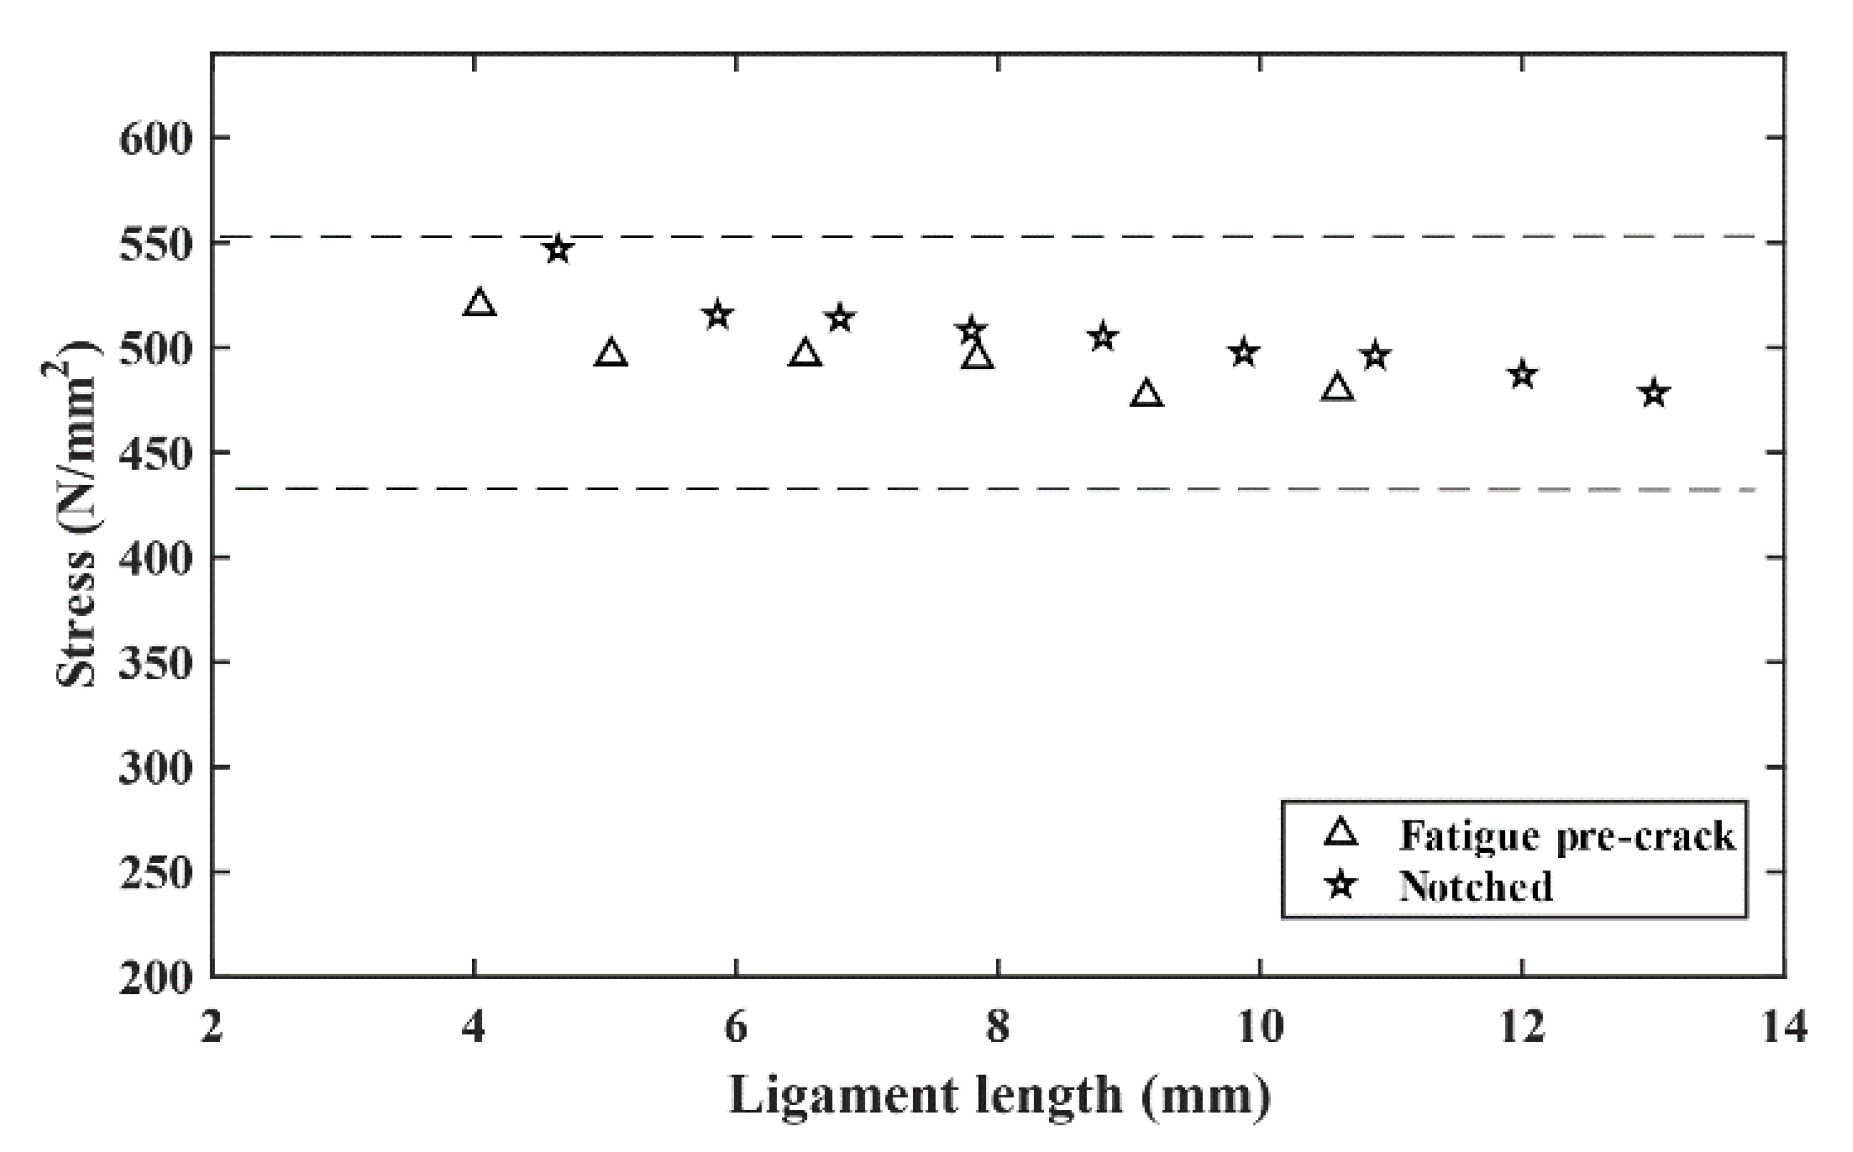
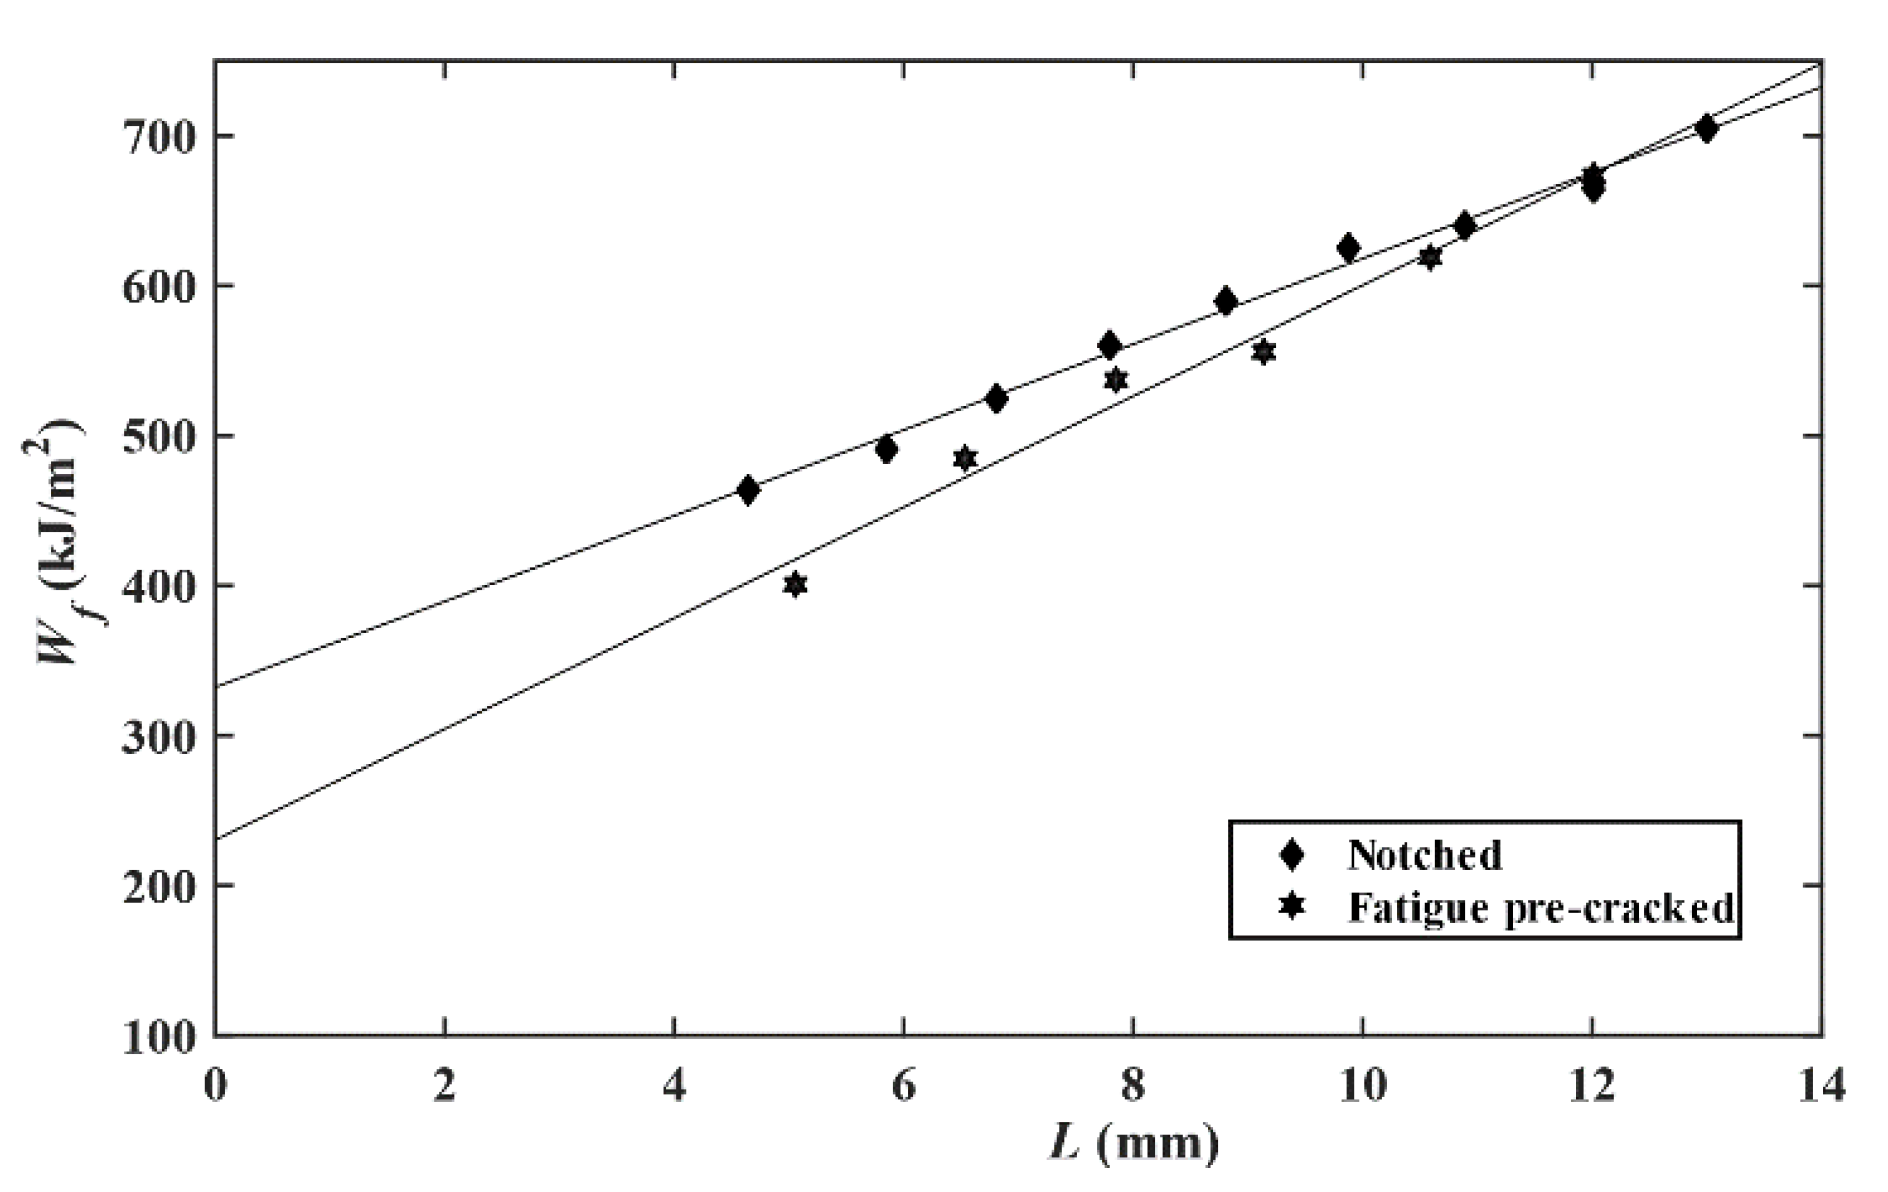
3.1. Essential Work of Fracture
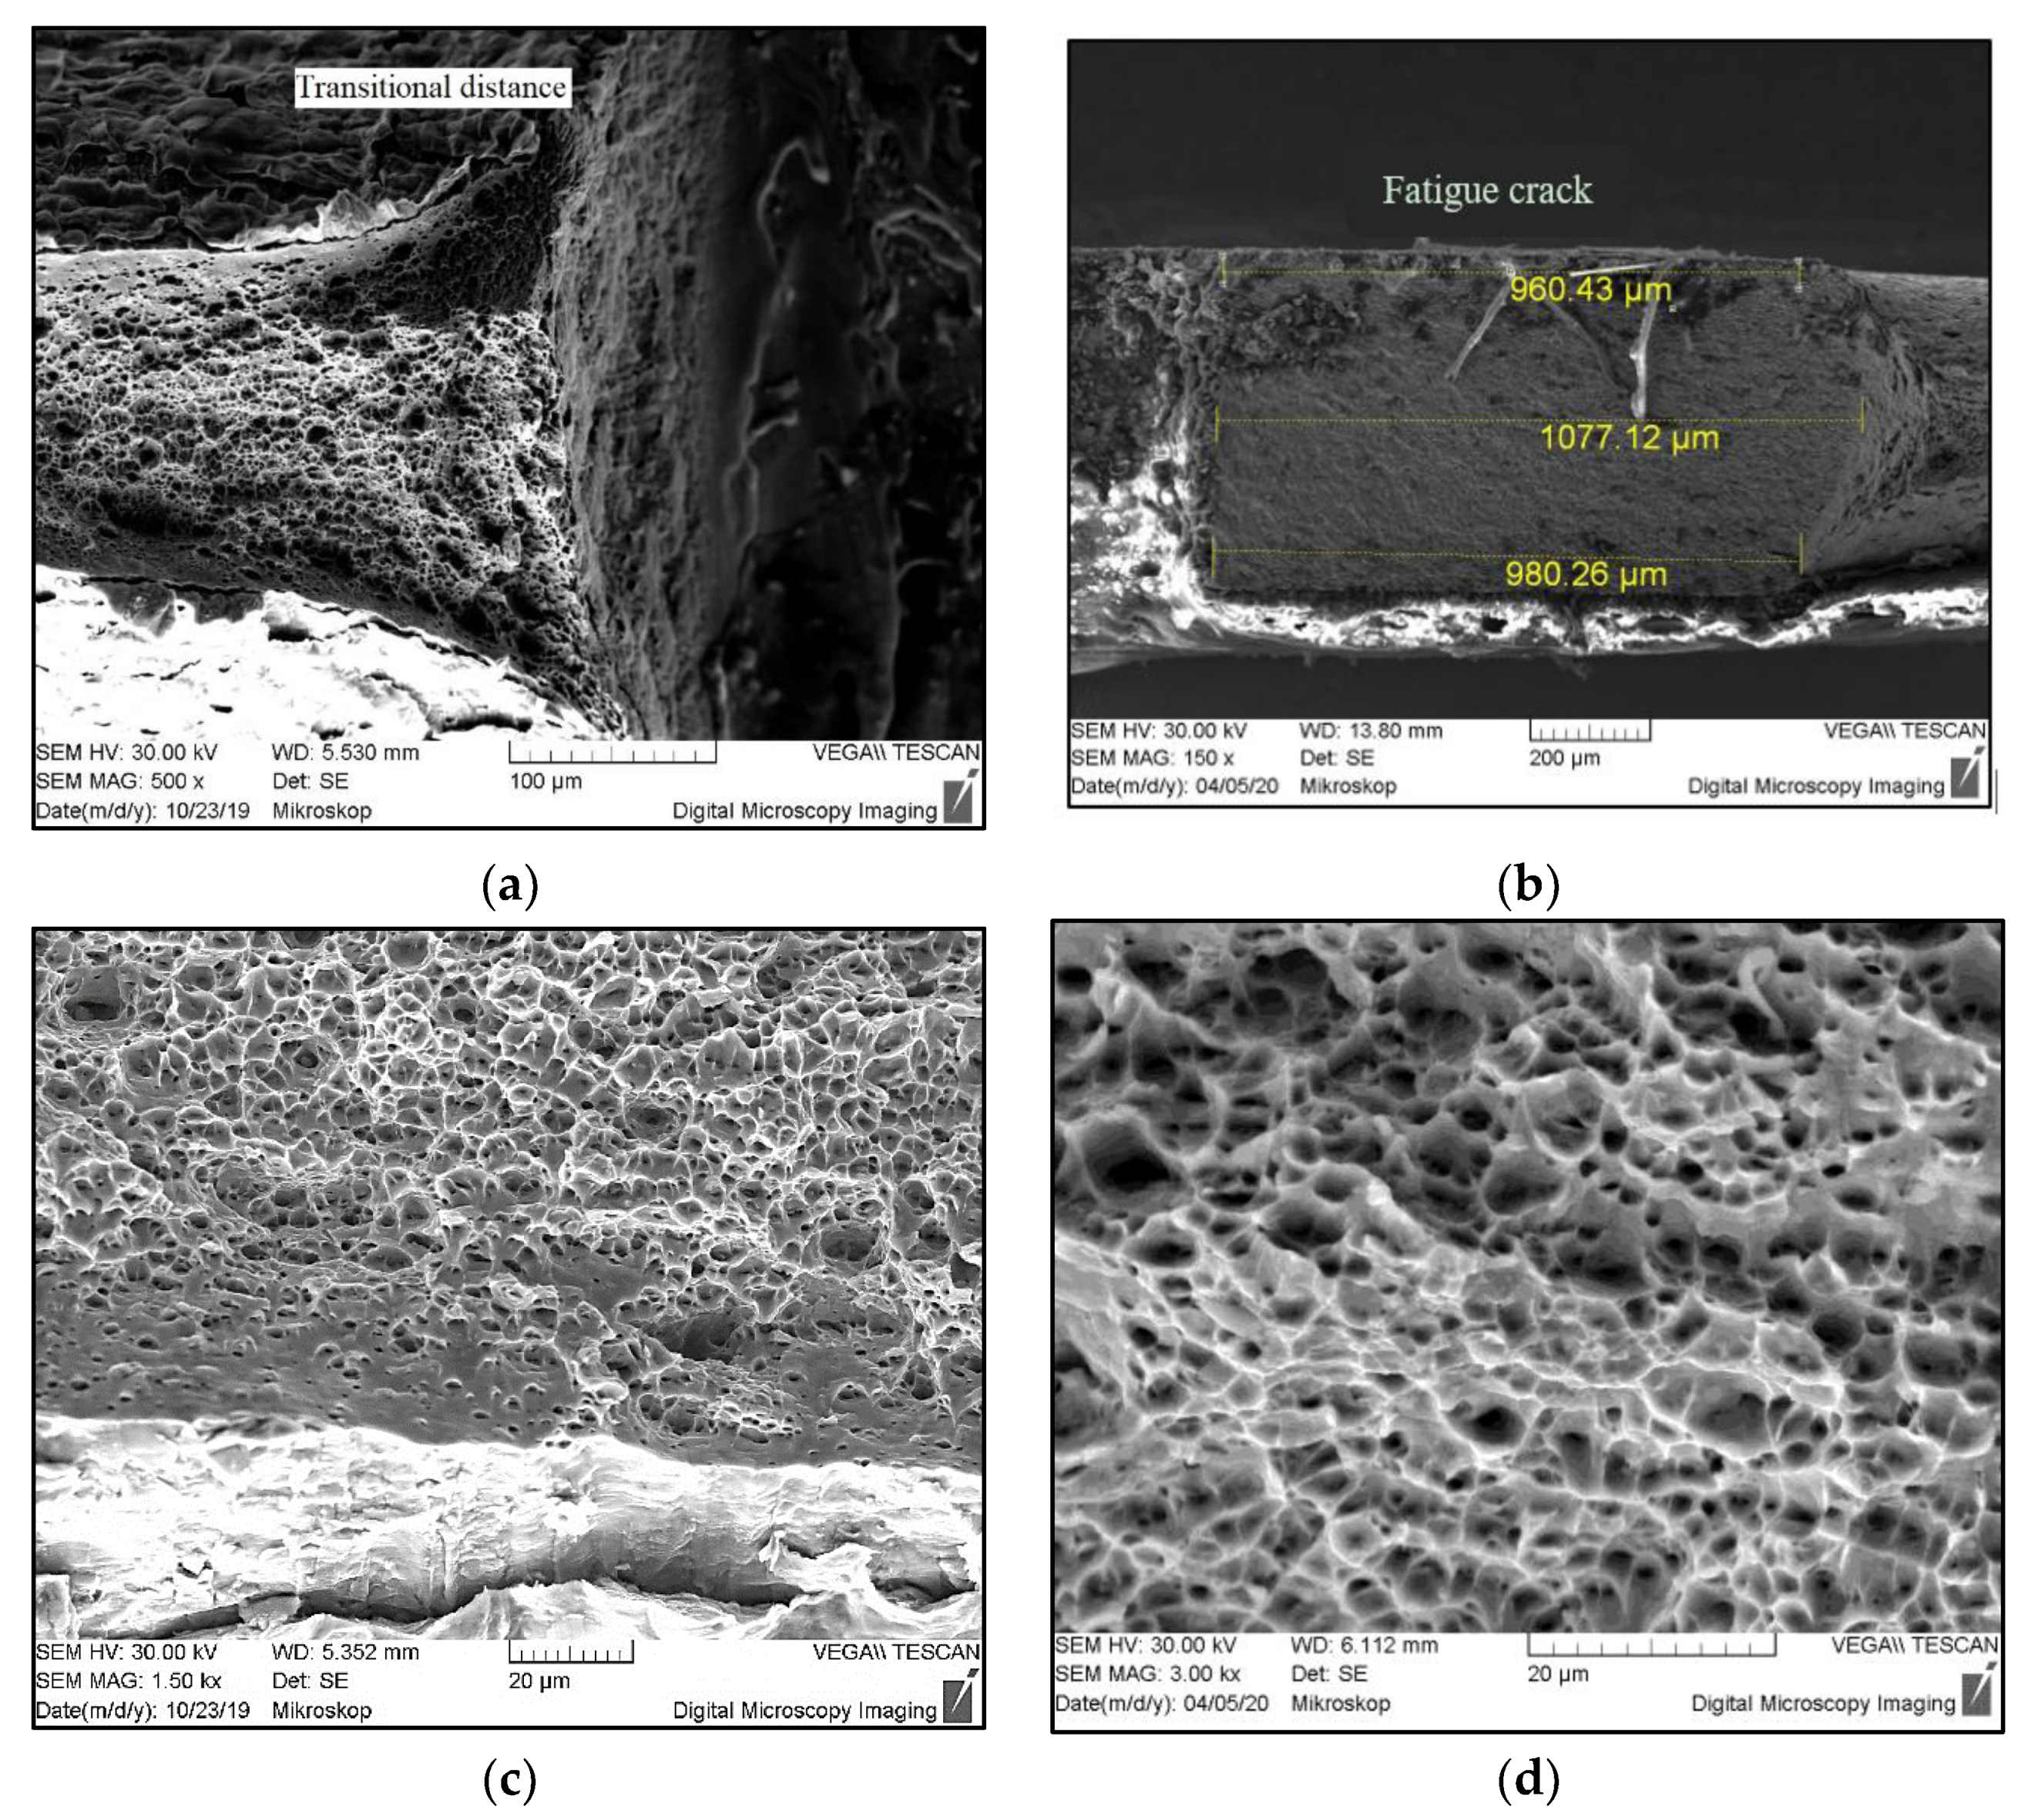
3.2. Fractured Surfaces
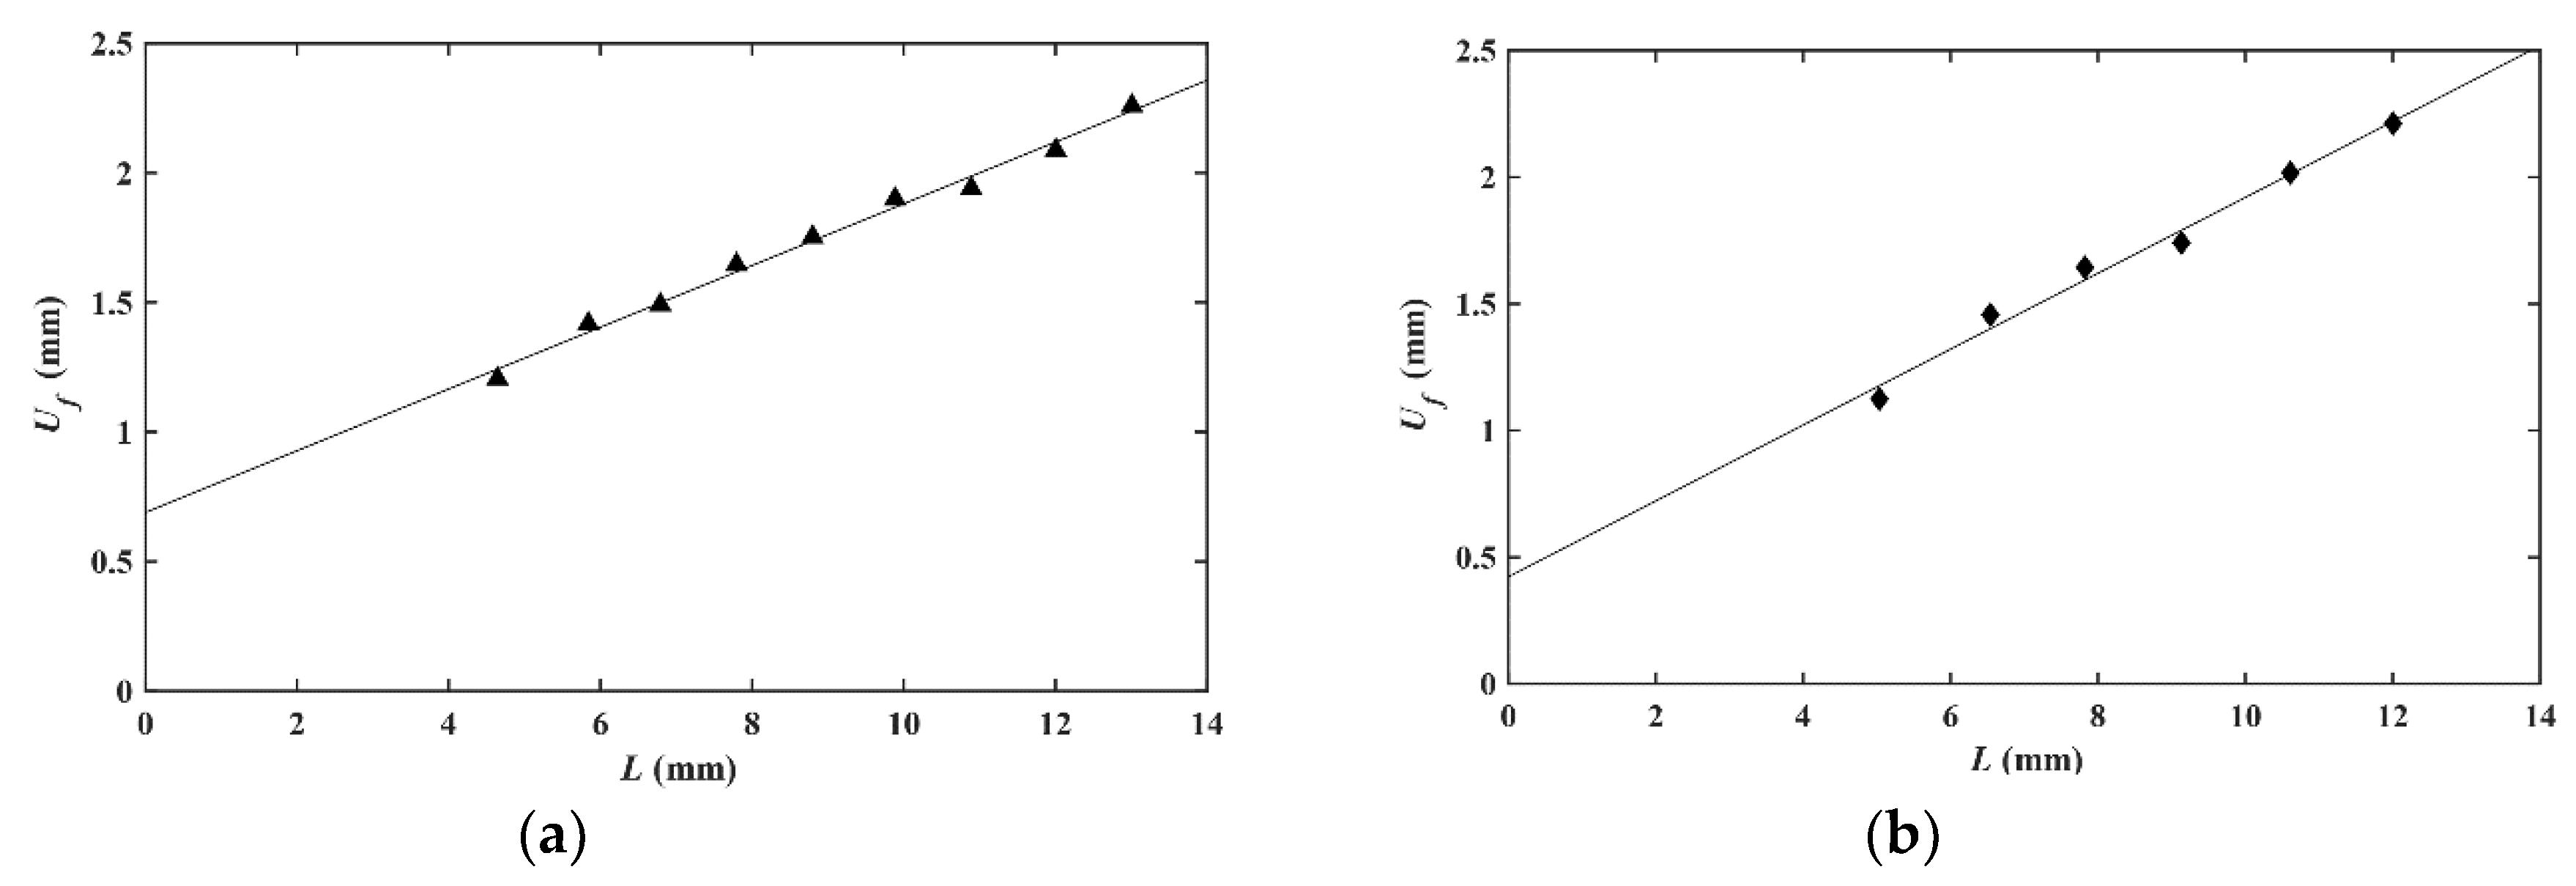
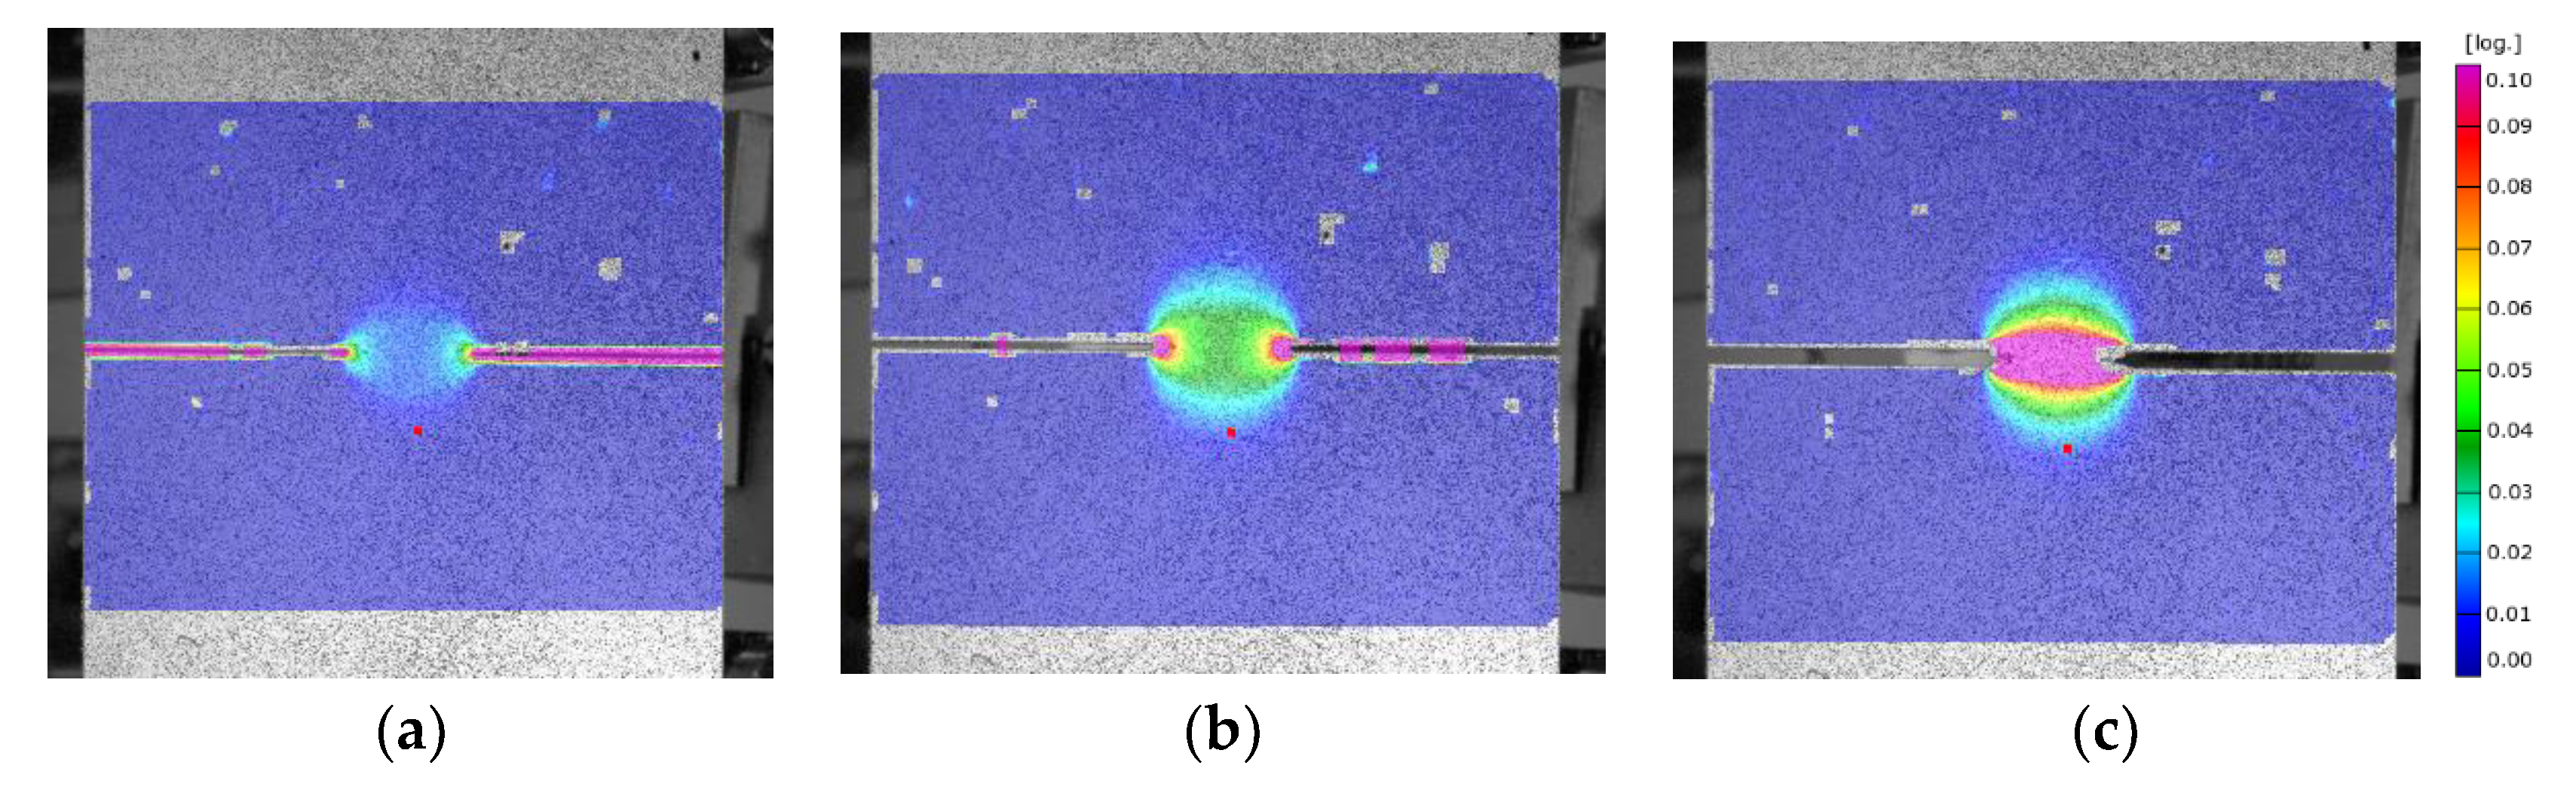
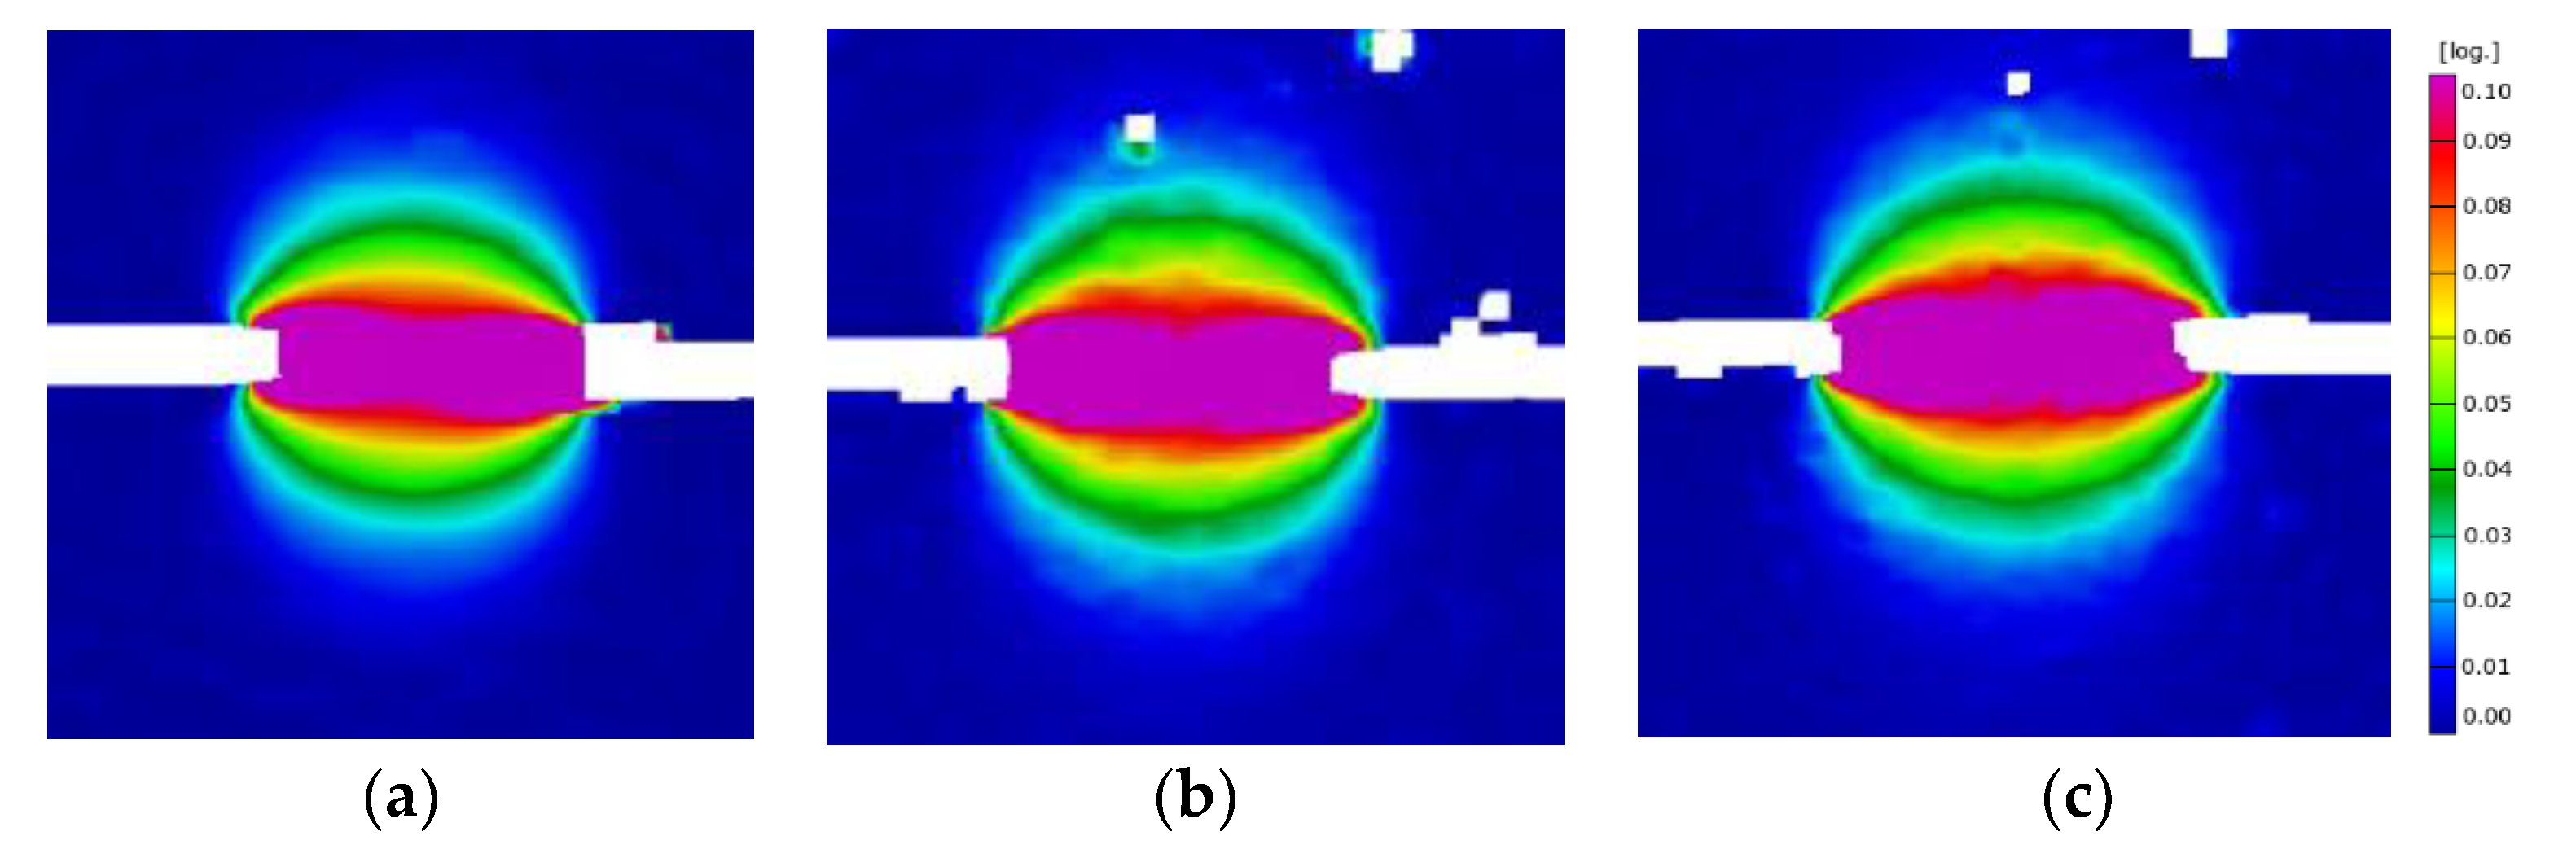
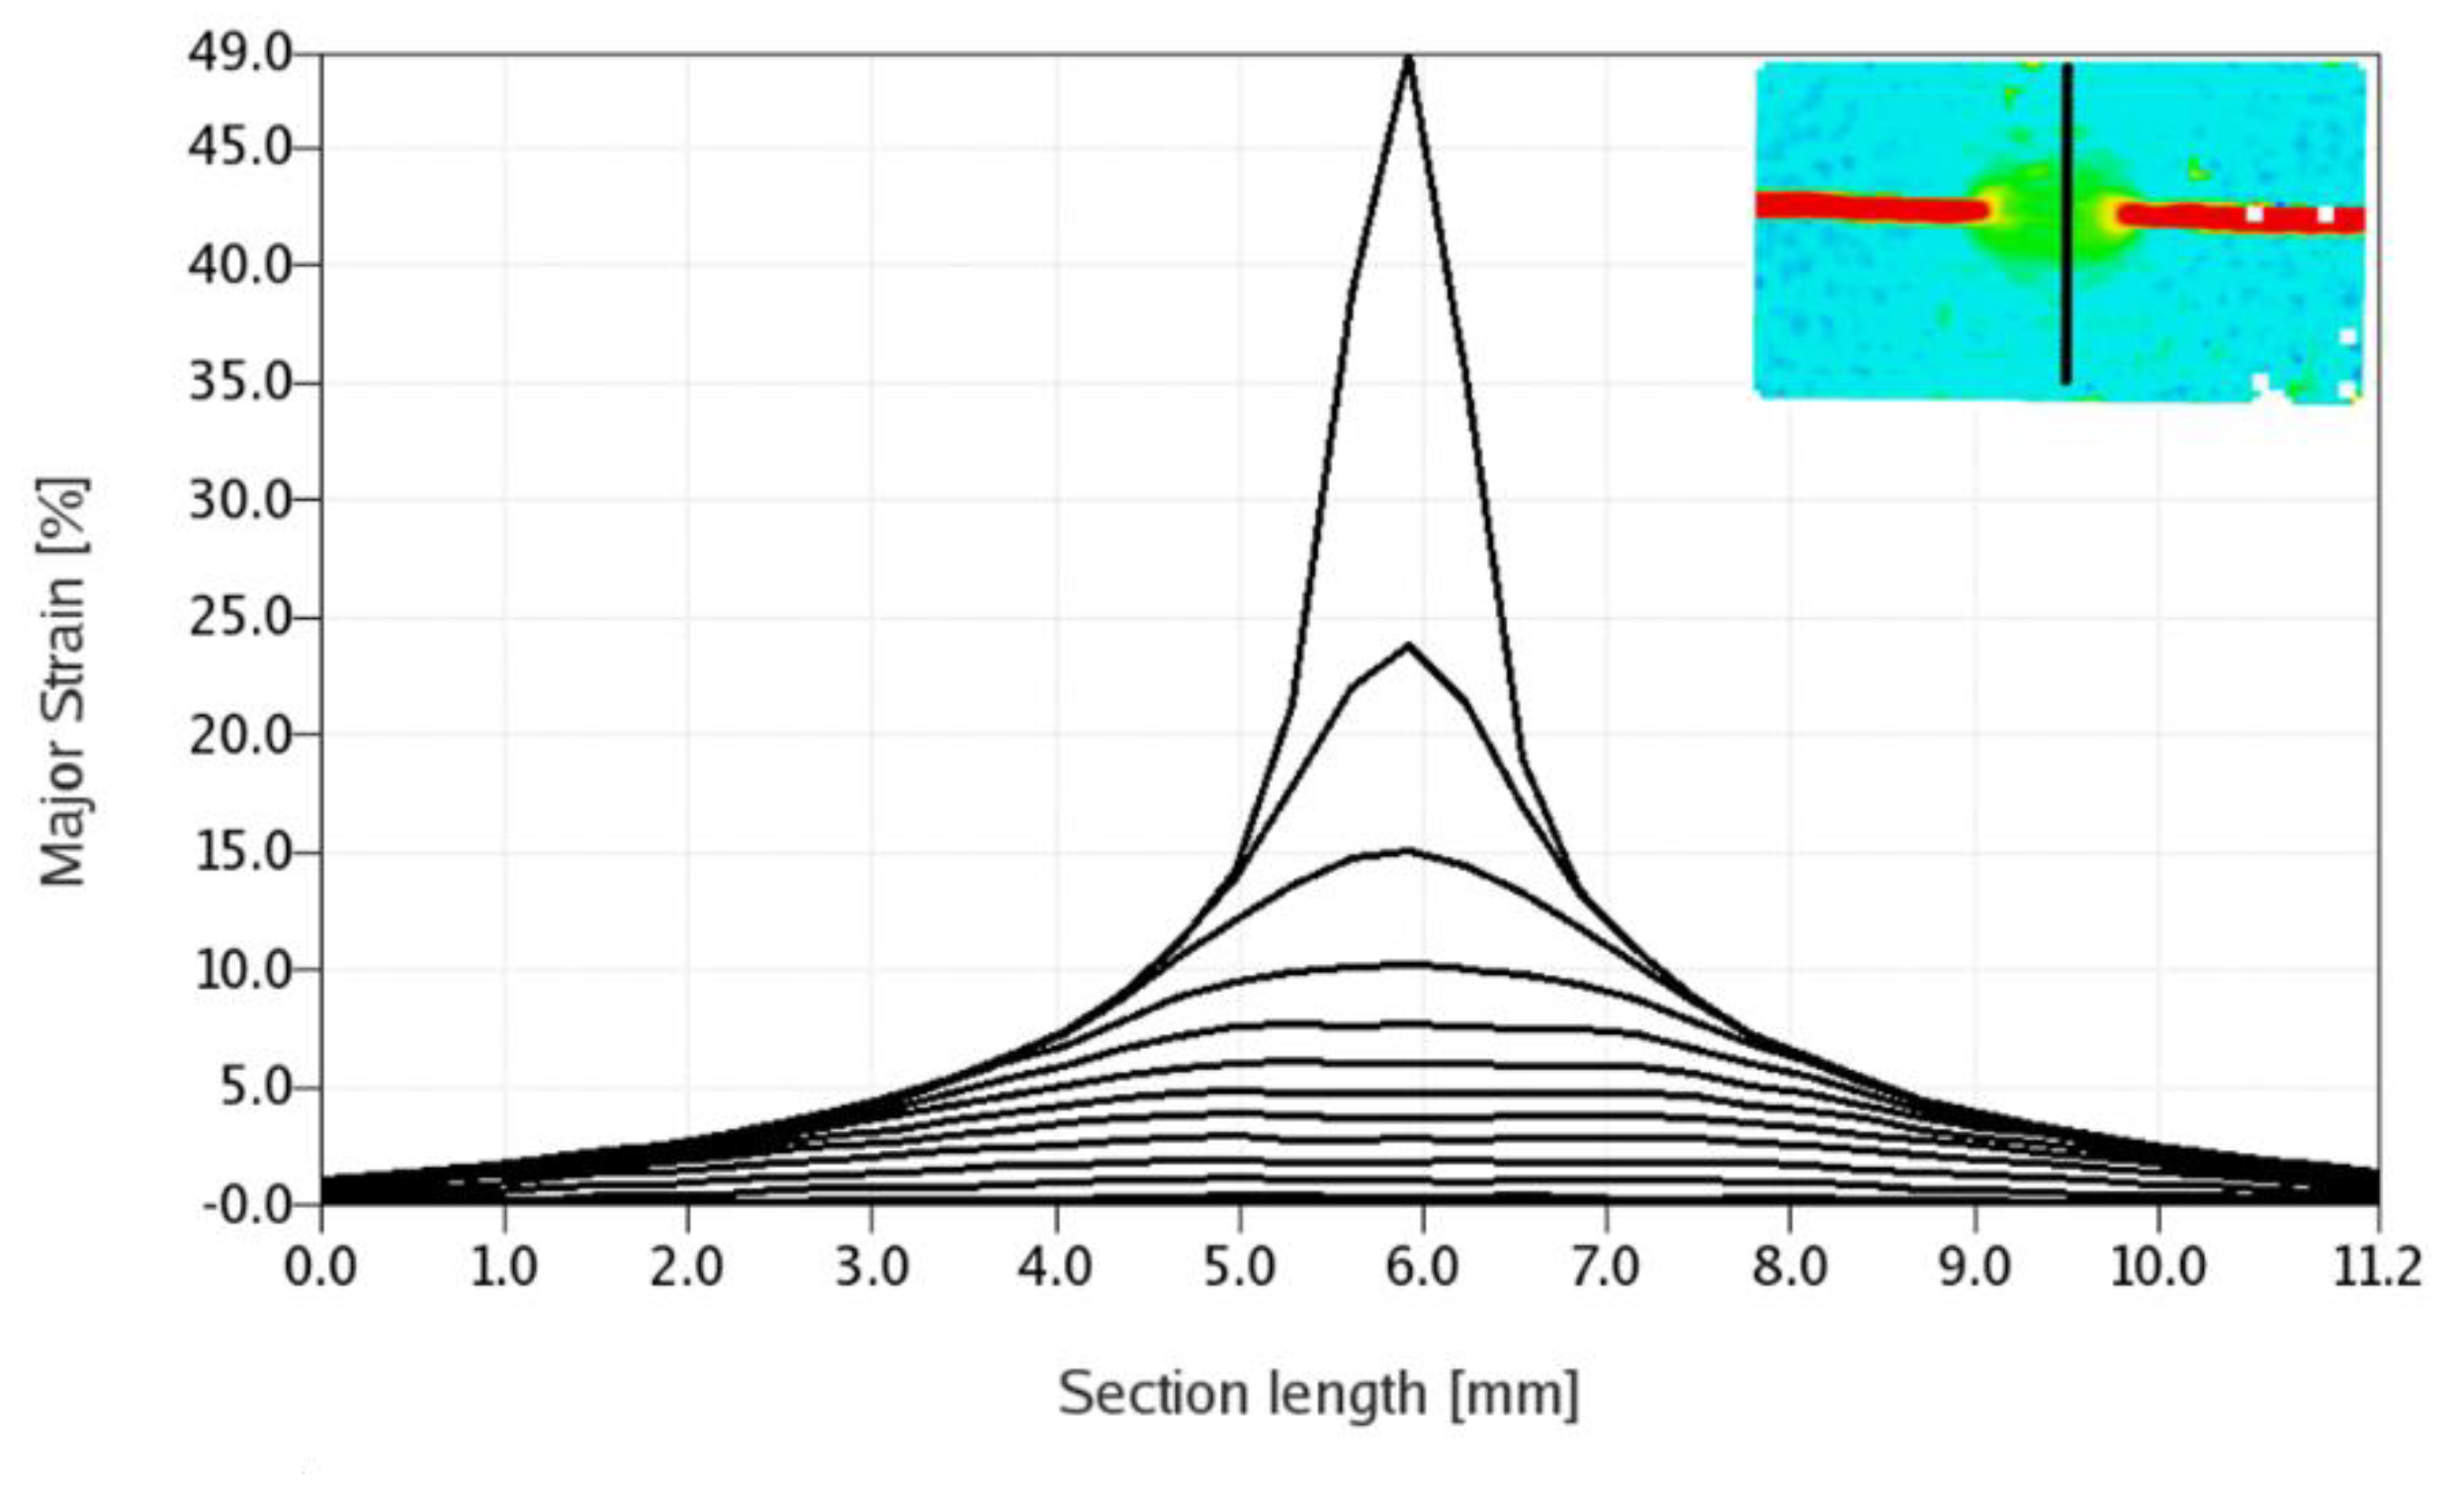
3.3. Digital Image Correlation Results
4. Conclusions
Author Contributions
Funding
Acknowledgments
Conflicts of Interest
Nomenclature
| Ag | elongation at ultimate stress |
| A50 | elongation at the fracture |
| critical J-integral | |
| essential work of fracture | |
| total work of fracture | |
| non-essential work of fracture | |
| elongation at fracture | |
| specific essential work of fracture | |
| specific non-essential work of fracture | |
| specific work of fracture | |
| L | length of the ligament |
| n | strain hardening exponent |
| W | specimen width (DENT) |
| crack tip opening displacement from EWF test | |
| critical notch tip radius | |
| ultimate tensile strength | |
| yield strength | |
| crack tip opening angle from EWF test | |
| t | thickness of the specimen |
| β | shape factor of plastic deformation |
Abbreviations
| AHSS | Advanced high strength steels |
| CTOA | Crack tip opening angle |
| CTOD | Crack tip opening displacement |
| DENT | Double edge notch tension |
| DIC | Digital image correlation |
| EDM | Electrical discharge machining |
| EWF | Essential work of fracture |
| FLD | Forming limit diagram |
| FPZ | Fracture process zone |
References
- Schmitt, J.H.; Iung, T. New Developments of Advanced High-Strength Steels for Automotive Applications. Comptes Rendus Phys. 2018, 19, 641–656. [Google Scholar] [CrossRef]
- Li, Y.; Song, R.; Jiang, L.; Zhao, Z. Strength Response of 1200 MPa Grade Martensite-Ferrite Dual-Phase Steel under High Strain Rates. Scr. Mater. 2019, 164, 21–24. [Google Scholar] [CrossRef]
- Huang, T.T.; Gou, R.B.; Dan, W.J.; Zhang, W.G. Strain-Hardening Behaviors of Dual Phase Steels with Microstructure Features. Mater. Sci. Eng. A 2016, 672, 88–97. [Google Scholar] [CrossRef]
- Farzam Rad, V.; Khamedi, R.; Moradi, A.R. The Effect of Martensite Volume Fraction on Topography of Dual Phase Steels. Mater. Lett. 2019, 239, 21–23. [Google Scholar] [CrossRef]
- Ingarao, G.; Di Lorenzo, R.; Micari, F. Analysis of Stamping Performances of Dual Phase Steels: A Multi-Objective Approach to Reduce Springback and Thinning Failure. Mater. Des. 2009, 30, 4421–4433. [Google Scholar] [CrossRef]
- Frómeta, D.; Tedesco, M.; Calvo, J.; Lara, A.; Molas, S.; Casellas, D. Assessing Edge Cracking Resistance in AHSS Automotive Parts by the Essential Work of Fracture Methodology. IOP Conf. Ser. J. Phys. Conf. Ser. 2017, 896, 12102. [Google Scholar] [CrossRef] [Green Version]
- ASTM E399. Standard Test Method for Linear-Elastic Plane-Strain Fracture Toughness of Metallic Materials; ASTM International: West Conshohocken, PA, USA, 1997. [Google Scholar]
- ASTME1820. Standard Test Method for Measurement of Fracture Toughness; ASTM International: West Conshohocken, PA, USA, 2020. [Google Scholar]
- ASTM E561. Standard Test Method for KR Curve Determination; ASTM International: West Conshohocken, PA, USA, 2019. [Google Scholar]
- Anderson, T.L. Fracture Mechanics Fundamentals and Applications, 4th ed.; CRC Press: Boca Raton, FL, USA, 2017. [Google Scholar]
- Broberg, K.B. Critical Review of Some Theories in Fracture Mechanics. Int. J. Fract. Mech. 1968, 4, 11–19. [Google Scholar] [CrossRef]
- Cotterell, B.; Reddel, J.K. The Essential Work of Plane Stress Ductile Fracture. Int. J. Fract. 1977, 13, 267–277. [Google Scholar] [CrossRef]
- Marchal, Y.; Delannay, F. Influence of Test Parameters on the Measurement of the Essential Work of Fracture of Zinc Sheets. Int. J. Fract. 1996, 80, 295–310. [Google Scholar] [CrossRef]
- Chandra, S.K.; Sarkar, R.; Bhowmick, A.D.; De, P.S.; Chakraborti, P.C.; Ray, S.K. Fracture Toughness Evaluation of Interstitial Free Steel Sheet Using Essential Work of Fracture (EWF) Method. Eng. Fract. Mech. 2018, 204, 29–45. [Google Scholar] [CrossRef]
- Clutton, E.Q. ESIS TC4 Experience with the Essential Work of Fracture Method. Eur. Struct. Integr. Soc. 2000, 27, 187–199. [Google Scholar] [CrossRef]
- Clutton, E. Essential Work of Fracture. Eur. Struct. Integr. Soc. 2001, 28, 177–195. [Google Scholar] [CrossRef]
- Golling, S.; Frómeta, D.; Casellas, D.; Jonsén, P. Investigation on the Influence of Loading-Rate on Fracture Toughness of AHSS Grades. Mater. Sci. Eng. A 2018, 726, 332–341. [Google Scholar] [CrossRef]
- Frómeta, D.; Lara, A.; Molas, S.; Casellas, D.; Rehrl, J.; Suppan, C.; Larour, P.; Calvo, J. On the Correlation between Fracture Toughness and Crash Resistance of Advanced High Strength Steels. Eng. Fract. Mech. 2019, 205, 319–332. [Google Scholar] [CrossRef]
- Hossain, M.M.; Kadam, A.A.; Lee, C.F.; Sue, H.J.; Fiscus, D.M. Numerical Modeling of Essential Work of Fracture on Ductile Polymeric Films. Eng. Fract. Mech. 2019, 212, 210–220. [Google Scholar] [CrossRef]
- Na, S.; Spatari, S.; Hsuan, Y.G. Fracture Characterization of Pristine/Post-Consumer HDPE Blends Using the Essential Work of Fracture (EWF) Concept and Extended Finite Element Method (XFEM). Eng. Fract. Mech. 2015, 139, 1–17. [Google Scholar] [CrossRef]
- Abdellah, M.Y. Essential Work of Fracture Assessment for Thin Aluminium Strips Using Finite Element Analysis. Eng. Fract. Mech. 2017, 179, 190–202. [Google Scholar] [CrossRef]
- Wnuk, M.P.; Read, D.T. Essential Work of Fracture (We) versus Energy Dissipation Rate (Jc) in Plane Stress Ductile Fracture. Int. J. Fract. 1986, 31, 161–171. [Google Scholar] [CrossRef]
- Rink, M.; Andena, L.; Marano, C. The Essential Work of Fracture in Relation to J-Integral. Eng. Fract. Mech. 2014, 127, 46–55. [Google Scholar] [CrossRef]
- Hosford, W.F.; Atkins, A.G. On Fracture Toughness in Tearing of Sheet Metal. J. Mater. Shap. Technol. 1990, 8, 107–110. [Google Scholar] [CrossRef]
- Mai, Y.-W.; Cotterell, B. On the Essential Work of Ductile Fracture in Polymers. Int. J. Fract. 1986, 32, 105–125. [Google Scholar] [CrossRef]
- Frómeta, D.; Parareda, S.; Lara, A.; Molas, S.; Casellas, D.; Jonsén, P.; Calvo, J. Identification of Fracture Toughness Parameters to Understand the Fracture Resistance of Advanced High Strength Sheet Steels. Eng. Fract. Mech. 2020, 229, 106949. [Google Scholar] [CrossRef]
- Cotterell, B.; Pardoen, T.; Atkins, A.G. Measuring Toughness and the Cohesive Stress-Displacement Relationship by the Essential Work of Fracture Concept. Eng. Fract. Mech. 2005, 72, 827–848. [Google Scholar] [CrossRef]
- Faccoli, M.; Cornacchia, C.; Gelfi, M.; Panvini, A.; Roberti, R. Notch Ductility of Steels for Automotive Components. Eng. Fract. Mech. 2014, 127, 181–193. [Google Scholar] [CrossRef]
- Kamat, S.V.; Hirth, J.P.; Zok, F.W. Effects of Notch Root Radius on Crack Initiation and Growth Toughnesses of a Cross-Ply Ti-6Al-4V/SiC Composite. Acta Mater. 1996, 44, 1831–1838. [Google Scholar] [CrossRef]
- Hill, R. On Discontinuous Plastic States, with Special Reference to Localized Necking in Thin Sheets. J. Mech. Phys. Solids 1952, 1, 19–30. [Google Scholar] [CrossRef]
- Terao, N.; Baugnet, A. High-Manganese Dual-Phase Steels, Strengthened by Additional Elements (Cr, Ti, V, W). J. Mater. Sci. 1990, 25, 848–858. [Google Scholar] [CrossRef]
- ASTM E8/E8M. Standard Test Methods for Tension Testing of Metallic Materials; ASTM International: West Conshohocken, PA, USA, 2016. [Google Scholar]
- Geller, S.; Holeczek, K.; Winkler, A.; Tyczynski, T.; Weber, T.; Gude, M.; Modler, N. Multiscale Characterization and Testing of Function-Integrative Fiber-Reinforced Composites. In Performance Testing of Textiles: Methods, Technology and Applications; Elsevier Inc.: Amsterdam, The Netherlands, 2016; pp. 155–176. [Google Scholar] [CrossRef]
- Knockaert, R.; Doghri, I.; Marchal, Y.; Pardoen, T.; Delannay, F. Experimental and Numerical Investigation of Fracture in Double-Edge Notched Steel Plates. Int. J. Fract. 1996, 81, 383–399. [Google Scholar] [CrossRef]
- Sarkar, R.; Chandra, S.K.; De, P.S.; Chakraborti, P.C.; Ray, S.K. Evaluation of Ductile Tearing Resistance of Dual-Phase DP 780 Grade Automotive Steel Sheet from Essential Work of Fracture (EWF) Tests. Theor. Appl. Fract. Mech. 2019, 103, 102278. [Google Scholar] [CrossRef]


| Type | ||||||
|---|---|---|---|---|---|---|
| we (kJ/m2) | wpβ (kJ/m3) | R | R | |||
| Fatigue pre-cracked | 230.45 | 36.99 | 0.9836 | 0.4088 | 0.1517 (17.38°) | 0.9883 |
| Notched | 332.3 | 28.59 | 0.9966 | 0.6891 | 0.1192 (13.65°) | 0.9956 |
© 2020 by the authors. Licensee MDPI, Basel, Switzerland. This article is an open access article distributed under the terms and conditions of the Creative Commons Attribution (CC BY) license (http://creativecommons.org/licenses/by/4.0/).
Share and Cite
M R, S.K.; Schmidova, E.; Konopík, P.; Melzer, D.; Bozkurt, F.; V Londe, N. Fracture Toughness Analysis of Automotive-Grade Dual-Phase Steel Using Essential Work of Fracture (EWF) Method. Metals 2020, 10, 1019. https://doi.org/10.3390/met10081019
M R SK, Schmidova E, Konopík P, Melzer D, Bozkurt F, V Londe N. Fracture Toughness Analysis of Automotive-Grade Dual-Phase Steel Using Essential Work of Fracture (EWF) Method. Metals. 2020; 10(8):1019. https://doi.org/10.3390/met10081019
Chicago/Turabian StyleM R, Sunil Kumar, Eva Schmidova, Pavel Konopík, Daniel Melzer, Fatih Bozkurt, and Neelakantha V Londe. 2020. "Fracture Toughness Analysis of Automotive-Grade Dual-Phase Steel Using Essential Work of Fracture (EWF) Method" Metals 10, no. 8: 1019. https://doi.org/10.3390/met10081019