Seawater Desalination: A Review of Forward Osmosis Technique, Its Challenges, and Future Prospects


School of Chemical and Process Engineering, Faculty of Engineering and Physical Sciences, University of Leeds, West Yorkshire, Leeds LS2 9JT, UK
*
Author to whom correspondence should be addressed.
Processes 2020, 8(8), 901; https://doi.org/10.3390/pr8080901
Submission received: 12 June 2020
/
Revised: 18 July 2020
/
Accepted: 19 July 2020
/
Published: 28 July 2020
(This article belongs to the Special Issue Design, Control and Optimization of Desalination Processes)
Abstract
:Currently over 845 million people are believed to be living under severe water scarcity, and an estimated 2.8 billion people across the globe are projected to come under serious water scarcity by the year 2025, according to a United Nations (UN) report. Seawater desalination has gained more traction as the solution with the most potential for increasing global freshwater supplies amongst other solutions. However, the economic and energy costs associated with the major desalination technologies are considered intrinsically prohibitive largely due to their humongous energy requirements alongside the requirements of complex equipment and their maintenance in most cases. Whilst forward osmosis (FO) is being touted as a potentially more energy efficient and cost-effective alternative desalination technique, its efficiency is challenged by draw solutes and the draw solutes recovery step in FO applications alongside other challenges. This paper looks at the present situation of global water scarcity, and a brief leap into the major desalination technologies employed. A closer look at the key drivers of FO as a seawater desalination technique in their individual domain and its outlook as an technology are further highlighted.
1. Introduction
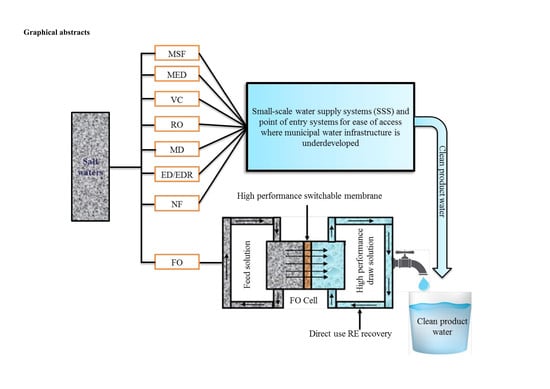
Desalination is a process of removing dissolved salts and other impurities from feed water sources, such as brackish waters and seawaters, and appears to be gaining more traction as the most attractive solution to increasing global freshwater availability. It is estimated that of the about 1385 billion cubic kilometres of water on the earth surface, 97.5 percent of that is seawater. Whilst freshwater makes up the remaining 2.5 percent, 90 percent of it being locked into ice caps or glaciers [1], leaving the rest of the fraction for human sustenance amongst other needs. In view of the seemingly substantial potential that seawater desalination holds as a solution to addressing freshwater scarcity, different seawater desalination technologies have been exploited in an apparent push towards harnessing increased global supplies of freshwater. Notably amongst these include multi-stage flash evaporation (MSF), multi effects distillation (MED), vapour compression (VP), reverse osmosis (RO), forward osmosis (FO), and electro-dialysis/electrodialysis reversal (ED/EDR), etc. [2]. High-energy intensity of seawater desalination processes and high cost of applicable seawater desalination technologies, aside from the associated environmental challenges, are considered as the major drawbacks of seawater desalination as a practice. It is worth noting that the principal economic constraint to harnessing seawater desalination stems from the high capital expenditure (CAPEX) and operational expenditure (OPEX), which often, eventually, is borne by the end users in the price of the desalinated water [3]. Furthermore, the design of seawater desalination systems utilizing either electrical or heat energy often is swayed by energy costs relative to capital inputs. Thus, as a trade-off, seawater desalination systems are often built in large capacities. Regrettably, however, often less focus is given in terms of the socio-economic situation of the geographical locations that would potentially utilize the desalinated water, especially as it relates to addressing economic water scarcity. Therefore, research into innovative and economically feasible techniques that offer the potential that may be harnessed and deployed as small scale or point of entry systems for seawater desalination, especially in locations where municipal water infrastructure is inadequate, is therefore critical.
This paper reviews and presents the current global freshwater scarcity challenge, and a glean at the different approaches of applicable seawater desalination techniques as a solution and the principal encumbrance of such techniques. The paper further looks at FO as an emerging technique by analysis of its key drivers in their individual domains, and their resultant impact on the potential viability of FO seawater desalination technique. Finally, the outlook of FO seawater desalination is highlighted.
2. Challenge of Global Water Scarcity
Water, an essential natural resource has over the past decades reportedly witnessed an increasing decline in its availability for satisfying basic human and environmental need, thus leading to scarcity. This further puts a strain on the limited freshwater resources, consequently creating a water stress situation in many parts of the world—a situation considered the most pressing global challenge of the 21st century. The major drivers exacerbating the increasing challenge of global water scarcity are said to be: the continuously increasing global population (especially in developing countries); industrialization and economic development; and changing consumption patterns, alongside other external factors, including climate change and migration, amongst others [4,5]. A condition of water scarcity is said to arise when there is less than an estimated 1000 m3 of freshwater per capita, whilst water stressed condition is said to occur when there is less than 1700 m3 of freshwater per capita [1]. However, the situation of water scarcity is multifaceted and may vary across the world depending on one or a combination of many factors. Largely, freshwater scarcity is considered in the context of physical scarcity or limited access to clean freshwater. However, the situation of water scarcity may also be viewed in the context of economical scarcity of water, which is linked to inadequate delivery of potable freshwater due to poor infrastructure or water management [6].
Many in developing countries today are suffering from a combination of physical, as well as economic water scarcity. Overall, the current challenge of global water scarcity is reportedly becoming steeper as demand continues to increase time-after-time, especially in emerging economies, where agriculture, industry, and urban development are said to be evolving quickly.
Global Freshwater Demands and Water Scarcity-Stress Situations
According to a United Nations report [4], it is anticipated that global water demand will witness a significant growth over the coming years in all water use sectors, with a preponderant percentage of this growth evinced to be occurring in developing economies of the world. It is predicted that contemporary global water demand, which currently stands at an estimated 4600 Km3 annually, is projected to increase by 20–30% to between 5500 and 6000 Km3 per year by 2050. This increase is mainly as a function of population growth, which is expected to reach between 9.4 and 10.2 billion by 2050 [7]. Consequently, freshwater availability will increasingly be strained over this time period, and it is projected that more than 40% of the global population would be living in areas of severe water stress through 2050 [4].
An assessment of global blue water (surface water and groundwater resources) scarcity on a monthly basis [8] revealed that, in at least one month a year, around 4.3 billion people live under conditions of moderate to severe water scarcity globally. Whilst around 4.0 billion estimably live under severe water scarcity at least one month of the year. The report further estimated that around 1.8 to 2.9 billion people experience severe water scarcity for at least four to six months per year. In the same vein, it posits that an estimated (approximate) 500 million people face severe water scarcity all year round [8].
Overall, the unfolding future of global freshwater scarcity appears to remain relatively on a fixed path, in addition to the continual shrinking of global freshwater bodies due to climate change. Different solutions had over the years been considered in a bid to ameliorating both current and future demands for freshwater. This is including, proposal in some quarters for a cap on the use of available freshwater resources, wastewater purification and reuse, as well as seawater desalination amongst other solutions. Interest in seawater desalination as an attractive solution has been on the ascendancy primarily because, theoretically, the potential for increasing global freshwater supplies via seawater desalination is appreciably enormous considering the vast amount of continental seawater bodies spanning the surface earth [1].
3. Seawater Desalination
Seawater desalination is reasoned to be the most feasible strategy amongst others towards increasing global freshwater to millions across the world. After decades of protracted growth, desalination as a practice has witnessed a considerable rise over the recent years across the world as countries seek to augment freshwater supplies as shown in Figure 1. There are currently around 21,123 total desalination plants installed worldwide spanning across 150 countries, with a total global cumulative desalination contracted capacity of around 126.57 million m3/d in 2019. Over 300 million people globally are now reportedly relying on water from desalination plants for diverse needs [9].
A broad range of technologies are employed in seawater desalination processes, which are further classified under two primary categories. The two main types of seawater desalination processes that had (over the years) been explored include (i) thermal processes, which work by utilizing thermal inputs and electrical power to cause seawater evaporation, wherein the condensates are collected as freshwater, and (ii) membrane processes, which utilize driving forces, including pressure (applied and vapour), electric potential, and concentration to overcome natural osmotic pressures to effectively force water molecules through membrane pores, whilst leaving behind trapped salt molecules [2]. Applicable choices of any one of these desalinating techniques is often situational and contingent upon other factors including source water quality, desired quantity and quality of product water, pre-treatment, energy and chemical requirements, and methods of concentrate disposal [2].
3.1. Overview of Major Desalination Technologies
3.1.1. Thermal Seawater Desalination Technologies
Principally, the most well-established thermal desalination technologies are the MSF, MED, and VC. Their insensitivity to source water quality, particularly MSF and MED, make them desalination technologies of choice in regions where source water is considered remarkably saline and warm, and with higher biofouling propensity. These attributes make water production costs of these technologies more competitive relative to seawater reverse osmosis (SWRO), and as such, they are more preponderant in the Arab Gulf region [11].
3.1.2. Membrane Desalination Processes
Membrane-based desalination systems are often pressure driven, with exception of electrodialysis, and are usually available in different varieties, depending on the feed water characteristics, separation capabilities, and pressure required. The most common membrane-based desalination systems that have found applications in seawater desalination, on a case-by-case basis, include both diffusion and size exclusion controlled processes, which operate under high pressure, as in RO, and the size controlled process types in the low-pressure membrane filtration processes, such as membrane distillation (MD), electrodialysis (ED), and FO.
3.2. Brief Insights—Energy and Economic Implications of Desalination
More often, the economic feasibility of a desalination asset is appraised in relation to some key drivers notably operation and maintenance cost, project capital, and balanced with the overall production cost of desalinated water. The cost factors satisfying these requirements, often hands in gloves, are contingent to other specifics, including technology, product water quality, quality of feedwater stream, site location, environmental impact and local regulations, energy use, etc. [11]. Costs series drawn from a database of study of over 50 desalination projects completed around the world over the past two decades is represented in Table 1 [11]. It is indicative that annualised CAPEX and OPEX costs, which gives a framework of the total cost of water produced in desalination projects differs significantly per project, and proportional to plant sizes typically below or above 100 million litres per day (MLD). This is based on several interrelated variables earlier mentioned, which are location specific.
It noteworthy, however, that the availability and cost of energy, which account for about over 30% of overall desalination cost, is a strong determinant of the economic feasibility of desalination assets. It is reckoned that the current global desalination capacity estimably consumes a minimum of 75.2 TWh annually, an equivalence of 0.4% of global electricity utility [12]. It is estimated that around 290 kJ/kg of heat energy, in addition to around 2.5 to 3.5 kWh/m3 of electricity, is the typical energy requirement to harness freshwater via seawater desalination using MSF. It typically requires appreciably around 3.5–5.0 kWh/m3 of electricity, though not exhaustive, for large scale RO—the most prevalent desalination technology, as shown in Figure 2, to produce potable water. This is albeit an ambitious expectation to have the actual expected energy consumption of SWRO reduced to a minimal 2.5 to 3.5 kWh/m3 using higher energy efficient technologies [11,13]. Tremendous reductions in energy demands of desalination technologies over the years notwithstanding, energy is still, adjudged, the largest recurrent cost component of desalination systems. These energy demands typically range between one-third and about one-half for SWRO, and between two-thirds and three-quarters for thermal desalination systems [11,14].
The Carlsbad desalination plant in the USA, which employs RO technology, is supposedly the most technologically advanced and energy efficient desalination plant in recent times. It is reported to consume around 40 megawatts of electricity to spew out around 189,000 cubic meters of potable water daily, an energy equivalence large enough to supply over 20,000 homes. It is worth noting, however, that water and energy are intricately related, and both are currently under strain globally. Consequently, choices made in one domain can potentially induce far reaching impact on the other directly and indirectly, either positively or negatively [4]. Global energy consumption are projected to congruously rise dramatically in the coming decades, with the rise in the water requirements to support the growing world population. A major downside of this, it is reckoned, would be the impact of increase in the cost of desalinated water as a trade-off for the increasing energy requirements for desalination that may inadvertently ensue. According to [15], the cost is closely related to energy prices and has been on a steady increase, despite fluctuations over the past decades.
What this implies is that a surge in global population, especially in developing countries, can potentially elicit an increase in demand for water already in scarce supply to meet human needs. Naturally, the challenge of increased demand for energy would correspondingly become even greater as a repercussion in the circumstance. Most recent desalination technologies depend on electrical power or thermal energy being constantly available, to which most of that comes from fossil energy. Regrettably, fossil energy in itself is in finite supply and not readily accessible by everyone, and where available, it comes at a high premium. Consequently, there had been a considerable lookout across the global society for innovative desalination solutions that are significantly less energy intensive in addressing the nexus of water and energy security concerns, amongst other associated challenges, such as the enormous carbon footprints in the atmosphere. Overall, it is held that notwithstanding the enormous possibilities of increasing global freshwater supplies through seawater desalination, a major flip side has been that seawater desalination is still considered an energy intensive practice. This makes it out of reach to many across the world, aside the associated environmental challenges. FO, a natural process driven by the difference in osmotic pressure between two solutions is considerably gaining great research interest in recent times as an emerging seawater desalination. This is due primarily to its efficiency in removing salts and other pollutants from water, low fouling propensity, and more importantly it is seen as a potentially less energy intensive process. The technology has demonstrated its merits either as a stand-alone process in applications such as fertigation, irrigation, as well as in concentrating solutions, and also in hybrid systems in combination with other techniques particularly in relation to applications such as desalination and wastewater reuse. It is seen as a potential game-changer that might affect the global outlook for freshwater positively when properly harnessed. Though in limited commercial application for seawater desalination, FO seawater desalination has been commercialized and is currently being operated by Modern Water with plants in Al Khaluf, Oman, Gibraltar, and China respectively, with potential for more expansion [17].
4. Forward Osmosis
Forward osmosis is a natural filtration process whereby water molecules are spontaneously transferred through the pores of a semipermeable membrane by reason of solute concentration differentials—by extension, the osmotic pressure differentials between two liquid solutions separated by the membrane, as shown in Figure 3. Devoid of any applied hydraulic pressure, water flows from the feed solution (FS) stream having low osmotic pressure to the high osmotic pressure draw solution (DS) stream. The feed solution becomes more concentrated and conversely the draw solution becomes more dilute, wherefrom product water is then separated from the diluted draw solution in the recovery system. Equation (1) gives a general mathematical relation for water flux () in osmotically driven processes [18].
where is constant of water permeability of the membrane (L/m2 h atm.), is the osmotic pressure difference (atm.) between draw solution side and feed side, and is the hydraulic pressure difference (atm.) applied across the membrane. In the Equation (1), is the net driving force under which water permeates through the membrane. Given that FO process is devoid of or very low hydraulic pressure is applied, is zero and the relation for water flux is reduced to:
where and represents the osmotic pressure of the draw and feed solution streams, respectively.
4.1. Benefits and Applications of Forward Osmosis
Numerous benefits bequeathing FO, such as potential low energy consumption, simultaneity in the treatment of two streams in a single process, fouling reversibility, and treatment of challenging liquids relative to other membrane processes, has endeared FO to diverse applications across board. The FO technology has, over the years, found application across varying disciplines including food and beverage industry, chemical industry, pharmaceutical industry, medical sciences, coal processing industry, micro-algae cultivation, textile industry, and pulp and paper industry. Other applications include electronic industry, car manufacturing industry, industries with heavy metal usage, oil and gas industry, and industrial wastewater treatment etc. [19]. The technology has particularly gained a wide implementation in water treatment applications where fouling and scaling aspect of conventional processes can be mitigated. It also offers the ability to reject high levels of salt- often inorganic salts in the form of total dissolved solids (TDS) that cannot ordinarily be achieved by normal treatment systems [20]. Most of the TDS removable by FO process exist as ions in solutions from complex waters, with each characteristically having varying values of ionic radii (nm) and hydrate number (ns) in Na+: 0.098, 4.03, K+: 0.133, 2.67, Mg2+: 0.078, 5.33, Ca2+: 0.106, 3.64, Cl−: 0.181, 1.70, SO42−: 0.147, 2.34, respectively [21]. Its applications in dewatering processes as well as its effective applicability in anaerobic digestion (AD) of wastewater in addition to its ease of use and environmental friendliness has been reported [22,23]. Lutchmiah et al. [24] also reported the application of FO technology in different areas. These include the treatment of strong industrial effluents—municipal wastewaters, textile processes, waste streams from oil and gas processes, landfill leachates, and activated sludge amongst others. In the light these numerous advantages, the last few decades have witnessed a considerable interest in research relating to the development and implementation of FO technology as a seawater desalination technique. This is principally due to its salt rejection effectiveness, low fouling propensity, and its low energy consumption potential—a distinct advantage over other desalination techniques amongst other advantages.
4.2. Research Trends on FO Technology
Trends about research on FO technology had been extensively covered in the past [25,26]. Statistical information obtained from Elsevier using the keyword: FO (forward osmosis), reveals as represented in Figure 4 that over the past decades, the technology had gained tremendous global research interests both in the academia and in the industry for diverse applications in water research, including desalination. As at yet, about 2025 FO related publications across different article types, including review articles, research articles, book chapters, etc., were recorded between 1992 and 2020. As represented in Figure 5, a total of 1487 of such publications were research articles representing 73%, followed by 281 review articles, accounting for about 14%, whilst 180 book chapters stood at 9%, and others accounted for the remaining 4%. After a period of stagnated growth between 1992 and 2013, a quantum leap was recorded between 2010 and 2019, at which point the growth tend to steady between 2019 and 2020 at 16%, respectively, although 2020 is counting. The apparent leapfrog in FO research interests between these periods is reasoned to not be unconnected to the breakthrough in membrane science ushering in the first commercial FO membrane by Hydration Technology Innovation (HTI) [25]. Insights deduced from these trends indicates that most of the publications are focused on topical areas of synthesis and fabrication of membranes and draw solute recovery and energy efficient regeneration—some of the most pertinent challenges associated with the FO technology [26,27]. Overall, the increasing publications in FO research reflects its importance as an emerging technology with great potentials that could be harnessed profitably as alternatives to the conventional technologies.
4.3. FO Life Cycle
A life cycle cost analysis of FO, relative to other membrane desalination techniques, depicts FO as offering a significant reduction in capital and operating costs [28]. Significant enhancements in water permeation rates as well as improved salt rejection ability primarily by reason of some modest progress in membrane technology over the years, has potentially placed FO in good offering as the potential alternative desalination technology of choice. The technology offers a potential advantage of achieving reductions in energy demand, which may further offset the cost of seawater desalination—a critical challenge in the desalination industry. It is characteristically known to be very flexible and more cost competitive in setting up and maintenance, compared to the conventional technologies such as RO. In the context of material consumption, an FO system typically does not require highly specialised equipment, as is the case with the other desalination systems, and in most cases, minimal specialized skillset is required in its operations, hence increasing its suitability for wider applications. This is antithetical to the other desalination systems often commanding huge costs in specialised process equipment and materials, depending on the process types and capacities, in addition to other auxiliary associated costs where applicable [29].
The FO technology is also said to enjoy a distinct advantage of inherently having low propensity to fouling and high rejection rates, as well as extended membrane lifespan typically twice that of the equivalent RO membrane thus achieving reduced lifetime cost [30]. Environmentally, FO can elicit considerable reduction in CO2 emissions to the atmosphere contrary to RO systems—said to provoke the emission of around 2 kg of CO2 per every meter cube of desalinated water obtained [31]. It is worth noting, however, that whilst in principle FO supposedly seems to offer more comparative advantages, its complete efficacy as a desalination technique relative to RO, in terms of energy efficiency and water production cost, remain unresolved in many quarters.
Different approaches had been postulated about estimating the cost and energy implications of draw solutions recovery in forward osmosis desalination processes. Tae-woo Kim et al. [32] in a simulation study compared the costs of FO draw solution recovery process based on thermal separation using a single distillation column. A cost function fusing operation and investment costs (Equation (3)) was modelled to compare the production cost of different draw solute candidates at different steam prices and plant capacity conditions.
where C represents total production cost to produce a ton of product water ($/t product water); Cinv.DC is the investment cost for the distillation column ($); Cinv.M is the investment cost of the FO membrane process ($); LM is the lifespan expectancy for the membrane process (year); LDC is the lifespan expectancy for the distillation column (year); rsteam is the required amount of stream to produce a ton of product water (M/t product water); relectricity is the required amount of electricity to produce a ton of product water (kWh/t product water); UM is the cost coefficient for illustrating the operation cost of FO membrane process; Usteam is the unit utility cost for steam MJ ($/MJ steam); Uelectricity is the utility cost for electricity kWh ($/kWh electricity); and Q is the annual production of product water (ton).
The findings from this study (see Table 2) taking into account different decision variables including membrane area, draw solute, number of stages in the distillation column, and pressure in the distillation column indicated that amongst the various draw solutions whose recoveries were evaluated, NH4OH was by far the most cost competitive. At elevated plant capacity of 100 Million Imperial Gallons per Day (MIGD) and lower steam prizes at $0.0001/MJ, NH4OH attained the least total water production cost of $0.275 and $0.092 per ton, respectively. It is worth noting that typical plant capacities for other desalination techniques ranges between 0.1 to 35 MIGD for RO, and between 20 to 200 MIGD [33,34]. This study is indicative of the feasibility of achieving major cost savings in energy applicable to draw solution recovery process in FO desalination systems given the availability of low-cost thermal energy. In a related development, a study by Choi et al. [35] modelled a cost function employing a solution diffusion model retrofitted with thin film theory to evaluate the performance and economic feasibility of 10,000 m3/day hybrid FO-RO desalination system under varying process conditions. Flux, recovery, FO membrane cost and energy cost were identified as the key influencing factors. Relative to varying flux values, the water production costs of the FO-RO hybrid system were established to have ranged between $0.71 to $0.78 per cubic metre; whilst in relation to varying recoveries, the water production cost of the hybrid system ranged from $0.71 to $0.87 per cubic metre. Furthermore, a water production cost of the hybrid system ranging from $0.59 to $1.16 cubic metre with varying electricity cost was reported. A conclusion from the study held that, it is only feasible to attain cost competitiveness with an FO-RO hybrid system relative to an RO system when the hybrid system operates at a very high recovery rate exceeding 170%, when the water flux and membrane cost of the FO vis-a-vis that of RO are the same, and when the cost of electricity is higher. A modelling approach by Mazlan et al. [36] using sets of thermodynamic and physical properties, modelled under various process conditions and compared the energy consumptions between FO and RO desalinations. Findings from this study indicated that from a bottom-up specific energy consumption (SEC) at 50% product recovery, the order of membrane processes was two-stage RO ≤ single–stage RO < FO with stage–stage NF (nanofiltration) recovery ≤ FO with NF recovery. Whilst at 75% product recovery, the study held that there was effectively no difference in SEC between FO with two–stage NF recovery process relative to a two–stage RO. The study further held that draw solution type and pressure driven recovery process employed regardless, there is practically no significant difference in energy consumption of different hybrid processes and standalone RO process.
Whilst these studies provide insights into the potential economic applicability, and/or otherwise of hybrid FO processes on industrial scale, more may still be needed towards attaining a synergy between these studies and practical industrial situations. For instance, subject to the heat source and design efficiency, it may not be expedient to achieve a cost competitive thermal DS recovery process if multiple distillation columns are utilized. The possibility of a reduction in membrane performance ratio that may be occasioned by internal concentration polarization (ICP) and even membrane fouling effects remains an encumbrance factor not withstanding how significantly high bulk draw solution might be. Improvements in FO membrane designs that will offset the impact of ICP and fouling and, consequently, necessitate a reduction in bulk draw solution concentrations remains unresolved.
5. Forward Osmosis Desalination Process
Generally, forward osmosis desalination processes involve two steps: process of pure water separation from saline water, and the draw solution recovery process of separating the pure water from the diluted draw solution [37]. In forward osmosis desalination process, a high osmolality draw solution is employed to extract water across a semipermeable membrane from a saline feed solution. The process is driven by the difference in osmotic pressure of the two solutions, with the draw solution usually having higher osmotic pressure relative to the feed solution; thus, eliminating the need for high hydraulic pressure—a potential source of energy consumption particularly in other membrane processes [38]. A successful FO desalination process is thus critically reliant on the availability of a DS that offers both high osmotic pressure and a facile regeneration mechanism. Hence, the property of a DS determines the recovery method of the diluted DS in FO desalination systems [37].
5.1. Selection Criteria for Draw Solutes
Draw solutes (DSs) are said to play the most predominant role in terms of providing the necessary driving energy required for FO based water treatment processes amongst of all the influencing parameters affecting FO processes. Suitable DSs selection process broadly encompasses first, an initial screening of the functional DSs material often predicated upon its natural properties to evaluate for some basic integral components that influences an FO process including—water solubility, pH, speciation, osmotic pressure, and compatibility with the FO membrane. Consequently, a laboratory-scale test of the performances of the screened functional DSs material is often required, following which is a final evaluation of the functional DSs material’s full-scale performance albeit further specific criteria may need to be evaluated depending on the targeted application [22,39,40,41]. High water flux and low back solute flux, least possible reverse draw solutes flux, high solubility in water, optimum temperature, chemical stability, neutral pH, lower molecular weight, recyclability, low toxicity, fouling resistance, and chemical inertness towards the membrane employed had been described as some of the requite attributes for consideration as an ideal draw solute in forward osmosis processes [40,42,43].
Other features reported as being important in consideration of an ideal draw solute is a higher osmotic pressure of draw solution relative to that of the feed solution [44]. Therefore, in order that a functional material performs effectively as a draw agent in FO processes, such a material must be able to generate much higher osmotic pressure relative to the feed solution, and in the context of desalination, the osmotic pressure of the draw solution must be required to far exceed 7.7 atm.—in respect to brackish feed and significantly exceeding 27 atm. relative to seawater feed [45].
5.2. Draw Solutes in Forward Osmosis Processes
A wide range of draw solutes have been proposed for FO systems with a string of recovery methods [46]. Draw solutes had over time been grouped into different categories. It follows from literature that the typically reported draw solutes include polarity switchable solutes, volatile liquids, hydrogels, and nanoparticles. These draw solutes are said to have ability to respond to stimuli and are reputed to offer great flexibility that enables them to decrease their propinquity to water and at the same time facilitating increased water flux to suit requirements. Other groups of draw solutes that had been reported in several studies are the inorganic, polymeric and organic compounds, and are said to be non-responsive [47]. More recently, carbonaceous materials have also entered the fray as a group of draw solutes for solar evaporation FO desalination [48].
5.2.1. Non-Responsive Draw Solutes
Of the different classes of draw agents, the inorganic salts appear to preponderate, to a large extent, than other classes of draw agents used in forward osmosis studies, attributed primarily to their ability to reasonably generate considerable osmotic pressures, and/or feasibility of being directly used without recourse to further treatment (dependent on the application). Achilli and co-workers [44] established a protocol to determine the most appropriate draw solutions for certain FO applications and investigated a series of inorganic-based draw solutes having the same concentrations for optimal performance as draw solutions according to some selected criteria including performance (generated water fluxes, reverse salt flux, and the DS recoveries) as well as cost effectiveness. Amongst the inorganic solutes examined included sodium chloride (NaCl), ammonium chloride (NH4Cl), potassium chloride (KCl), potassium bromide (KBr), sodium bicarbonate (NaHCO3), potassium bicarbonate (KHCO3), magnesium chloride (MgCl2), calcium chloride (CaCl2), ammonium sulphate ((NH4)2SO4), sodium sulphate (Na2SO4), potassium sulphate (K2SO4), magnesium sulphate (MgSO4). In these investigations using the established protocol and based on the selection criteria herein stated above, CaCl2, KHCO3, MgCl2, MgSO4, and NaHCO3 were adjudged highest in terms of performance with regards to reverse salt flux. Whilst cost wise, KHCO3, MgSO4, NaCl, NaHCO3, and Na2SO4 were adjudged more cost effective and so ranked highest. However, whilst combining the two criteria of performance and cost effectiveness, KHCO3, MgSO4, and NaHCO3 were adjudged tops. Other than reverse salt flux, low water flux, high viscosity, low water solubility, scale precursor ions, and fouling were the other drawbacks reportedly occasioned in these investigations. Phuntsho et al. [49] also examined a couple of other inorganic salts largely fertilizers as DS in their study, which was aimed to appraise the prospect of FO process in desalination for irrigation. The performance of these salts as draw agents including ammonium phosphate (NH4(H2PO4)), diammonium hydrogen phosphate ((NH4)2HPO4), ammonium nitrate (NH4NO3), potassium nitrate (KNO3), sodium nitrate (NaNO3), ammonium chloride (NH4Cl), calcium nitrate (Ca(NO3)2), potassium chloride (KCl), and (NH4)2SO4 were scrutinised by water flux and reverse salt flux. At the end, the draw solutions of KCl, NaNO3, and KNO3 were considered as best relating to water flux where as in the context of reverse salt flux, NH4H2PO4, (NH4)2HPO4, Ca(NO3)2, and (NH4)2SO4 were adjudged to have exhibited the lowest. Alnaizy et al. [50] in a study aimed to minimize the energy demands related to pure water recovery in FO desalination processes explored the feasibility of CuSO4 as draw agent. As much as water recovery in the FO process was realizable by way of metathesis precipitation of CuSO4 with BaSO4, the chemical and raw material cost of the process was a drawback cost wise.
5.2.2. Responsive Draw Solutes and Synthetic Materials
The other classes of draw solutions that have been gaining tremendous use in studies involving forward osmosis in recent years are the responsive draw solutes. These include thermally responsive molecules, polarity switchable solutes, volatile liquids, and hydrogels and nanoparticles. In recent years, the rapid progress in nanomaterial research has brought about new opportunities with special focus to the development of nanoparticles as draw solutes in FO desalination processes owing to their low energy utilization and easy recovery. Hydrophilic magnetic nanoparticles (MNPs) have particularly gained growing interest in the past few years as promising DS for FO process [51,52,53,54,55,56] since the advent of the concept of MNPs as draw agents was in patented work by Warne and his group in 2010. Ling et al. [54] explored the use of a highly water-soluble magnetic nanoparticles functionalised by various groups, such as 2-pyrrolidone, triethylene glycol, and polyacrylic acid, in a study to investigate the relationship between the surface chemistry of magnetic nanoparticles and the achieved osmolality. The work concluded that draw solutions of magnetic nanoparticles capped with polyacrylic acid (PAA-MNPs) exhibited the highest water flux among the three different surface-functionalised magnetic nanoparticles. The separation of nanoparticles from product water was done using an ultrafiltration (UF) system. There was, however, drop in water flux due to particle agglomeration. In a related study, Ge et al. also investigated the potential of a series of poly(ethylene glycol)diacid-coated (PEG-(COOH)2-coated) MNPs with different size distributions as draw solutes in their work [53]. It was reported that the as-prepared PEG-(COOH)2 MNPs demonstrated good dispersibility and generated high osmotic pressures in aqueous solutions, with water fluxes of >9 L/m2h achieved when deionised water is used as the feed solution. Recovery was via magnetic field, with a total water flux decrease of 21% reported due to slight aggregation after nine cycles. Polymer hydrogels had also found usage as the draw agents in studies involving FO processes. Li et al. [57] in their study to examine the effect of the ability of polymer hydrogels to withdraw water through semipermeable membrane and dewater under thermal process, investigated four different types of polymer hydrogels. These included two ionic polymer hydrogels: poly (sodium acrylate, PSA) and (poly (sodium acrylate)-co-poly(N-isopropylacrylamide) with an equimolar NIPAM and SA, PSA–NIPAM); and two non-ionic hydrogels: poly(acrylamide), PAM) and poly(N-isopropylacrylamide). PSA and PSA-NIPAM hydrogels were reported to have produced the highest and lowest water fluxes (0.55 and 1.1 L/m2h) respectively, with the water flux for all four types of hydrogels observed to have decreased with time. Water recovery from the hydrogels was induced by hydrostatic pressure at different temperatures.
Switchable polarity solvents (SPS) have also attracted interests as draw agents in FO studies. Stone et al. investigated the application of mixtures of carbon dioxide, water, and tertiary amines as novel switchable polarity solvents (SPSs) draw solutes in FO process wherein the removal of CO2 from the saturated draw solution of dimethylcyclohexylamine [HN(Me)2Cy HCO3] facilitated a phase separation from water of the nonpolar immiscible SPS [58]. RO was applied for SPS DS recovery; however, degradation of the cellulose triacetate (CTA) membrane and reverse salt flux were notable drawbacks. Other responsive draw solutes reported in literature to have been investigated as draw agents in studies involving FO include: nano-size dextran coated ferric oxide MNPs (Fe3O4); 2-methylimidazole based compounds with monovalent and divalent charges. Polyelectrolytes of polyacrylic acid sodium (PAA-Na), thermo-sensitive polyelectrolytes, acyl-TAEA, micelles close to the krafft point, dendrimers, albumin, hexavalent phosphazene, polymer-graphene composite hydrogels, etc., are amongst other additions to the list of responsive draw solutes investigated. Other classes of draw solutes as reported in literature include organic draw solutes and carbon-based draw solutes. An overview of some of the several draw solutions used in FO processes is provided in Table 4. From the foregoing expositions herein on a wide range of available draw solutions in FO processes, it can be established that, notwithstanding the varying criteria employed for material selection and fabrication as draw solutes, none of these draw solutions is without an attendant challenge(s).
5.3. FO Membrane Developments
The membranes used in forward osmosis are similar in configurations to the membranes used in other membrane processes such as reverse osmosis. They come in different shapes and configurations including tubular or hollow fibre, spiral wound, plate and frame, as well as flat sheet. Each of these membrane configurations does have their pros and cons in terms of their applicability in FO processes. FO membranes are often consisting of varying connections across either side of the membrane—feed in, concentrated feed out, and draw in, dilute draw out. This implies that under certain applications, pressure generation on the membrane by flow and process condition is possible. Table 3 updated from Li et al. [59] provides an indicative status of FO membranes developments.
5.3.1. Design Criteria of FO Membranes
An ideal membrane for FO processes is required to attain certain criteria for its consideration. These include the ability to generate a high-water flux, which ensures a high-water recovery rate and improves the FO efficiency in water treatment. Another criterion considered essential for an FO membrane is a high solute retention ability in view of its semipermeable nature that allows for passage of molecules of solvents whilst retaining solutes of all sort [65]. Reverse solutes diffusion however remains a challenge. Minimal membrane fouling and concentration polarization effect is another essential criterion required of an FO membrane as these two have the propensity to lower effective osmotic pressure differential across the membrane, and consequently decline in rate of water recovery in osmotic processes amongst other attendant effects such as cost of cleaning. Additionally, an FO membrane is required to meet the criteria of good chemical stability and resistance to chlorine, as well high mechanical strength [65].
5.3.2. FO Membrane Types
The two most common types of membranes used in filtration studies are the cellulose based and thin film membranes, and under consideration in recent times are carbon-based membranes—albeit under research and development.
Cellulose Based Membranes
The cellulose acetate/cellulose triacetate (CA/CTA) FO membranes are obtained by way of simple immersion of casted or spun polymer dope into coagulants, where phase inversion occurs, in which event, an asymmetric membrane structure featured with a skin layer integrally supported by a porous substrate is generated, as shown in Figure 6. CA/CTA membranes reputably have good mechanical strength, wide availability, high hydrophilicity, and good resistance to degradation by chemicals such as Chlorine and other oxidants. They are also known to exhibit lower fouling propensity than the thin film composite (TFC) membranes due to their hydrophilic nature; thus, generating high water flux [66].
Notwithstanding their advantageous properties, amongst the downsides associated with these membrane types is the necessity of annealing post-treatment to achieve pore size reduction and improvement in selectivity. A principal disadvantage, however, remains the inherently low water permeability due to their thick skin layer, which is aggravated during the annealing process. They are also said to have poor resistance to hydrolysis and biological attacks. Other challenges that continue to trail and negate the CA/CTA FO membranes include higher reverse solutes flux compared to TFC membranes. It requires the pH of the draw and feed solutions to be maintained at a value between 4–6 or at a temperature below 35 °C to suppress membrane hydrolysis [66]. High concentration of polymer in use coupled with the annealing process occasions denser substrate with lower porosity; hence, creating a larger structural parameter of the membrane. More so, in contrast to the TFC membranes, CA/CTA asymmetric FO membranes fabrications does not permit for separate modification of the skin layer. Different approaches had, over time, been explored in a bid to improving the impediment of low water flux and salt rejection associated with CA/CTA asymmetric FO membranes. Amongst such approaches include the introduction of new additives, dope composition adjustment, as well as changing fabrication conditions with little progress really achieved nonetheless [67,68,69].
Thin-Film Composite Membranes
TFC forward osmosis membranes, which are said to be predominantly formed via interfacial polymerization (IP) employing substrates of different hydrophilicities, have gained widespread attention in recent times in studies involving FO. This is due primarily to the high versatility to independently change the characteristics of membrane substrate and its active layer. They are said to exhibit better results than CA membranes in terms of water permeable flux, salt rejection flux, membrane performance etc. [66]. Figure 7 shows different images of a TFC membrane. A typical TFC membrane structure in most cases is comprised of a polyamide thin selective layer, an intermediate polymeric porous support often consisting of semi-hydrophobic polymers such as polysulfone (PSF) and polyethersulfone (PES), and an optional non-woven polyester fabric [71].
The polymeric substrate layer exercitation in TFC membrane is also understood to be essentially predicated on the dope formulation and fabrication conditions, analogous to the intrinsic asymmetric membranes [73]. However, TFC membranes are reputably more susceptible to fouling and chlorine attack due to the vulnerable characteristic of the polyamide active layer [74]. This increased susceptibility to fouling is also attributed to the greater surface roughness and higher initial water flux obtained in TFC membrane [75]. Furthermore, the existence of carboxyl group (-COOH) on TFC active layers, which enhances its propensity for hydrogen bonding is considered to further exacerbate the fouling owing to the strong adhesion force that is established at the membrane foulant interface [76]. These scenarios have the potentialities that may adversely curtail the lifespan of membrane and consequently debasing of the desalinated water, hence hindering its full implementation.
Therefore, in the light of the fact that cost-benefit implications are often the principal determinants that justifies the applicability of membranes across a range of applications including desalination, TFC membrane’s ingrained high propensity to fouling is deemed a critical deterrent. This questions its economic benefits relative to the CA/CTA membrane notwithstanding its superior advantages of higher water flux. Reason being that membrane replacement is considered capital intensive. More so is the fact that the pre-treatment requirements typically aimed at minimizing fouling phenomena where TFC membranes are employed, in consequence makes the implementation of TFC for desalination prohibitively expensive. Without therefore addressing this inherent limitation of high fouling propensity in TFC membrane, the CA/CTA membrane may remain the membrane of choice for practical applications albeit being of lower flux.
Carbon Based Membranes
These membrane types, which hypothetically have great potentialities for applications in a membrane based process, are reportedly gaining wide traction based on their potential mitigation abilities in relation to concentration polarization, fouling, as well as having a good chemical and physical stability [77]. They are currently mostly under research development and have not attained commercial applicability as at yet.
A principal candidate in this class of membrane type that has gained great attention for potential implementation in membrane filtration processes for water desalination in recent times had been graphene oxides (GO). This is due primarily to its exceptional physical properties as well its remarkable water transport behaviour, alongside its ability to effectively separate molecules and ions from liquids and gases. Its capability to acts as barrier when dealing with liquids and gases, in addition to its oxygen containing functional groups, which grants hydrophilicity causing it to be exfoliated in some solvents with good water dispersity, has endeared its strong consideration in the FO membrane development [78]. GO itself is a two-dimensional structure having high selectivity with nano-size channels of around 0.3 nm adequate to permit the diffusion of water molecules through it. It is obtained by oxidation of graphite, wherefrom the oxidised graphite is subsequently dispersed in basic solutions to produce GO comprising of carbon, oxygen and hydrogen atoms in varying ratios [79,80]. Different methods including Brodie, Staudenmaier, and Hummers are usually employed in the synthesis of different GO composites depending on the desired properties [79,80]. As shown in Figure 8, GO atoms can be self-layered, interlayered or coated on the surfaces of membrane structures to enhance its water removing capabilities [81]. The various methods of producing graphene from which GO is obtained include mechanical exfoliation of graphene from bulk graphite; crystal growth of graphene films; chemical vapour deposition of graphene monolayers; longitudinal cutting of CNTs and reduction of graphene. The production of graphene sheets from these techniques satisfying all the requirements of industrial membranes is considered complex and expensive [77,78]. It is also reportedly challenging to establish the methods for the fine control of the interlayer of GO laminate within sub-nanometre range in the synthesis of GO laminate membranes. This fine control is necessary in sorting through small molecules accurately [77]. Worth mentioning is the key challenge of integrating carbon nanoparticles on to membrane substrates during the fabrication process due to the sometimes instability and inefficiencies associated with diverse membrane materials [82].
5.3.3. Membrane Fouling
Fouling involves the adsorption or trapping of particles (foulants) that are present in a fluid being transported across the membrane and can be a physical or chemical phenomenon. Typically, some of the known foulants are proteins, lipids, bacteria, etc. The widely held opinion is, however, that fouling may be on account of one or a combination of the following mechanisms including: formation of dynamic membrane (surface layer or filter cake) on the front face of the membrane, fouling within the membrane structure, and fouling at the pore entrance [84]. Notwithstanding that numerous submissions in literature tend to downplay the significance of fouling on membrane performance in FO processes as compared to other membrane filtration processes, the phenomenon of membrane fouling is yet seen in many quarters as a major impediment that affects the efficiency of FO processes. This is because where and when it occurs, it leads to decline in membrane permeability through the formation of a cake/gel layer on the membrane surface or the blocking of the inside membrane pores especially porous support layer. Consequently, this result in decline in water flux, decrease salt rejection ability, as well as membrane deformation. Due primarily to different foulants and fouling mechanisms, membrane fouling is often classified into four general categories, these being organic fouling, inorganic fouling, colloidal fouling, and microbial fouling. Typically, the factors affecting or contributing to membrane fouling include: (i) the feed properties effects (concentration, pH and ionic strength, component interactions, pre-filtration and the removal of aggregates); (ii) the membrane material and its physical-chemical properties effects (pore size, porosity and pore size distribution, physical-chemical properties); and (iii) the effect of the operating or processing parameters or variable on the membrane behaviour (temperature, crossflow velocity and turbulence, as well as transmembrane pressure) [84].
Over the years, some of the known approaches that have been explored to improve membrane performance include boundary layer or velocity control; turbulence inducers or velocity generators; membrane modification and materials; and combined (external) fields. When fouling occurs, a couple of cleaning and regeneration methods are applied to alleviate its attendant effects on the fouled membrane through the following broadly categorised methods. These include: (a) physical cleaning methods, which involves the application of mechanical methods, such as periodic back flushing, backwashing, vibrations, air sparging, automatic sponge ball cleaning, and ultra-sonication to dislodge and remove foulants from membrane surfaces; (b) chemical cleaning methods, which entails chemical reactions applied to remove foulants from membrane surfaces including the use of cleaning agents such as alkalis (hydroxides, carbonates and phosphates, acids (nitric and phosphoric), surface-active-agents (anionic, cationic and non-ionic), sequestering agents (ethylenediaminetetraacetic acid—EDTA), and formulated cleaning agents (often a mixture of alkalis, phosphates, sequestering agents and wetting agents); (c) physical-chemical cleaning methods achieved by use of physical cleaning in addition to chemical agents to aid effective cleaning; and (d) biological cleaning methods, which involves the application of mixtures containing bioactive agents (enzymes or microorganisms) to improve foulants removal [84,85]. For FO however, physical cleaning processes has been adduced as being the most applied membrane cleaning strategy [86]. Widely deployed in this instance is on-line washing, which involves the recirculation of applicable cleaning agents on either side of the membrane. Other physical cleaning strategy deployed in FO is the osmotic backwashing involving the use of a concentrated feed solution and a less concentrated draw solution in alternate direction across the membrane so as to flush out entrapped solutes within the pores of the membrane [86]. Depending on membrane type, it is pertinent to note that for organic fouling, chemical cleaning has been reported as a requisite with regard to thin film composite (TFC) membranes relative to the cellulose triacetate (CTA) membranes due primarily to strong adhesion to alginate [87]. More so, depending on type and severity of fouling, a combination of more than one cleaning approaches may be more appropriate. For instance, it has been established that a combination of osmotic backwashing method followed by back flushing had proven to be an effective strategy for cleaning membranes that are considered to be remarkably fouled [82,88]. Overall, it is worth mentioning that some physical membrane cleaning techniques may pose some potential adverse impacts in practice. For instance, where applicable, pressurised water is pumped at high crossflow velocity through the membrane from the permeate side to dissolve or dislodge fouling deposits. There is a risk of membrane damage by detaching its delicate thin top layer, which performs the separation. In practice, doing this will require some high pressure piping on the permeate side of the membrane and this potentially could increase equipment cost significantly [89].
5.3.4. Concentration Polarization
Concentration polarisation phenomena and its consequences on the overall osmotic pressure is one amongst the critical factors in osmotically driven processes, primarily because of the membrane support layer [29]. Its occurrence leads to gel formation when the concentration at the membrane surface reaches solubility limits of the solutes [84]. In case of FO, the feed solution is said to become more concentrated on one side of the membrane and conversely the draw solution becomes more diluted at the other. This essentially results in the decrease in the osmotic pressure difference between the two solutions, and consequently the solvent flow. The extent of these effects is contingent upon the nature of the membrane and its orientation. Figure 9 depicts concentration polarization across an asymmetric FO membrane. For an asymmetric membrane configuration with the porous support layer facing the feed solution, which is applicable in pressure retarded osmosis (PRO) mode, as represented in Figure 9b, the decrease in net driving osmotic pressure is accounted for by concentrative ICP. An analytical model describing this effects on permeate flux [90] is given as follows:
On the other hand, the case of an asymmetric membrane configuration with the feed solution facing the active layer (FO mode) is shown in Figure 9a. In this configuration, the draw solution gets diluted by the permeate water within the membrane’s porous support layer. The concentration polarization phenomenon that takes place is termed dilutive ICP [91], and an expression that models water flux for a membrane experiencing this phenomenon [90] is given as follows:
where from in both Equations (4) and (5): πD,b is the bulk osmotic pressure of the draw solution; πF,b is the bulk of the feed solution; Jw is the water flux; K is the solute resistivity for diffusion; k is the mass transfer coefficient; exp(− is the reduction factor of the draw solution; and exp () is the amplification factor of the feed solution osmotic pressure due to concentrative external concentration polarization (ECP) respectively. The negative exponent is indicative of dilution effect whilst the positive exponent indicate that the effect is concentrative.
It is noteworthy that the expressions in Equations (4) and (5) for concentrative ICP and dilutive ICP are coupled with dilutive ECP and concentrative ECP, respectively. Both the ECP and ICP moduli in the respective phenomena does exhibit limiting effects on the overall osmotic driving force, in which case the limiting effects tend to increase in direct proportion with flux and, consequently, generate a circumstance of self-limiting flux. Hence, indicative that an increase in bulk osmotic force would only produce an attenuated flux increase in the circumstance [90].
5.3.5. Reverse Salt Flux
Diffusion of solutes in FO processes can potentially occur in both directions across a semipermeable membrane depending on the composition of the draw solution and the feed water [92]. The phenomenon of reverse salt flux is said to occur wherein diffusion of solutes takes place from the area of high concentration (draw side of the membrane) to the area of lower concentration (feed side of the membrane). Undoubtedly, this is not often without some knock-on effects in relation to the selection of draw solution for any FO process. As a case in point, the loss of draw solutes may not only lead to decline in osmotic pressure difference across the FO membrane, which could result in reduction in water recovery efficiency, but may also have an impact on the feed solution. This possibly could result in the contamination of the feed, such as in osmotic membrane bioreactors. On the other hand, contamination of the draw solution may also arise from solutes that may foul or scale when the draw solution is recycled [29].
5.4. Draw Solutes Development and Draw Solutions Regeneration
Despite some relatively gained industrial implementations, lack of suitable draw solutes aside the lack of appropriate membrane remains the most critical factors currently negating an effective large-scale process development of the FO technology. The most significant challenge in relation to appropriate DS development stems from their separation and recovery from the product water. This is considering that it is fundamentally important that employed DS recovery processes are desired to be cost effective and less energy intensive in order to maintain some advantages over other known membrane separation process like RO [93]. Since FO itself does not produce fresh water, a second regeneration process is often required to obtain the pure water. DS regeneration is considered as a potentially energy-intensive process, with the energy and cost implication in DS recovery significantly dependent on the as-selected DS [37].
Several recovery methods had over the years been investigated in FO processes notably among which include heat-driven recoveries, pressure-driven recoveries, magnetic recoveries, and recoveries by membrane distillation. Others include recoveries via physical triggers, electrolytic recoveries, and recoveries by precipitation. Thermal recovery is one of the most used methods of solute recovery, as most of the other methods are still under study and have not been implemented at a commercial level. A summary of some of the different DSs and various recovery methods investigated in FO research studies is presented in Table 4.
Thermal recovery, an extensively employed method of recovery in FO systems based on ammonium bicarbonate or sulphur dioxide as draw solutes, is noted to have limitations of high energy requirements, high heat losses and poor water quality [94]. Other widely used recovery methods such as NF and ultrafiltration (UF) with considerable application in FO systems utilizing synthetic and organic draw solutes. Notwithstanding the high effectiveness of NF and UF methods, in terms of recovery, they are said to require electrical energy to operate, and sometimes experience issues of high back diffusion and concentration polarization, which might negate their commercial applicability [68]. Magnetic separation is yet another recovery method under several research studies for implementation in FO systems utilizing MNPs and other multi-functional compounds as draw solutes due to its acclaimed low energy requirement and ease of use. However, the problem of particle aggregation in the use MNPs as DS necessitates a combination of magnetic recovery with a tertiary recovery process(es), which may demand high energy [38]. It is worthy of note to observe however that the energy required in DS regeneration and product water recovery step in FO processes, which is bestowed by the downstream separation techniques, is mundane. Overall, the energy requirement at this stage is surpassing the savings in energy from pumping since the majority of these downstream techniques such as RO, NF, MD, etc., always depend primarily on electricity as the energy source in the circumstance. Thus, it suffices that an FO system incorporating any of these separation processes might not necessarily minimize or lower the energy consumption desired in FO seawater desalination systems [36,45]. Hence, it is of utmost importance to develop an appropriate DS for which the separation and recovery is less energy-intensive and in which the draw solute may be profitably regenerated and reused [40]. Integrating FO systems for seawater desalination with renewable energy has been widely considered as one of the sustainable solutions that might come in handy to help with mitigating the challenge of high-energy intensity, negating seawater desalination systems regardless of the separation method employed. This is considering that renewable energy resources are sustainable and readily availability in nature across different regions of the world, in addition to reducing the carbon footprints of carbon-based fuels.
5.5. Combination of FO with Other Technologies
Renewable energy (RE) technology has been witnessing an increasing drive across board towards harnessing its applicability in powering desalination facilities. Renewable energy comes in different forms, such as solar, wind, or geothermal energy, and can be produced in several ways—each having a distinct requirement for conversion and utilization. RE coupled desalination systems for freshwater production it is reasoned, would be a viable solution that might ameliorate the challenges of high-energy demands required to achieve potable water production from the various desalination systems. Solar energy has been the most tested form of renewable energy for desalination followed by wind energy. Both forms have been extensively coupled with RO process [120]. Other forms of desalination technologies that had been reported to have employed renewable energy include: MSF; MED; ED; and VC [121]. RE coupled FO process could yet offer more energy savings primarily because FO benefits from largely unpressurised fluid transfer across a semipermeable membrane. Hence when couple with RE such energies would only go towards solute recovery, which would result in significant energy savings for FO desalination systems relative to the mainstream technologies such as RO.
Solar Energy Integrated FO Desalination
The use of solar energy for desalination processes appears to be the most promising possibility of achieving a more sustainable desalination system. Being the most abundant form of renewable energy, solar energy is readily available in parts of the world most ravaged by water scarcity. It is reputably more pliant and can be easily transformed into different forms of energy such as electrical, mechanical or the thermic depending on the type of technique employed, to facilitate phase transition mechanisms processes. This, therefore, often makes it a renewable resource of interest for exploitation in desalination systems [122,123,124,125,126,127,128,129,130,131]. Integration of FO with solar energy resources can be a panacea to achieving a more energy efficient FO desalination process when efficiently harnessed. There however appears to be a limited literature on solar energy based FO desalination [120]. Schrier [132] used forward osmosis to examine the production of fuel ethanol from a mixture of ethanol and water solution. The work attempted an evaporative regeneration of the brine draw solution wherein solar energy was collected by a shallow pool of brine, lined with a low-albedo material. It was concluded that the limited solubility of salts to create the draw solution made the scheme infeasible for production of 95% (w/w) ethanol. Elsewhere in Saudi Arabia, a pilot work by Ghaffour et al. [133] to implement an FO seawater water desalination system driven entirely by solar energy was examined. The system was reported to have operated at low temperatures and pressures, and it was concluded that an attainment of a below 2 kWh/m3 energy consumption was feasible. In a related development, a work by Khayet and co-workers [134] investigated the enhancement of a solar-driven FO pilot plant to ensure a high-water production rate with a low reverse solute permeability and reduced energy consumption under varying optimised conditions. They posited that the regeneration of the draw solution can be performed by means of an optimised solar powered RO. with an optimum FO specific performance index range of 25.79 to 0.62 L/g kW h. They concluded that the FO energy consumption is only 14.1% the total energy consumption of the FO/RO plant. Solar energy stored in 500 W capacity batteries was explored by Khaydarov et al. [135] to drive a pilot FO desalination system in a study aimed at achieving a low energy consuming desalination system. The specific power consumption of the desalination process was reported to have been lowered from approximately 5 kWh/m3 for SWRO to a value of less than 1 kWh/m3, and with a product water salinity of 50 mg/l attained from an initial total salt concentration of about 17 g/l. A recent work by Amjad and co-workers [48] utilised some purposely functionalised nanoparticles for direct solar absorptive forward osmosis desalination. The work investigated in a batch mode, the direct solar absorption by a working fluid to produce product water, and attempted the regeneration of the working fluid under solar irradiation. In this study, K/CNF was used as a novel DS dispersed in aqueous solution of tri-ethylene glycol (TEG). The diluted draw solution was re-concentrated by evaporating the water under a sun simulator. These works depict that the integration of solar energy to drive FO desalination processes if properly harnessed, holds the potential that might be a game changer to achieving a much more cost-effective desalination system.
Overall, it is pertinent to note however that despite the drive and ongoing progress in the development of renewable energy resources for implementation in desalination systems, their practical applications are currently still considered relatively unconvincing. Consequently, therefore, this further necessitates a continual reliance on carbon-based fuels to drive water production in desalination systems. This is primarily because, the advanced infrastructure required to harness nearly all forms of renewable energy resources into final use is often cost-prohibitive, and out of reach of many particularly in developing regions of the world where municipal water infrastructure is not well developed [4].
6. Challenges and Future Perspectives in FO Technology for Water Desalination
6.1. Design of Suitable DS
Figure 10 shows the rational design of ideal properties desired in FO draw solutions. The preparation of new functional materials as draw solutes for FO processes is becoming increasingly important given the central role DS plays in these processes. Whilst it is often being expedient to seek out osmotic pressure in appreciation of optimal draw agents, osmotic pressure in itself does not necessarily provide the requisite information with regards to the stability and ability of a draw solution to facilitate mass transfer in FO processes. The chemical potential difference of the functional draw solutes in a solution is the driving force and does thermodynamically provide insight into the predisposition to which a DS might be stable and able to sustainably effectuate mass transfer in FO processes. It may be a note on good practice therefore, to explore chemical potential, implicitly molar free energy as a metric amongst other important parameters in seeking out optimal draw agents for FO processes in future researches. Furthermore, the synthesis and or fabrication of functional materials with the right fusion of thermodynamic properties that may be able to maintain a time resolved non-equilibrium draw solute concentrations during a FO process would be a huge step towards advancing the development of ideal DS for FO. Development of nature or bio inspired materials, as DS, might also be useful.
6.2. Engineered Fabrication of Membrane
Membrane permeability accounts for approximately 15% of the specific energy consumption in most seawater desalination plants, hence the plants are often set up to operate at 13.6 to 20.4 L/m2 h average fluxes to defray fouling potentials and cost of installations [136]. The membrane, as the main site of activity in osmotic separation processes, is usually exposed to the actions of external conditions such as pH, temperature, magnetic fields, and ionic strength of solutions and the likes, often encumbering its performance. Fabrication or modification of high permeability membranes having switchable properties with a focus on achieving a membrane’s ability to reversibly modify itself in response to interfacial activities from any prevailing external conditions is desirable. This might potentially help with mitigating some of the challenges associated with fouling and ICP, which in consequence could significantly improve permeance and cost savings. Overall FO membranes are required to meet certain metrics herein represented in Figure 11.
6.3. Energy Efficiency
There is no gainsaying the fact that FO as an emerging technology is plagued with some attendant challenges that negates its development and applicability as a mainstream desalination technique. The key appeal towards FO technology for seawater desalination is its perceived energy efficiency potentials especially considering that for direct use FO applications, only about 0.25 kWh/m3 amount of energy is utilised [137]. However, where DS recovery and regeneration is required as is the case with seawater desalination, the energetic performance of FO as a supposedly energy efficient desalination technique is seriously questioned. This is because the DS regeneration step involves a combination of more than one process, often with some attendant consequences of increased energy consumption more than the energy applicable for direct use FO processes.
The energy consumption at this stage reputably surpasses 1.56 kWh/m3, the minimum thermodynamic energy of separation for seawater at 50% recovery [45]. For instance, around 2 kWh/m3 of specific energy is contributable by ED for draw solutes recovery of an FO desalination process, energy almost akin to RO [138]. The consequence of potential increased in energy consumption beyond the thermodynamic limit for seawater separation, has considerably reduced FO desalination’s appeal relative to the traditional desalination techniques like RO and the likes [45]. Hence, the continued quest for a sustainable and energy efficient solution for DS regeneration. Magnetic field separation and RE coupled DS separation might offer the potential of achieving a sustainable and energy efficient FO desalination. Neglecting, however, the challenges associated with the conversion, storage and utilization of RE resources coupled with the operations and maintenance issues thereof, with the attendant critical implications on the overall water production would be nothing less than unthinkable. RE coupled FO desalination systems that circumvents the requirement of transformation into electric energy and storage before final use, might hold the ace to achieving minimal cost of product water recovery regardless of the separation mechanism. It offers a good potential of the possibility of achieving a sustainable and considerable reductions in the capital cost of desalination systems operated by renewable energy. It may be useful to explore further research into the application of direct solar energy capture FO desalination.
6.4. Cost Effective Desalination Systems
Whilst the quest to increase global water supply through desalination continues, it is well established that access to clean drinking water by use of the various desalination technologies is not equitably distributed especially in developing countries owing largely to economic factors and water infrastructural deficit. It is critical therefore to explore the development of small-scale water desalination systems and point of entry desalination systems. This offers a good potential that could play an essential role in guaranteeing future clean water supply especially in remote areas of developing countries, where municipal water infrastructure is deficient in today’s increasingly diminishing global freshwater resources.
7. Conclusions
This paper espoused the degree of current global freshwater scarcity challenge and an exposition of the merits of FO as an emerging technique in water desalination as a solution to addressing the challenge of freshwater scarcity. The paper also briefly examined the cost implications of potential DS recoveries applicable to FO hybrid systems, with some applicable suggestions made. Whilst FO hold great potentials that might be harnessed as an alternative seawater desalination technology, its efficacy is constraint by some key drivers impacting its applicability including membrane developments, membrane fouling, concentration polarization, draw solutes development and draw solution recovery, and reverse salt flux. These challenges remained to be overcome, hence eliciting some preoccupying questions whether:
- the development of functional materials with the right mix of properties that maintains and sustains non-equilibrium in solute concentrations as draw solutes in FO processes could offer a solution to the challenges related to ideal DS;
- the challenge of membrane fouling in FO applications could potentially be addressed through fabrication of high permeability switchable membranes;
- research in direct solar FO desalination could potentially offer solution to achieving sustainable energy savings in FO desalination;
- small-scale system and point of entry systems could provide more opportunity to equitably guarantee future clean water supply in a situation of both lack and economic water scarcity.
Future research developments in these areas might potentially offer a huge step towards advancing the development of FO as a mainstream seawater desalination technology.
Author Contributions
Conceptualization, J.G. and A.H.; resources, J.G. and A.A.; writing—original draft preparation, A.A.; writing—review and editing, J.G. and A.H.; supervision, J.G. and A.H.; project administration, A.H.; funding acquisition, A.A. and J.G. All authors have read and agreed to the published version of the manuscript.
Funding
This research was funded by the Petroleum Development Technology Development Fund (PTDF) in Nigeria, grant number PTDF/AAJ/250/17 and the APC was funded by J.G.
Conflicts of Interest
The authors declare no conflict of interest.
References
- Hameeteman, E. Future water. In Security: Facts, Figures and Predictions; Global Water Institute: Columbus, OH, USA, 2013. [Google Scholar]
- American-Membrane-Technology-Association. Water Desalination Processes. 2007. Available online: https://www.amtaorg.com/wp-content/uploads/08_Water_Desalination_Processes.pdf (accessed on 23 November 2019).
- Gao, L.; Yoshikawa, S.; Iseri, Y.; Fujimori, S.; Kanae, S. An economic assessment of the global potential for seawater desalination to 2050. Water 2017, 9, 763. [Google Scholar] [CrossRef]
- Connor, R. The world Water Development Report 2014: Water and Energy; United Nations Educational, Scientific and Cultural Organization: Paris, France, 2014. [Google Scholar]
- Khan, M.; Almesfer, M.; Danish, M.; Ali, I.; Shoukry, H.; Patel, R.; Gardy, J.; Nizami, A.; Rehan, M. Potential of Saudi natural clay as an effective adsorbent in heavy metals removal from wastewater. Desalin. Water Treat. 2019, 158, 140–151. [Google Scholar] [CrossRef]
- Hesas, R.H.; Baei, M.S.; Rostami, H.; Gardy, J.; Hassanpour, A. An investigation on the capability of magnetically separable Fe3O4/mordenite zeolite for refinery oily wastewater purification. J. Environ. Manag. 2019, 241, 525–534. [Google Scholar] [CrossRef] [PubMed]
- United-Nations-World-Water-Assessment-Programme. The United Nations World Water Development Report 2018: Nature-Based Solutions for Water; Connor, R., Ed.; United Nations Educational, Scientific and Cultural Organization: Paris, France, 2018. [Google Scholar]
- Mekonnen, M.M.; Hoekstra, A.Y. Four billion people facing severe water scarcity. Sci. Adv. 2016, 2, e1500323. [Google Scholar] [CrossRef] [Green Version]
- International-Desalination-Association. Desalination and Water Reuse by the Numbers. 2019. Available online: https://idadesal.org/ (accessed on 25 November 2019).
- Jones, E.; Qadir, M.; van Vliet, M.T.H.; Smakhtin, V.; Kang, S.M. The state of desalination and brine production: A global outlook. Sci. Total Environ. 2019, 657, 1343–1356. [Google Scholar] [CrossRef] [PubMed]
- World-Bank. The Role of Desalination in an Increasingly Water-Scarce World; World Bank: Washington, DC, USA, 2019. [Google Scholar]
- Bazargan, A. A Multidisciplinary Introduction to Desalination; Stylus Publishing LLC: Sterling, VA, USA, 2018. [Google Scholar]
- AMTA. Membrane Desalination Power Usage Put in Perspective. 2016. Available online: https://www.amtaorg.com/wp-content/uploads/07_Membrane_Desalination_Power_Usage_Put_In_Perspective.pdf (accessed on 13 November 2019).
- Energy, U.R. Water Desalination Using Renewable Energy; IRENA: Abu Dhabi, UAE, 2012. [Google Scholar]
- Energy-Information-Administration, U.S. International Energy Outlook 2010; Energy Information Administration (eia): Washington, DC, USA, 2011; pp. 1–410.
- Li, Z.; Siddiqi, A.; Anadon, L.D.; Narayanamurti, V. Towards sustainability in water-energy nexus: Ocean energy for seawater desalination. Renew. Sustain. Energy Rev. 2018, 82, 3833–3847. [Google Scholar] [CrossRef] [Green Version]
- Hangzhou-Water. Forward Osmosis Desalination. 2017. Available online: https://www.modernwater.com/desalination-systems/forward-osmosis-desalination (accessed on 23 January 2020).
- Cath, T.Y.; Childress, A.E.; Elimelech, M. Forward osmosis: Principles, applications, and recent developments. J. Membr. Sci. 2006, 281, 70–87. [Google Scholar] [CrossRef]
- Haupt, A.; Lerch, A. Forward osmosis application in manufacturing industries: A short review. Membranes 2018, 8, 47. [Google Scholar] [CrossRef] [Green Version]
- Coday, B.D.; Xu, P.; Beaudry, E.G.; Herron, J.; Lampi, K.; Hancock, N.T.; Cath, T.Y. The sweet spot of forward osmosis: Treatment of produced water, drilling wastewater, and other complex and difficult liquid streams. Desalination 2014, 333, 23–35. [Google Scholar] [CrossRef]
- Tanganov, B.B. About sizes of the hydrated salt ions—The components of sea water. Eur. J. Nat. Hist. 2013, 1, 36–37. [Google Scholar]
- Zhu, H.; Zhang, L.; Wen, X.; Huang, X. Feasibility of applying forward osmosis to the simultaneous thickening, digestion, and direct dewatering of waste activated sludge. Bioresour. Technol. 2012, 113, 207–213. [Google Scholar] [CrossRef] [PubMed]
- Chung, T.S.; Zhang, S.; Wang, K.Y.; Su, J.; Ling, M.M. Forward osmosis processes: Yesterday, today and tomorrow. Desalination 2012, 287, 78–81. [Google Scholar] [CrossRef]
- Lutchmiah, K.; Verliefde, A.R.D.; Roest, K.; Rietveld, L.C.; Cornelissen, E.R. Forward osmosis for application in wastewater treatment: A review. Water Res. 2014, 58, 179–197. [Google Scholar] [PubMed]
- Ang, W.L.; Mohammad, A.W.; Johnson, D.; Hilal, N. Forward osmosis research trends in desalination and wastewater treatment: A review of research trends over the past decade. J. Water Process Eng. 2019, 31, 100886. [Google Scholar] [CrossRef]
- Suwaileh, W.; Pathak, N.; Shon, H.; Hilal, N. Forward osmosis membranes and processes: A comprehensive review of research trends and future outlook. Desalination 2020, 485, 114455. [Google Scholar] [CrossRef]
- Alihemati, Z.; Hashemifard, S.; Matsuura, T.; Ismail, A.; Hilal, N. Current status and challenges of fabricating thin film composite forward osmosis membrane: A comprehensive roadmap. Desalination 2020, 491, 114557. [Google Scholar] [CrossRef]
- Valladares Linares, R.; Li, Z.; Yangali-Quintanilla, V.; Ghaffour, N.; Amy, G.; Leiknes, T.; Vrouwenvelder, J.S. Life cycle cost of a hybrid forward osmosis—Low pressure reverse osmosis system for seawater desalination and wastewater recovery. Water Res. 2016, 88, 225–234. [Google Scholar]
- Nicoll, P. Forward Osmosis—A brief introduction. In Proceedings of the International Desalination Association World Congress on Desalination and Water Reuse, Tianjin, China, 20–25 October 2013. [Google Scholar]
- Modern-Water. Forward Osmosis: Desalination. 2013. Available online: https://www.modernwater.com/pdf/MW_Factsheet_Membrane_HIGHRES.pdf (accessed on 23 August 2019).
- Cuenca, J.C. Report on Water Desalination Status in the Mediterranean Countries; Instituto Murciano de Investigación y Desarrollo Agrario y Alimentario (IMIDA): La Alberca, Spain, 2013. [Google Scholar]
- Kim, T.W.; Kim, Y.; Yun, C.; Jang, H.; Kim, W.; Park, S.J.D. Systematic approach for draw solute selection and optimal system design for forward osmosis desalination. Desalination 2012, 284, 253–260. [Google Scholar] [CrossRef]
- Fritzmann, C.; Löwenberg, J.; Wintgens, T.; Melin, T.J.D. State-of-the-art of reverse osmosis desalination. Desalination 2007, 216, 1–76. [Google Scholar] [CrossRef]
- Borsani, R.; Rebagliati, S.J.D. Fundamentals and costing of MSF desalination plants and comparison with other technologies. Desalination 2005, 182, 29–37. [Google Scholar] [CrossRef]
- Choi, Y.; Cho, H.; Shin, Y.; Jang, Y.; Lee, S.J.M. Economic evaluation of a hybrid desalination system combining forward and reverse osmosis. Membranes 2016, 6, 3. [Google Scholar] [CrossRef] [PubMed] [Green Version]
- Mazlan, N.M.; Peshev, D.; Livingston, A.G.J.D. Energy consumption for desalination—A comparison of forward osmosis with reverse osmosis, and the potential for perfect membranes. Desalination 2016, 377, 138–151. [Google Scholar] [CrossRef] [Green Version]
- Jiao, Y.; Kang, Y.; Yang, C. Osmosis and its Applications; Encyclopedia of Microfluidics and Nanofluidics; Springer: Boston, MA, USA, 2013; pp. 1–14. [Google Scholar]
- Zhao, Q.; Chen, N.; Zhao, D.; Lu, X. Thermoresponsive magnetic nanoparticles for seawater desalination. ACS Appl. Mater. Interfaces 2013, 5, 11453–11461. [Google Scholar] [CrossRef] [PubMed]
- Al-aibi, S.; Mahood, H.B.; Sharif, A.O.; Alpay, E.; Simcoe-Read, H. Evaluation of draw solution effectiveness in a forward osmosis process. Desalin. Water Treat. 2016, 57, 13425–13432. [Google Scholar] [CrossRef]
- Darwish, M.A.; Abdulrahim, H.K.; Hassan, A.S.; Mabrouk, A.A.; Sharif, A.O. The forward osmosis and desalination. Desalin. Water Treat. 2016, 57, 4269–4295. [Google Scholar] [CrossRef]
- Phuntsho, S.; Shon, H.K.; Hong, S.; Lee, S.; Vigneswaran, S. A novel low energy fertilizer driven forward osmosis desalination for direct fertigation: Evaluating the performance of fertilizer draw solutions. J. Membr. Sci. 2011, 375, 172–181. [Google Scholar] [CrossRef]
- Chekli, L.; Phuntsho, S.; Shon, H.K.; Vigneswaran, S.; Kandasamy, J.; Chanan, A. A review of draw solutes in forward osmosis process and their use in modern applications. Desalin. Water Treat. 2012, 43, 167–184. [Google Scholar] [CrossRef]
- Corzo, B.; de la Torre, T.; Sans, C.; Ferrero, E.; Malfeito, J.J. Evaluation of draw solutions and commercially available forward osmosis membrane modules for wastewater reclamation at pilot scale. Chem. Eng. J. 2017, 326, 1–8. [Google Scholar] [CrossRef]
- Achilli, A.; Cath, T.Y.; Childress, A.E. Selection of inorganic-based draw solutions for forward osmosis applications. J. Membr. Sci. 2010, 364, 233–241. [Google Scholar] [CrossRef]
- Shaffer, D.L.; Werber, J.R.; Jaramillo, H.; Lin, S.; Elimelech, M. Forward osmosis: Where are we now? Desalination 2015, 356, 271–284. [Google Scholar] [CrossRef]
- Luo, H.; Wang, Q.; Zhang, T.C.; Tao, T.; Zhou, A.; Chen, L.; Bie, X. A review on the recovery methods of draw solutes in forward osmosis. J. Water Process Eng. 2014, 4, 212–223. [Google Scholar] [CrossRef]
- Yang, Y.; Chen, M.; Zou, S.; Yang, X.; Long, T.E.; He, Z. Efficient recovery of polyelectrolyte draw solutes in forward osmosis towards sustainable water treatment. Desalination 2017, 422, 134–141. [Google Scholar] [CrossRef]
- Amjad, M.; Gardy, J.; Hassanpour, A.; Wen, D. Novel draw solution for forward osmosis based solar desalination. Appl. Energy 2018, 230, 220–231. [Google Scholar] [CrossRef]
- Phuntsho, S.; Sahebi, S.; Majeed, T.; Lotfi, F.; Kim, J.E.; Shon, H.K. Assessing the major factors affecting the performances of forward osmosis and its implications on the desalination process. Chem. Eng. J. 2013, 231, 484–496. [Google Scholar] [CrossRef]
- Alnaizy, R.; Aidan, A.; Qasim, M. Copper sulfate as draw solute in forward osmosis desalination. J. Environ. Chem. Eng. 2013, 1, 424–430. [Google Scholar] [CrossRef]
- Adham, S.; Oppenheimer, J.; Liu, L.; Kumar, M. Dewatering Reverse Osmosis Concentrate from Water Reuse Using forward Osmosis; WateREUES: Alexandria, VA, USA, 2007; pp. 1–52. [Google Scholar]
- Bai, H.; Liu, Z.; Sun, D.D. Highly water soluble and recovered dextran coated Fe3O4 magnetic nanoparticles for brackish water desalination. Sep. Purif. Technol. 2011, 81, 392–399. [Google Scholar] [CrossRef]
- Ge, Q.; Su, J.; Chung, T.S.; Amy, G. Hydrophilic superparamagnetic nanoparticles: Synthesis, characterization, and performance in forward osmosis processes. Ind. Eng. Chem. Res. 2011, 50, 382–388. [Google Scholar] [CrossRef]
- Ling, M.M.; Wang, K.Y.; Chung, T.S. Highly water-soluble magnetic nanoparticles as novel draw solutes in forward osmosis for water reuse. Ind. Eng. Chem. Res. 2010, 49, 5869–5876. [Google Scholar] [CrossRef]
- Ling, M.M.; Chung, T.S. Desalination process using super hydrophilic nanoparticles via forward osmosis integrated with ultrafiltration regeneration. Desalination 2011, 278, 194–202. [Google Scholar] [CrossRef]
- Ling, M.M.; Chung, T.S. Novel dual-stage FO system for sustainable protein enrichment using nanoparticles as intermediate draw solutes. J. Membr. Sci. 2011, 372, 201–209. [Google Scholar] [CrossRef]
- Li, D.; Zhang, X.; Yao, J.; Simon, G.P.; Wang, H. Stimuli-responsive polymer hydrogels as a new class of draw agent for forward osmosis desalination. Chem. Commun. 2011, 47, 1710–1712. [Google Scholar] [CrossRef] [PubMed]
- Stone, M.L.; Rae, C.; Stewart, F.F.; Wilson, A.D. Switchable polarity solvents as draw solutes for forward osmosis. Desalination 2013, 312, 124–129. [Google Scholar] [CrossRef]
- Li, L.; Shi, W.; Yu, S. Research on forward osmosis membrane technology still needs improvement in water recovery and wastewater treatment. Water 2020, 12, 107. [Google Scholar] [CrossRef] [Green Version]
- Porifera. Technology. A Powerful Pairing of Forward Osmosis and Unique Draw Regeneration Solutions for Optimal Concentration and Purification. pp. 179–181. Available online: http://www.porifera.com/technology (accessed on 18 March 2020).
- TIDAL™. TIDAL™ Forward Osmosis. 2020. Available online: https://www.kochmembrane.com/en-US/products/spiral-membranes/TIDAL-Forward-Osmosis (accessed on 18 March 2020).
- Im, S.J.; Choi, J.; Jeong, S.; Jang, A. New concept of pump-less forward osmosis (FO) and low-pressure membrane (LPM) process. Sci. Rep. 2017, 7, 1–6. [Google Scholar] [CrossRef] [PubMed] [Green Version]
- Goh, P.S.; Ismail, A.F.; Ng, B.C.; Abdullah, M.S. Recent progresses of forward osmosis membranes formulation and design for wastewater treatment. Water 2019, 11, 2043. [Google Scholar] [CrossRef] [Green Version]
- Hydroxsys. Revolutionising Global Filtration Technology. Available online: https://www.hydroxsys.com/ (accessed on 18 March 2020).
- Xu, W.; Chen, Q.; Ge, Q. Recent advances in forward osmosis (FO) membrane: Chemical modifications on membranes for FO processes. Desalination 2017, 419, 101–116. [Google Scholar] [CrossRef]
- Sreedhar, I.; Khaitan, S.; Gupta, R.; Reddy, B.M.; Venugopal, A. An odyssey of process and engineering trends in forward osmosis. Environ. Sci. Water Res. Technol. 2018, 4, 129–168. [Google Scholar] [CrossRef]
- Ong, R.C.; Chung, T.S.; Helmer, B.J.; de Wit, J.S. Novel cellulose esters for forward osmosis membranes. Ind. Eng. Chem. Res. 2012, 51, 16135–16145. [Google Scholar] [CrossRef]
- Zhao, S.; Zou, L.; Mulcahy, D. Brackish water desalination by a hybrid forward osmosis–nanofiltration system using divalent draw solute. Desalination 2012, 284, 175–181. [Google Scholar] [CrossRef]
- Wang, Y.N.; Goh, K.; Li, X.; Setiawan, L.; Wang, R. Membranes and processes for forward osmosis-based desalination: Recent advances and future prospects. Desalination 2018, 434, 81–99. [Google Scholar] [CrossRef]
- Yang, E.; Chae, K.J.; Kim, I.S. Biotechnology. Comparison of different semipermeable membranes for power generation and water flux in osmotic microbial fuel cells. J. Chem. Technol. 2016, 91, 2305–2312. [Google Scholar]
- Chan, E.; Young, A.; Lee, J.H.; Stafford, C. Swelling of Ultrathin Molecular Layer-by-Layer Polyamide Water Desalination Membranes. J. Polym. Sci., Part B: Polym. Phys. 2013, 51. [Google Scholar] [CrossRef]
- Ren, J.; McCutcheon, J.R. A new commercial thin film composite membrane for forward osmosis. J. Desalination. 2014, 343, 187–193. [Google Scholar] [CrossRef]
- Li, J.; Wei, M.; Wang, Y. Substrate matters: The influences of substrate layers on the performances of thin-film composite reverse osmosis membranes. Chin. J. Chem. Eng. 2017, 25, 1676–1684. [Google Scholar] [CrossRef]
- Blandin, G.; Vervoort, H.; Le-Clech, P.; Verliefde, A.R.D. Fouling and cleaning of high permeability forward osmosis membranes. J. Water Process Eng. 2016, 9, 161–169. [Google Scholar] [CrossRef]
- Chen, G.; Wang, Z.; Nghiem, L.D.; Li, X.M.; Xie, M.; Zhao, B.; Zhang, M.; Song, J.; He, T. Treatment of shale gas drilling flowback fluids (SGDFs) by forward osmosis: Membrane fouling and mitigation. Desalination 2015, 366, 113–120. [Google Scholar] [CrossRef] [Green Version]
- Duong, P.H.H.; Chung, T.S. Application of thin film composite membranes with forward osmosis technology for the separation of emulsified oil–water. J. Membr. Sci. 2014, 452, 117–126. [Google Scholar] [CrossRef]
- Boretti, A.; Al-Zubaidy, S.; Vaclavikova, M.; Al-Abri, M.; Castelletto, S.; Mikhalovsky, S. Outlook for graphene-based desalination membranes. NPJ Clean Water 2018, 1, 5. [Google Scholar] [CrossRef]
- Liu, G.; Jin, W.; Xu, N. Graphene-based membranes. Chem. Soc. Rev. 2015, 44, 5016–5030. [Google Scholar] [CrossRef]
- Brodie, B.C., XIII. On the atomic weight of graphite. Philos. Trans. R. Soc. Lond. Ser. A 1859, 149, 249–259. [Google Scholar]
- Hummers, W.S.O.; Richard, E. Preparation of graphitic oxide. J. Am. Chem. Soc. 1958, 80, 1339. [Google Scholar] [CrossRef]
- Ali, W. Advances in forward osmosis membranes: Altering the sub-layer structure via recent fabrication and chemical modification approaches. Desalination 2018, 436, 176–201. [Google Scholar]
- Yadav, S.; Saleem, H.; Ibrar, I.; Naji, O.; Hawari, A.A.; Alanezi, A.A.; Zaidi, S.J.; Altaee, A.; Zhou, J. Recent developments in forward osmosis membranes using carbon-based nanomaterials. Desalination 2020, 482, 114375. [Google Scholar] [CrossRef]
- Choi, H.G.; Shah, A.; Nam, S.E.; Park, Y.I.; Park, H. Thin-film composite membranes comprising ultrathin hydrophilic polydopamine interlayer with graphene oxide for forward osmosis. Desalination 2018, 449, 41–49. [Google Scholar] [CrossRef]
- Zhao, Y.J.; Wu, K.F.; Wang, Z.J.; Zhao, L.; Li, S.S. Fouling and cleaning of membrane—A literature review. J. Water Process Eng. 2000, 12, 241–251. [Google Scholar]
- Li, L.; Liu, X.P.; Li, H.Q. A review of forward osmosis membrane fouling: Types, research methods and future prospects. Environ. Technol. Rev. 2017, 6, 26–46. [Google Scholar] [CrossRef]
- Lee, W.J.; Ng, Z.C.; Hubadillah, S.K.; Goh, P.S.; Lau, W.J.; Othman, M.H.D.; Ismail, A.F.; Hilal, N. Fouling mitigation in forward osmosis and membrane distillation for desalination. Desalination 2020, 480, 114338. [Google Scholar] [CrossRef]
- Yadav, S.; Ibrar, I.; Bakly, S.; Khanafer, D.; Altaee, A.; Padmanaban, V.C.; Samal, A.K.; Hawari, A.H. Organic Fouling in Forward Osmosis: A Comprehensive Review. Water 2020, 12, 1505. [Google Scholar] [CrossRef]
- Lotfi, F.; Samali, B.; Hagare, D. Cleaning efficiency of the fouled forward osmosis membranes under different experimental conditions. J. Environ. Chem. Eng. 2018, 6, 4555–4563. [Google Scholar] [CrossRef]
- Semiat, R.; Sapoznik, J.; Hasson, D. Energy aspects in osmotic processes. Desalin. Water Treat. 2010, 15, 228–235. [Google Scholar] [CrossRef]
- McCutcheon, J.R.; Elimelech, M. Influence of concentrative and dilutive internal concentration polarization on flux behavior in forward osmosis. J. Membr. Sci. 2006, 284, 237–247. [Google Scholar] [CrossRef]
- Zhao, S.; Zou, L. Relating solution physicochemical properties to internal concentration polarization in forward osmosis. J. Membr. Sci. 2011, 379, 459–467. [Google Scholar] [CrossRef]
- Hancock, N.T.; Cath, T.Y. Solute coupled diffusion in osmotically driven membrane processes. Environ. Sci. Technol. 2009, 43, 6769–6775. [Google Scholar] [CrossRef] [PubMed]
- Shon, H.K.; Phuntsho, S.; Zhang, T.C.; Surampalli, R.Y. Forward Osmosis: Fundamentals and Applications. 2015. Available online: http://ascelibrary.org/doi/book/10.1061/9780784414071 (accessed on 18 March 2020).
- Alejo, T.; Arruebo, M.; Carcelen, V.; Monsalvo, V.M.; Sebastian, V. Advances in draw solutes for forward osmosis: Hybrid organic-inorganic nanoparticles and conventional solutes. Chem. Eng. J. 2017, 309, 738–752. [Google Scholar] [CrossRef]
- Lutchmiah, K.; Lauber, L.; Roest, K.; Harmsen, D.J.H.; Post, J.W.; Rietveld, L.C.; van Lier, J.B.; Cornelissen, E.R. Zwitterions as alternative draw solutions in forward osmosis for application in wastewater reclamation. J. Membr. Sci. 2014, 460, 82–90. [Google Scholar] [CrossRef]
- Hau, N.T.; Chen, S.S.; Nguyen, N.C.; Huang, K.Z.; Ngo, H.H.; Guo, W. Exploration of EDTA sodium salt as novel draw solution in forward osmosis process for dewatering of high nutrient sludge. J. Membr. Sci. 2014, 455, 305–311. [Google Scholar] [CrossRef]
- Petrotos, K.B.; Quantick, P.; Petropakis, H. A study of the direct osmotic concentration of tomato juice in tubular membrane—module configuration. I. The effect of certain basic process parameters on the process performance. J. Membr. Sci. 1998, 150, 99–110. [Google Scholar] [CrossRef]
- Ng, H.; Tang, W. Forward (Direct) Osmosis: A Novel and Prospective Process for Brine Control. Proc. Water Environ. Fed. 2006, 2006, 4345–4352. [Google Scholar] [CrossRef]
- Ng, H.Y.; Tang, W.; Wong, W.S. Performance of Forward (Direct) Osmosis Process: Membrane Structure and Transport Phenomenon. Environ. Sci. Technol. 2006, 40, 2408–2413. [Google Scholar] [CrossRef]
- Yaeli, J. Method and Apparatus for Processing Liquid Solutions of Suspensions Particularly Useful in the Desalination of Saline Water. U.S. Patent US5098575A, 24 March 1992. [Google Scholar]
- Kravath, R.E.D.; Joanna, A. Desalination of sea water by direct osmosis. Desalination 1975, 16, 151–155. [Google Scholar] [CrossRef]
- Su, J.; Chung, T.S.; Helmer, B.J.; de Wit, J.S. Enhanced double-skinned FO membranes with inner dense layer for wastewater treatment and macromolecule recycle using Sucrose as draw solute. J. Membr. Sci. 2012, 396, 92–100. [Google Scholar] [CrossRef]
- McCormick, P.; Pellegrino, J.; Mantovani, F.; Sarti, G. Water, salt, and ethanol diffusion through membranes for water recovery by forward (direct) osmosis processes. J. Membr. Sci. 2008, 325, 467–478. [Google Scholar] [CrossRef]
- Bowden, K.S.; Achilli, A.; Childress, A.E. Organic ionic salt draw solutions for osmotic membrane bioreactors. Bioresour. Technol. 2012, 122, 207–216. [Google Scholar] [CrossRef]
- McCutcheon, J.R.; McGinnis, R.L.; Elimelech, M. A novel ammonia—carbon dioxide forward (direct) osmosis desalination process. Desalination 2005, 174, 1–11. [Google Scholar] [CrossRef]
- McCutcheon, J.R.; McGinnis, R.L.; Elimelech, M. Desalination by ammonia–carbon dioxide forward osmosis: Influence of draw and feed solution concentrations on process performance. J. Membr. Sci. 2006, 278, 114–123. [Google Scholar] [CrossRef]
- Bachelder, G.W. Process for the Demineralization of Water. U.S. Patent US3171799A, 6 March 1965. [Google Scholar]
- Wallace, M.; Cui, Z.; Hankins, N.P. A thermodynamic benchmark for assessing an emergency drinking water device based on forward osmosis. Desalination 2008, 227, 34–45. [Google Scholar] [CrossRef]
- Achilli, A.; Cath, T.Y.; Marchand, E.A.; Childress, A.E. The forward osmosis membrane bioreactor: A low fouling alternative to MBR processes. Desalination 2009, 239, 10–21. [Google Scholar] [CrossRef]
- Garcia-Castello, E.M.; McCutcheon, J.R.; Elimelech, M. Performance evaluation of sucrose concentration using forward osmosis. J. Membr. Sci. 2009, 338, 61–66. [Google Scholar] [CrossRef]
- Zou, S.; Gu, Y.; Xiao, D.; Tang, C.Y. The role of physical and chemical parameters on forward osmosis membrane fouling during algae separation. J. Membr. Sci. 2011, 366, 356–362. [Google Scholar] [CrossRef]
- Yen, S.K.; Haja N, F.M.; Su, M.; Wang, K.Y.; Chung, T.S. Study of draw solutes using 2-methylimidazole-based compounds in forward osmosis. J. Membr. Sci. 2010, 364, 242–252. [Google Scholar] [CrossRef]
- Ge, Q.; Wang, P.; Wan, C.; Chung, T.S. Polyelectrolyte-promoted forward osmosis–membrane distillation (fo–md) hybrid process for dye wastewater treatment. Environ. Sci. Technol. 2012, 46, 6236–6243. [Google Scholar] [CrossRef] [PubMed]
- Ou, R.; Wang, Y.; Wang, H.; Xu, T. Thermo-sensitive polyelectrolytes as draw solutions in forward osmosis process. Desalination 2013, 318, 48–55. [Google Scholar] [CrossRef]
- Li, D.; Zhang, X.; Simon, G.P.; Wang, H. Forward osmosis desalination using polymer hydrogels as a draw agent: Influence of draw agent, feed solution and membrane on process performance. Water Res. 2013, 47, 209–215. [Google Scholar] [PubMed] [Green Version]
- Noh, M.; Mok, Y.; Lee, S.; Kim, H.; Lee, S.H.; Jin, G.W.; Seo, J.H.; Koo, H.; Park, T.H.; Lee, Y. Novel lower critical solution temperature phase transition materials effectively control osmosis by mild temperature changes. Chem. Commun. 2012, 48, 3845–3847. [Google Scholar] [CrossRef] [PubMed]
- Gadelha, G.; Hankins, N. Assessment of Draw-Solution Performance in Combination with Asymmetric Membranes for Forward Osmosis; Elsevier: Amsterdam, The Netherlands, 2011. [Google Scholar]
- Stone, M.L.; Wilson, A.D.; Harrup, M.K.; Stewart, F.F. An initial study of hexavalent phosphazene salts as draw solutes in forward osmosis. Desalination 2013, 312, 130–136. [Google Scholar] [CrossRef]
- Zeng, Y.; Qiu, L.; Wang, K.; Yao, J.; Li, D.; Simon, G.P.; Wang, R.; Wang, H. Significantly enhanced water flux in forward osmosis desalination with polymer-graphene composite hydrogels as a draw agent. RSC Adv. 2013, 3, 887–894. [Google Scholar] [CrossRef]
- Ali, A.; Tufa, R.A.; Macedonio, F.; Curcio, E.; Drioli, E. Membrane technology in renewable-energy-driven desalination. Renew. Sustain. Energy Rev. 2018, 81, 1–21. [Google Scholar] [CrossRef]
- Al-Qaraghuli, A.; Kazmerski, L.L. Comparisons of technical and economic performance of the main desalination processes with and without renewable energy coupling. In Proceedings of the World Renewable Energy Forum, Denver, CO, USA, 13–17 May 2012; Boulder, C.O., Ed.; American Solar Energy Society (ASES), National Renewable Energy Lab. (NREL): Golden, CO, USA, 2012. [Google Scholar]
- Mahmoud, A.; Fath, H.; Ahmed, M. Enhancing the performance of a solar driven hybrid solar still/humidification-dehumidification desalination system integrated with solar concentrator and photovoltaic panels. Desalination 2018, 430, 165–179. [Google Scholar] [CrossRef]
- Arunkumar, T.; Jayaprakash, R.; Denkenberger, D.; Ahsan, A.; Okundamiya, M.S.; Kumar, S.; Tanaka, H.; Aybar, H.Ş. An experimental study on a hemispherical solar still. Desalination 2012, 286, 342–348. [Google Scholar] [CrossRef]
- Chen, T.C.; Ho, C.D. Immediate assisted solar direct contact membrane distillation in saline water desalination. J. Membr. Sci. 2010, 358, 122–130. [Google Scholar] [CrossRef]
- Frantz, C.; Seifert, B. Thermal analysis of a multi effect distillation plant powered by a solar tower plant. Energy Procedia 2015, 69, 1928–1937. [Google Scholar] [CrossRef] [Green Version]
- Banat, F.; Jumah, R.; Garaibeh, M. Exploitation of solar energy collected by solar stills for desalination by membrane distillation. Renew. Energy 2002, 25, 293–305. [Google Scholar] [CrossRef]
- Darawsheh, I.; Islam, M.D.; Banat, F. Experimental characterization of a solar powered MSF desalination process performance. Therm. Sci. Eng. Prog. 2019, 10, 154–162. [Google Scholar] [CrossRef]
- Omara, Z.M.; Eltawil, M.A.; ElNashar, E.A. A new hybrid desalination system using wicks/solar still and evacuated solar water heater. Desalination 2013, 325, 56–64. [Google Scholar] [CrossRef]
- Salcedo, R.; Antipova, E.; Boer, D.; Jiménez, L.; Guillén-Gosálbez, G. Multi-objective optimization of solar Rankine cycles coupled with reverse osmosis desalination considering economic and life cycle environmental concerns. Desalination 2012, 286, 358–371. [Google Scholar] [CrossRef]
- Kershman, S.A.; Rheinländer, J.; Gabler, H. Seawater reverse osmosis powered from renewable energy sources—Hybrid wind/photovoltaic/grid power supply for small-scale desalination in Libya. Desalination 2003, 153, 17–23. [Google Scholar] [CrossRef]
- Shaobo, H.; Zhang, Z.; Huang, Z.; Xie, A. Performance optimization of solar multi-stage flash desalination process using Pinch technology. Desalination 2008, 220, 524–530. [Google Scholar] [CrossRef]
- Schrier, J. Ethanol concentration by forward osmosis with solar-regenerated draw solution. Sol. Energy 2012, 86, 1351–1358. [Google Scholar] [CrossRef]
- Ghaffour, N.; Lattemann, S.; Missimer, T.; Ng, K.C.; Sinha, S.; Amy, G. Renewable energy-driven innovative energy-efficient desalination technologies. Appl. Energy 2014, 136, 1155–1165. [Google Scholar] [CrossRef] [Green Version]
- Khayet, M.; Sanmartino, J.A.; Essalhi, M.; García-Payo, M.C.; Hilal, N. Modeling and optimization of a solar forward osmosis pilot plant by response surface methodology. Sol. Energy 2016, 137, 290–302. [Google Scholar] [CrossRef] [Green Version]
- Khaydarov, R.A.; Khaydarov, R.R. Solar powered direct osmosis desalination. Desalination 2007, 217, 225–232. [Google Scholar] [CrossRef]
- Shrivastava, A.; Rosenberg, S.; Peery, M. Energy efficiency breakdown of reverse osmosis and its implications on future innovation roadmap for desalination. Desalination 2015, 368, 181–192. [Google Scholar] [CrossRef]
- Altaee, A.; Alanezi, A.A.; Hawari, A.H. 2—Forward osmosis feasibility and potential future application for desalination. In Emerging Technologies for Sustainable Desalination Handbook; Gude, V.G., Ed.; Butterworth-Heinemann: Waltham, MA, USA, 2018; pp. 35–54. [Google Scholar]
- Zhao, N.; Wang, H.; He, Z.; Yan, Q. Ammonia removal and recovery from diluted forward osmosis draw solution by using a tubular microbial desalination cell. Environ. Sci. Water Res. Technol. 2019, 5, 224–230. [Google Scholar] [CrossRef]
Figure 1.
Global desalination growth, 1960–2020. Reprinted figure with permission from [10]. Copyright (2019) Elsevier.
Figure 1.
Global desalination growth, 1960–2020. Reprinted figure with permission from [10]. Copyright (2019) Elsevier.

Figure 2.
The shares of desalination methods in installed capacity. Reprinted figure with permission from [16]. Copyright (2018) Elsevier.
Figure 2.
The shares of desalination methods in installed capacity. Reprinted figure with permission from [16]. Copyright (2018) Elsevier.

Figure 3.
A schematic of the forward osmosis (FO) process.

Figure 4.
Growth trend of FO publication (1992–2020).

Figure 5.
Percentage of FO publication per article type (1992–2020).

Figure 6.
SEM images of surface active side (a) CTA non-woven (NW), (b) CTA embedded support (ES,) and (c) Polyamide (PA) surface support layer (d) CTA NW, (e) CTA ES, and (f) PA, cross section (g) CTA NW, (h) CTA ES, and (i) PA. Reprinted figure with permission from [70]. Copyright (2016) Wiley.
Figure 6.
SEM images of surface active side (a) CTA non-woven (NW), (b) CTA embedded support (ES,) and (c) Polyamide (PA) surface support layer (d) CTA NW, (e) CTA ES, and (f) PA, cross section (g) CTA NW, (h) CTA ES, and (i) PA. Reprinted figure with permission from [70]. Copyright (2016) Wiley.

Figure 7.
SEM images for top surface (a–c); SEM images for bottom surface (d–f), and Cross–sectional SEM images (g–j) of TFC membrane at different magnifications with dotted boxes showing the zoomed sections. Reprinted figure with permission from [72]. Copyright (2014) Elsevier.
Figure 7.
SEM images for top surface (a–c); SEM images for bottom surface (d–f), and Cross–sectional SEM images (g–j) of TFC membrane at different magnifications with dotted boxes showing the zoomed sections. Reprinted figure with permission from [72]. Copyright (2014) Elsevier.

Figure 8.
SEM images of surface structures of polysulfone (PSf) support layer membranes with polydopamine/graphene oxide (PDA/GO) interlayer at different concentrations of GO/water solution: (a) PSf support layer, (b) PSf support layer with PDA, (c) PSf support layer with PDA and 0.25 g/L GO, (d) PSf support layer with PDA and 0.4 g/L GO, (e) PSf support layer with PDA and 0.5 g/L GO, (f) PSf support layer with PDA, (g) schematic illustration for fabrication of thin-film composite (TFC) membrane with polydopamine/graphene oxide (PDA/GO) interlayer and 0.87 g/L GO. Reprinted figure with permission from [83]. Copyright (2019) Elsevier.


Figure 9.
Dilutive and concentration internal polarisation concentration. Reprinted figure with permission from [91]. Copyright (2019) Elsevier.
Figure 9.
Dilutive and concentration internal polarisation concentration. Reprinted figure with permission from [91]. Copyright (2019) Elsevier.

Figure 10.
Rational design idea of draw solutions for FO processes.

Figure 11.
(a) Key design criteria for FO membranes and (b) key desired characteristics of membrane modules.
Figure 11.
(a) Key design criteria for FO membranes and (b) key desired characteristics of membrane modules.


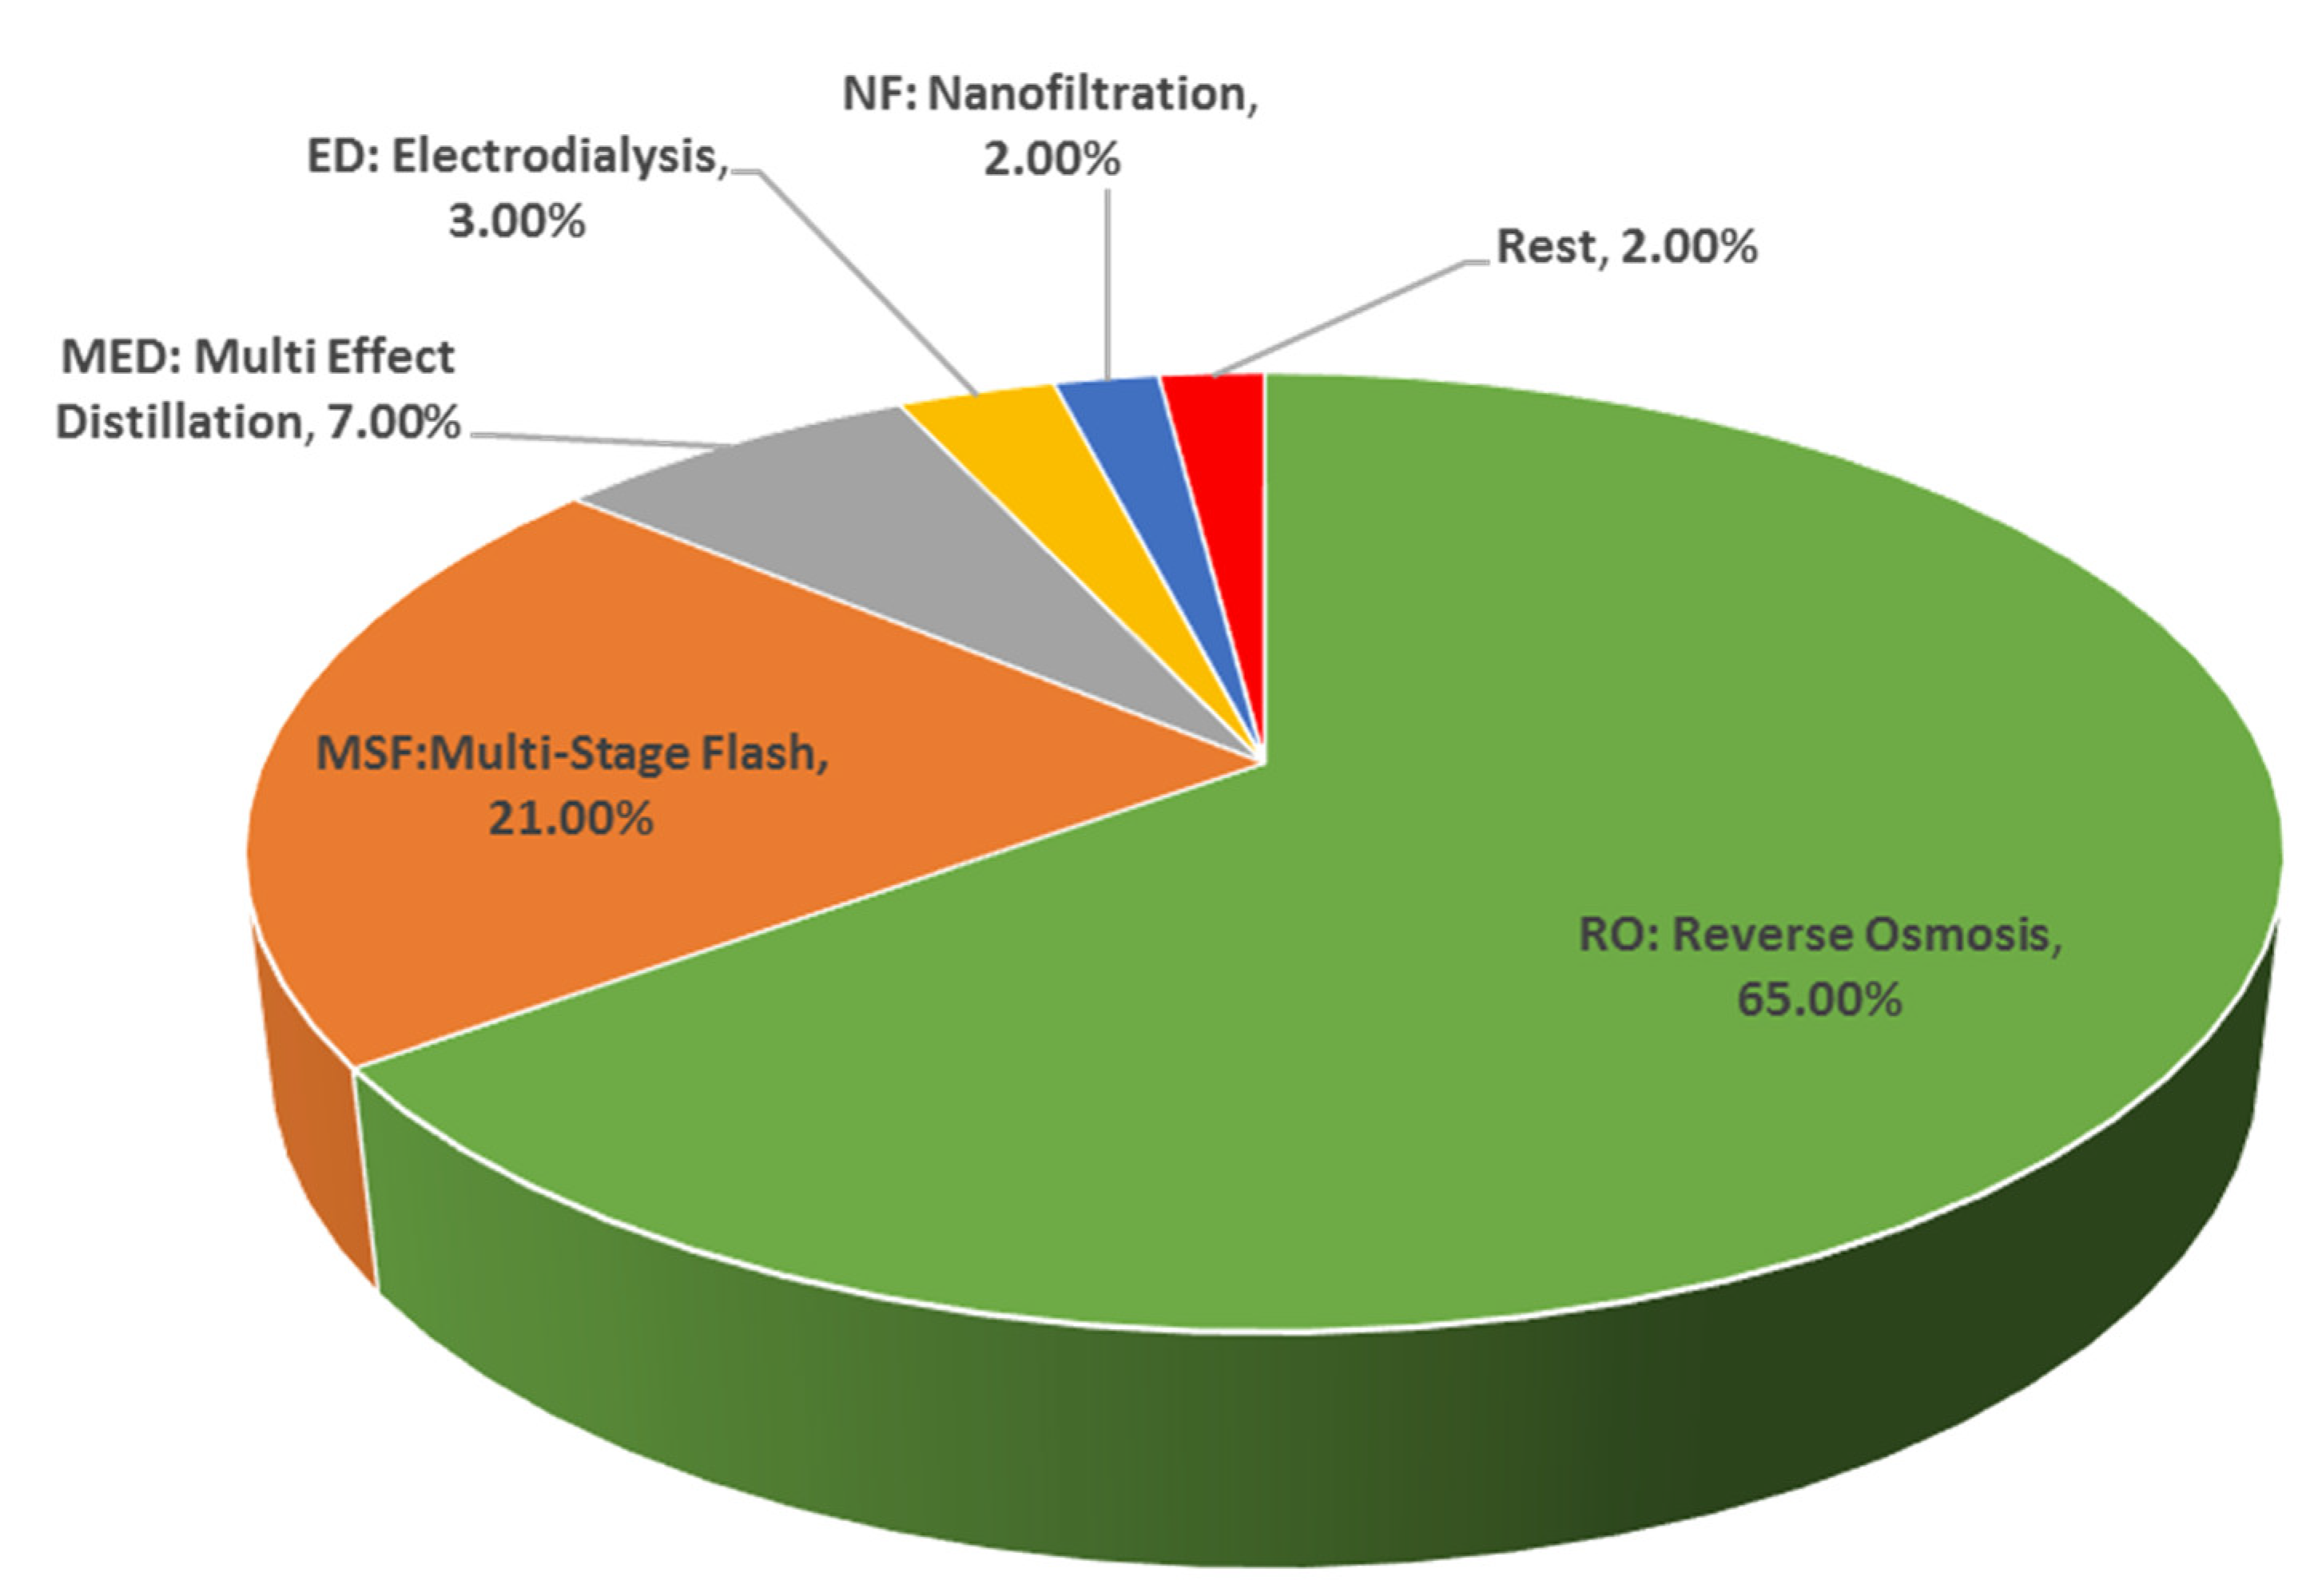
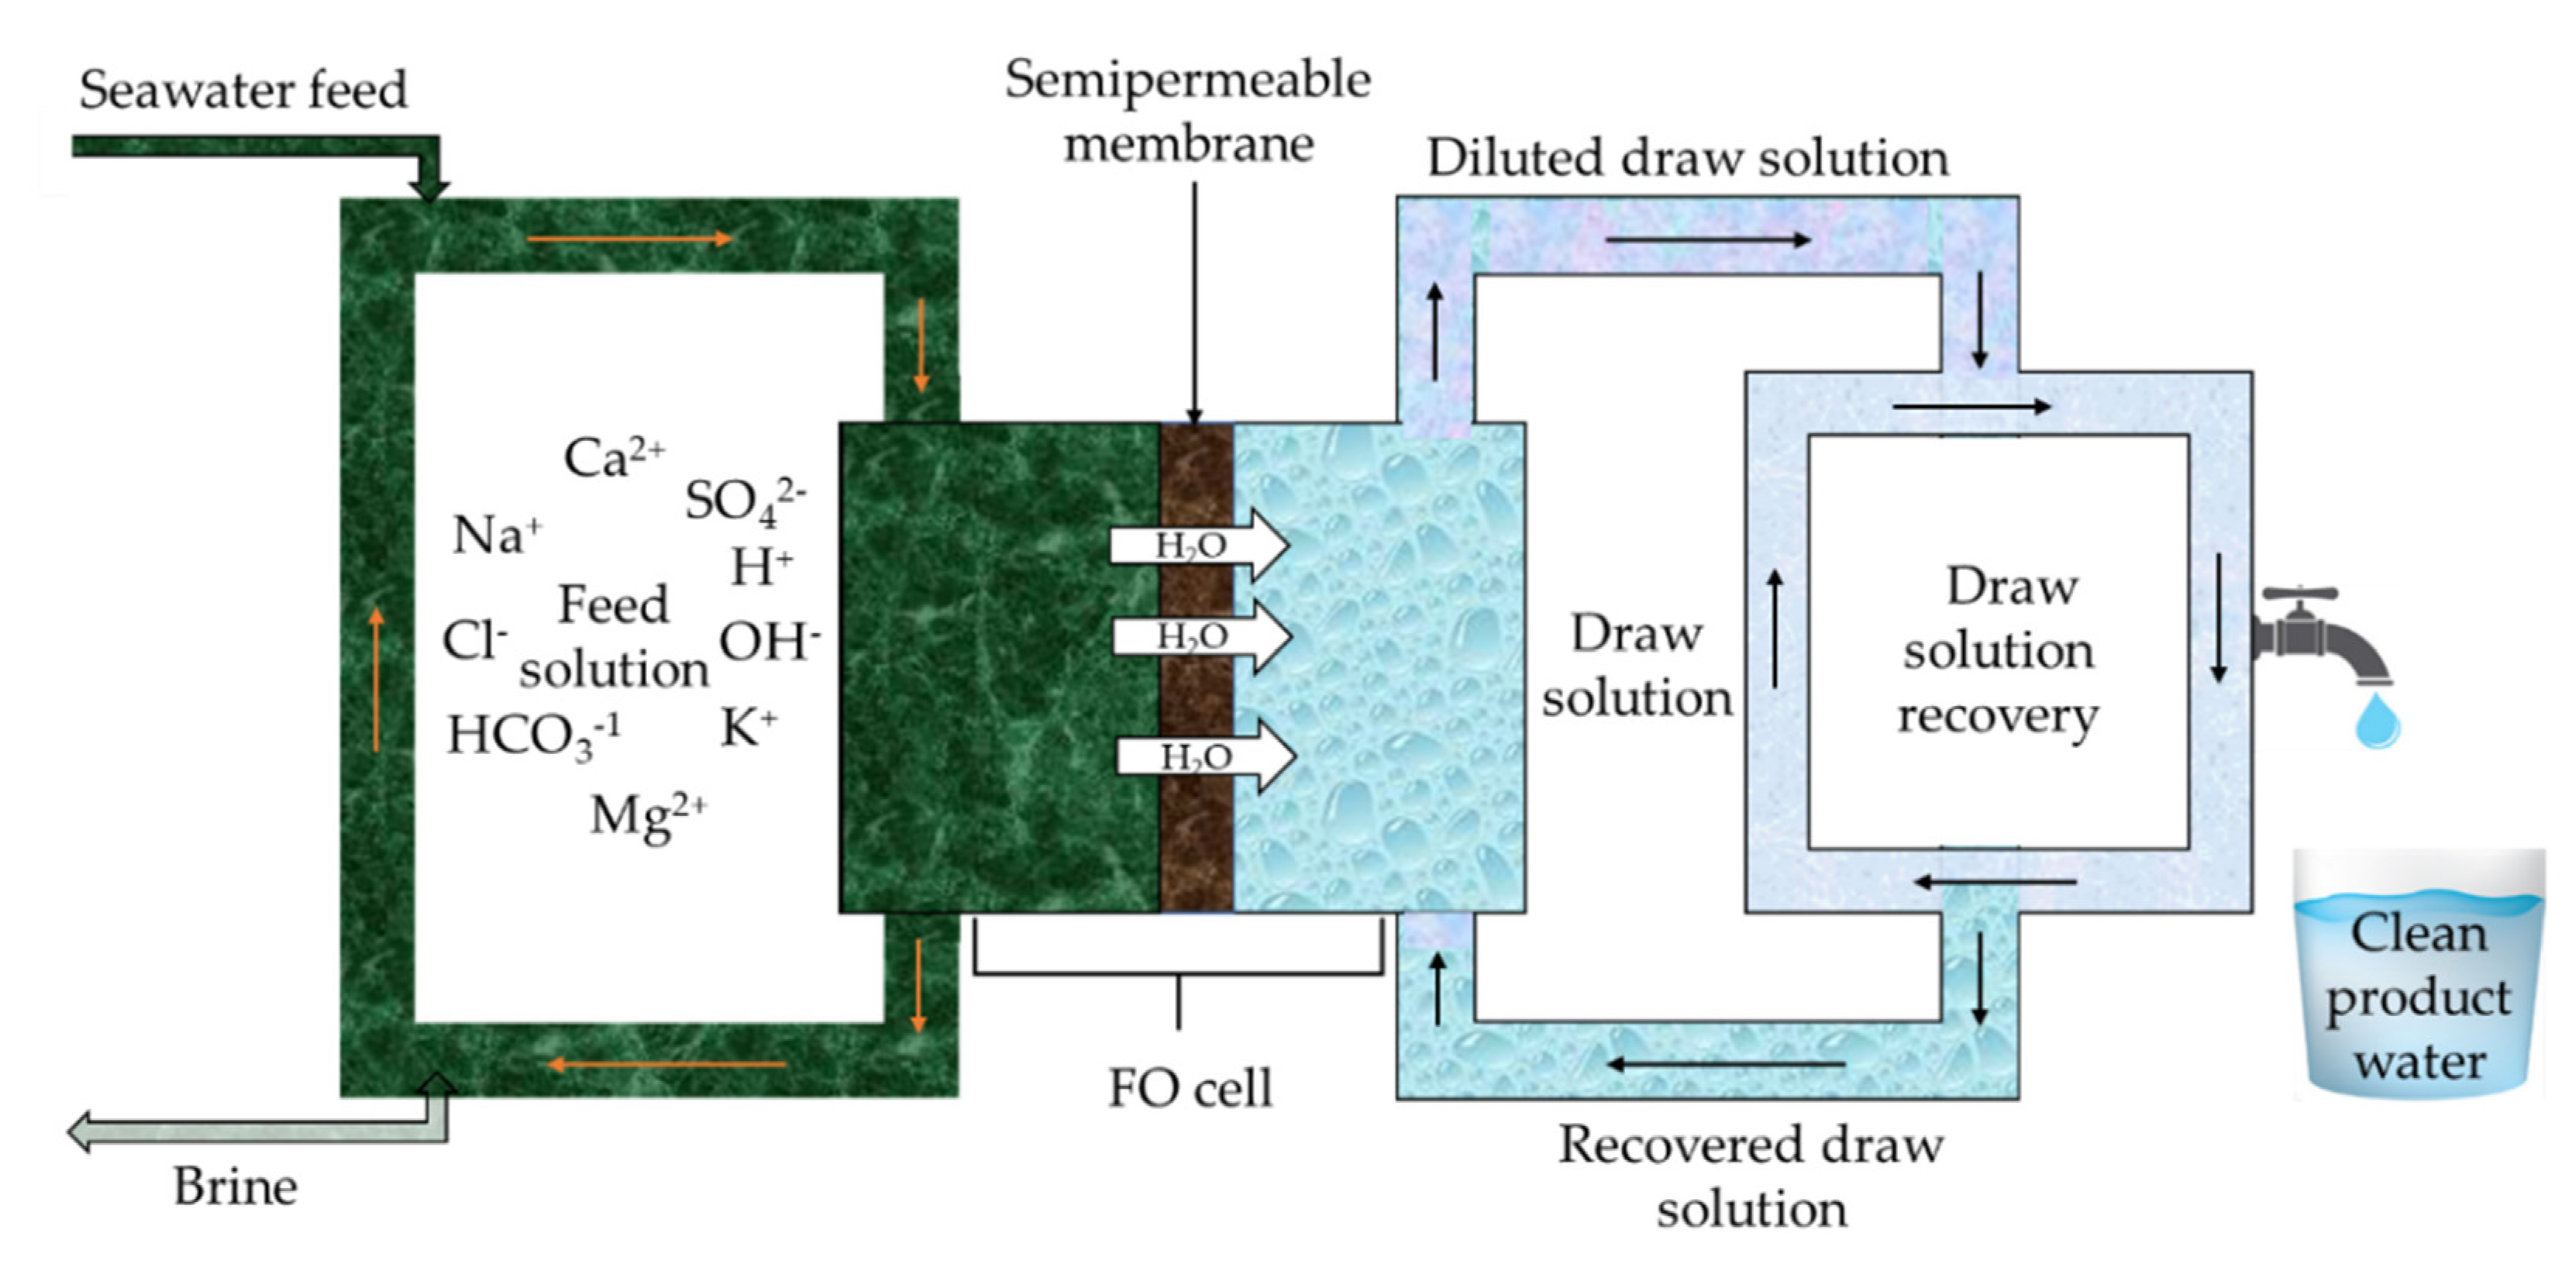
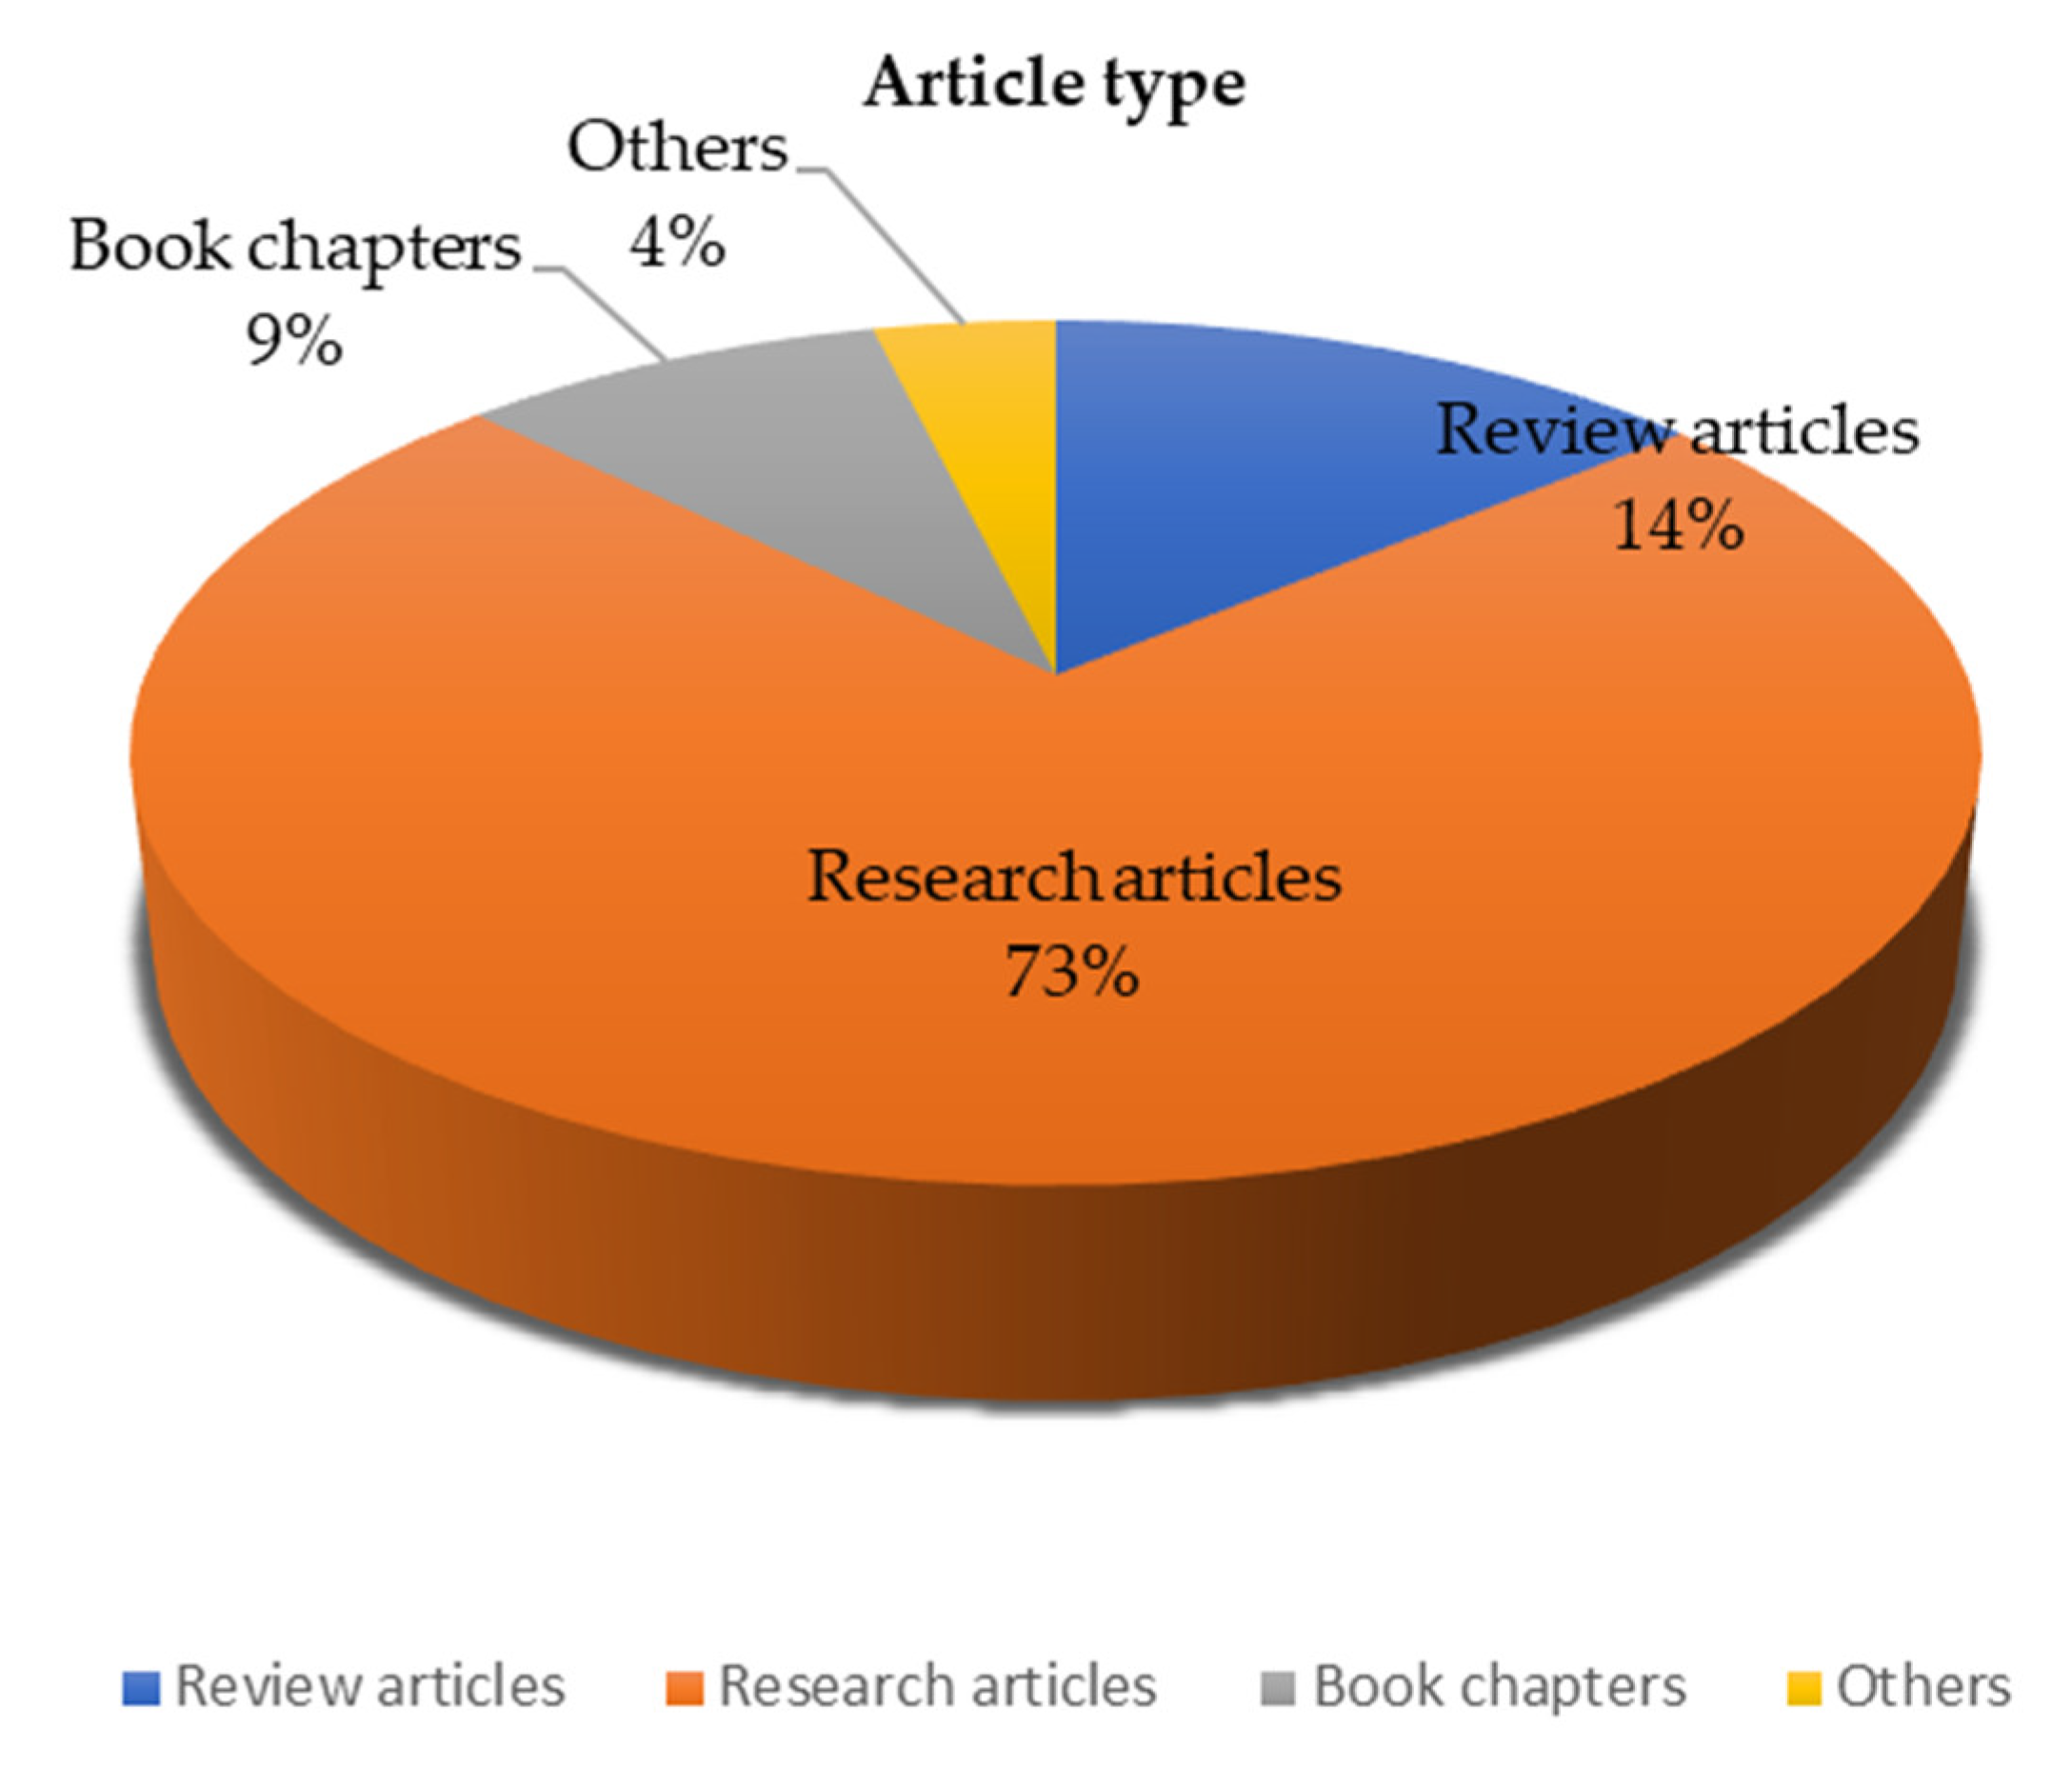
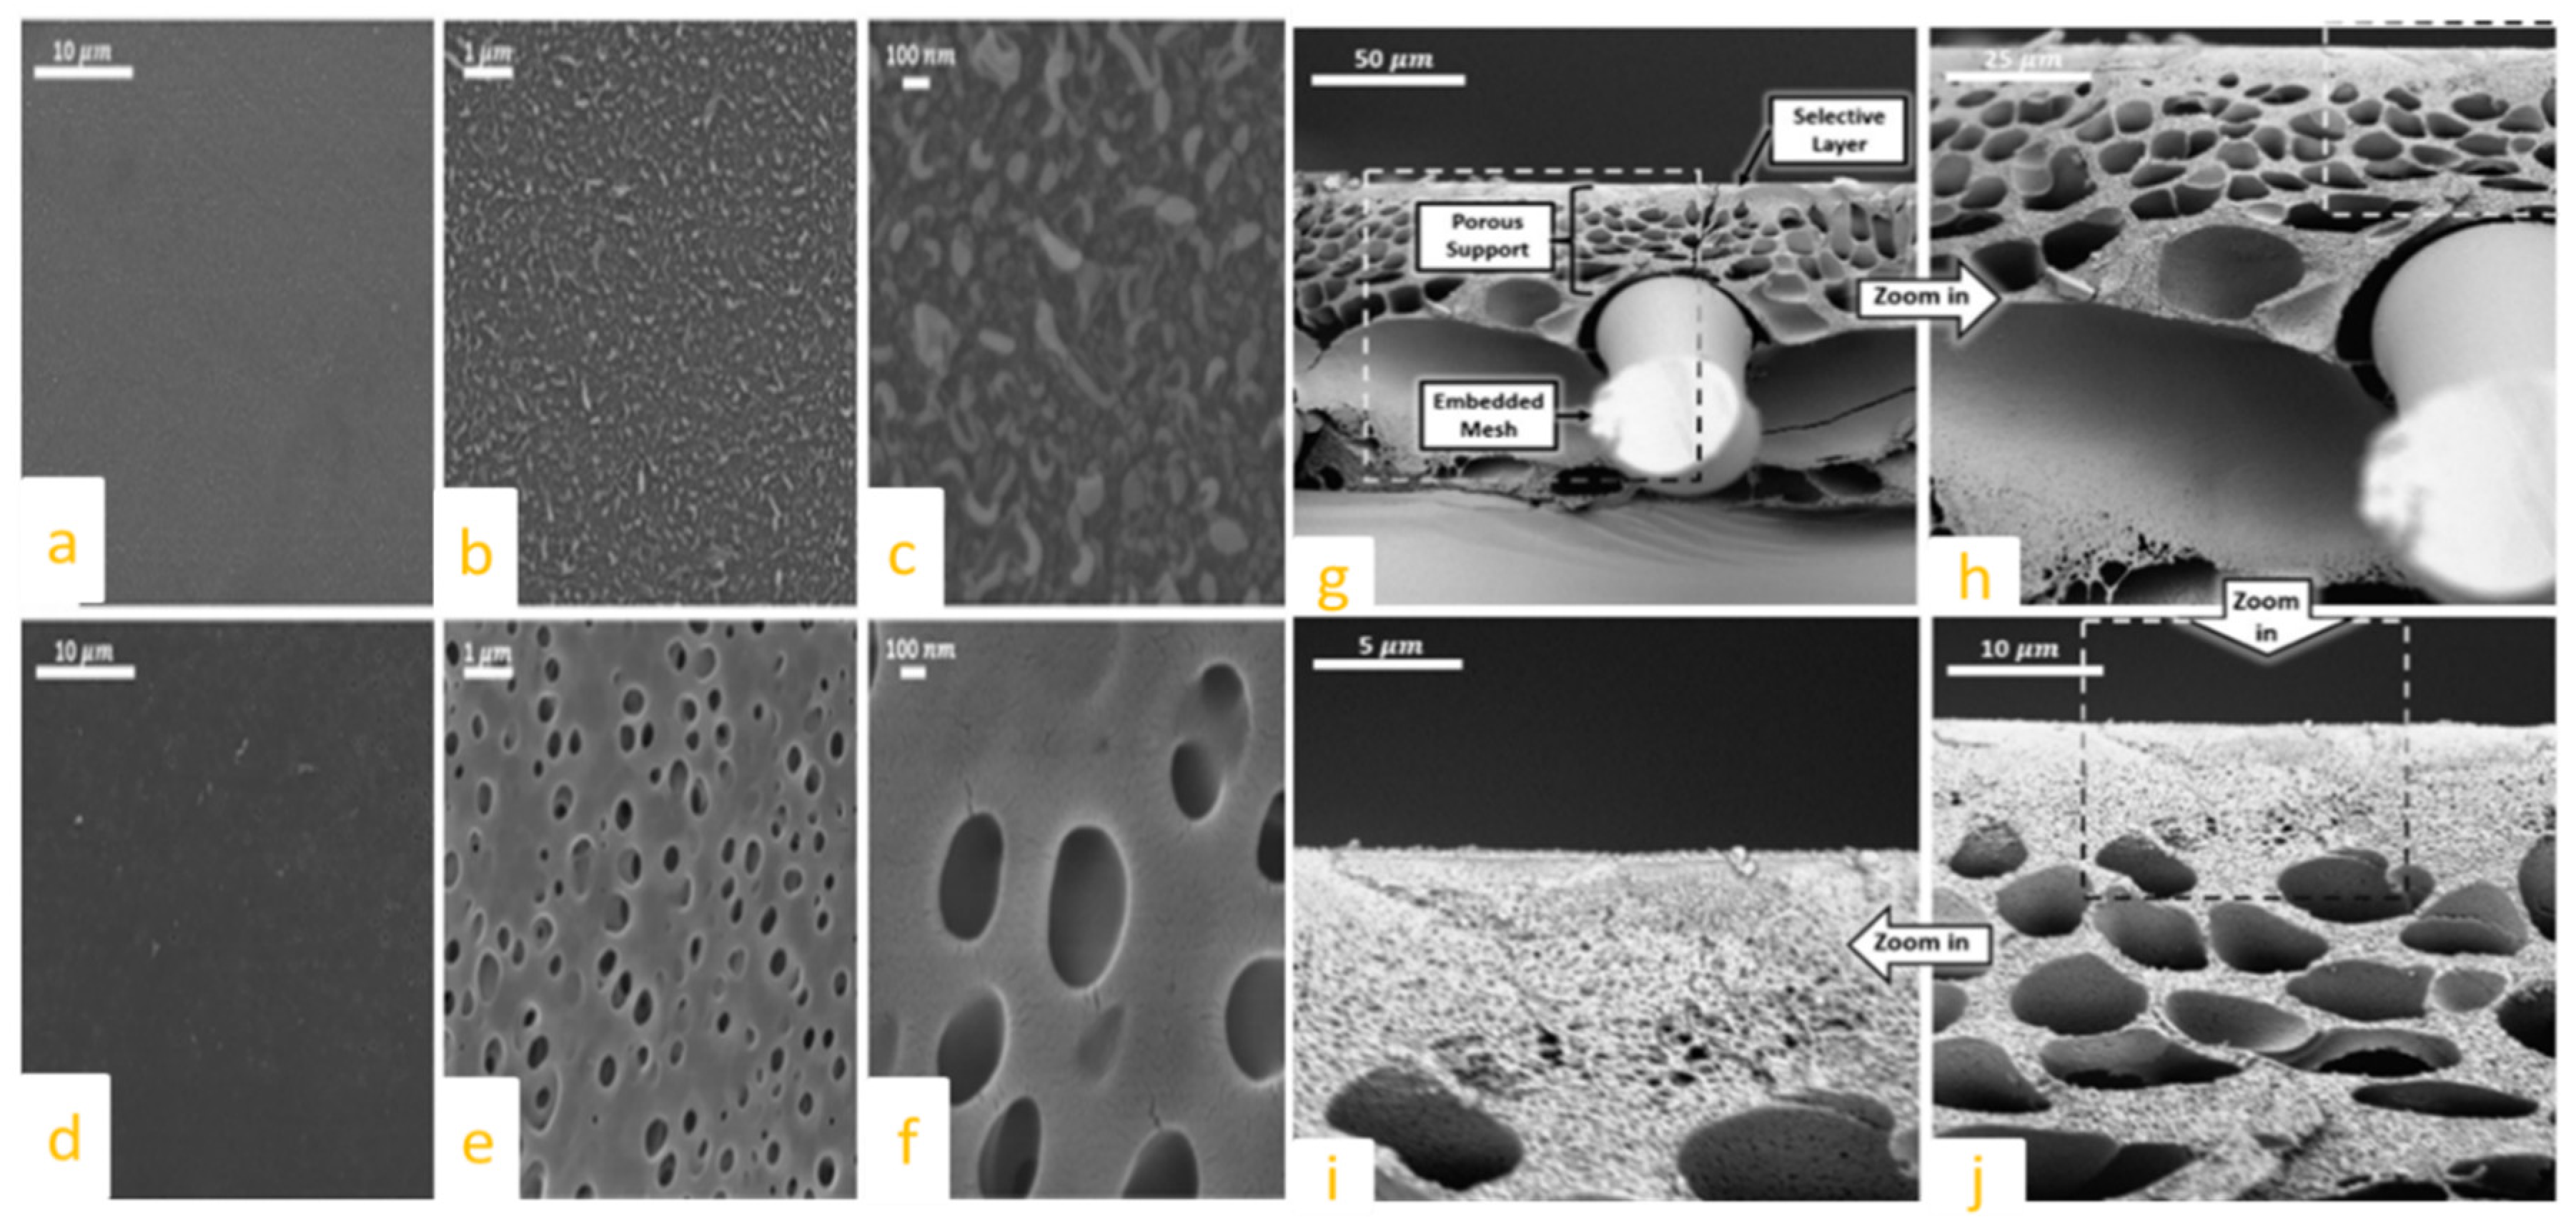
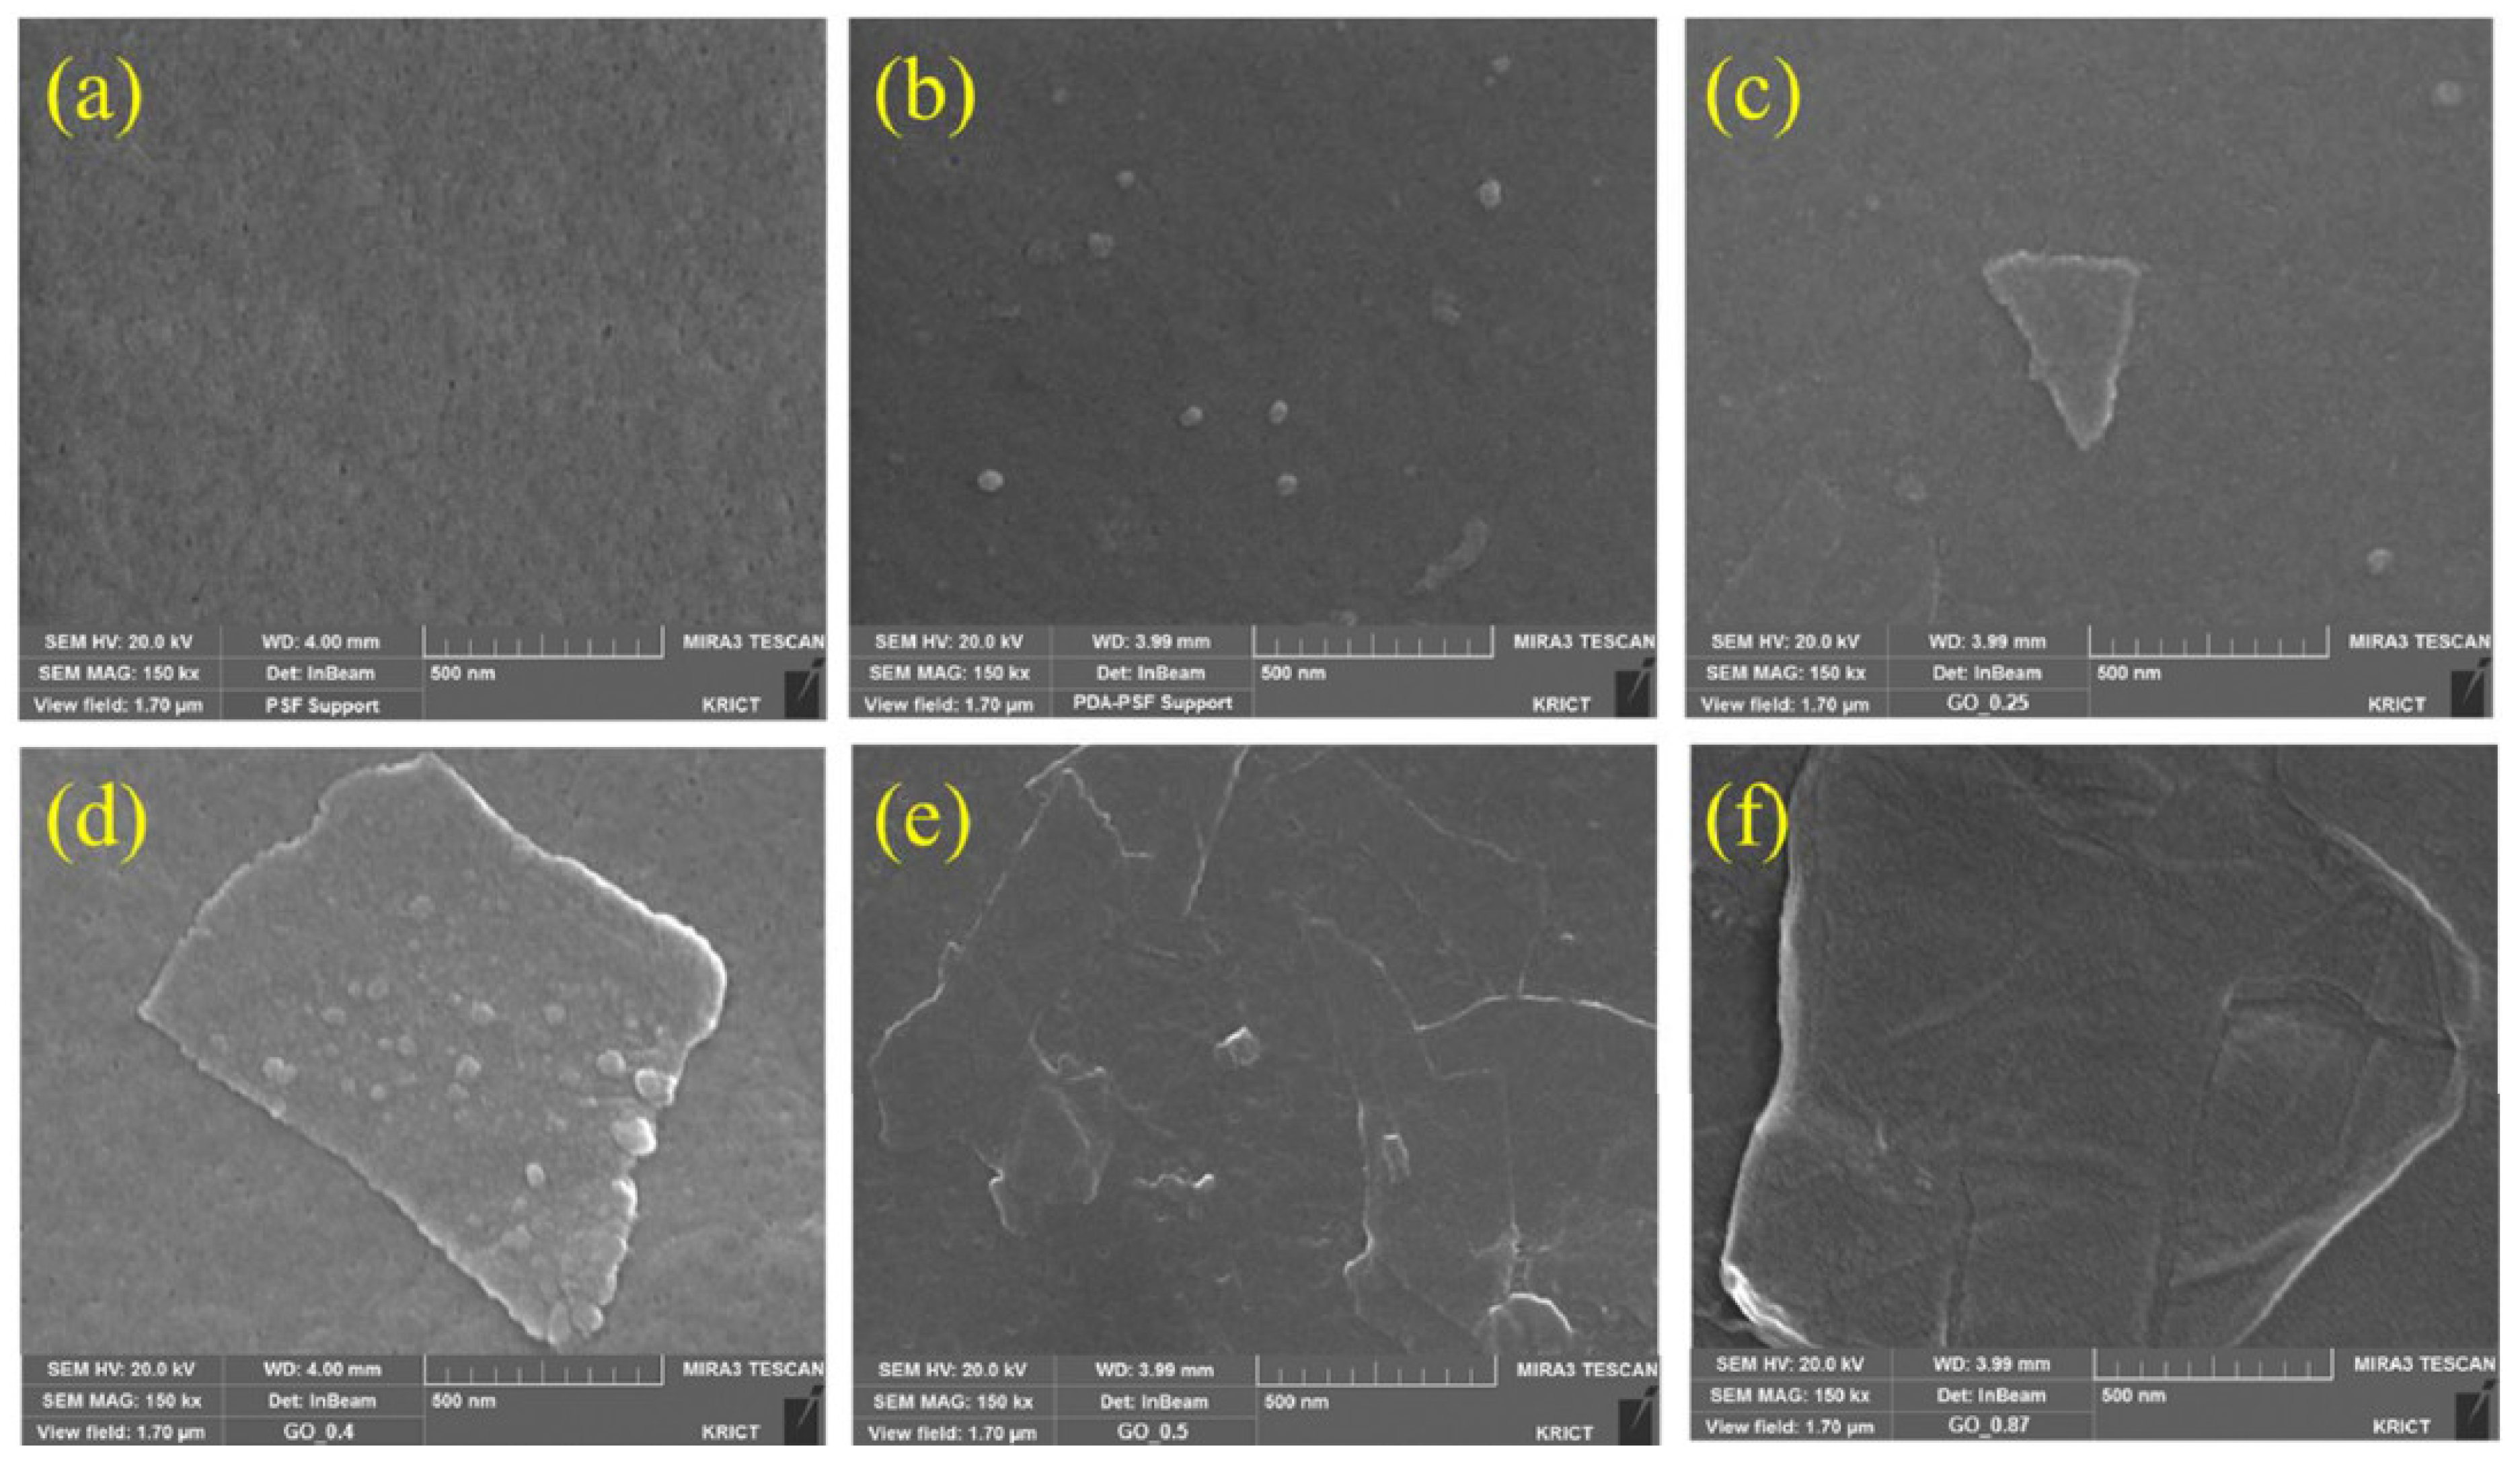
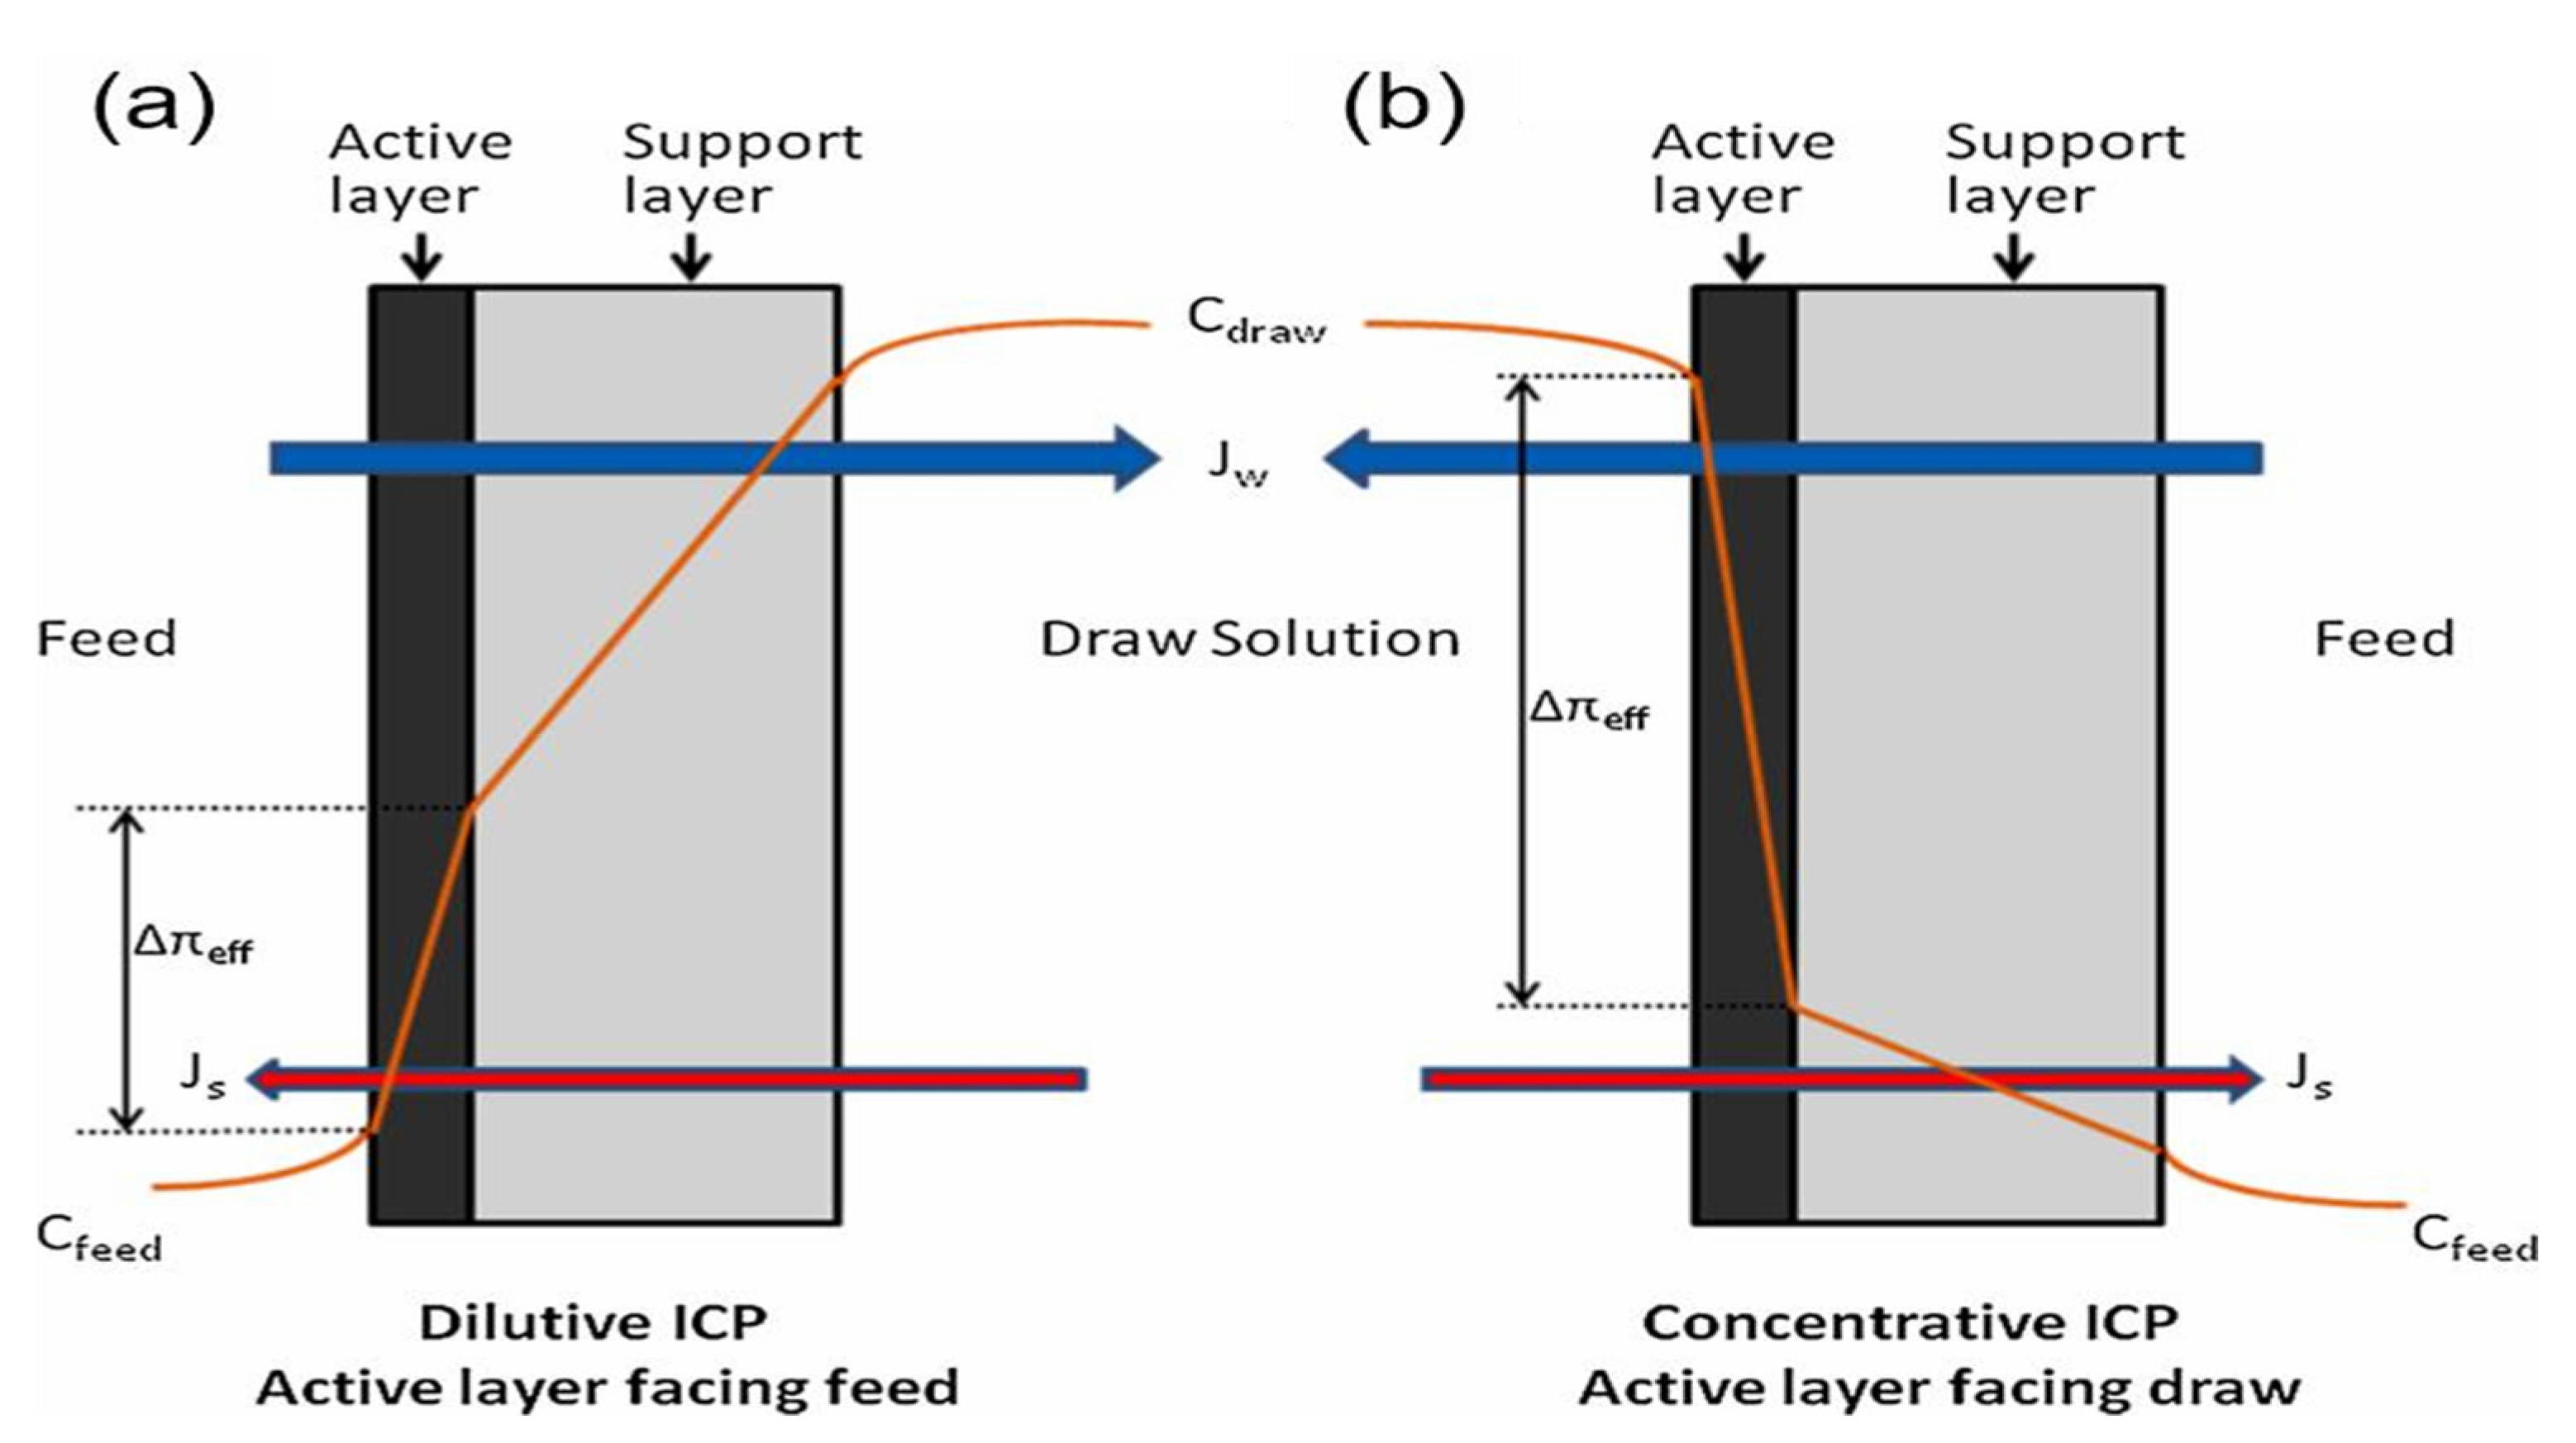
Table 1.
Summary of Worldwide Seawater desalination costs [11].
Table 1.
Summary of Worldwide Seawater desalination costs [11].
| Desalination Method * | Capital Costs (Million US$/MLD) | O&M (US$/m3) | Cost of Water Production (US$m3) | ||||
|---|---|---|---|---|---|---|---|
| Range | Average | Range | Average | Range | Average | ||
| MSF | 1.7–3.1 | 2.1 | 0.22–0.30 | 0.26 | 1.02–1.74 | 1.44 | |
| MED–TVC | 1.2–2.3 | 1.4 | 0.11–0.25 | 0.14 | 1.12–1.50 | 1.39 | |
| SWRO Mediterranean Sea | 0.8–2.2 | 1.2 | 0.25–0.74 | 0.35 | 0.64–1.62 | 0.98 | |
| SWRO Arabian Gulf | 1.2–1.8 | 1.5 | 0.36–1.01 | 0.64 | 0.96–1.92 | 1.35 | |
| SWRO Red Sea | 1.2–2.3 | 1.5 | 0.41–0.96 | 0.51 | 1.14–1.70 | 1.38 | |
| SWRO Atlantic and Pacific oceanic | 1.3–7.6 | 4.1 | 0.71–0.41 | 0.21 | 0.88–2.86 | 1.82 | |
| Hybrid | MSF/MED | 1.5–2.2 | 1.8 | 0.41–0.25 | 0.23 | 0.95–1.37 | 1.15 |
| SWRO | 1.2–2.4 | 1.3 | 0.29–0.44 | 0.35 | 0.85–1.12 | 1.03 | |
* Costs are at 2016 values. MED-TVC = multiple effect distillation with thermal vapor compression; MLD = million liters per day; MSF = multistage flash distillation; O&M = operation and maintenance; SWRO = seawater reverse osmosis.
Table 2.
Ranks and total costs to produce a ton of product water. Reprinted Table with permission from [32]. Copyright (2012) Elsevier.
Table 2.
Ranks and total costs to produce a ton of product water. Reprinted Table with permission from [32]. Copyright (2012) Elsevier.
| Rank | 1 | 2 | 3 | 4 | 5 | 6 | 7 | |
|---|---|---|---|---|---|---|---|---|
| 1 MIGD *, Steam price: 0.008$/MJ | Draw solute | C4H8O | NH4OH | C3H6O2 | NH4HCO3 | C2H6O | CH4O | C3H8O |
| Total cost ($/t) | 1.372 | 2.010 | 3.837 | 3.959 | 4.201 | 4.512 | 4.609 | |
| 100 MIGD, Steam price: 0.008$/MJ | Draw solute | C4H8O | NH4OH | C3H6O2 | NH4HCO3 | C2H6O | CH4O | C3H8O |
| Total cost ($/t) | 0.955 | 1.620 | 3.264 | 3.459 | 3.854 | 4.060 | 4.254 | |
| 1 MIGD, Steam price: 0.0001$/MJ | Draw solute | NH4OH | CH4O | C2H6O | C4H8O | NH4HCO3 | C3H8O | C3H6O2 |
| Total cost ($/t) | 0.275 | 0.343 | 0.344 | 0.348 | 0.395 | 0.402 | 0.545 | |
| 100 MIGD, Steam price: 0.0001$/MJ | Draw solute | NH4OH | NH4HCO3 | C4H8O | CH4O | C2H6O | C3H8O | C3H6O2 |
| Total cost ($/t) | 0.092 | 0.093 | 0.112 | 0.120 | 0.121 | 0.137 | 0.388 | |
* MIGD = million imperial gallons per day.
Table 3.
Indicative status of FO membranes developments.
| Company | Material and Type | Configuration | Status | Reference |
|---|---|---|---|---|
| Aquaporin A/S (AQP) | Biometric aquaporin | Flat sheet, Hollow fibre | Commercial | [59] |
| Fluid Technology Solutions | Cellulose triacetate | Flat sheet | Development | |
| Oasys Water | Thin film composite (TFC) | Flat sheet | Engineering application | |
| Nitto Denko | Composite membrane | Flat sheet, Hollow fibre | Commercial | |
| Woongjin Chemical Company Ltd. | Composite membrane | Flat sheet, Hollow fibre | Commercial | |
| Samsung Co. Ltd. | Composite membrane | Flat sheet | Development | |
| Porifera | TFC | Flat sheet | Commercial | [60] |
| Koch | Proprietary | Spiral wound | Commercial | [61] |
| Toyobo | Proprietary | Hollow fibre | Commercial | [29] |
| Toray | TFC | Spiral wound | Development | [29,62,63] |
| HydroxsysTM | Polyethylene | Not reported | Pre-commercial | [64] |
Table 4.
Overview of the different draw solutions used in FO process.
| Draw Solution Category | Draw Solution | Osmotic Pressure | Water Flux (Feed Solution & Membrane Type Employed) | Recovery Process(es) Employed | Drawbacks | References |
|---|---|---|---|---|---|---|
| Organic compounds | Glycine betaine (1.40 mol/kg) Glycine (1.24 mol/kg) L-proline (1.27 mol/kg) | 2.35 MPa 2.42 MPa 2.64 MPa | 4.83±0.15 L/m2h 4.59±0.38 L/m2h 4.31±0.57 L/m2h Deionised (DI) water/CTA | Anaerobic digestion | Severe dilutive ICP, Potentially cost intensive DS replacement, Biodegradation of DS and loss of DS via reverse salt flux. High membrane bio-fouling potential | [95] |
| EDTA sodium | 0.55 MPa (0.1 to 1.0 M) | 4.02 to 13.08 L/m2.h (Activated sludge—CTA cartridge type membrane) | Nanofiltration | Potential membrane impairment due to sludge deposition | [96] | |
| Glucose (C6H12O6) | 5.6 MPa (2.0 M) | 0.37 L/m2h (tomato juice—TFC aromatic polyamide) | Direct application | ICP effects necessitated by high molecular sizes of draw solutes | [97,98,99,100,101] | |
| Fructose (C6H12O6) | 5.6 MPa (2.0 M) | 2.5 L/m2h (0.5 M NaCl—thin layer cotton-derived cellulose-ester plastics embedded on to of a microfiltration membrane | Direct application | [98,99] | ||
| Sucrose (C12H12O11) | 2.7 MPa (1.0 M) | 12.9 L/m2h (DI water—CA hollow fiber) | Nanofiltration | Low water flux | [102] | |
| Ethanol (C2H6O) | 5.1 MPa (2.0 M) | Unstated | Pervaporation-based separation | High reverse salt flux and low water flux | [103] | |
| Sodium formate (HCOONa) | 31.4 MPa (at saturation) | 2.6 µm/s at 2.8 MPa (DI water—CTA flat sheet) | RO process | High reverse salt flux, Potentially cost intensive DS replacement | [104] | |
| Sodium acetate (C2H3NaO2) | 27.0 MPa (at saturation) | 2.5 µm/s at 2.8MPa (DI water—CTA flat sheet) | Potentially cost intensive DS replacement relative to inorganic salts | |||
| Sodium propionate (C3H5NaO2) | N/A | 2.41 µm/s at 2.8 MPa (DI water—CTA flat sheet) | ||||
| Magnesium acetate (Mg(CH3COO)2) | 10.3 MPa (at saturation) | 2.25 µm/s at 2.8 MPa (DI water—CTA flat sheet) | ||||
| HN(Me)2Cy HCO3 | ~33 MPa (7.6 mol/kg) | 10 L/m2h at 7.6 mol/kg (2 mol/kg NaCl—CTA flat sheet) | CO2 induced phase separation | Degradation of FO membrane | [58] | |
| Volatile compounds | Ammonium bicarbonate (NH4HCO3) | 6.7 MPa (2.0 M) | 2.04 µm/s (DI water—CTA flat sheet) | Heating—decomposition into NH3 and CO2 | Low solubility in water, High reverse salt flux, Potentially cost intensive DS replacement, Not thermally stable | [44,92,98,105,106] |
| Sulfur dioxide (SO2) | Not stated | Not stated | Heating air stripping or distillation | Volatile, Corrosive, Unstable in solution | [107] | |
| Nonresponsive draw solutes | Potassium chloride (KCl) | 9.1 MPa (2.0 M) | 6.337 µm/s (DI water—CA embedded in polyester woven mesh) | Direct application | High reverse salt flux | [41,44] |
| Sodium chloride (NaCl) | 10.2 MPa (2.0 M) | 2.68 µm/s (DI water—CTA flat sheet) | RO process, Distillation/RO, Direct application | High reverse salt flux | [44,97,108,109,110,111] | |
| Ammonium chloride (NH4Cl) | 8.9 MPa (2.0 M) | 5.348 µm/s (DI water—CA embedded in polyester woven mesh) | Direct application | High reverse salt flux | [41,44] | |
| Ammonium nitrate (NH4NO3) | 6.6 MPa (2.0 M) | 4.177 µm/s (DI water—CA embedded in polyester woven mesh) | Direct application | High reverse salt diffusion | [41] | |
| Potassium bromide (KBr) | 9.1 MPa (2.0 M) | 2.84 µm/s (DI water—CTA flat sheet) | RO process | Very high reverse salt diffusion, Potentially cost intensive DS replacement | [44] | |
| Sodium bicarbonate (NaHCO3) | 4.7 MPa (2.0) | 2.47 µm/s (DI water—CTA flat sheet | Low water solubility, Contain scale precursor ions | |||
| Potassium bicarbonate (KHCO3) | 8.0 MPa—(2.0 M) | 2.25 µm/s (DI water—CTA flat sheet) | Reverse salt flux, Contain scale precursor ions, Not easily recovered by RO | |||
| Magnesium chloride (MgCl2) | 26.0 MPa (2.0 M) | 2.33 µm/s (DI water—CTA flat sheet) | NF/direct application | Reverse salt flux, High viscosity Low diffusion coefficient, Mg2+ potential to effect membrane fouling via complexing with some functional groups | [44,108] | |
| Calcium chloride (CaCl2) | 22.1 MPa (2.0 M) | 2.64 µm/s (DI water—CTA flat sheet) | RO process | Reverse salt flux, Contain scale precursor ions, | [44,97,108] | |
| Ammonium sulphate ((NH4)2SO4) | 9.3 MPa (2.0 M) | 5.391 µm/s (DI water—CT embedded in polyester woven mesh) | Direct application | Reverse salt flux, Potentially cost intensive DS replacement | [41,44] | |
| Sodium sulphate (Na2SO4) | 9.7 MPa (2.0 M) | 2.14 µm/s (DI water—CTA flat sheet) | Nanofiltration | Reverse salt flux, Contain scale precursor ions | [44] | |
| Potassium sulphate (K2SO4) | 3.3 MPa (2.0 M) | 2.52 µm/s (DI water—CTA flat sheet) | RO process | Reverse salt flux, Low water solubility, Potentially cost intensive DS replacement. | ||
| Magnesium sulphate (MgSO4) | 5.6 MPa (2.0 M) | 1.54 µm/s (DI water—CTA flat sheet) | Nanofiltration | Reverse salt flux, High viscosity, Low water solubility, Contain scale precursor ions | ||
| Copper sulphate (CuSO4) | 3.0 MPa (220, 000 ppm) | 3.57 L/m2h (5, 050 ppm NaCl—CTA flat sheet) | Metathesis precipitation with barium hydroxide, and then sulphuric acid | Low water flux, FO process severely affected by concentration polarization effect | [50] | |
| Sodium nitrate (NaNO3) | 8.2 MPa (2.0 M) | 5.706 µm/s (DI water—CA embedded in polyester woven mesh) | Direct application | High reverse salt flux | [41] | |
| Potassium nitrate (KNO3) | 6.6 MPa (2.0 M) | 4.429 µm/s DI water CA embedded in polyester woven mesh) | High reverse salt flux Toxic, Energy intensive | |||
| Diammonium phosphate ((NH4)2HPO4) | 9.6 MPa (2.0 M) | 3.892 µm/s (DI water—CA embedded in polyester mesh) | Reverse slat flux, Low water flux | |||
| Ammonium phosphate (NH4H2PO4) | 7.7 MPa (2.0 M) | 4.349 µm/s (DI water—CA embedded in polyester mesh) | Reverse salt flux Low water flux | |||
| Calcium nitrate (Ca(NO3)2) | 11.0 MPa (2.0 M) | 50.22 µm/s DI water—CA embedded in polyester woven mesh) | Direct application | Potentially cost intensive DS replacement, Poor water extraction capacity | [41,44] | |
| Responsive draw solutes | Polyacrylic acid MNPs (PAA MNPs) | Up to 7.1 MPa (0.08mol/L) | 10 to 17 L/m2h (DI water—HTI membrane) | Magnetic field separation, Ultrafiltration | Drop in water flux due to agglomeration of MNPs | [54,55,56] |
| 2-pyrolidone based MNPs (2-pyrol MNPs) | Unstated | 0.5 to 5 L/m2h (DI water—HTI membrane) | ||||
| Triethylene glycol MNPs (TREG MNPs) | 0.5 to 5 L/m2h (DI water—HTI membrane) | |||||
| Polyethylene glycol diacid MNPs (PEG-(COOH)2MNPs) | 5.6 to 7.4 MPa (0.065 mol/L) | 5.3 to 9.1 L/m2h DI water—CTA flat sheet) | [53] | |||
| Nano size dextran coated ferric oxide MNPs (Fe3O4) | Unstated | 3.25 to 4 L/m2h (DI water—HTI membrane) | External magnet | [52] | ||
| 2-methylimidaxole based compounds with monovalent and divalent charges | 5.0 to 15 MPa (2.0 M) | 0.1 to 20 L/m2h (DI water—CTA flat sheet) | FO-MD integrated process | High ICP effect when using compound with divalent charge, High reverse solute flux, Potentially cost intensive DS replacement | [112] | |
| Polyelectrolyte of polyacrylic acid sodium (PAA-Na) | 2.5-4.6 MPa (0.72 mg/L) | 13 to 21 L/m2h (DI water—CA hollow fibre) | FO-MD integrated process, Ultrafiltration | Reverse salt flux, High viscosity | [113] | |
| Thermo-sensitive polyelectrolytes | Up to 8.9 MPa (14.28 wt.% polyelectrolytes with different sodium acrylate content) | 0.05 to 075 L/m2h (DI water—HTI membrane) | Hot ultrafiltration | Poor water flux | [114] | |
| Polymer hydrogels | 2.7 MPa | 0.55 to 1.1 L/m2h (2000 ppm NaCl—HTI membrane) | Direct application, Heating, Pressure stimuli | Energy intensive, Poor water flux | [57,115] | |
| Acyl-TAEA | N/A | N/A | High temperature | Poor water flux | [116] | |
| Micelles close to Kraft point | 9.5 MPa | 4.73 to 16.14 L/m2h (n.a) | Temperature swing with low grade heat and crystallization | Low diffusivity | [117] | |
| Dendrimers | 2279813 Pa (20 wt. %) | Unexamined | Wide range of pH value, and ultrafiltration | Somewhat inexpedient in practice | [51] | |
| Albumin | 4.8 MPa (30 wt. %) | Denatured and solidified upon heating | ||||
| Concentrated RO brines | Unmeasured | 8.8 to 11 L/m2h | RO process | Precipitation of organic salts on membrane surface | [55] | |
| Hexavalent phosphate | Unmeasured | 6 (Na salt) to 7 (Li salt) L/m2h (DI water—HTI membrane) | Direct application | Hydrolysis CTA membrane | [118] | |
| Carbon based nanoparticles | Polymer-graphene composite hydrogels | Unmeasured | 6.8 to 8.2 L/m2h (DI water/200 ppm NaCl—HTI membrane) | Heating | Poor water flux | [119] |
| Potassium carbon nanofibers (TEG-K/CNF) | 2.8 to 7.0 MPa (0.05 to 0.2 wt. %) | 10.5 to 13.3 L/m2h (3.0 wt.% NaCl—CTA flat sheet) | Solar evaporation | Decline in water flux | [48] |
© 2020 by the authors. Licensee MDPI, Basel, Switzerland. This article is an open access article distributed under the terms and conditions of the Creative Commons Attribution (CC BY) license (http://creativecommons.org/licenses/by/4.0/).
Share and Cite
MDPI and ACS Style
Aende, A.; Gardy, J.; Hassanpour, A. Seawater Desalination: A Review of Forward Osmosis Technique, Its Challenges, and Future Prospects. Processes 2020, 8, 901. https://doi.org/10.3390/pr8080901
AMA Style
Aende A, Gardy J, Hassanpour A. Seawater Desalination: A Review of Forward Osmosis Technique, Its Challenges, and Future Prospects. Processes. 2020; 8(8):901. https://doi.org/10.3390/pr8080901
Chicago/Turabian StyleAende, Aondohemba, Jabbar Gardy, and Ali Hassanpour. 2020. "Seawater Desalination: A Review of Forward Osmosis Technique, Its Challenges, and Future Prospects" Processes 8, no. 8: 901. https://doi.org/10.3390/pr8080901
Note that from the first issue of 2016, this journal uses article numbers instead of page numbers. See further details here.