Identifying Characteristics of Wildfire Towers and Troughs


1
Department of Civil and Environmental Engineering, University of California, Irvine, CA 92697, USA
2
Los Alamos National Laboratory, Los Alamos, NM 87545, USA
*
Author to whom correspondence should be addressed.
Atmosphere 2020, 11(8), 796; https://doi.org/10.3390/atmos11080796
Submission received: 29 May 2020
/
Revised: 18 July 2020
/
Accepted: 24 July 2020
/
Published: 28 July 2020
(This article belongs to the Special Issue Atmospheric Turbulence Processes and Wildland Fires)
Abstract
:Wildfire behavior is dictated by the complex interaction of numerous physical phenomena including dynamic ambient and fire-induced winds, heat transfer, aerodynamic drag on the wind by the fuel and combustion. These phenomena create complex feedback effects between the fire and its surroundings. In this study, we aim to study the mechanisms by which buoyant flame dynamics along with vortical motions and instabilities control wildfire propagation. Specifically, this study employs a suite of simulations conducted with the physics-based coupled fire-atmosphere behavior model (FIRETEC). The simulations are initialized with a fire line and the fires are allowed to propagate on a grass bed, where the fuel heights and wind conditions are varied systematically. Flow variables are extracted to identify the characteristics of the alternating counter-rotational vortices, called towers and troughs, that drive convective heat transfer and fire spread. These vortices have previously been observed in wildfires and laboratory fires, and have also been observed to arise spontaneously in FIRETEC due to the fundamental physics incorporated in the model. However, these past observations have been qualitative in nature and no quantitative studies can be found in the literature which connected these coherent structures fundamental to fire behavior with the constitutive flow variables. To that end, a variety of state variables are examined in the context of these coherent structures under various wind profile and grass height conditions. Identification of various correlated signatures and fire-atmosphere feedbacks in simulations provides a hypothesis that can be tested in future observational or experimental efforts, potentially assisting experimental design, and can aid in the interpretation of data from in situ detectors.
1. Introduction
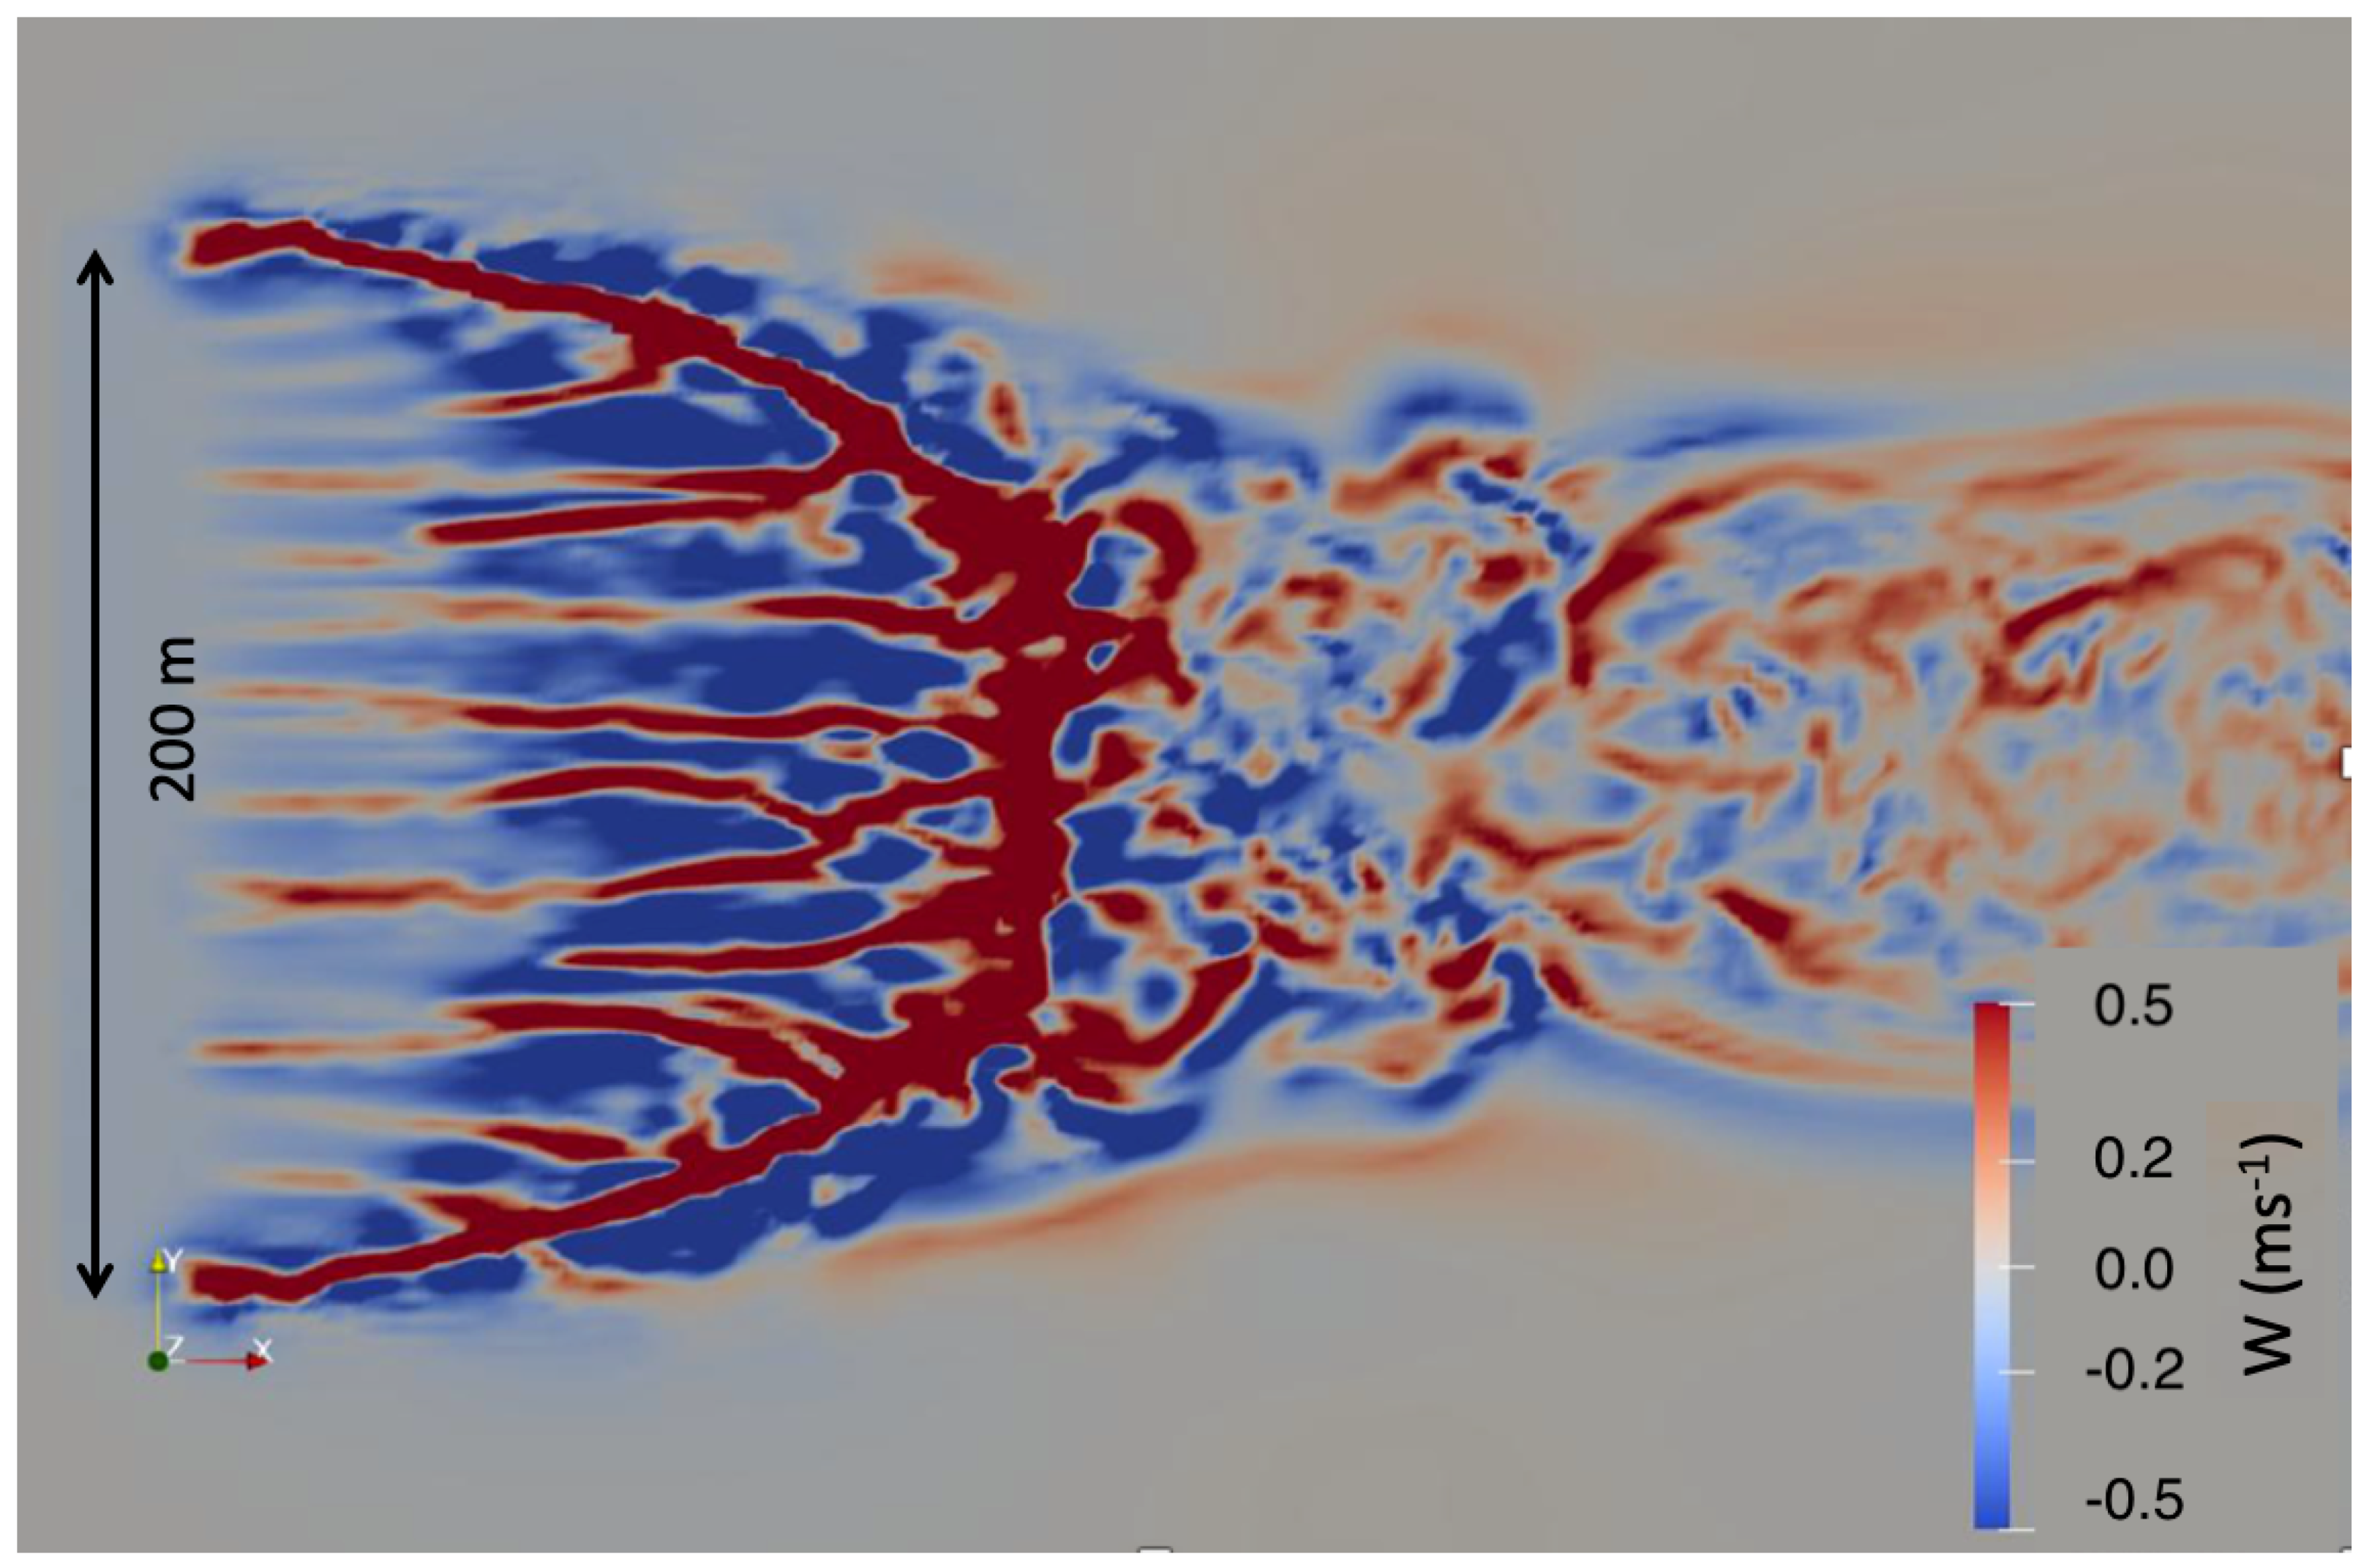
Wildfires occur across the globe, with varied degrees of impact on nature and society. Low intensity wildfires can be beneficial from a landscape ecology perspective, while high-intensity fires, especially at the wildland-urban interface can be catastrophic in terms of threat to infrastructure, economic losses as well as loss of lives. The fundamental physics governing wildland fires are immensely complex. However, because landscape-scale fires often impact human and ecological well-being, an improved understanding of fire physics and accurate wildfire models are necessary to anticipate and mitigate catastrophic scenarios, as well as designing prescribed burns. Prescribed burns are usually low intensity fires that are aimed at reducing heavy fuel loads in order to reduce future fire intensity. Therefore a detailed understanding of the energetics, regulating factors and scales responsible for fire propagation are important from a management perspective [1]. This work applies a coupled fire/atmosphere model (FIRETEC) to elucidate our understanding of phenomena that have recently been found to be key to the spread of wildland fires [2]. More specifically, turbulent coherent structures in the form of counter-rotational vortices or “towers and troughs” are computationally explored here, and their key physical characteristics are investigated. Flaming wildfires have been observed to spread predominantly via convective heat transfer to surrounding unburnt fuels, and in both laboratory and large-scale fires, a series of towers and troughs have been observed to arise naturally and play a major role in convective heat transfer [2]. These towers and troughs are the visible manifestations of the interaction between ambient wind and heated gases rising from the burning fuel (towers), and corresponding down drafts of air drawn towards the base of the tower along a pressure gradient (troughs), as shown in Figure 1. The origin of the streamwise vorticity and tower trough structures in spreading fires is not trivial due to the number of complex feedbacks that develop in the vicinity of the fire front.
The observation of towers and trough-like structures associated with strong buoyancy driven environments can be traced back to several studies involving heated plates [4,5,6,7]. Stationary diffusion flames have also been used in efforts to study the interactions between forward momentum and buoyancy without the additional complexities of combustion [8,9,10]. Boundary layer instabilities could develop into counter-rotating streamwise vortices which were associated with the visible tower and trough pattern in wind-driven fire scenarios. These structures were observed in several experiments on isothermal, flat plates, indicating that the towers and troughs can exist without the presence of inhomogeneity in temperature or fuel. The authors [4,5,6,7] concluded that the counter-rotational vortices must be accounted for to accurately describe or model the three-dimensional boundary layer in combustion scenarios. A viscous wall length was defined, and the authors confirmed that the tower and trough pattern had approximately the expected wavelength of 100 viscous wall units (in the streamwise direction), as has been in observed in other boundary layers [11,12]. Moreover, the growth of the tower and trough amplitude was found to approximately agree with Rayleigh-Taylor scaling laws in existing literature, but the authors postulate that tendencies of pre-existing vorticity in the flow may also be a contributing factor to tower and trough behavior. In addition, the heat flux to the surface immediately after the flame was considerably higher under and ahead of the troughs (as opposed to the towers). In the wind tunnel experiments involving flat, isothermally heated plates and no subsequent diffusion flame, it was demonstrated that the spacing and width of the counter-rotational vortices both have a lognormal distribution. Interestingly, the spacing and width grow as streamwise distance increases along the heated plate, and the spacing and width of vortices decrease considerably as plate temperature increases and (to lesser degree) as wind speed increases [8,13,14].
Building on the observations from the heated plate experiments and diffusion flame studies, several authors have reported the tower and trough pattern as observed in lab experiments, wildfires, and physics-based landscape- scale simulations [2,15,16,17,18,19,20,21]. Canfield et al. [21] pointed out the presence of the streamwise vorticity patterns and their connection to the fire front structure, which was further supported by Cunningham and Linn [19]. These studies suggest that vortices could be more heavily accentuated in fires (as opposed to heated plates) because the towers and troughs produce self-reinforcing patterns of “fingers” of burned fuel. Moreover, intense burning in upwash zones, where the buoyant plume and local turbulence result in towers that are poor and fuel rich, allows for residual burning after the flame-front passes. In these simulations no significant dependence of vortex spacing on initial fireline length was noted, but longer fire lines and faster ambient winds caused vortices to merge more often.
Experiments conducted at the Missoula Fire Sciences Laboratory in (US Forest Service Rocky Mountain Research Station) Montana recently noted the tower and trough behavior as an important flame-spread mechanism. The mechanism is clearly shown to be a principal method of convective heat transfer, and convective heat transfer is in turn experimentally determined to dominate fire spread in wildland fires. Finney et al. [2] suggest that the convective heat transfer may be due to flame “bursts” as the fire intermittently heats the fuel downwind. These bursts were observed in a series of experiments to range between 1.4 and 4.9 Hz [15], but this likely varies for other experiments. In general, flame bursts are poorly understood [22,23], but they are presumably related to the observed instabilities in the tower and trough structures [2], and consistent with the observation that heat flux is higher ahead of and below a flame trough.
Moreover, the tower trough structures are persistently present even in well-developed fires, not only in transition flows. Other authors have found similar results on inclined plates [13,24], and some researchers have noted that the counter-rotational vortices have some similarities to Görtler vortices [2,8,9,10,19,20,21]. It is important to note that the tower and trough pattern is similar but not identical to Görtler vortices, which arise as a result of fluid impinging upon a curved surface (i.e., Görtler vortices are a combination of forward momentum and centrifugal force, while the heated plate towers and troughs arise from forward momentum and the force due to buoyancy) [25,26,27].
Therefore, it is evident that although lab scale experiments have investigated tower trough structures with relatively more accuracy, the characterization of such coherent structures have been qualitative at best in the landscape scales. The current work is an attempt to address this gap and we quantitatively answer the following questions:
- What is the nature of fire—atmosphere interactions in the tower-trough structures?
- What is the impact of controlling factors such as fuel loading, fuel height and wind in modulating the tower trough structures?
The nature of these quantified results can help target measurement schemes in future experiments for testing hypotheses and validating physics-based fire models. Moreover, the results will create a baseline of tower and trough characteristics in more complex scenarios.
2. Materials and Methods
2.1. FIRETEC Overview
FIRETEC has been described in detail elsewhere [28,29,30], so a detailed description is not recreated here. Instead, a greatly abbreviated overview is given. FIRETEC is a physics-based, landscape-scale wildfire model coupled to atmospheric effects. It is physics-based in a sense that the formulation consists of a series of coupled partial differential equations describing conservation of mass, momentum and energy for both air surrounding a fire, mass and energy for the solid fuels, and the concentration of oxygen and fine scale turbulent kinetic energy. The combustion rate, and associated fuel mass loss, energy release and oxygen depletion are determined by local and dynamic fuel loading, oxygen concentration, and turbulent mixing (a mixing limited approximation for the combustion rate.) FIRETEC, also referred to as HIGRAD/FIRETEC, couples the wildfire specific process to the atmosphere through a two-way consistent integration with the HIGRAD atmospheric hydrodynamics code. Finally, FIRETEC is landscape-scale in that it is most applicable to simulations ranging from tens to thousands of meters on each of the three spatial dimensions, and has the capacity to capture fire behavior on complex topography.
2.2. Experiment Design
The set of simulations were designed to eliminate as many potentially confounding factors as possible. The wildfires were simulated on simple fields of grass on domains of 600 × 600 × 615 m. The grid resolution was 2 m by 2 m in the x and y directions. There were 41 grid points in the z direction and an grid stretching was employed so that there were more grid points near the surface. The time step was 0.02 s and outputs were recorded every 50 simulation time steps (1 s). The simulations were run until the fire reached the end of the domain. Incoming winds were generally idealized, and fuel loadings were homogeneous. A fire line was ignited by raising a 200 × 2 m strip of grass to 1000 K over 3 s. The ignition line was situated 100 m from the inlet boundary and centered between the top and bottom boundaries, with the wind entering from the inlet boundary (the x direction). The wind was initialized at 4 or 8 at a height of 10 m above the ground in a profile reminiscent of a power law with appropriate modifications for fuel drag, which attenuates the velocity profile inside the canopy [28].
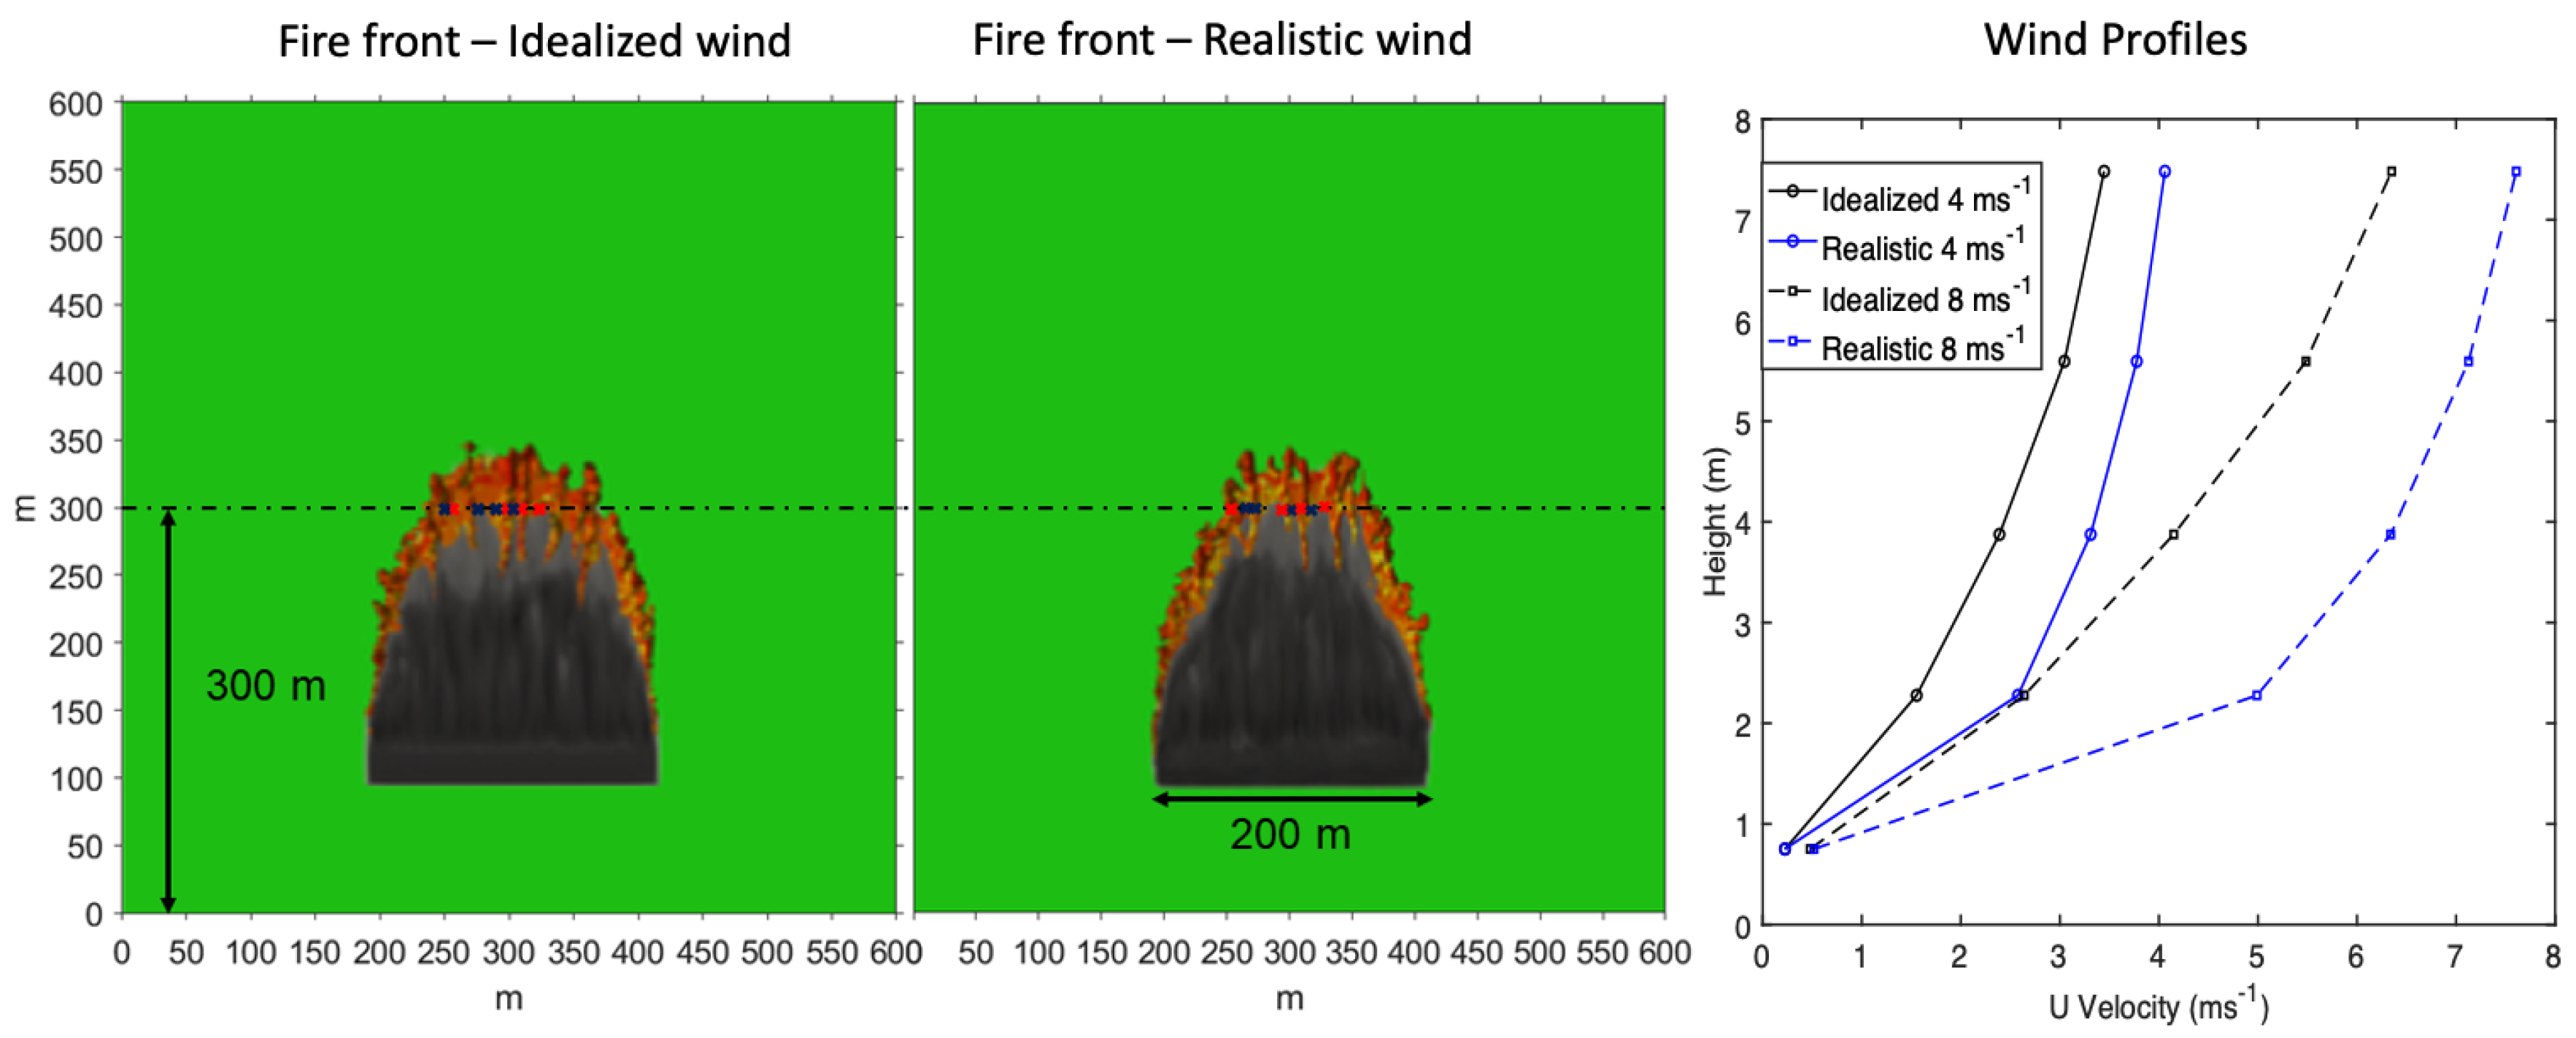
Because wind speed and turbulence have a profound impact on both the burn rate and the fire spread rate, a realistic wind field was developed through the use of cyclic boundary conditions. This precalculated dynamic and heterogeneous wind field was then idealized and used to initialize fire simulations. This was done by initializing the wind profile, perturbing the profile, and allowing 1300 s of simulation time to establish wind fields over the domain with both resolved and sub-grid turbulence. The wind was then averaged by averaging the wind velocity vectors over the entire plane for each height in the z direction, and populating each plane with the average wind vector at each vertical cell (eliminating the resolved turbulence, but maintaining the wind profile as a function of altitude). The averaged wind profile was also set as the constant incoming boundary conditions. Additionally, the sub-grid turbulence values were averaged at the initial fire line prior to initial combustion. In reality, no single wind sub-grid turbulence boundary profile is correct, but fixing these values eliminates a crucial layer of variability from the simulation, and a pair of simulations shown in Figure 2 show that the total fire spread rate and fuel consumption were quite comparable between the realistic and idealized winds. The main difference is the degree of disruption of coherent structures with the addition of resolved eddies. To summarize, the ‘idealized’ wind profile was a prescribed log-law and the ‘realistic’ profile a fully turbulent profile averaged over the domain to avoid strong gusts.
Table 1 contains a brief summary of the simulations completed for this study in which efforts were made to focus attention on the heterogeneous dynamics caused by the fire-atmosphere interaction and thus eliminate the influences of complex heterogeneities in wind and fuels.
In Table 1, Idealized (IU4 or IU8) simulations idealized the wind field—either 4 or 8 at 10 above ground. The base case uses IU winds of 4 with uniform fuel height of 0.7 , a fuel loading of 0.7 and a fuel moisture fraction (mass of water/mass of dry fuel) of 5%. All other simulations are a perturbation of these base cases. Real wind (RU) simulations use of a wind profile that is a fully developed resolved turbulent profile (either 4 or 8 at 10 above the ground). IUx2 and IUx0.5 simulations are identical to the base case, except the fuel height has a multiplier either doubling or halving the fuel height and loading from the base case.
The challenge in the use of data collected in this manner comes from the fact that fire behavior is heterogeneous and it is challenging to know apriori where ideal locations are to take measurements to assess specific characteristic of a fire, such as a tower or trough, or how representative a point measurement is of the larger scale fire behavior. To account for these heterogeneities of the fireline dynamics a planar test area (vertical plane 80 wide in crosswind (y) direction and 9 tall located 300 downwind (x) of the upwind boundary) was selected, and all quantities of interest (wind vectors, gas temperature, radiative and convective heat flux etc.) were recorded. This line was centered in the cross-stream (or y) direction. By locating the line 300 m from the x boundary (200 m for the ignition line), any unrealistic signatures of ignition procedures were allowed to dissipate prior to data collection. Similarly, by taking only the central 80 m of the 200 m fireline, the edge or flanking effects of the fire line were excluded. The simulated data were recorded approximately 9 m into the air for every 50 simulation time steps (i.e., every 1 s of simulation time) beginning immediately after ignition. Towers and troughs were chosen during post-processing as the location that had the most intense tower or trough structures, as determined by the vertical wind components above the level of background noise. The most notable towers and troughs (4 of each) were chosen for every wind and fuel condition. Post-processing of the data revealed very similar trends in any grid cell in the vertical direction in this 9 m high plane for each tower and trough location, but the cleanest, most relevant data clearly came from the grid cell immediately above the fuel bed at approximately 1.5 m height, as might be expected. Therefore, although the data were recorded and extracted on a plane, we show the results from a line on this plane at 1.5 m height. The locations of the towers and troughs are also marked clearly in Figure 2 for both the tracked and untracked cases as well as the idealized and realistic wind profiles.
2.3. Identification of Towers and Troughs
The tower and trough structures are dynamic and influenced both by adjacent flame structures and the complex interactions of the atmosphere with the fire as a whole. Past work has shown coherent structures can be observed to meander slowly as they are tied to upstream heterogeneities in fuel and combustion. Visual inspection of the burn scar pattern in the fuel and the progressing towers of rising air suggest that the macro-scale structure is stationary enough (in the crosswind direction) to gain insight by studying the time evolution of specific points. We attempted to take advantage of this apparent relatively minimal lateral movement of tower structures in these simulation by extracting simulation data at a handful of strategically chosen static points of interest within a subsection of the domain. This means that the x, y, and z coordinates were fixed, and quantities of interest were recorded at each time step.
To select the chosen static locations, each time step and each location in the cross-stream (or y) direction within the planar test area were labeled based on being involved in active burning (based on whether those cells had reached 500 K or not). If a cell had reached 500 K, then it was classified as a tower or trough based on the sign and magnitude of the vertical component of the wind vector. If the magnitude was less than 0.1 , the vertical wind at that time step was considered to be due to random fluctuations, and the time step was not considered in determining tower vs. trough behavior. Otherwise, the location was counted as a tower for positive values of the vertical wind or a trough for negative vertical wind values.
Nevertheless, to account for the meandering nature of the tower-trough structures [2], their features were investigated using two different perspectives. In the first “stationary” or “untracked” perspective, the tower was detected by a predominance of positive wind in the w direction during the active combustion period of a static cell. In the “non-stationary” or “tracked” perspective, a tower was determined by the most intense updraft region within adjacent cells of the initial tower (in the transverse direction). Similar to the untracked version, this was over time for a given point, except the “point” was really the most intense tower-like region in a sub-set of adjacent cells along the y direction. This was meant to account for the flickering, swaying nature of the tower-trough structures at different stages of heat-up, combustion, and burnout. For example, spatial points that visually contained a tower or trough as the fire front passed the test plane were initially chosen. Then the updraft or downdraft of the streamwise vorticity pattern behind the towers or troughs were tracked as they shifted laterally, and each quantity of interest was recorded at each time step. The tracking was conducted by searching the cells for the maximum updraft or down draft within 6 m of the location where the updraft or downdraft were in the previous time step.
3. Results and Discussions
To quantify the trends in towers and trough type structures, Pearson correlation coefficients were computed between the individual components of the wind vector and other quantities of interest, shown in Figure 3 and Figure 4. From a micrometeorological perspective, correlation coefficient of the fluctuations (from mean) of a scalar quantity such as heat of a gas with the fluctuations (from mean) of a velocity component represents the efficiency of advective flux transport of the scalar by the moving gas in a specified direction. Hence in the context of wildfires, the correlations of the oxygen concentration, gas temperature or heating are quantities that can provide additional insights into the net influence of the highly turbulent environment on the movement of these scalars. Noting that the coherent structures are a direct result of heat transfer coupling the fuel combustion to the gas phase, the tower and trough structures are naturally only observed during active heating and combustion. Therefore, the data at each location were divided into pre-combustion, combustion, and post-combustion phases as determined by the time step when the fuel first rose above 500 K (or subsequently fell below 500 K as the flaming front moved on). Therefore, a fixed averaging time was not selected apriori for computing correlation coefficients. This calculation was done at the post-processing stage. However, as an approximation, each tower or trough was tracked for about 120 s. The actual time was different from case to case and was determined by the combustion threshold described earlier.
3.1. Stationary Tower and Trough Characteristics
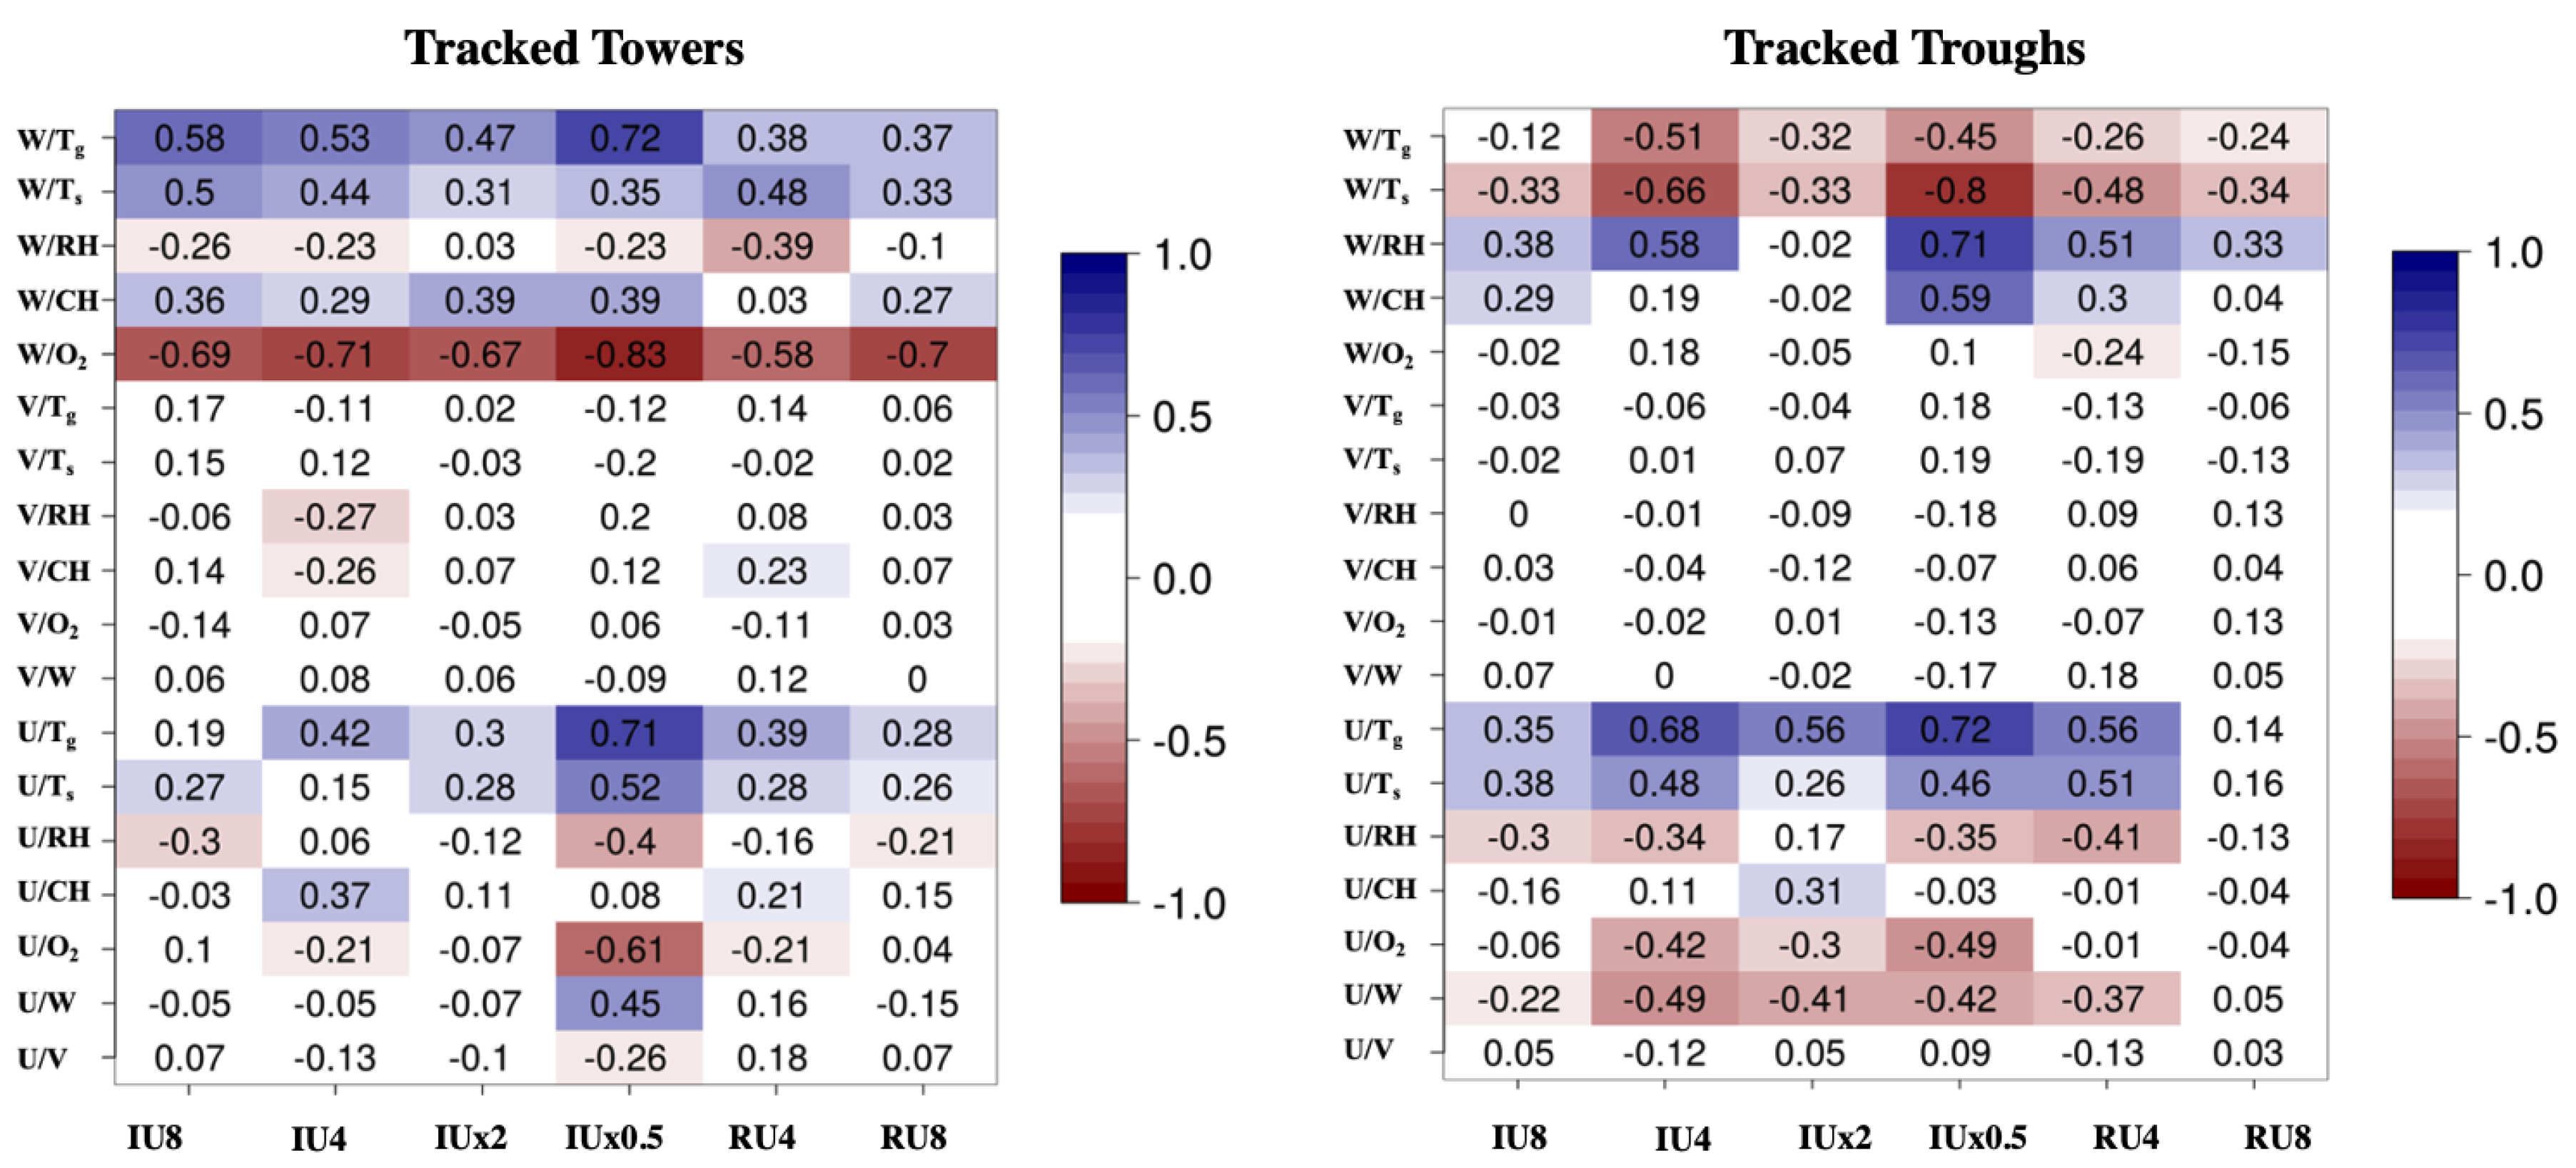
The correlation coefficients shown in Figure 3 for the spatially static quantities of interest show a general lack of correlation. In the left panel the correlation coefficients are computed for towers, where w is a positive value, and thus a positive correlation indicates that the correlated quantity is also positive (while anti-correlation indicates that the correlated quantity is negative). For example, in towers is generally depleted, making the correlation negative. The converse is true for the right panel, where w is negative for troughs and thus a positive correlation coefficient indicates a negative quantity (such as w and the convective heating (CH) where CH is consistently negative as the trough is characterized by convective cooling). However, the meandering movement due to streamwise vorticity (pairs of vortices either have dominant upward or downward motion), which is related to the turbulent nature of the atmosphere surrounding the fire, weakens correlations as expected. In light of this chaotic environment, correlation coefficients are considered noteworthy in a range of 0.2 to 0.4, and strong in a range of 0.4 to 0.6 in the following discussion. Correlations that are not considered noteworthy (correlation coefficients that are below a magnitude of 0.2) are not discussed. Numerical values of the correlation coefficients are available in Figure 3.
There is a strong correlation between local streamwise velocities, u (the wind component in the x direction), and both (gas temperature) and (solid temperature). This correlation is likely associated with the fact that intense burning induces strong updrafts and thus strong horizontal indrafts. The temperature correlation is considerably stronger between u values and because strong winds enhance both heating and cooling of the solids at different times, weakening the correlation between wind and solid temperature . The correlation of the u and v (the wind component in the y direction) with (the concentration of oxygen normalized to 1.0 at background atmospheric concentration) are noteworthy but far from consistent across the six simulation cases. In general, the tables indicate anti-correlation, or that high values of wind correlate with low values of oxygen. This is to be expected, given that the high winds are correlated with more intense combustion and thus more depleted oxygen, while low velocity winds tend to do the opposite. Conversely, high winds also bring about a stronger flux of oxygen from ambient to combusting regions.
The high-speed winds and the turbulent wind simulations (IU8, RU8, and RU4) show lower levels of correlation in general compared to the low wind speed idealized cases, likely because the turbulence and high wind speed distort the coherent structures and cause the towers and troughs to shift locations to a greater degree. By contrast, the idealized wind experiments have the cleanest delineation between towers and troughs (as indicated by the highest average correlation coefficient magnitude). This is especially true at the 4 base wind speed, and further implies that turbulence and high wind speed distort coherent structures. In other studies, this sort of distortion process has been shown to frequently be achieved as a result of dynamic pressure fluctuations. Because of its isotropization tendency (turbulent fluctuations in one direction stir up and move energy to fluctuations in other directions over time), pressure tends to decorrelate covariances, distorting finite coherent structures [31]. A strong dynamic pressure perturbation had been observed between the upstream and downstream sides of the fire front during previous simulations involving FIRETEC [21].
The correlation between w and both net convective and radiative heating (CH and RH, respectively) is generally strong in troughs but barely noteworthy in towers, with considerable variation between different simulations. This is a more complex interaction that is clarified later by more carefully tracking the towers and troughs as they change location. The strongest correlation is between w and depletion, which generally shows that areas of depleted are towers, and regions of minimal depletion are troughs. This is interpreted as towers being regions of intense burning and relatively little mixing. When relatively little fresh air is mixed in, it comes in from above the fire where ambient air is carried down. Conversely air in the towers is being drafted up from the surface where there is significant combustion and thus the is not renewed.
Though the burn scars (Figure 2) show fairly linear features parallel to the mean flow, the towers and troughs do meander dynamically on spatial scales up to several meters perpendicular to bulk wind flow (i.e., the towers and troughs often wander across several cells in the cross-stream direction, both in real fires and in the simulation). The tendency for flame structures to wiggle in the lateral is physically realistic given the turbulent nature of the flame front, but it partially reduces the value of the results in this section where simulated data are taken at stationary points that were held stationary in the cross-stream direction. Unfortunately, while the signatures of towers and troughs can be clearly visualized in burn patterns in the fuel and vorticity patterns in the gas, the pattern is still not as stationary and the meandering of these patterns in time or downwind direction requires care to be taken in the analysis. This can most clearly be seen in contrast between Figure 3 vs. Figure 4. These results are still included here as they illustrate some characteristics of the towers and troughs as well as the meandering nature of these features, but they also illustrate the care that should be taken when analyzing point field measurements.
3.2. Non-Stationary Tower and Trough Characteristics
Coherent structures surrounding a stationary point were found to transition between being a tower and trough at different time steps, which contaminated the results of Section 3.1. In some cases, the transient behavior was so erratic that a given location might even be an approximately equal blend of tower or trough behavior over the duration of the simulation. The results were therefore somewhat ambiguous, with both towers and troughs appearing at the same location at different time steps. Similar difficulties are likely to be encountered in physical experiments, where detectors might be entirely fixed or at least unable to keep pace with the rapid flickering of the flame. However, in simulations, because we have such a larger richness of virtual data, it is possible to attempt to de-convolute the characteristics of towers from troughs as much as possible.
In order it improve our ability to use the simulation data to provide useful analysis of this fireline structure and make inferences relevant to laboratory data where the positions of towers and troughs might be more static, we attempted to track to positions of rising and falling seams of the streamwise vorticity patterns in the test plane. Figure 4 supports the following trends seen when the updrafts and downdrafts are tracked as they shift spatially in the test plane.
The correlation coefficient of w and is, again, the strongest of all the quantities of interest in the left panel of Figure 4. It is a consistent, strong anti-correlation, indicating that generally positive values of w (towers or updrafts in the streamwise pattern behind the fire front) coincide with heavily depleted oxygen, while the opposite is generally true for troughs or downdraft locations. This is likely the clearest differentiation between a tower or trough. The w component of the wind is relatively small compared to the u component (ambient) because the statistics are being recorded close to the ground and even in the towers, the air is still accelerating as it moves upward. When the updraft is fire-induced (rather than a result of ambient turbulence) it is due to relatively intense local combustion and oxygen consumption. Interestingly, the anticorrelations can be seen in the untracked towers as well. The troughs also show this anticorrelation but with opposite signs on both the oxygen and velocity fluctuations. In these locations, downward motions carry oxygen rich air from above. By spatially tracking the updrafts and downdrafts, it becomes apparent that an even stronger anticorrelation exists between w and concentration in the updrafts, and its magnitude is weaker in the troughs. This can be thought of as similar to the circulations in an unstable mixing environment where there is large but diffuse downdraft regions and more concentrated updrafts. Here it is similar for the flux of oxygen.
In general, IUx0.5 has relatively strong correlations (or anticorrelations) between related quantities, while IUx2 correlation coefficients are far lower. From plots of their respective quantities of interest over time, IUx0.5 (half as much fuel as base case) is a rapidly propagating, short duration flame with strong characteristics of a wind driven fire and winds easily penetrate through the fire’s plume. The larger quantity of fuel in IUx2 (twice as much fuel as base case) leads to a deeper flame front with more characteristics of a plume dominated fire and highly chaotic behavior inside the fire perimeter as mean wind is less effective at blowing through the plume, thus degrading correlation coefficient magnitude. Similar to the untracked cases (Section 3.1), high streamwise winds (wind in the u direction) are correlated with high solid and gas temperatures ( and ). Also as seen in the untracked towers and troughs analyses, the correlation between gas temperature and u is stronger than the correlation because high winds also contribute to convective cooling.
As with u, there is a strong correlation between w and both and in the spatially tracked experiments. This is in striking contrast to the much lower low correlation in the untracked experiments (the flickering nature of the tower-trough structures weakens the correlations), and must be interpreted differently than the correlations. In the case of vertical air flow, both positive and negative values are critical for interpretation. In the case of towers, the vertical airflow is positive, and the correlation with is slightly weaker than the correlation between positive w and , which implies a strong coupling between a high w value due to a large amount of energy released into the gas and a strong buoyant force with a slightly weaker coupling to the solid temperature. In the case of negative w values, the gas temperature is relatively weakly correlated with the value of w as compared to the correlation in towers. The correlation implies that strong downdrafts are associated with cooler air, which is intuitive, and the weaker value can be thought of again as an analogy to the circulations present in the atmosphere where there are small strong concentrated updraft locations, but larger areas of weaker downward motions. More interestingly, the coupling between negative values of w and is strong relative to both the trough correlation and the tower correlation. This is caused by the negative w values carrying cool ambient air and convectively cooling fuels, leading to low , resulting in warming of the air which is advected away.
On the other hand, there is very low correlation between v velocity and the variables of interest. This is due to the fact that the pairs of streamwise vortices and thus the towers and troughs have converging and diverging lateral flows associated with them. There is no preferential difference between a positive and negative v since they are occurring in somewhat symmetric pairs.
3.3. Temporal Evolution of Towers and Trough Structures
The various simulation scenarios produced dozens of towers and troughs. It is unnecessary and impractical to plot results from every flame structure, but temporal signatures from representative towers and troughs (from the non-stationary analysis) are shown below (Figure 5, Figure 6, Figure 7 and Figure 8).
Figure 5, which illustrates the convective heating to the fuel and oxygen depletion, shows that for all of the simulations there is a rapid convective heating period followed by a longer convective cooling period, which occurs once the fuel temperatures gets sufficiently elevated. In all of the simulations, oxygen depletion at the tower locations begins during the heating phase (near the fire front) and in most cases oxygen continues into the time period where the fuel is hot and starts being convectively cooled. During this period when there is significant oxygen depletion there are intermittent partial recovery of the oxygen concentration levels associated with turbulent wind gusts. The duration of the oxygen depletion as well as the period of convective cooling is dependent on the amount of fuel that is present to burn as illustrated by the much shorter timescales for these values in the IUx0.5 simulation.
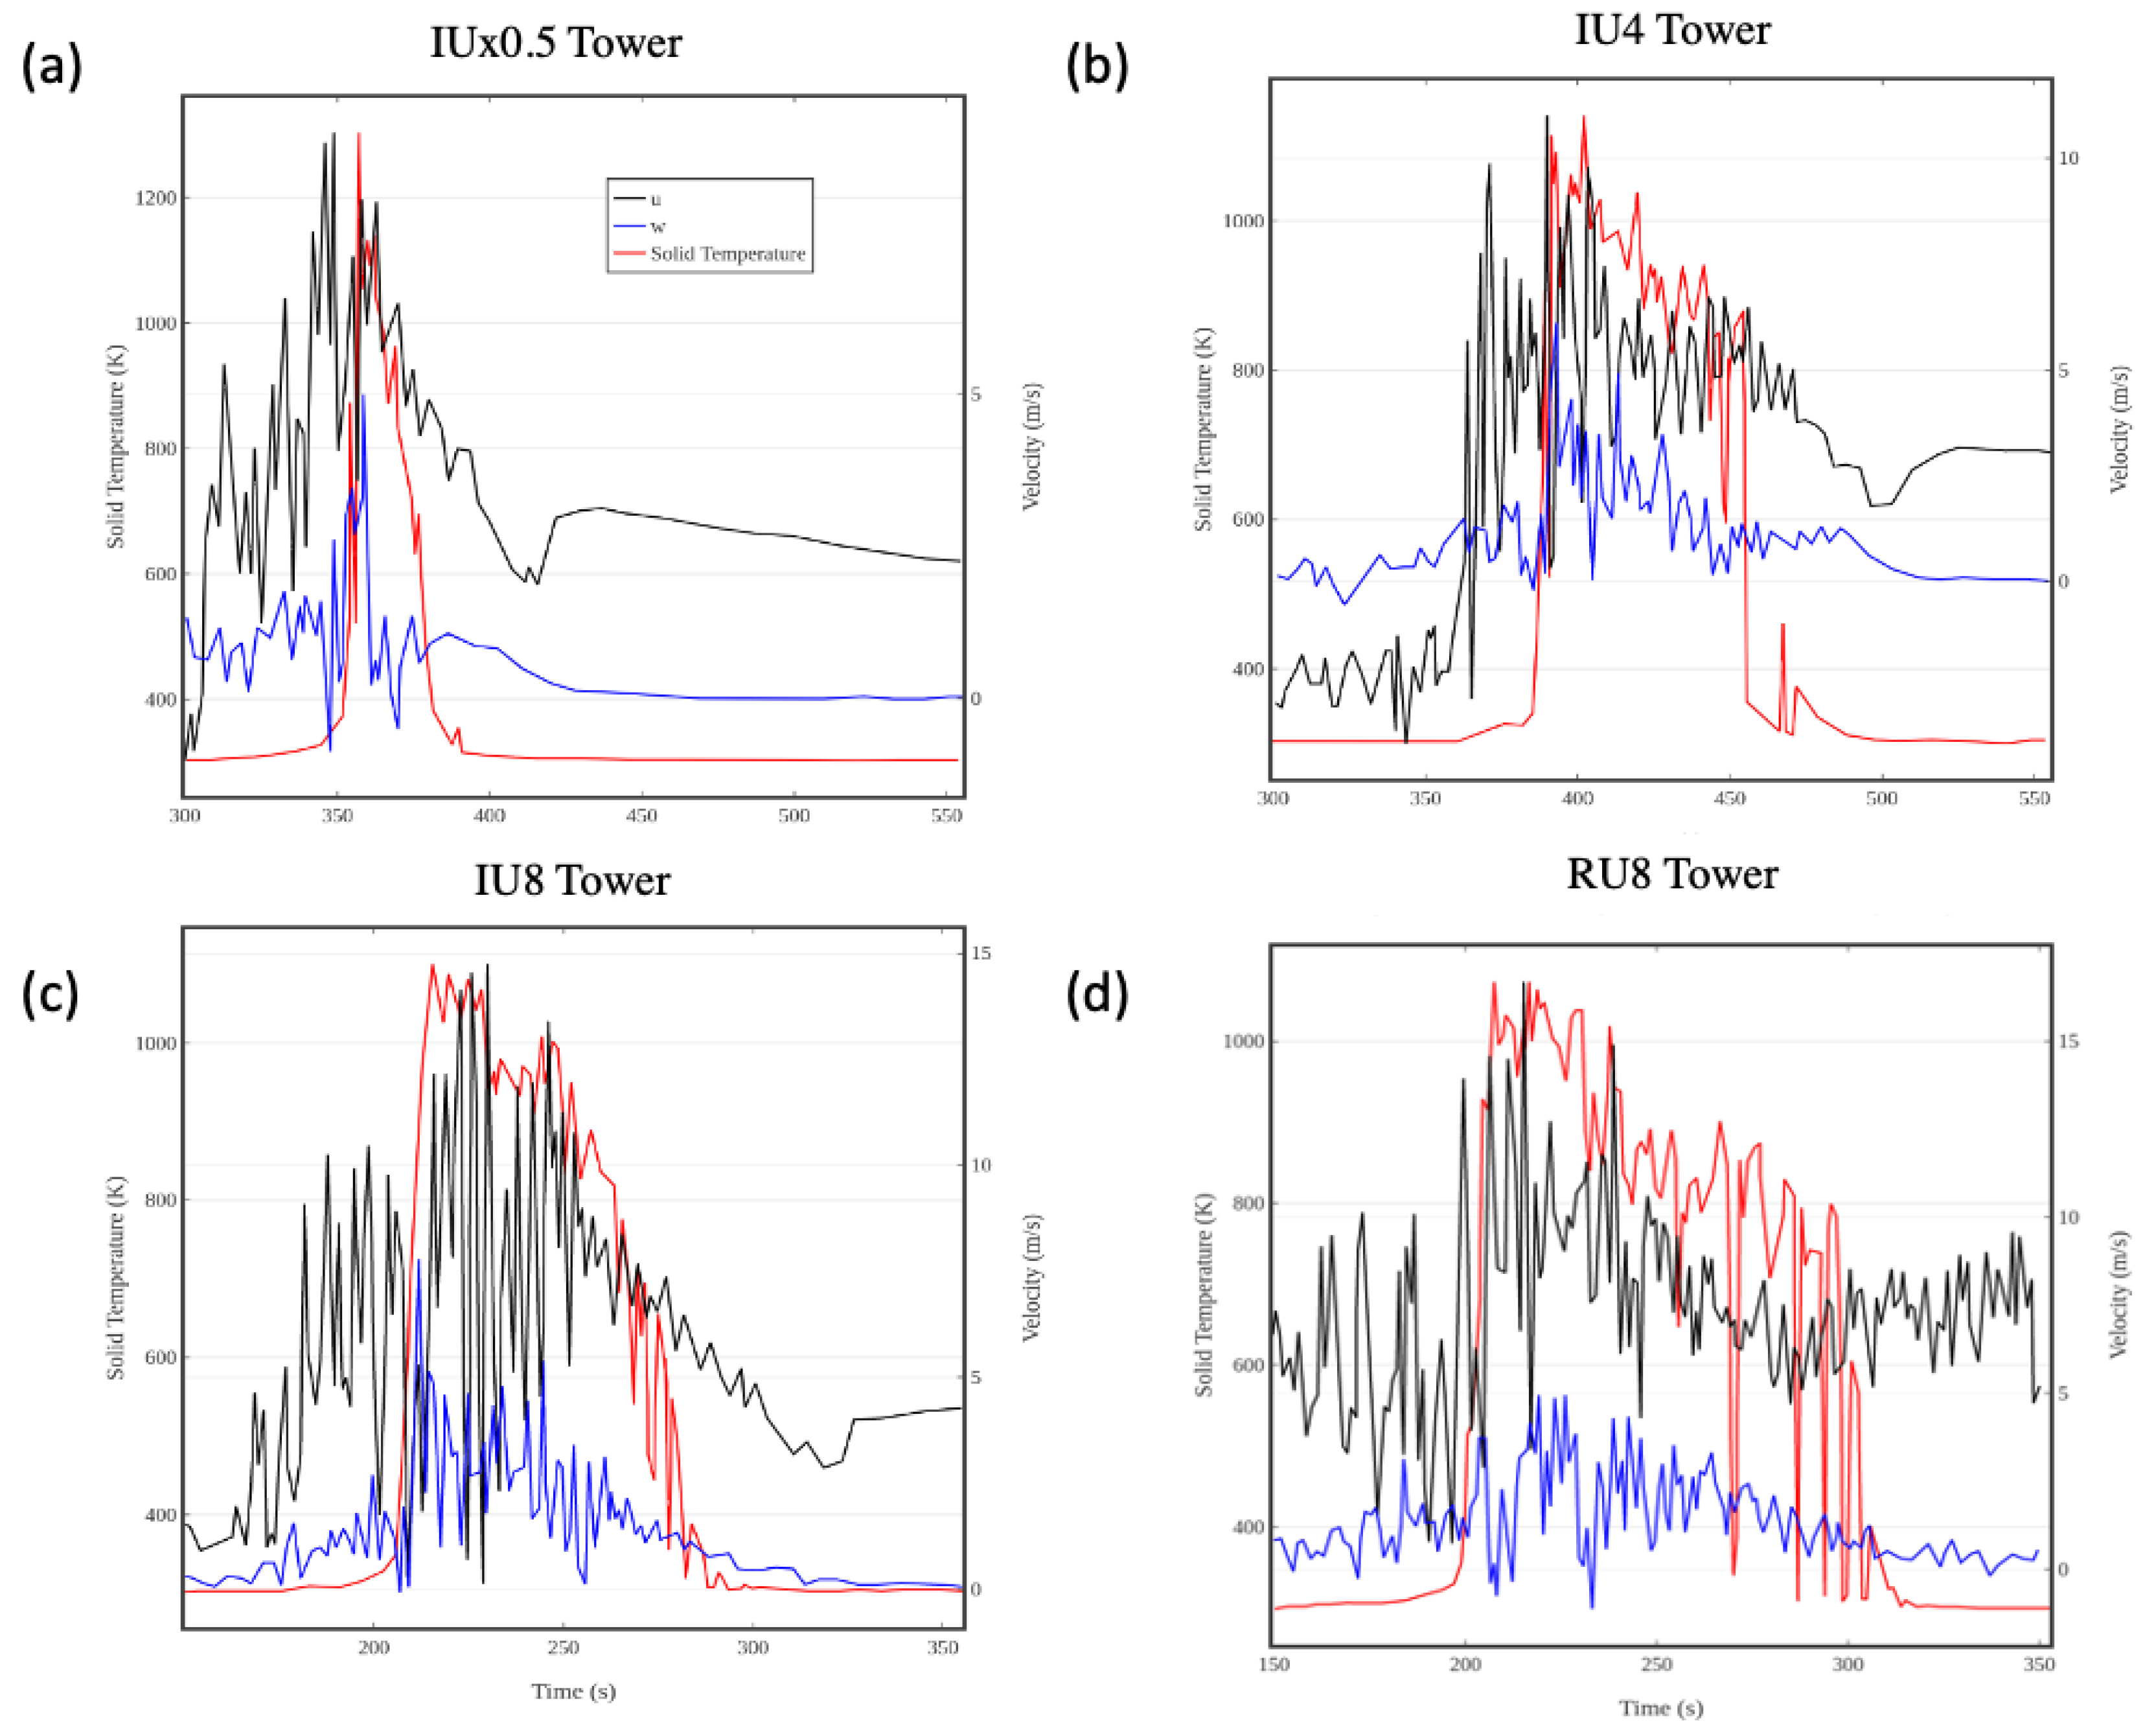
Figure 6 confirms that the transition from convective heating to convective cooling is consistent with time when the temperature of the fuel has grown significantly. The temperature spike has associated elevated velocity periods as well. This figure also illustrates the fact that in the realistic wind case the mixing is more effective at bringing faster moving air down to the surface as the streamwise velocity is higher in this case (RU) at the surface before and after the fire. Behind the fire, the streamwise winds settle back to a value higher than the wind speed before the effects of the fire were felt due to reduced drag (but to a lesser degree in RU case, where mixing plays a bigger role in bringing high speed winds to the surface). Another interesting observation is that in most of the cases, the streamwise winds increase in magnitude before the fuel temperature starts to rise. This is probably due to the convective pre-heating of fuel elements before the flame front reaches a particular location. It is also important to note that high wind-speeds and turbulence degrade the correlations, and a higher temporal and spatial resolution are needed to study the effects on coherent structure at higher wind speeds.
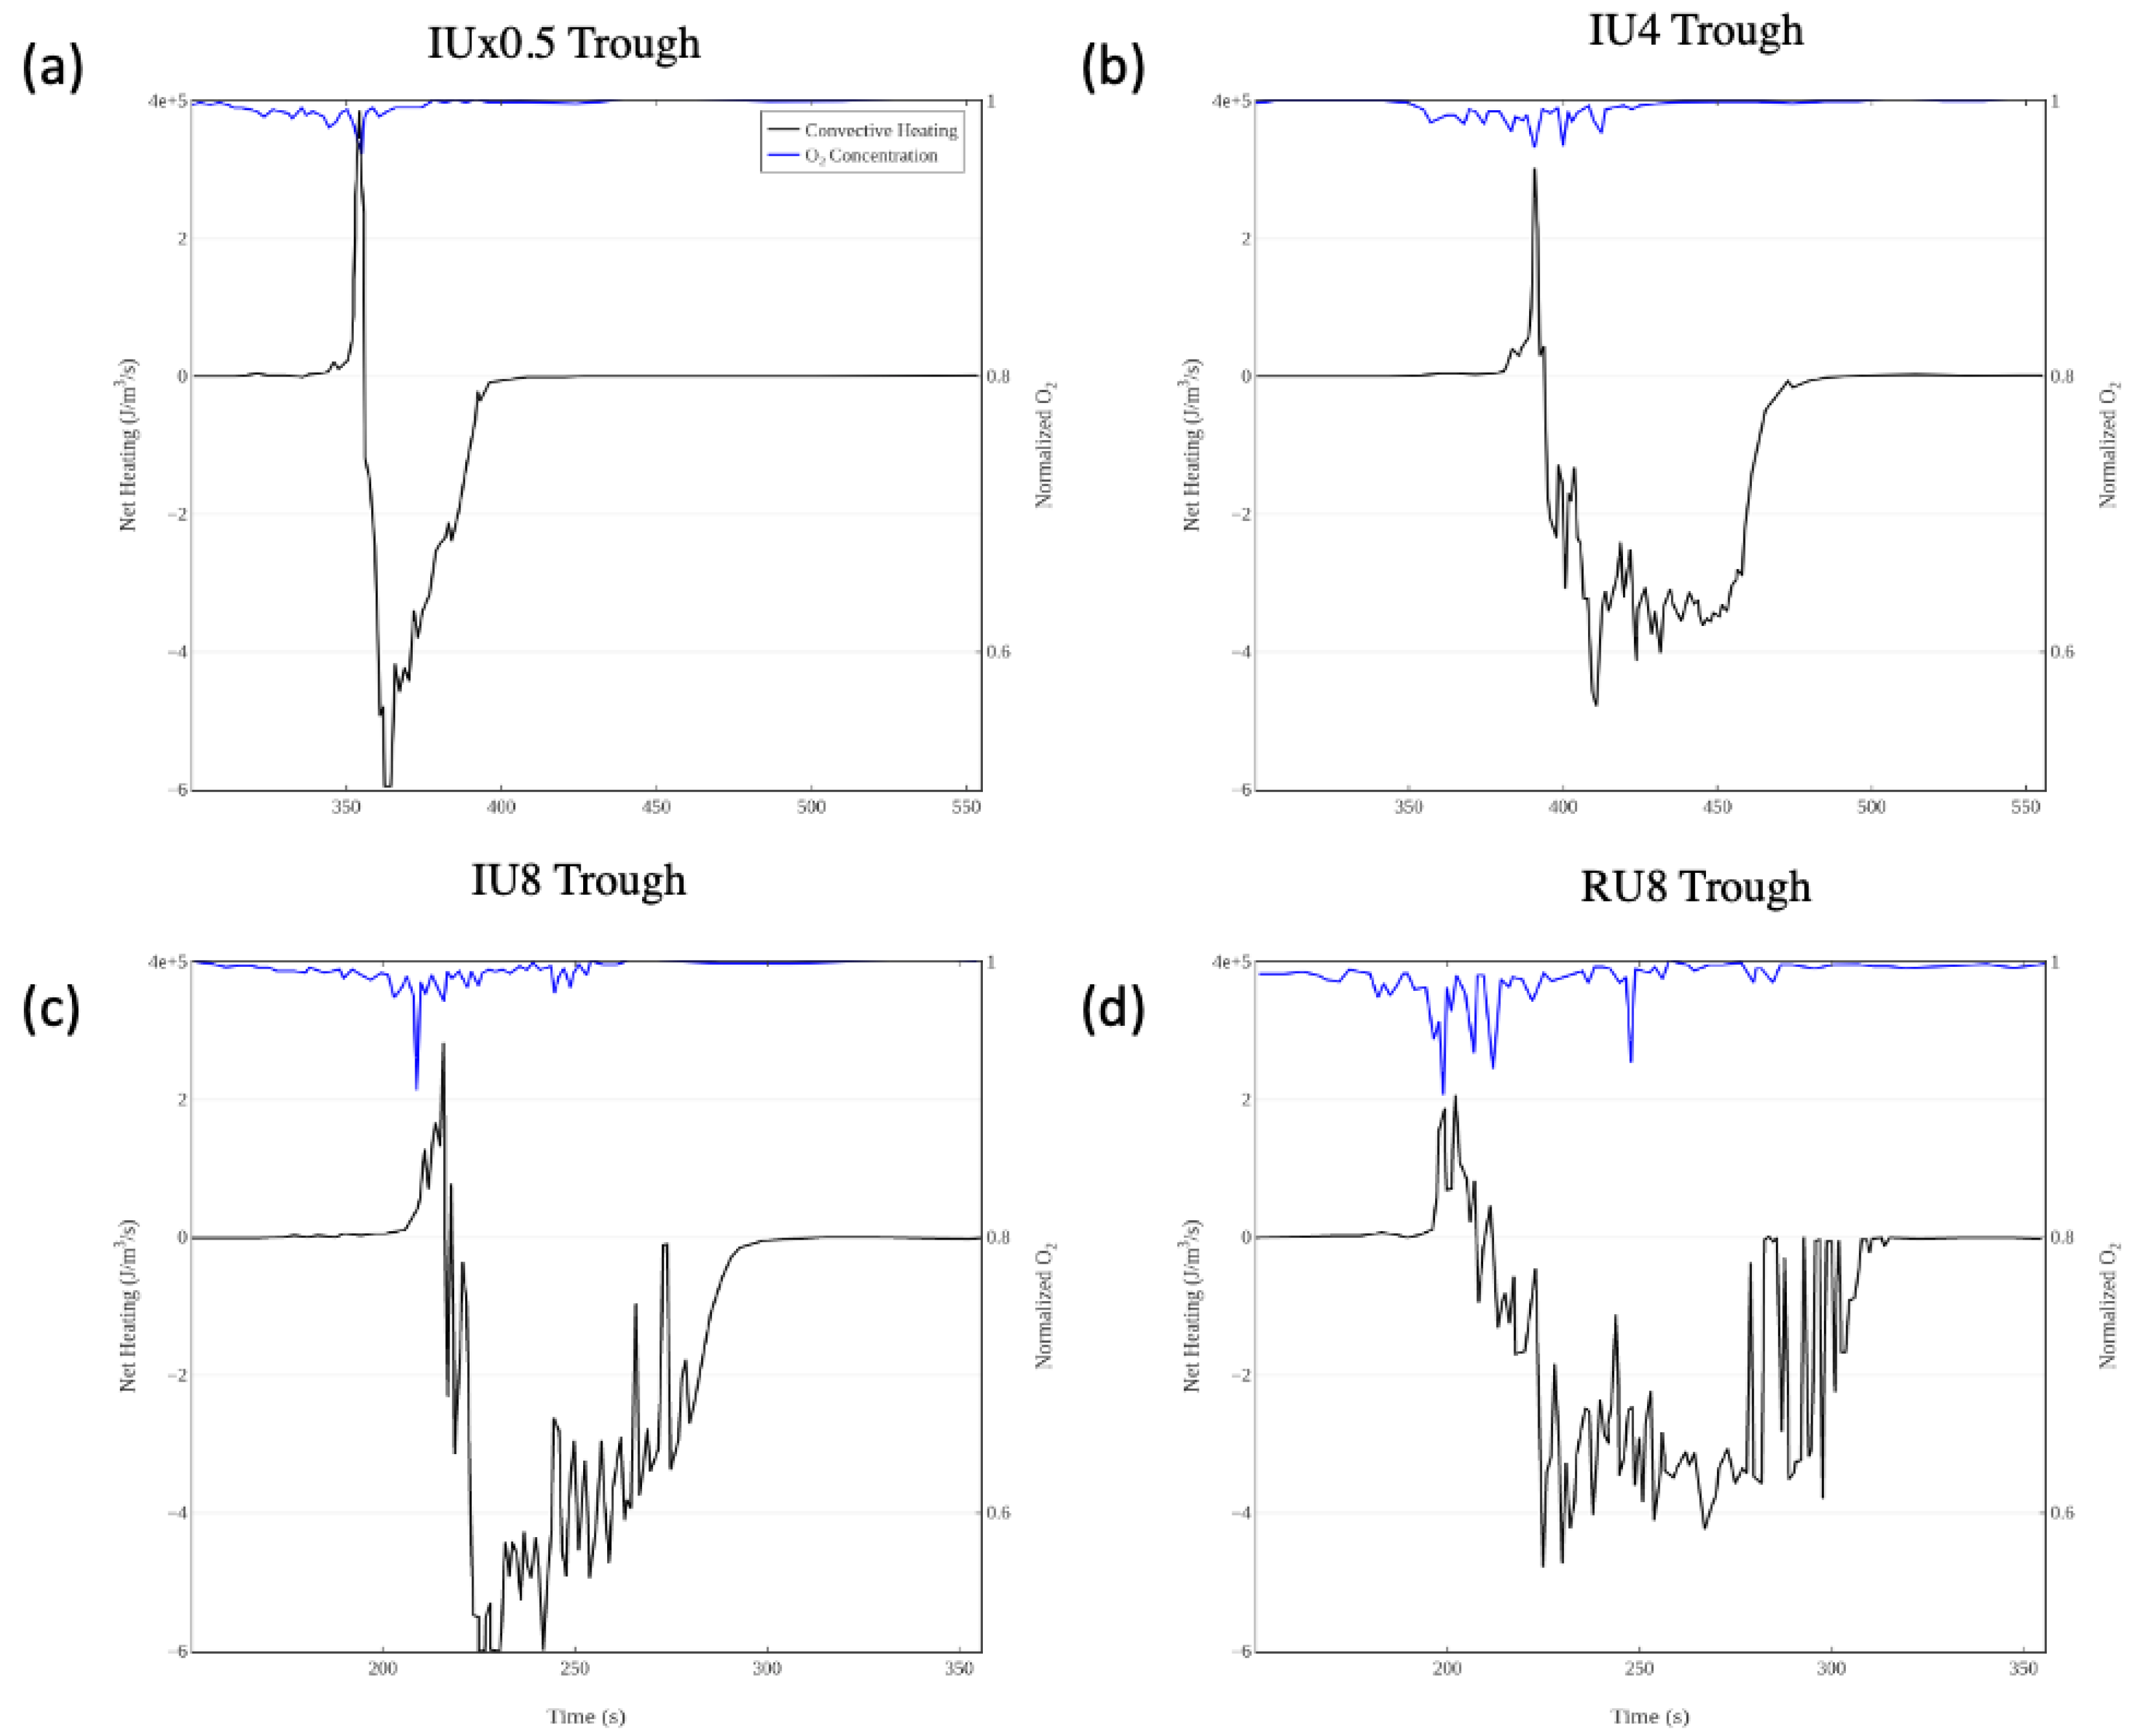
Figure 7 shows that the rapid convective heating followed by convective cooling for a longer duration exists in the troughs as well, but there is minimal oxygen depletion in these regions. The most noteworthy difference between the towers and troughs is shown in Figure 8 where the vertical velocity actually becomes negative during most of the period when the temperatures are elevated. Figure 8 also shows that in the troughs the streamwise winds are consistently elevated before the fire reaches the test plane as winds push through the toughs. The fluctuations in the streamwise wind are less in the case of half as much fuel, IUx0.5, and the velocity and temperature signatures in this case are much shorter than in the cases with more fuel.
Both Figure 6 and Figure 8 illustrate the rapid growth of solid temperatures upon ignition and the decrease of the same nearly as sharply upon burnout. Please note that these simulations consider only fine fuels that cool quickly. The duration of the elevated temperature period is tied to the fuel load and is thus shorter when there is less fuel. The frequency and amplitude of wind fluctuations are often dampened in the combustion region. This is especially true of troughs and lower wind speeds, presumably because the pressure gradient caused by the tower induces a substantial portion of the trough winds, especially at low ambient wind speeds.
4. Conclusions
The current work investigated the characteristic features of tower and trough type structures using numerical simulations, which has been recently identified as the dominant coherent structures associated with fire front propagation. We attempted to address two major aspects: (1) the nature of fire—atmosphere interaction specific to the tower and trough type structures; and (2) the sensitivity of such structures to fuel loading, fuel height and wind speeds. To address these issues, a physics-based wildland fire behavior model called FIRETEC was used to simulate grass fires starting from a linear ignition and moving through a homogeneous fuel bed for a range of wind speeds. Some simulations tested the effects of altering the amount of fuel as well. Macro-scale structures that emerged from simulations and were common to all simulations were investigated to extract tower and trough type features. Towers were designated as zones that are burning and associated with updrafts of the vertical wind velocity. Troughs were classified as zones with downdrafts of the vertical wind velocity. Combined, they result in a ‘finger like’ organizations in the flame front. These structures were found to be move laterally in space, which means they can meander around the location from where they originate, yet maintaining their coherence. Studying the structure of the towers and troughs therefore required tracking them in neighboring locations perpendicular to the wind direction in order to study their features in time. Using this approach, highly coherent features were detected in both towers and troughs. Apart from the obvious defining features of positive vertical velocity in towers and negative vertical velocity in troughs, oxygen concentration is the most important parameters defining their characteristics. Towers are associated with depleted oxygen, where troughs are oxygen rich. They are also associated with different rates of radiative and convective heating and cooling. The structures are also sensitive to fuel height and wind speeds. Shorter fuel heights result in thinner and rapidly progressing fire fronts compared to a thicker flame front for larger fuel depths, which makes it more difficult to observe tower-trough dynamics. Higher wind speeds also mean more rapid downdrafts leading to faster replacement of warm air with cold air in the flame front, which changes the characteristic time and spatial scales of the towers and troughs. One major outcome of this study is delineating the differences between the tower and trough structures, as they relate to coupled fuel-fire-atmosphere interaction in different ways, yet organize together in the flame structure. Another important conclusion from this study is the fact that physics-based simulations can consistently demonstrate and reproduce tower trough type structures under a range of environmental conditions as an emergent feature, without any applied artificial numerical forcing. Earlier these structures were observed in lab experiments and some limited simulation studies. This lends confidence in the practice of using physics-based models in fire and fuel management. Future works will be targeted to compare physics-based models and lab/field experiments in accurately predicting the locations and distributions of towers and troughs as well as elucidating their intermittent turbulent features. Nonetheless, it can be concluded that this work has defined some quantified baseline cases against which future experimental studies can be benchmarked for simple homogeneous fuel loadings.
Author Contributions
Conceptualization, R.L., T.H., T.B., and K.S.; methodology, R.L., T.H., T.B., M.H., and K.S.; software, R.L. and T.H.; validation, R.L.; formal analysis, T.H.; investigation, T.H., M.H.; resources, R.L.; data curation, T.H. and T.B.; writing—original draft preparation, T.H.; writing—review and editing, T.B.; visualization, T.H. and K.S.; supervision, R.L.; project administration, R.L.; funding acquisition, R.L., T.B., and K.S. All authors have read and agreed to the published version of the manuscript.
Funding
T. Banerjee acknowledges the funding support from the University of California Laboratory Fees Research Program funded by the UC Office of the President (UCOP), grant ID LFR-20-653572. Additional support was provided by the new faculty start up grant provided by the Department of Civil and Environmental Engineering, and the Henry Samueli School of Engineering, University of California, Irvine. This work was supported by the USFS RMRS as well. This research was partially supported by LDRD funds through the Los Alamos National Laboratory Center for Space and Earth Science.
Acknowledgments
The authors gratefully acknowledge useful correspondence with Michael Gollner of the University of Maryland and Mark Finney of the U.S. Forest Service.
Conflicts of Interest
The authors declare no conflict of interest. The funders had no role in the design of the study; in the collection, analyses, or interpretation of data; in the writing of the manuscript, or in the decision to publish the results.
References
- McKenzie, D.; Miller, C.; Falk, D.A. The Landscape Ecology of Fire; Springer: Berlin, Germany, 2011. [Google Scholar]
- Finney, M.; Cohen, J.; Forthofer, J.; McAllister, S.; Gollner, M.; Gorham, D.; Saito, K.; Akafuah, N.; Adam, B.; English, J. Role of buoyant flame dynamics in wildfire spread. Proc. Natl. Acad. Sci. USA 2015, 112, 9833–9838. [Google Scholar] [CrossRef] [Green Version]
- Holland, T.; Banerjee, T.; Holmes, M.; Linn, R. The Impact of Fuel Loading on Buoyancy-induced Counter-rotational Vortices. In Proceedings of the Western States Meeting of the Combustion Institute, Bend, OR, USA, 25–27 March 2018. [Google Scholar]
- Gilpin, R.; Imura, H.; Cheng, K. Experiments on the onset of longitudinal vortices in horizontal Blasius flow heated from below. J. Heat Transf. 1978, 100, 71–77. [Google Scholar] [CrossRef]
- Imura, H.; Gilpin, R.; Cheng, K. An experimental investigation of heat transfer and buoyancy induced transition from laminar forced convection to turbulent free convection over a horizontal isothermally heated plate. J. Heat Transf. 1978, 100, 429–434. [Google Scholar] [CrossRef]
- Wang, X. An experimental study of mixed, forced, and free convection heat transfer from a horizontal flat plate to air. J. Heat Transf. 1982, 104, 139–144. [Google Scholar] [CrossRef]
- Moharreri, S.; Armaly, B.; Chen, T. Measurements in the transition vortex flow regime of mixed convection above a horizontal heated plate. J. Heat Transf. 1988, 110, 358–365. [Google Scholar] [CrossRef]
- Miller, C.; Finney, M.; McAllister, S.; Sluder, E.; Gollner, M. Investigating coherent streaks in wildfires via heated plates in crosswind. Fire Saf. J. 2017, 91, 735–741. [Google Scholar] [CrossRef]
- Miller, C.; Tang, W.; Finney, M.; McAllister, S.; Forthofer, J.; Gollner, M. An investigation of coherent structures in laminar boundary layer flames. Combust. Flame 2017, 181, 123–135. [Google Scholar] [CrossRef] [Green Version]
- Miller, C.; Tang, W.; Sluder, E.; Finney, M.; McAllister, S.; Forthofer, J.; Gollner, M. Boundary layer instabilities in mixed convection and diffusion flames with an unheated starting length. Int. J. Heat Mass Transf. 2018, 118, 1243–1256. [Google Scholar] [CrossRef]
- Panton, R. Overview of the self-sustaining mechanisms of wall turbulence. Prog. Aerosp. Sci. 2001, 37, 341–383. [Google Scholar] [CrossRef]
- Kline, S.; Reynolds, W.; Schraub, F.; Runstadler, P. The structure of turbulent boundary layers. J. Fluid Mech. 1967, 30, 741–773. [Google Scholar] [CrossRef] [Green Version]
- Sparrow, E.; Husar, R. Longitudinal vortices in natural convection flow on inclined plates. J. Fluid Mech. 1969, 37, 251–255. [Google Scholar] [CrossRef]
- Gorham, D.; Hakes, R.; Singh, A.; Forthofer, J.; Cohen, J.; McAllister, S.; Finney, M.; Gollner, M. Studying Wildland Fire Spread Using Stationary Fires. Adv. For. Fire Res. 2014, 422–433. [Google Scholar]
- Finney, M.; Forthofer, J.; Grumstrup, T. Wind and Slope effects on Flame Scaling in Laboratory Fires. In Proceedings of the Eighth International Symposium on Scale Modeling, Portland, OR, USA, 12–14 September 2017. [Google Scholar]
- Clark, T.; Radke, L.; Coen, J.; Middleton, D. Analysis of small scale convective dynamics in a crown fire using infrared video camera imagery. J. Appl. Meteorol. 1999, 38, 1401–1420. [Google Scholar] [CrossRef] [Green Version]
- Clark, T.; Reeder, M.; Griffiths, M.; Packham, D.; Krusel, N. Infrared observations and numerical modelling of grassland fires in the Northern Territory, Australia. Meteorol. Atmos. Phys. 2005, 88, 193–201. [Google Scholar] [CrossRef]
- Atkinson, G.; Drysdale, D.; Wu, Y. Fire driven flow in an inclined trench. Fire Saf. J. 1995, 25, 141–158. [Google Scholar] [CrossRef]
- Cunningham, P.; Linn, R. Numerical simulations of grass fires using a coupled atmosphere-fire model: Dynamics of fire spread. J. Geophys. Res. Atmos. 2007, 112, 17. [Google Scholar] [CrossRef]
- Linn, R.; Canfield, J.; Cunningham, P.; Edminster, C.; Dupuy, J.; Pimont, F. Using periodic line fires to gain a new perspective on multi-dimensional aspects of forward fire spread. Agric. For. Meteorol. 2012, 157, 60–76. [Google Scholar] [CrossRef]
- Canfield, J.; Linn, R.; Sauer, J.; Finney, M.; Forthofer, J. A numerical investigation of the interplay between fireline length, geometry, and rate of spread. Agric. For. Meteorol. 2014, 189, 48–59. [Google Scholar] [CrossRef]
- Tang, W.; Gorham, D.; Gollner, M.; Forthofer, J.; Finney, M. Forward Pulsation Behavior in Wind-driven Line Fires. In Proceedings of the 9th U.S. National Meeting of the Combustion Institute, College Park, MD, USA, 23–26 April 2017. [Google Scholar]
- Tang, W.; Gorham, D.; Finney, M.; McAllister, S.; Cohen, J.; Forthofer, J.; Gollner, M. An experimental study on the intermittent extension of flames in wind-driven fires. Fire Saf. J. 2017, 91, 742–748. [Google Scholar] [CrossRef]
- Zocchi, G.; Moses, E.; Libchaber, A. Coherent structures in turbulent convection, an experimental study. Phys. Stat. Mech. Its Appl. 1990, 166, 387–407. [Google Scholar] [CrossRef]
- Kamotani, Y.; Lin, J.; Ostrach, S. Effect of Destabilizing Heating on Görtler Vortices. J. Heat Transf. 1985, 107, 877–882. [Google Scholar] [CrossRef]
- Toé, R.; Ajakh, A.; Peerhossaini, H. Heat transfer enhancement by Görtler instability. Int. J. Heat Fluid Flow 2002, 23, 194–204. [Google Scholar] [CrossRef]
- Floryan, J. On the görtler instability of boundary layers. Prog. Aerosp. Sci. 1991, 28, 235–271. [Google Scholar] [CrossRef]
- Linn, R. A Transport Model for Prediction of Wildfire Behavior; New Mexico State University: Las Cruces, NM, USA, 1997. [Google Scholar]
- Linn, R.; Harlow, F. Mixing-limited transport model used for description of wildfires. In Computational Technologies for Fluid/Thermal/Structural/Chemical Systems with Industrial Applications; Amer Society of Mechanical: New York, NY, USA, 1998; pp. 161–168. [Google Scholar]
- Linn, R.; Cunningham, P. Numerical simulations of grass fires using a coupled atmosphere-fire model: Basic fire behavior and dependence on wind speed. J. Geophys. Res. Atmos. 2005, 110, 19. [Google Scholar] [CrossRef]
- Savill, A. Recent Developments in Rapid-Distortion Theory. Annu. Rev. Fluid Mech. 1987, 19, 531–573. [Google Scholar] [CrossRef]
Figure 1.
Visualization of counter-rotational vortices and tower—trough structures. This is a snapshot of FIRETEC simulation, showing instantaneous vertical (w) velocity. The red structures indicate towers and the blue structures are troughs [3]. The prevailing wind direction is from left to right. A scale is shown for reference.

Figure 2.
Fire spread and fuel consumption for the idealistic wind case (left) and the realistic wind field (right) 300 s after ignition. The data were collected on a planar test area (vertical plane 80 wide in crosswind (y) direction and 9 tall located 300 downwind (x) of the upwind boundary) and all quantities of interest were recorded (marked on figure). For tower and trough behavior, 4 points each were selected at a line on this plane at 1.5 m height, just above the fuel bed. This line was centered in the cross-stream (or y) direction. The locations of the towers and troughs are marked on the figures with markers—red for towers and blue for troughs. The third panel shows all idealized and realistic wind profiles.

Figure 3.
(Left) Correlation coefficient between different flow quantities associated with untracked or stationary towers. The y axis shows the two fluctuating quantities (separated by /) between which the correlation coefficients are computed. U,V,W indicate the longitudinal, cross-stream and vertical wind velocities, indicates gas temperature, indicates solid or fuel temperature, denotes radiative heating, indicates convective heating, denotes oxygen concentration. On the x axis, the different simulation cases are shown. A colormap is used to highlight the correlation coefficient magnitude for ease of comparison. (Right) Same as the left panel but for untracked or stationary troughs.

Figure 4.
Same as Figure 3, but for tracked or non-stationary towers (left) and troughs (right).
Figure 4.
Same as Figure 3, but for tracked or non-stationary towers (left) and troughs (right).

Figure 5.
Non-stationary tower plots of oxygen concentration (blue lines) and convective heat flux to the fuels (black lines). Panel titles indicate the simulation cases being depicted. (a) IUx0.5 Tower (b) IU4 Tower (c) IU8 Tower (d) RU8 Tower.
Figure 5.
Non-stationary tower plots of oxygen concentration (blue lines) and convective heat flux to the fuels (black lines). Panel titles indicate the simulation cases being depicted. (a) IUx0.5 Tower (b) IU4 Tower (c) IU8 Tower (d) RU8 Tower.

Figure 6.
Non-stationary tower plots of solid temperature (red lines), horizontal wind velocity (black lines) and vertical wind velocity components (blue lines). Panel titles indicate the simulation cases being depicted. (a) IUx0.5 Tower (b) IU4 Tower (c) IU8 Tower (d) RU8 Tower.
Figure 6.
Non-stationary tower plots of solid temperature (red lines), horizontal wind velocity (black lines) and vertical wind velocity components (blue lines). Panel titles indicate the simulation cases being depicted. (a) IUx0.5 Tower (b) IU4 Tower (c) IU8 Tower (d) RU8 Tower.

Figure 7.
Non-stationary trough plots of oxygen concentration (blue lines) and convective heat flux to the fuels (black lines). Panel titles indicate the simulation cases being depicted. (a) IUx0.5 Trough (b) IU4 Trough (c) IU8 Trough (d) RU8 Trough.
Figure 7.
Non-stationary trough plots of oxygen concentration (blue lines) and convective heat flux to the fuels (black lines). Panel titles indicate the simulation cases being depicted. (a) IUx0.5 Trough (b) IU4 Trough (c) IU8 Trough (d) RU8 Trough.

Figure 8.
Non-stationary trough plots of solid temperature (red lines), horizontal wind velocity (black lines) and vertical wind velocity components (blue lines). Panel titles indicate the simulation cases being depicted. (a) IUx0.5 Trough (b) IU4 Trough (c) IU8 Trough (d) RU8 Trough.
Figure 8.
Non-stationary trough plots of solid temperature (red lines), horizontal wind velocity (black lines) and vertical wind velocity components (blue lines). Panel titles indicate the simulation cases being depicted. (a) IUx0.5 Trough (b) IU4 Trough (c) IU8 Trough (d) RU8 Trough.


Table 1.
Experimental design summary.
| Simulation | Wind ( at 10 m Height) | Fuel Height () | Fuel Load () |
|---|---|---|---|
| IU4 | Ideal, 4 | 0.7 | 0.7 |
| RU4 | Real, 4 | 0.7 | 0.7 |
| IU8 | Ideal, 8 | 0.7 | 0.7 |
| RU8 | Real, 8 | 0.7 | 0.7 |
| IUx2 | Ideal, 4 | 1.4 | 1.4 |
| IUx0.5 | Ideal, 4 | 0.35 | 0.35 |
© 2020 by the authors. Licensee MDPI, Basel, Switzerland. This article is an open access article distributed under the terms and conditions of the Creative Commons Attribution (CC BY) license (http://creativecommons.org/licenses/by/4.0/).
Share and Cite
MDPI and ACS Style
Banerjee, T.; Holland, T.; Solander, K.; Holmes, M.; Linn, R. Identifying Characteristics of Wildfire Towers and Troughs. Atmosphere 2020, 11, 796. https://doi.org/10.3390/atmos11080796
AMA Style
Banerjee T, Holland T, Solander K, Holmes M, Linn R. Identifying Characteristics of Wildfire Towers and Troughs. Atmosphere. 2020; 11(8):796. https://doi.org/10.3390/atmos11080796
Chicago/Turabian StyleBanerjee, Tirtha, Troy Holland, Kurt Solander, Marlin Holmes, and Rodman Linn. 2020. "Identifying Characteristics of Wildfire Towers and Troughs" Atmosphere 11, no. 8: 796. https://doi.org/10.3390/atmos11080796
Note that from the first issue of 2016, this journal uses article numbers instead of page numbers. See further details here.