

Abstract
In particle therapy, the x-ray based treatment planning converting photon attenuation values to relative stopping power ratio (RSP) introduces clinically relevant range uncertainties. Recently, novel imaging technologies using transmission ion beams have been investigated to directly assess the water equivalent thickness (WET) of tissue, showing improved accuracy in RSP reconstruction, while potentially reducing the imaging dose. Due to their greater availability, protons have been mostly used for ion imaging. To this end, in this work, the influence of three ion species (protons, helium and carbon ions) on the image quality of radiographic WET retrieval has been explored with a dedicated experimental setup and compared to Monte Carlo (MC) simulations. Three phantom setups with different tissue interfaces and features have been irradiated with clinically validated proton, helium and carbon ion pencil beams under comparable imaging dose and beam settings at the Heidelberg Ion-Beam Therapy Center. Ion radiographies (iRADs) were acquired with an integration mode detector, that functions as a range telescope with 61 parallel plate ionization chambers. For comparison, experiments were reproduced in-silico with FLUKA MC simulations. Carbon ions provide iRADs with highest image quality in terms of normalized root mean square error, followed by helium ions and protons. All ions show similar capabilities of resolving WET for the considered phantoms, as shown by the similar average relative error < 3%. Besides for the slab phantom, MC simulations yielded better results than the experiment, indicating potential improvement of the experimental setup. Our results showed that the ability to resolve the WET is similar for all particles, intrinsically limited by the granularity of the detector system. While carbon ions are best suited for acquiring iRADs with the investigated integration mode detector, helium ions are put forward as a less technical challenging alternative.
Export citation and abstract BibTeX RIS

Original content from this work may be used under the terms of the Creative Commons Attribution 3.0 license. Any further distribution of this work must maintain attribution to the author(s) and the title of the work, journal citation and DOI.
1. Introduction
Ion beam therapy offers various advantages compared to conventional radiotherapy based on x-rays. The main benefit of ions is due to the characteristic increase of energy deposition close to the end of their range, the so-called Bragg peak (BP) (Wilson 1946). This allows an excellent dosimetric conformity with improved targeting of the tumor and an efficient sparing of surrounding organs at risk. However, uncertainties in the ion beam range estimation can have profound implications on the actual dose delivery, potentially leading to severe underdosage of the tumor volume and overdosage of neighbouring healthy tissue.
Therefore, full exploitation of the ion beam therapy capabilities demands accurate knowledge of the ion beam range during the treatment planning and delivery processes (Paganetti 2012). Here, range uncertainties mainly arise from inter- and intra-fractional anatomical variations, patient setup errors and the determination of the relative (to water) ion stopping power (RSP) map of the patient. The latter uncertainty is mostly due to the current practice of relating the ion RSP to the Hounsfield unit (HU) information of x-ray imaging (i.e. treatment planning CT image). Thereby, a semi-empirical calibration is deployed to convert HU into RSP (Schaffner and Pedroni 1998, Rietzel et al 2007, Yang et al 2012). This procedure can cause range uncertainties of 1% to 5% (Yang et al 2012, Paganetti 2012). Therefore, the refinement of such RSP maps and the application of range verification techniques either prior to, during, or after the therapy (Knopf and Lomax 2013, Parodi 2014) are desirable in order to ensure an accurate and precise dose application.
Although additional approaches based on the usage of dual- or multi-energy x-ray CT have been proposed and found first clinical translation in a few centers (Möhler et al 2016, Wohlfahrt et al 2017), for ion beam therapy facilities offering sufficiently high energies to completely traverse the patient, ion imaging could be introduced as a technique for improved RSP and in vivo range estimation. Furthermore, the line integral of RSP, also denoted as water equivalent thickness (WET), provided by transmission ion radiographies (iRADs) can also be used to identify positioning errors or misalignments during patient setup (Farace et al 2016b, Hammi et al 2018, Cassetta et al 2019). This can be performed directly at the treatment site without requiring additional sources of x-ray radiation or other imaging technologies. Moreover, the WET measurement can be exploited to perform a patient-specific refinement of the HU-RSP calibration (Schneider et al 2005). By including the detector into a rotational gantry system, ion imaging can be extended to tomographic image reconstruction. Hereby, the RSP can be directly retrieved, completely eluding the uncertainty related to the HU-RSP calibration in the treatment planning process. Furthermore, ion imaging is expected to deliver a lower physical and biological dose to the patient compared to conventional x-ray imaging (Schulte et al 2005, Meyer et al 2019).
The use of protons for imaging applications was first pointed out by Cormack (Cormack 1963) and pursued in the pioneering work of Koehler (Koehler 1968) in the 1960s. In the mid-1990s, the research on ion imaging was continued as a result of the rapid spread of ion beam therapy, and to date considerable progress has been achieved. However, besides the demanding acquisition rate requirement for the detector read-out, multiple Coulomb scattering (MCS) is still a fundamental challenge, which prompts the consideration of heavier ions. MCS is caused by several elastic Coulomb interactions of the projectile with the target nuclei (Schardt et al 2010). The resulting lateral spread of particle beams is more pronounced for light (protons) than for heavier (helium, carbon) ions. Therefore, few groups have recently (re)explored the use of helium and carbon ions for imaging applications (Rinaldi et al 2014, Muraishi et al 2016, Volz et al 2017, Gehrke et al 2018b). The former using an integration mode detector. Compared to so-called tracking detectors, integrating systems are usually not single-particle sensitive, making the designs very cost-effective and much easier to operate (Rinaldi et al 2014, Farace et al 2016b). However, due to the absence of direct position information, the integration mode performance highly depends on the choice of the ion species. Because of the increased beam spot size and MCS for protons, range mixing effects can cause strong ambiguities in the observed signal, which are difficult to interpret (Doolan et al 2015). This also motivates the use of heavier ions, since they typically exhibit a smaller pencil-beam size. On the other hand, heavier ions will suffer from larger beam losses due to fragmentation (Gehrke et al 2018a) and exhibit higher linear energy transfer, which could pose implication on the smallest achievable imaging dose (Parodi 2014, Meyer et al 2019). All these considerations demand a careful evaluation of the clinically available different ion species.
To this end, in this work, we performed a thorough experimental investigation of proton, helium and carbon ion radiography (pRAD, heRAD and cRAD) for various phantoms using an integration mode detector prototype functioning as a range telescope (Rinaldi et al 2014). We try to show that in the near future helium ions, due to their reduced MCS compared to protons, could be an interesting alternative to the more technically challenging (and therefore currently sparsely available) carbon ions for ion imaging using an integration mode detector. The experiments were performed at the Heidelberg Ion-Beam Therapy Center (HIT) using similar dose and beam setting to ensure a fair comparison. In order to make the most out of the residual range information, a dedicated post-processing method was applied to decompose the acquired signal into its individual Bragg peak components (Meyer et al 2017). For comparison, the results were benchmarked relying on a dedicated and thoroughly validated Monte Carlo (MC) simulations framework (Tessonnier et al 2016, Meyer et al 2017).
2. Material and methods
2.1. Detector setup
The detector consists of 61 parallel plate ionization chambers interleaved with 3 mm thick absorber plates of polymethylmethacrylat (PMMA). The combined RSP of one absorber plate and the corresponding ionization chamber is 1.192, which gives the detector the possibility to register WET differences of up to 21.5 cm. Along with its low cost and maintenance requirements, a key feature of the detector is its large active area of 30 cm × 30 cm, which is suited for clinical usage as most particle facilities have maximum delivery fields of around 20 cm × 20 cm (Haberer et al 2004, Pedroni et al 2004, Rossi 2011). The range telescope is a further development of a system initially designed to verify treatment plans (Brusasco 1999), similar to the commercial multilayer ionization chamber (MLIC) (Giraffe, IBA Dosimetry GmbH, Schwarzenbruck, Germany), and has been previously used for iRAD acquisition with carbon ions at HIT (Rinaldi et al 2014). Since then, the system has been upgraded with new readout electronics and different approaches for noise reduction to enable investigations of low-dose carbon ion iRADs (Magallanes et al 2020). To read out all 61 parallel plate ionization chambers simultaneously, an I-128 electrometer with 128 channels is used (Pyramid Technical Consultants Inc. Lexington, Ma, USA). A change in raster point position is detected by the electronics through a specially designed trigger signal that is produced from the beam delivery system. As the detector is not position-sensitive, the raster point position at the isocenter plane of the beam delivery system is used to locate the pencil beam at the detector.
2.2. Phantoms and beam parameters
For this study, two phantoms in different configurations have been irradiated with protons, helium and carbon ions under comparable imaging dose and beam settings. Beam energies of similar range in water were chosen in order to fully traverse the phantoms. The narrowest available beam spot size (Parodi et al 2012) was used to minimize range mixing effects. Additionally, the particle number per raster point was adjusted such that the physical dose delivered to the phantom was comparable for all ion irradiations (about 10 mGy per iRAD of the slab phantom). Moreover, recent works observed an average 18.9% higher relative biological effectiveness in the entrance channel for carbon ion CTs compared to proton CTs (Meyer et al 2019), suggesting a reduced effective dose difference between the here delivered ion beams. The most important irradiation parameters are summarized in table 1. All investigated ions are currently being used (protons, carbon ions) or are considered (helium ions) for clinical usage (Krämer et al 2016, Tessonnier et al 2017c). Moreover, the irradiation settings are readily available at HIT without substantial adjustment of the beam delivery or other settings.
Table 1. Beam parameters for iRAD acquisitions for full width at half maximum (FWHM), physical dose for the slab phantom and range in water are listed. The smallest available beam spot size was chosen and the particle number per raster point was adjusted so that the physical dose delivered to the phantoms was similar.
| Beam parameters for iRAD acquisitions | |||||
|---|---|---|---|---|---|
| Particle type | Beam energy (MeV u−1) | FWHM (mm) | Particle per PB (#) | Physical dose (mGy) | Range in water |
| Slab phantom | (mm) | ||||
| 1H | 157.43 | 10.7 | 100 000 | 9.50 | 172.64 |
| 4He | 158.08 | 6.3 | 25 000 | 9.51 | 173.76 |
| 12C | 299.94 | 3.9 | 4 000 | 8.11 | 171.89 |
For the iRAD acquisitions, the phantoms were manually positioned at the isocenter with the laser alignment system at HIT. Subsequently, a pRAD, heRAD and cRAD was acquired in sequence, without modifying the experimental setup. For a fair comparison between different iRADs, the same scanning irradiation pattern was used. For all acquisitions, a 1 mm image resolution, corresponding to the irradiation scanning step size, has been used. For the slab and the stepped wedge phantom, a 10 × 10 cm2 and 20 × 15 cm2 scanning field has been chosen, respectively.
The so-called slab phantom consists of six 1 cm thick slabs of five different tissue equivalent materials (Gammex, Middleton, WI, USA) that are combined to form a 6 × 10 × 10 cm3 phantom. Table 2 shows the experimentally validated material parameters of every slab (Hudobivnik et al 2016, Meyer et al 2017). The stepped wedge phantom consists of PMMA with an experimentally determined RSP of 1.165 (Magallanes Hernández 2017). It is carved by 12 steps of 7 × 20 mm2 and one 7 × 10 mm2 and has been irradiated from two orthogonal sides yielding two distinguished iRADs: the first one resulting in a simple geometrical object (square) with 13 different WET values (configuration 1) and the second one resulting in an homogeneous WET with sharp stepped edges (configuration 2).
Table 2. Phantom parameters for iRADs. The RSP values were experimentally determined by Peakfinder (PTW, Freiburg, Germany) water column measurements and recreated in-silico for the reference iRADs (cf section 2.3). If manually changed in the MC simulation, the ionization potential (I) is reported. 1I value of the phantom materials has been calculated by FLUKA using the nominal material composition described in (Hudobivnik et al 2016, Meyer et al 2017).
| Phantom parameters | |||||
|---|---|---|---|---|---|
| Phantom | Material | Density (g cm−3) | RSP | I (eV) | |
| Slab | Slab 1 | Muscle | 1.049 | 1.036 | − 1 |
| Slab 2 | Cortical Bone | 1.834 | 1.618 | 126.00 | |
| Slab 3 | Adipose | 0.946 | 0.948 | − 1 | |
| Slab 4 | Lung | 0.282 | 0.284 | 59.00 | |
| Slab 5 | Inner Bone | 1.152 | 1.104 | 80.50 | |
| Slab 6 | Muscle | 1.049 | 1.036 | − 1 | |
| Stepped wedge | PMMA | 1.185 | 1.165 | ||
The two phantoms were chosen because they present different challenges to our imaging method. The slab phantom consists of several sharp tissue interfaces that have to be accurately resolved and features five different materials with varying RSP values to be retrieved. On the other hand, the stepped wedge phantom has a smoother transition in WET in configuration 1 and a complicated geometry with exposed steps in configuration 2. The investigated phantoms allow us not only to (qualitatively) evaluate the spatial resolution of the different ions, but also the WET accuracy for the different steps and materials. Figure 1 shows schematics with dimensions for both phantoms and the beam direction from which the iRADs have been taken. For visualization purposes, the images have been cropped to reduce the amount of surrounding air.

Figure 1. Visualization of the two phantoms that are irradiated for this study. The coordinate axis for the different phantoms and configurations is displayed. In this study, the beam always traverses with the negative z-axis. The slab phantom (6 cm × 10 cm × 10 cm) is positioned such that all six slabs are irradiated parallel to the long slab interface. The stepped wedge phantom (25 cm × 9.1 cm × 9.1 cm) is centrally irradiated from two sides, yielding two different configurations: for configuration 1, the phantom is irradiated from the flat side opposite to the steps (below), whereas for configuration 2 the beam direction is from the side parallel to the steps.
Download figure:
Standard image High-resolution image2.3. Monte Carlo simulations
To benchmark the acquired images, MC simulations have been performed using a computational framework established at HIT on the basis of the FLUKA code (Parodi et al 2012, Tessonnier et al 2016, 2017a, Ferrari et al 2005, Böhlen et al 2014). This framework has already been used for cRAD simulations of the considered detector in (Krah et al 2015, Meyer et al 2017). For the reference simulations, 50% of the experimentally delivered particles have been used to create iRADs of comparable quality for both phantoms using FLUKA v2011.2x.0. All phantoms have been reproduced in-silico with RSP and density values that reflect the experimentally acquired values shown in table 2 (Meyer et al 2017). If necessary, the mass density and more importantly the ionization potential of the individual materials was adjusted in a trial-and-error process to match the corresponding RSP values with the experimental ones (Meyer et al 2017). To best reproduce the experimental data, the energy deposition inside the ionization chambers is scored for all 61 detector channels, as described in (Meyer et al 2017).
2.4. iRAD generation
As the range telescope can only measure the residual range of the particle beams, the range information must be converted to WET. Since it provides better results than the previously used approach attributing the WET simply to the location of the signal maximum, the Bragg peak decomposition method (BPD) was used to identify the dominant WET value enclosed in the detector signal and to determine the pixel values in the iRADs (Meyer et al 2017) in a two-step process:
- (a)The detector signal for each raster point is decomposed into its individual contributions, or channel weights, by means of a MC-based look-up table.
- (b)The channel provided with the maximum weight is identified and converted to WET by an ion-specific channel-to-WET conversion, based on the previous work (Meyer et al 2017) for carbon ions and extended to helium ions and protons in this work.
For the heRAD and pRAD channel-to-WET conversion, the readout channel with maximum signal for energies in the range of 48 MeV u−1 to 180 MeV u−1 has been simulated in-silico and fitted with a second order polynomial function to describe the relationship between initial beam energy and maximum channel readout. The WET (in mm) as a function of initial energy and maximum readout channel for the calibration can be described by:

where  is the combined RSP of one absorber slab,
  is the physical thickness of one detector absorber slab (i.e. 3 mm),
  and
and  (table 3) are ion-dependent fitting parameters and
  is the channel with the highest Bragg Peak weight for an iRAD acquisition with particle beam energy
  [MeV u−1]. The fitting values for cRADs are reported in the previous works of (Meyer et al 2017, Magallanes Hernández 2017).
Table 3. Fit parameters of the channel-to-WET conversion for all three iRAD types. Both, the coefficient of determination (R2) and the root mean square error (RMSE) demonstrate an equally good fit for all three ion types.
| Fitting values for channel to WET calibration | |||||||||
|---|---|---|---|---|---|---|---|---|---|
| cRAD | heRAD | pRAD | |||||||
| px | R2 | RMSE (mm) | px | R2 | RMSE (mm) | px | R2 | RMSE (mm) | |
| p1 | 0.0003114 | 0.9960 | 0.001341 | 0.9996 | 0.001348 | 0.9997 | |||
| p2 | 0.0805 | 0.3216 | 0.1151 | 0.2974 | 0.1154 | 0.2997 | |||
| p3 | −5.488 | −4.310 | −4.197 | ||||||
Finally, the WET value is assigned to the pixel in the iRAD at the given raster point position. The above described image generation process has been applied to all reported iRADs in this paper.
2.5. Metrics
The image quality of iRADs was determined by calculating the normalized root mean square error ( )
)
where  and
and  are the WET values at position (x, y) for the experimental and reference image, respectively,
  and
and  are the dimension of the image in x and y and
  and
and  are the maximum and minimum WET value of the reference image, respectively. The reference image was obtained from the phantom geometry and RSP estimation. For analysis, it has been manually mapped to the experimentally acquired and in-silico iRADs for each phantom. For all cases, the shift was ∼1 mm. By using the NRMSE, which is normalized with respect to the range of observed WET values, one is able to directly compare the imaging qualities of different phantoms, exhibiting different WET values.
For the slab phantom, the WET mean and standard deviation of each pixel column (i.e. vertical direction) in the iRAD have been calculated. To countermeasure effects that arise from vertical positioning uncertainties that could affect the standard deviation and mean, the iRADs were additionally cropped along the vertical axis. The mean and standard deviation are then compared to the calculated reference image. The WET accuracy of the individual slabs has been determined by the relative error (ℜ)
where  is the median value of the WET distribution in one slab of an iRAD and
  is the corresponding reference WET value. Moreover, ℜ was calculated for every slab within a region of interest defined laterally by the reference image and vertically by a margin of 10 mm added to the image border. This approach ensures that only effects of tissue interfaces and not positioning uncertainties are accounted for in the ℜ calculation. The same approach has been used for the individual steps of the stepped wedge phantom in configuration 1 without the vertical margin to the image border, as the transition between steps was smoother and allowed for an easier alignment.
3. Results
3.1. Slab phantom
Figure 2 shows the experimental iRADs (left column) for the slab phantom. Compared to the reference image (top row), the cRAD yields the highest visual agreement of all three iRADs in terms of WET (colour-coded) and geometry, followed by the heRAD and pRAD. Especially for the pRAD, the sharp transitions between the individual slabs are fading, whereas for the heRAD and the cRAD this effect is less pronounced. Overall, the qualitative difference between the heRAD and cRAD is hardly appreciable in comparison to the pRAD. This observation is also reflected in the  of the iRADs being 7.8%, 10.5%, and 16.3% for the experimentally acquired cRAD, heRAD, and pRAD, respectively. The simulated iRADs (right column) are visually in good agreement with the experimental results. The main difference between experimental data and simulation is that the iRADs are less noisy at the boundaries of the individual slabs. The
  for the simulated iRADs is 10.7%, 12.7%, and 18.2% for the cRad, heRAD, and pRAD, respectively. The NRMSE of the experimental iRADs is within 3% to the simulated images, demonstrating a reasonable agreement between simulation and experimental data. Additional checks indicate that this difference is due to the extreme interface of the slab phantom, challenging the BPD method at the boundary to air.

Figure 2. Reference image along with experimentally acquired iRADs (left) and simulated iRADs (right) for the slab phantom.
Download figure:
Standard image High-resolution imageLine profiles along the horizontal dimension for the slab phantom are presented in figure 3. WET mean and standard deviation are determined by averaging along the vertical x-axis (cf Figure 2) of the iRADs. For all iRADs, the error increases at the transition between the individual slabs. Overall, the pRAD has the highest errors, followed by the heRAD and the cRAD.
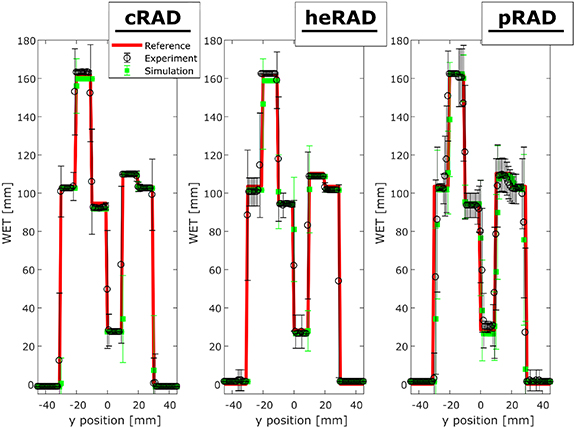
Figure 3. Horizontal mean (averaged over the vertical axis of the phantom) WET profile of experimentally acquired iRADs of the slab phantom. The panels show the reference (red), experimental (black) and simulated (green) cRAD (left), heRAD (centre) and pRAD (right). The error bars represent one standard deviation.
Download figure:
Standard image High-resolution imageThe ℜ of the individual materials of slab phantom is listed in table 4. Except for the lung slab, ℜ is always within ± 3%, demonstrating satisfactory WET resolution. The mean absolute ℜ of slabs 1–5 (muscle slab is averaged for both slabs) for the experimental iRADs is 1.8% for cRAD, 2.2% for heRAD and 2.0% for pRAD, whereas for the simulated iRADs they are 1.9%, 2.5% and 2.3%.
Table 4. ℜ [%] of the individual materials of the slab phantom for experimental and simulated iRADs with protons, helium and carbon ions.
| ℜ [%] of the individual materials of the slab phantom for experimental and simulated iRADs | |||||||
|---|---|---|---|---|---|---|---|
| Muscle I | C. Bone | Adipose | Lung | Inner bone | Muscle II | ||
| Experimental | cRAD | −1.01 | 0.97 | −3.14 | −3.37 | −0.62 | −1.01 |
| heRAD | −1.96 | 0.36 | −0.41 | −6.85 | −1.52 | −1.96 | |
| pRAD | −2.02 | 0.32 | −0.47 | 5.54 | −1.57 | −2.02 | |
| Simulation | cRAD | −1.01 | −1.24 | −3.14 | −3.37 | −0.62 | −1.01 |
| heRAD | −1.96 | −1.85 | −0.41 | −6.85 | −1.52 | −1.96 | |
| pRAD | −2.02 | 0.32 | −0.47 | −7.06 | −1.57 | −2.02 | |
3.2. Stepped wedge phantom
Configuration 1
The experimentally acquired and simulated iRADs for the stepped wedge phantom in configuration 1 are displayed in figure 4. As for the slab phantom, the cRAD yields the highest visual agreement with respect to the reference image, followed by the heRAD and pRAD. For the pRAD, the straight sides of the phantom form an almost wave-like pattern. This effect is less pronounced for the heRAD and negligible for the cRAD. The experimental  is 5.2% for the cRAD, 6.0% for the heRAD and 8.6% for the pRAD. The simulated data exhibits improved results compared to the experimental data with a corresponding
  of 3.3%, 5.7% and 7.5 %. For both, experimental and simulated iRADs, the individual steps of the phantom and the transitions are sharply resolved. Moreover, the average absolute ℜ of the individual steps was 2.3%, 2.4% and 2.6% for experimentally acquired cRAD, heRAD and pRAD, respectively, while for in-silico iRADs the ℜ was 2.4%, 2.2% and 2.1 %. Analysing the average ℜ of the simulated iRADs, the ℜ of the step with the smallest WET is approximately 3.5 times bigger than the one of the largest WET.

Figure 4. Reference image in comparison to the simulated (right) and experimentally acquired (left) iRADs of the stepped wedge phantom in configuration 1.
Download figure:
Standard image High-resolution imageConfiguration 2
Figure 5 shows the experimentally acquired and simulated iRADs for the stepped wedge phantom in configuration 2. In both cases the visual agreement with respect to the reference is worst for the pRAD. The step-like structure appears blurred, predominantly in the pRADs. The  for the experimental iRADs is 8.3% for the cRAD, 8.6% for the heRAD and 13.5% for the pRAD and the corresponding errors for the simulated iRADs are 5.6%, 6.1% and 8.6%. When analysing the WET difference within the phantom, a ℜ of 0.1 %, −0.8% and −0.9% was found for experimentally acquired cRAD, heRAD and pRAD, respectively, while for in-silico generated iRADs ℜ was 0.1%, −0.8% and −0.9%.

Figure 5. Reference image in comparison to simulated (right) and experimentally acquired (left) iRADs of stepped wedge phantom in configuration 2.
Download figure:
Standard image High-resolution image
4. Discussion
4.1. Phantom analysis
As all iRAD have been taken under comparable dosimetric and beam settings, as well as in a clinical quality, a fair comparison between the imaging capabilities of carbon ion, helium ion and proton beams cost-effective range telescope (very similar to nowadays commercially available dosimetric MLIC systems) is ensured. In patients, there are different types of tissues, e.g. bone and muscle, which have to be resolved by every employed imaging modality. In this regard, the slab phantom can be considered as a worst-case scenario for boundary transitions. Our analysis has shown that carbon ions achieve the best results at resolving a geometry with extreme, well-defined boundaries using the range telescope. More specifically, the visual comparison and quantitative  and ℜ values of the cRAD were all closest to the reference. It is worth noting though that helium ions showed almost equal imaging capabilities compared to carbon ions. Only pRAD exhibited considerable inaccuracies at slab transitions due to their increased beam size and MCS, indicating that they might be less suited than carbon or helium ions due their increased lateral scattering, unless special algorithms are employed to counteract these effects such as (Krah et al 2015) or (Gianoli et al 2016). Nevertheless, a smoother transition between tissue interfaces as present in the slab phantom can be expected in patients. The resulting inaccuracies should therefore be less pronounced in clinical practice.
For some experimental iRADs, minor image artifacts were observed. They are caused by so-called pickup noise that originates from resonance frequencies of single ionization chambers. Although the BPD is able to eliminate some of the pick-up noise (Magallanes Hernández 2017), with our current detector setup and readout electronics the issue can not be completely avoided. Switching the here used I-128 readout electronic to a model with continuous charge integration could potentially decrease imaging artifacts (Magallanes et al 2020). In our analysis, a substantially increased ℜ was found for lung-like material. The increased ℜ is partly due to the detector's intrinsic WET resolution, i.e. due to its discrete energy measurement capabilities of up to half of the absorber plate thickness. Consequently, when calculating the ℜ normalized to the reference WET value (in the case of the lung slab only 2.84 cm), the limited WET granularity affects ℜ for all ions. A similar trend was seen when looking at the WET ℜ of the individual steps of the stepped wedge phantom in configuration 1, where the largest average ℜ was found for the step with the smallest WET. Moreover, for some inserts (e.g. adipose) cRADs yielded a higher ℜ than heRADs or pRADs, going against the otherwise overall trend of improved analysis metrics for cRADs. In these cases, we think that a one-channel detector readout shift could be the cause, as remaining WET differences between expected value and measured are smaller than 3.5 mm WET (the current WET granularity of the detector). Over one central pixel row averaged detector readouts are provided in the supplementary information for every slab and both simulation and experimental data. For visualization purposes, the averaged detector signal is normalized by its maximum.
Although the WET retrieval of the detector should not exhibit a systematic over- or underestimation, most retrieved ℜ values were smaller than 0, indicating an underestimation of the WET. It would be worth investigating, whether this effect reduces when the granularity of the detector is improved, e.g. by changing the absorber plate thickness from 3 mm to 1 mm as previously proposed (Meyer et al 2017).
The line profiles (figure 3) revealed that the overall WET resolution for all ions largely varies at the boundaries between the slabs due to the finite beam spot size and range mixing effects at tissue interfaces, while there is little error in the homogenous regions of the phantom. As already mentioned, the main source of error in the homogenous regions is the intrinsic WET resolution of the detector. This effect dominates over inaccuracies due to range straggling of the investigated ions. By decreasing the absorber plate thickness of the detector, as already investigated in-silico by (Meyer et al 2017), the overall WET error could be further reduced.
The complex geometry of the stepped wedge phantom challenges our method to resolve sharp edges in configuration 2 and different WET values in configuration 1, where the latter are due to different physical thickness rather than different RSP. Even though the observed NRSME was smaller for the stepped wedge phantom in configuration 1 than for the slab phantom (NRMSE is naturally lower at tissue interfaces with similar RSP) configuration 2 was especially challenging for protons. The individual steps of the phantoms are hardly resolved in the pRADs, resulting in the apparent triangular shape of the phantoms body. As the BPD is sensitive to larger beam shapes, the combination of an increased beam spot size and particle scattering with a finite image resolution leads to inaccuracies in the correct reproduction of sharp edges. With integration mode detectors relying on the identification of the WET component with maximum weight, the blurring of the signal translates into inaccuracy of the image. As a consequence, the iRAD does not result blurred, rather inaccurate (Gianoli et al 2019). For helium and carbon ions, this effect was less pronounced, due to their reduced beam spot size (table 1) and MCS (Tessonnier et al 2017b, Gehrke et al 2018a) compared to lighter ions. This resulted in a reduced  , confirming almost equal imaging capabilities for the experimental carbon and helium iRADs. To overcome the limitations due to the increased beam spot size and particle scattering with the considered integration mode detector, deconvolution kernels taking the initial beam shape into account could be investigated to potentially increase the achievable image resolution.
4.2. MC validation
Except for the slab phantom, the simulated iRADs always yielded a decreased  compared to experimental acquisitions since charge collection efficiency and fluctuations in the detector signals were not simulated. The simulations thereby function as a best-case approximation of the experiment. Nevertheless, overall good agreement for simulation and experimental iRADs both visually and in terms of
  have been found in all cases. This is attributed to the general good agreement between MC simulations and experiments at HIT, as the raster point scanning as well as the characterization of materials and phantoms have been experimentally validated in previous works (Meyer et al 2017, Magallanes Hernández 2017). Overall, the extension of the MC ion-imaging framework in combination with the BPD, originally developed in the context of carbon ion imaging, to protons and helium ions has been successfully validated. With this framework, extensive MC studies on new detector designs, including also the biological implications of ion-imaging on the human body, along with improvements of data processing approaches can be investigated in-silico prior to further experimental work (Meyer et al 2019).
5. Conclusion and outlook
In this work, we have investigated the imaging capabilities of clinically validated protons, helium and carbon ions under comparable dose and beam setting with an integration mode detector that functions as a range telescope. Our system is very similar to commercially available MLIC dosimetric solutions also currently under investigations for proton radiography at different centres (Rinaldi et al 2014, Farace et al 2016a, 2016b). We have shown that for the presented cases carbon ions are best suited for acquiring ion-radiographies due to their reduced MCS and small beam spot size. Nevertheless, all three ions were almost equally capable of resolving the reference WET far from tissue interfaces of the phantoms. The usage of helium ions in combination with an integration mode detector could thereby be a compromise between the limited MCS as well as increased biological implication that comes with the usage of heavier ions. Moreover, compared to carbon ions, helium ions show only slightly decreased image quality, as reflected by increased iRAD inaccuracies at tissue interfaces and phantom edges. In the future, image enhancing methods (such as deconvolution kernels) specifically tailored to the detector and ion beam shapes in air could further enhance the iRAD image quality for all ion-species. With such improvements, integration mode detectors could be employed in clinical practice to facilitate adoption of imaging modalities that natively measure WET and potentially reduce the dose to the patients. Even in the case that the RSP accuracy would prove to be unsatisfactory for volumetric imaging for clinical treatment planning purposes, ion-radiography with an integration mode detector could be still a useful clinical tool for patient alignment and positioning, as well as patient-specific refinement of the x-ray CT calibration curve.
Acknowledgments
Authors acknowledge the DFG project for Hybrid-Bildgebung in Hadrontherapy für Adaptive Ionen-Strahlentherapie (HIGH-ART) and the Munich Center for Advanced Photonics (MAP).
The authors would like to thank the medical physics staff and Professor Dr Thomas Haberer from HIT for their invaluable help.