1. Introduction
In general, there is practically no technical system without the existence of friction (except for, e.g., magnetically levitated devices such as high-speed maglev trains and magnetic bearings). Even today, there are no consistent views on the justification of the nature of friction and its description. This is confirmed by the fact that there are many models and theories of friction. From the very beginning of the study of friction, people have used experimental methods and tried to quantify friction with various measurement devices.
Tribological measurements include friction coefficients, friction forces, surface roughness, wear, material, and lubricant characteristics. The coefficient of friction is the ratio of the friction force between two bodies and the normal force between them. Static friction occurs between bodies when the bodies are not yet moving towards each other.
Static friction force prevents the movement of a body on an inclined plane. Kinetic friction, also called dynamic friction, is represented by the force at the moment when the bodies move relative to each other. In general, the kinetic coefficient of friction is less than the static coefficient of friction [
1,
2].
On the basis of previous studies [
1,
2,
3,
4,
5,
6,
7,
8,
9,
10,
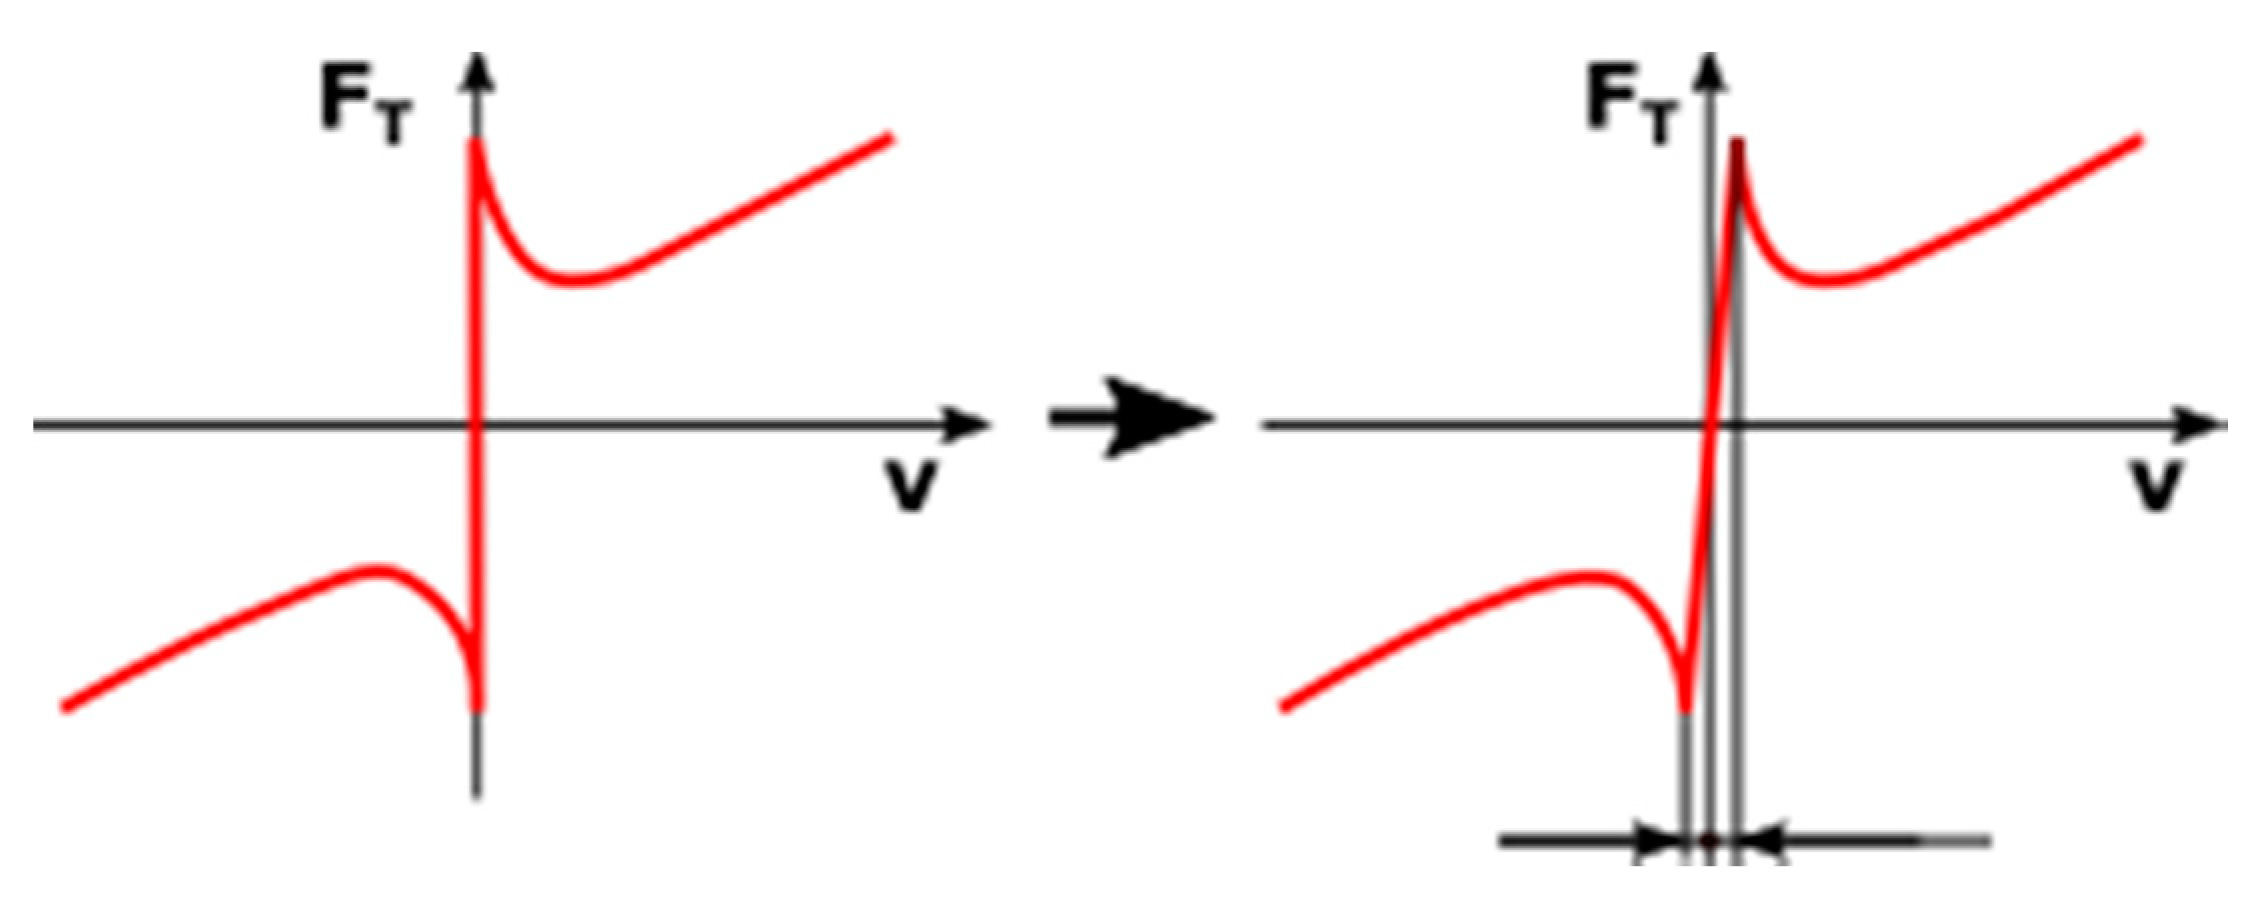
11], it can be said that the sliding friction is a symmetrical problem. Frequently, it is presented as a symmetrical graph of friction force that is dependent on the relative velocity motion between explored material pairs (
Figure 1). The graph in
Figure 1 shows the Stribeck friction model often used in mechanical engineering. The dependence also includes the area of discontinuity on zero velocity. When break-away force is exceeded, the friction force is decreased. This discontinuity causes problems in experiments and simulations. From the math viewpoint, the means that we have two different friction force values for a zero relative motion velocity. For this reason, we modified previous original Stribeck model to the model shown in
Figure 1—right. The modified model is a symmetrical model without any numerical problems and with zero crossing.
In slip and fall incidents, human dynamics and people’s reaction to the perceived loss of friction between their feet and the floor play a big role. As a precaution, slippery surfaces that can cause a person to fall are often examined. The static friction coefficient has been previously investigated. However, the vast majority of falls occur when a person moves. Thus, investigating the kinetic was more appropriate in this case.
Even a trivial matter such as the production of bathtubs and shower enclosures is rather complicated. The friction between the human foot and the bath surface is further complicated by the presence of water, which acts as a lubricant and reduces the friction force between the foot and the bath surface. When developing flooring materials, it is also necessary to investigate the friction properties that occur when interacting with human footwear. A tribometer is therefore used to assess the safety of human walking [
2]. Efforts have also been made to develop a device for floor material assessment for this purpose, even in the wet state [
3,
4,
5]. A serious problem that has been solved is the interaction of a car tire with a road surface, and test facilities were developed for this investigation [
5]. Therefore, the anti-slip properties of a road surface are investigated and evaluated before commissioning [
6]. In [
7,
8,
9], different methods of the measurement of friction forces for different applications were examined, and it was found that friction issues affect many areas of everyday life [
10,
11,
12,
13,
14,
15].
From the practical viewpoint, the friction coefficient has an influence on the practical operation of mechanisms. For example, the frictional coefficient has a direct impact on bearing operation parameters. The internal clearance in rolling bearing affects the friction between rolling elements and races [
16].
A tribometer is a device for examining tribological characteristics and for examining the interaction between the surfaces of bodies during their relative movement. In [
2], the inclined skid tribometer is referred to as a variable incidence tribometer (VIT).
The aim of this article was to solve specific problems in the measurement of the coefficient of the sliding friction of material pairs using of a variable incidence tribometer from the perspective of metrology. In particular, we intended to research the expression of the credibility (in terms of achieved errors and uncertainties of measurement) and the possibility of increasing the credibility of this measurement. Another problem that needs to be solved is the method of carrying out the measurement, which has an impact on the achieved uncertainty of measurement.
2. Motivation and Goals
In practice, tables with empirical values of coefficients of friction between different material pairs are available. However, such tables only offer a very rough approximation that can be diametrically different from reality because friction is dependent on many factors.
A much more serious problem is the knowledge of friction in miniature systems. In this case, the identification of friction is a dominant task upon which the overall success of these miniature systems and their implementation in practice depends [
17,
18,
19].
In common practice, the method of neglecting friction is often used when solving systems. However, this approach can have fatal consequences. A situation when the designed and subsequently implemented system does not fulfil its target function at all can occur. The cause of this situation is the dominance of friction forces in the technical system.
The existence of friction in solved systems causes a number of non-linearities, e.g., dead zone (zone of insensitivity) and hysteresis (different behavior at the same input variables). Neglecting these non-linearities leads created simulation models with different properties from implemented systems.
Finally, there are also the economic aspects that are introduced into a product’s life cycle when the development and verification process become more expensive, precisely because of the frivolous neglect of friction forces at the product design stage. Then, the produced prototype does not meet the customer’s requirements and becomes unsaleable and uncompetitive. These and other mentioned factors were the motivations for this work.
For characteristics or descriptions of friction or friction resistance, a dimensionless quantity called the coefficient of friction (COF) is used. The coefficient of friction, according to [
19,
20], is defined as the ratio of the friction force to the normal force that acts perpendicularly to the two surfaces in contact. This coefficient measures the difficulty with which one material slides on another material. The kinetic coefficient of friction is related to the force measured while maintaining motion.
3. Description of Measurement Chain
The measurement of the static coefficient of friction using the variable incidence tribometer method is defined in the standard ASTM D4917-97(2007) [
21,
22], ASTM D4521-96 [
23], ISO 12957-2 [
24], TAPPI T 815 [
25], ASTM F1679-04e1 [
26], ASTM D4918-97 [
27]. The measurement of the static coefficient of friction (
Figure 2) simply consists of increasing of the angle of the inclined plane α until the moment when the slipping of sled on the inclined plane is initiated. The tangent of this angle (
Figure 2) is the static coefficient of friction (1) [
26].
For static friction, force applies as follows:
If it is necessary to determine the kinetic coefficient of friction, the inclined plane is set to a selected angle of inclination, and the slipping body of the sled is moved manually. If the sled stops, then the angle is not suitably adjusted. Thus, this procedure is repeated until the moment when the slipping of the sled is maintained at a constant velocity. The tangent of the inclination angle of the inclined plane at which this happens corresponds to the kinetic coefficient of friction. The initialization of the movement of the sled is inevitable because, in general, it applies that:
Here, there may appear a problem that when the motion is triggered manually, because such a force pulse that distorts this measurement can be given to the slipping sled. This measurement method provides only approximate values of the kinetic coefficient of friction, and these are not usable for practical purposes.
For kinetic friction, force applies as follows:
According to the equation, the friction force during the movement of the body does not depend on the velocity of this movement. However, this can only be considered under laboratory conditions at a low velocity of movement. In fact, the kinetic coefficient of friction is dependent on the velocity of body movement. Both relationships suggest that the friction force is independent on the size of the friction areas of the sliding bodies [
9].
4. Recommendations from Standards
According to the ASTM D4918-97 standard [
27], the static coefficient of friction is related to the force required to initiate movement between two surfaces of a material pair. According to the ASTM D4918-97 standard [
27], it is not possible to determine the kinetic coefficient of friction by this method. Reference is made to the ASTM D4917 standard [
22], which describes another method for measuring both the static and the kinetic coefficients of friction.
The measurement device according to ASTM D4918-97 [
27] (
Figure 2) consists of a skid (flat surface) attached at one end by means of a joint. This skid (
Figure 2) can be tilted at a uniform velocity. The surface of this skid is made of a material with sufficient rigidity—wood, plastic, or metal. The width of this skid has to be at least 25 mm wider than the width of the sled. The length of the inclined plane of the skid must be large enough to allow the sled to move at least 15 mm. The inclined plane has clips for attaching a sample of the test material to the inclined plane. The sled (
Figure 2) is made of a square metallic material with dimensions of 63.5 mm
2. The weight of the sled is 200 g. The sled also has clips for attaching the test material. For the measurement to be carried out, the smooth increasing of the inclination angle of the skid from horizontal position to 45° is required. The velocity of the tilting of the skid should be 1.5 ± 0.5°/s. The indication of the inclination angle of the skid should be with resolution at least 0.5°. Tilting should be triggered until the moment when the movement of the sled is initialized. After the movement of the sled is initialized, the skid tilting is immediately turned off and the angular position of the inclined skid is read with resolution of 0.5°. The ASTM D4918-97 standard [
27] states that five measurements are required to determine the static coefficient of friction, from which the arithmetic mean and the standard deviation should be determined.
According to the TAPPI T815 standard [
25], a pressure between the surfaces of 1.4 ± 0.7 kPa is recommended for measurement. The sled should measure 90 × 100 mm and weigh 1300 g. The width of the inclined plane of the skid should be 12.5 mm greater than the width of the sled. The inclined plane of the skid should be of such a length as to enable the sled to travel on the path for at least 25 mm. The velocity of tilting the skid should be 1.5 ± 0.5°/s. This standard [
25] also states that it is not possible to determine the kinetic coefficient of friction by this measurement method.
According to the ISO 12957-2 standard [
24], the friction properties of specific materials (geotextiles with soil or sand) are evaluated. The so-called friction angle for specific friction material pairs is evaluated, and this angle is determined by measuring the inclination angle of the skid on time when the slipping body of the sled is moved. The velocity of the tilting of the skid should be slow at an interval of 3 ± 0.5°/min. Before the testing begins, the skid should be horizontal in all directions. The required maximum permissible error for the measurement of inclination angle of the skid is ±0.5°.
Many research and development works do not include the evaluation of the validity of their results. Authors forget to express how one can believe to the obtained results. The valid standards [
28,
29,
30,
31] also include recommendations for the evaluation and expression of the uncertainties of measurements. In this work, we express and evaluate results in accordance with these standards [
28,
29,
30,
31]. Additionally, almost all countries have own national version of these standards, and they are harmonized with the mentioned international standards [
28,
29,
30,
31].
The result of measurement is completed only if it consists of measured value and the related uncertainty of the measurement. The measurement uncertainty is a non-negative parameter that is associated with the result of a measurement that characterizes the dispersion of the values that could reasonably be attributed to the measurement result. In most cases for this paper, we supposed that uncertainty was symmetrical around the mean value of the measurement data, and we attached the uncertainty to the mean value with the symbol (±). This means that we supposed that real value belonged inside the interval symmetrically around the mean value with any probability level [
28,
29,
30,
31].
The uncertainty of measurement associated with input estimates is evaluated according to either the ‘Type A’ or a ‘Type B’ method of evaluation. The Type A evaluation of standard uncertainty is the method of evaluating the uncertainty through the statistical analysis of a series of observations. In this case, the standard uncertainty is the experimental standard deviation of the mean that follows from an averaging procedure or an appropriate regression analysis. The Type B evaluation of standard uncertainty is the method of evaluating the uncertainty by means other than the statistical analysis of a series of observations. In this case, the evaluation of the standard uncertainty is based on some other scientific knowledge (e.g., previous measurement data, experience with or general knowledge of the behavior and properties of relevant materials and instruments, manufacturer’s specifications, data provided in calibration and other certificates, or uncertainties assigned to reference data taken from handbooks.).
The Type A evaluation of standard uncertainty can be applied when several independent observations have been made for one of the input quantities under the same conditions of measurement. If there is sufficient resolution in the measurement process, there will be an observable scatter or spread in the obtained values. Generally, when the number n of repeated measurements is low (n < 10), the reliability of the Type A evaluation of standard uncertainty, as expressed by standard deviation of the mean, has to be considered.
There have also been some [
32,
33] where “Method A” and “Method B” were used instead of “Type A” and “Type B.” The meaning of both expressions are the same.
Combined uncertainty is the square-root of the linear sum of squared standard uncertainty components. Each component is the product (i.e., the result of multiplication) of the standard uncertainty and its associated sensitivity coefficient. By combining these components, we attempt to estimate the total magnitude of uncertainty associated with our evaluated measurement system or process [
32,
33].
5. Questions and Problems Connected with Measurement
The guidelines and instructions in the above-mentioned standards give rise to several major problems with the implementation of the measurement process:
- -
How to determine the moment of initialization of the movement of the sled on the skid when measuring the static coefficient of friction? Subjective observation can introduce gross errors in the measurement process, and the measurement process will thus be impaired.
- -
What should the tilting velocity of the tribometer skid be in terms of the achievable uncertainty of measurement?
- -
How many measurements are needed? The measurement process should not be lengthy due to the economic aspects of the measurement, but this consideration should not lead to the detriment of the achievable uncertainty of the measurement.
- -
How to determine the uncertainty of the measurement of friction coefficients?
- -
Is it possible to determine the kinetic coefficient of friction using this measurement principle? How to proceed with this measurement?
6. Model of Measurement of Static and Kinetic Coefficients of Friction and Uncertainty of Measurement
The model of measurement of the static friction coefficient has the already mentioned form:
Following the application of the recommendations given in [
28,
29,
30,
31,
32], for the standard uncertainty of the static coefficient of friction, it is possible to state:
The combined uncertainty can be obtained by combining the standard uncertainty determined by Methods A and B [
28].
All these standards require a maximum permissible error of determination of the inclination angle of the skid of ±0.5°. Thus, this value sets the criterion for selecting the sensing system for the measurement of the inclination angle of the skid.
After considering a uniform law of distribution of the measured values of the inclination angle of the skid at a level of confidence 0.95, it is then possible to determine the standard uncertainty for the measurement of the inclination angle of the skid. If the maximum permissible error criterion is to be met, then it is better to replace this standard uncertainty by a combined uncertainty:
For this purpose, it is necessary to select a sensing system that meets this criterion.
To determine the model for the kinetic coefficient of friction, let us consider the motion equation in the form:
Meanwhile,
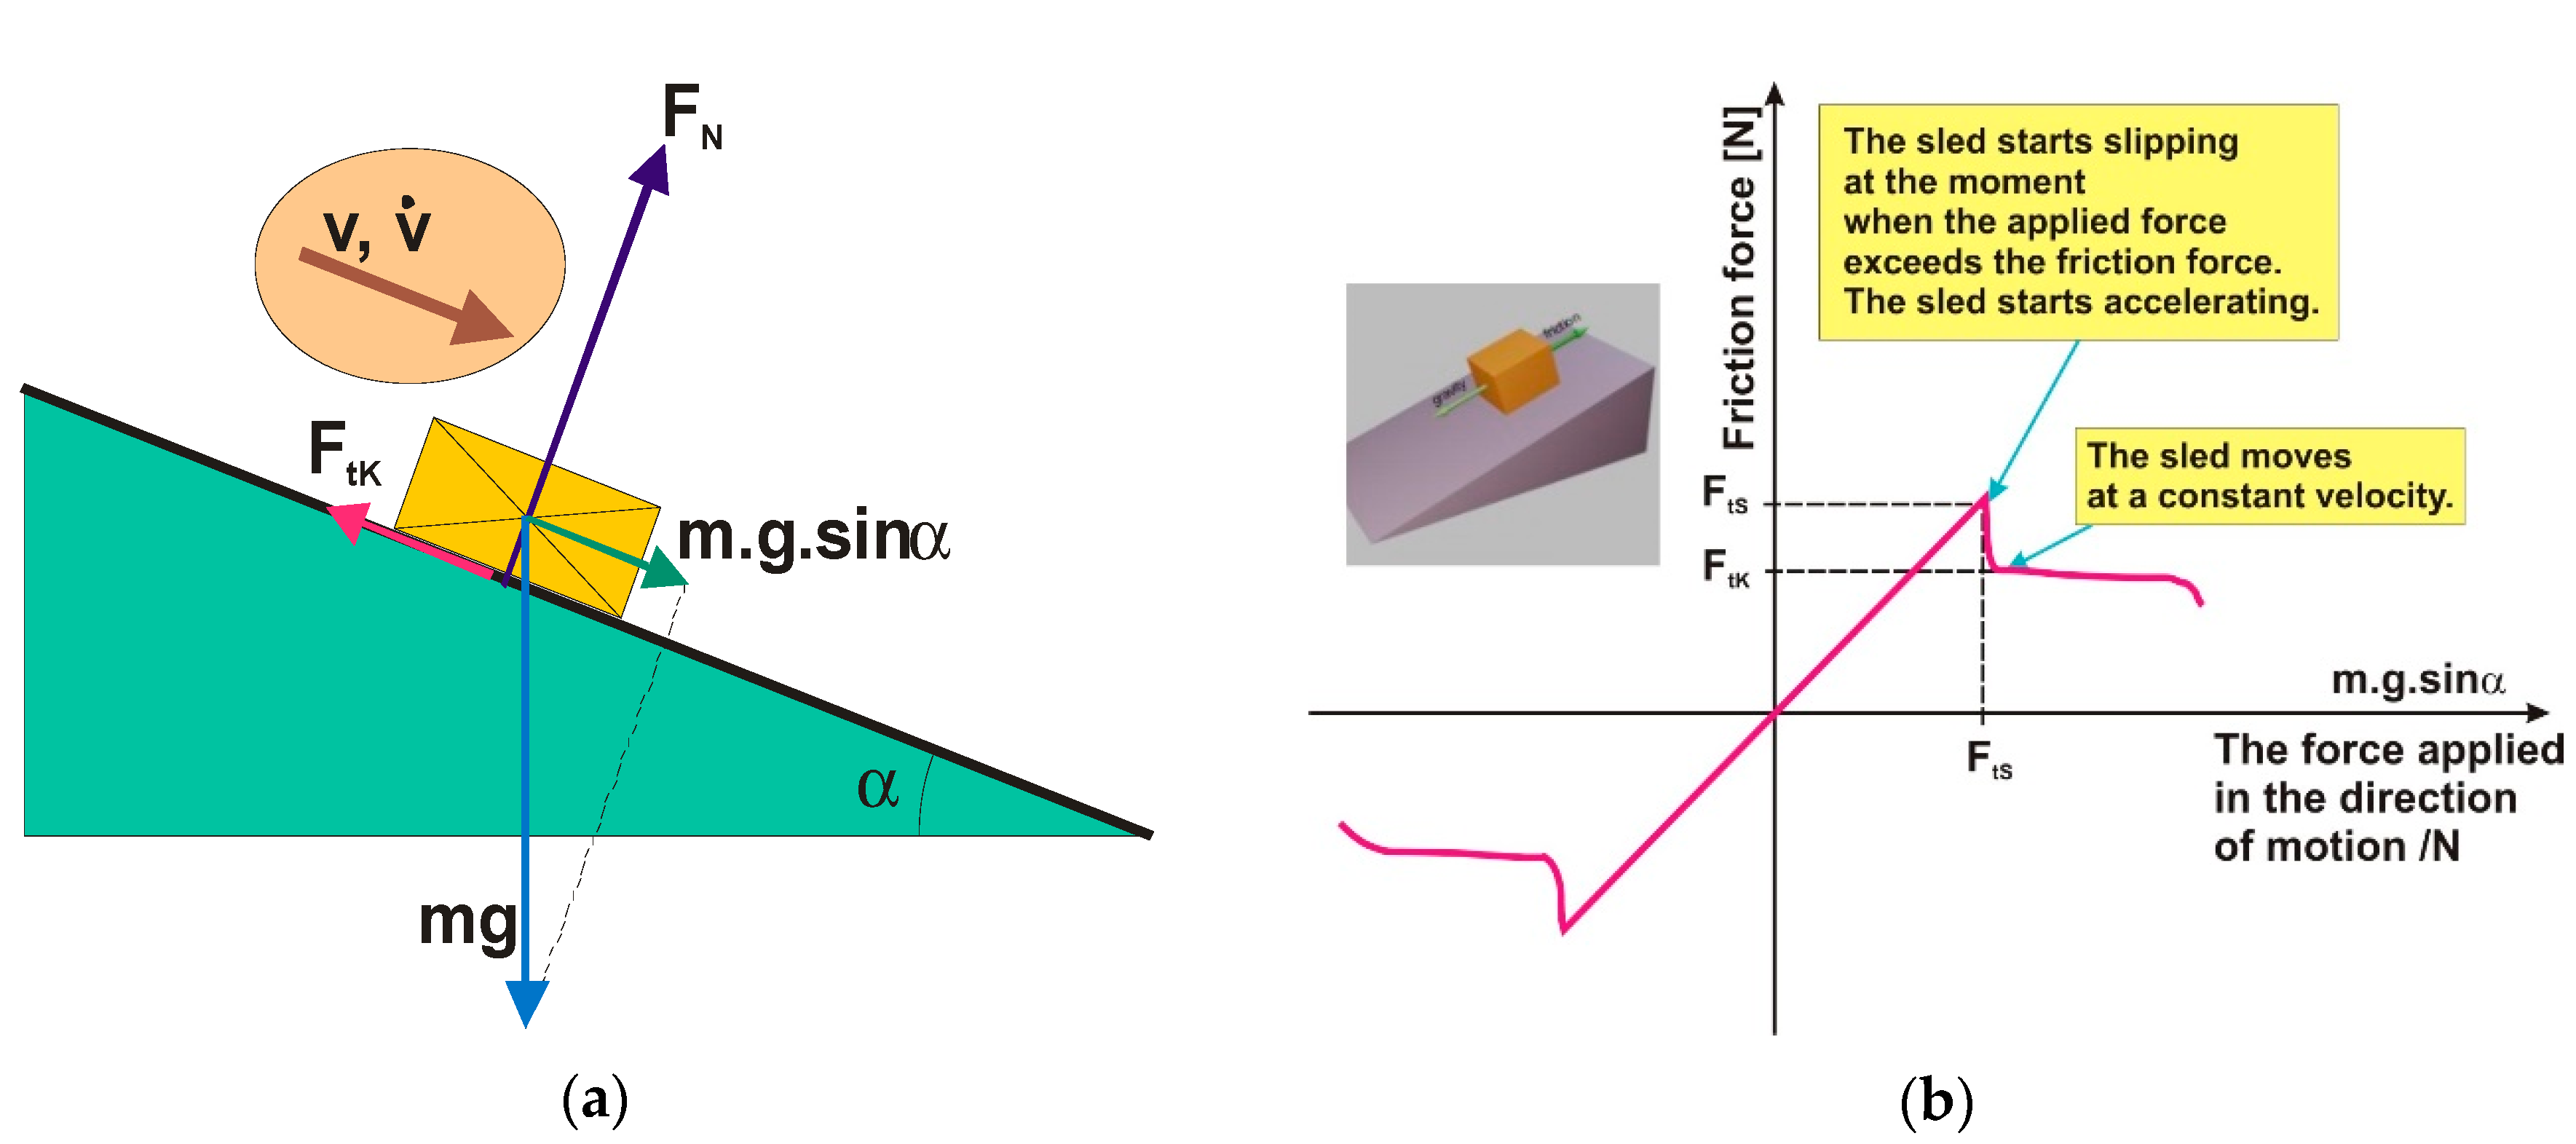
The overpassed path of the slipping body of the sled (
Figure 3) on an inclined plane on the skid over time t is defined as the path of uniformly accelerated motion along a straight line:
If the initial velocity
at time
, then it is possible to express an acceleration:
After substituting Equation (8) into the motion, it is possible to express the kinetic coefficient of friction:
This relationship is a measurement model for determining the kinetic coefficient of friction. This relation also confirms the validity of Coulomb’s law .
The standard uncertainty of the kinetic coefficient of friction is then:
The meaning of both coefficients of friction is apparent from
Figure 3. If the force applied in the direction of the movement of the sled exceeds the static friction force (
Figure 3), then the sled begins to move or accelerate. Then, the sled moves at a quasi-constant velocity and the kinetic friction force is in balance with the force applied in the direction of movement. The kinetic coefficient of friction does not have to be constant because it not only depends on the material pair but also on other factors such as surface roughness, humidity, and temperature, and, moreover, these factors may also vary on one particular material pair [
1].
7. Design of Concept of Measurement Device
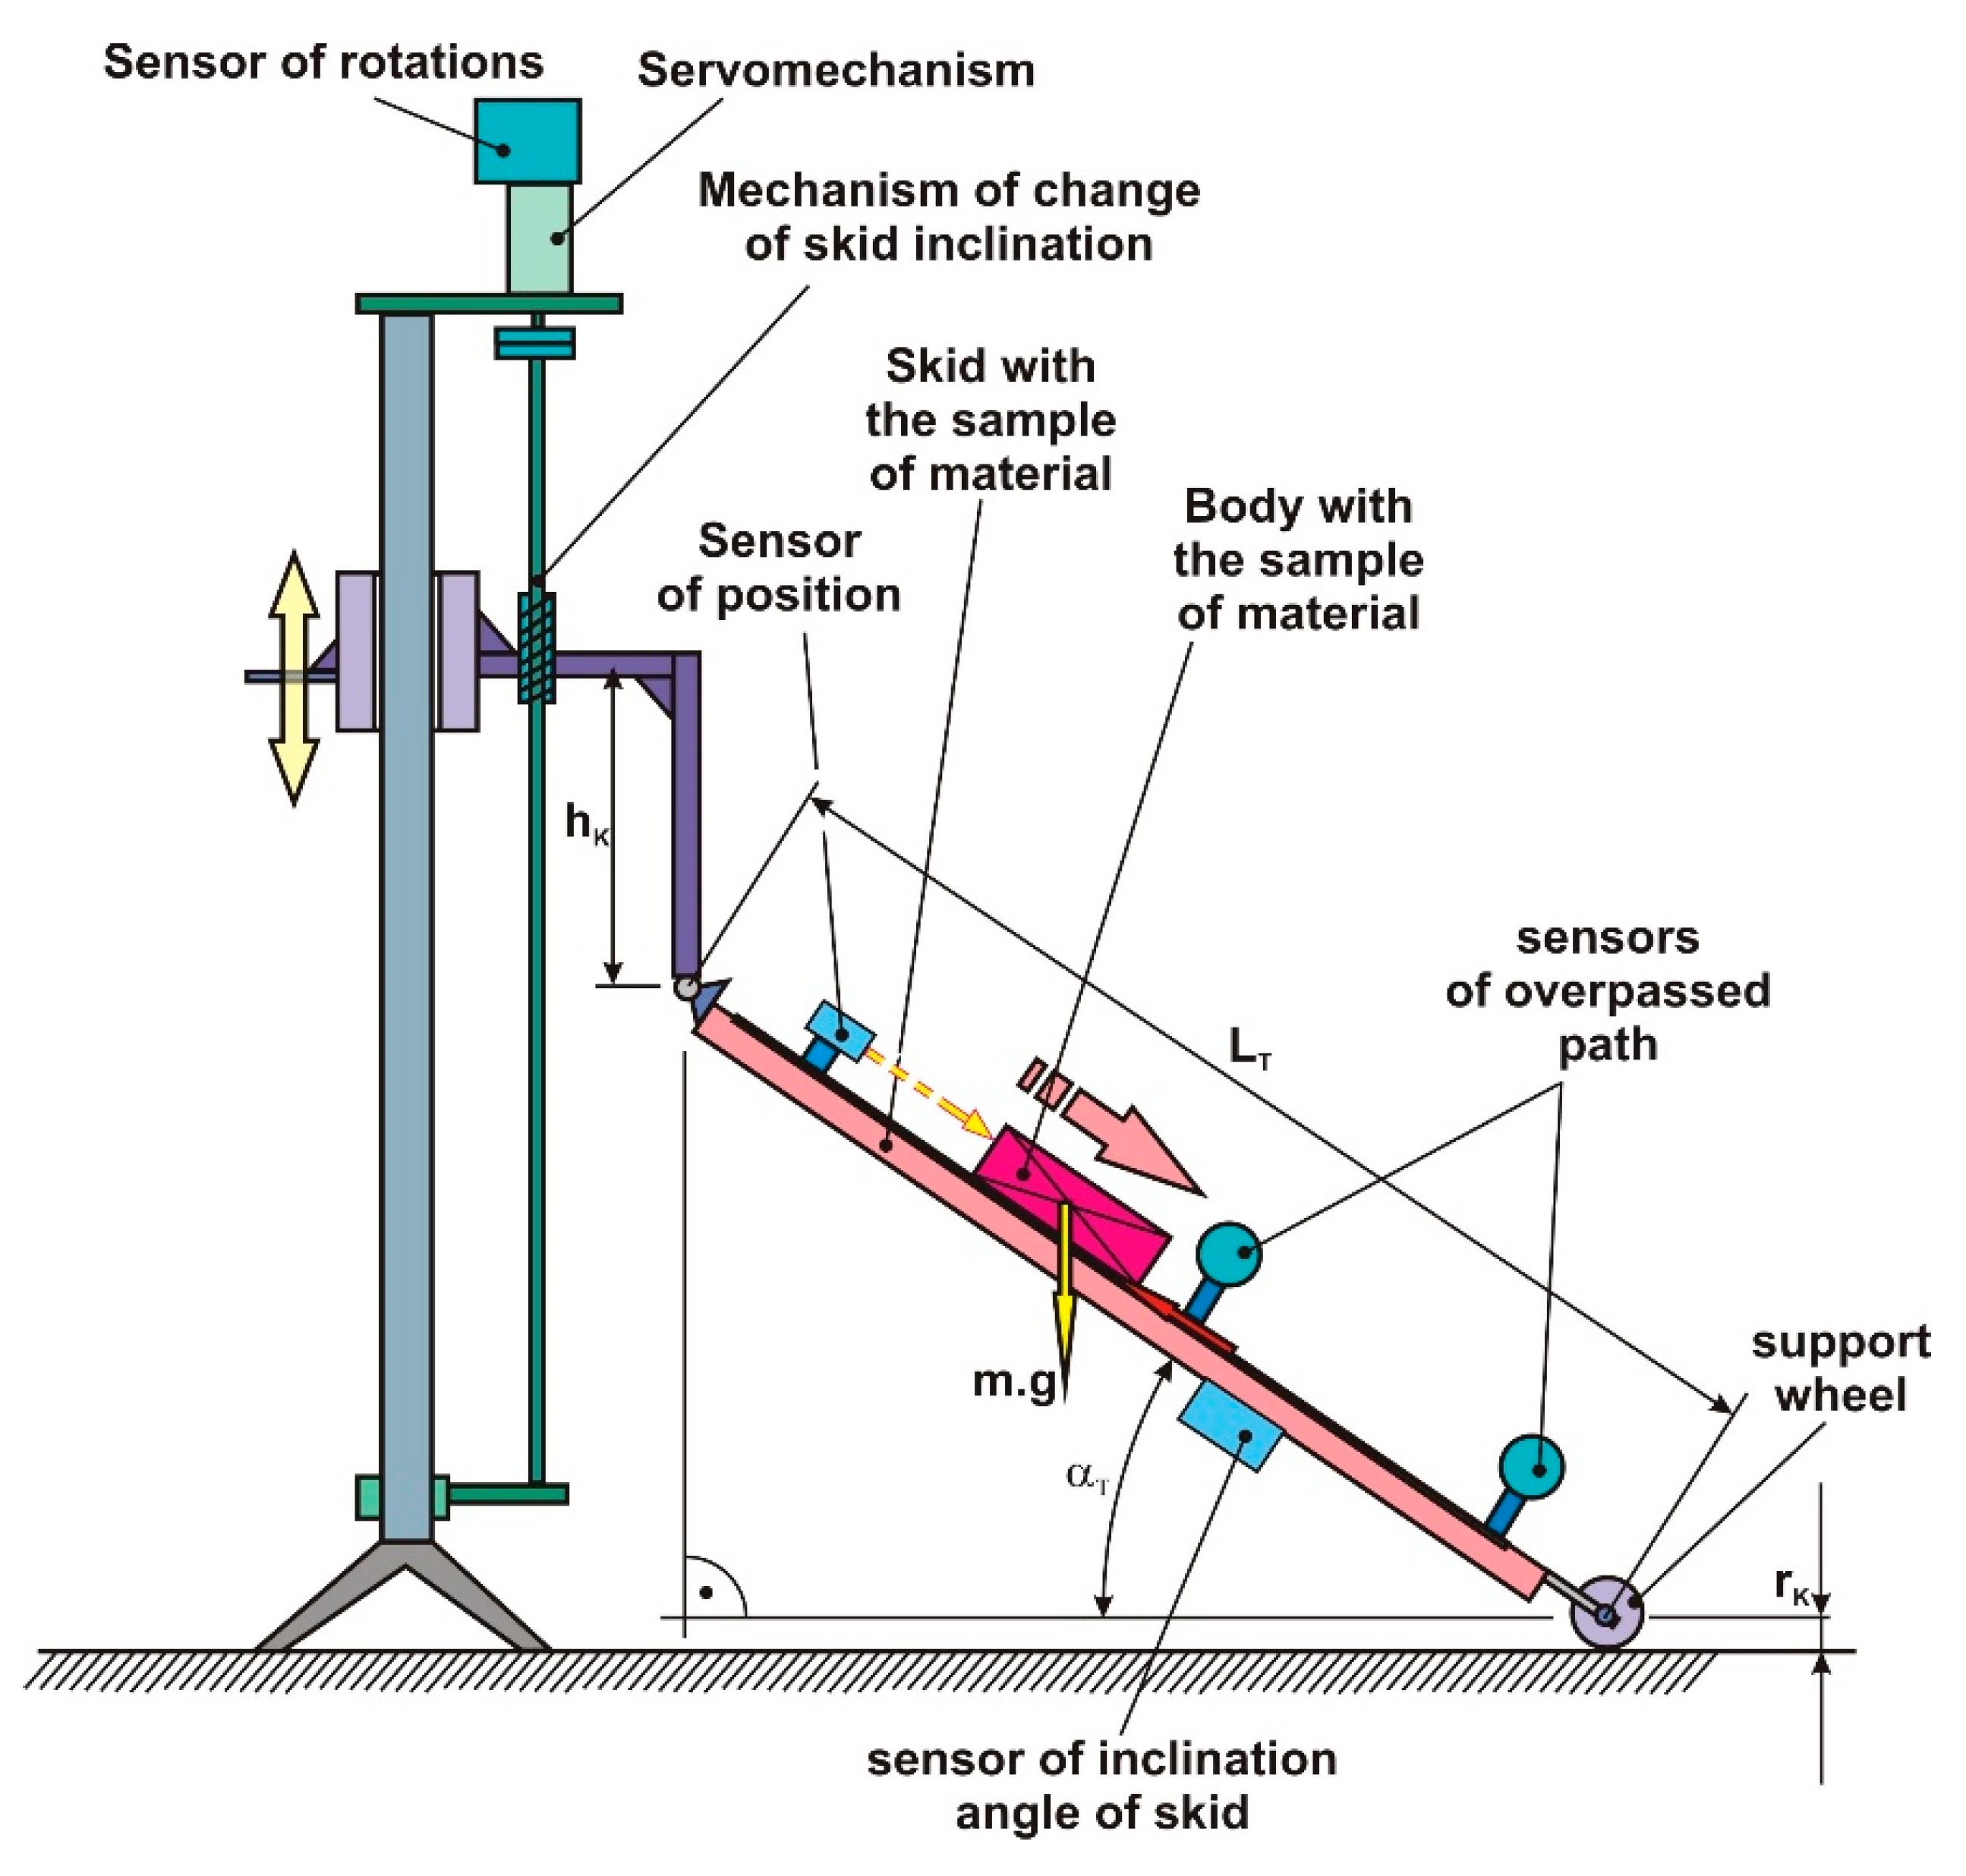
On the basis of the given mathematical model, requirements for the concept of the arrangement of the measurement device arise (
Figure 4). In the proposed measurement device, it is necessary to solve the following tasks:
The sensing of the inclination angle and the automatic evaluation of the measured value of the inclination angle of the skid to eliminate the complicated and inaccurate reading of the inclination angle of the skid.
The sensing of the moment of the initialization of the motion of the slipping sled on the skid and the subsequent automatic turn off of the inclination of the tribometer skid in order to eliminate the subjective approach of the measuring person by which gross errors are introduced into the measurement.
The possibility of adjusting the skid inclination velocity in intervals from 0.5°/s to 3°/s. The creation of the automatic control of the skid inclination velocity to the selected value of the skid inclination velocity.
The sensing of the overpassed path of the slipping sled along the skid when measuring the kinetic coefficient of friction using adjustable sensors for various adjustments to the overpassed path of the sled.
For the purpose of sensing, the controlling and automatic performing of the functions of the device (
Figure 4), it is necessary to locate the sensors of some non-electric quantities. Suitable measurement circuits and control systems must be selected for this purpose.
The implementation of these measuring and control devices minimizes the resulting uncertainty of the measurement of the static and kinetic coefficient of friction. Therefore, the selection of the sensors and measuring methods for each function realized in the measurement device is important.
Within this research, detailed examinations of several types of selected sensors and evaluation methods were carried out. The properties of commercially available sensors are mostly described in detail in the data sheets. An important criterion for selection was the uncertainty of the measurement of individual quantities, and we also tried to speed up the measurement process and thus increase the overall measurement productivity.
The rodless linear resistive position sensor was selected for the measurement of the inclination angle. The sensor has a range of 780 mm and an overall resistivity of 10 kOhms. It is connected as a voltage divider with a reference voltage power supply. The accuracy of the sensor is better than ±0.1% of the measured value.
The hall effect sensor was selected to sense the initialization of the motion of the slipping sled. The sled also included a permanent magnet, and a selected hall sensor returned the information about the initialization of the sled motion. The hall sensor had a ratiometric output voltage set by the supply voltage. The magnetic range was ±70 mT, and the measured distance range with the used magnet (NdFeB) was ±10 mm. The accuracy was better than ±0.5% of the measured value.
Laser optical barriers with electronics were selected to register the overpassed paths of the sled. Laser diodes with visible red light were used. Two pairs of transmitters (LED diode) and receivers (phototransistor) were used to register the sled position. The signals from both laser barriers were connected to a high precision digital counter. A digital counter was able to detect the time between the external events registered by optical barriers.
We cannot present, the detailed description of producers and concrete types of sensors because this information has commercial value.
7.1. Sensing of Inclination Angle of the Skid
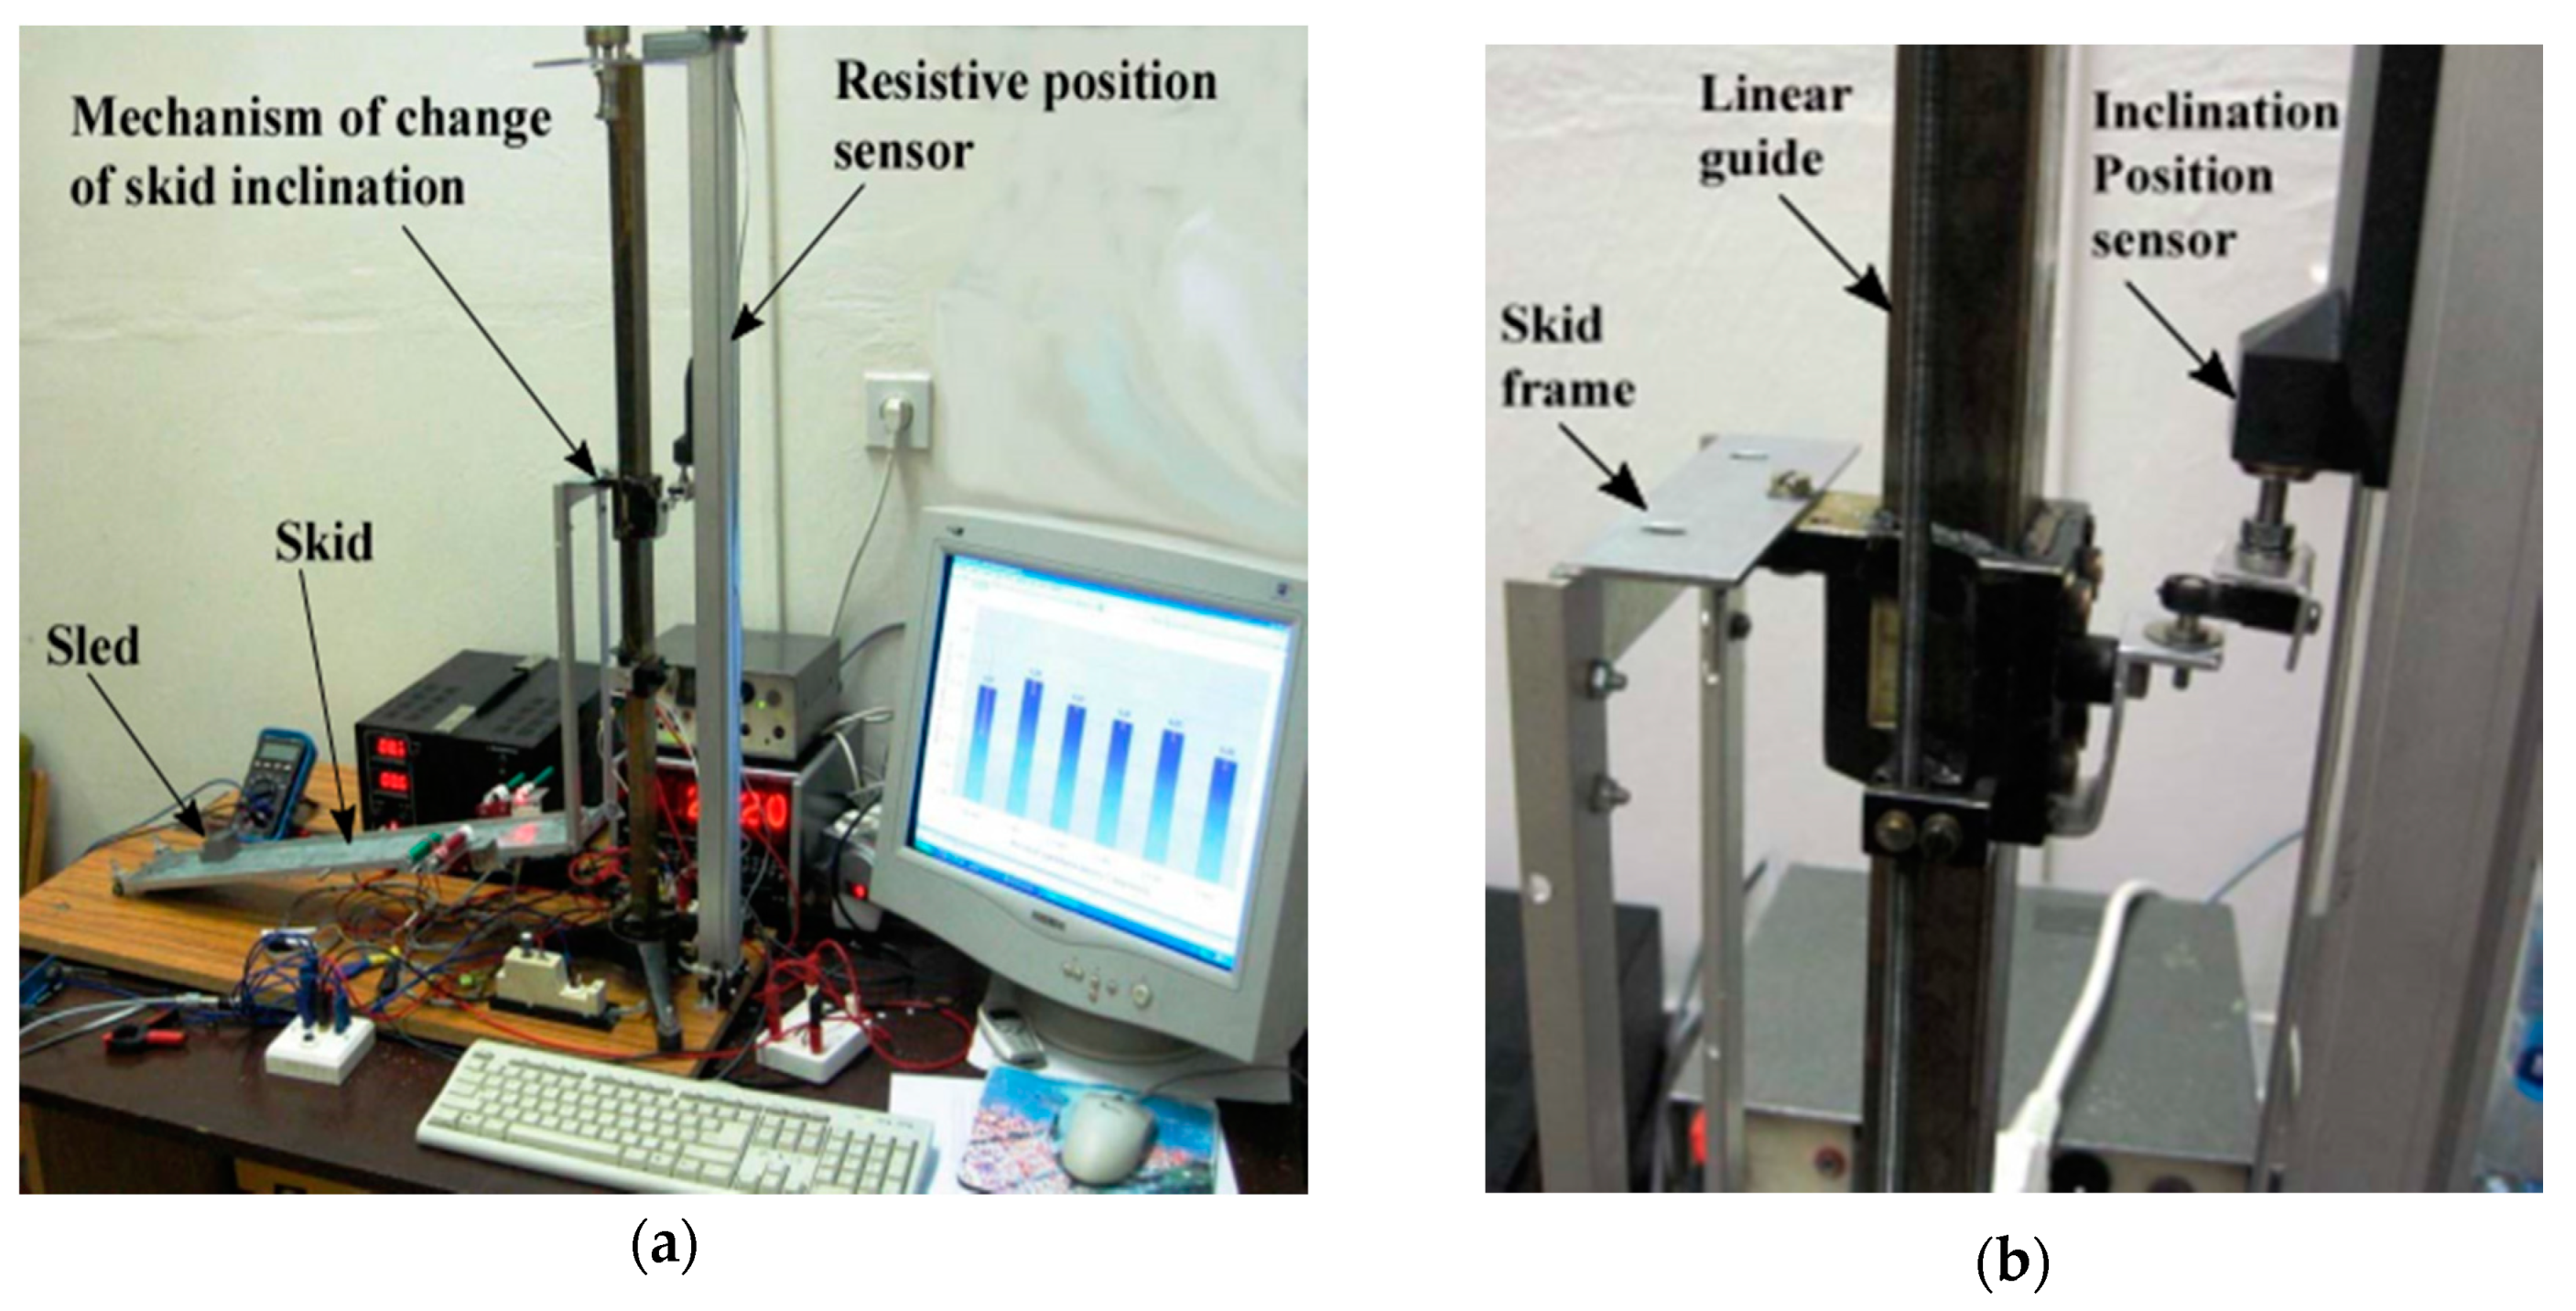
To sense the inclination angle of the skid, a linear rodless resistive position sensor was selected based on experimental investigation (
Figure 5). After the application of a resistive position sensor to sense the inclination angle of the skid, we carried out comparative measurements that confirmed the correctness of the mathematical model of the measurement of the inclination angle of the skid. An angle gauge block set was used for comparative measurements. The processing of the measured values of the displacement of the wiper was performed with the multifunction input-output card MF624 online measuring system supported by the MATLAB/Simulink software. With this system, the current value of the inclination angle of the skid, the current velocity of inclination of the tribometer skid, and the time course of the inclination angle of the skid and velocity of inclination of the skid are displayed for the user.
7.2. Sensing of Initialization of Motion of Sled on the Inclined Skid
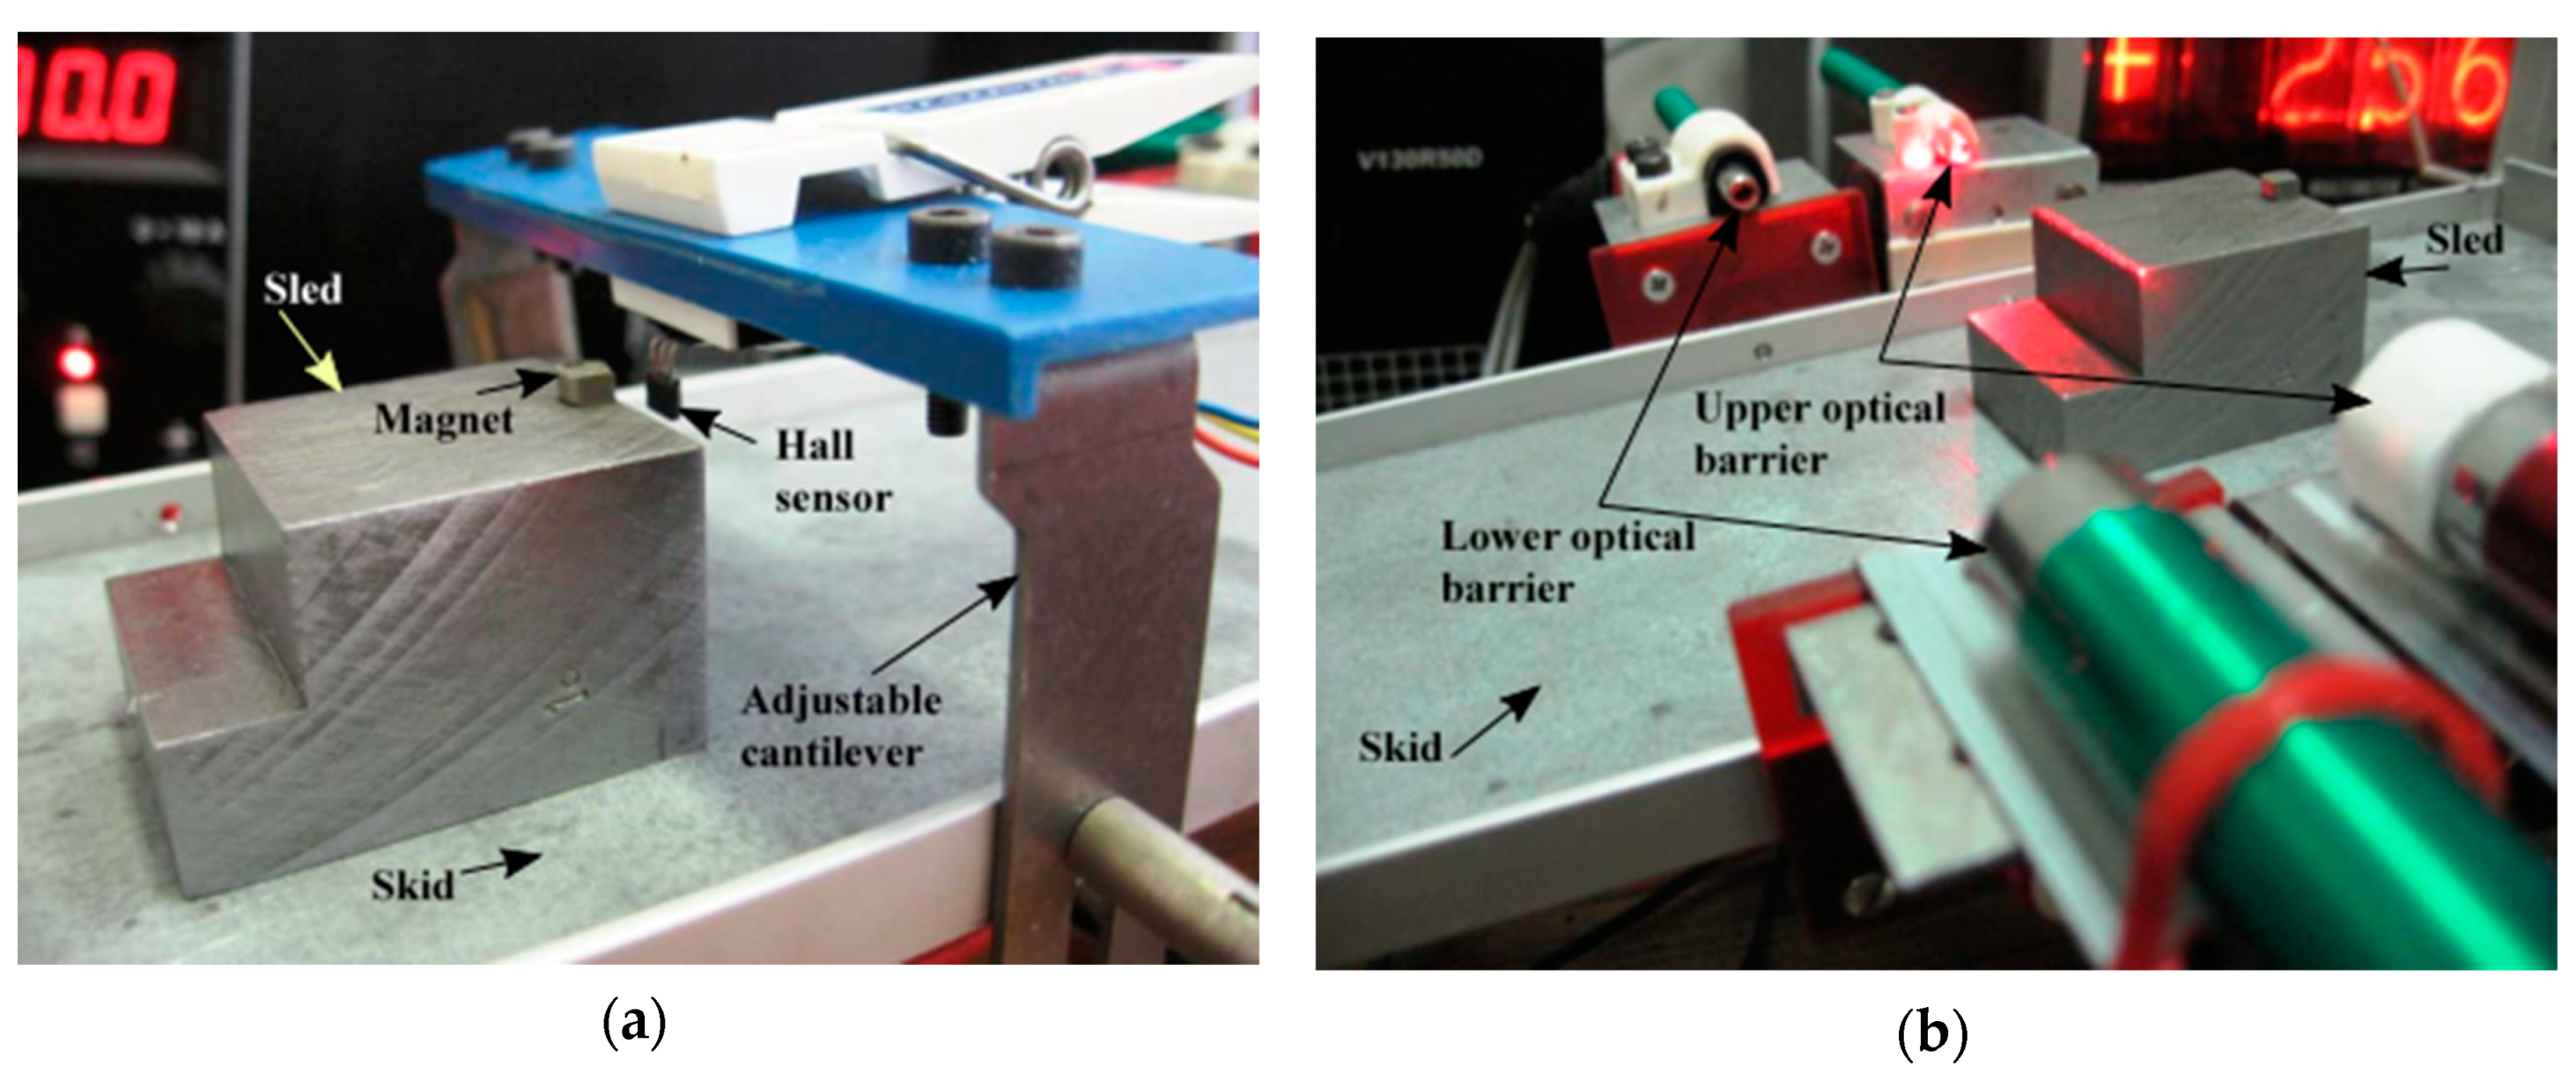
A Hall effect sensor was selected to sense the initialization of the motion of the slipping sled on the skid. This sensor required installation on an adjustable cantilever located above the tribometer skid (
Figure 6). It was necessary to place a permanent magnet on the moving body at the position with which the selected Hall effect sensor was going to react and thus sense the moment of initialization of the motion of the sled on the skid of the tribometer.
The adjustable cantilever (
Figure 6) was height adjustable and could be moved to other places on the skid of the tribometer. The sensor was adjustable on the cantilever, and it was thus possible to adjust its position depending on the choice of measuring point.
Laser optical barriers with electronics were installed to register the overpassed paths of the sled. (
Figure 6). The output signals were adapted to using digital stopwatches that measure the time taken by the body to pass a predetermined path of the sled when determining the kinetic coefficient of friction. The laser barriers were adjustable and could be mounted on various points of the skid.
A DC motor with an encoder and the feedback control of the rotation velocity was used to tilt the skid of the tribometer. This drive, in combination with a helical gear, allowed the tribometer skid to tilt gradually according to the value selected by the user.
8. Experimental Examination of the Influence of Parameters of Measurement Chain on the Result of Measurement of the Static Coefficient of Friction and the Balance of Uncertainties of Measurement
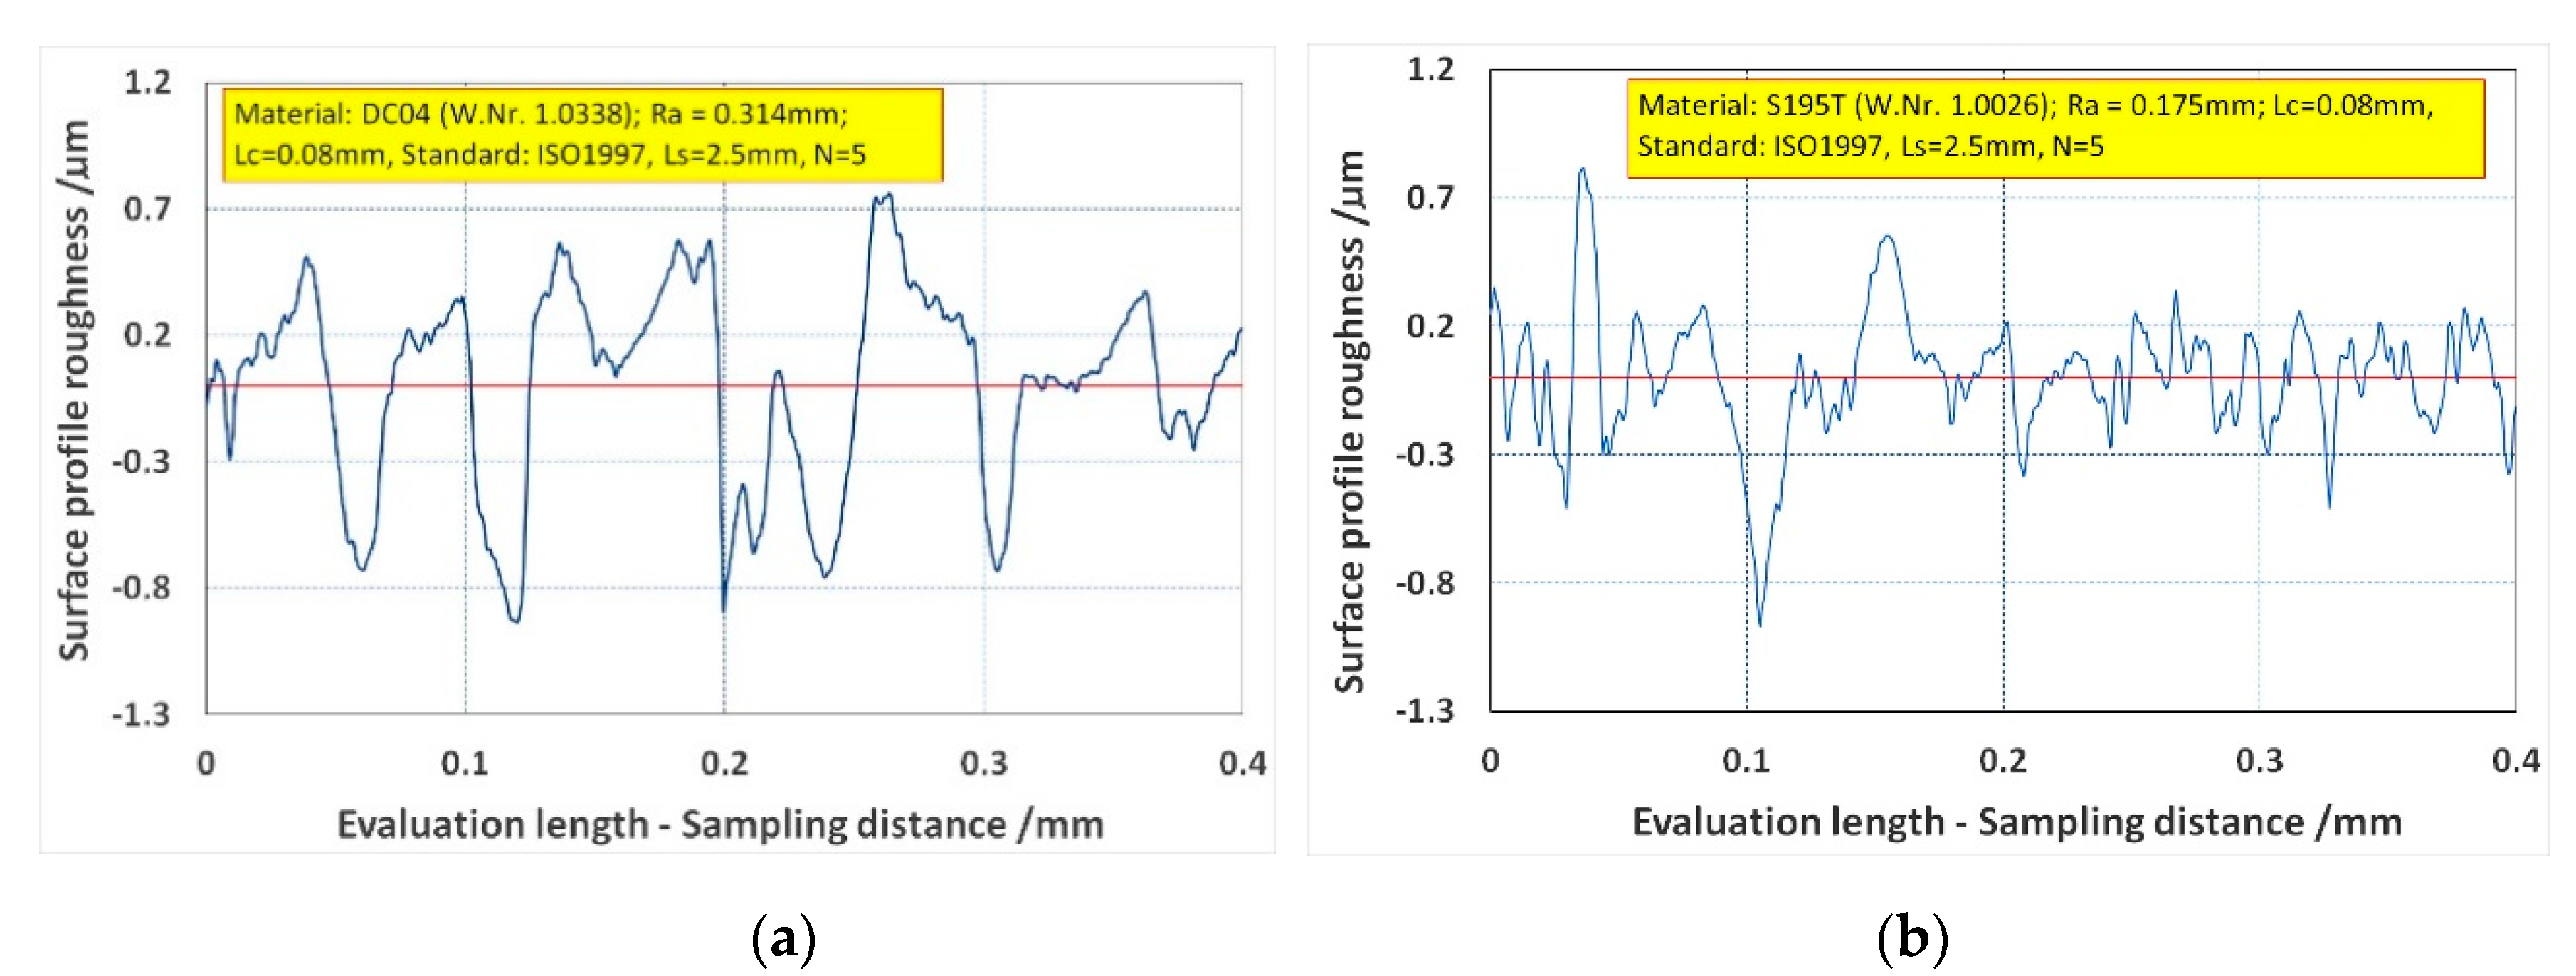
For measurement, a prism sample made of S195T steel (W.Nr. 1.0026) was selected, and the skid surface was made of DC04 steel (W.Nr. 1.0338). These materials were selected by authors on the basis of the need for other research, where it is necessary to define the coefficient of friction for selected material pairs. Whenever it is necessary to design a machine, there is a need to define a friction property.
The surface roughness of both materials was measured (
Figure 7) and evaluated via the arithmetical mean deviation of the assessed profile of the material in accordance with the ISO 4287:1997 standard (
Figure 8).
The extended uncertainty for the values of the arithmetical mean deviation mentioned in
Figure 8 was ±0.03 µm (the assumption of the rectangular uniform probability distribution of the measured data; the coverage factor is the square-root of 3 for a confidence level of 95%).
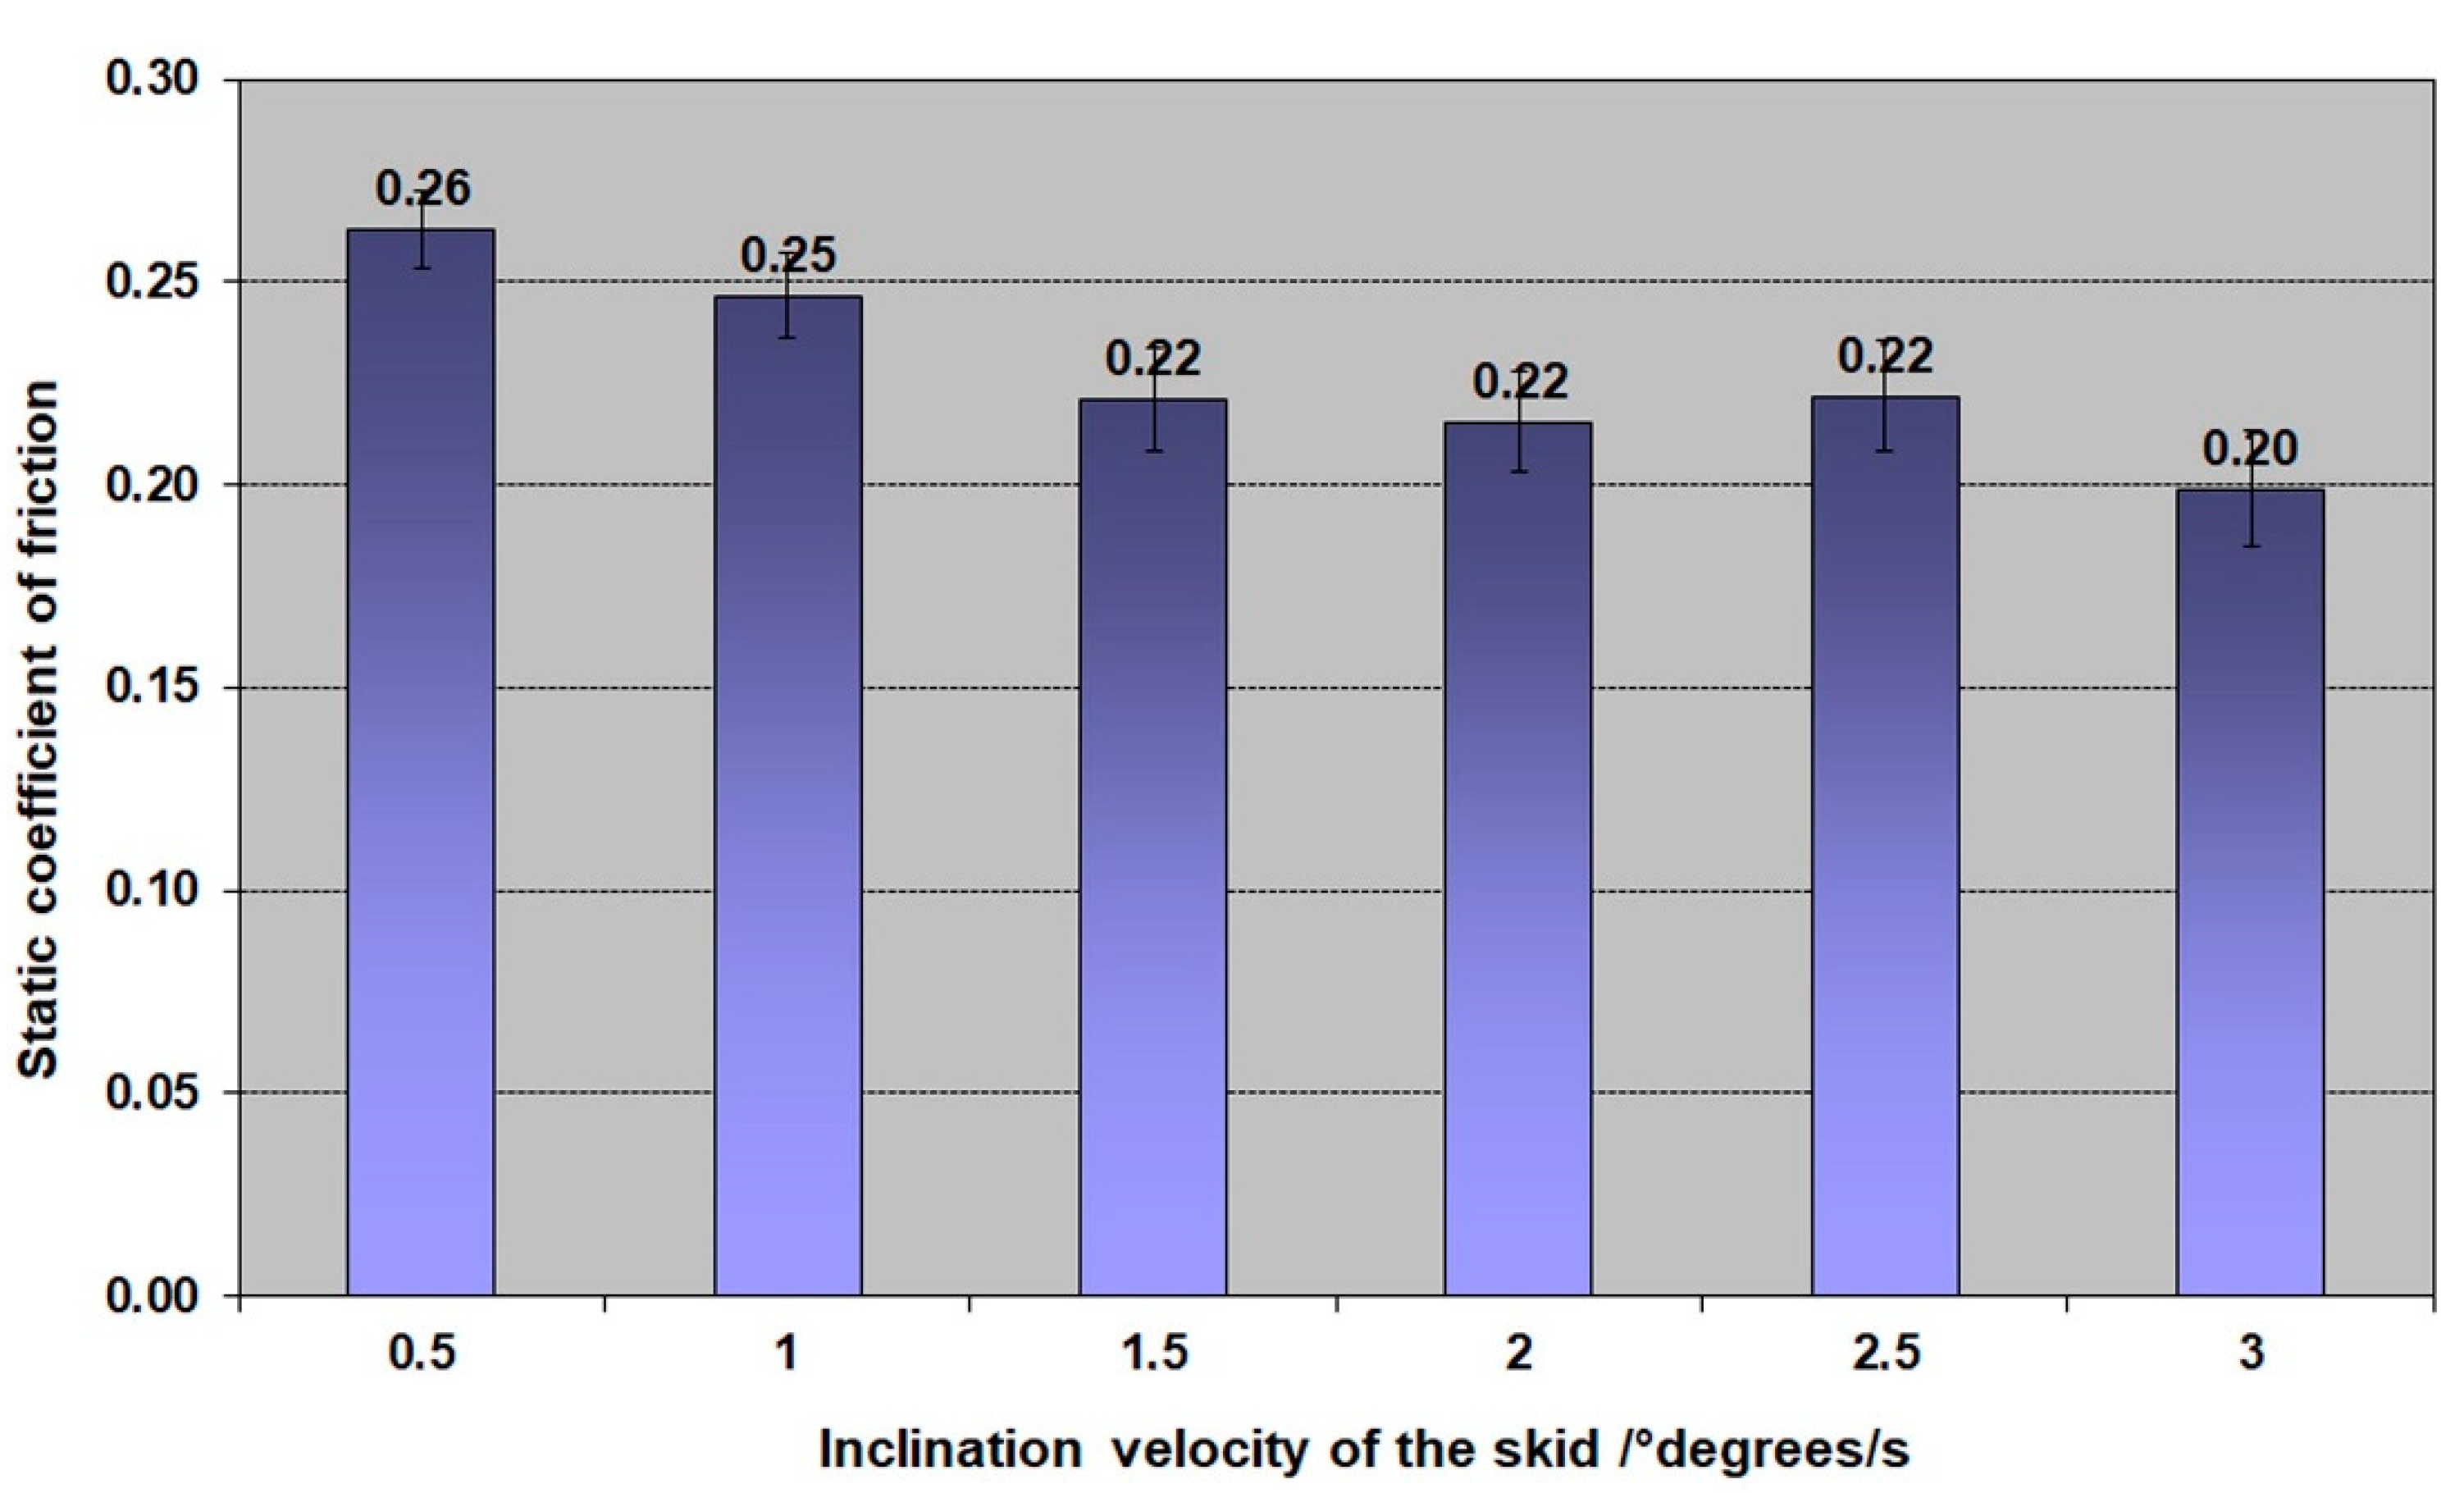
The aim was to determine the static coefficient of friction of the selected material pair. Another objective was to experimentally determine the effect of the skid tilting velocity on the measurement result.
Measurements were made at different tilting velocities of the tribometer skid (0.5, 1, 1.5, 2, 2.5, and 3°/s). At each velocity, 100 measurements were made, from which arithmetic means and standard deviations were evaluated.
The results of the measurement of the static coefficients of friction are shown in
Figure 9. The error bars represent the standard deviation (100 measurements).
The graph (
Figure 9) shows a decrease in the mean value of the static coefficient of friction with the increasing inclination speed of the tribometer skid. Increasing the velocity of the skid tilting thus tended to decrease the mean value of the static coefficient of friction. A significant difference was particularly noticeable when exceeding the inclination velocity 1°/s, which led to a deterioration in the measurement results.
Another indicator of the quality of the measured data was the dispersion of the measured data, as represented by the standard deviation. The graphical representation (
Figure 10) shows that the standard deviation value increased with the increasing tribometer skid tilting velocity. There was significant increase in the standard deviation value that occurred after the 1°/s value of the inclination velocity of the skid was exceeded.
These results indicated that it was advantageous to perform measurements at a lower skid tilting velocity (max. 1°/s) in terms of dispersion and, thus, measurement uncertainty. Reducing the velocity improved the measurement uncertainty, but, on the other hand, it impaired the overall measurement productivity.
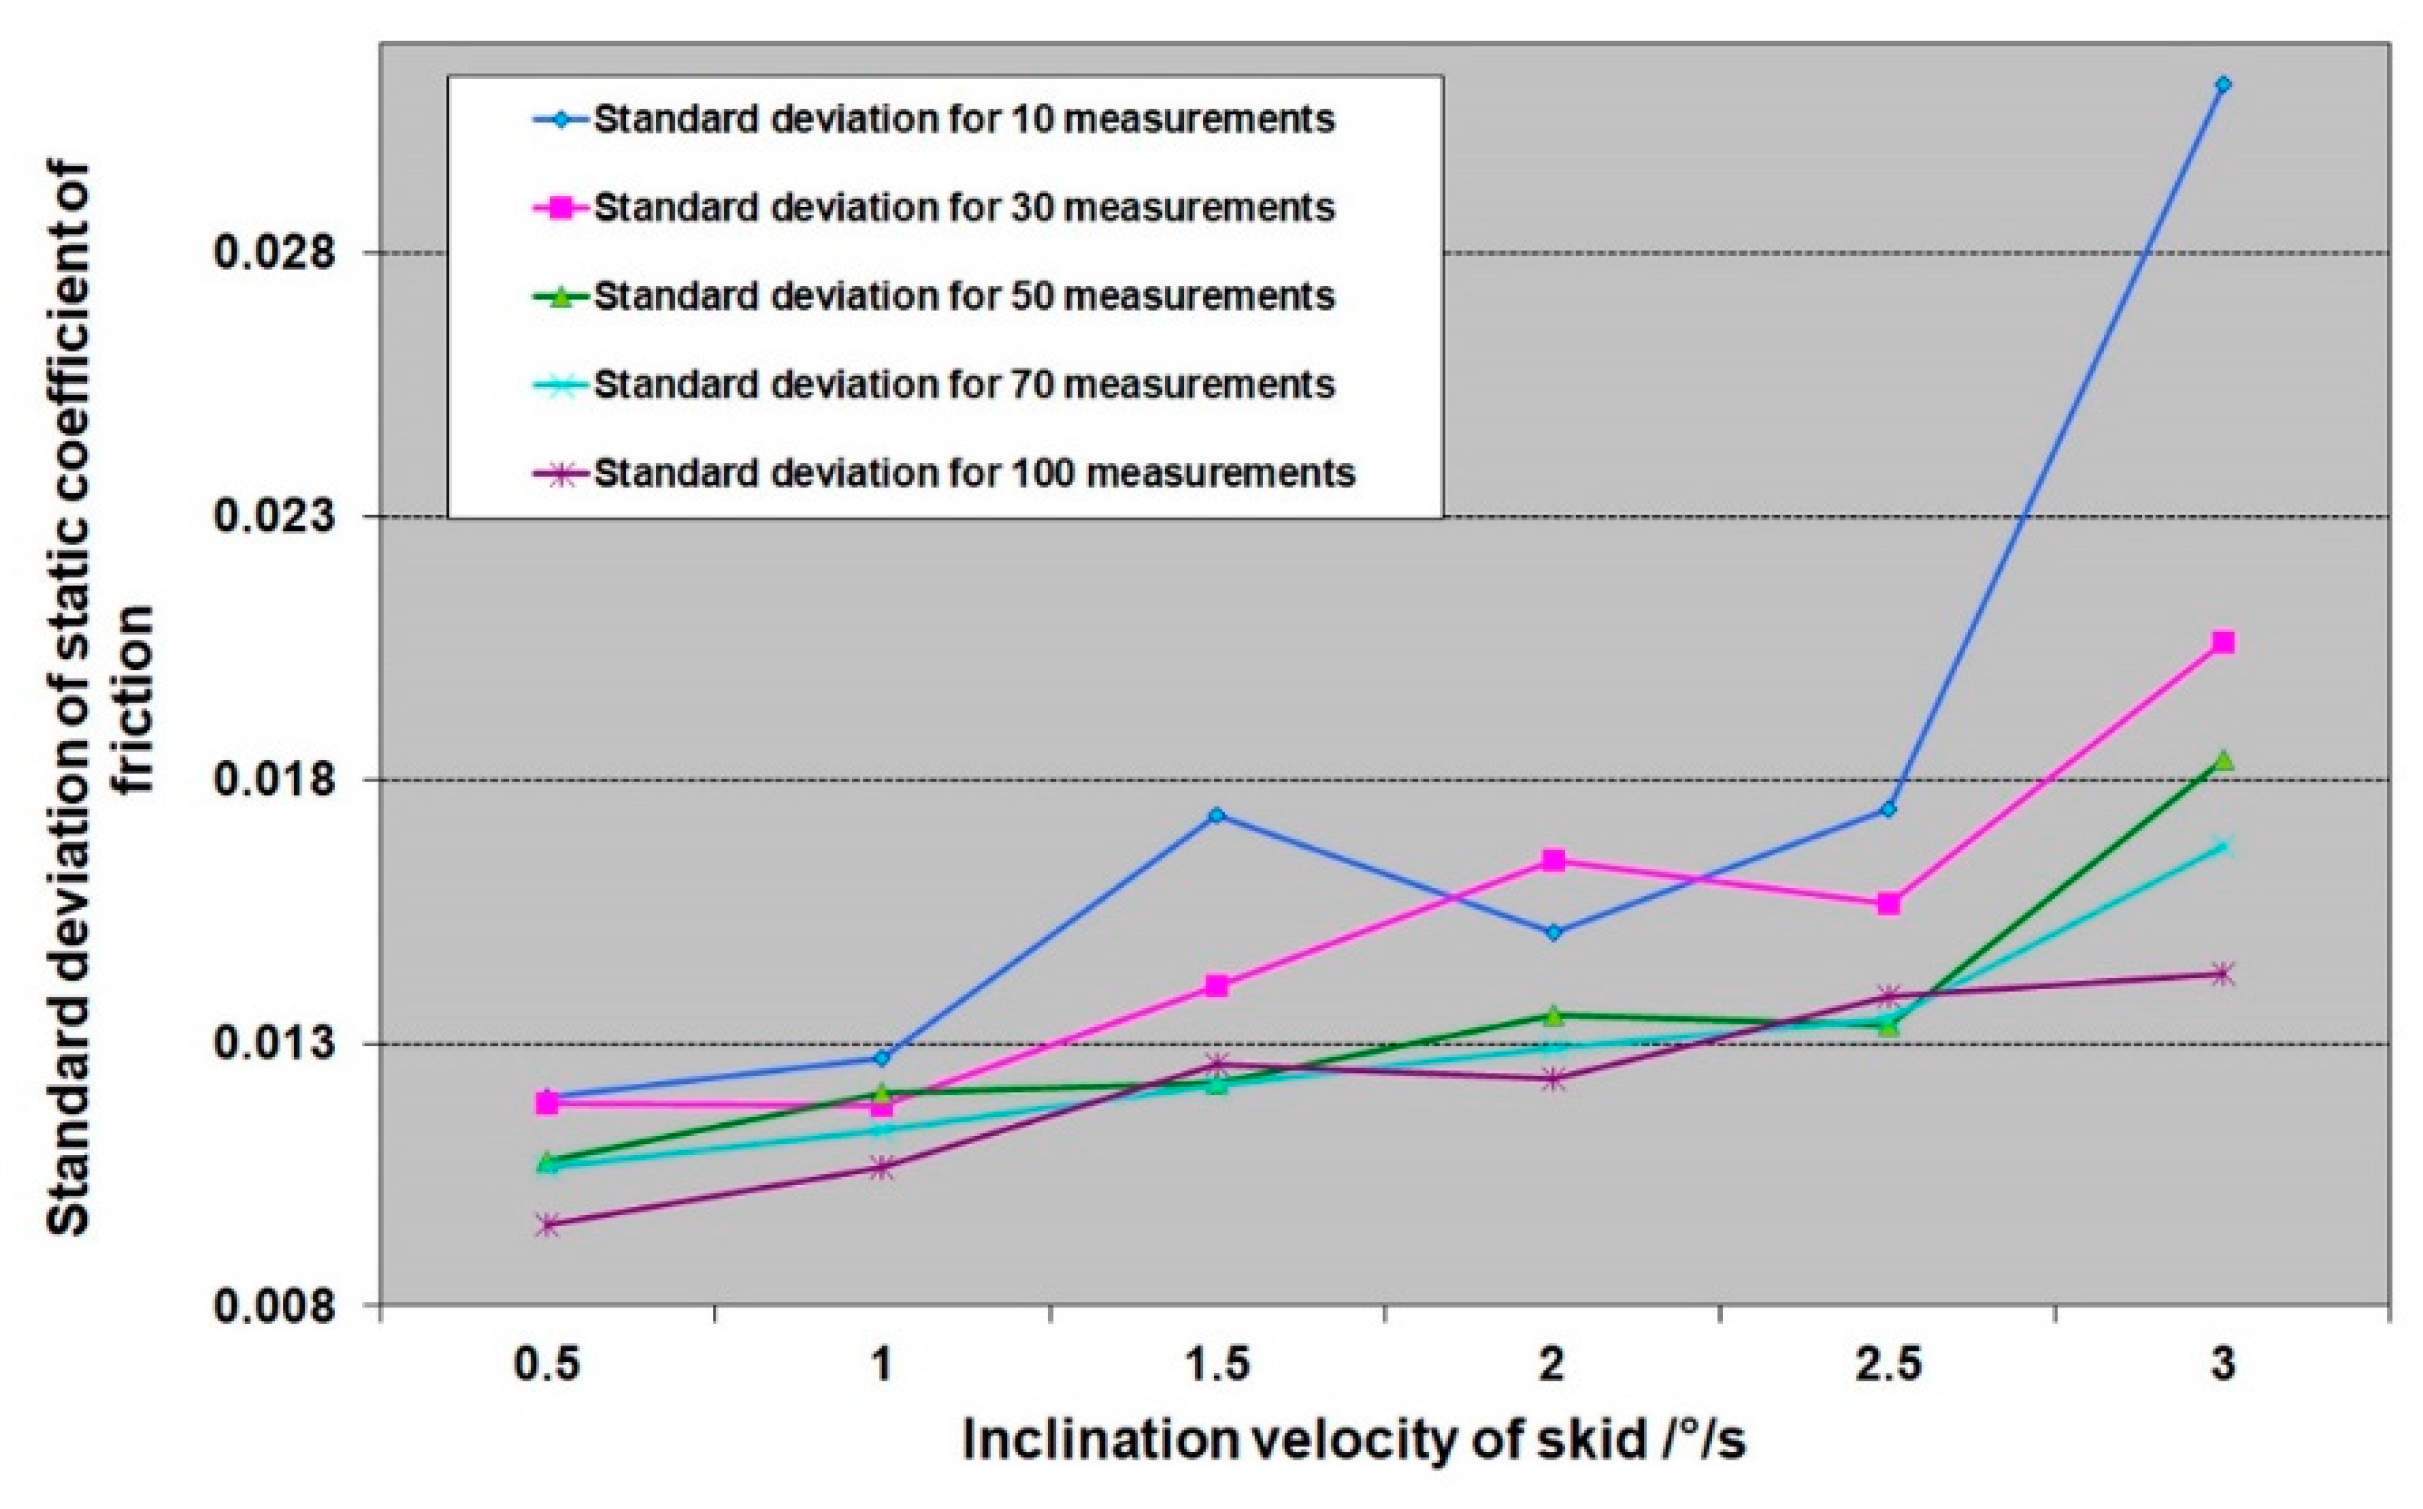
Experience from solving other tasks has shown that the number of measurements has a clear impact on measurement uncertainty. A small number of measurements leads to the degradation of the measurement results. On the other hand, an overly large number of measurements also has an economic impact because they cause a long measurement time, thus making the process of experimentally identifying frictional properties more expensive in practice. To determine the optimum number of measurements with respect to the minimum variance of the measured values and thus the minimum measurement uncertainty, it is advantageous to analyze the cumulative standard deviations. This means that out of the 100 measured values, standard deviations of 10, 30, 50, 70, and 100 could be evaluated. These values are shown for all measured speeds at (
Figure 11).
From this course of values (
Figure 11), it can be seen that the worst standard deviations were at 10 and 30 measurements. However, optimum results were already at 50 measurements. From the experimental course, it was apparent that the impact of the number of measurements was significant at the higher velocities of tilting the tribometer skid. This means that, in terms of the number of measurements, it is preferable to perform measurements at a lower skid tilting velocity, which implies the need for fewer repetitions of measurement. Ultimately, the measurement at a lower skid tilting velocity was much more productive since it did not require a large number of repetitions of measurement.
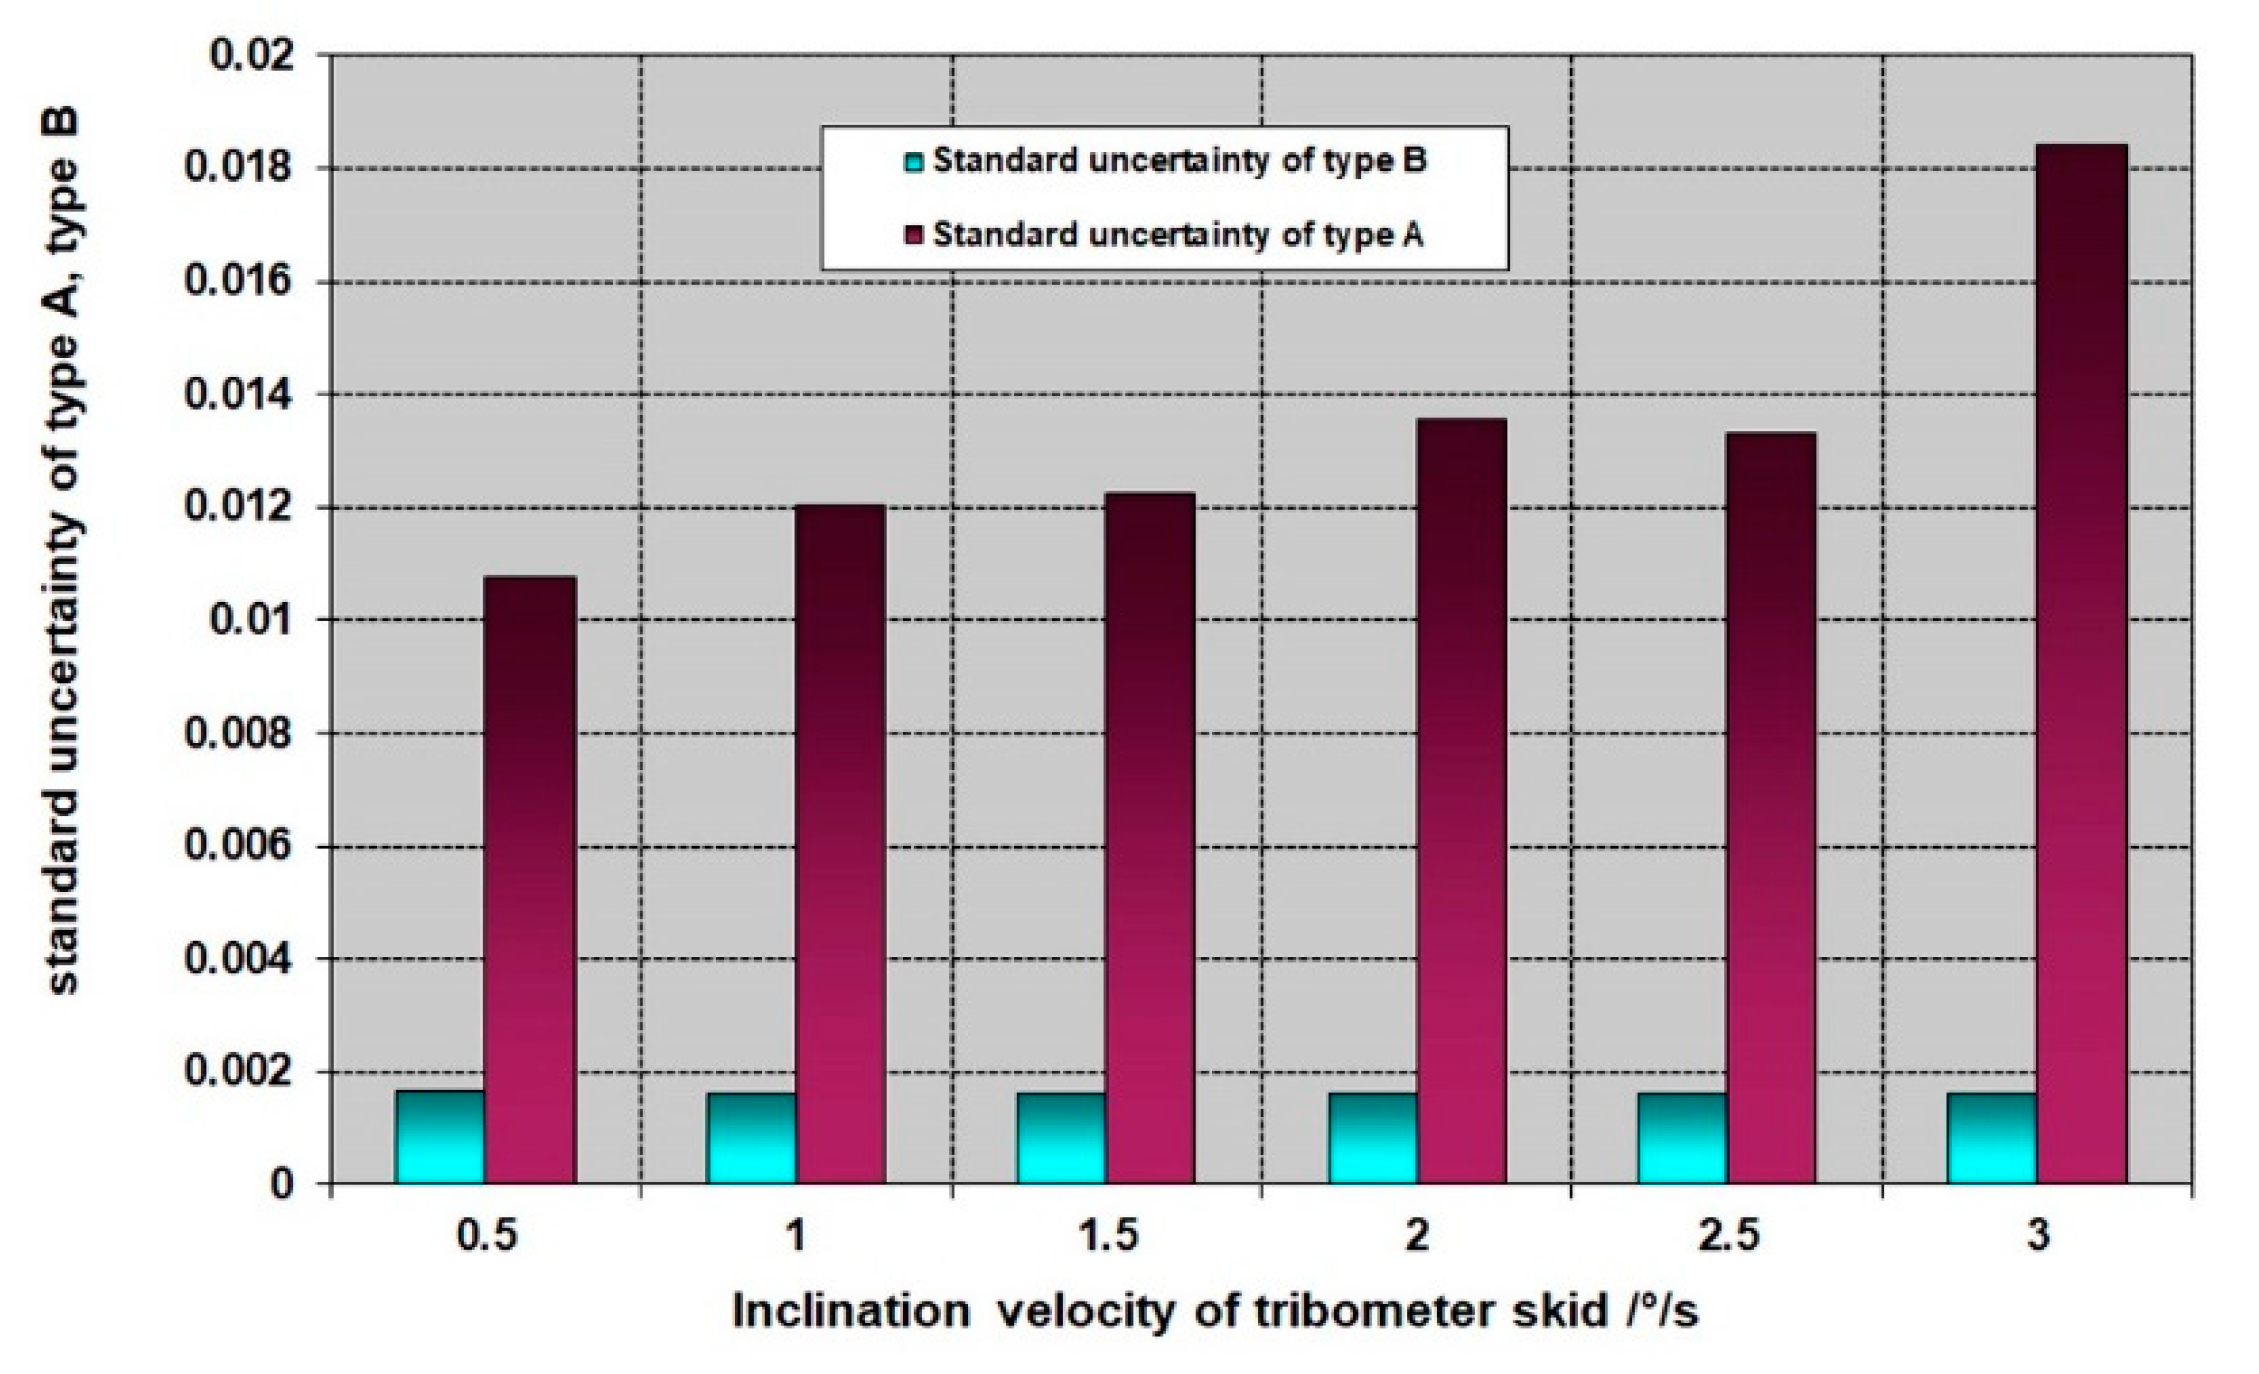
The maximum value of the standard uncertainty for the measurement of the inclination angle of the skid by a resistive displacement sensor was set to 5.3′. If the standard uncertainty of the static coefficient of friction applies, then the standard uncertainty determined by Method B for the static coefficient of friction is 0.0016.
If the standard uncertainty determined by Method A is considered the standard deviation of the 50 measurements (
Figure 11) (based on the above given), then it is possible, through a combination of these uncertainties, to obtain a combined uncertainty. The graphical representation of the standard uncertainties (
Figure 12) shows that the effect of the uncertainty determined by Method B was negligible compared to the standard uncertainty determined by Method A.
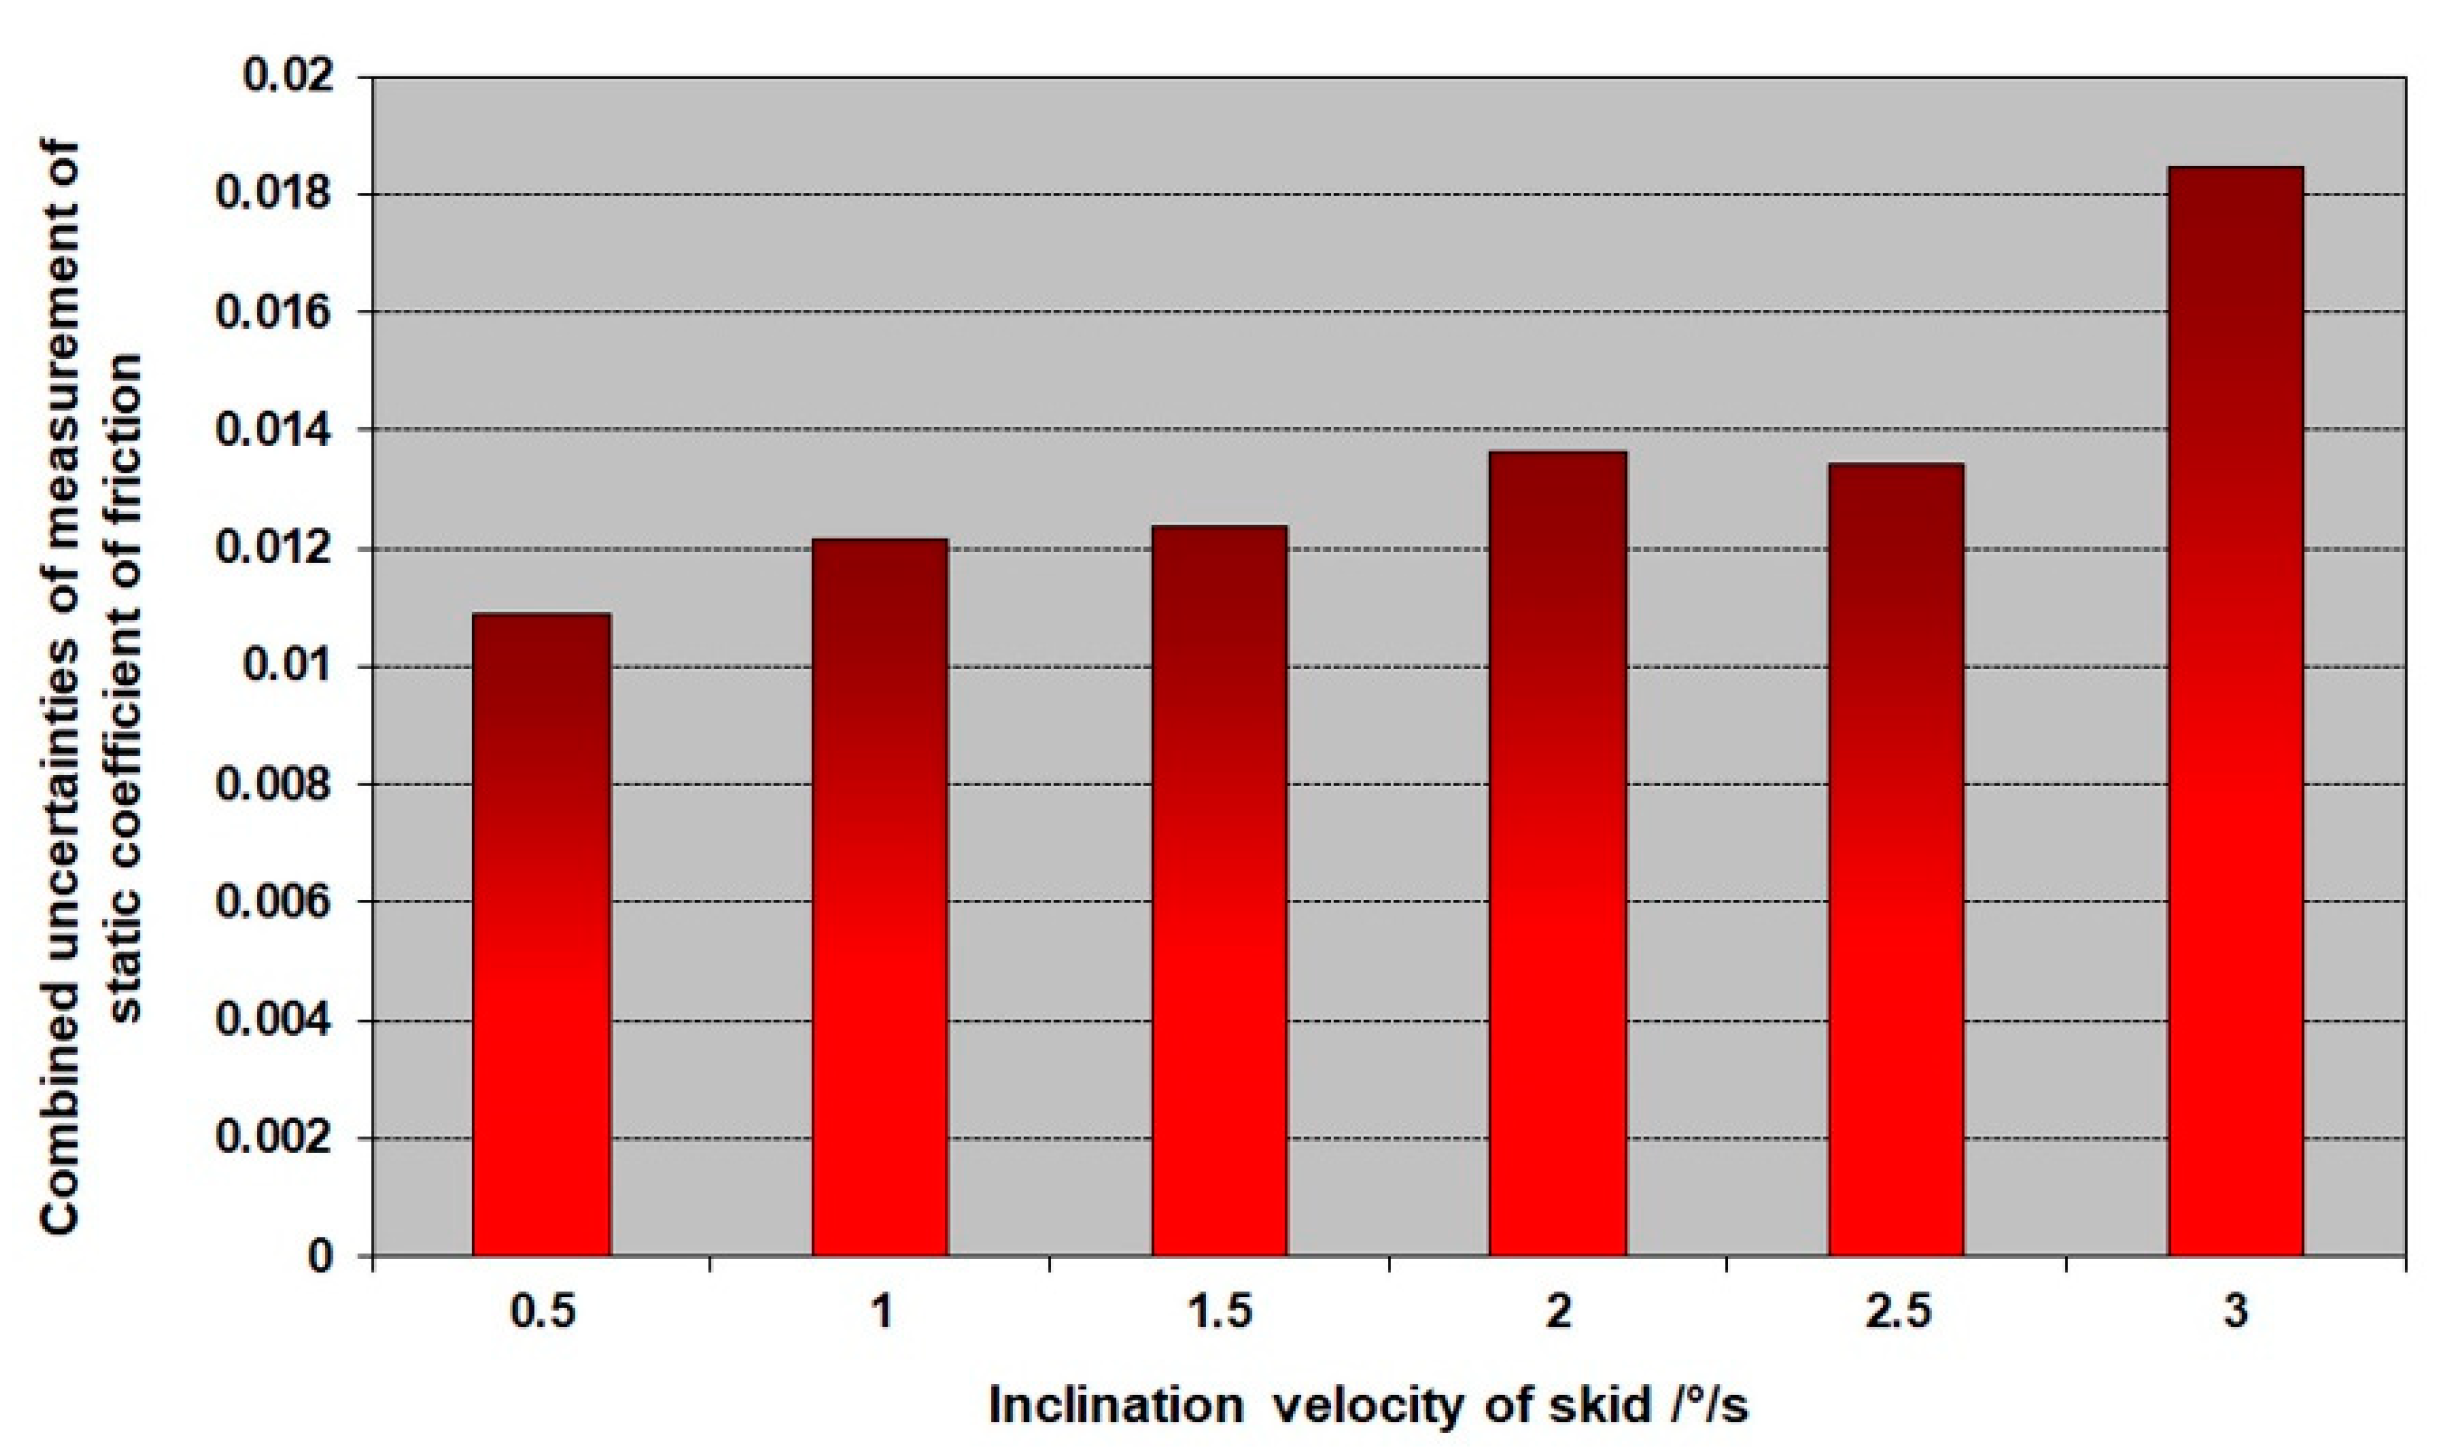
The graphical representation of the combined uncertainty of the measurements of the static coefficient of friction (
Figure 13) shows an increase in the expanded measurement uncertainty as the tribometer skid tilting velocity increased.
9. Experimental Examination of Impact of Parameters of Measurement Chain on the Result of Measurement of Kinetic Coefficient of Friction and Balance of Measurement Uncertainties
Based on the derived mathematical model of the measurement of the kinetic coefficient of friction, it was necessary to install a system to measure the time needed to overpass the path at the start of the body on the tribometer skid (
Figure 4 and
Figure 6).
Optical barriers for measuring the time were placed as close as possible to the point where the body initialized sliding. These measurements were performed at different inclination angles of the skid at which the body was lowered on the tribometer skid.
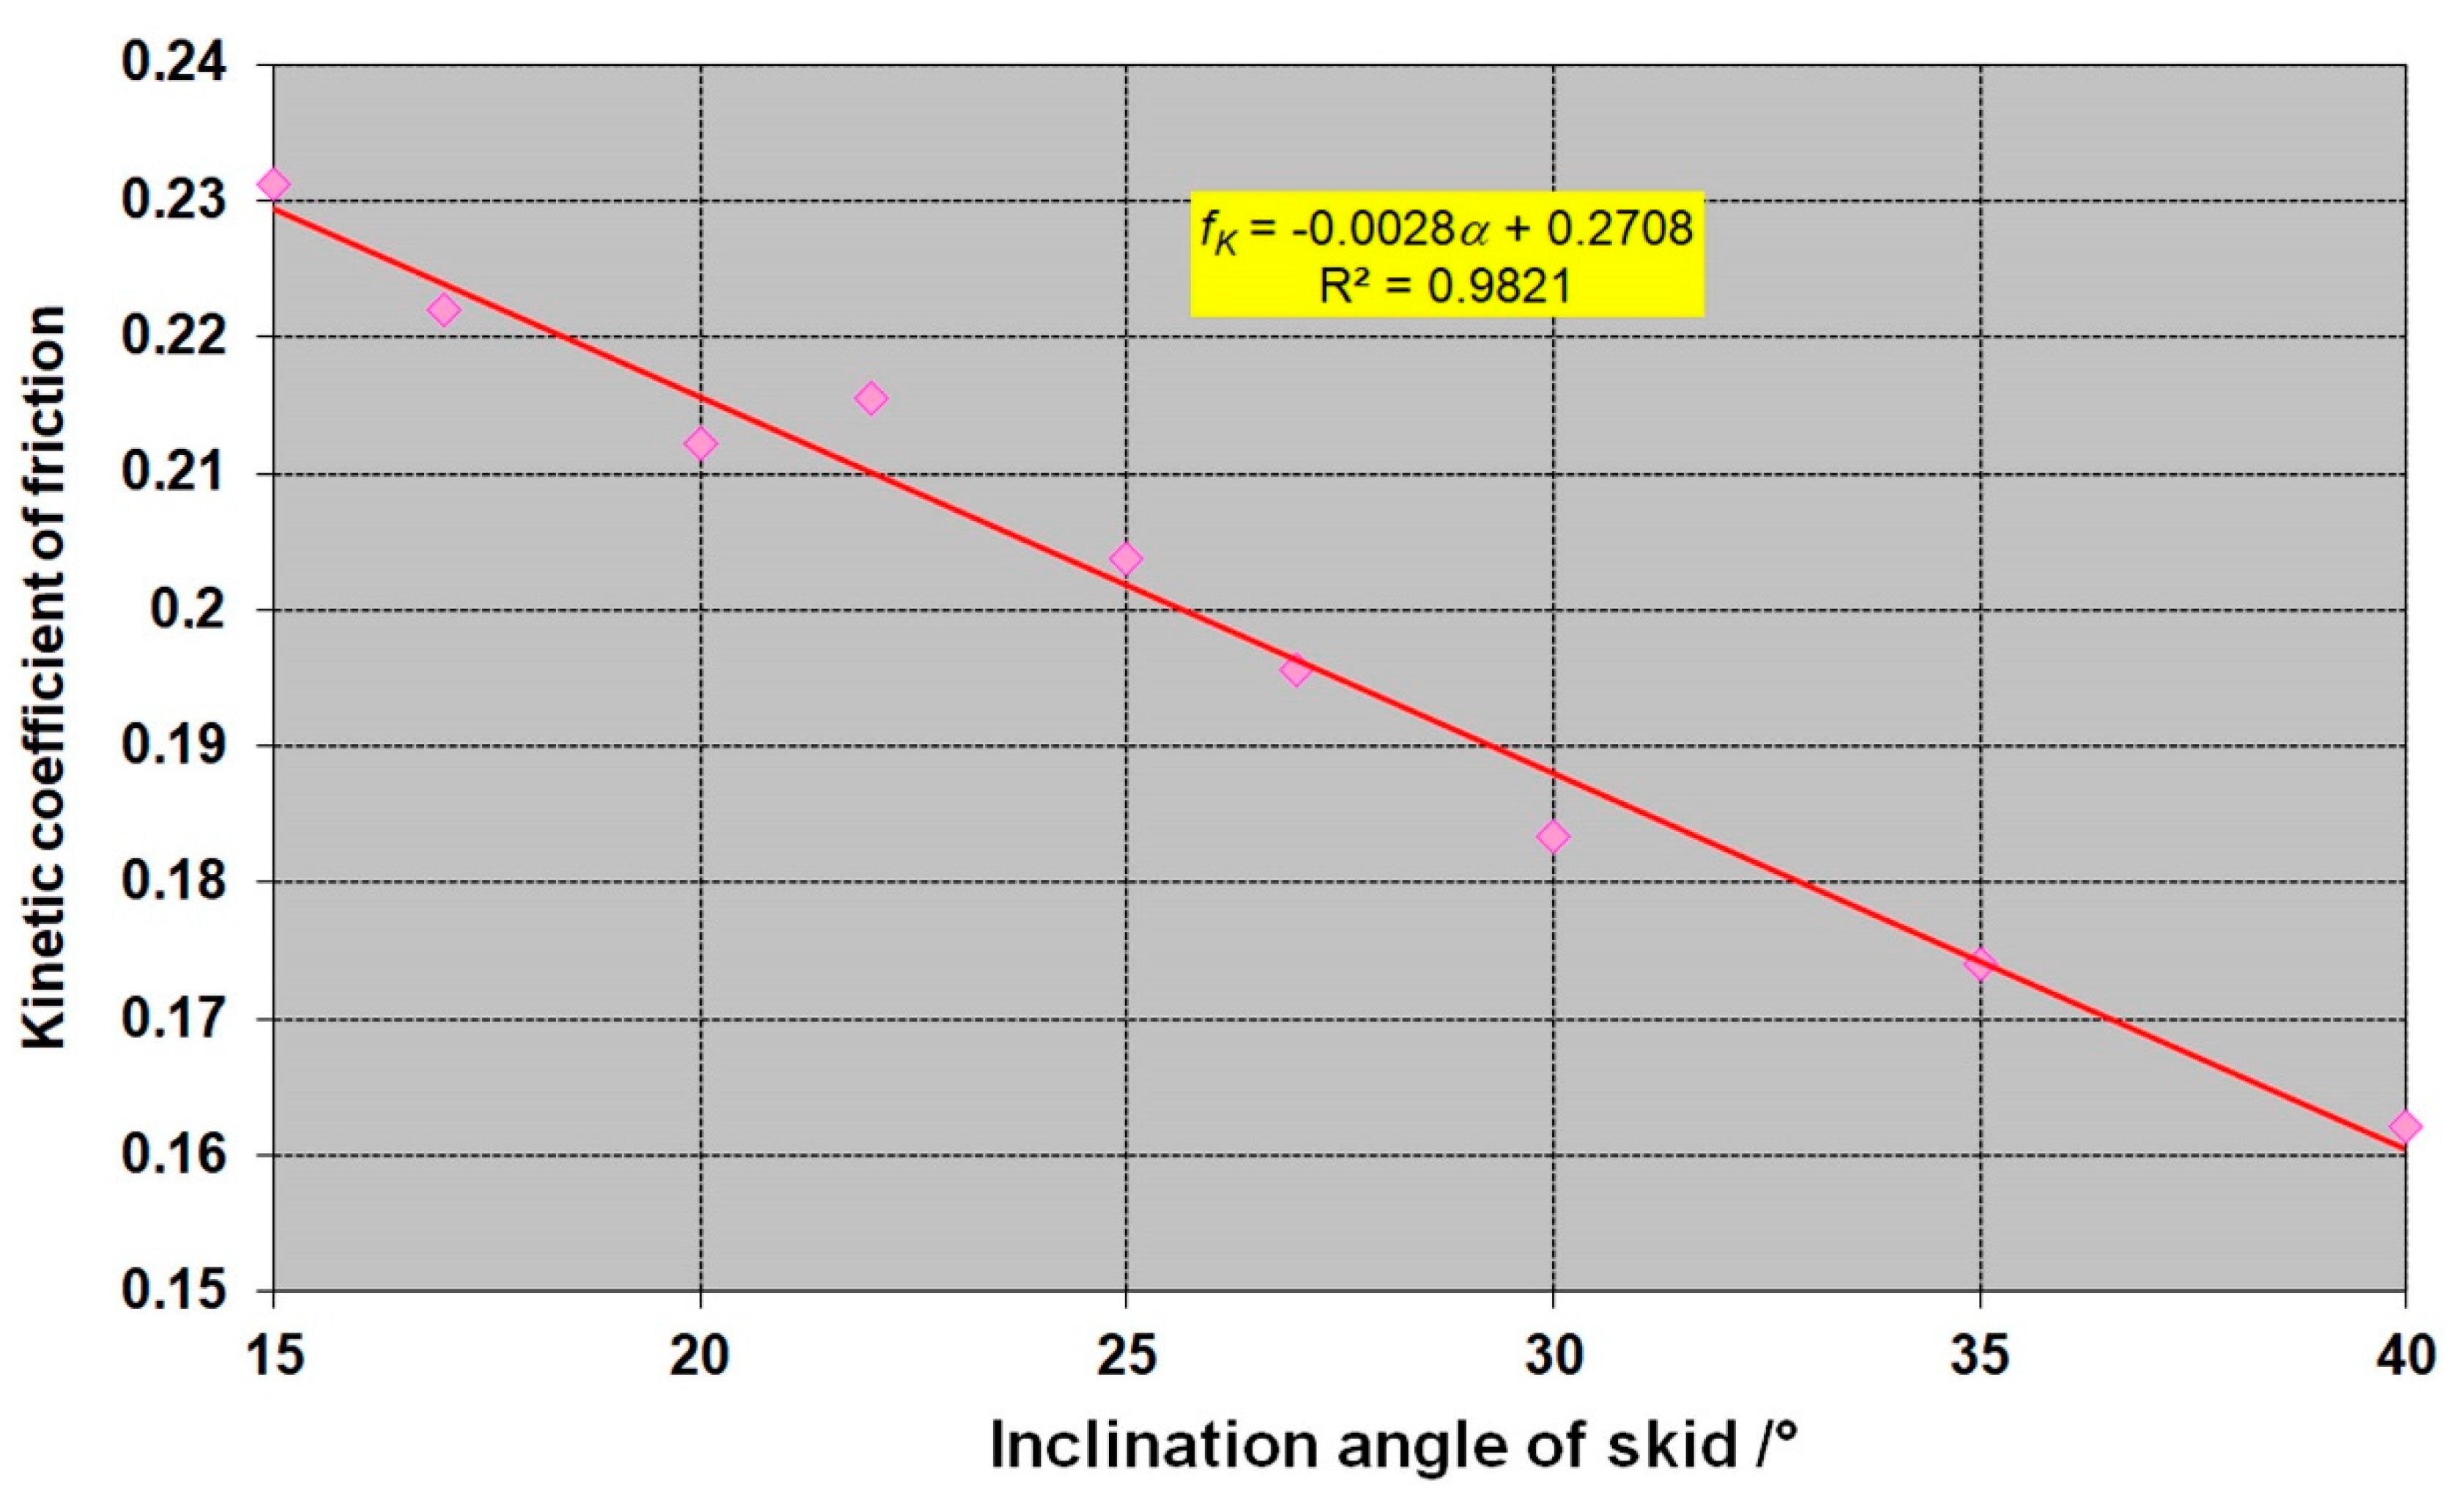
The results (
Figure 14) showed that the kinetic coefficient of friction had lower values than the static coefficient of friction and decreased as the inclination angle increased.
After substituting the values into Relation (14), it was possible to determine the standard uncertainty for the kinetic coefficient of friction when the variables in Relation (14) were uncorrelated. For the kinetic coefficient of friction, the following mathematical model applies:
where the overpassed path
LP and the gravity acceleration
g are constant but the time of the body motion Δ
t and the inclination angle of skid
αT are probably correlated variables.
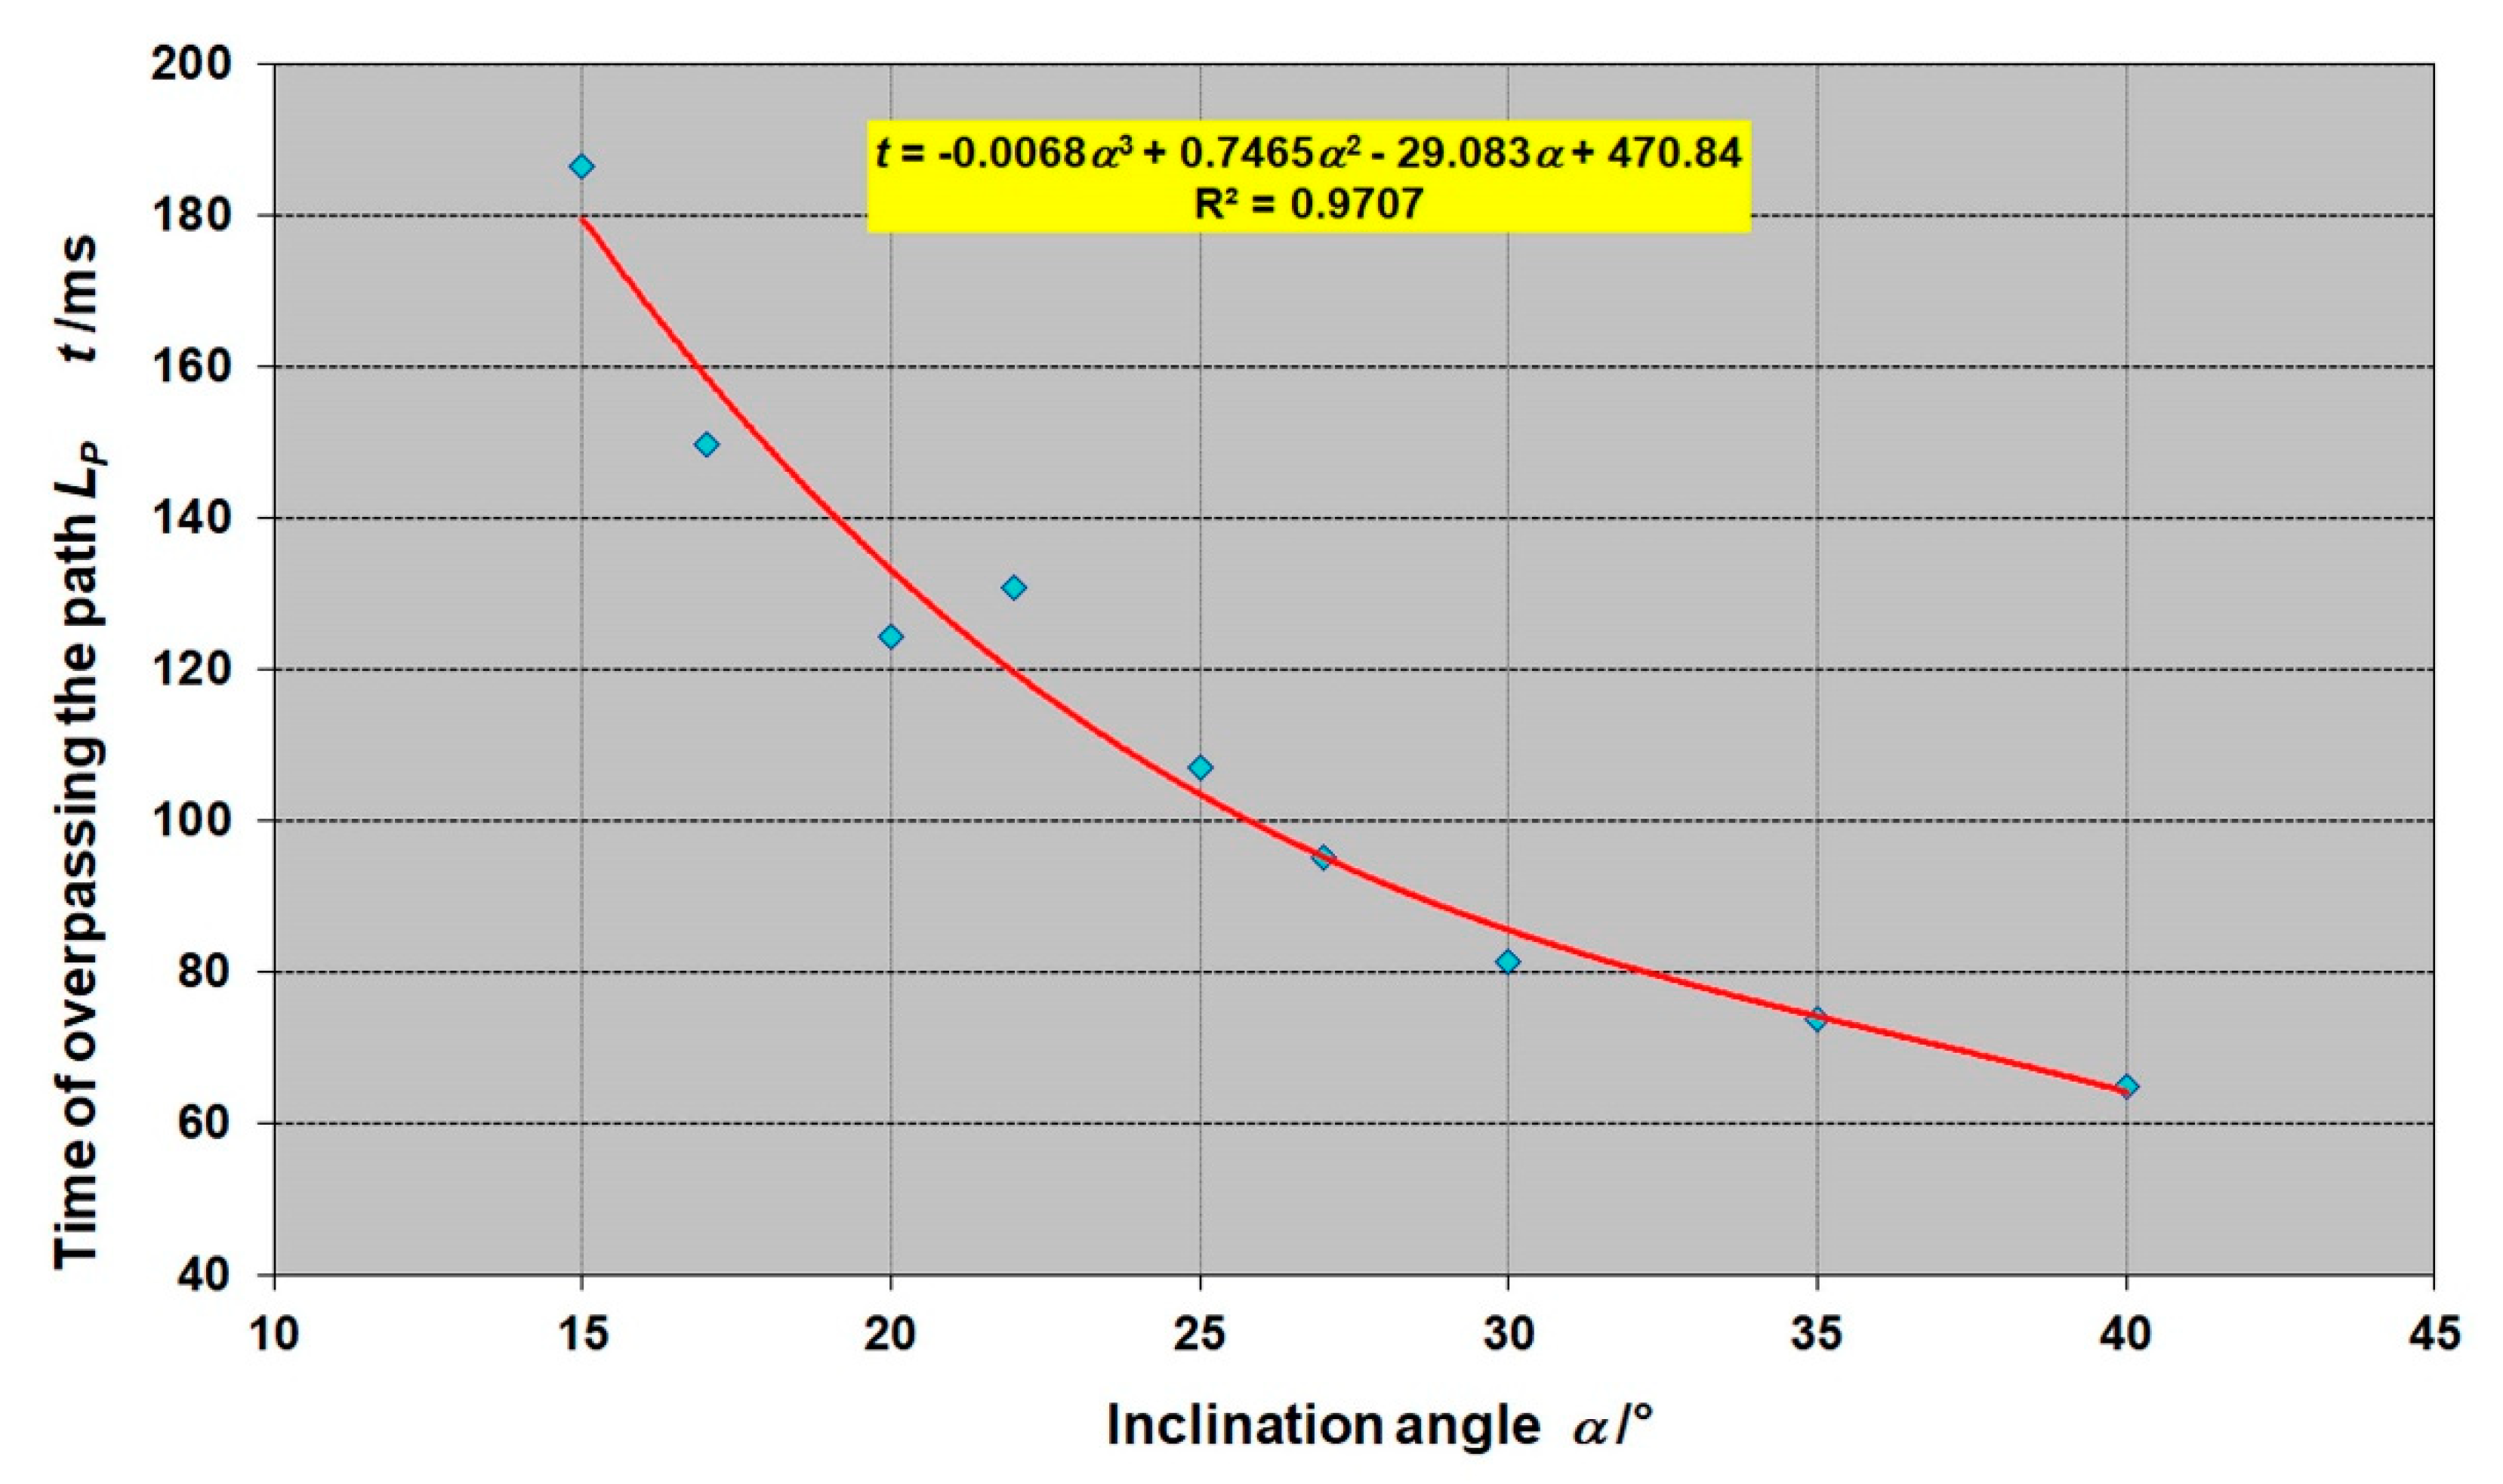
The graphical dependence (
Figure 15) between
αT and Δ
t indicates that there is a functional dependence between these variables, and, therefore, their covariance had to be considered in determining the uncertainty of the kinetic coefficient of friction.
The least-squares regression method was used for data fitting through a cubic function. This method is used in regression analysis to approximate experimental data.
Based on the law of uncertainty propagation [
28,
29,
30], the standard uncertainty of the kinetic coefficient of friction is as follows:
Standard uncertainties of input variables are determined according to regulations [
28,
29] by Methods A and B. Covariance cov(
αT, Δ
t) has a component cov
A(
αT, Δ
t) evaluated by Method A and component cov
B(
αT, Δ
t) evaluated by Method B.
The covariance determined by Method A (determined by statistic method) is the standard covariance between inclination angle
αT and the time of overpassing the path Δ
t is determined by Relation (17) and has a value of cov
A(
αT, Δ
t) = −0.00476606 rad·s.
The covariance determined by Method B is determined according to the following relation:
After substituting the value of the covariance determined by Method B, the value of cov
B(
αT, Δ
t) = −8.3474 × 10
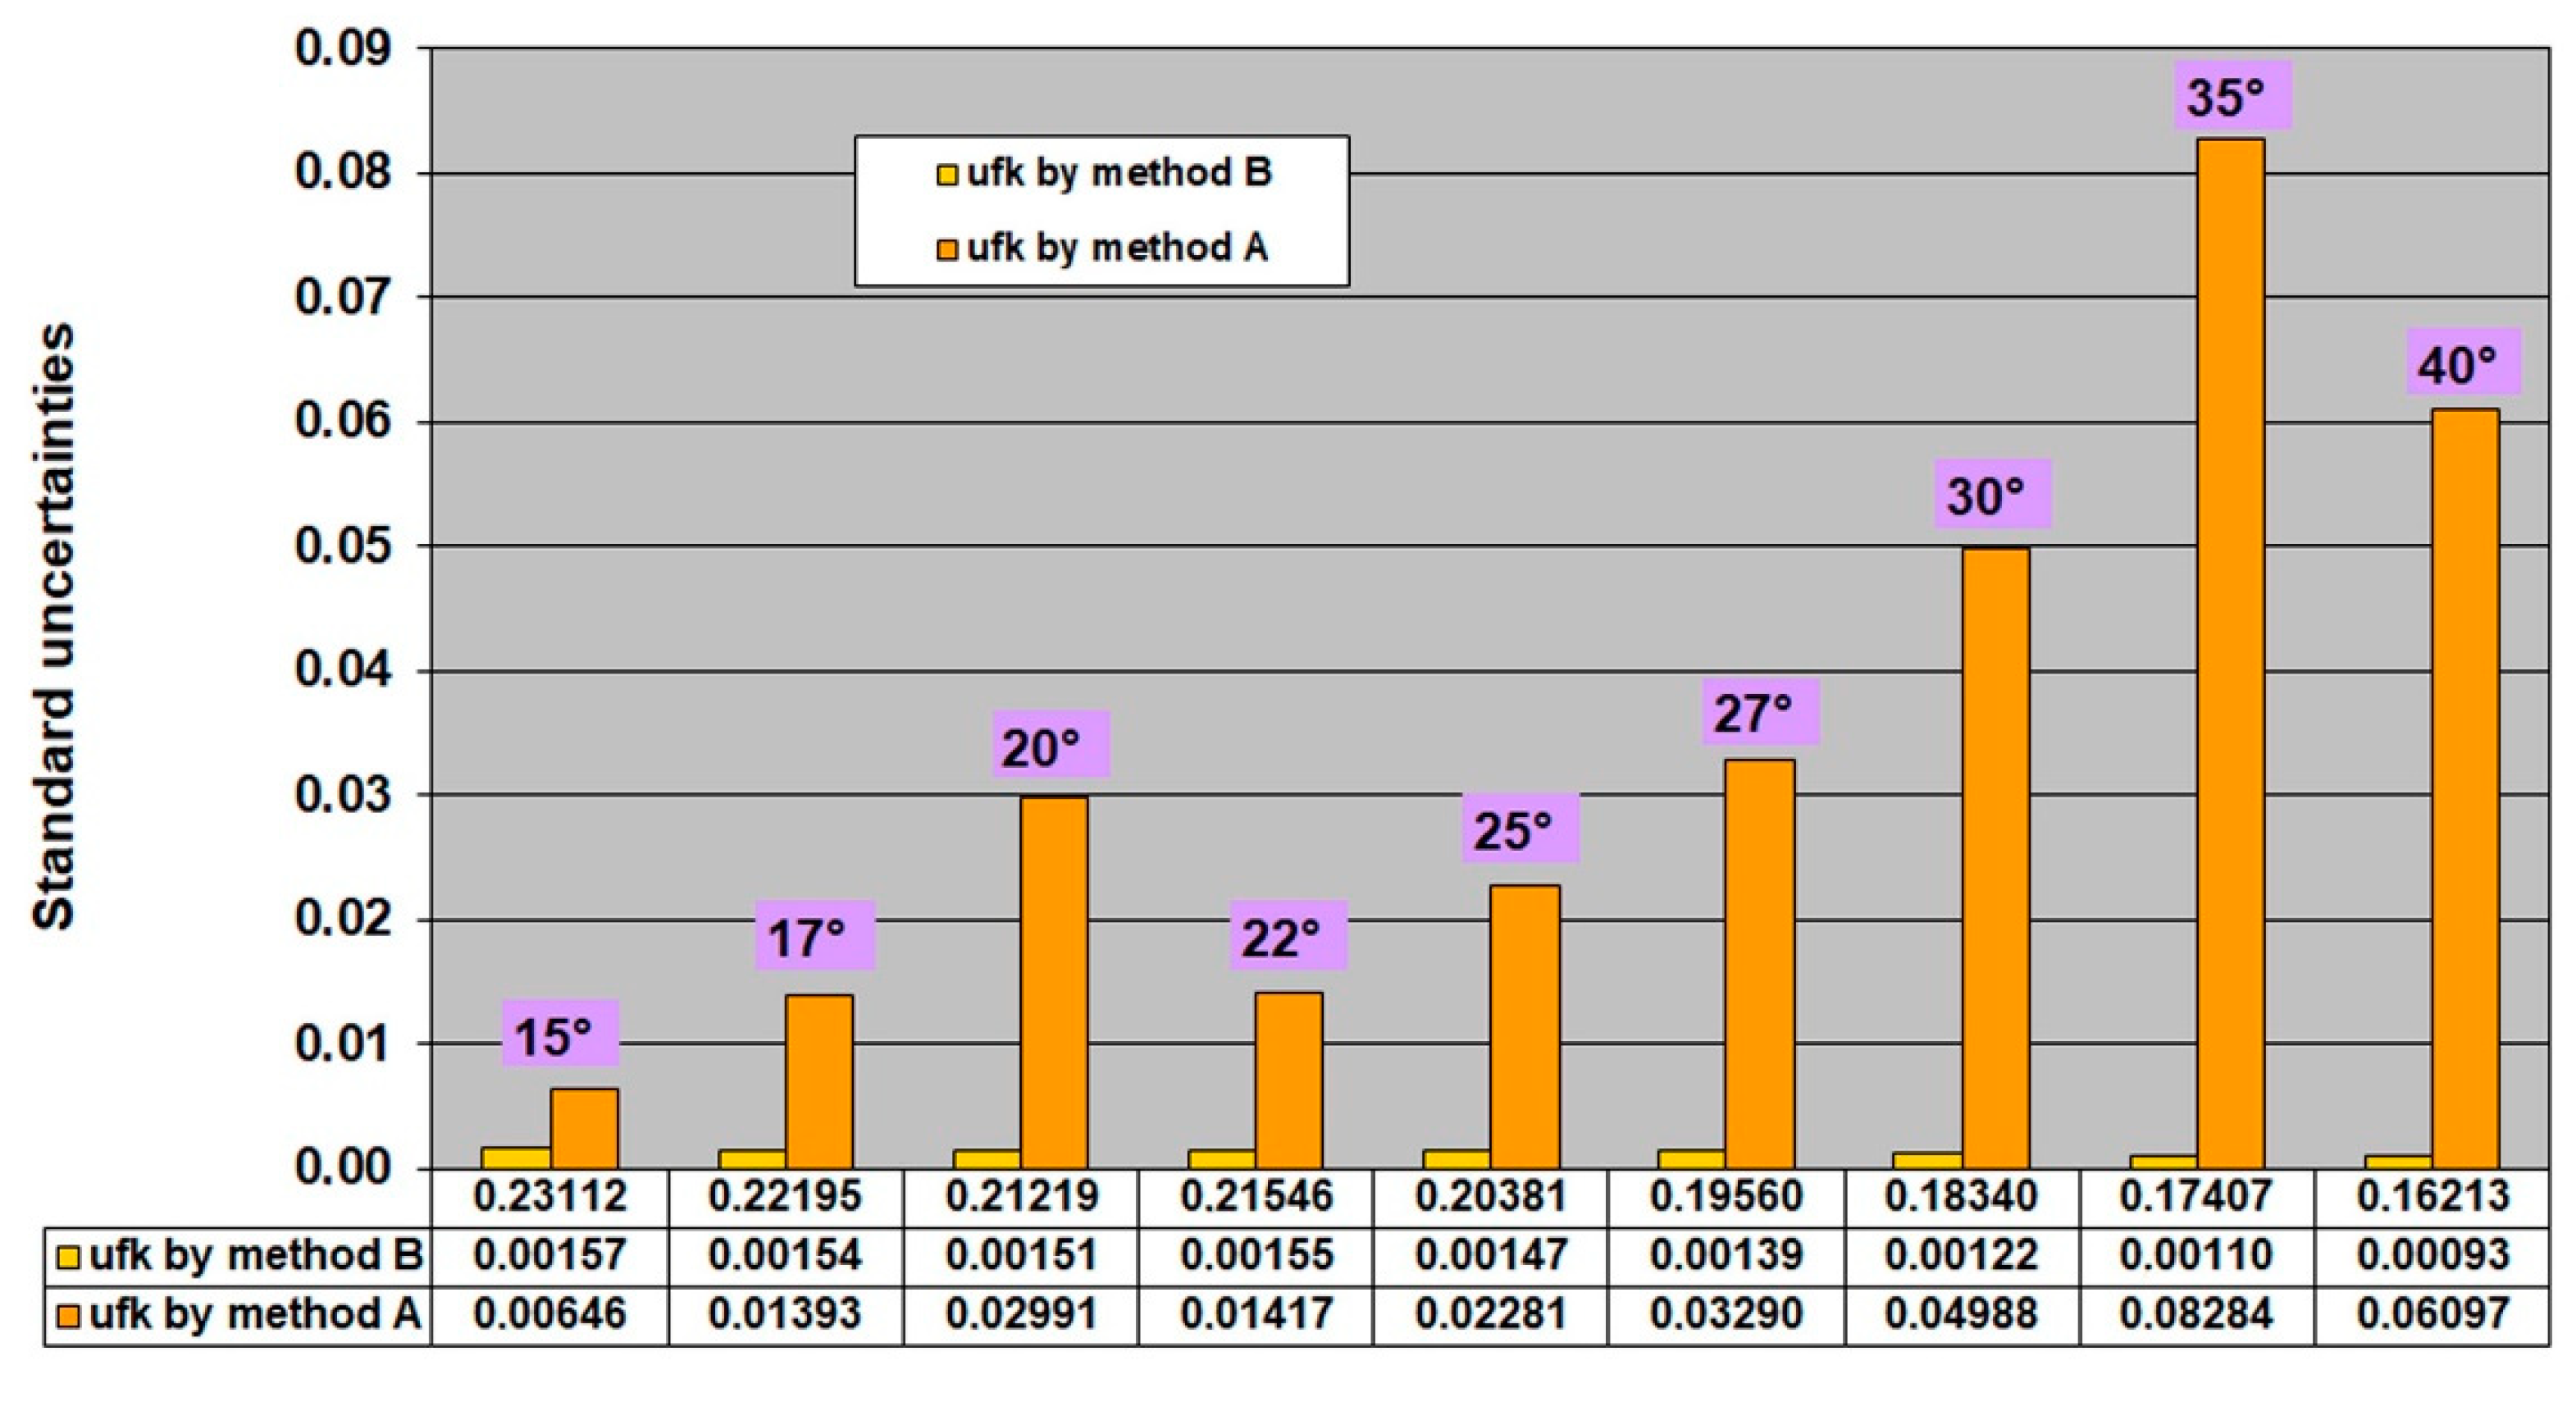
−9 rad·s was found. After substituting this value into Relation (16), it was possible to obtain the standard uncertainty of kinetic coefficient obtained by Methods A and B (
Figure 16).
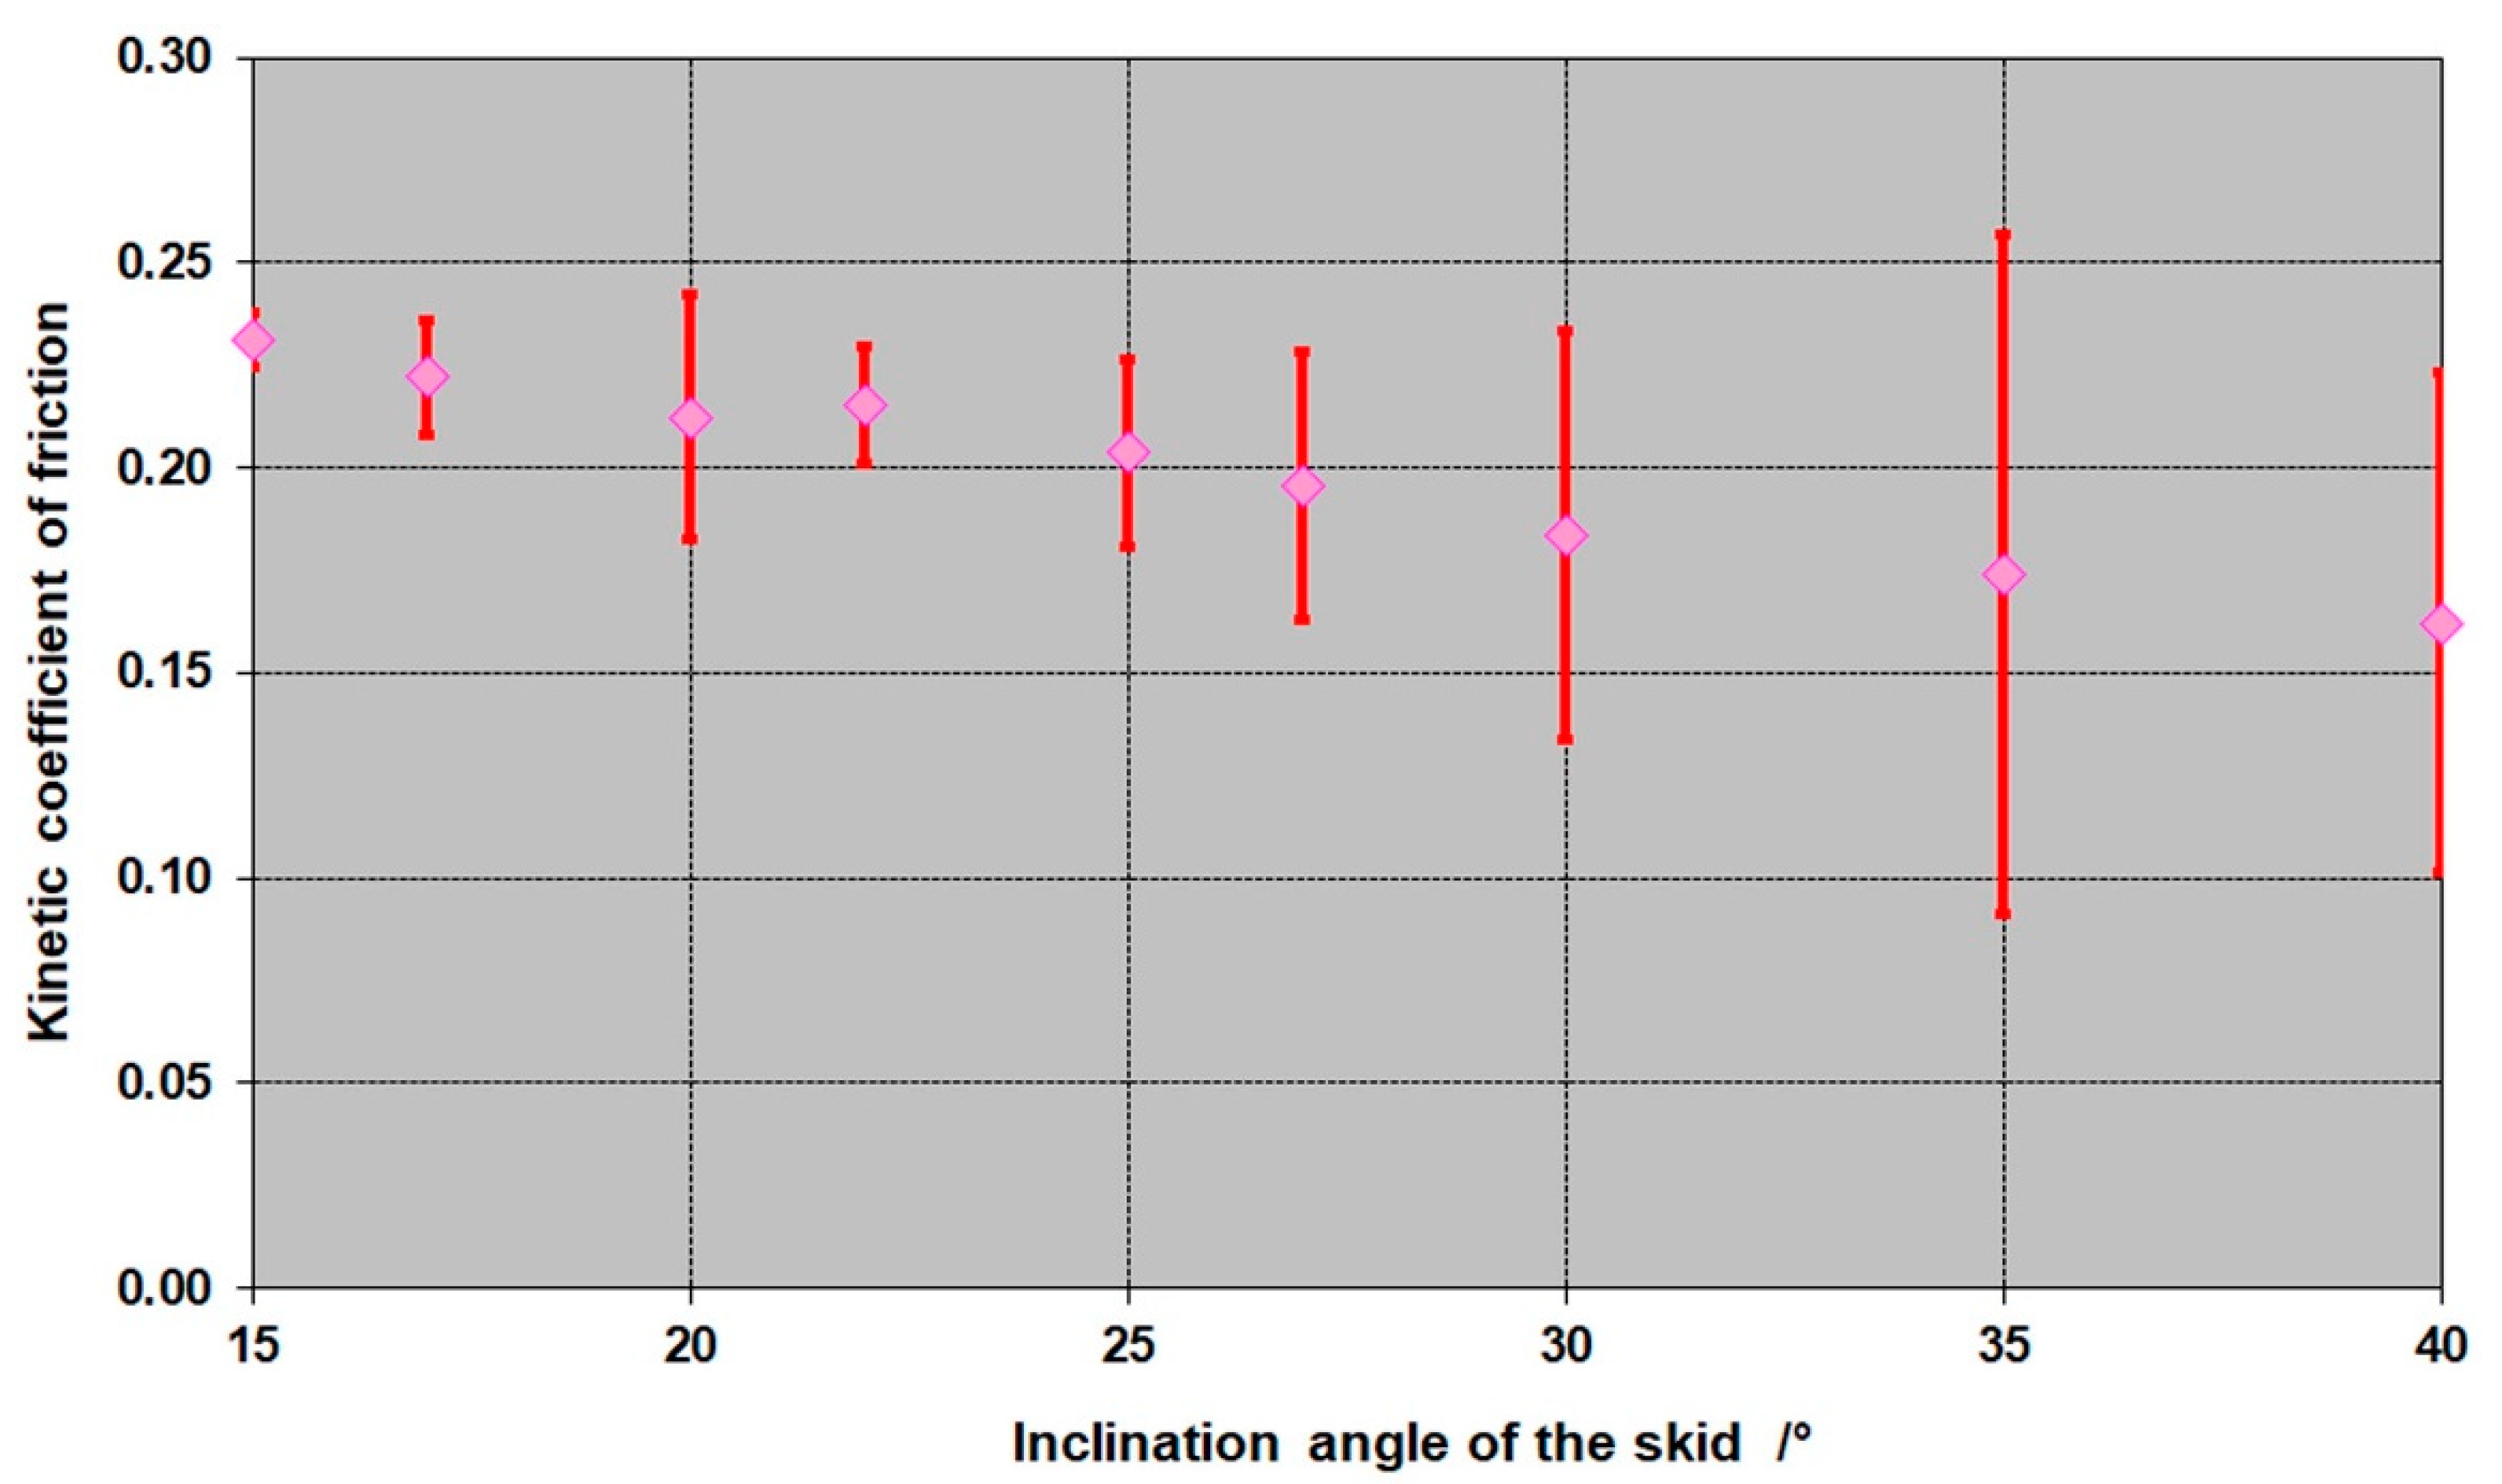
By combining the standard uncertainties obtained by Methods A and B, it was possible to determine combined uncertainties for the kinetic coefficient of friction (
Figure 17). The graph shows an increase in the combined uncertainty (shown as error bars) with the inclination angle of the platform at which the kinetic coefficient of friction was determined.
10. Discussion and Conclusions
Practically, there are many applications where it is necessary to identify friction forces. The use of default tables for concrete material pairs only leads to a very rough estimation. The success of many applications depends on the precise identification of friction properties [
34,
35,
36,
37,
38,
39,
40,
41].
This work was focused on problems related to the expression of friction coefficients for concrete materials. The measurement of friction forces has to be executed in accordance with measurement standards.
According to International vocabulary of metrology (Vocabulaire international de metrologie VIM3 - 2.9 (3.1)—Note2) [
31], a measurement result is defined as the quantitative value of the variable and the uncertainty of measurement. This fact is rather often forgotten, and few works in the area of the identification of frictional properties have been concerned with the uncertainty of measurement results. If this uncertainty is not stated in the measurement result, its negligible size is assumed. However, very often, the reason why it is not stated is because the measurement uncertainty was not even assessed and analyzed in the measurement process. Thus, it is not uncommon that even renowned scientific teams publish measurement results without stating measurement uncertainties. These results do not express their credibility, and then it is not possible to compare the actual measurement results or inter-laboratory comparative measurements that could move this particular area of knowledge forward.
This work aimed to contribute to this field of knowledge and link the process of measurement itself with the assessment of measurement uncertainties. Uncertainty analysis can also be helpful in the design of devices, where it is already possible to design the measurement chain so that it may achieve the required level of uncertainty at the implementation. Such a process of concept, supported by uncertainty analysis, also brings economic benefits because the development results in devices with a higher “credibility” of their measurement results.
To measure the moment of starting the movement of the body, the method of visual observation by the observer is currently used, and this method subjectively determines the moment of the starting of the movement of the body and, thus, the moment of the reading of the inclination angle of the tribometer skid. As a result, significant gross errors are introduced into the measurement process, which significantly depreciates the measurement uncertainty. A suitable solution is to apply a sensitive sensor with as little measurement uncertainty as possible, which would objectively identify the moment of the starting of the movement of the body as a change of its position.
The proposed concept meets the specified requirements—the sensing of the inclination angle and the automatic evaluation of its measured value, sensing the moment of initialization of the movement of slipping body on the skid, and the subsequent automatic turn off of the inclination of the skid at the initialization of the movement of the body on the skid. The velocity of the tilting of the skid is automatically regulated at the selected value in an interval of 0.5–3°/s.
We experimentally tested the created measurement device’s ability to measure the static coefficient of friction. The influence of the inclination velocity of the tribometer skid on the measurement result was identified. The optimal number of measurements in terms of the uncertainty balance was determined.
The difference between the static and kinematic coefficients results from their definitions. The static coefficient of friction is obtained in a moment when an object starts moving, and kinematic friction results from a situation when an object is moving on any surface. The kinematic coefficient of friction should be still less than static coefficient of friction. All theoretical models and our experiments have confirmed this phenomenon [
34,
35,
36,
37,
38,
39,
40,
41].
Research results were found for dry sliding friction at room temperature without any lubricants. The need of this research was established from previous research on micromachines, where friction force is dominant and sometimes larger than active drive force. The neglect of the wrong values of friction force during the design process can cause that designed machine to not work.
Future research will be focused on the experimental verification of obtained results for various material pairs. Additionally, the influence of the other relevant factors of temperature and humidity on measurement results will be evaluated, and the authors have developed the concept of a fully automatic tester to obtain of friction properties of material pairs. This concept will be researched in future research.


 ,
, 


