Cooling Performance Analysis of the Lab-Scale Hybrid Oyster Refrigeration System
by
 ,
,
Xuejun Qian
1,2,* ,
,
Yulai Yang
1,2,
Seong W. Lee
1,2,
Marc J. L. Caballes
1,2 and
Oludayo S. Alamu
1,2 1
Industrial and Systems Engineering Department, Morgan State University, 1700 East Cold Spring Lane, Baltimore, MD 21251, USA
2
Center for Advanced Energy Systems and Environmental Control Technologies, School of Engineering, Morgan State University, 1700 East Cold Spring Lane, Baltimore, MD 21251, USA
*
Author to whom correspondence should be addressed.
Processes 2020, 8(8), 899; https://doi.org/10.3390/pr8080899
Submission received: 4 June 2020
/
Revised: 16 July 2020
/
Accepted: 23 July 2020
/
Published: 27 July 2020
(This article belongs to the Special Issue Control and Optimization of Multi-Agent Systems and Complex Networks for Systems Engineering)
Abstract
:Compared with the waste-to-heat and electricity-based hybrid refrigeration system, the innovative lab-scale refrigeration system integrated with the DC and AC cooling units that able to use solar and electricity as energy resources. Previous studies found that temperature control and uniform temperature distribution in refrigeration systems are both critical factors reducing vibrio growth on raw oysters and saving energy consumption. Therefore, this refrigeration system also equipped a specially designed divider and was used to test various air circulation strategies to achieve uniform temperature distribution in six individual compartments. The objective is to investigate and evaluate the effects of air circulation strategies and operating conditions on the cooling performance, including temperature distribution, standard deviation of compartment temperatures, and cooling time using a factorial design method. Results indicated the maximum temperature difference between the compartments was 8.9 ± 2.0 °C, 6.7 ± 2.0 °C, and 4.8 ± 2.0 °C in the scenarios of no air circulation, natural air circulation, and combined natural and forced air circulation, respectively. The interaction of fan location and fan direction showed a significant effect on the compartment temperatures while there was no significant effect on cooling time. A circulation fan on the lower part of the 12-volt section with an air supply from the 12- to 110-volt section was determined as the optimal condition to achieve relatively uniform temperature distribution. Refrigeration system also achieved a cooling temperature of 7.2 °C within 150 min to meet regulations. To that end, the innovative hybrid oyster refrigeration system will benefit oyster industries, as well as the aquaculture farmers in terms of complying with regulations and energy savings.
1. Introduction
Oysters play a vital role in the Bay ecosystems because they filter sediments, detritus, and small phytoplankton from the water to improve water quality while providing foods and habitats to hundreds of critters [1]. Additionally, oyster aquaculture has been partially approved as an alternative management practice for nutrient reduction (e.g., nitrogen and phosphorus) in the Chesapeake Bay region. This is because oysters consume organic materials from their aquatic environment by specialized filtration systems [1,2]. However, several factors have contributed to a decline in oyster populations associated with Chesapeake Bay, including overharvesting, habitat destruction, and mortal diseases (e.g., Multinuclear Sphere X and Dermo) [3]. Among these factors, overharvesting played a key role in the declination of the oyster population [4]. In 2009, Maryland’s Oyster Restoration and Aquaculture Development Plan announced whereby the State of Maryland was to gradually shift the oyster business from a fishing model of wild oysters into a farming model of cultured oysters. This business model change was expected to accommodate overharvesting and the decline of oysters in the Bay areas. In recent years, oyster aquaculture in Maryland was estimated to have a total economic output of 8.1 million USD, while boosting employment with 133 new jobs in 2018 [5]. Nationally, oysters remain as the one of the largest growing marine species group under aquaculture, valued at 173 million USD in 2015 and 192 million USD in 2016 [1]. Accordingly, oyster aquaculture will not only continue to grow and play a more important role in the nation’s economy, but it can integrate into best watershed management practices by reducing nutrients and improving water quality.
Moreover, while consumption of raw oysters is only increasing, several studies suggest that the consumption of cultured raw molluscan shellfish (e.g., oysters, clams, mussels, and scallops) is associated with foodborne illnesses and risk of infections from vibrio bacteria, such as Vibrio vulnificus (Vv) and Vibrio parahaemolyticus (Vp) [6,7,8]. One proposed approach by the National Shellfish Sanitation Program (NSSP) for reducing bacteria quantity is the post-harvest processing (PHP) methods. PHP methods include cool pasteurization, rapid freezing, low-dose gamma-irradiation, high-hydrostatic pressure, high-sanity relaying, and thermal processing [2,9,10]. However, these PHP methods are costly technologies and negatively affect the taste of raw oysters [10]. Temperature control of oysters during harvesting, processing, and distribution process was another proposed approach to inhibit and decrease vibrio growth [7,8]. According to the NSSP for appropriate Vp control, the internal temperature of oysters for raw consumption must reach 10 °C (or less) within 10 h after being placed into a refrigeration system during the warm summer season [8,11,12]. Several investigations further support the role of temperature control on Vp growth, specifically, from maintaining storage temperature at 7.2 °C in order to hamper pathogen growth [13]. Uniformity of temperature distribution in refrigeration systems was found to extend the living cycle of food and minimize bacterial growth. At the same time, keeping a uniform distribution of temperature was found to improve the storage quality of products while reducing energy consumption [14,15]. Previous computational fluid dynamics simulation studies found that both temperature distribution and thermal behavior were influenced by the refrigeration system’s interior design [16,17], cooling load conditions [18], and the addition of fans [19]. Yang et al. [20] proposed a new design of shelves in the air outlets in order to achieve a better thermal profile with a reduction of temperature in the refrigerator compartment, from 7.17 °C to 3.57 °C [20]. It was found that the temperature variation declined, and a more consistent temperature was achieved if the distance between the shelves and refrigerator door was reduced [21]. Adding an axial fan and an air duct had affected the air flow in a way that improved temperature uniformity in the refrigerator [19]. In addition, it was suggested to include forced air circulation to realistically simulate air flow and reduce temperature variation in the refrigeration cabinet [15].
In the past, ice was widely used as a cooling medium in traditional fishing boats in order to control temperature and store cultured oysters. It was found that oysters directly exposed to the ice after one to two weeks post-harvest exhibited significant gaping among the oyster shells [22]. Furthermore, unexpected mortalities in oysters have been correlated with gaping. Ice is also not an ideal option for storing oysters for long periods of time, often during long-distance transportation of the oysters due to its tendency of melting rather easily. Conventional refrigeration systems utilize hazardous refrigerants (e.g., chlorofluorocarbons, hydrochlorofluorocarbons, fluorocarbons, and hydrofluorocarbons), which depleted ozone layers and caused global warming phenomena [23]. These environmental reasons lead to identify and deploy new types of refrigerants. A wide variety of mechanical refrigerating systems exist today, including those with environmentally friendly refrigerants (e.g., R717 and R744), depending on the fish species, size, and processing methods [24,25]. In addition, there exists emerging refrigeration technologies, such as sorption refrigeration, ejector refrigeration, air cycle refrigeration, trigeneration, Stirling cycle refrigeration, thermoelectric refrigeration, thermoacoustic refrigeration, and magnetic refrigeration system [26]. However, the deployment of new refrigerants and refrigeration technologies are restricted by the size of fishing boats and increasing fuels (or electricity) prices. In addition, conventional refrigeration systems consume mainly electricity and large amount of carbon dioxide were emitted during electricity generation process. Current research efforts are now being focused on the deployment of the hybrid system, which use a combination of waste-heat, solar energy, electricity along with innovative control strategies to reduce environmental problems, optimize the energy efficiency, and enhance overall coefficient of performance (COP) [23,27]. Recently, sorption system (i.e., thermal) and conventional vapor compression system (i.e., electricity) have been studied on system operational functionality. The results indicated that system was running normally and had 6 kW cooling production [23]. Three proportional integral control methods were applied in cooling system to control fan operation, improve energy efficiency, and reduce power consumption between 49.5% and 67.4% [28]. There is still limited study on the hybrid refrigeration system of solar energy and conventional vapor compression system. Solar energy (or photovoltaic) is one of the cleanest, cost-effective, and most abundant alternative renewable energy sources that exist today. Performance tests of solar-powered refrigerators in different climate zones strongly supports solar energy as a viable energy resource for the refrigeration system [29]. Experimental results showed that the refrigerator can work well in many different climates and regions. Solar-powered refrigeration systems have also been studied in order to determine the different parameters (e.g., time of day, and cooling load) affecting the system performance (e.g., energy consumption and power production on solar panel) [30]. To that end, collecting and utilizing solar energy to provide a portion of power for the hybrid refrigeration systems during the oyster farming processes on the bays and estuaries may play a vital role in reducing fuels and energy consumption from the fishing boats.
Cooling performance was widely used to evaluate the system performance for the multiple systems, include ground source heat pump system [31], steam cooled gas turbine nozzle guide vane [32], and internally cooled liquid desiccant absorbers [27]. These studies confirmed that cooling performance is critical and necessary to evaluate system performance of the hybrid refrigeration system [27,31,32]. A few technical challenges have been also identified during the development of our novel hybrid oyster cooling process. Firstly, it needs to reach a cooling temperature that complied with legal requirements (i.e., 7.2 °C or lower within 10 h) in order to minimize vibrio growth. Secondly, the process must avoid a local rise in temperature within the cooling cabinet to prevent damaging oyster freshness and taste. Third, it needs to use solar energy as an alternative energy resource to reduce energy and fuel consumption of refrigeration system from the fishing boats. Thus, cooling time to reach desired storage temperature and temperature distribution were identified as performance factors to resolve these technical challenges in the refrigeration systems. Factorial design is one of the most effective statistical methods to plan and conduct experiments in a systematic way in order to evaluate the effect of operating factors on the response of energy conversion systems [33,34,35]. The objective of this study was to investigate and evaluate the effect of air circulation strategies and operating conditions on cooling performance (e.g., cooling time and temperature distribution) of a lab-scale hybrid oyster refrigeration system during the oyster cooling process using the factorial design method.
2. Materials and Methods
2.1. Conceptual and 3D Design of the Lab-Scale Hybird Oyster Refrigeration System
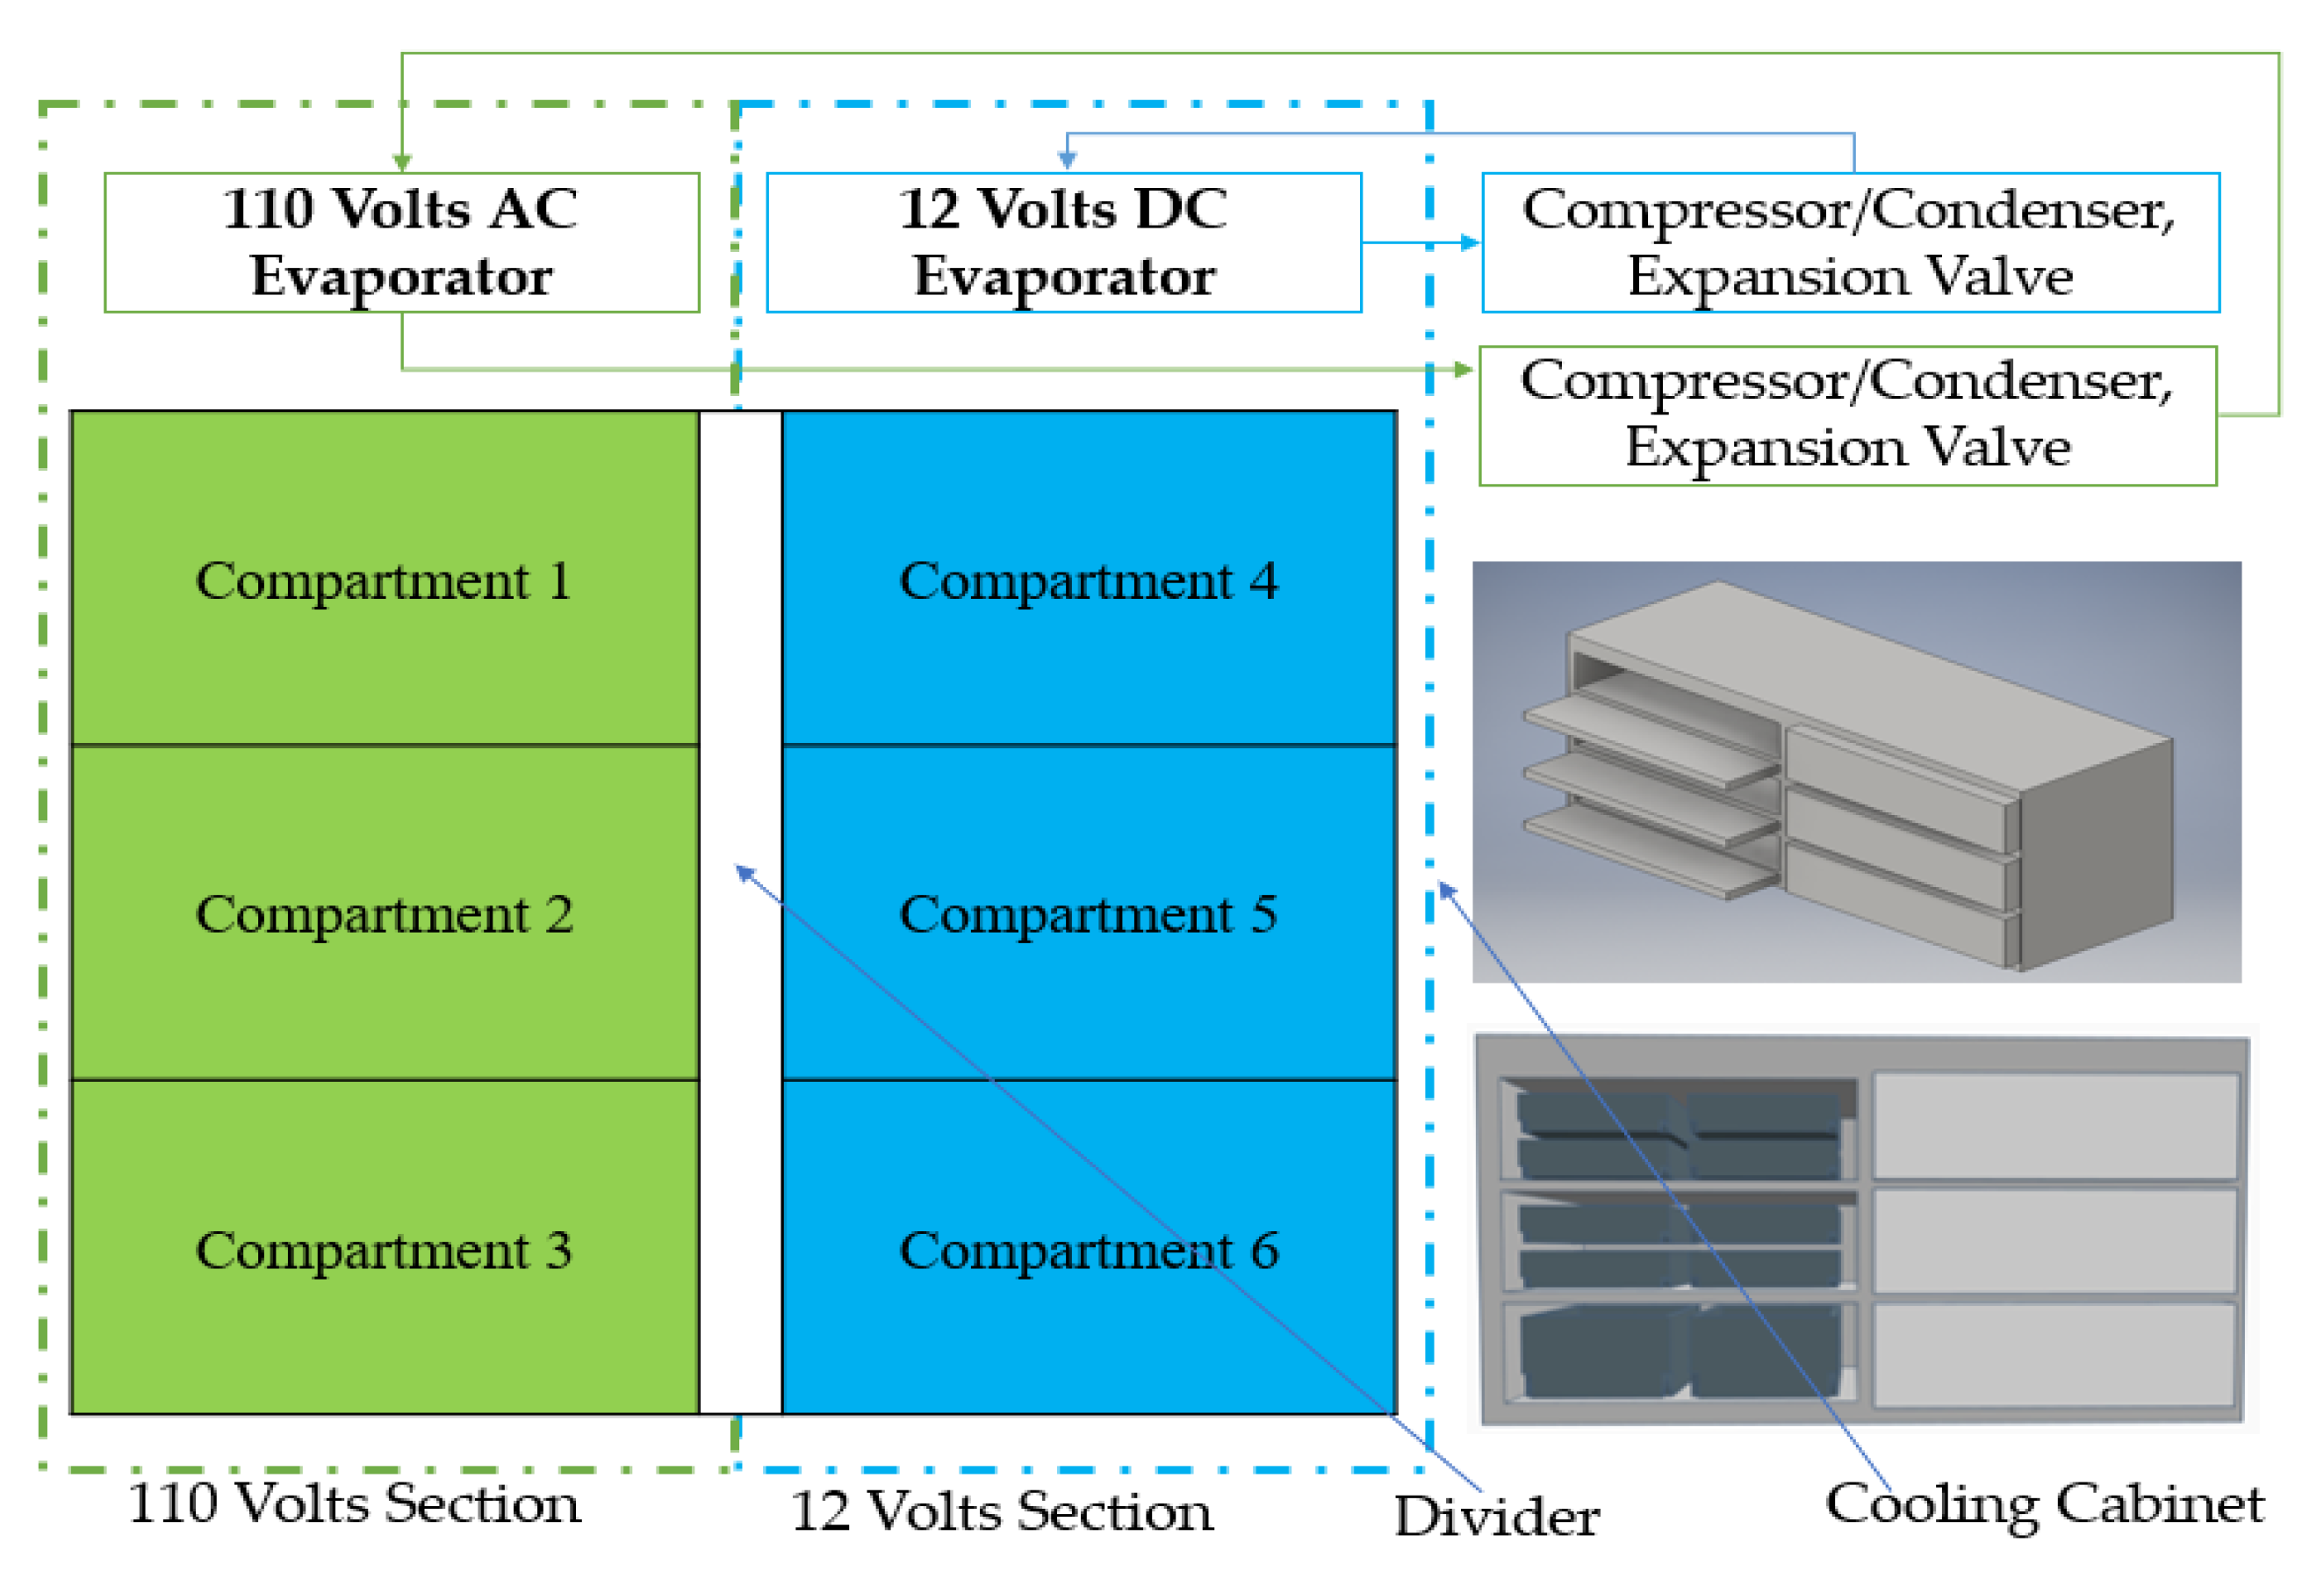
Based on feedback from local oyster farmers, the lab-scale hybrid oyster refrigeration system was designed to carry a total 16 boxes (12 small boxes with 4 large boxes) of raw oysters. As shown in Figure 1, the conceptual design of the lab-scale hybrid oyster refrigeration system compromises of a cooling cabinet, 110 volts AC cooling unit, 12 volts DC cooling unit, and other accessories enable the utilization of both solar and boat energy during various oyster farming processes. Key components of the cooling unit include the evaporator, compressor, condenser, expansion valve, among other connections. The cooling cabinet is composed of six individual compartments (889 mm width × 368.3 mm height × 546.1 mm depth for each compartment), numbered from 1 to 6 across two sections: 110 volts left section (AC Cooling) and 12 volts right section (DC Cooling). Compartments 1–3 belong to the left section and compartments 4–6 belong to the right. A separate door exists for each compartment to allow for oysters to be inserted into one of the compartments with minimal influence on the other compartments, in order to limit heat loss for maintaining the oysters’ freshness. A divider with 50.8 mm thickness was vertically erected in the middle of the cooling box to divide the inner container into two sections and allow for better air circulation. 3-D model of the cooling cabinet along with its 6 insertion doors was generated to visualize and verify compliance with space requirements before the fabrication process.
2.2. Fabrication and Assembly of the Lab-Scale Hybird Oyster Refrigeration System
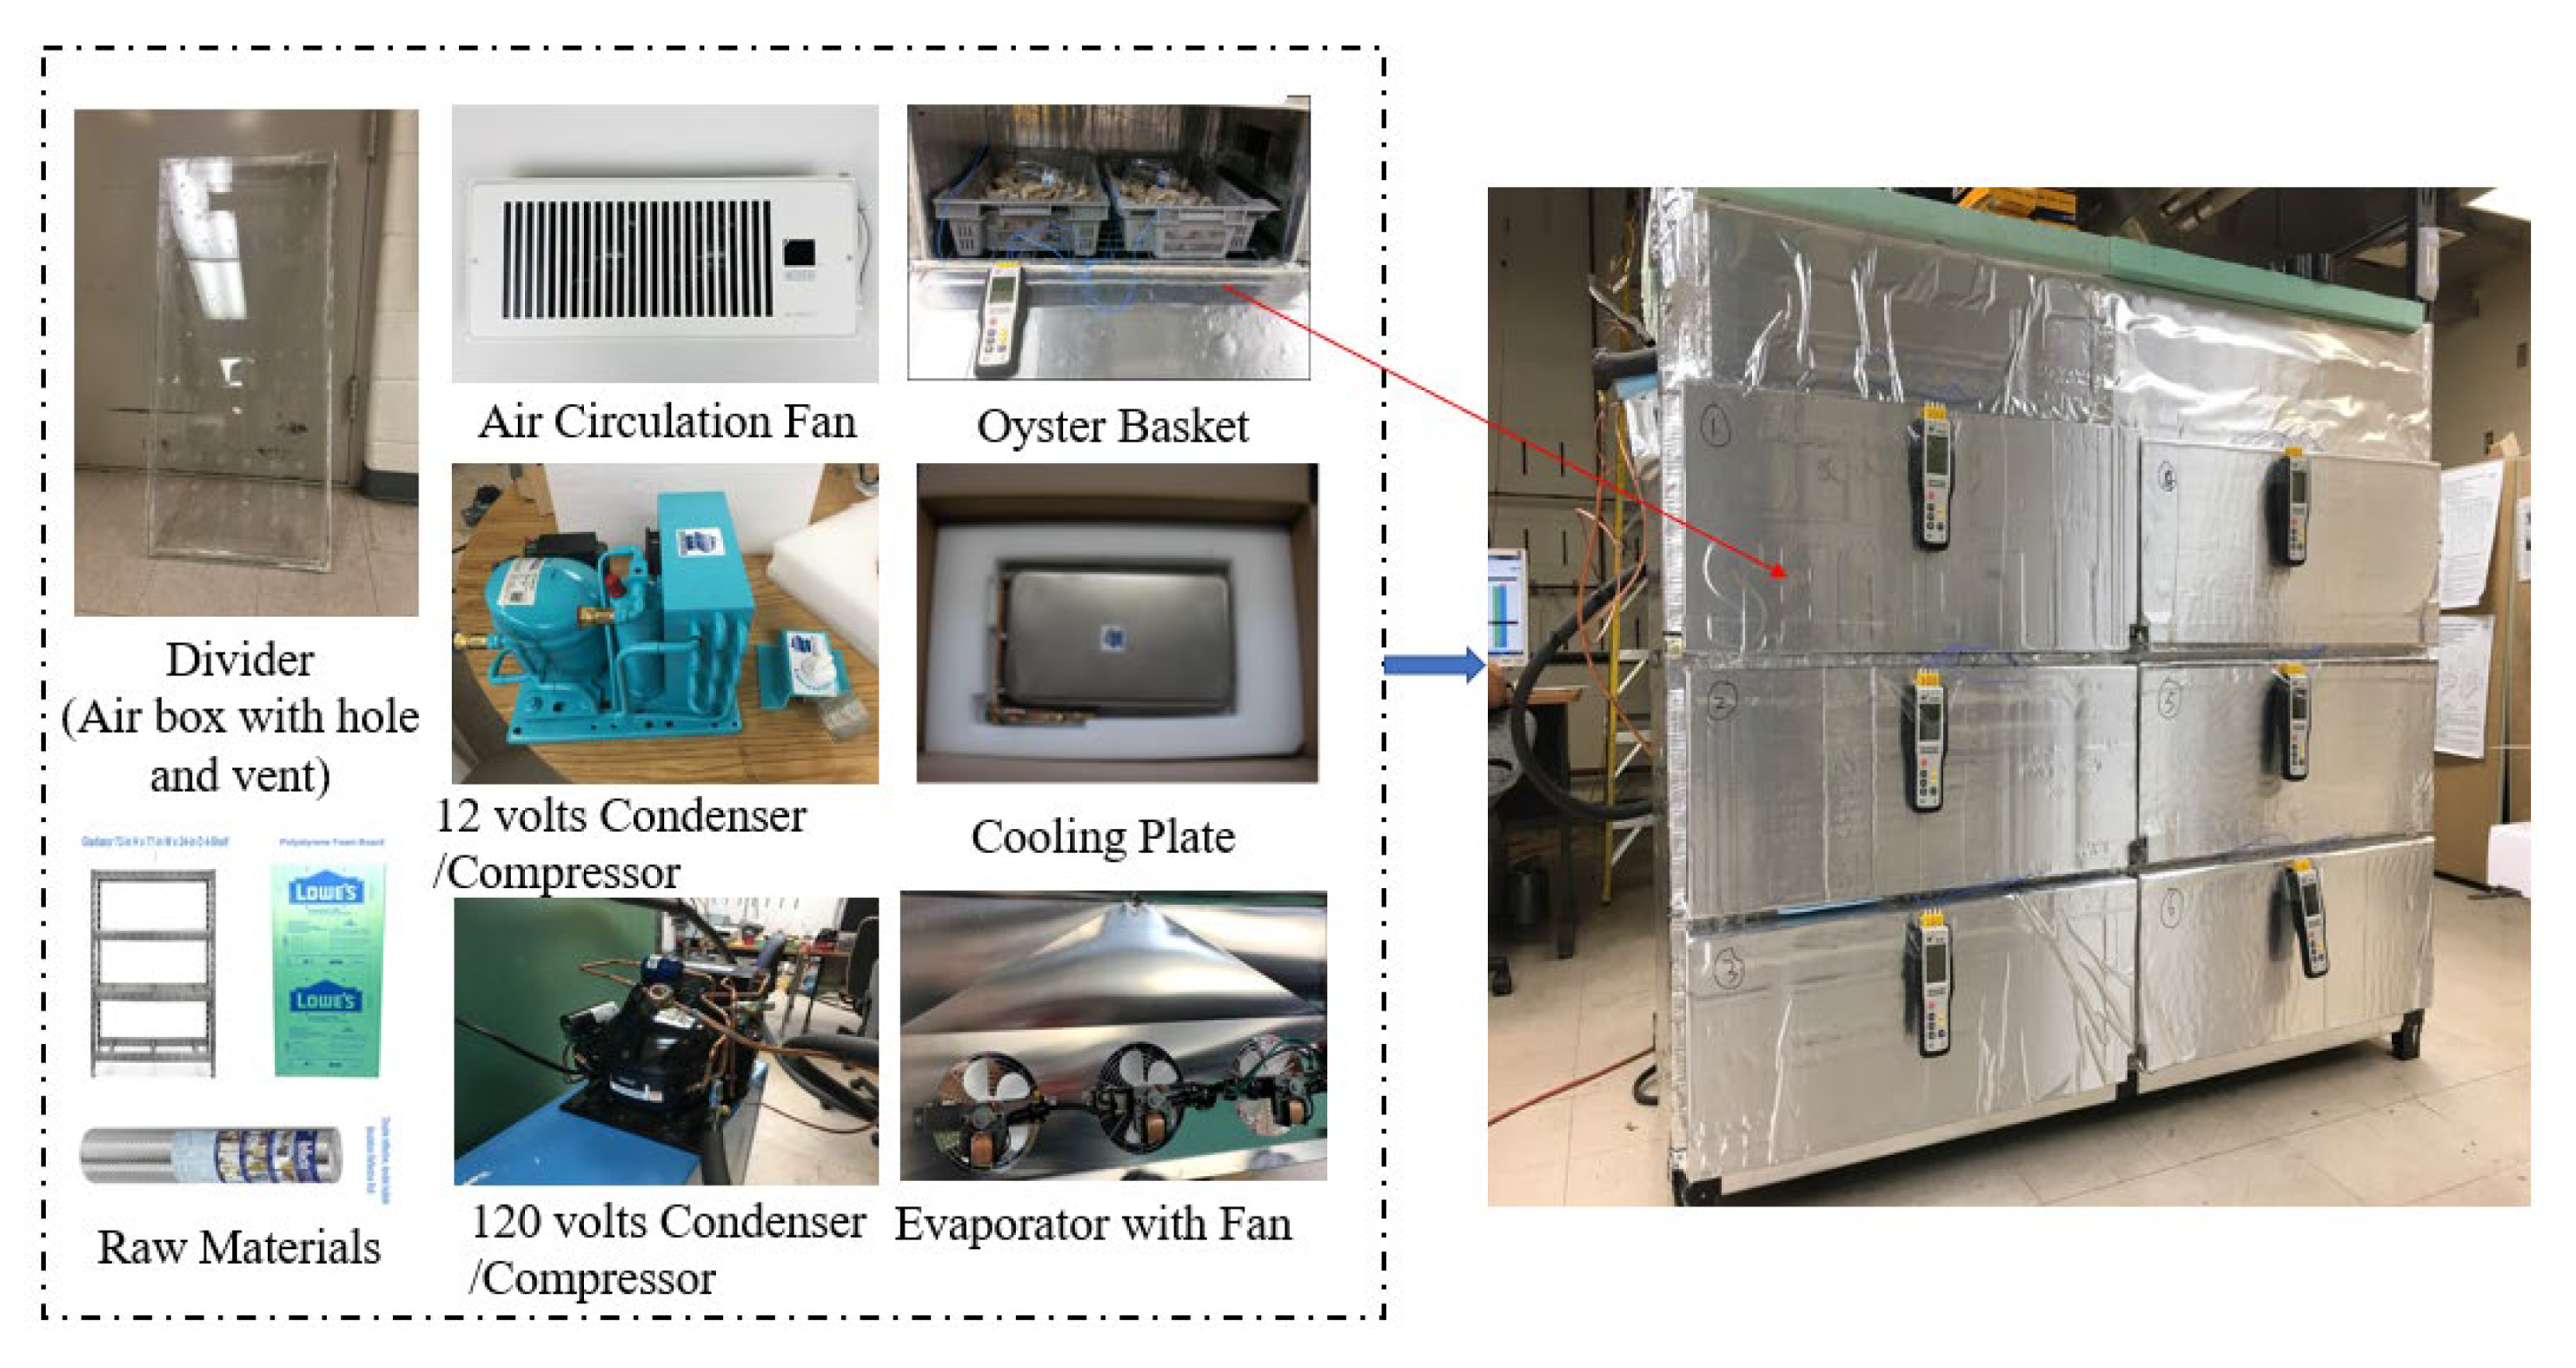
Prototype along with its major components and raw materials of the lab-scale hybrid oyster refrigeration system are shown in Figure 2. Fabrication and assembly of the lab-scale hybrid oyster refrigeration system were performed by laboratory staff in the Center for Advanced Energy Systems and Environmental Control Technologies (CAESECT) at Morgan State University. The frame of the refrigeration system was built and modified from a heavy-duty steel garage shelving unit (GARS774XEG, Gladiator, Belton Harbor, MI, USA) with weight capacity of 907.18 kg in order to carry the required amount of oysters (about 100–110 kg) within a safe structure. The exterior walls of the refrigeration system were cut from unfaced polystyrene insulation foam boards (Item #338136, Kingspan Insulation, Atlanta, GA, USA). The double-sided bubble reflective insulation rolls (Item #2541504, Reflectix, Markleville, IN, USA) were added to the inner parts of insulation foam board. The combination of these two insulation materials offered the higher R value to slow the rate of heat transfer between the refrigerator and the outside environment during the cooling process. The lab-scale hybrid oyster refrigeration system was then integrated with two cooling units, AC cooling unit and DC cooling unit. The AC system consisted of the condensing/compressor unit (M6JM-H023-IAA-177, Emerson, St. Louis, MO, USA) and evaporator unit with fan (KMK230, KeepRite Refrigeration, Brantford, ON, Canada) to ensure a cooling capacity of 697.5 watts and energy efficiency ratio of 5.5, equivalent to the COP of 6.37. The 12 volts system (CoolBlue, Technautics, Escondido, CA, USA) consists of variable speeds compressor/condenser and evaporator unit (or cooling plate) to provide autosensing and various cooling capacities under different voltage settings/inner environments. Both evaporator units were installed on the top of the cooling cabinet. The DC unit was attached to the 12 volts battery and charger on the wall outlet while the AC unit was directly connected to an adjacent wall outlet. This hybrid system also operates two refrigerants (R134a in DC system and R404a in AC system), which have relatively lower pollutions than the chlorofluorocarbons (CFC) refrigerants. Both AC and DC cooling systems have a basic refrigeration cycle.
The new design of rectangular air box had a total of 108 holes along with four vents was served as a divider. The divider was inserted into the middle of the cooling cabinet to provide separation between the two sections. There were 3 levels with 18 holes for each level at one side of air box. The diameter of the hole was 6.35, 12.7, and 19.05 mm for the first, second, and third level, respectively. Two rectangular vents were made initially on each top side of the divider. After initial testing, an additional two vents were added to the bottom side of each divider. The quiet booster fan, operating with an air flow rate of 0.0566 m3/s, was installed to offer forced air circulation. In addition, each section was divided into three compartments by wire decking with 50.8 mm insulation foam. Other accessories, all-purpose sealant, waterproof aluminum roll flashing, and spray foam insulation material were used to connect various components and close small gaps.
2.3. Experimental Setup and Operating Conditions
In order to closely simulate the oyster cooling process within the lab-scale hybrid oyster refrigeration system, oyster shell with equal amount of water were added to simulate the conditions of cultured raw oysters. The water was there to act as a cooling load to replace the missing oyster meat of the shell. The baskets with oyster shells and water were inserted into each compartment. Table 1 displays the weight of shells (in kg) and water (in kg) in each compartment. The total amount of 95.2 kg of oyster shell plus 10 kg of water was placed into the refrigeration system to simulate the approximate weight of a 107.1 kg oyster cooling process. The specific heat of oyster and water was assumed to be at 3.52 J/g °C and 4.186 J/g °C, respectively. One digital thermometer (Item #8541957450, Amazon, Seattle, WA, USA) was used to monitor real-time temperature changes in each compartment. Each thermometer had four channels of K-type temperature sensors with an uncertainty of ±2.0 °C (<100 °C) and temperature resolution of 0.1 °C (<1000 °C) that measured temperatures at four different points (i.e., oyster shell surface, middle of oyster shell pack, top layer of oyster shell pack, and 12.7 mm above top layer of oyster shell pack). Average temperature for each compartment was calculated from the observed temperature at each of the four points and recorded every 20 min. System performance, cooling time was set to the desired temperature of 7.2 °C and temperature distribution in the cooling cabinet were evaluated under different operating conditions. Three different scenarios of air circulation—no air circulation, natural air circulation, and combined forced and natural air circulation—were tested to study the temperature distribution.
Factorial design methods with statistical analysis were used to further determine whether the system cooling performance was meaningfully affected by operating conditions. Factorial design consists one or more independent variables or factors, each with discrete possible values or levels to investigate the effect of multiple factors on a dependent variable or response [33]. Characterization experiment using the one factor-at-a-time (OFAT) strategy were conducted first, followed by two operating factors that were selected based on preliminary results [33,34]. Fan location was factor A, with the high level denoting the fan mounted at the upper part of the cooling cabinet and the low level denoting the fan mounted at the lower part of the cooling cabinet. Fan direction was factor B, with the high level denoting the fan circulating air from AC section to the DC section. Factor B’s low level was the fan circulating air from DC section to AC section. Two levels for each factor, a 22 factorial design, was used to analyze and optimize the performance of the refrigeration system. Standard deviation of compartment temperatures after 4 h cooling process was used as first response variable. Cooling time for average oyster temperature to be cooled down to 7.2 °C were determined as the second response variable. Experiments were performed randomly, and each experiment has two replicates with a total of 8 runs. All statistical analyses were performed using the software package Minitab (version 17, Minitab, LLC., State College, PA, US, 2014). Statistical significance was set at 5%. In this study, cooling performance analysis is the process of analyzing temperature distribution, standard deviation, and required cooling time.
3. Results and Discussion
3.1. Effects of Air Circulation on Cooling Performance
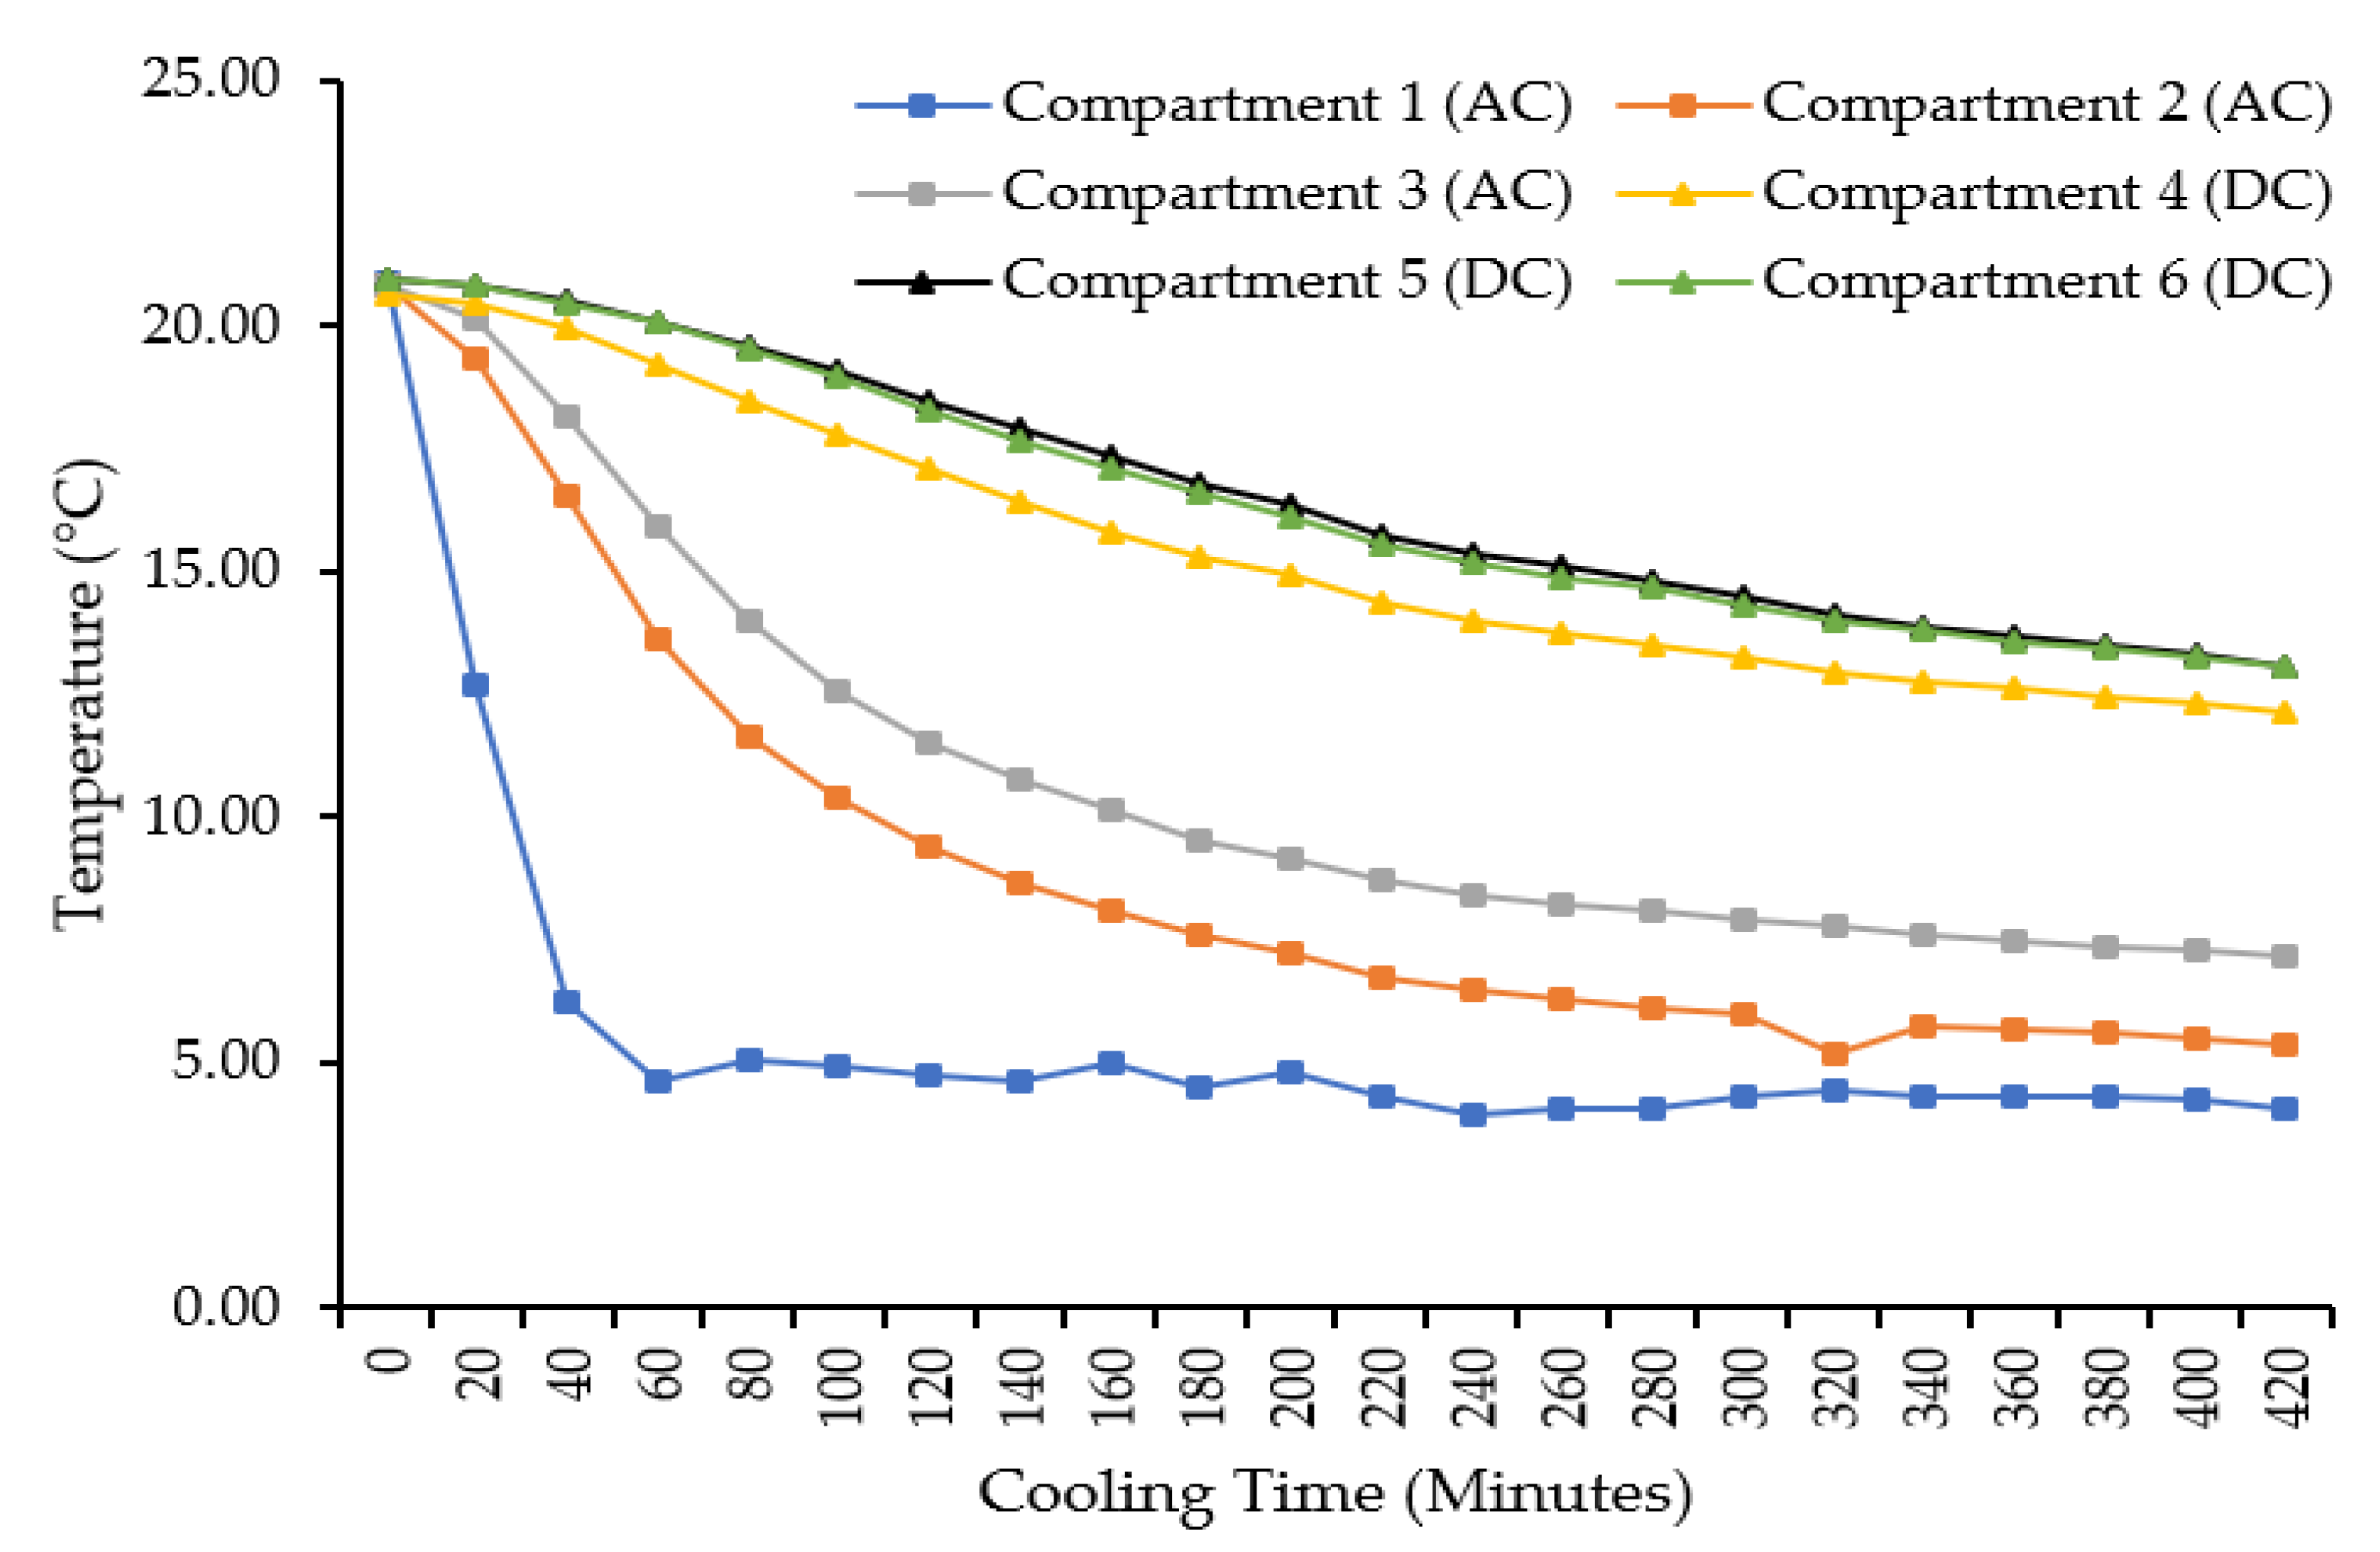
In order to investigate the effects of air circulation on the performance of the lab-scale hybrid oyster refrigeration system, three different scenarios were compared. In the first scenario, vents and holes on each divider were closed. Figure 3 summarizes the temperature changes in individual compartments based on the cooling time. After 420 min of cooling, the temperature in each compartment dropped from 20.9 ± 2.0 °C to 4.1 ± 2.0 °C for compartment 1, from 20.8 ± 2.0 °C to 5.4 ± 2.0 °C for compartment 2, from 20.8 ± 2.0 °C to 7.2 ± 2.0 °C for compartment 3, from 20.6 ± 2.0 °C to 12.2 ± 2.0 °C for compartment 4, from 20.9 ± 2.0 °C to 13.1 ± 2.0 °C for compartment 5, and from 21.0 ± 2.0 °C to 13.0 ± 2.0 °C for compartment 6. Temperature stratification was also observed, with the lowest temperatures measured at compartment 1 and the highest temperature at compartment 6 with a temperature difference of 8.9 ± 2.0 °C. Results indicated that temperatures in the DC sections were lower than the AC sections. Temperature difference between the maximum and the minimum compartment temperature in the AC section was 3.1 ± 2.0 °C which was higher than the DC section at 0.8 ± 2.0 °C. One possible reason for this observation is the large cooling capacity of the AC section leading to a higher temperature variance compared to the DC section with relatively lower cooling capacity. Results suggest that the AC cooling unit was appropriate to fulfill the cooling time requirement while DC cooling unit was able to maintain cooling temperature with minimum temperature deviation. To achieve lower temperature variances between compartments, toward uniform temperature distribution, results indicate the need for air circulation in the cooling cabinet.
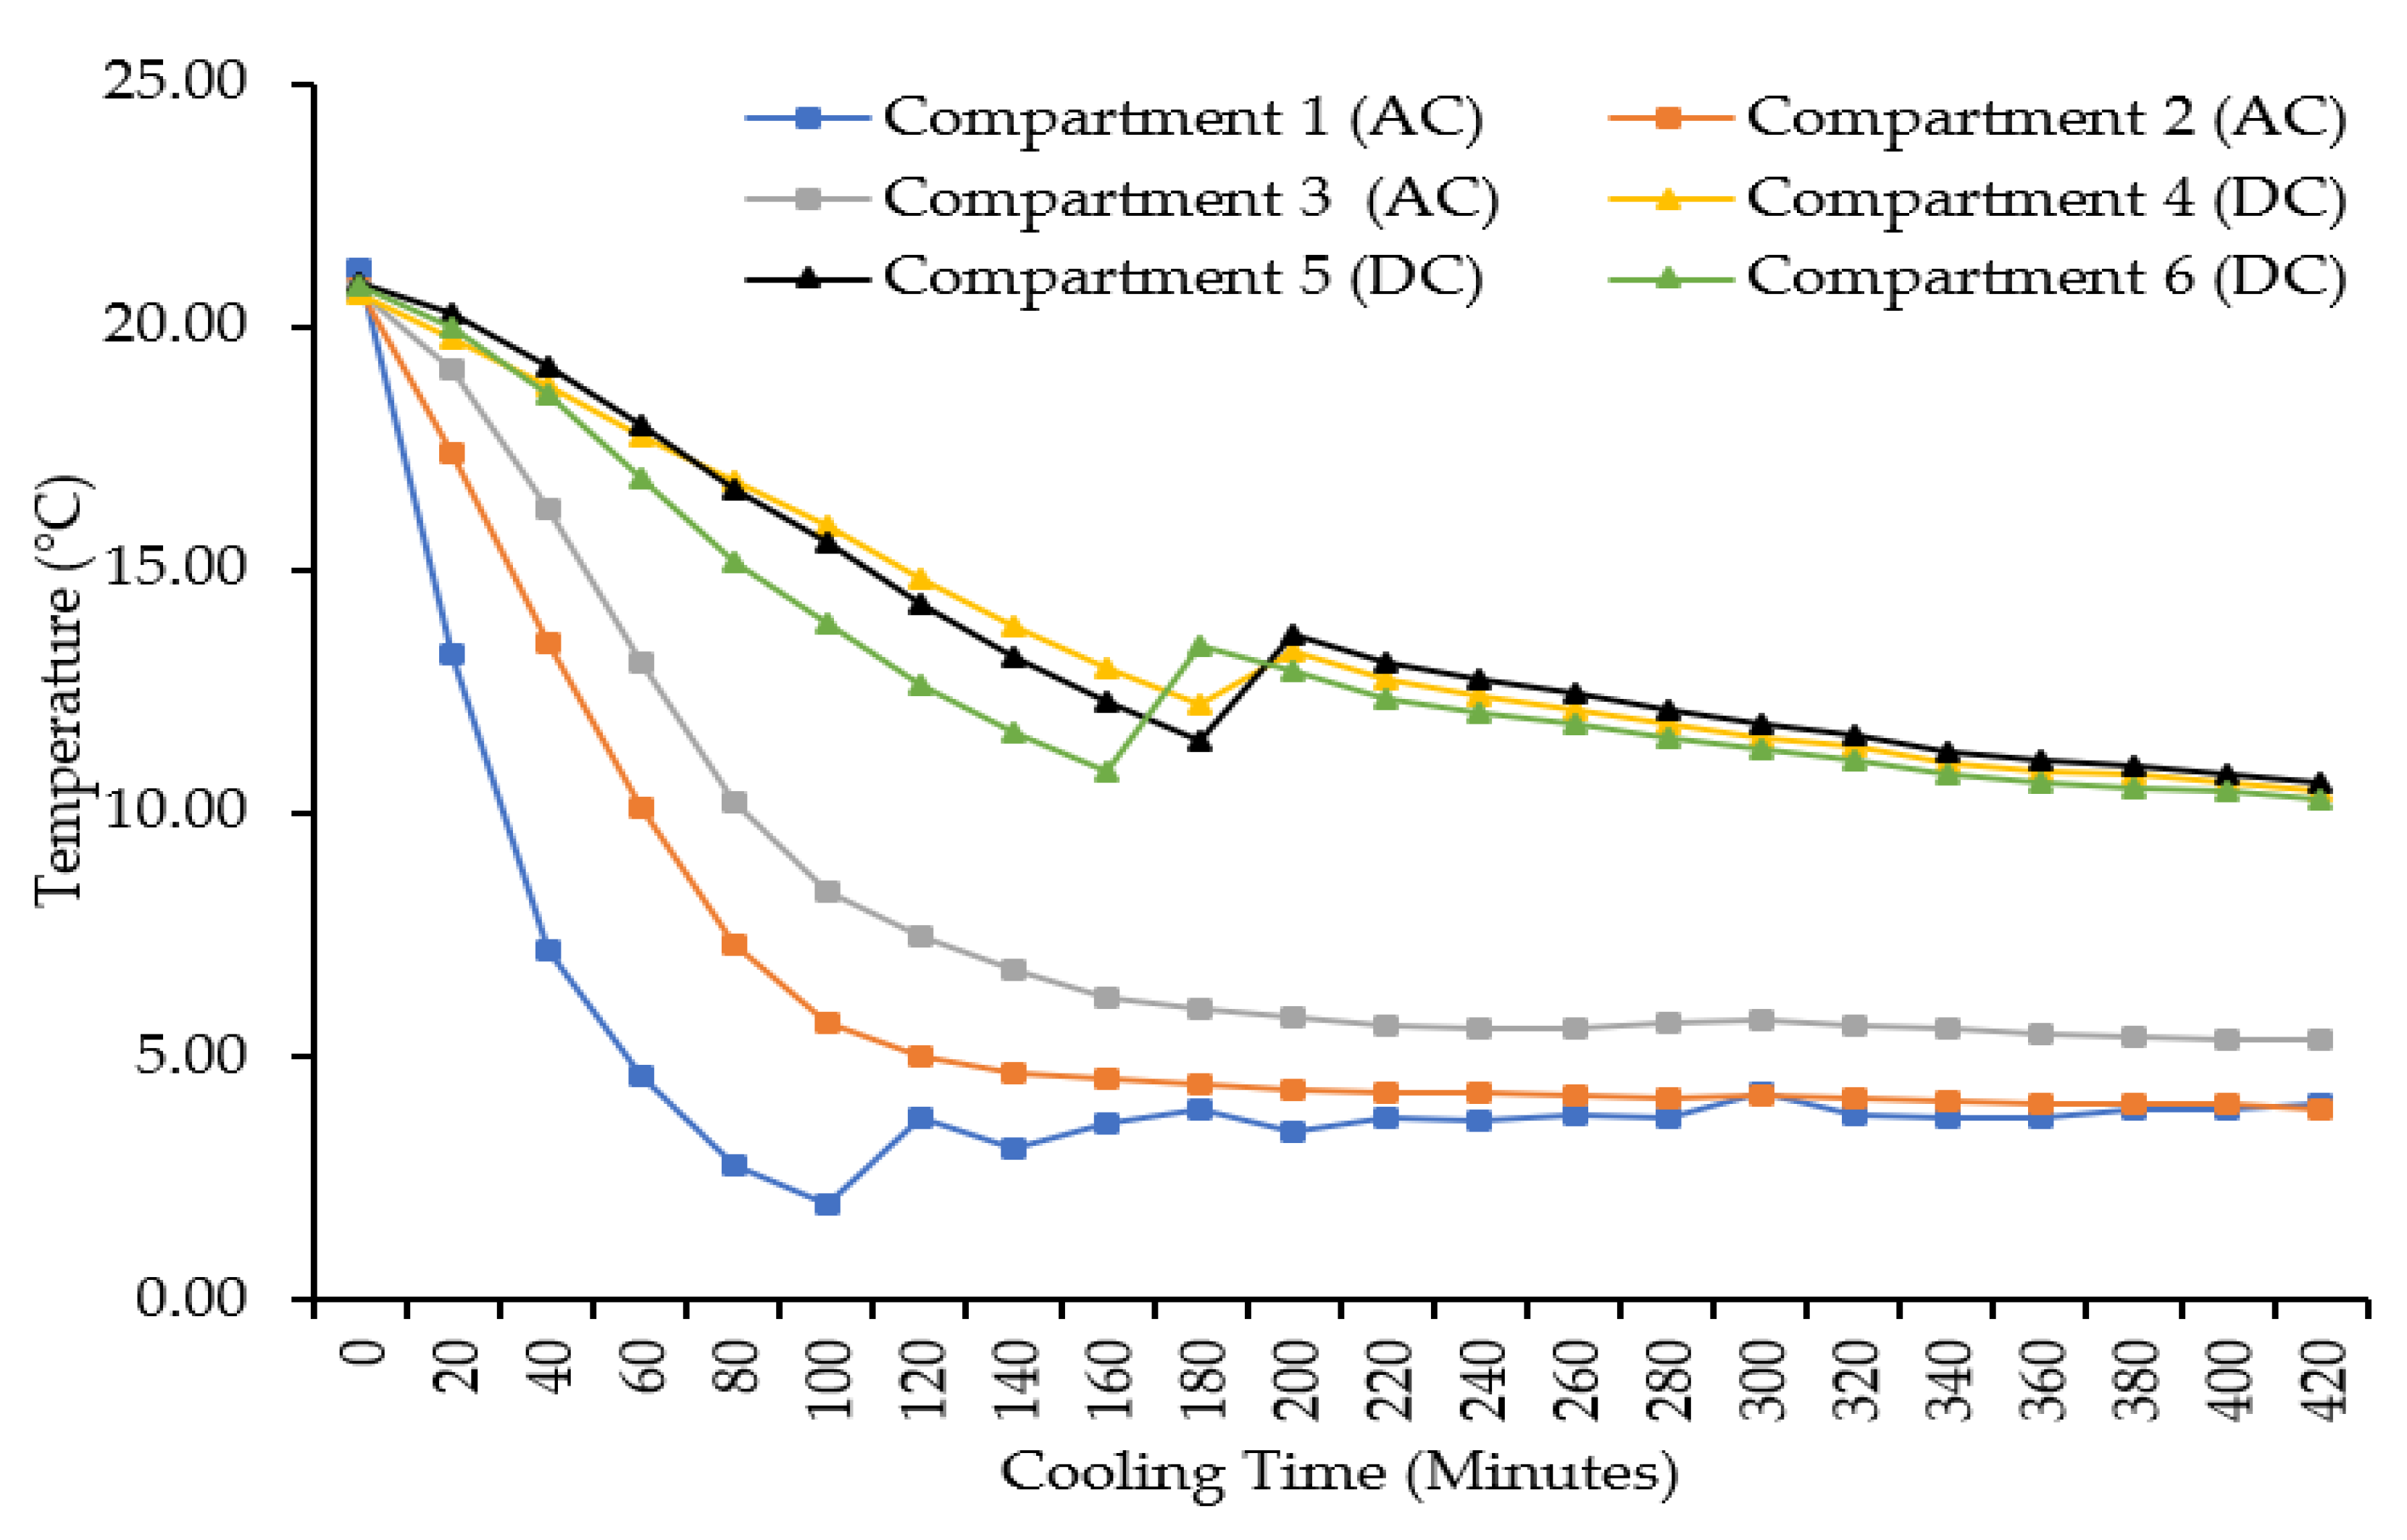
In the study’s second scenario, vents and holes on the divider were both opened to initiate natural convection for air circulation between the AC and DC sections. Figure 4 summarizes the temperature changes in an individual compartment based on cooling time. After a 420 min of cooling, the temperature had changed from 21.2 ± 2.0 °C to 4.0 ± 2.0 °C for compartment 1, from 20.8 ± 2.0 °C to 3.9 ± 2.0 °C for compartment 2, from 20.8 ± 2.0 °C to 5.4 ± 2.0 °C for compartment 3, from 20.7 ± 2.0 °C to 10.5 ± 2.0 °C for compartment 4, from 20.9 ± 2.0 °C to 10.6 ± 2.0 °C for compartment 5, and from 20.8 ± 2.0 °C to 10.3 ± 2.0 °C for compartment 6. The maximum temperature difference was found between compartment 2 and 5 (at about 6.7 °C) and was reduced from 8.9 ± 2.0 °C (between compartment 1 and 6) to 6.7 ± 2.0 °C, compared to the previous scenario. With similar initial temperature and cooling times of 420 min, individual compartment temperatures were lower than the first scenario because vents and holes on the divider assisted with producing natural air convection with density variation and laminar flow, effectively collecting hot air from the DC side while transferring heat into the refrigerant through the evaporator of AC cooling unit [14]. Wang et al. [15] investigated the effects of a perforated plate as a divider between the refrigeration room and storage compartment. Experimental results indicated a clear decrease in temperature gradient for the refrigeration room. Partial cooled air from refrigeration room passed through the upper perforated plate into storage compartment to ensure uniform mixing [15]. These findings suggest that our study’s new design of divider with holes and vent has a potential to provide natural convection and improve uniform temperature distribution. In addition, minor temperature increments in the cooling cabinet were observed at 160 and 200 min because the door had to be opened to check on the temperature sensors, consequentially brought partial warm air from the outside environment into the cooling cabinet. It also suggests that just by opening the single door of a traditional refrigeration system to insert each oyster basket is enough to affect the whole refrigeration system. Thus, with a multi-compartment design, each with its own individual door, can reduce energy consumption and maintain freshness of oysters.
In the third scenario, vents and holes on the divider were both opened to provide natural air convection and air circulation with the addition of a fan to supply forced air convection. Figure 5 shows the temperature changes in the individual compartment based on cooling time. This test was only performed for 280 min because the lowest temperature was reached at 3.3 ± 2.0 °C. Any additional cooling may reduce temperature and ultimately kill oysters. Temperatures were observed to have dropped from 17.9 ± 2.0 °C to 3.3 ± 2.0 °C, from 17.1 ± 2.0 °C to 6.6 ± 2.0 °C, from 17.2 ± 2.0 °C to 8.1 ± 2.0 °C, from 18.0 ± 2.0 °C to 4.5 ± 2.0 °C, from 18.2 ± 2.0 °C to 5.7 ± 2.0 °C, and from 17.6 ± 2.0 °C to 7.5 ± 2.0 °C for compartment 1, 2, 3, 4, 5, and 6, respectively. The maximum temperature difference was found between compartment 1 and 3 (about 4.8 ± 2.0 °C), which is a substantial decrease compared to previous scenarios. Individual compartment temperatures were also lower compared to previous two scenarios. Wang et al. [15] found that cooled air flowed from the refrigeration room into the storage room by addition of circulation fan, which assisted to achieve uniform temperature distribution. These results were in accordance with findings from Fukuyo [19]. Thus, forced air convection from adding a circulation fan, thereby reducing temperature variance in the refrigerator. Compared with previous two scenarios, cooling time was reduced to 280 min, saving 140 min because of forced air circulation generated by a fan installed in the lower cooling capacity side (i.e., DC section) in order to remove hot air from the DC section to AC section. The DC cooling unit has lower cooling capacity to dissipate large amounts of heat in hot air. Thus, partial heat from the hot air in DC section was rejected more effectively through higher cooling rates in AC section. Moreover, we found that the coldest region (compartment 1) reached its coldest temperature of 4.60 °C at 60 min, 1.94 °C at 100 min, and 2.06 °C at 180 min cooling process for the scenarios 1, 2, and 3, respectively. This demonstrates the fact that caught oysters would be shocked if they were suddenly transferred from the sea environment (at normal sea water temperature, about 21 °C) into scenarios with lower temperature (i.e., 5 °C or less). Thus, we added an air circulation fan with opened vents and holes on the divider to reach recommended storage temperature (i.e., 10 °C) within the acceptable cooling time, while maintain a low rate of temperature reduction and avoid shock for the contained oysters.
3.2. Effect of Operating Conditions on Cooling Performance
In order to further investigate the effect of air circulation fan location and direction on cooling performance, the 22 factorial design method and analysis of variance (ANOVA) tests were used. As shown in Table 2, standard deviation of temperatures among the six compartments ranges from 1.46 °C to 2.67 °C after 4 h cooling process within the lab-scale hybrid oyster refrigeration system. As shown in Table 3, ANOVA results indicate that there was a significant interaction between the two-way interaction of selected factors and standard deviation of the compartment temperatures because the p-value of two-way interactions was 0.007, which was much lower than the significant level of 0.05. On the contrary, separate effects of the fan location and fan direction on temperature variance were not significant due to higher p-values (>0.05).
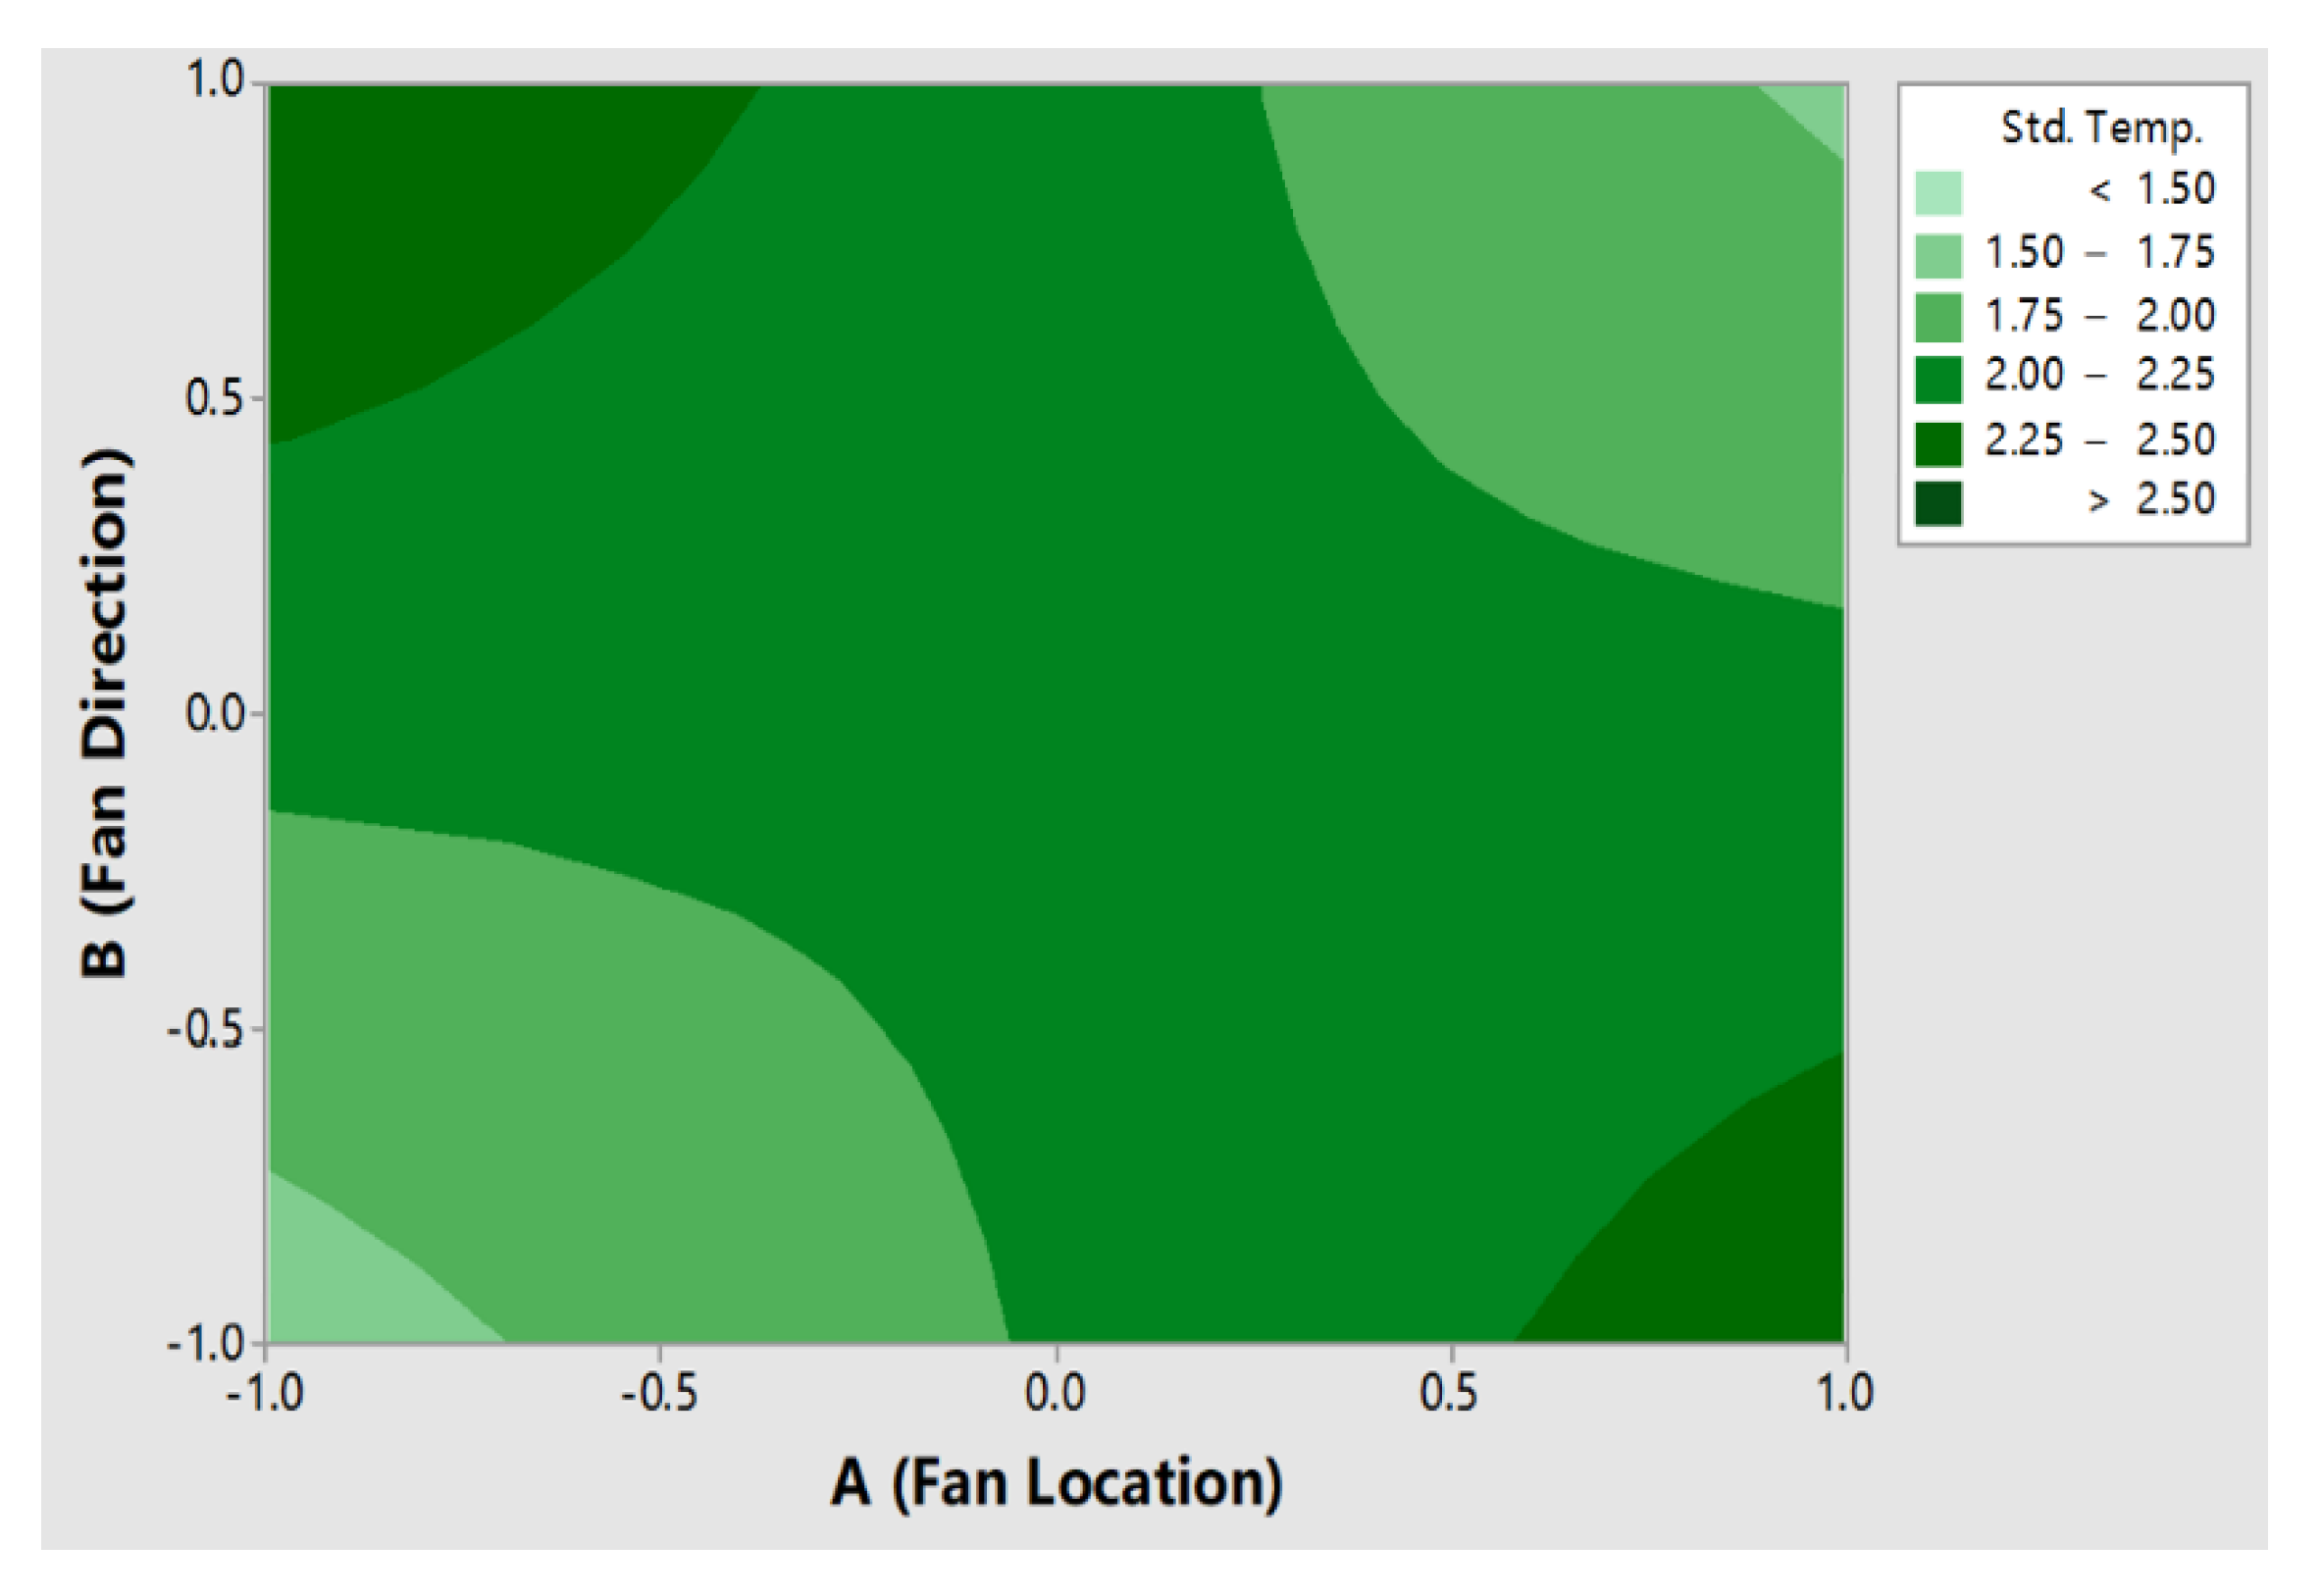
As shown in Figure 6, the contour plot of this model suggests that the response C7 (standard deviation of compartment temperatures) was in the smallest range of 1.50 °C to 2.00 °C when A and B factors were at the low levels. This may explain for the installation of fan on the bottom of cooling unit (factor A at low level), which provided air from DC section to AC section (factor B at low level). This resulted in the lowest temperature deviation and achieved uniform temperature distribution in the lab-scale hybrid oyster refrigeration system. It can then be postulated that the DC section had a relatively lower cooling capacity, resulting in being the hottest regions during the cooling process. Thus, additional fan was required to effectively remove and circulate the hot air from DC section to the AC section. High amounts of heat in the hot air was then rejected by higher cooling capacity of AC cooling unit.
Table 4 summarizes the cooling time needed to reach the suggested oyster temperatures of 7.2 °C under different fan locations and direction. An average of 130 min was required to meet cooling time requirement (i.e., 10 h or less). Cooling time was further reduced to 110 min by installation of a fan on the top location and providing air from AC section to DC section, but the temperature deviation was still high (about 1.71 °C). By contrast, the installation of a fan on the bottom of the DC section provided circulating air from 12 volts to 110 volts with a slightly longer cooling time (about 150 min) compared to other cases. Nevertheless, we found the temperature deviation to be at its lowest, thereby achieving relatively uniform temperature distribution. These results support the idea that the cooling time to achieve the desired temperature and temperature variance among compartments have a strong relationship. Therefore, a fan was installed on the bottom of the DC section to provide air circulation from 12 volts to 110 volts and provide similar temperature environment with minimal temperature variance for the caught oysters. A slight increase in the cooling time was acceptable and remained in compliance with the regulations (i.e., 10 h or less). From the ANOVA test results of cooling time, p-value was 0.473, 0.378, and 0.584 for the fan location, fan direction and two-way interaction, respectively. p-value of main factors and two-way interactions were both greater than 0.05 and thus there was no significant effect between chosen factors and cooling time.
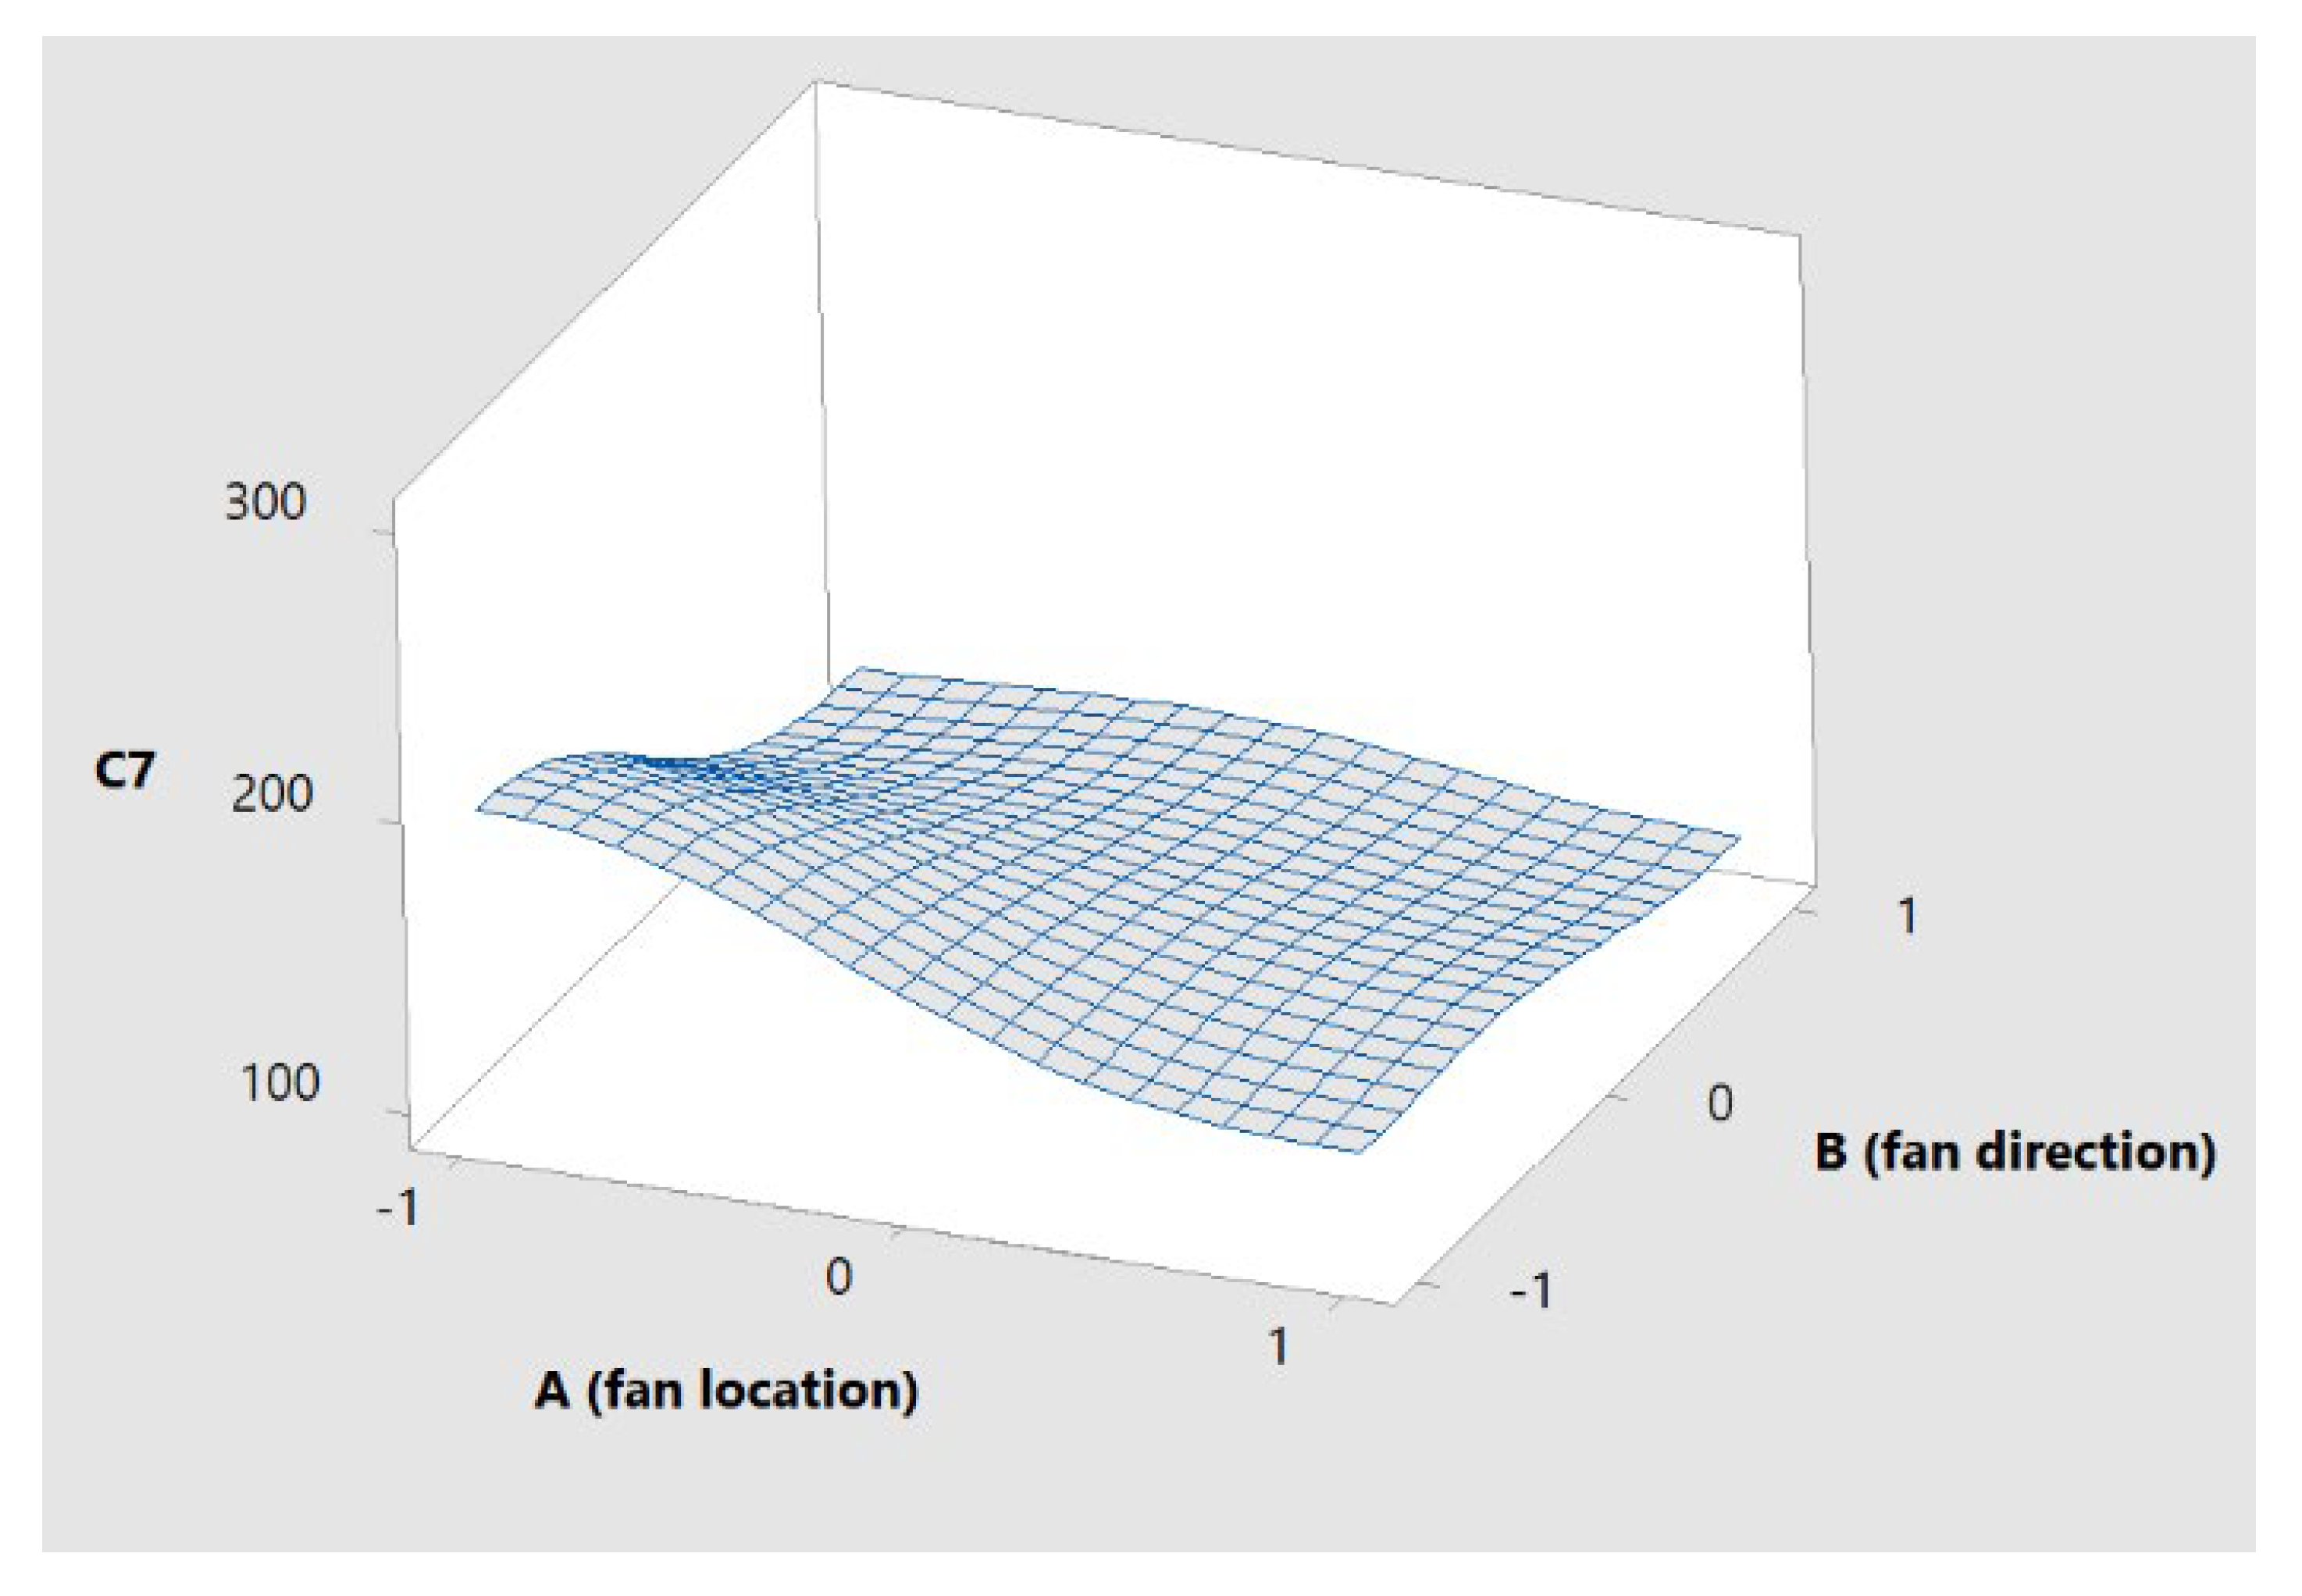
As shown in Figure 7, C7 indicated the cooling time under various fan location and direction. The surface plot tends to be flat, confirming that the fan direction and fan location did not have significant effect on the cooling time. It is possible that cooling time was more dependent on the cooling capacity of evaporator and compressor. However, it was found that location of fan and direction of fan affected the temperature distribution of cooling system. Thus, temperature distribution in the cooling system under other operating conditions (e.g., cooling load and pre-cooling) should be further investigated and analyzed to provide a similar cooling environment for the oysters and improve the cooling performance of designed refrigeration systems.
4. Conclusions
A refrigeration system is critical to maintain freshness and to avoid vibrio bacteria growth for cultured oysters before raw consumption. However, the deployment of new refrigerants and refrigeration technologies in the conventional refrigeration systems are limited by the power capacity of fishing boats and increasing fuels (or electricity) prices. Previous studies focused on the hybrid refrigeration system, which used the waste-to-heat and electricity as energy resources during the cooling process. In this study, the innovative lab-scale hybrid oyster refrigeration system integrated the 12 volts DC and 110 volts AC cooling units with a specially designed divider and air circulation strategies to achieve uniform temperature distribution and satisfy regulations during the oyster cooling process. This refrigeration system was developed to use electricity for the AC cooling unit while solar energy will be used for the DC cooling unit during the oyster farming process (e.g., harvesting, storage, and transporting). Within three different air circulation strategies, the lowest temperature difference was observed to be 4.8 ± 2.0 °C when vents and holes on the specially designed divider were both opened to provide natural air convection while air circulation fan supplied forced air convection. Statistical analysis of fan location and direction showed no significance for the cooling time but had a significant effect on the variance of the compartment temperatures. The optimal condition was found to be circulation fan at the lower level of the DC section and air supply from the DC section to the AC section to control air flow, reduce temperature variation, and provide uniform temperature distribution among the six individual compartments. Results also indicated that the refrigeration system can achieve the cooling temperature of 7.2 °C with a standard deviation of 1.5 °C within 150 min of cooling to meet ideal storage temperatures as required by regulations (i.e., 10 h or less). This study showed that the importance of air flow on temperature distribution and the possibility of using solar energy in the DC cooling system of the hybrid refrigeration system. Results and findings from this study can be used to develop the hybrid oyster refrigeration system and maintain freshness of cultivated raw molluscan shellfish (i.e., oysters), particularly from the Bay areas, where solar energy is abundant. Temperature data can be further used to calculate heat load, coefficient of performance (COP), and heat transfer. In future field tests, solar panels along with a controller will be used to provide DC power to the DC cooling unit in order to demonstrate the feasibility of solar energy utilization as an alternative energy resource for raw oysters cooling in fishing boats.
Author Contributions
S.W.L. and X.Q. coordinated projects and received grants from as PIs of the Project from the Office of Technology Transfer at Morgan State University. X.Q. and Y.Y. conducted the literature reviews and found the research gaps. X.Q., Y.Y., M.J.L.C., and O.S.A. fabricated the lab-scale hybrid oyster refrigeration system. X.Q., Y.Y., M.J.L.C., and O.S.A. conceived and designed the approach to set up the testing facility and collected results. Y.Y. and X.Q. analyzed experimental results in this study. X.Q., Y.Y., and S.W.L. wrote the draft manuscript. S.W.L. reviewed and provided his constructive comments and suggestions to improve the quality of the manuscript. All authors have read and agreed to the published version of the manuscript.
Funding
This research was funded by the Office of Technology Transfer at Morgan State University and the APC was partially funded by the School of Graduate Studies at Morgan State University.
Acknowledgments
The authors would like to acknowledge the Office of Technology Transfer at Morgan State University for providing sponsorship and financial support to conduct this research. In addition, authors would like to appreciate the kind support of the research staff and facilities from the Center for Advanced Energy Systems and Environmental Control Technologies (CAESECT).
Conflicts of Interest
The authors declare no conflict of interest.
References
- Turner, J.S.; Kellogg, M.L.; Massey, G.M.; Friedrichs, C.T. Minimal effects of oyster aquaculture on local water quality: Examples from southern Chesapeake Bay. PLoS ONE 2019, 14, e0224768. [Google Scholar] [CrossRef] [PubMed] [Green Version]
- Baker, G.L. Food safety impacts from post-harvest processing procedures of molluscan shellfish. Foods 2016, 5, 29. [Google Scholar] [CrossRef] [PubMed] [Green Version]
- Dungan, C.F.; Carnegie, R.B.; Hill, K.M.; McCollough, C.B.; Laramore, S.E.; Kelly, C.J.; Scarpa, J. Diseases of oysters Crassostrea ariakensis and C. virginica reared in ambient waters from the Choptank River, Maryland and the Indian River Lagoon, Florida. Dis. Aquat. Organ. 2012, 101, 173–183. [Google Scholar] [CrossRef] [Green Version]
- Rothschild, B.J.; Ault, J.S.; Goulletquer, P.; Heral, M. Decline of the Chesapeake Bay oyster population: A century of habitat destruction and overfishing. Mar. Ecol. Prog. Ser. 1994, 111, 29–39. [Google Scholar] [CrossRef]
- Van Senten, J.; Engle, C.; Parker, M.; Webster, D. Analysis of the Economic Benefits of the Maryland Shellfish Aquaculture Industry. Final Project Report, 31 December 2019. Available online: https://www.cbf.org/document-library/non-cbf-documents/analysis-of-the-economic-benefits-of-the-maryland-shellfish-aquaculture-industry-full-report.pdf (accessed on 7 April 2020).
- Hudson, K. Virginia Shellfish Aquaculture Situation and Outlook Report. Results of the 2017 Virginia Shellfish Aquaculture Crop Reporting Survey. VIMS Marine Resources Report No 2018–9. Available online: www.vims.edu/map/aquaculture (accessed on 3 May 2020).
- Aaraas, R.; Hernar, I.J.; Vorre, A.; Bergslien, H.; Lunestad, B.T.; Skeie, S.; Mortensen, S. Sensory, histological, and bacteriological changes in flat oysters, ostrea edulis L., during different storage conditions. J. Food Sci. 2004, 69, S205–S210. [Google Scholar] [CrossRef]
- Mudoh, M.; Parveen, S.; Schwarz, J.; Rippen, T.; Chaudhuri, A. The effects of storage temperature on the growth of Vibrio parahaemolyticus and organoleptic properties in oysters. Front. Public Health 2014, 2, 45. [Google Scholar] [CrossRef] [Green Version]
- Love, D.C.; Lane, R.M.; Davis, B.J.; Clancy, K.; Fry, J.P.; Harding, J.; Hudson, B. Performance of cold chains for Chesapeake Bay farmed oysters and modeled growth of Vibrio parahaemolyticus. J. Food Prot. 2019, 82, 168–178. [Google Scholar] [CrossRef]
- Muth, M.K.; Viator, C.L.; Karns, S.A.; Cajka, J.C.; O’Neil, M. Analysis of the costs and economic feasibility of requiring postharvest processing for raw oysters. Compr. Rev. Food Sci. Food Saf. 2013, 12, 652–661. [Google Scholar] [CrossRef]
- Jones, J.L.; Lydon, K.A.; Kinsey, T.P.; Friedman, B.; Curtis, M.; Schuster, R.; Bowers, J.C. Effects of ambient exposure, refrigeration, and icing on Vibrio vulnificus and Vibrio parahaemolyticus abundances in oysters. Int. J. Food Microbiol. 2017, 253, 54–58. [Google Scholar] [CrossRef] [PubMed]
- FDA/ISSC. National Shellfish Sanitation Program (NSSP) Guide for the Control of Molluscan Shellfish: 2015 Revision. Available online: https://www.fda.gov/food/federalstate-food-programs/national-shellfish-sanitation-program-nssp (accessed on 5 May 2020).
- Cook, D.W. Refrigeration of oyster shellstock: Conditions which minimize the outgrowth of Vibrio vulnificus. J. Food Prot. 1997, 60, 349–352. [Google Scholar] [CrossRef] [PubMed]
- Nikbay, M.; Acikgoz, M.B.; Kerpicci, H. Investigation of airflow and temperature distribution in the freezer cabinet of a domestic no-frost refrigerator. In Proceedings of the ASME 2009 Heat Transfer Summer Conference Collocated with the InterPACK09 and 3rd Energy Sustainability Conferences, San Francisco, CA, USA, 19–23 July 2009; pp. 689–694. [Google Scholar]
- Wang, L.; Zhang, L.; Lian, G. A CFD simulation of 3D air flow and temperature variation in refrigeration cabinet. Procedia Eng. 2015, 102, 1599–1611. [Google Scholar] [CrossRef] [Green Version]
- Gupta, J.K.; Gopal, M.R.; Chakraborty, S. Modeling of a domestic frost-free refrigerator. Int. J. Refrig. 2007, 30, 311–322. [Google Scholar] [CrossRef]
- Belman-Flores, J.M.; Ledesma, S.; Gallegos-Muñoz, A.; Hernandez, D. Thermal simulation of the fresh food compartment in a domestic refrigerator. Energies 2017, 10, 128. [Google Scholar] [CrossRef] [Green Version]
- Laguerre, O.; Flick, D. Temperature prediction in domestic refrigerators: Deterministic and stochastic approaches. Int. J. Refrig. 2010, 33, 41–51. [Google Scholar] [CrossRef]
- Fukuyo, K.; Tanaami, T.; Ashida, H. Thermal uniformity and rapid cooling inside refrigerators. Int. J. Refrig. 2003, 26, 249–255. [Google Scholar] [CrossRef]
- Yang, K.S.; Chang, W.R.; Chen, I.Y.; Wang, C.C. An investigation of a top-mounted domestic refrigerator. Energ. Convers. Manag. 2010, 51, 1422–1427. [Google Scholar] [CrossRef]
- Ding, G.L.; Qiao, H.T.; Lu, Z.L. Ways to improve thermal uniformity inside a refrigerator. Appl. Therm. Eng. 2004, 24, 1827–1840. [Google Scholar] [CrossRef]
- Melody, K.; Senevirathne, R.; Janes, M.; Jaykus, L.A.; Supan, J. Effectiveness of icing as a post-harvest treatment control of Vibrio vulnificus and Vibrio parahaemolyticus in the Eastern oyster (Crassostrea virginica). J. Food Prot. 2008, 71, 1475–1480. [Google Scholar] [CrossRef]
- Lychnos, G.; Tamainot-Telto, Z. Prototype of hybrid refrigeration system using refrigerant R723. Appl. Therm. Eng. 2018, 134, 95–106. [Google Scholar] [CrossRef]
- Wang, S.G.; Wang, R.Z. Recent developments of refrigeration technology in fishing vessels. Renew. Energy 2005, 30, 589–600. [Google Scholar] [CrossRef]
- Hafner, I.A.; Gabrielii, C.H.; Widell, K. Refrigeration Units in Marine Vessels: Alternatives to HCFCs and High GWP HFCs; Nordic Council of Ministers: Copenhagen, Denmark, 2019. [Google Scholar]
- Tassou, S.A.; Lewis, J.S.; Ge, Y.T.; Hadawey, A.; Chaer, I. A review of emerging technologies for food refrigeration applications. Appl. Therm. Eng. 2010, 30, 263–276. [Google Scholar] [CrossRef] [Green Version]
- Khan, A.Y. Cooling and dehumidification performance analysis of internally-cooled liquid desiccant absorbers. Appl. Therm. Eng. 1998, 18, 265–281. [Google Scholar] [CrossRef]
- Ko, J.S.; Huh, J.H.; Kim, J.C. Improvement of energy efficiency and control performance of cooling system fan applied to Industry 4.0 data center. Electronics 2019, 8, 582. [Google Scholar] [CrossRef] [Green Version]
- Zhang, P.; Liu, Q.S.; Wang, R.Z. Performance and applicability of a dc refrigerator powered by the photovoltaics. J. Renew. Sustain. Energy 2010, 2, 013101. [Google Scholar] [CrossRef]
- Aktacir, M.A. Experimental study of a multi-purpose PV-refrigerator system. Int. J. Phys. Sci. 2011, 6, 746–757. [Google Scholar]
- Luo, J.; Rohn, J.; Bayer, M.; Priess, A.; Wilkmann, L.; Xiang, W. Heating and cooling performance analysis of a ground source heat pump system in Southern Germany. Geothermics 2015, 53, 57–66. [Google Scholar] [CrossRef]
- Wang, W.; Gao, J.; Shi, X.; Xu, L. Cooling performance analysis of steam cooled gas turbine nozzle guide vane. Int. J. Heat Mass Transf. 2013, 62, 668–679. [Google Scholar] [CrossRef]
- Qian, X.; Lee, S.W. The design and analysis of energy efficient building envelopes for the commercial buildings by mixed-level factorial design and statistical methods. In Proceedings of the ASEE Middle Atlantic American Society of Engineering Education, Swarthmore, PA, USA, 14–15 November 2014. [Google Scholar]
- Qian, X.; Chen, G.; Kattel, B.; Lee, S.; Yang, Y. Factorial analysis of vertical ground reaction force and required coefficient of friction for safety of stair ascent and descent. Inter. J. Ind. Oper. Res. 2018, 1, 002. [Google Scholar] [CrossRef]
- Qian, X. Statistical Analysis and Evaluation of the Advanced Biomass and Natural Gas. Co-Combustion Performance. Ph.D. Thesis, Morgan State University, Baltimore, MD, USA, May 2019. [Google Scholar]
Figure 1.
Conceptual design and 3D model of the lab-scale hybrid oyster refrigeration system.

Figure 2.
Major components and materials of the lab-scale hybrid oyster refrigeration system.

Figure 3.
Temperature changes in individual compartments (without air circulation).

Figure 4.
Temperature changes in individual compartments (with natural air circulation).

Figure 5.
Temperature changes in individual compartments (with natural and forced air circulation).

Figure 6.
Contour plot of fan location and fan direction versus temperature deviation.

Figure 7.
Surface plot of cooling time versus fan direction and fan location (C7: cooling time in minutes).
Figure 7.
Surface plot of cooling time versus fan direction and fan location (C7: cooling time in minutes).


Table 1.
Distribution of oyster shell and water in the cooling system.
| 110 Volt AC Cooling Unit (Left Section) | 12 Volt DC Cooling Unit (Right Section) | ||
| Compartment 1 (kg) | Compartment 4 (kg) | ||
| 4.76 shell + 0.5 water | 4.76 shell + 0.5 water | 4.76 shell + 0.5 water | 4.76 shell + 0.5 water |
| Total: 9.52 shell + 1 water | Total: 9.52 shell + 1 water | ||
| Compartment 2 (kg) | Compartment 5 (kg) | ||
| 9.52 shell + 1 water | 9.52 shell + 1 water | 9.52 shell + 1 water | 9.52 shell + 1 water |
| Total: 19.04 shell + 2 water | Total: 19.04 shell + 2 water | ||
| Compartment 3 (kg) | Compartment 6 (kg) | ||
| 9.52 shell + 1 water | 9.52 shell + 1 water | 9.52 shell + 1 water | 9.52 shell + 1 water |
| Total: 19.04 shell + 2 water | Total: 19.04 shell + 2 water | ||
Table 2.
Factorial design with standard deviation of compartment temperatures (δ) as response variable.
Table 2.
Factorial design with standard deviation of compartment temperatures (δ) as response variable.
| Factor | Treatment Combination | Replicate | ||
|---|---|---|---|---|
| A | B | I | II | |
| − | − | A low, B low | 1.63 | 1.63 |
| + | − | A high, B low | 2.49 | 2.34 |
| − | + | A low, B high | 2.67 | 2.33 |
| + | + | A high, B high | 1.95 | 1.46 |
Table 3.
Summary of analysis of variance (ANOVA) results.
| Source | DF | Adj SS | Adj MS | F-Value | p-Value |
|---|---|---|---|---|---|
| A (Fan Location) | 1 | 0.00005 | 0.00005 | 0.00 | 0.976 |
| B (Fan Direction) | 1 | 0.01280 | 0.01280 | 0.27 | 0.630 |
| 2-Way Interaction | 1 | 1.24820 | 1.24820 | 26.40 | 0.007 |
| Error | 4 | 0.18910 | 0.04727 | ||
| Total | 7 | 1.45015 |
Table 4.
22 factorial design with cooling time as response variable.
| Factor | Treatment Combination | Replicate (min) | Total (Min) | Average (min) | ||
|---|---|---|---|---|---|---|
| A | B | I | II | |||
| − | − | A low, B low | 300 | 100 | 400 | 150 |
| + | − | A high, B low | 140 | 120 | 260 | 130 |
| − | + | A low, B high | 120 | 120 | 240 | 120 |
| + | + | A high, B high | 120 | 100 | 220 | 110 |
© 2020 by the authors. Licensee MDPI, Basel, Switzerland. This article is an open access article distributed under the terms and conditions of the Creative Commons Attribution (CC BY) license (http://creativecommons.org/licenses/by/4.0/).
Share and Cite
MDPI and ACS Style
Qian, X.; Yang, Y.; Lee, S.W.; Caballes, M.J.L.; Alamu, O.S. Cooling Performance Analysis of the Lab-Scale Hybrid Oyster Refrigeration System. Processes 2020, 8, 899. https://doi.org/10.3390/pr8080899
AMA Style
Qian X, Yang Y, Lee SW, Caballes MJL, Alamu OS. Cooling Performance Analysis of the Lab-Scale Hybrid Oyster Refrigeration System. Processes. 2020; 8(8):899. https://doi.org/10.3390/pr8080899
Chicago/Turabian StyleQian, Xuejun, Yulai Yang, Seong W. Lee, Marc J. L. Caballes, and Oludayo S. Alamu. 2020. "Cooling Performance Analysis of the Lab-Scale Hybrid Oyster Refrigeration System" Processes 8, no. 8: 899. https://doi.org/10.3390/pr8080899
Note that from the first issue of 2016, this journal uses article numbers instead of page numbers. See further details here.