Confined Bed Breakage of Fine Iron Ore Concentrates


1
Department of Metallurgical and Materials Engineering, Universidade Federal do Rio de Janeiro–COPPE/UFRJ, Cx. Postal 68505, Rio de Janeiro CEP 21941-972, RJ, Brazil
2
Vale S.A., Complexo de Tubarão, Vitória CEP 29090-911, ES, Brazil
*
Author to whom correspondence should be addressed.
Minerals 2020, 10(8), 666; https://doi.org/10.3390/min10080666
Submission received: 26 June 2020
/
Revised: 22 July 2020
/
Accepted: 24 July 2020
/
Published: 27 July 2020
(This article belongs to the Special Issue Comminution in the Minerals Industry)
Abstract
:High-pressure grinding rolls (HPGR) have gained great popularity in the mining industry in the last 25 years or so. One of the first successful applications of the technology has been in iron ore pressing prior to pelletization. Piston-and-die tests can provide good insights on the material response in an HPGR. This work analyzed confined bed breakage of four iron ore concentrates under different conditions. Saturation in breakage of particles contained in the top size in the tests was observed to occur at specific energies of about 2 kWh/t, whereas full saturation in breakage, with no additional increase in specific surface area of the material, occurred at energies above about 6 kWh/t. An expression was proposed to characterize the propensity of a material to break under confined bed conditions. The phenomenology involved in confined bed breakage of such materials was then analyzed in light of the results.
Keywords:
bed breakage; iron ore; comminution; saturation; piston-and-die; compaction; compression; breakage1. Introduction
Comminution machines that rely on confined bed breakage, namely high-pressure grinding rolls (HPGR) and the vertical roller mill (VRM), have gained great popularity in the cement industry [1,2,3,4,5,6,7] and, in the case of the HPGR, also in the minerals industry [8,9,10,11,12,13]. Their main advantages include good energy efficiency, high throughput, and ability to operate in size reduction operations from secondary crushing down to fine grinding. One particularly important characteristic of these technologies is that, as the applied specific energies are raised, the efficiency of energy usage drops, partially owing to the phenomenon of breakage saturation.
One important approach to gain insights into the operation of comminution machines that rely on confined breakage is to conduct tests using the piston-and-die apparatus [14,15]. Through these tests, it is possible to analyze how the applied energy is dissipated under controlled conditions and is used to create new surfaces. Schubert [16] highlighted that the total energy input in a particle bed can be divided into several microprocesses, namely friction losses, plastic deformation work, elastic recovery, energy dissipated during breakage, and compaction [16]. As such, in order to assess the particle breakage behavior resulting from the application of different applied vertical stresses, several authors [14,15,17,18,19,20,21,22,23,24] used the force–displacement curve and the size reduction results from piston-and-die tests for different materials. Kalala et al. [15] presented results indicating an elastic recovery of around 40% of the total input energy for pressing iron ores in a piston-and-die apparatus with compressive forces of 1700 kN and with particle sizes of about 12 mm.
Great attention has been dedicated to the study of the compaction behavior of particulate materials under confined conditions. Such compaction occurs during processes that include metal powder smelting, as well as tableting and pelletizing in the pharmaceutical, ceramic, and food industries. Indeed, compaction has been studied and modelled for inorganic powders [25], metal powders [26], ceramic powders [27], fine grinding processes [17,28,29], and organic powders in the manufacture of pharmaceutical tablets [30,31,32,33]. The particle bed compaction behavior can be influenced by different parameters including the deformation or stress–strain behavior [34,35] as well as particle size and shape [33,36]. Assessing limestone breakage response under confined conditions, Cabiscol et al. [29] observed that the packing density reached a maximum of around 90% of the specific gravity of the material with particles with mean initial size of 236 µm, being equivalent to the value found by Wünsch et al. [28] for different materials used in the production of pharmaceutics. On the other hand, recent works have attempted to assess particle bed behavior under confined conditions from computational simulations using the discrete element method (DEM) [37,38,39]. Besides DEM simulations, Garner et al. [37] also showed several experimental results highlighting the ability to reach relative densities around 0.95 for a vertical stress of 150 MPa. Indeed, the complexity of this process is the main reason for the poor predictability and the limited understanding yet available.
One particularly successful application of confined bed breakage is the HPGR in association with ball milling in either pregrinding or regrinding of iron ore concentrates for pellet feed production [8,13]. The present work investigated breakage of iron ore concentrates in confined conditions in single and multiple pressings in a piston-and-die apparatus with the aim of identifying the onset of saturation during confined breakage.
2. Experimental Section
2.1. Materials
Samples were collected of four iron ore concentrates that are fed into Vale’s pelletizing plants at Complexo de Tubarão (Vitória, Brazil). Three of these concentrates (Itabira, Brucutu, and Timbopeba) are produced by flotation of ores from the Iron Quadrangle from the state of Minas Gerais (Brazil), having a top particle size of 1 mm. The fourth consists of the result of the preparation of ore from the Carajás mineral province (Pará, Brazil).
Specific gravity was measured by Helium pycnometry. Bulk (apparent) density was measured by placing each weighed sample in a beaker and measuring the apparent volume after vibration. Prior to testing, all samples were dried in air.
2.2. Piston-and-Die Tests
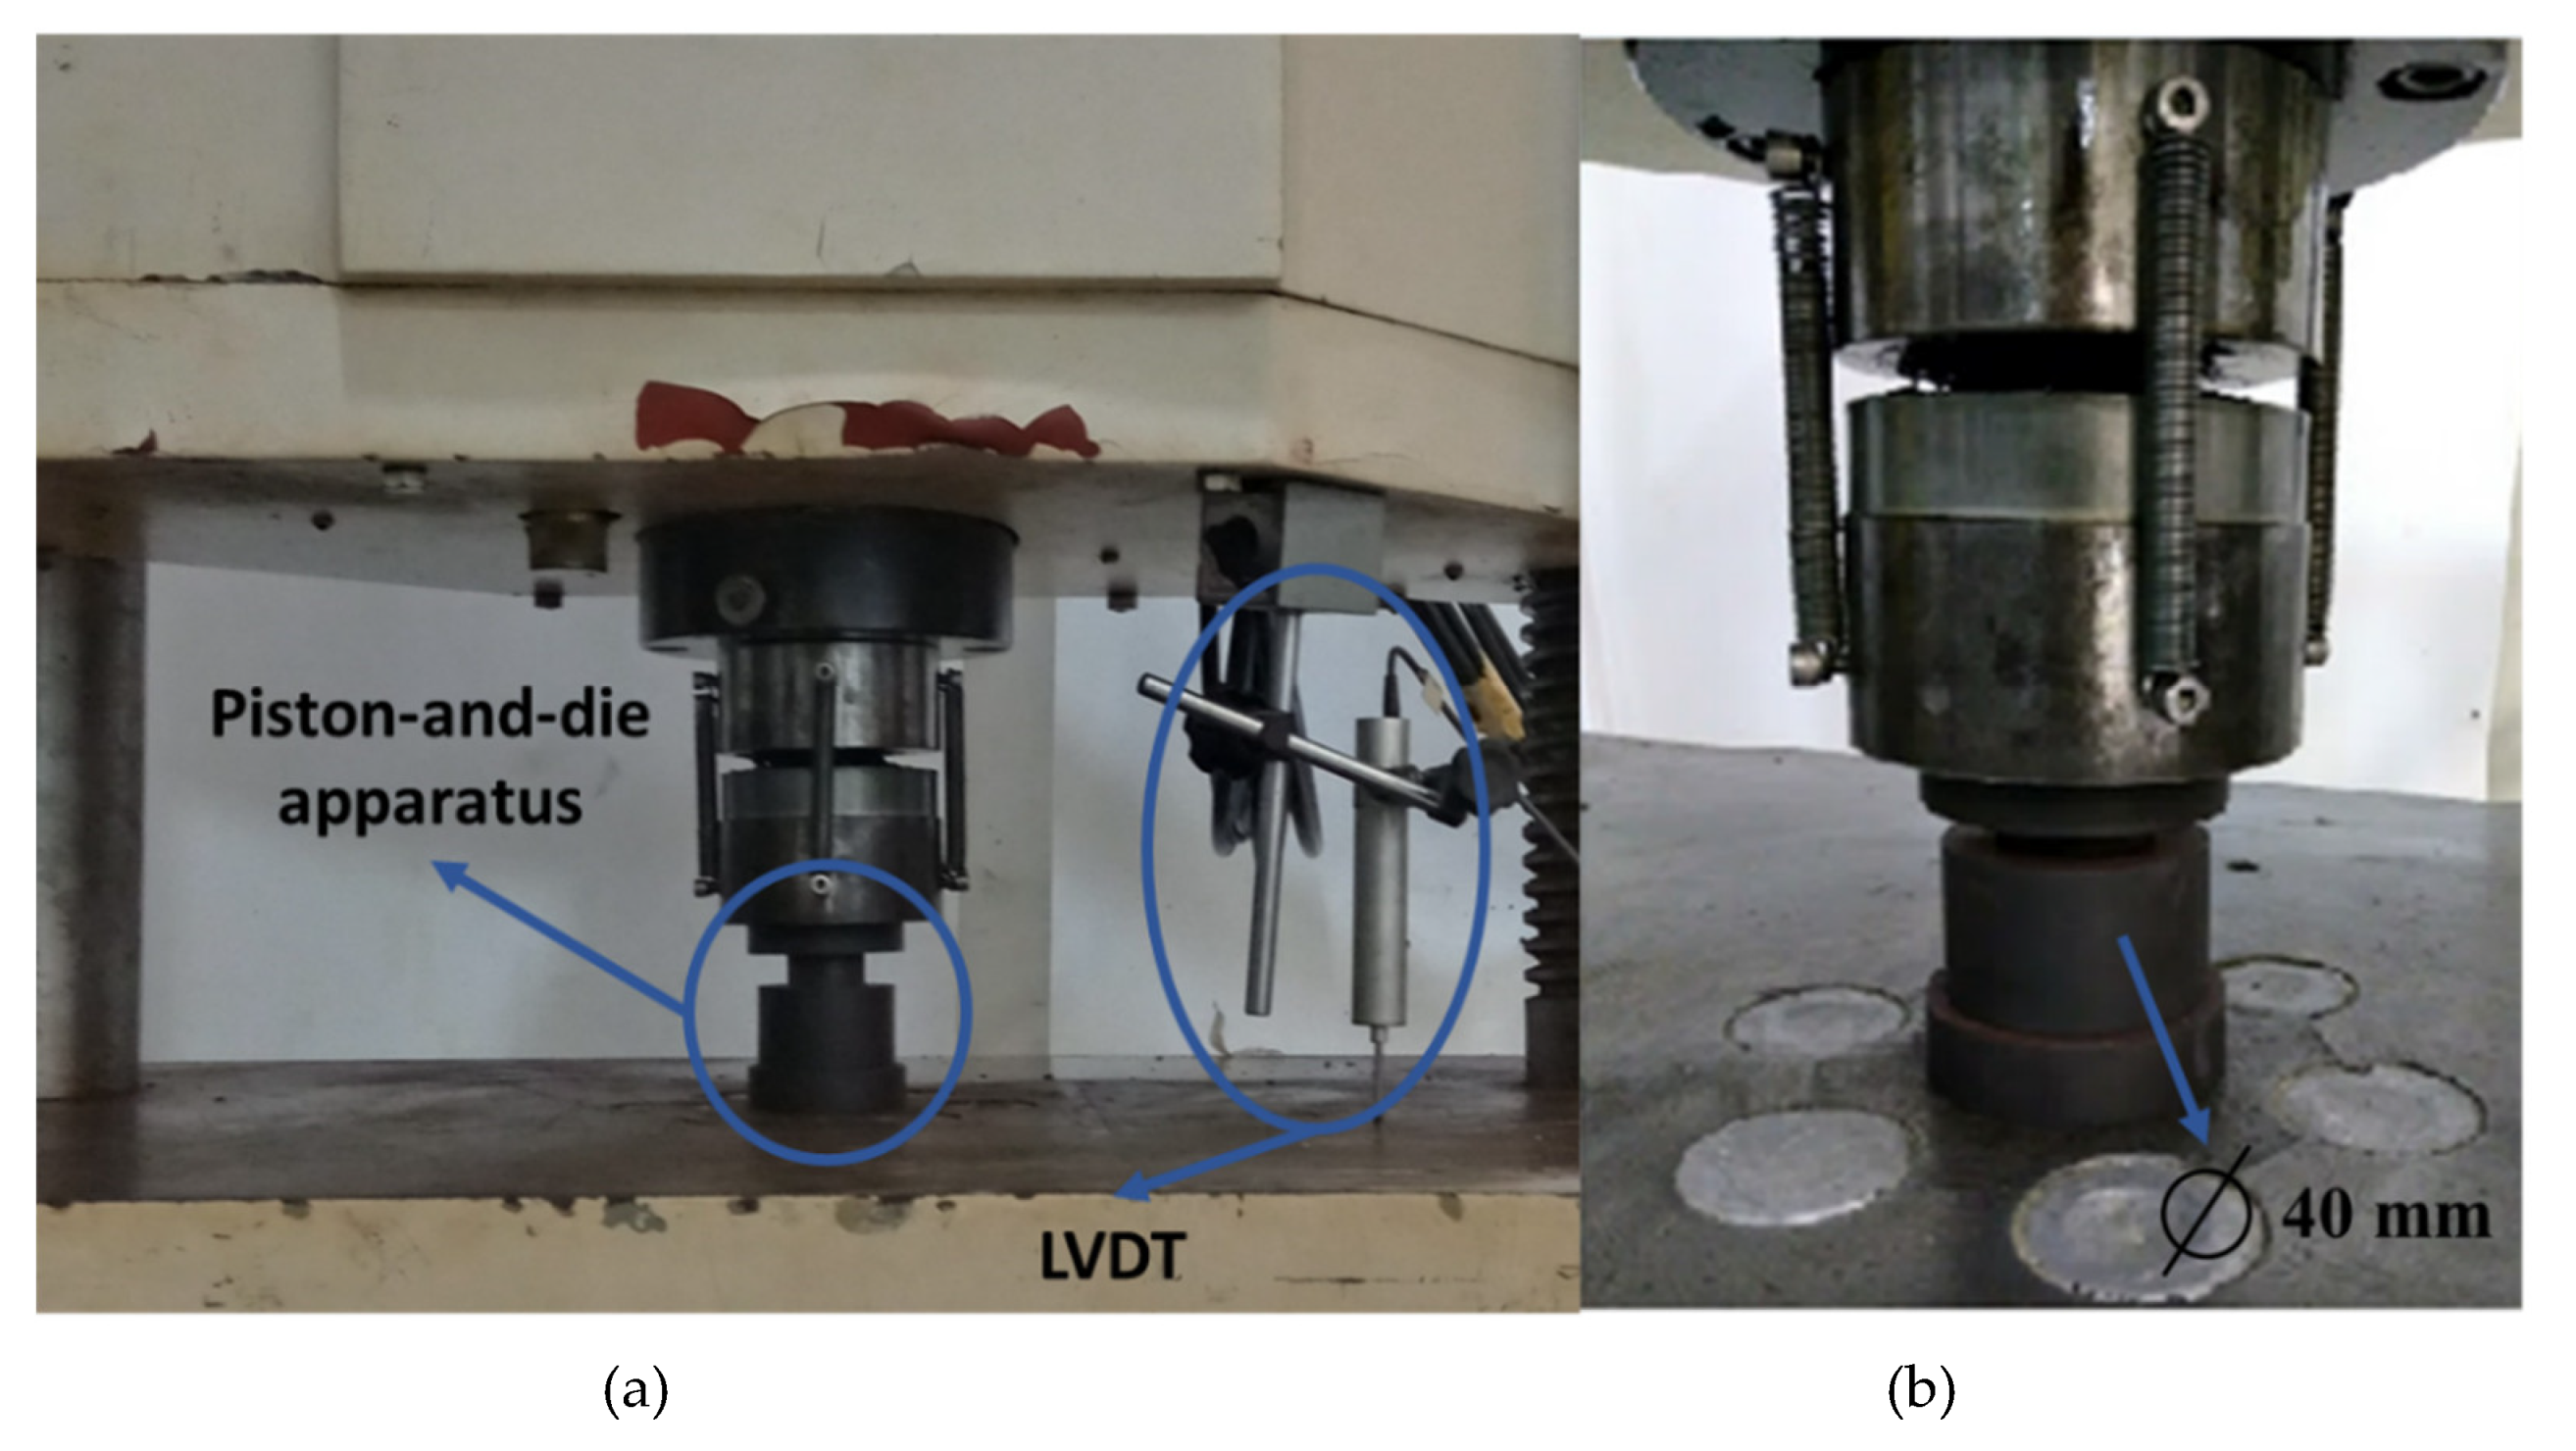
Particles contained in three size ranges were tested, namely 150–125 µm, 106–75 µm, and 53–45 µm, which were prepared by careful wet sieving. Each previously dried sample, containing 30 g, was placed in the die for testing. The piston had a 40 mm diameter and the resulting initial bed height was about 13 mm. As such, these tests were conducted under ideal confined particle bed conditions, as precluded by Schönert [14,40], that is, the height of the bed is larger than six times the top size of the samples and the bed diameter is larger than three times the bed height, so that wall effects were minimized.
Figure 1 illustrates the servo-hydraulic press (Shimadzu, Kyoto, Japan) used, showing the linear variable differential transformer (LVDT) employed to measure the particle bed displacement (a) and the piston-and-die apparatus in detail (b). The elastic deformation of the system was subtracted from the value measured using the LVDT.
The compressive forces were applied in the range of 50–1000 kN (40–800 MPa), and the deformation rate was 5 mm/min. The output of the test was the force–displacement curve. The specific input energy in each test was calculated from the numerical integration up to the maximum load. Upon completion of the test, the bed of particles was removed from the die, dispersed in water, and the size distribution measured. Size analyses were conducted directly of the material from the test by laser scattering in a Malvern Mastersizer 2000 (Malvern Instruments Inc., Malvern, UK) while the Blaine specific surface area (BSA) was measured using a PCBlaine-Star (Zünderwerke Ernst Brün GmbH, Marl, Germany). In addition to that, each pressed sample was also wet sieved using the bottom size of the interval in order to assess the proportion of material broken.
An additional set of tests consisted of conducting multiple pressings of material contained in the 106–75 µm size range. The initial bed was pressed up to 200 kN (159 MPa), the load removed, the material dispersed and analyzed, then it was reloaded to the die and the same procedure repeated. This specific energy was selected since it is in the range of values used in the pelletizing industry [12].
3. Results
3.1. Material Characteristics
3.2. Force–Displacement Profiles
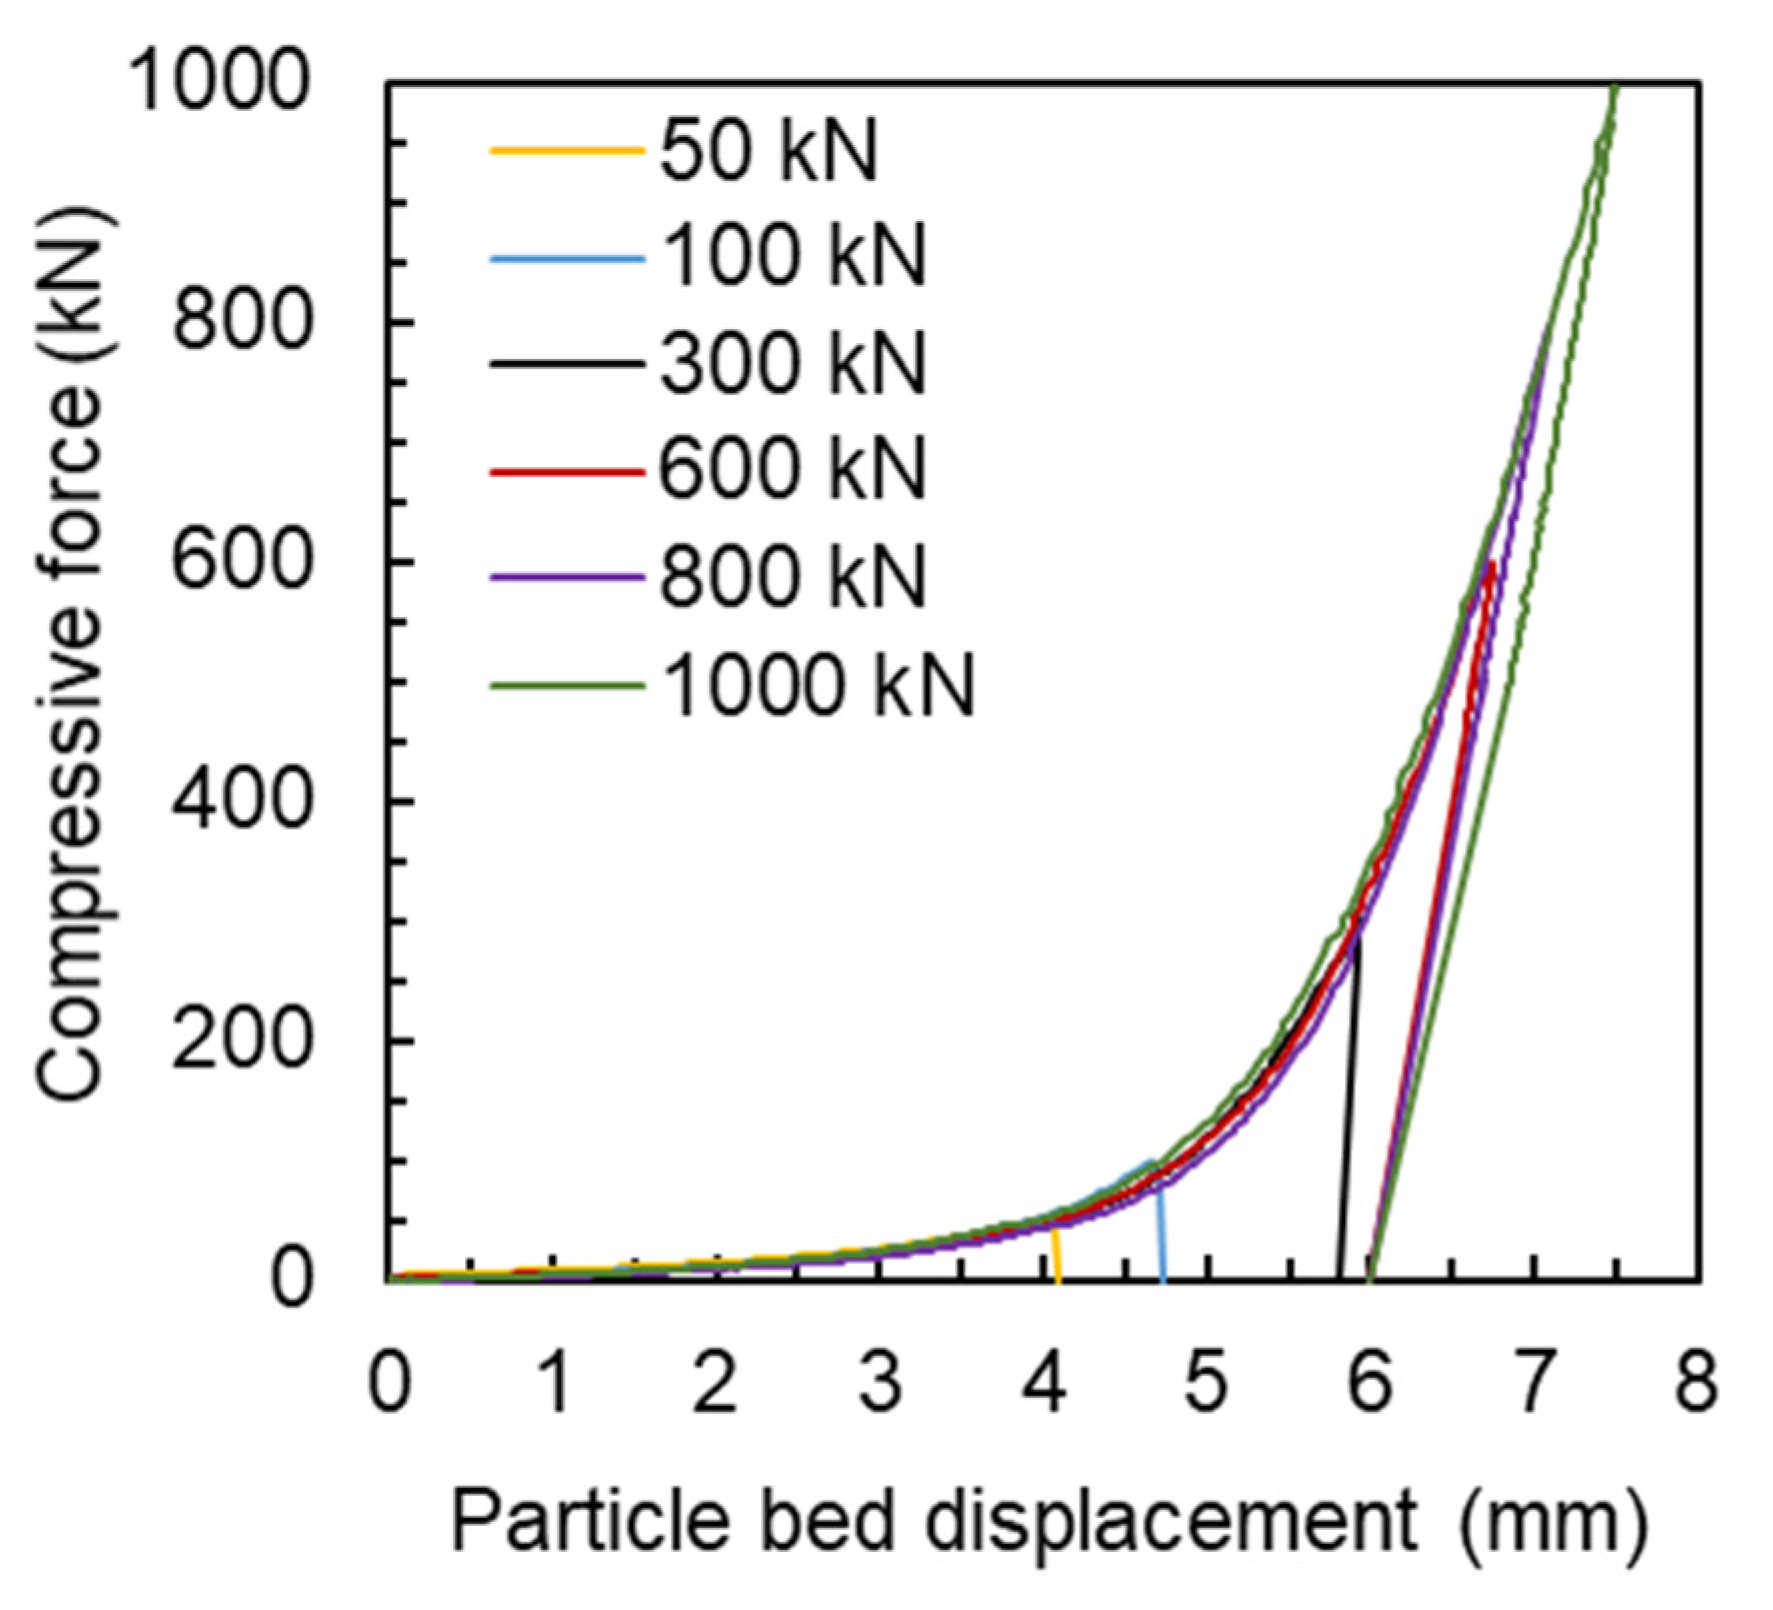
In order to analyze bed response in compressive bed breakage in greater detail, force–deformation profiles are analyzed as follows. Figure 2 presents force–displacement curves for different compressive forces, highlighting the load and unload (relief) curves. It is evident that, when the bed is compressed up to relatively small loads, namely below 100 kN (80 MPa), no elastic recovery appears, with no recoil of the bed. Mütze [17] observed that, in this case, all energy applied to the bed is either dissipated in rearranging the particles or in producing particle breakage. Under such conditions, the thickness of the bed after unloading progressively reduces as loads increase. Beyond this point, as loads increase, the force–displacement curves become steeper. In this case, unloading exhibits progressively more elastic response, with the bed presenting ever more elastic recovery, which becomes evident from the lower slopes of the unloading curves.
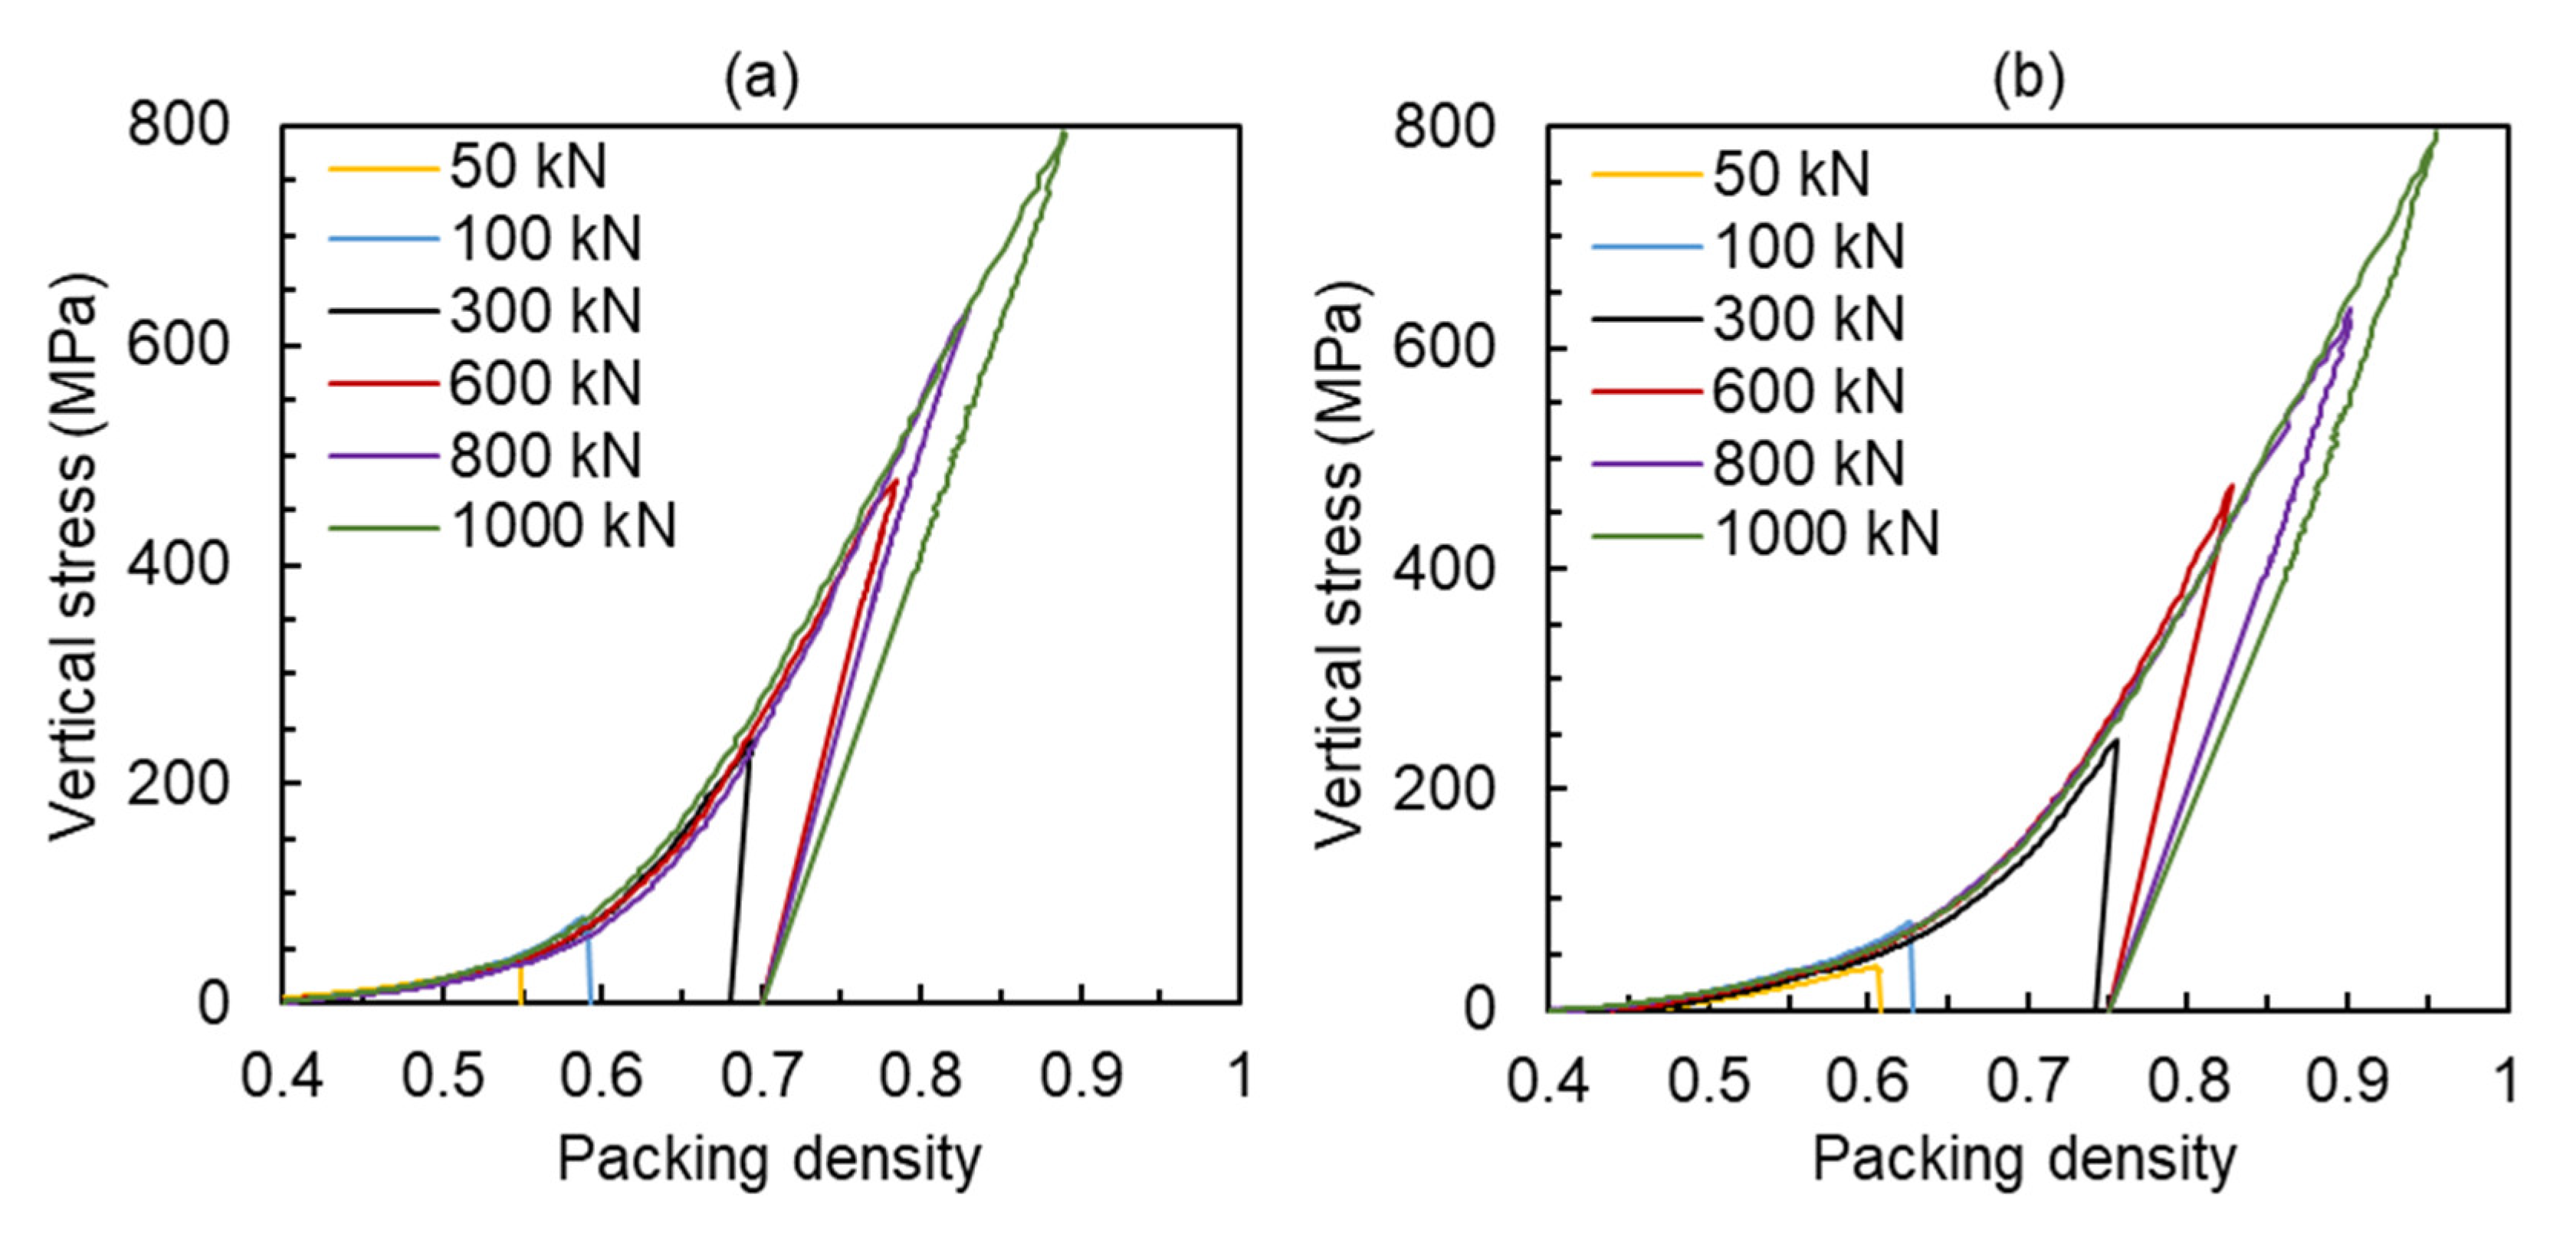
Force-deformation curves such as those in Figure 2 may be presented more suitably on the basis of the relationship between the packing density (ratio between apparent density of the bed and specific gravity) and the vertical stress applied. Results are presented in Figure 3 for the Itabira and Carajás samples contained in the narrow particle size range of 150–125 µm. For a vertical stress of 800 MPa (1000 kN), the Itabira sample presented a maximum packing density of around 0.88, whereas a maximum of 0.95 was reached for the Carajás sample. The reasonable difference in the curves indicates a softer response for the Carajás sample under compressive loads. In addition, both results are able to show that, even though different vertical stresses were applied, the final packing density after total relief was nearly constant for each material, being equal to around 0.70 for the Itabira and 0.75 for the Carajás samples.
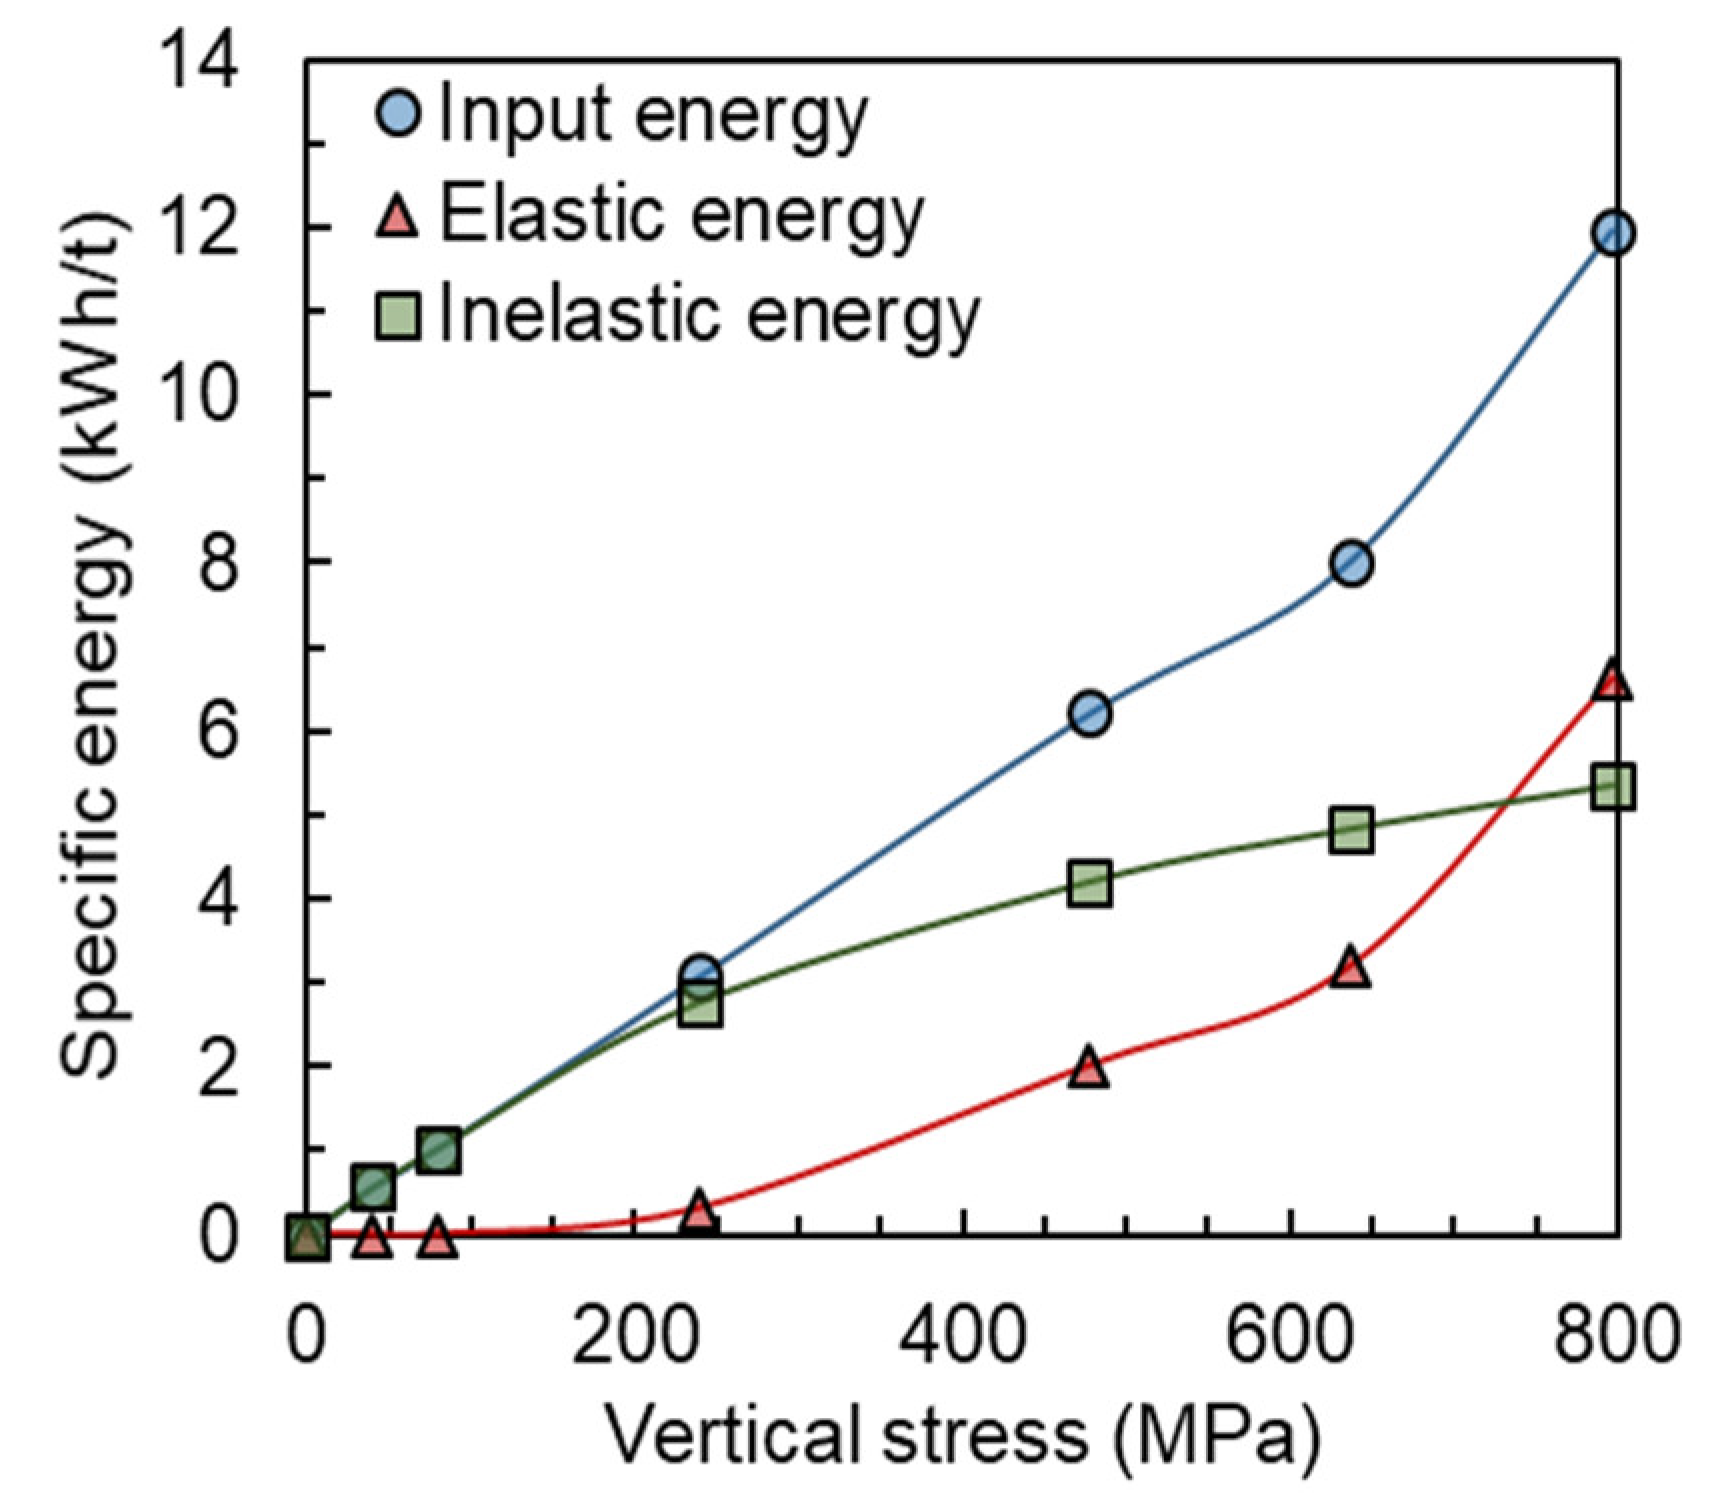
A more detailed examination of the results is possible by calculating the areas below the curves. The input energy is given by numerical integration of the curves up to the maximum vertical stress, whereas the elastic energy is given by the area corresponding to the unloading of the piston. The inelastic or dissipated energy is simply given by the difference between the two. Results are presented in Figure 4, which shows the rapid increase in elastic energy with the increment in vertical stress. The results also show that for low compressive forces the elastic energy is almost negligible, whereas it corresponds to around 60% of the input energy for the highest compressive forces analyzed.
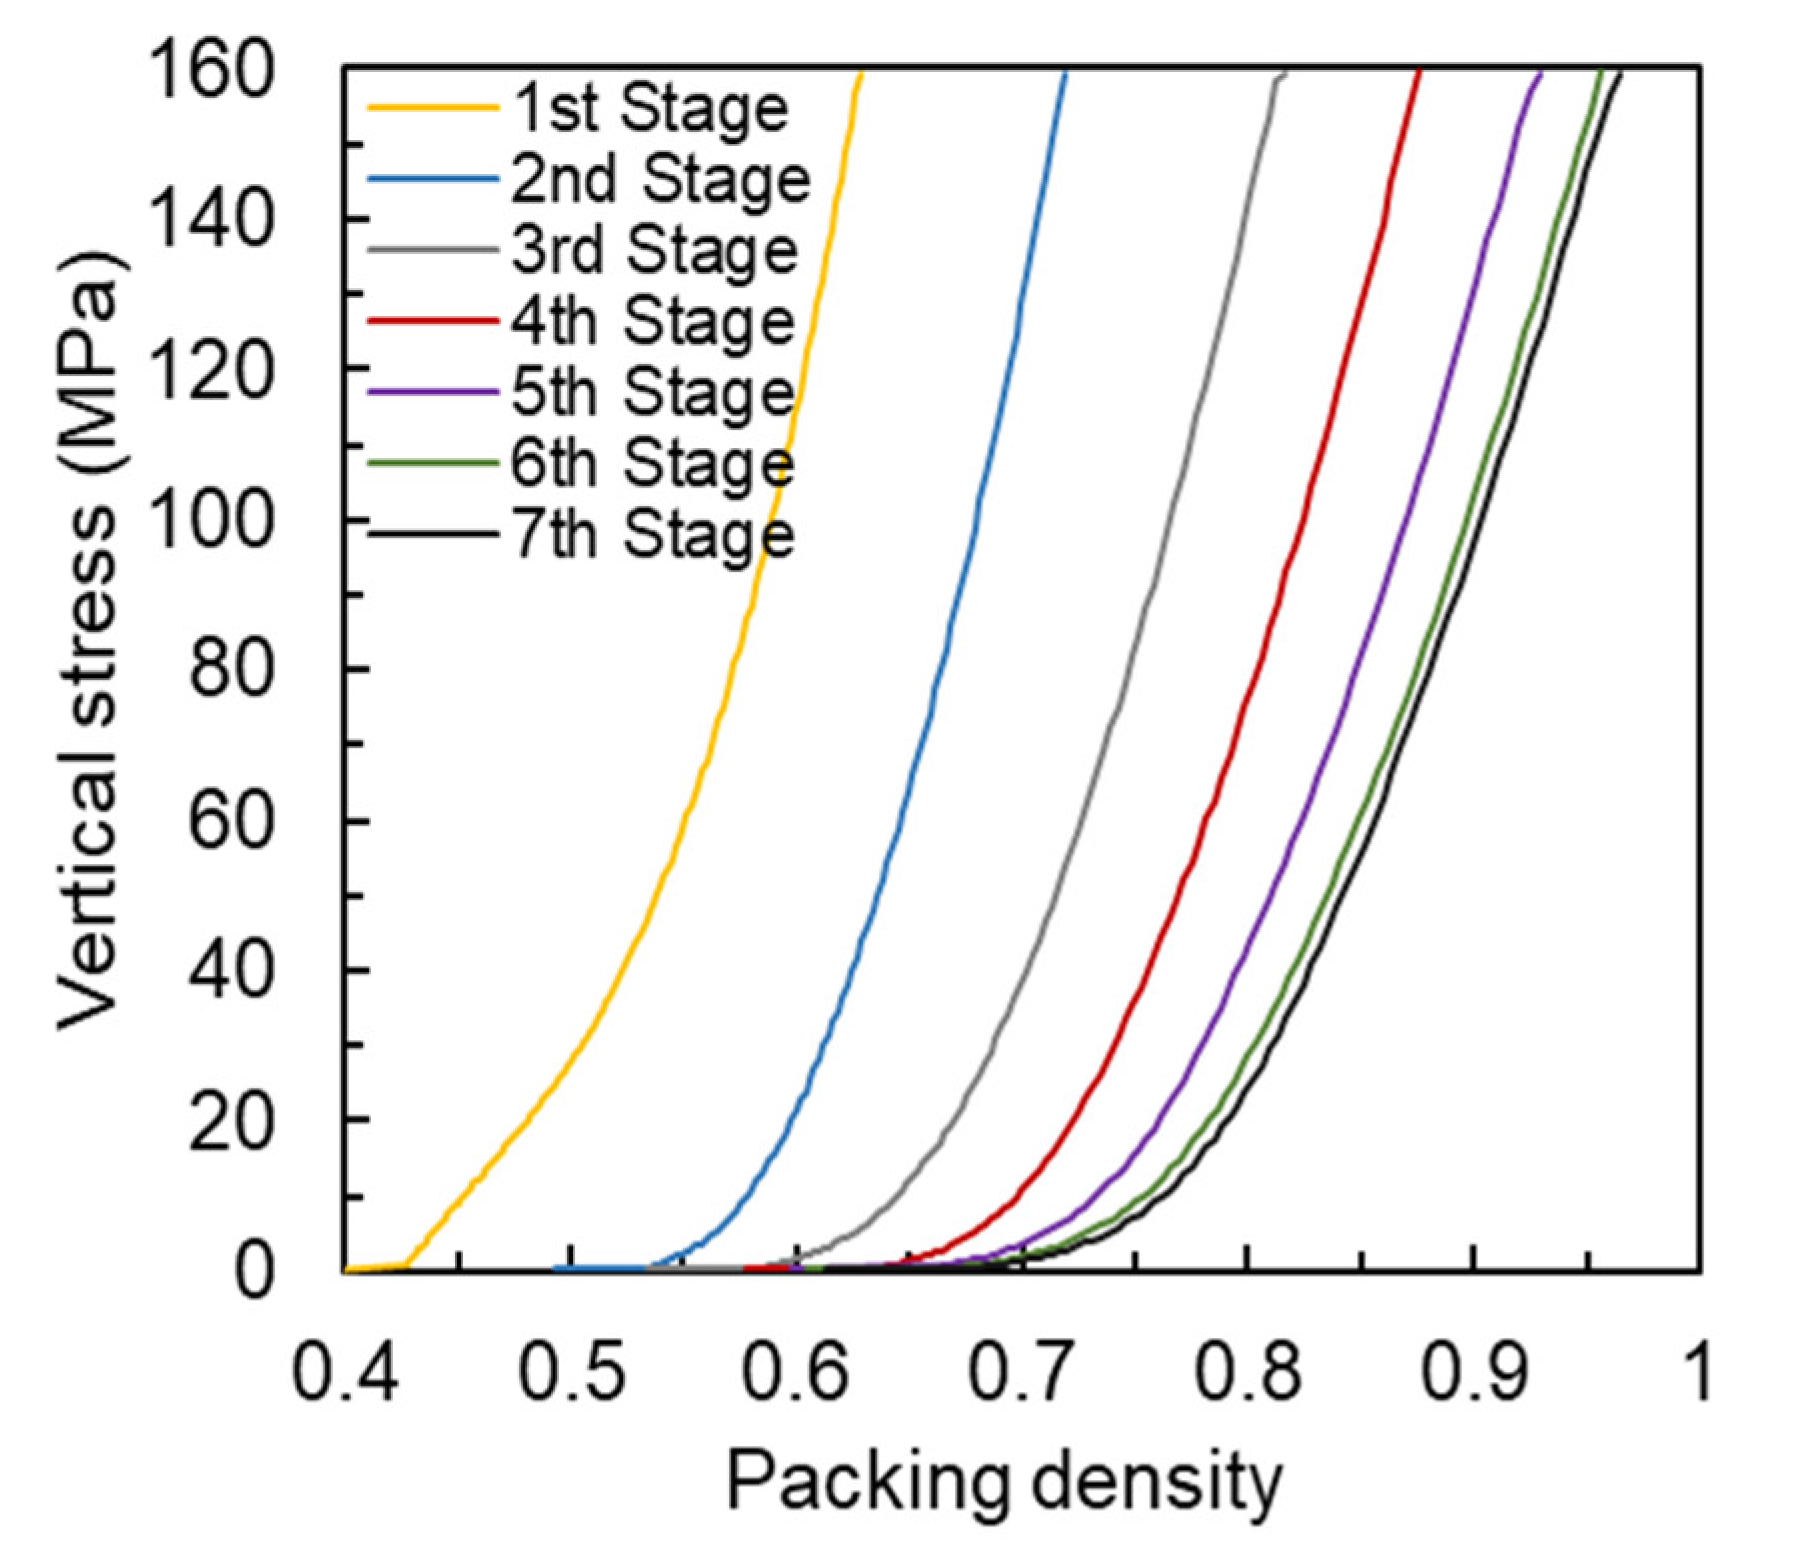
In order to assess the particle bed behavior under multiple pressing cycles, Figure 5 shows the relationship between the packing density with the vertical stress applied in seven repeated pressing stages. For a vertical stress of up to 160 MPa (200 kN), the different pressing stages showed a great distinction in the initial bed configuration with the packing density reaching a maximum value of around 0.7 for the last stage. This result is consistent with the maximum packing density found after the single-stage pressing process presented in Figure 3a for the Itabira sample. Indeed, there is a marked relationship between the initial feed size distribution and the progressive change in packing density of the material. The results from Figure 5 indicate that, for the fine feed size distributions used, there is an increment in packing density caused by the reduction in the voids fraction within the particle bed. As the multiple stages of pressing were applied, the force–displacement profile started to superimpose, with this effect being potentially associated with the high particle bed packing. The dispersion of the material following each pressing cycle, coupled with the application of a relatively low vertical stress in each cycle, allowed to prevent particle bed saturation.
3.3. Size Analyses
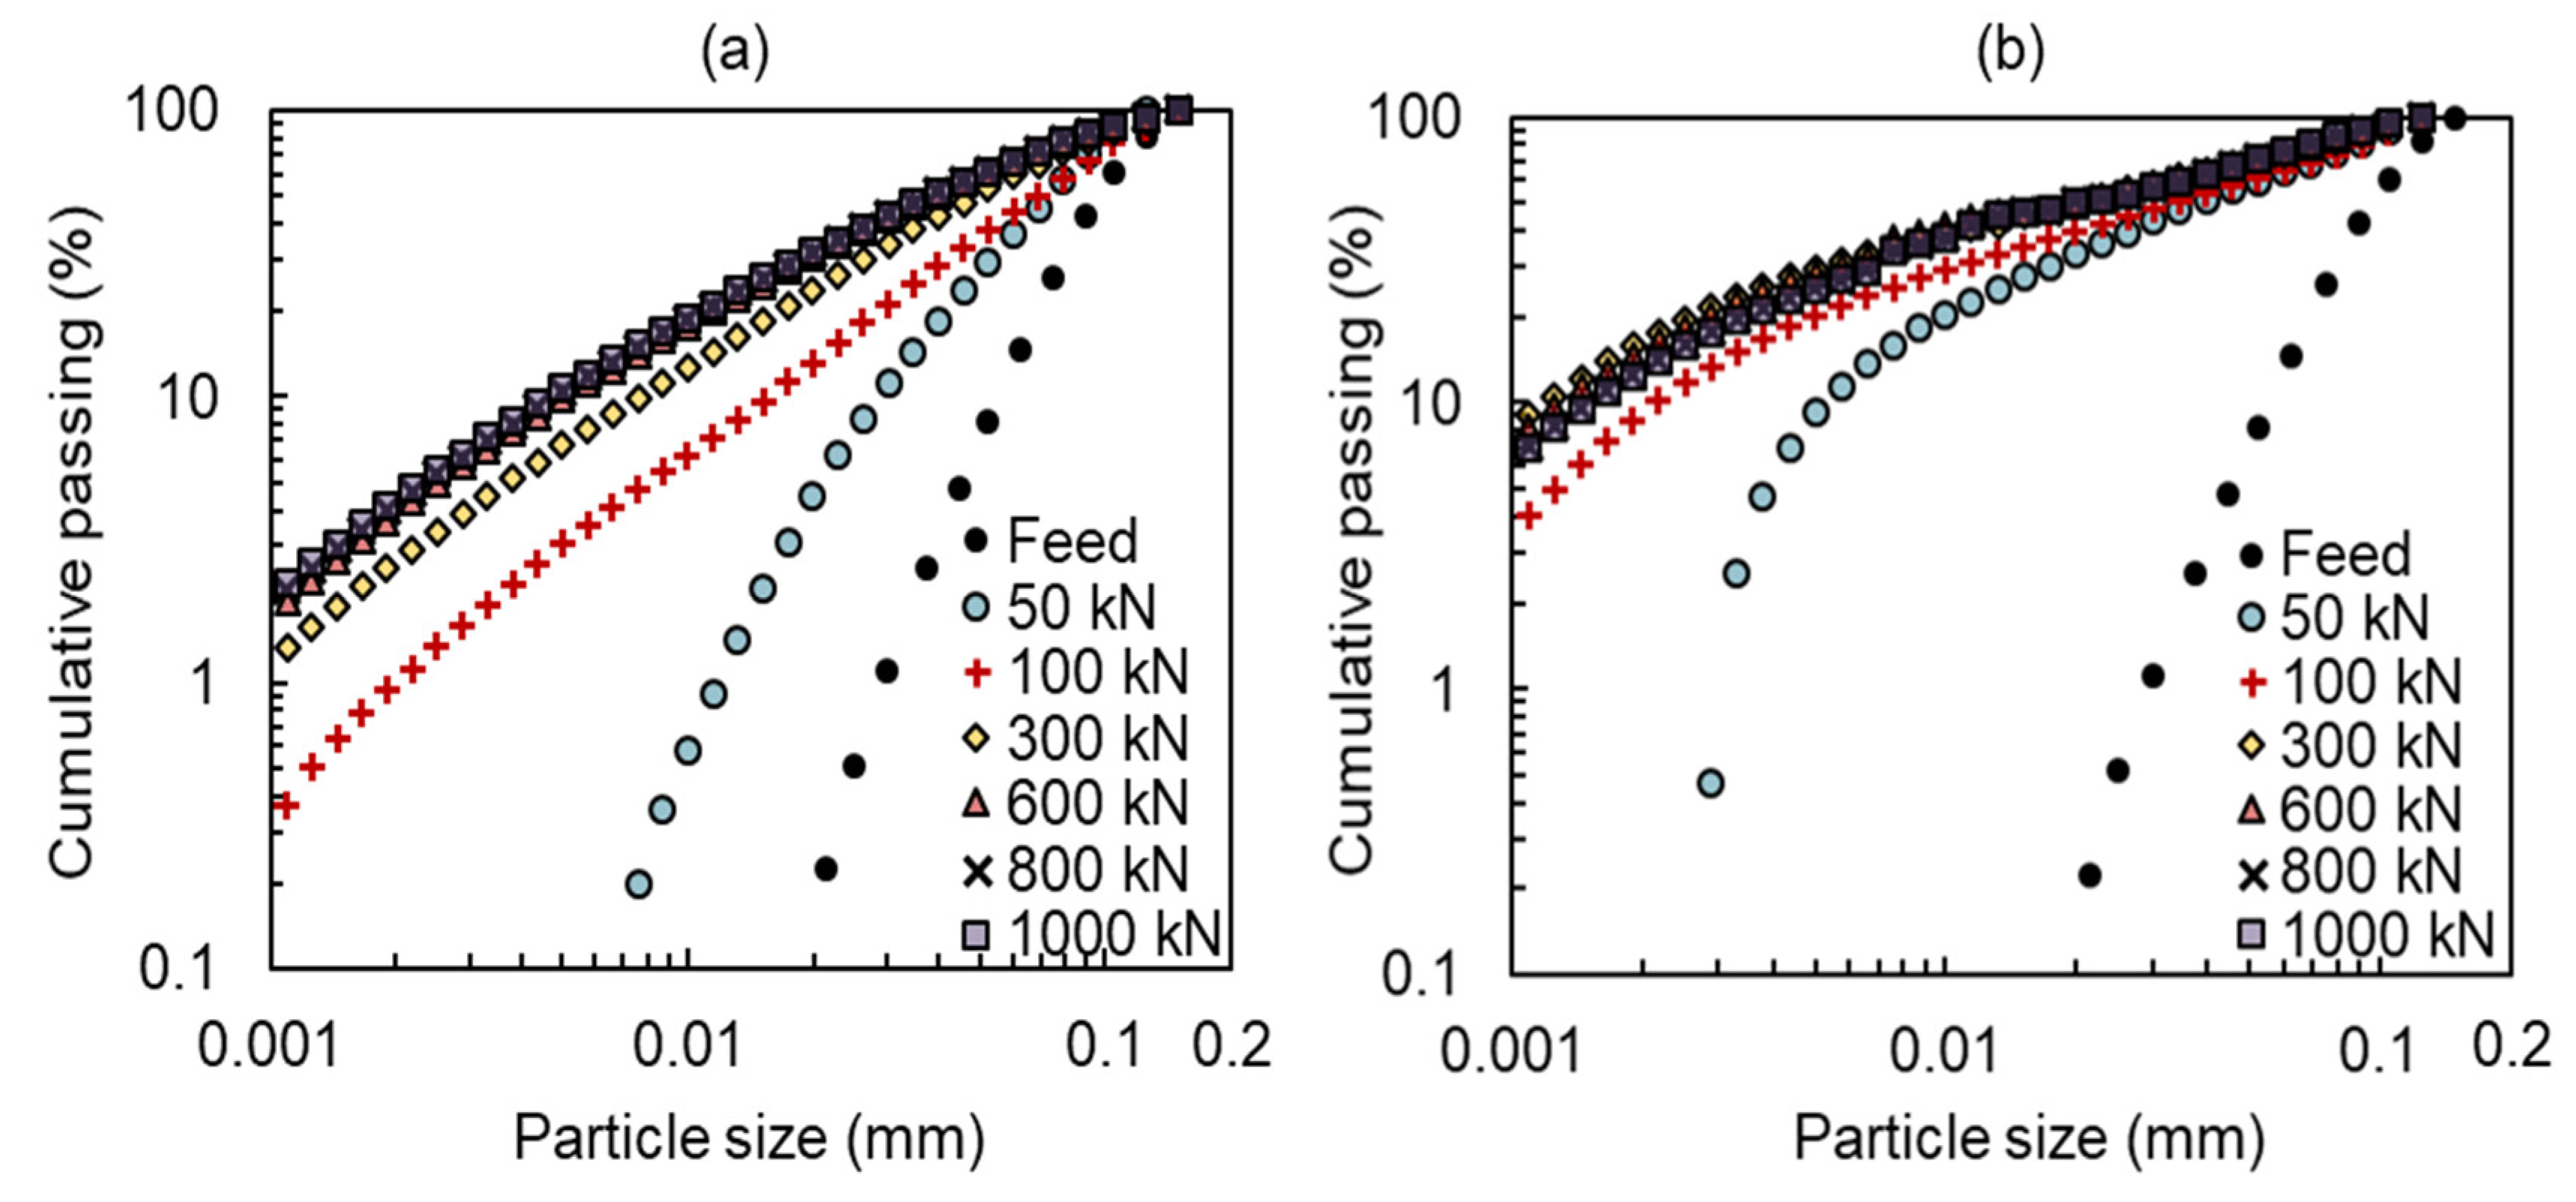
Figure 6 presents the product size distributions for the Brucutu and Carajás samples at different stressing conditions. They demonstrate the increase in fineness as compressive forces increase, as well as the onset of the breakage saturation that is associated with the application of compressive forces higher than about 300 kN (240 MPa). The higher propensity of the Carajás sample to breakage in the piston-and-die test is evident from the larger proportion of fines produced.
3.4. Breakage of Top Size Particles
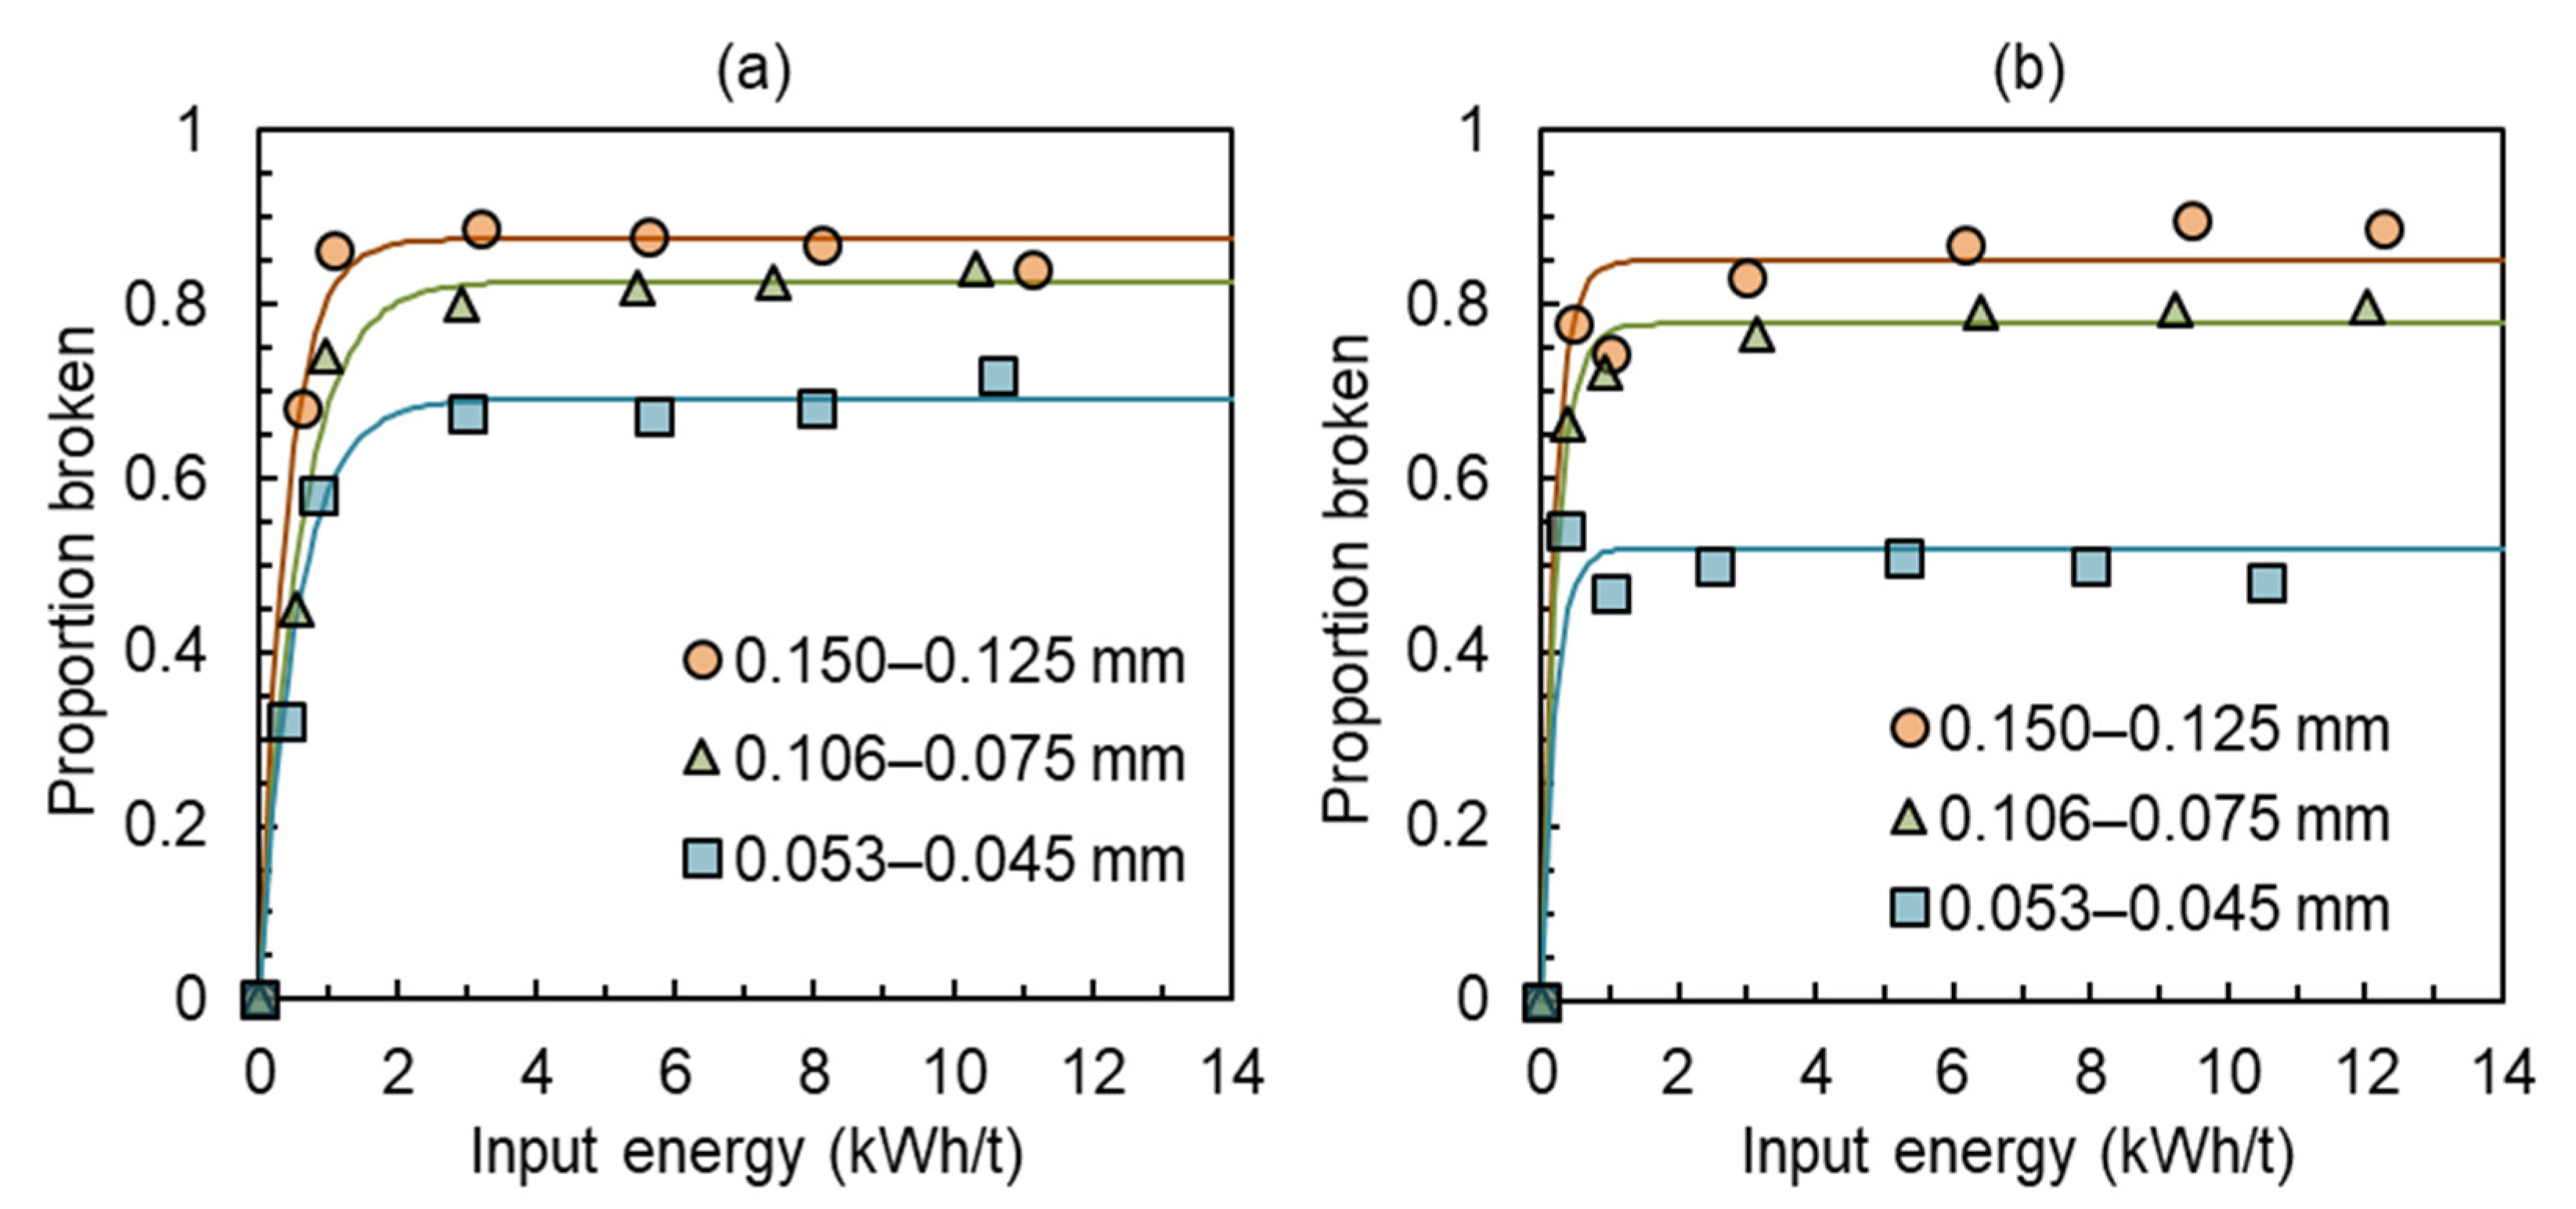
After each piston-and-die test, the proportion passing the original narrow size range was recorded by sieving. The proportion broken was then plotted as a function of specific energy in Figure 7, following the approach used by Liu and Schönert [18] and Dundar et al. [21].
The figure shows that the proportion of particles broken increases significantly at low specific input energies, but reaches a maximum value, which becomes nearly constant with increasing input energies. Beyond this point, increasing the input energy does not lead to more breakage of particles contained in the original size range, as they become stabilized by neighboring particles. Tavares [42] observed that, whereas little or no additional breakage occurred at these higher energy inputs in HPGR experiments, particles may become progressively weaker. Furthermore, as observed by Liu and Schönert [18], it is evident that this maximum proportion broken varies with size, reducing significantly for the finer size range studied. Indeed, in the finest size range studied (53–45 µm), less than half of the particles broke for the Carajás sample (Figure 7b), in spite of the energy applied, showing the significant size effect on particle stabilization in confined bed breakage. The figure also shows that, at specific energies in the order of 2 kWh/t, saturation is reached on the maximum proportion of particles broken. This specific energy corresponds to a maximum load in the order of 200 kN (159 MPa), coinciding with the conditions in which the bed starts to recoil partially elastically (Figure 3) and also the condition under which the multiple stage pressings (Figure 5) were carried out.
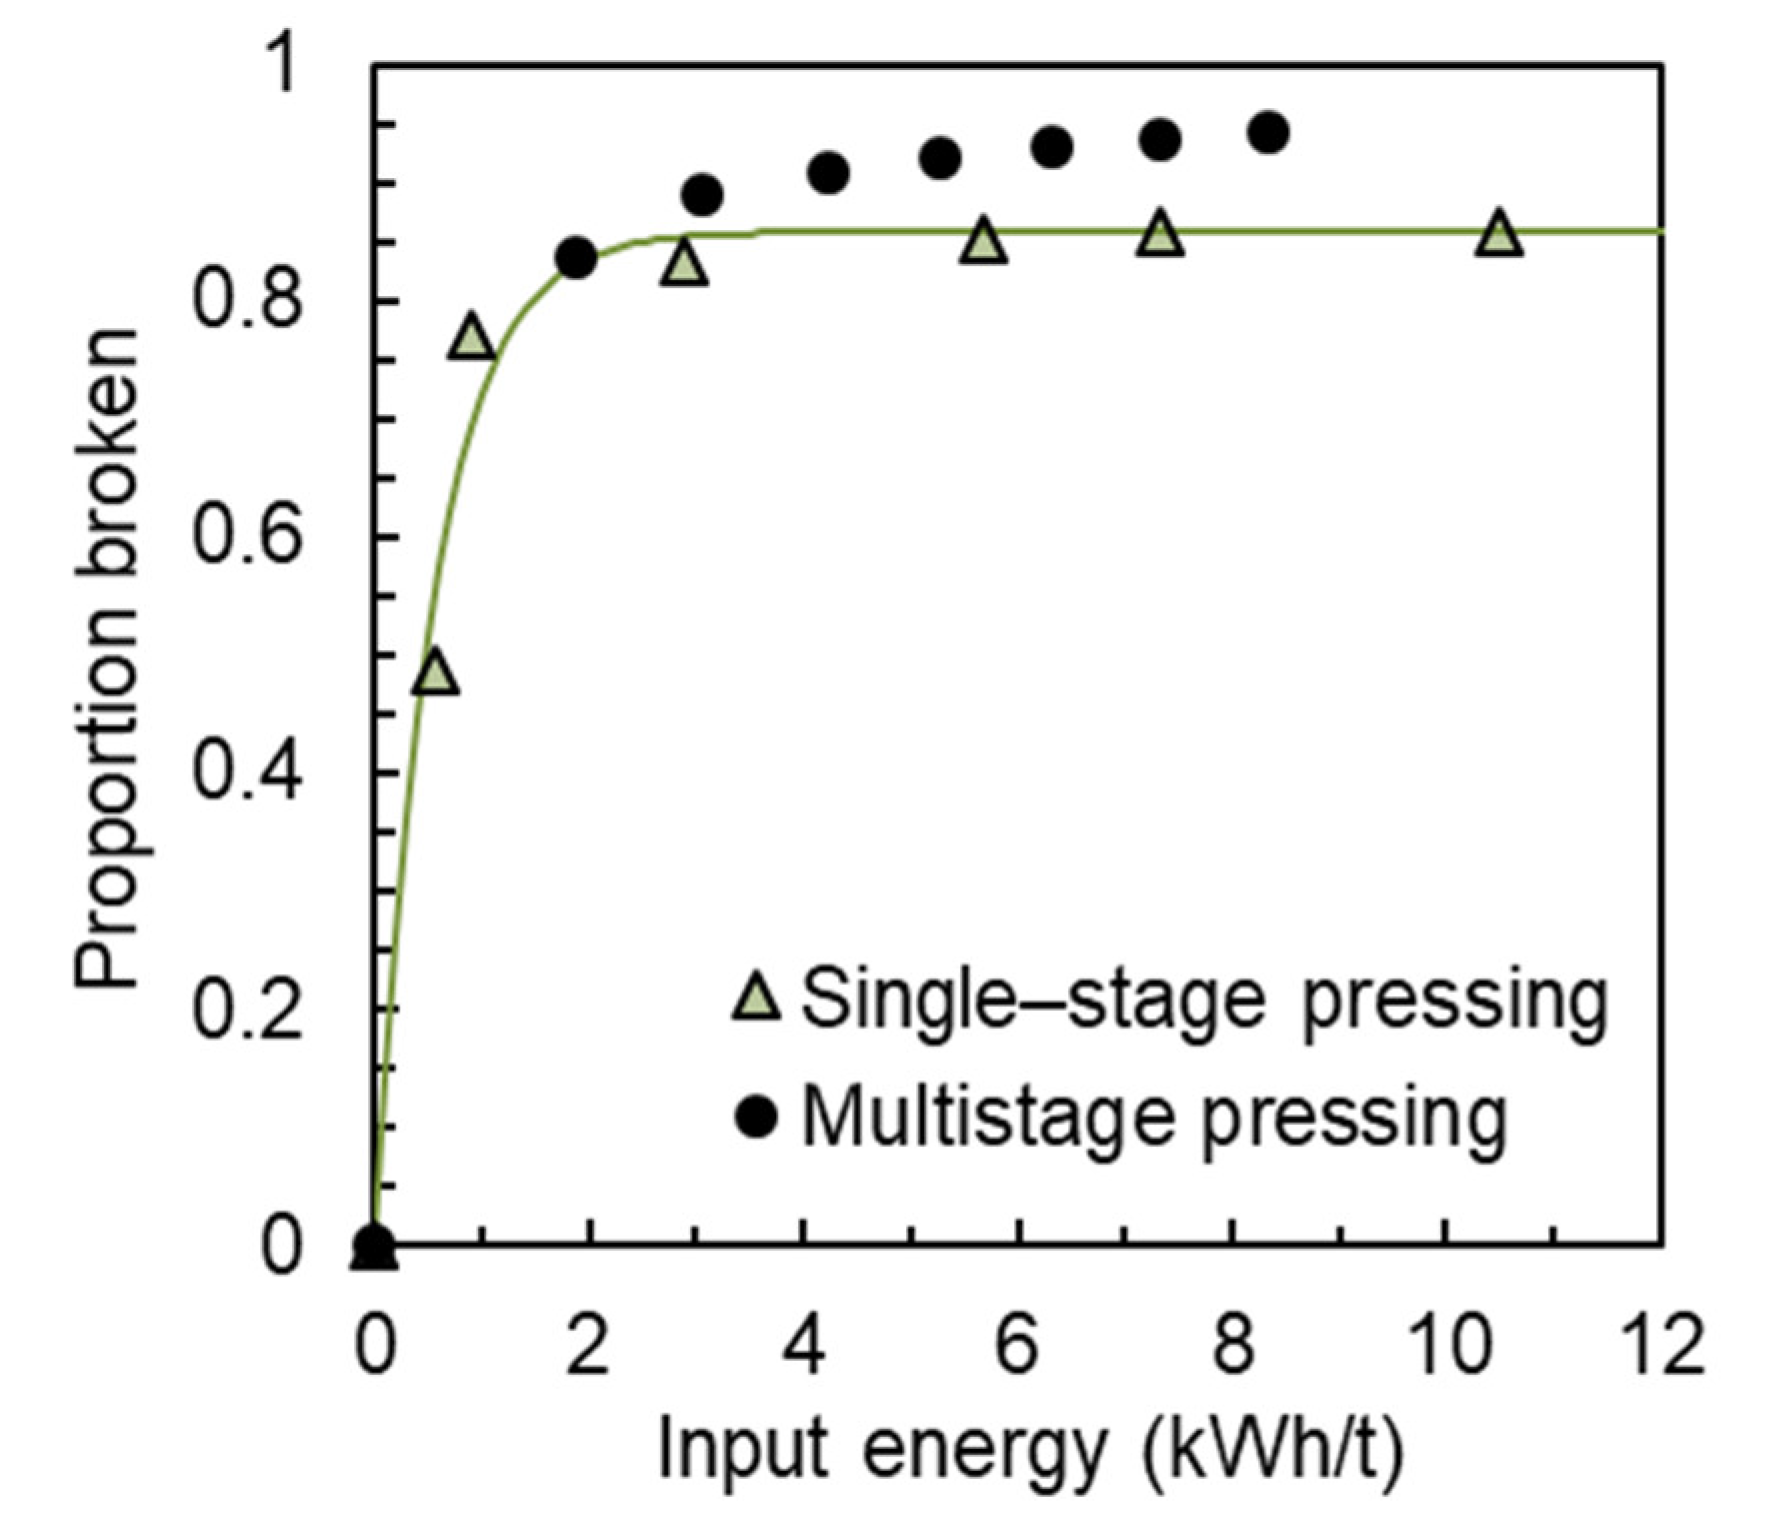
Figure 8 compares results on the proportion broken for the Itabira sample as a function of input energy in individual pressings at progressively higher vertical stresses and results from multistage pressings. It shows that the sequential pressing and dispersion of the material prior to another pressing stage allowed the additional breakage of particles contained in the top size fraction, preventing saturation.
3.5. Blaine Specific Surface Area
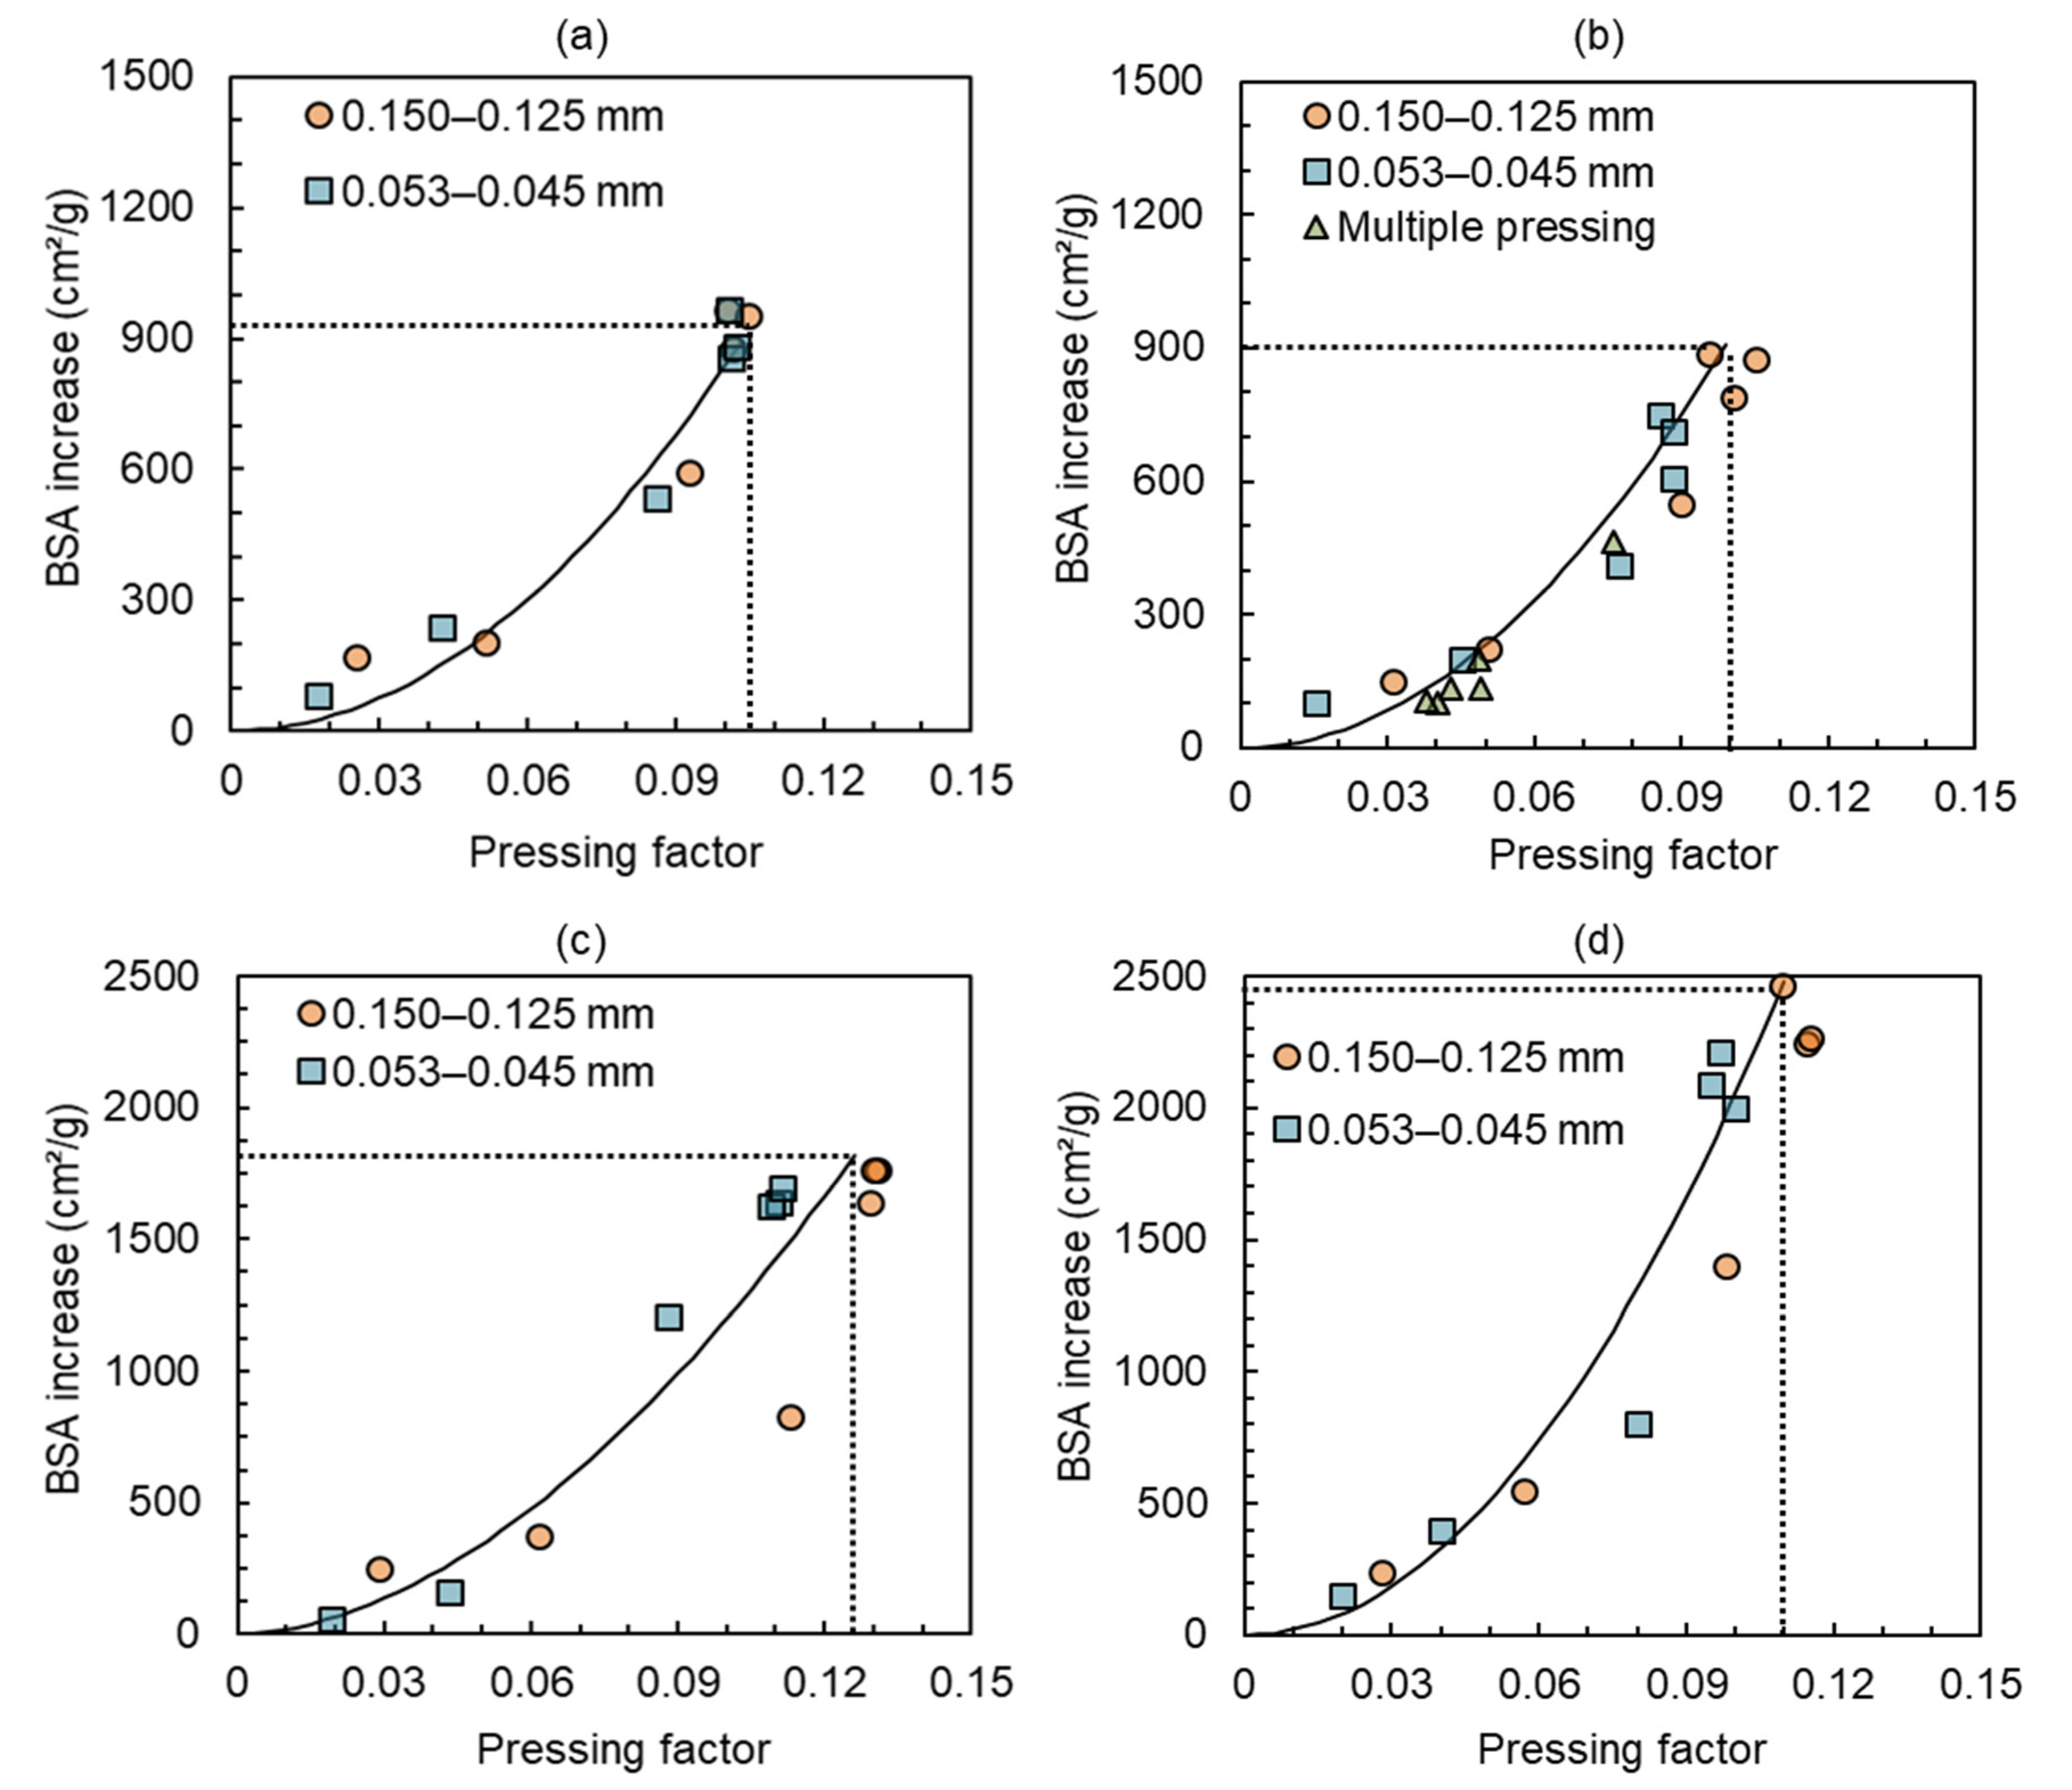
The Blaine specific surface area (BSA), an important parameter used to characterize the fineness of powdered materials, is commonly used to control pellet feed quality in iron ore pelletizing plants [43]. Figure 9 shows the relationship between the BSA increase from the feed BSA and the specific energy applied for all samples in piston-and-die tests. It is evident that the BSA increase is nearly proportional to the input specific energy up to a point, beyond which the slope of the line reduces. As such, in analogy to Figure 7, the data approach a maximum value, but in this case only at specific energy inputs above about 6 kWh/t. Such a value corresponds to maximum vertical loads in the order of 600 kN (480 MPa).
As already reported by Schönert [14] and recently observed by Zhou et al. [38] using DEM simulations, the main cause for the drop in energy efficiency in particle bed breakage is the reduction in the voids that are caused by fine debris relocating themselves as a result of the application of high normal applied stresses. Such a drop in energy efficiency in compressed bed breakage is also evident in Figure 9 for specific energies higher than about 6 kWh/t.
With the aim of analyzing in greater detail the issue of saturation in compressed bed breakage, a comparison between single and multiple pressing results for the Itabira sample is presented in Figure 9b. It compares the results from piston-and-die tests carried out at different maximum pressures to results from multiple compressive cycles at a constant maximum loading force of 200 kN (159 MPa). Dispersion of the material after each pressing cycle allowed reaching significantly higher BSA values than those obtained in a single pass at higher pressures, since the dispersion prevented particles from stabilizing in the bed. This effect becomes noticeable at specific energies above about 3 kWh/t. These results demonstrate the value, for iron ore concentrates, of using multiple passes as a way of increasing the specific surface area of the product, in contrast to a single pass.
Given the various effects observed, including that of the mean particle size, the size distribution of the original material, the degree of its dispersion, and the observed trends towards saturation at higher pressures, a parameter, called pressing factor κ, is proposed to capture the bed propensity to pressing in a test. It is given by the following:
where is the packing density of the originally pressed material and is the final packing density of the bed after unloading the piston, that is, of the permanently deformed bed. varies as a function of particle size and size distribution, degree of dispersion, if previously in loose form or preloaded. In the experiments in the present work, it was estimated from the value corresponding to a preload of 20 MPa, in order to remove any bias due to uneven bed surface in the beginning of the test (Figure 3).
The higher the value of κ, the greater the expected size reduction for a given material. As such, it increases with the increase in pressure and stressing energy applied to the bed, the maximum achievable packing density, whereas it decreases with an increase in initial bed packing density. As such, it acknowledges that pressing results change if the bed was previously loose or preloaded in the beginning of a test.
Figure 10 presents the results from Figure 9, now as a function of the parameter κ. It shows that the increase in Blaine specific surface area varies as a function of parameter κ, relatively independently of initial particle size and final pressure. It demonstrates that it is possible to represent data not only from single but also from multiple pressings (Figure 10b) in the same curve. As such, it suggests that κ is a parameter that may be used to characterize the potential of a material to undergo breakage under confined conditions.
Since data included experiments with narrow size beds that presented the lowest initial packing density and that were subjected to pressures beyond those responsible for breakage saturation (Figure 9), a maximum achievable value of Blaine specific surface area increase in a single loading stage could also be identified, as shown in Figure 10. Such a value corresponded to the maximum achievable magnitude of pressing factor. It varied according to material, being about 0.10–0.11 for Brucutu and Itabira and about 0.11–0.13 for Timbopeba and Carajás, identifying the greater pressing propensity of the latter in comparison to the former (Figure 10).
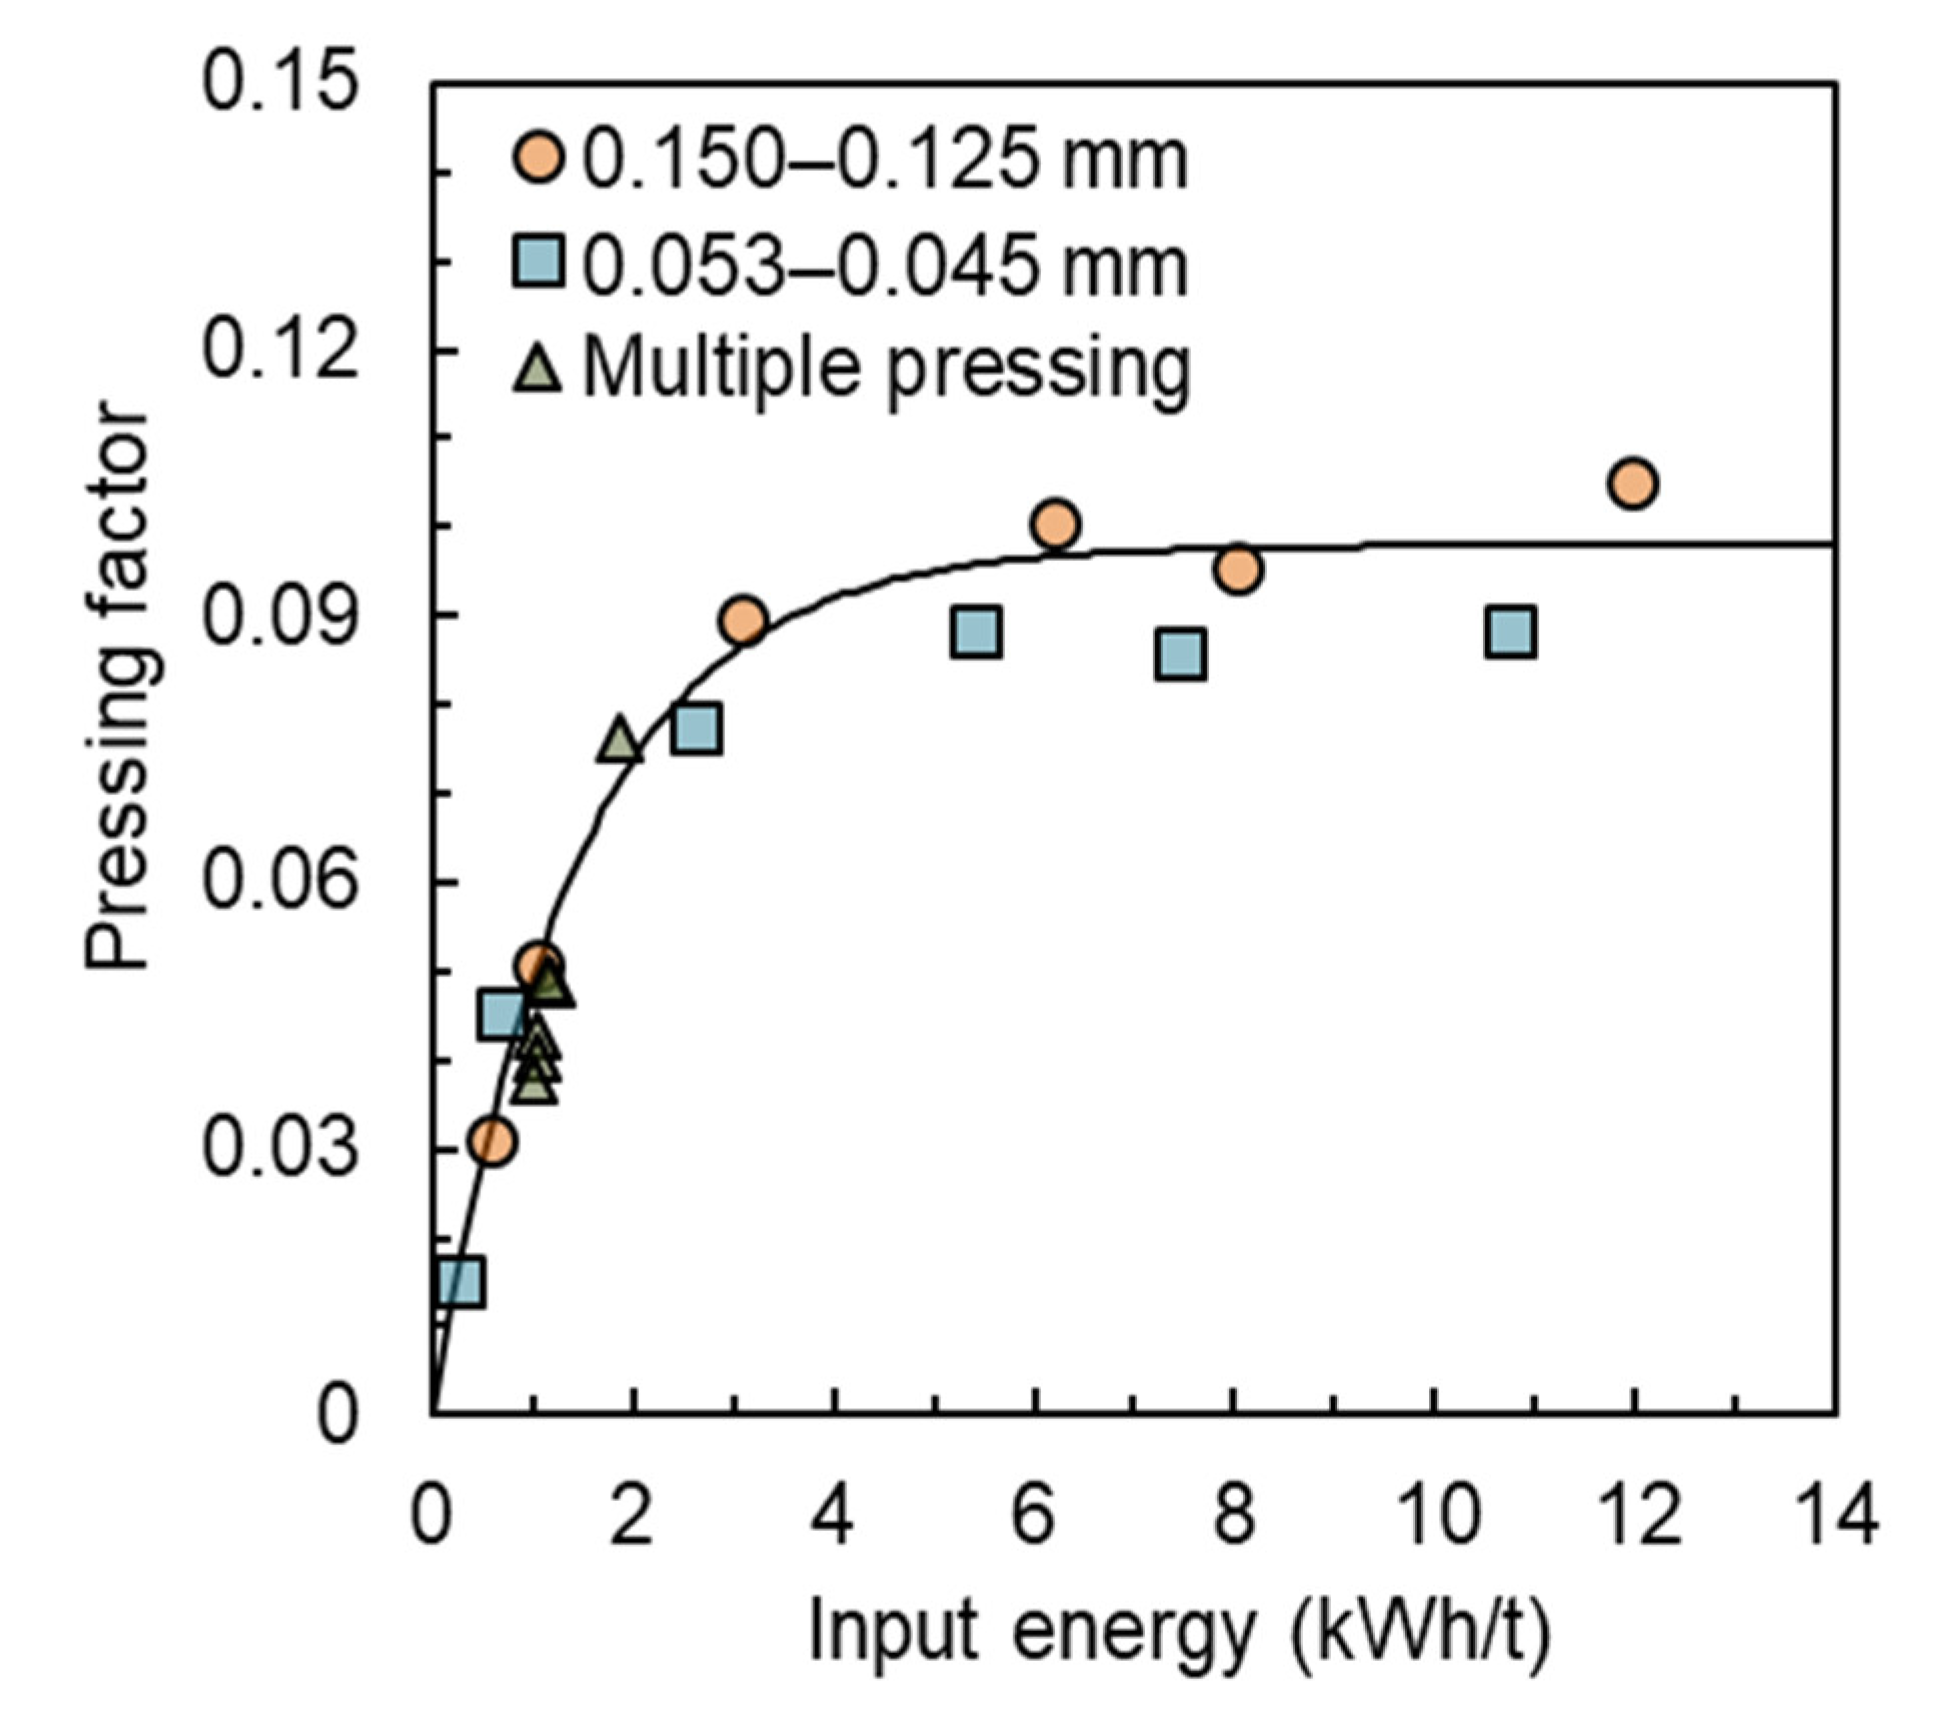
Figure 11 then shows the variation of the pressing factor as a function of the input energy in pressing for one of the samples. It demonstrates that the data, including those from multiple pressings, follow approximately the same general trend, with a maximum pressing factor reached with specific energies above about 6 kWh/t, varying only marginally with initial particle size. Alternatively, the relationship between the pressing factor κ and the input energy could be estimated by a model describing the force–displacement profile for both loading and unloading of the bed [17], which would make the method suitable for predicting results in the piston-and-die apparatus.
3.6. Energy Utilization
Assuming the validity of Rittinger’s law, Rumpf [44] proposed a definition of energy utilization as the ratio between the increment in surface area from the feed and the energy spent in comminution. This definition has been used by Campos et al. [12] with a minor modification presented in Equation (2), from the ratio between the BSA increase and the specific energy spent on the process:
For iron ore pelletizing operations, this relationship is commonly used as a metric for characterizing the comminution process efficiency [12,41].
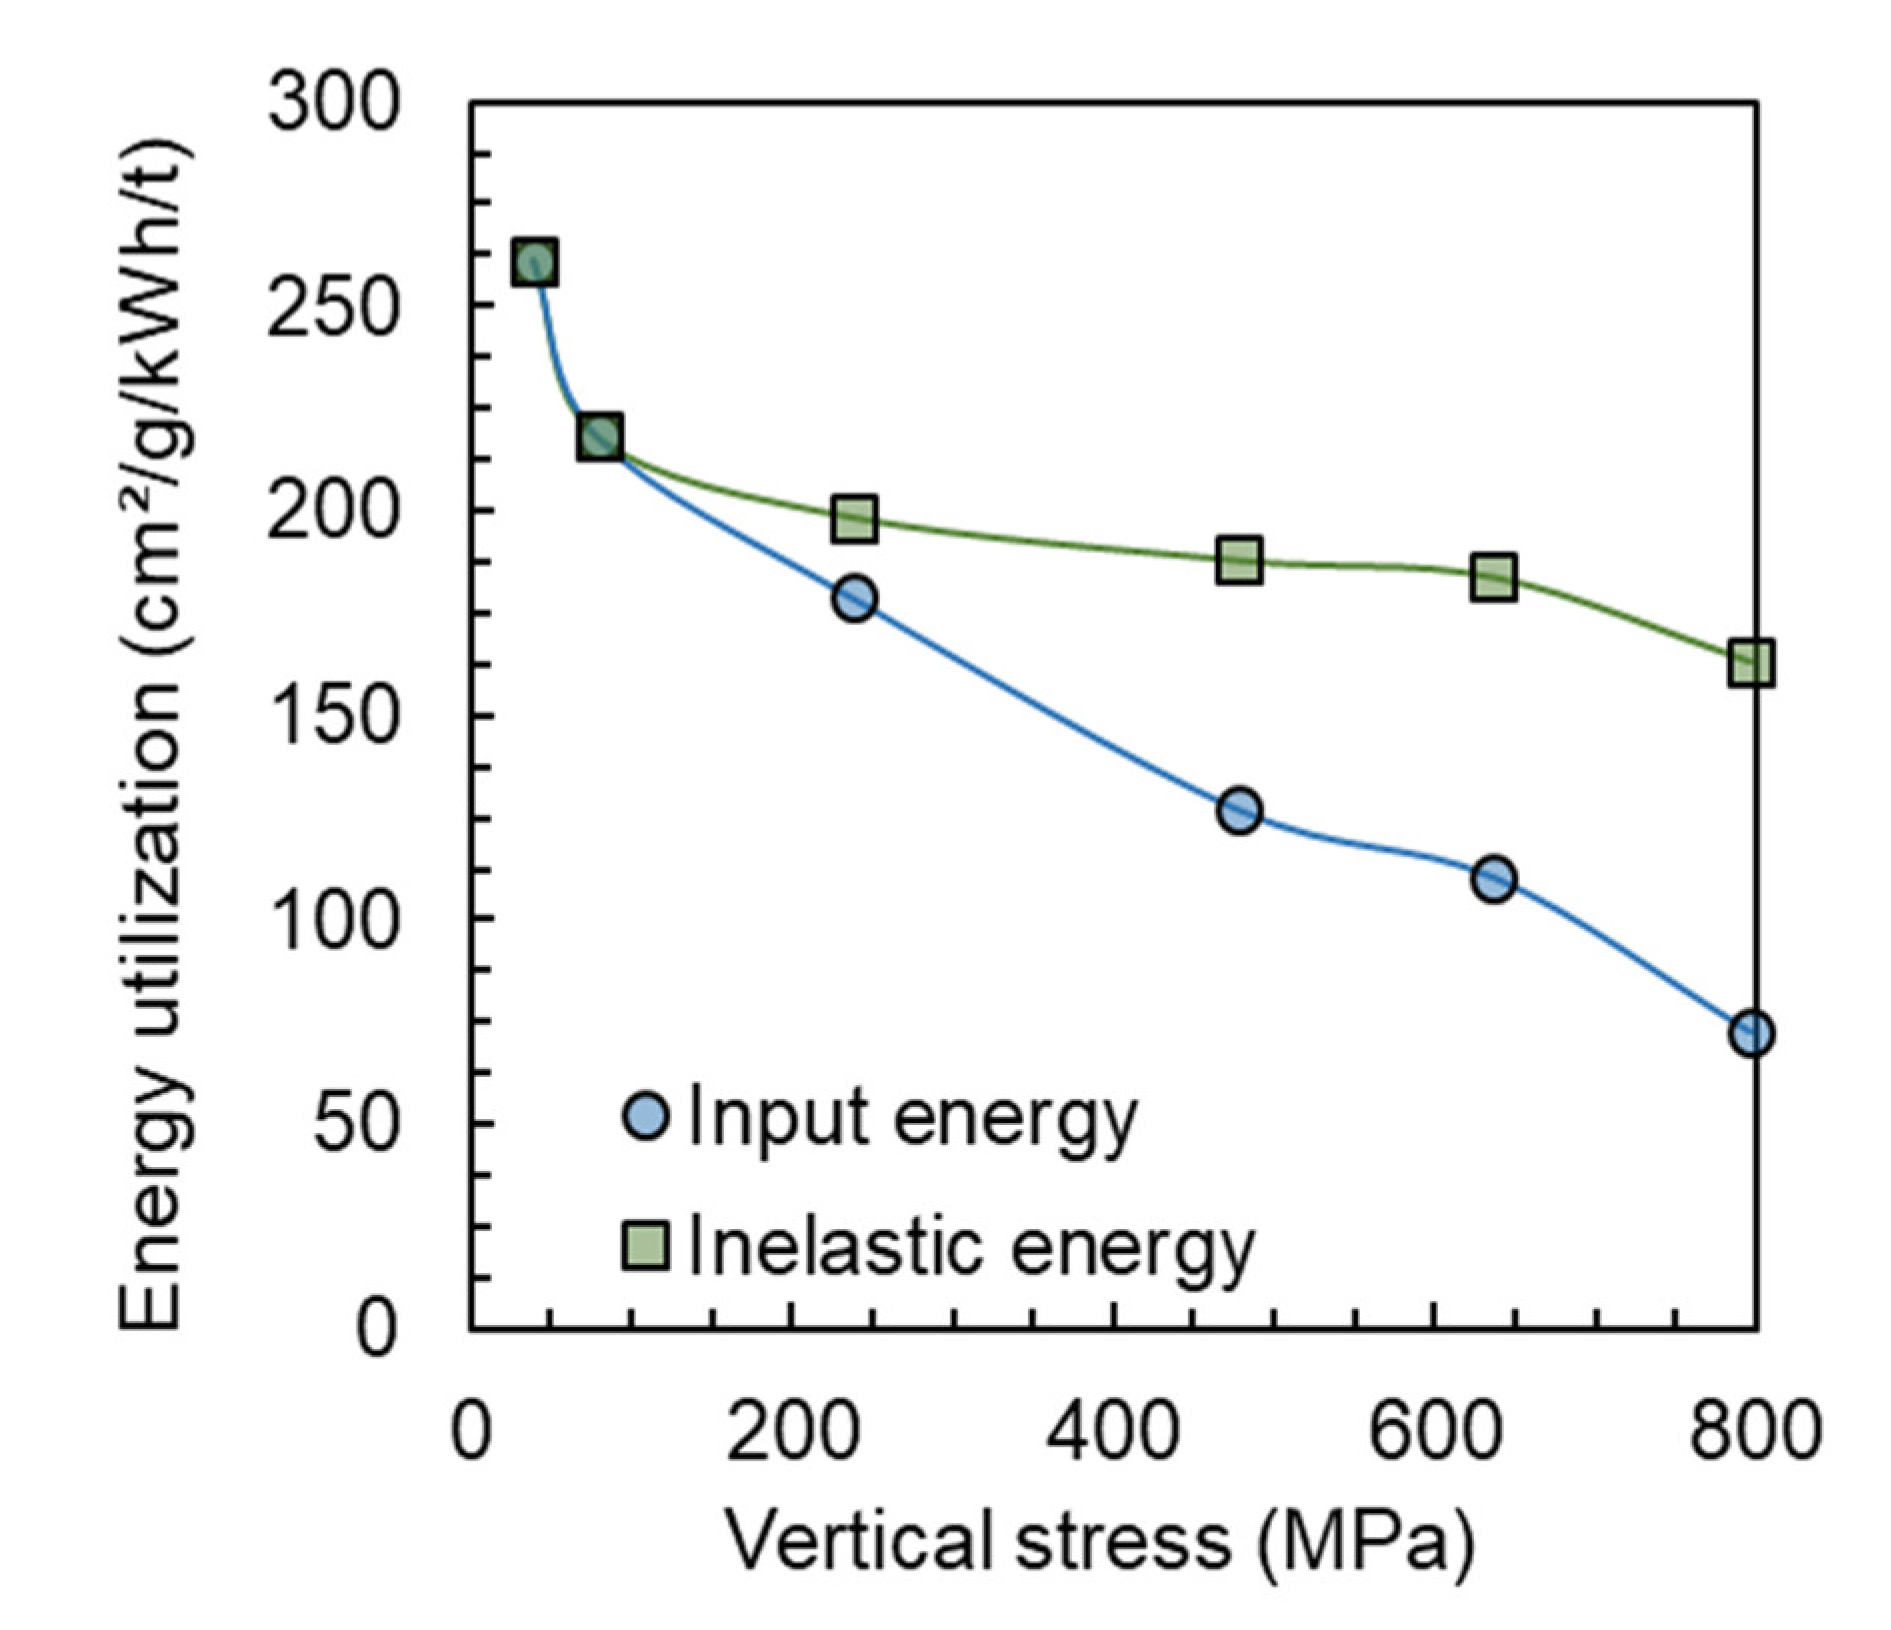
In order to analyze the energy utilization in greater detail, Equation (2) is used considering both the total specific energy consumption and also only the inelastic energy, that is, the result of subtracting the elastic recovery from the input specific energy, as shown in Figure 4. These results are presented in Figure 12, which shows that energy utilization was maximum when the bed was subjected to the lowest pressures. Such high energy utilization at the lowest pressures may be explained by the fact that stressing energy is used to break the most brittle particles contained in the original size range. Figure 12, however, shows that beyond the minimum energy applied, energy utilization decreased, in particular for pressures above 150 MPa, even when the elastic restitution was subtracted from the input stressing energy. This is evidence of the progressively lower energy efficiency in size reduction as beds approach saturation.
4. Discussion
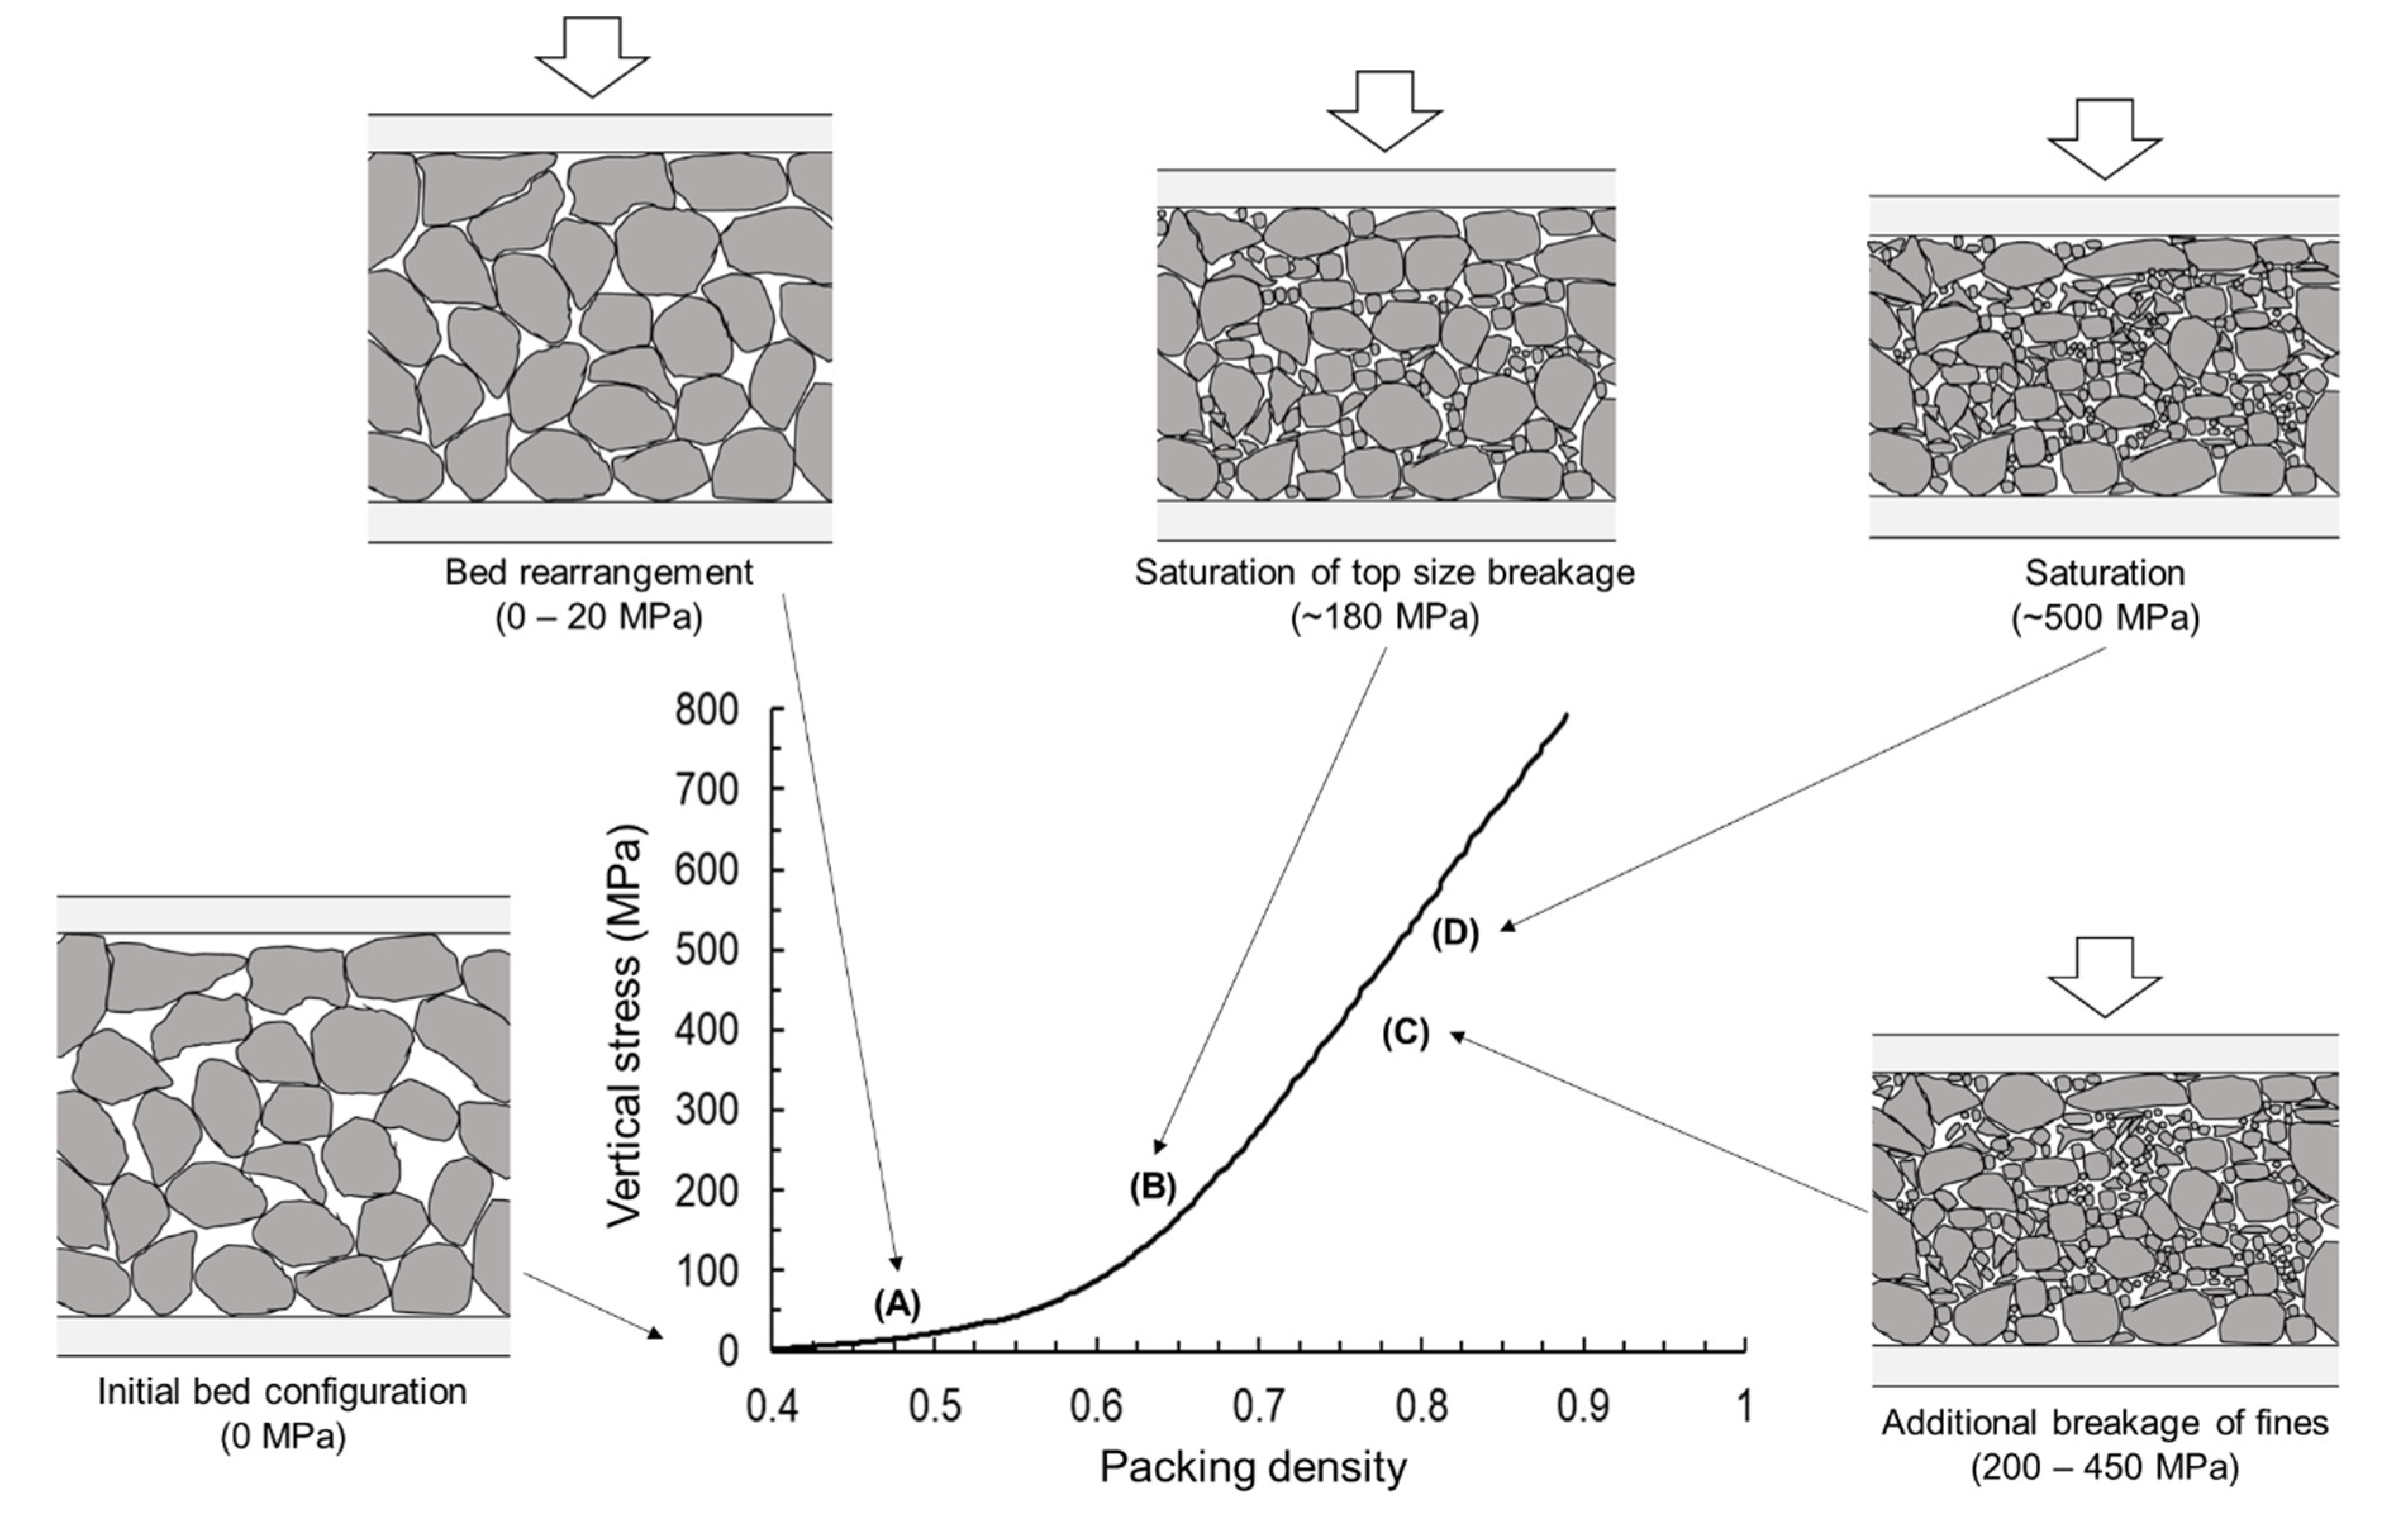
From the various analyses, it becomes feasible to describe the main features observed during the pressing of confined beds containing fine iron ore concentrates. This is illustrated in Figure 13, which shows that the first step in compression of the particle bed corresponds to a rearrangement of the particles, which occurs up to about point A. This key feature can be observed in Figure 3 for the different materials tested and, as already reported by Mütze [23], is associated predominantly with low stress levels (below about 40 MPa), when particles rearrange themselves within the bed by rotating and sliding in respect to each other. This is associated with very low energy inputs but is responsible for reasonable increases in the packing density of the bed.
After initial rearrangement of the bed and within the interval from points A to B in Figure 13, the stress chains connecting the particles are formed, with stresses increasing significantly with deformation. As the critical force or stressing energy required to fracture each of the particles is reached, the weakest particles are progressively broken, leading to a rearrangement of the stress field, which is transmitted by the skeleton formed by the remaining unbroken particles. Point B in the figure corresponds to the saturation in breakage of particles contained in the top size. This occurs at pressures of around 180 MPa (2 kWh/t), as already shown in Figure 7. Such stresses and specific energies would have been sufficient to break all particles contained in the original size, if stressed individually in a micro compression tester [41]. Beyond this point, a proportion of particles contained in the top size, which varied from about 10% for the coarsest sizes tested to about 50% for the finest, remained unbroken, even as stressing energies increased. This is associated with the well-known phenomenon in confined particle bed breakage where the finer debris from breakage of the coarser particles are able to prevent the remaining coarser particles from further breaking [18,23]. The larger proportion of finer particles remaining in comparison to the coarser ones demonstrates the greater ability of the finer particles to dissipate the stresses. Until this point, the bed behaves perfectly inelastically, with all energy applied dissipated in either bed rearrangement or breakage.
The interval from point B to C in Figure 13 corresponds to further breakage of the debris from the initial breakage of the top size material in the case of narrow size beds, with additional increase in fines generation and specific surface area, as is evident in Figure 6 and Figure 9, without additional breakage of particles contained in the top size class. The same effect of saturation in breakage of the top size then appears to happen with progressively finer sizes, as the increase in applied pressures results in only the progressive generation of finer particles.
In the interval from point B to C, deformations start to show an elastic component, with the bed recoiling partially after reaching the maximum stress during loading. As stresses are progressively increased, bed breakage reaches complete saturation at about point D, with no measurable increase in fines generation or specific surface area as a result of applying higher loads. At pressure beyond point D, a substantial increase in the elastic energy stored in the bed, which can correspond to over half of the energy input (Figure 4), is observed. Unlike the interval from A to B, in this interval the increasing inelastic energy is progressively used less in breakage, but more in dissipative phenomena, such as friction, plastic deformation, and interlocking and cold-welding of the particles, forming a tough final agglomerate, quite familiar in tableting studies [30,31,32,33] and consistent with final compaction.
5. Summary and Conclusions
The breakage of beds made up of narrow sizes of iron ore concentrates in confined conditions was studied in great detail. Stress versus relative density curves exhibited deformations that were purely inelastic for pressures of up to about 180 MPa. Up to this value, breakage of the top size fraction increased proportionally with input energy, reaching saturation at about 2 kWh/t. The saturation corresponded to proportions remaining in the top size that were as low as 10% for the 150–125 µm size range and as low as half for the 53–45 µm size range, depending on material.
At higher pressures, breakage of the top size fraction reached a maximum, whereas generation of additional fines from breakage of the progeny from the initially broken particles occurred. In this interval, progressively larger elastic deformations were observed, besides a more modest increase in specific surface area, reaching a point of full bed saturation (compaction) at specific energies beyond about 6 kWh/t, beyond which no increase in BSA occurred. This was evident from the achievement of the maximum increase in BSA under such conditions. Results also show the reasonable difference between the energy utilization calculated on the basis of the input energy and the inelastic energy (elastic energy subtracted from the input energy), even showing that a part of the inelastic energy may be used in dissipative processes such as friction, plastic deformation, and particle packing and not contributing to new surface area generation.
A pressing parameter κ was then proposed to quantify the propensity of a material contained in a bed to reduce in size when loaded under confined conditions. It correlated well with the increase in the Blaine specific surface area for beds with different initial size distributions, including narrow sizes and wide size ranges (multiple pressings) as well as different final pressures. It also captured the bed saturation condition in the maximum achievable value of κ observed in the experiments, which varied from about 0.10 to 013 for the materials studied.
A comparison of stressing at progressively higher pressures and multiple pressings at an intermediate pressure (160 MPa) showed that it is possible to enhance breakage of the top size material, as well as reach higher values of energy utilization, when multiple pressing stages are used. These results provide the technical justification and motivation for the application of multiple stages of pressing in HPGRs.
Author Contributions
Conceptualization, T.M.C., G.B., and L.M.T.; methodology, T.M.C. and G.B.; formal analysis, T.M.C. and L.M.T.; investigation, T.M.C., G.B., and L.M.T.; data curation, T.M.C. and L.M.T.; writing—original draft preparation, T.M.C. and L.M.T.; writing—review and editing, T.M.C., G.B., and L.M.T.; supervision, L.M.T. All authors have read and agreed to the published version of the manuscript.
Funding
This research was funded by Vale S.A. The authors would also like to thank the Brazilian Agencies CNPq (grant number 310293/2017-0) and FAPERJ (grant number E-26/202.574/2019).
Acknowledgments
The authors would like to thank Vale S.A. for financial and technical support for the research.
Conflicts of Interest
The authors declare no conflict of interest.
References
- Kellerwessel, H. High pressure material bed comminution in practice. ZKG Int. 1990, 43, 71–75. [Google Scholar]
- Tamashige, T.; Obana, H.; Hamaguchi, M. Operational results of OK series roller mill. IEEE Trans. Ind. Appl. 1991, 27, 416–424. [Google Scholar] [CrossRef]
- McIvor, R.E. High Pressure Grinding Rolls—A review. In Comminution Practices; Kawatra, S.K., Ed.; SME: Littleton, CO, USA, 1997; pp. 95–98. [Google Scholar]
- Ito, M.; Sato, K.; Naoi, Y. Productivity increase of the vertical roller mill for cement grinding. In Proceedings of the IEEE/PCA Cement Industry Technical Conference. XXXIX Conference Record (Cat. No.97CH36076), Hershey, PA, USA, 20–24 April 1997. [Google Scholar]
- Benzer, H.; Ergun, L.; Lynch, A.J.; Oner, M.; Gunlu, A.; Celik, I.B. Modelling cement grinding circuits. Miner. Eng. 2001, 14, 1469–1482. [Google Scholar] [CrossRef]
- Aydogan, N.A.; Ergun, L.; Benzer, H. High pressure grinding rolls (HPGR) applications in the cement industry. Miner. Eng. 2006, 19, 130–139. [Google Scholar] [CrossRef]
- Altun, D.; Benzer, H.; Aydogan, N.; Gerold, C. Operational parameters affecting the vertical roller mill performance. Miner. Eng. 2017, 103, 67–71. [Google Scholar] [CrossRef]
- Van der Meer, F.P. Roller press grinding of pellet feed: Experiences of KHD in the iron ore industry. In Proceedings of the AusIMM Conference on Iron Ore Resources and Reserves Estimation, Perth, Australia, 25–26 September 1997; pp. 1–15. [Google Scholar]
- Morley, C. High-Pressure Grinding Rolls—A technology review. In Advanced in Comminution, 1st ed.; Kawatra, S.K., Ed.; SME: Littleton, CO, USA, 2006; pp. 15–40. [Google Scholar]
- Michaelis, H.V.O.N. How energy efficient is HPGR? In Proceedings of the World Gold Conference, Gauteng, South Africa, 26–30 October 2009; pp. 7–15. [Google Scholar]
- Powell, M.S.; Hilden, M.M.; Evertsson, C.M.; Asbjörnsson, G.; Benzer, A.H.; Mainza, A.N.; Tavares, L.M.; Davis, B.; Plint, N.; Rule, C. Optimisation opportunities for high pressure grinding rolls circuits. In We Are Metallurgists, Not Magicians! 1st ed.; Australian Institute of Mining and Metallurgy (Organisation): Carlton, Australia, 2017; Volume 1, pp. 483–498. [Google Scholar]
- Campos, T.M.; Bueno, G.; Barrios, G.K.; Tavares, L.M. Pressing iron ore concentrate in a pilot-scale HPGR. Part 1: Experimental results. Miner. Eng. 2019, 140, 105875. [Google Scholar] [CrossRef]
- Thomazini, A.D.; Trés, E.P.; Macedo, F.A.D.; Athayde, M.; Bueno, G.; Fernandes, R.B.; Nunes, R.A.P. Development of a novel grinding process to iron ore pelletizing through HPGR milling in closed circuit. Min. Metall. Explor. 2020, 37, 933–941. [Google Scholar] [CrossRef]
- Schönert, K. The influence of particle bed configurations and confinements on particle breakage. Int. J. Miner. Process. 1996, 44, 1–16. [Google Scholar] [CrossRef]
- Kalala, J.T.; Dong, H.; Hinde, A.L. Using piston die tests to predict the breakage behavior of HPGR. In Proceedings of the 5th International Conference Autogenous and Semi-Autogenous Grinding, Vancouver, BC, Canada, 25–28 September 2011; pp. 1–12. [Google Scholar]
- Schubert, H. Zu Einigen Fragen der Kollektivzerkleinerung. Chem. Technol. 1967, 19, 595–598. [Google Scholar]
- Mütze, T. Energy dissipation in particle bed comminution. Int. J. Miner. Process. 2015, 136, 15–19. [Google Scholar] [CrossRef]
- Liu, J.; Schönert, K. Modelling of interparticle breakage. Int. J. Miner. Process. 1996, 44, 101–115. [Google Scholar] [CrossRef]
- Fuerstenau, D.W.; Gutsche, O.; Kapur, P.C. Confined particle bed comminution under compressive loads. Int. J. Miner. Process. 1996, 44, 521–537. [Google Scholar] [CrossRef]
- Mütze, T.; Husemann, K. Compressive stress: Effect of stress velocity on confined particle bed comminution. Chem. Eng. Res. Design 2008, 86, 379–383. [Google Scholar] [CrossRef]
- Dundar, H.; Benzer, H.; Aydogan, N. Application of population balance model to HPGR crushing. Miner. Eng. 2013, 50, 114–120. [Google Scholar] [CrossRef]
- Davaanyam, Z. Piston Press Test Procedures for Predicting Energy-Size Reduction of High Pressure Grinding Rolls. Ph.D. Thesis, University of British Columbia, Vancouver, BC, Canada, 2015. [Google Scholar]
- Mütze, T. Modelling the stress behaviour in particle bed comminution. Int. J. Miner. Process. 2016, 156, 14–23. [Google Scholar] [CrossRef]
- Benzer, H.; Dundar, H.; Altun, O.; Tavares, L.M.; Mazzinghy, D.B.; Russo, J.C. HPGR simulation from piston-die tests with an itabirite ore. REM Int. Eng. J. 2017, 70, 99–107. [Google Scholar] [CrossRef] [Green Version]
- Train, D. An investigation into the compaction of powders. J. Pharm. Pharmacol. 1956, 8, 745–761. [Google Scholar] [CrossRef]
- Heckel, R.W. Density–pressure relationships in powder compaction. Trans. Metall. Soc. AIME 1961, 221, 671–675. [Google Scholar]
- Cooper, A.R.; Eaton, L.E. Compaction behavior of several ceramic powders. J. Am. Ceram. Soc. 1962, 45, 97–101. [Google Scholar] [CrossRef]
- Wünsch, I.; Finke, J.H.; John, E.; Juhnke, M.; Kwade, A. A mathematical approach to consider solid compressibility in the compression of pharmaceutical powders. Pharmaceutics 2019, 11, 121. [Google Scholar] [CrossRef] [Green Version]
- Cabiscol, R.; Shi, H.; Wünsch, I.; Magnanimo, V.; Finke, J.H.; Luding, S.; Kwade, A. Effect of particle size on powder compaction and tablet strength using limestone. Adv. Powder Technol. 2020, 31, 1280–1289. [Google Scholar] [CrossRef]
- Kawakita, K.; Lüdde, K.H. Some considerations on powder compression equations. Powder Technol. 1971, 4, 61–68. [Google Scholar] [CrossRef]
- Armstrong, N.A.; Haines-Nutt, R.F. Elastic recovery and surface area changes in compacted powder systems. Powder Technol. 1974, 9, 287–290. [Google Scholar] [CrossRef]
- Vachon, M.G.; Chulia, D. The use of energy indices in estimating powder compaction functionality of mixtures in pharmaceutical tableting. Int. J. Pharm. 1999, 177, 183–200. [Google Scholar] [CrossRef]
- Patel, S.; Kaushal, A.M.; Bansal, A.K. Effect of particle size and compression force on compaction behavior and derived mathematical parameters of compressibility. Pharm. Res. 2007, 24, 111–124. [Google Scholar] [CrossRef]
- Tye, C.K.; Sun, C.C.; Amidon, G.E. Evaluation of the effects of tableting speed on the relationships between compaction pressure, tablet tensile strength, and tablet solid fraction. J. Pharm. Sci. 2005, 94, 465–472. [Google Scholar] [CrossRef]
- David, S.T.; Augsburger, L.L. Plastic flow during compression of directly compressible fillers and its effect on tablet strength. J. Pharm. Sci. 1977, 66, 155–159. [Google Scholar] [CrossRef]
- Podczeck, F.; Sharma, M. The influence of particle size and shape of components of binary powder mixtures on the maximum volume reduction due to packing. Int. J. Pharm. 1996, 137, 41–47. [Google Scholar] [CrossRef]
- Garner, S.; Strong, J.; Zavaliangos, A. Study of the die compaction of powders to high relative densities using the discrete element method. Powder Technol. 2018, 330, 357–370. [Google Scholar] [CrossRef]
- Zhou, W.; Wang, D.; Ma, G.; Cao, X.; Hu, C.; Wu, W. Discrete element modeling of particle breakage considering different fragment replacement modes. Powder Technol. 2020, 360, 312–323. [Google Scholar] [CrossRef]
- Barrios, G.K.; Jiménez-Herrera, N.; Tavares, L.M. Simulation of particle bed breakage by slow compression and impact using a DEM particle replacement model. Adv. Powder Technol. 2020, 31, 2749–2758. [Google Scholar] [CrossRef]
- Schönert, K. Physical and technical aspects of very and micro fine grinding. In Proceedings of the 2nd World Congress Particle Technology, Society of Technology, Kyoto, Japan, 19–22 September 1990; pp. 557–571. [Google Scholar]
- Campos, T.M.; Bueno, G.; Alfonso, V.R.; Mayerhofer, F.; Kwade, A.; Tavares, L.M. Relationships between particle breakage characteristics and comminution response of fine iron ore concentrates. Miner. Eng. 2020. submitted for publication. [Google Scholar]
- Tavares, L.M. Particle weakening in high-pressure roll grinding. Miner. Eng. 2005, 18, 651–657. [Google Scholar] [CrossRef]
- Meyer, K. Pelletizing of Iron Ores, 1st ed.; Springer: New York, NY, USA, 1980. [Google Scholar]
- Rumpf, H. Physical aspects of comminution and new formulation of a law of comminution. Powder Technol. 1973, 7, 145–159. [Google Scholar] [CrossRef]
Figure 1.
Press used in the piston-and-die tests highlighting the linear variable differential transformer (LVDT) used to measure the (a) particle bed displacement and (b) piston and die apparatus.
Figure 1.
Press used in the piston-and-die tests highlighting the linear variable differential transformer (LVDT) used to measure the (a) particle bed displacement and (b) piston and die apparatus.

Figure 2.
Load and unload force-displacement curves in tests up to different applied compressive forces for the Itabira sample contained in the size range of 150–125 µm.
Figure 2.
Load and unload force-displacement curves in tests up to different applied compressive forces for the Itabira sample contained in the size range of 150–125 µm.

Figure 3.
Relationship between the vertical stress and the packing density for different compressive forces applied for the (a) Itabira and (b) Carajás samples in the narrow size range of 150–125 µm.
Figure 3.
Relationship between the vertical stress and the packing density for different compressive forces applied for the (a) Itabira and (b) Carajás samples in the narrow size range of 150–125 µm.

Figure 4.
Variation of the input, elastic, and dissipated energy in the particle bed as a function of vertical stress for the Itabira sample for the narrow size range of 150–125 µm.
Figure 4.
Variation of the input, elastic, and dissipated energy in the particle bed as a function of vertical stress for the Itabira sample for the narrow size range of 150–125 µm.

Figure 5.
Relationship between vertical stress and packing density for different stages of pressing for the Itabira sample in a narrow size range of 106–75 µm.
Figure 5.
Relationship between vertical stress and packing density for different stages of pressing for the Itabira sample in a narrow size range of 106–75 µm.

Figure 6.
Product size distributions for different maximum compressive forces for the (a) Brucutu and (b) Carajás samples contained in the size range of 150–125 µm in piston-and-die tests.
Figure 6.
Product size distributions for different maximum compressive forces for the (a) Brucutu and (b) Carajás samples contained in the size range of 150–125 µm in piston-and-die tests.

Figure 7.
Proportion broken out of the original size for (a) Brucutu and (b) Carajás samples for different specific energies and feed particle sizes.
Figure 7.
Proportion broken out of the original size for (a) Brucutu and (b) Carajás samples for different specific energies and feed particle sizes.

Figure 8.
Proportion broken out of the original size for the Itabira sample in the narrow particle size range of 106–75 µm for single-stage pressing and multistage pressing. Line fits data from single-stage pressing.
Figure 8.
Proportion broken out of the original size for the Itabira sample in the narrow particle size range of 106–75 µm for single-stage pressing and multistage pressing. Line fits data from single-stage pressing.

Figure 9.
Relationship between Blaine specific surface area (BSA) increase and specific input energy for (a) Brucutu, (b) Itabira, (c) Timbopeba, and (d) Carajás samples.
Figure 9.
Relationship between Blaine specific surface area (BSA) increase and specific input energy for (a) Brucutu, (b) Itabira, (c) Timbopeba, and (d) Carajás samples.

Figure 10.
Relationship between BSA increase and pressing factor κ for the (a) Brucutu, (b) Itabira, (c) Timbopeba, and (d) Carajás samples.
Figure 10.
Relationship between BSA increase and pressing factor κ for the (a) Brucutu, (b) Itabira, (c) Timbopeba, and (d) Carajás samples.

Figure 11.
Relationship between the factor κ and specific input energy for the Itabira sample, including data for single and multiple pressings (106–75 μm).
Figure 11.
Relationship between the factor κ and specific input energy for the Itabira sample, including data for single and multiple pressings (106–75 μm).

Figure 12.
Comparison of energy utilization for different applied vertical stresses for the Itabira sample for the narrow size range of 150–125 µm, considering both the input and the inelastic energy.
Figure 12.
Comparison of energy utilization for different applied vertical stresses for the Itabira sample for the narrow size range of 150–125 µm, considering both the input and the inelastic energy.

Figure 13.
Schematic summarizing the main features of the particle bed pressing behavior of fine iron ore particles.
Figure 13.
Schematic summarizing the main features of the particle bed pressing behavior of fine iron ore particles.


Table 1.
Summary of physical characteristics of the samples.
| Sample | Specific Gravity (g/cm3) | Apparent Density (g/cm3) |
|---|---|---|
| Itabira | 5.07 | 3.01 |
| Brucutu | 5.03 | 3.02 |
| Timbopeba | 4.80 | 2.85 |
| Carajás | 4.55 | 2.70 |
© 2020 by the authors. Licensee MDPI, Basel, Switzerland. This article is an open access article distributed under the terms and conditions of the Creative Commons Attribution (CC BY) license (http://creativecommons.org/licenses/by/4.0/).
Share and Cite
MDPI and ACS Style
Campos, T.M.; Bueno, G.; Tavares, L.M. Confined Bed Breakage of Fine Iron Ore Concentrates. Minerals 2020, 10, 666. https://doi.org/10.3390/min10080666
AMA Style
Campos TM, Bueno G, Tavares LM. Confined Bed Breakage of Fine Iron Ore Concentrates. Minerals. 2020; 10(8):666. https://doi.org/10.3390/min10080666
Chicago/Turabian StyleCampos, Túlio M., Gilvandro Bueno, and Luís Marcelo Tavares. 2020. "Confined Bed Breakage of Fine Iron Ore Concentrates" Minerals 10, no. 8: 666. https://doi.org/10.3390/min10080666
Note that from the first issue of 2016, this journal uses article numbers instead of page numbers. See further details here.