1. Introduction
A requirement for the industrial success of offshore renewable energy systems is to ensure operation that is at the same time economically profitable and reliable. Not surprisingly, such objectives are usually competing, particularly for floating wave energy systems that have to withstand spurious very harsh environmental conditions, while also operating efficiently during most common mild sea states. In this respect, the mooring system is especially crucial as it ensures station-keeping, in both operational and extreme conditions, while also, ideally, not affecting power absorption. In addition, the mooring system represents a significant portion of the total capital expenditure, with a strong impact on the final cost of energy delivered [
1]. There are some guidelines provided by the EquiMar [
2,
3] project, which wants to establish a pre-normative wave energy converters (WECs) design phase considering all the aspects of design, from life cycle assessment (LCA) to tank testing and survivability problem.
There is a widespread consensus in the wave energy community that mooring system design and modelling is one of the major challenges that still needs to be overcome [
4,
5,
6]. In fact, although literature and design guidelines for conventional ocean engineering applications are abundant [
7,
8,
9], they often do not meet the device-specific requirements of wave energy conversion. The design, optimisation and assessment of mooring systems require both mathematical models and experimental validation. Design phases for mooring system are provided in the literature by, for example, the work in [
10], which describes a mooring system optimisation model to find the cheapest solution to ultimate, fatigue and accidental limit state problems for four different WECs. Different modelling approaches are available [
11], with pros and cons according to the specific objective of the analysis: while extensive parametric optimisation studies have the mandatory requirement of flexibility and low computational time, with low-medium demand on accuracy, survivability assessment prioritise fidelity of load reproduction with little constraint on computational burden [
12].
Models applied to WECs may be static [
13], quasi-static [
14,
15,
16,
17] and dynamic [
18]. The latter can be classified for spatial discretisation (lumped mass [
19], finite differences [
20] or finite element [
21]). On the one hand, some established commercial software are borrowed from traditional ocean engineering applications and applied to the wave energy case [
22,
23]; on the other hand, some novel approaches are being developed in-house and/or in an open source fashion [
24,
25]. One of the objectives and novelties of this paper is to critically compare different modelling approaches, presenting advantages and limitations, quantifying their relative accuracy and providing preliminary guidelines on the important parameters to correctly set-up each model. In fact, the authors of [
11] point out that a limited amount of analysis has been performed for the WEC application case. A method for validation and numerical modelling (using OrcaFlex [
23]) for WEC moorings systems for a floating WEC is proposed in [
26]. Different simulation procedures are investigated in [
27] using Moody [
28]. Different nonlinear effects in different software (AQWA, SIMA and OrcaFlex) are considered in [
29] for a WEC. Finally, the work in [
30], using MoorDyn and AQWA for the ISWEC device, points out that finding a suitable mooring line model, in terms of compromise between accuracy and the corresponding computational burden of the simulation, is one major challenge in the device development. In this paper, three different models are considered: a quasi-static (QS) ad hoc model, already used in [
31]; the open source software MoorDyn [
32]; and the commercial software OrcaFlex [
23]. Such modelling approaches are retained to be representative of the accuracy/complexity continuum, starting from the simplest QS model, also considering a dynamic open source code, building up to the industry-standard software OrcaFlex.
A particular application case is considered, as experimental data for validation and benchmarking are available: a 1:32 scale model of the Spar-Buoy oscillating water column (OWC) device [
33], tested in the COAST laboratory ocean basin (Plymouth, UK) [
34]. The system is composed of a floating buoy, anchored by three semi-taut mooring lines, each one comprising of an anchor, a jumper (or riser) and a clump weight. Such a configuration is popular in wave energy applications, as it ensures station-keeping while having little effect on the degree of freedom used to convert energy, either heave [
33] or pitch [
35], as shown in various experimental campaigns [
36,
37], while also providing yaw restraint [
38]. An experimental campaign Spar-Buoy was provided by a PTO, but its damping does not influence the work of the paper because kinematic was used as input device. Anyway, PTO effects principally heave motion [
15] and mooring line tension is mainly caused by surge and sway motion.
One of the main challenges to overcome when comparing different mathematical models is the difficulty, or even impossibility, to separate effects in order to clearly identify connections of causality. In particular, the response of the device to incoming waves mainly depends on its hydrodynamics and the interaction with the mooring system; likewise, loads on the mooring systems depend on the device kinematics. Therefore, if the mathematical model takes the wave as input and the kinematics as output, the validation and comparison of different mooring models is effective and meaningful only if the hydrodynamic interactions are reliably described. However, different collaborative projects [
39,
40] highlight the difficulties of generating a reliable hydrodynamic model, due to nonlinearities related to changing wetted surface [
41], dynamic instabilities [
42], viscosity [
43] and other device dependent nonlinear effects or losses [
44]. This is particularly true for wave energy applications, as the controller enhances the motion, thus nonlinearities, in order to maximise power extraction [
45,
46].
Therefore, in order to break the chain of modelling uncertainties and inaccuracies, the kinematic response recorded in the experimental tests is taken as a known input. Normal operational conditions are considered, in order to assess the accuracy of the mooring model during power production. For considering the survivability problem, a QS approach could be insufficient because WEC dynamics in extreme conditions and line snap events require a more accurate modelling approach [
47,
48]; however, survivability analysis are outside the scope of this work The reminder of the paper is organised as follows.
Section 2 describes in detail the experimental campaign.
Section 3 provides a brief critical description of mathematical models for mooring systems.
Section 4 presents the relative comparison between models and validation with experimental data, while
Section 5 offers a deeper analysis of the results. Finally, some concluding remarks are given in
Section 6.
2. Experimental Set-Up
The experimental testing campaign of the Spar-buoy OWC was carried out at the COAST laboratory ocean basin (Plymouth, UK), considering a 1:32 model scale model. The wave basin width and length are 15.5 m and the 35 m, respectively, while the water depth is adjustable up to 3 m, thanks to a movable floor. For the testing of the Spar-buoy OWC model, a water depth of 2.5 m was considered, corresponding to 80 m at full scale. Wave generation was performed through 24 individually controlled hinged flap paddles, also with wave absorption capability. The dissipative beach has a convex shape in order to improve wave absorption capabilities. Regular and irregular long-crested waves are considered in this work, as summarised in
Table 1. Note that some of the wave conditions (ID 1, 2, 3, 4, 23, 24 and 27, shown in bold in
Table 1) induce the system into parametric resonance, resulting in a 6-DoF response, despite of a planar wave excitation [
31].
Scaling of the geometry and testing conditions follow the Froude criterion, based on the 16 m diameter and 48 m draft device, optimised for a wave climate from a location off the Portuguese western coast [
49].
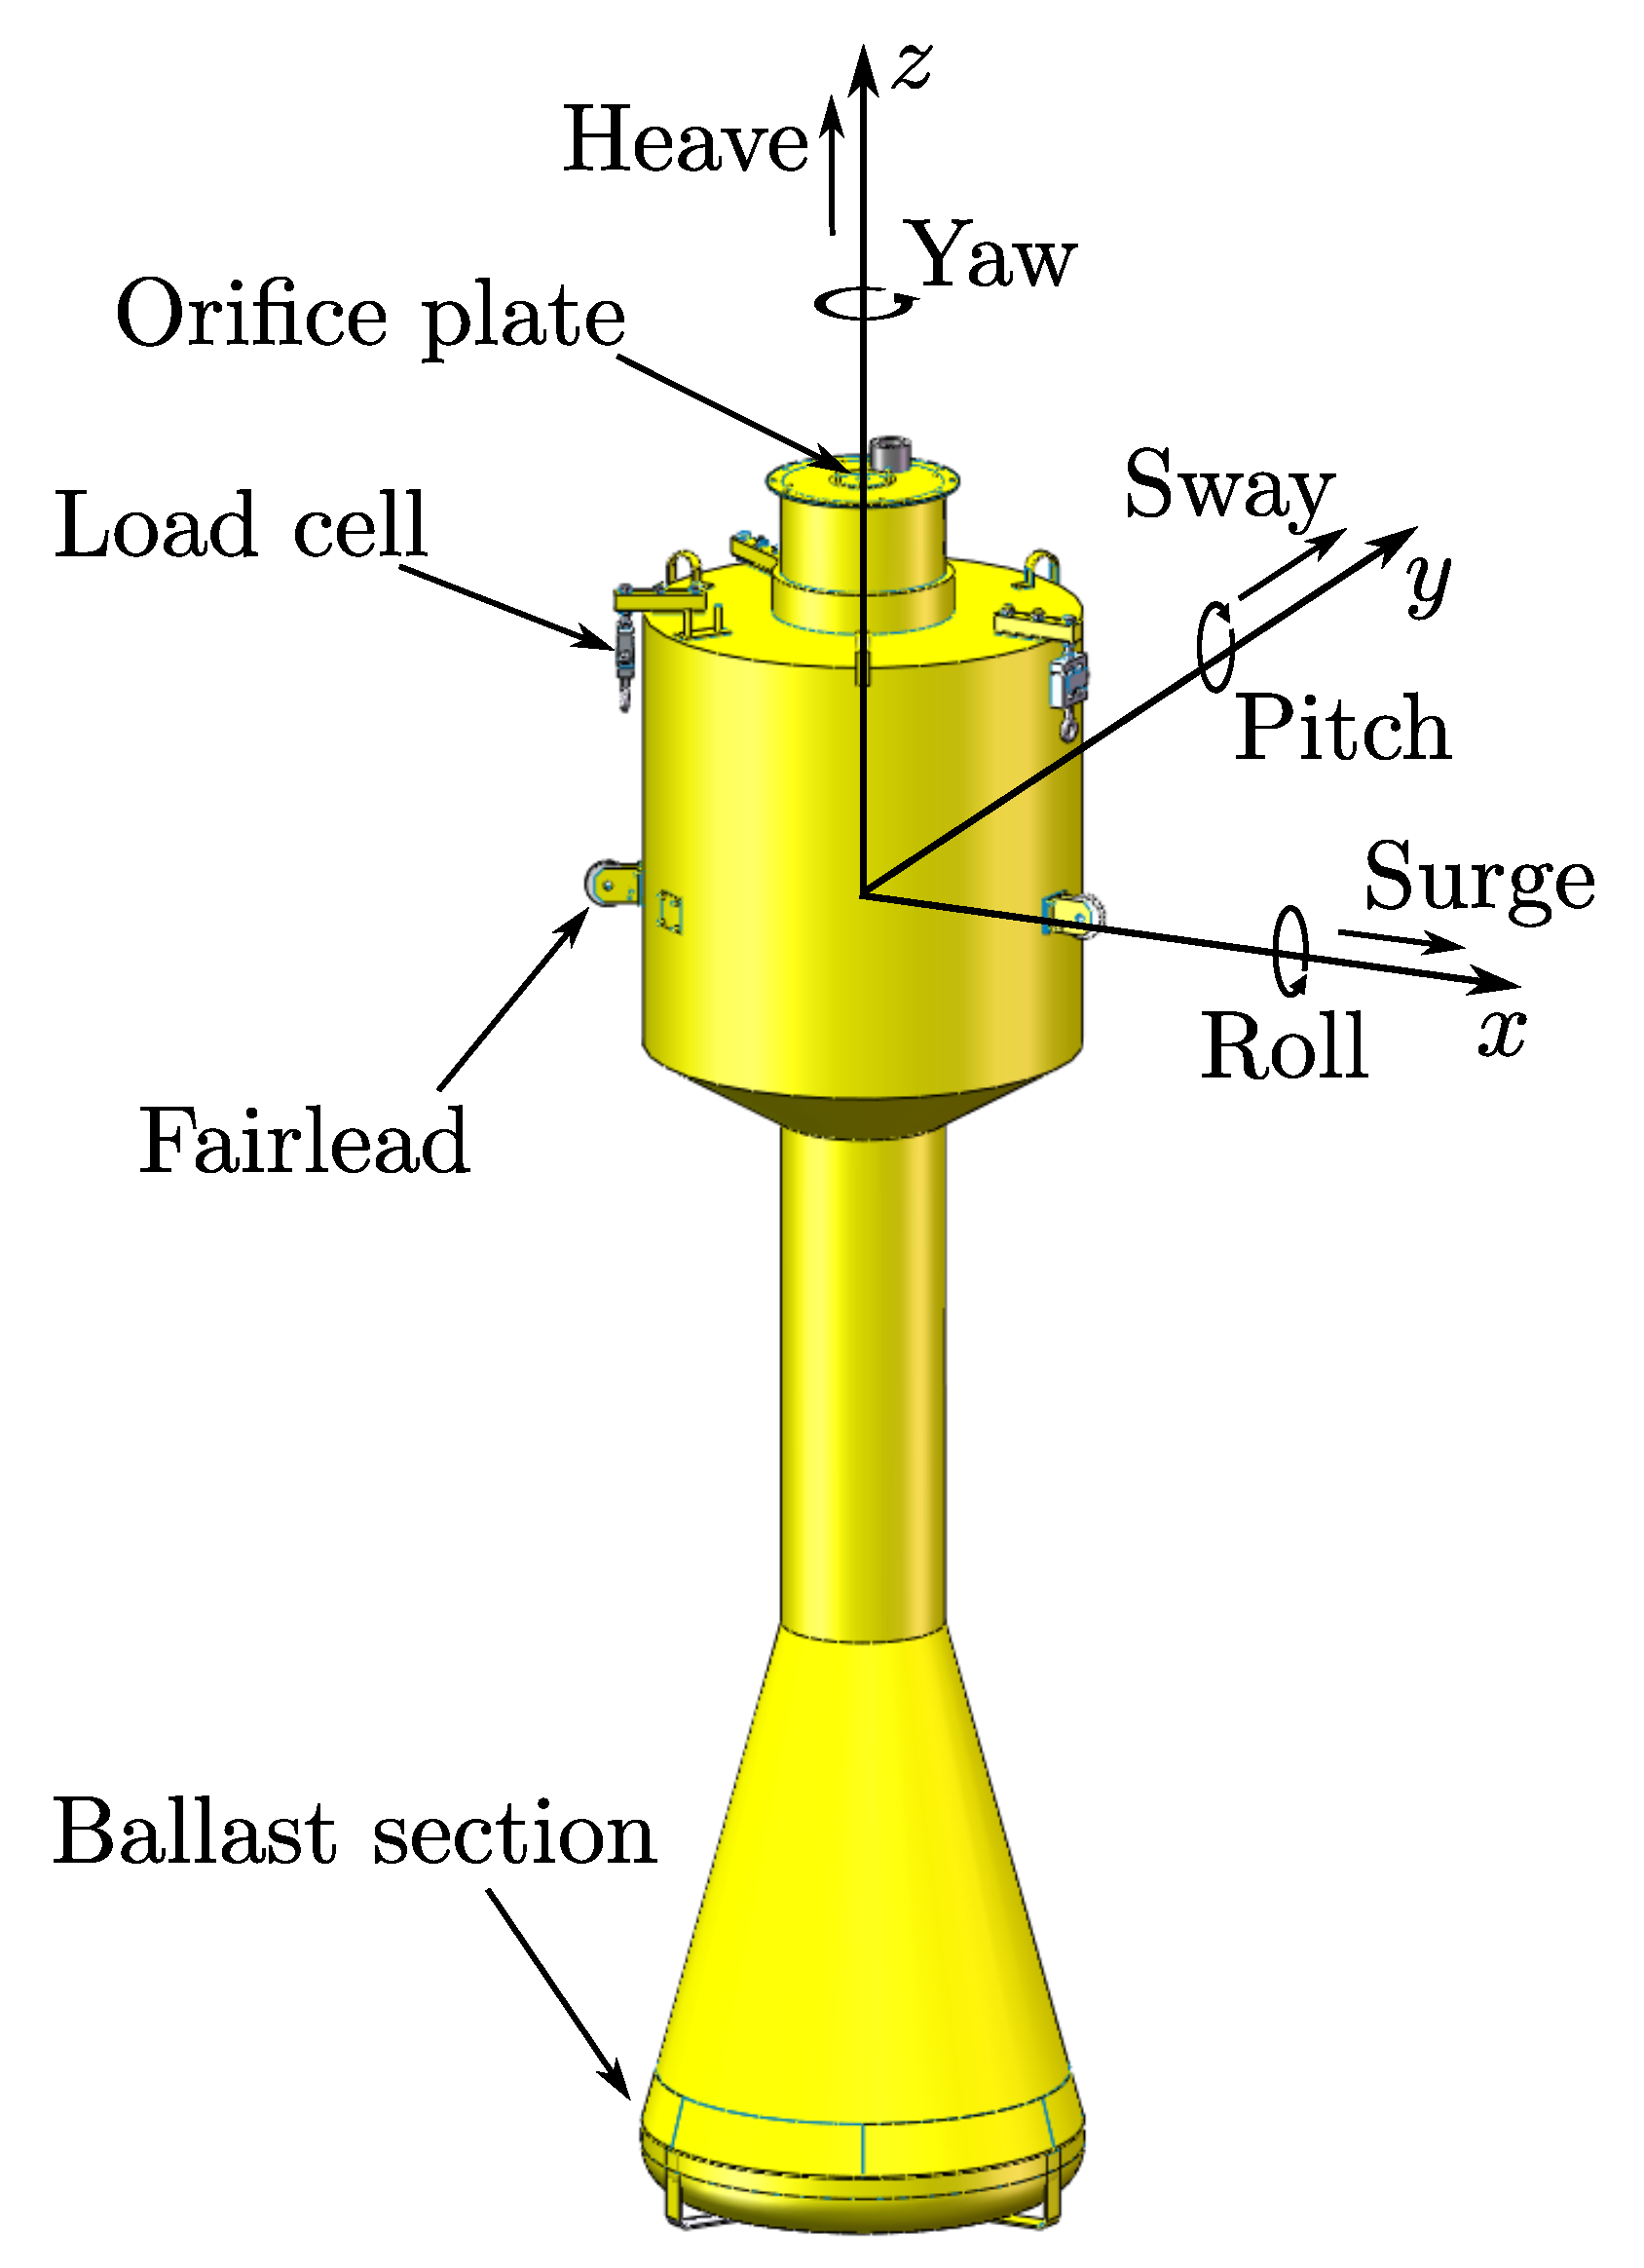
Figure 1 shows a three-dimensional representation of the device. Cylindrical and conical surfaces were build from welded steel plates, while the toroidal shape at the bottom was made from concrete using a steel mesh. Turbine damping effect at model scale was replicated by an orifice plate located at the top of the air chamber. Three pulleys, fixed to the outer surface of the buoy close to the free surface, acted as fairleads for the mooring lines. S-Beam load cells connected each mooring line to the device, allowing the assessment of the mooring line tension at the fairlead through an axial force measurement. Mooring lines were anchored on the wave basin floor through heavy concrete block.
A schematic representation of the wave tank, including the position of the prototype in the experiments, is shown in
Figure 2. Eight resistive wave gauges (WG1, WG2,..., WG8) were used to measure the free surface elevation at different locations in the tank. Wave gauge WG8, positioned aside and far from the device, was used to determine the incident wave conditions at the device location. The measurements of this wave gauge were compared with the wave measurement in the empty tank (without the device) at the device location. As small differences were found, WG8 was considered as an adequate proxy. Through this procedure, inaccuracies in the incident wave conditions due to the spatial variation of the wave amplitude caused by wave refection (typically 10% in this basin) are reduced.
For the analysis of the device, performance several parameters were measured. Quantities relevant to the study performed in this paper comprise of the motion of the device, the loads on the mooring lines and the incident wave conditions. The data acquisition system was placed near the device using a gantry platform positioned above the device. The six-degree-of-freedom motion of the buoy was evaluated using a motion-tracking system Oqus300+ developed by Qualisys. This system uses the measurements of various reflective targets attached to the buoy, by means of six infrared cameras placed around the basin, detecting the motion of each degree of freedom. The tensions on the mooring lines at the fairlead were measured by three S-beam load cells, DBBSM-25Kg-003-017 manufactured by Applied Measurements Ltd. (Berkshire, UK), with a measurement range between 0 and 250 N.
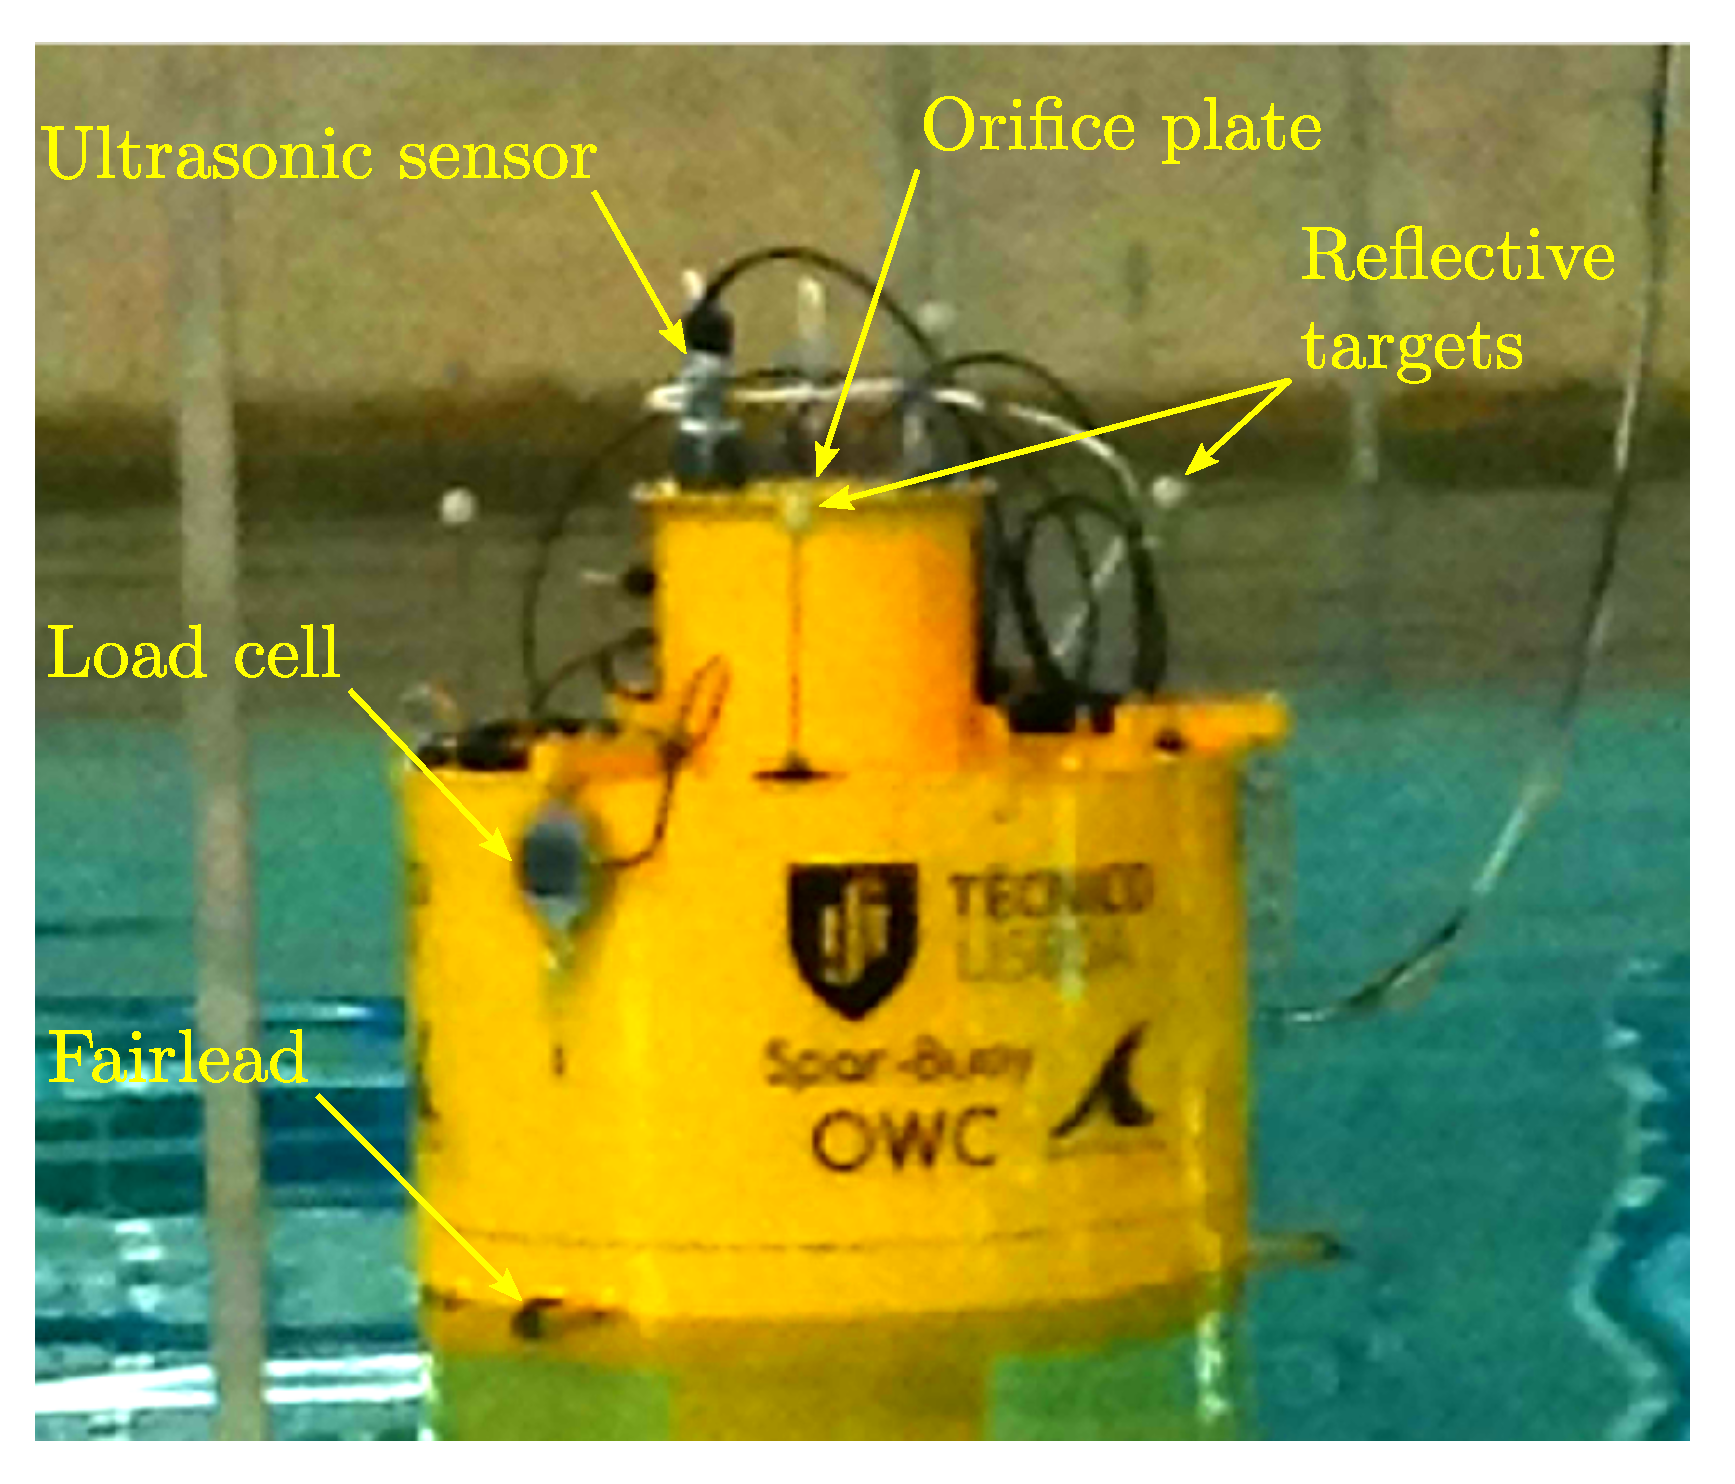
Figure 3 presents a picture of the model during the experimental campaign, with the measuring equipment installed.
The characteristics of the tested prototype are presented in
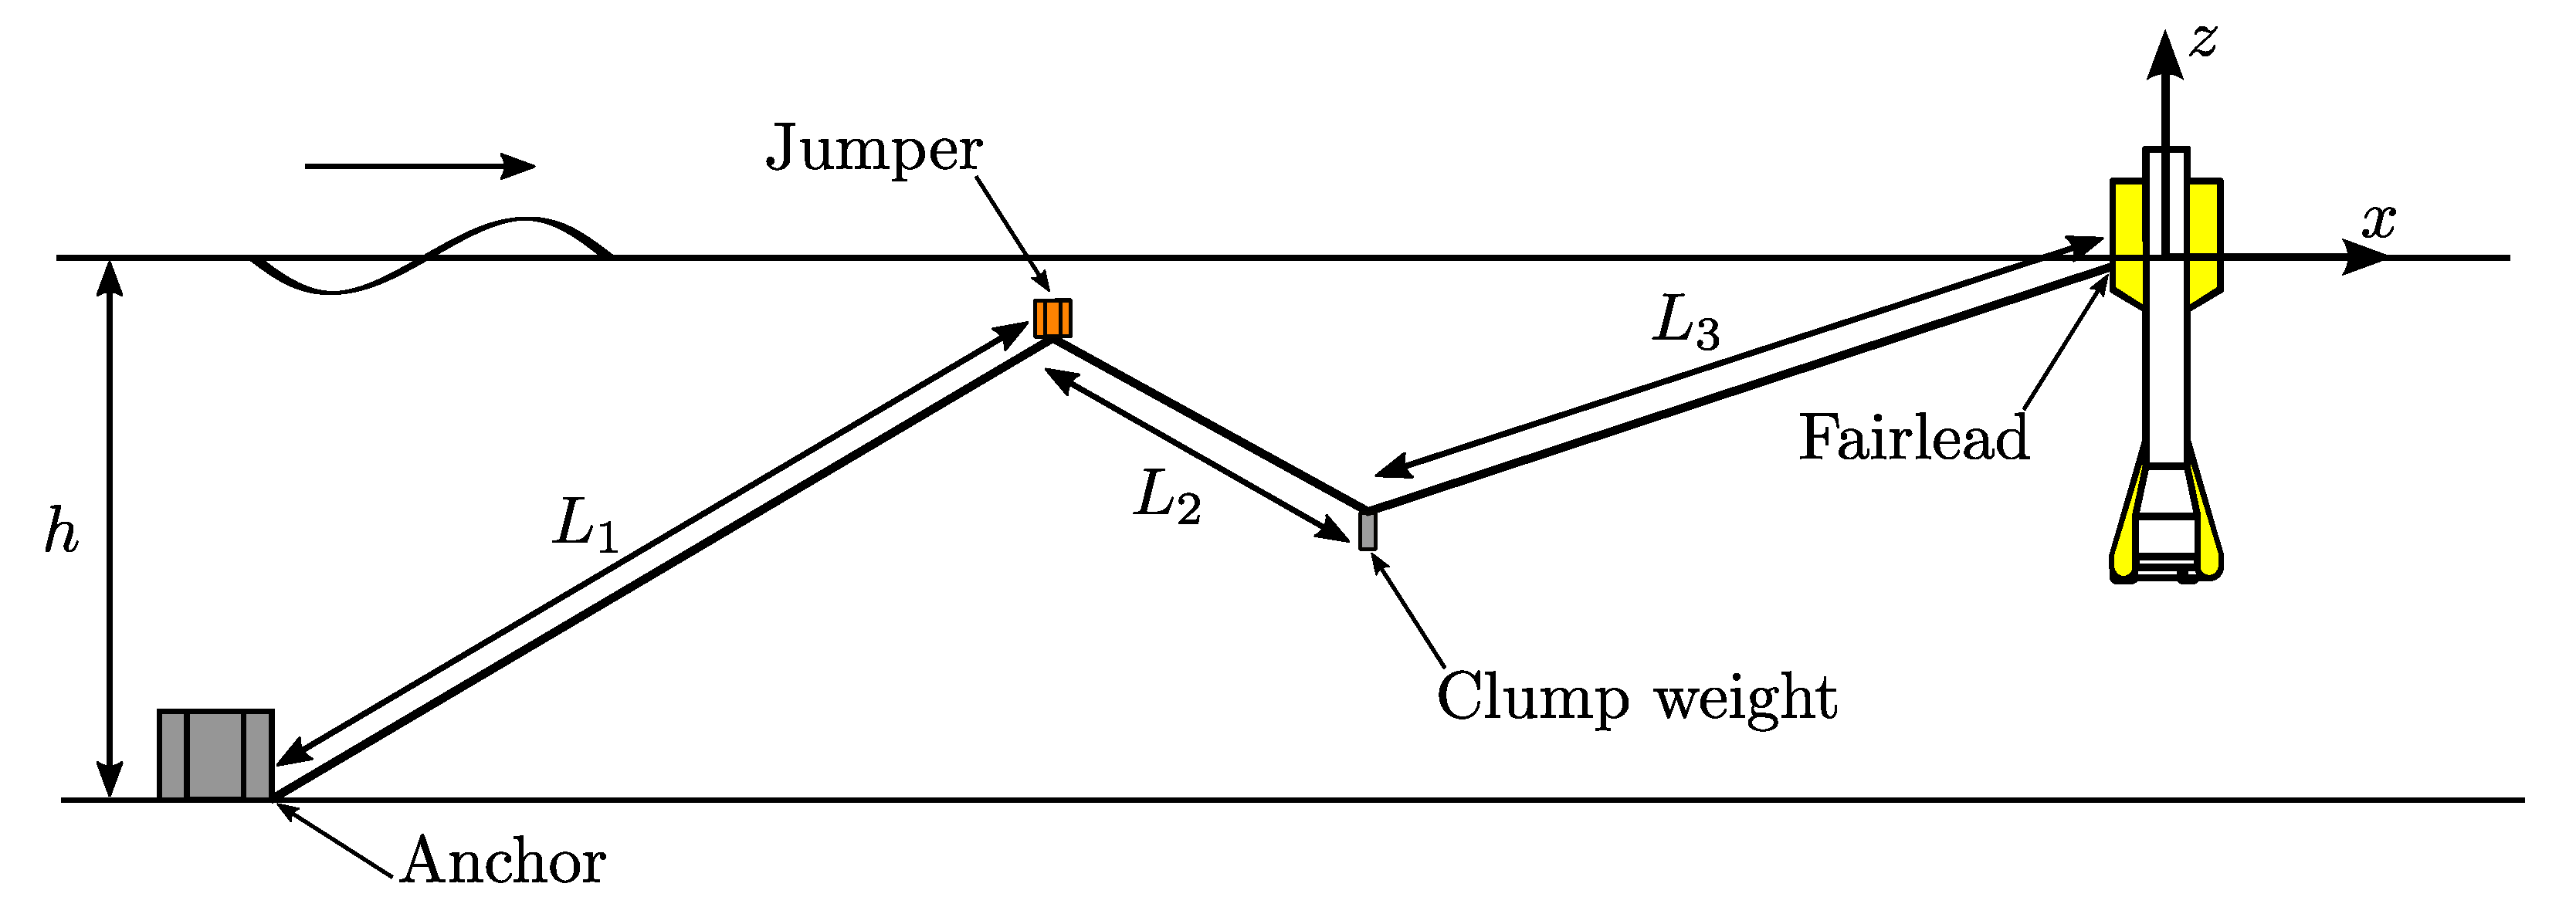
Table 2. The mooring system consists of three lines (ML1, ML2 and ML3), made from six-strand steel wire, equally spaced in the tangential direction around a vertical axis located at the centre of the buoy in still water conditions, as shown in
Figure 2. Each line, connecting the buoy fairlead to the floor, is divided into three segments (with lengths
,
and
), with a clump weight and a jumper (or riser) at the connections of the segments, as shown in
Figure 4. Such a mooring concept is popular in wave energy applications, as it is able to keep the device in station while having little influence on the response in the DoF were energy is extracted [
36,
50,
51]. Through the control of the mass and density of the clump weight and jumper, it is possible to control the stiffness and pretension of the mooring system [
52]. Relevant parameters of the mooring system are presented in
Table 3, shown in both model- and full-scale. The mooring system configuration was based on the work by Vicente et al. [
53]. The clump weight mass was determined based on the mass of the buoy (typically ~1–2%), and the jumper mass and line lengths were selected in order to keep the natural surge period largely above common sea periods (typically above 100 s), while also respecting geometrical constraints, such as the jumper being always below the free surface.
3. Mathematical Models of the Mooring System
Mooring systems for Wave Energy Converter can be modelled in several ways using commercial, open source and in-house software. A first distinction about mathematical model could be done between QS model and Dynamic model.
The QS model considered in this analysis is a simplified approach where dynamic forces, such as inertia and damping, are neglected. Mooring forces are calculated considering the instantaneous position of the system, while the previous position state is ignored. Conversely, dynamic models consider inertia forces and all forces depending on previous states, such as drag forces. Generally, dynamic models use a formulation of the Morison’s Equation (
1) [
54] for slender bodies with circular cross section:
where
is the water density;
and
are the mass and drag coefficients, respectively;
D is the diameter; and
u is the velocity. Equation (
1) represents the exchanged force as the sum of an inertia force and a drag force. Coefficients depend on body volume and surface. Both QS and dynamic modelling approaches can be used, according to different guidelines [
8], also including extreme wave design process. However, a QS approach can be used only when the system is characterised by low-frequency motion.
A further classification concerns the simulation approach, which can be either
uncoupled or
coupled [
27]. In uncoupled simulations, the mooring solver runs separately from the WEC solver, as the kinematic of the WEC is imposed as a known input in the mooring solver. Therefore, only a time-domain approach can be used. Uncoupled simulations can be used in a design workflow for either static or driven devices, where the focus is on the mooring loads rather than the mooring-device interaction. In a coupled simulation, at each time step the mooring solver and the WEC hydrodynamic solver communicate with each other, generating an interface force that is taken into account for computing the resulting dynamic response of the floater. This simulation can be performed in both the time-domain and frequency-domain. It is worth remarking that uncoupled simulations can be used for validation against an experimental campaign, as further discussed in
Section 4, but they are not apt to design a mooring system.
Regarding the software choice, several overviews are available in the literature [
55] with an extended discussion on the ability of mathematical model to represent different phenomena and nonlinearities [
29]. Regarding the software choice, several overviews are available in the literature with an extended discussion on the ability of mathematical model to represent different phenomena and nonlinearities. For example, considering extreme sea states, mooring line snap events could be important for the use of a finite element software like the open source MooDy [
56] or the commercial one ProteusDS [
57].
Table 4 shows some of the popular software for mooring analysis. A fair comparison between such software is challenging since they resolve both the mooring dynamics and the WEC dynamics. In addition, OrcaFlex does not iteratively solve the hydrodynamic radiation/diffraction problem as WEC hydrodynamic properties are assumed to be constant during the simulation.
This paper considers the mooring system for a 1:32 prototype of the Spar-buoy OWC, proposing a validation against the experimental data presented in
Section 2. In order to define a level playing field of comparison between models and wave tank test data, the kinematics recorded during the experiments are imposed in the mooring model, following an uncoupled simulation approach. Afterwards, experimental and numerical tension at the mooring line fairlead are compared. With reference to the software list mentioned in
Table 4, three different modelling approaches are considered: an in-house
QS model,
MoorDyn, and
OrcaFlex, which are discussed in
Section 3.1,
Section 3.2 and
Section 3.3, respectively.
3.1. QS Model
A QS model is defined to compute the tension on each line depending on the position of the attachment points, driven by the kinematics of the buoy. Relying on the fact that the mass of the mooring lines is negligible and they are always tensioned, it is possible to treat each line as always straight. The problem can be simplified as two-dimensional, by defining each mooring line on a vertical plane containing the buoy fairlead and the anchor point. For each line, the positions of each component can be represented by the horizontal coordinate
r and the vertical coordinate
z, considering the origin of the referential at the anchor point. Consequently, for each line, two equations are written for the vertical and horizontal force equilibrium, one for the torque balance, and two for imposing geometrical constraints:
where
and
are the horizontal and vertical distances between the buoy fairlead and the anchor, respectively, while
and
are the net force of the clump weight and jumper, respectively, obtained as the balance between their weight and buoyancy. The horizontal distance of the midpoint of line
to the anchor is
, for
, while
and
are the horizontal distances of the jumper and clump weight from the anchor, respectively. The variable
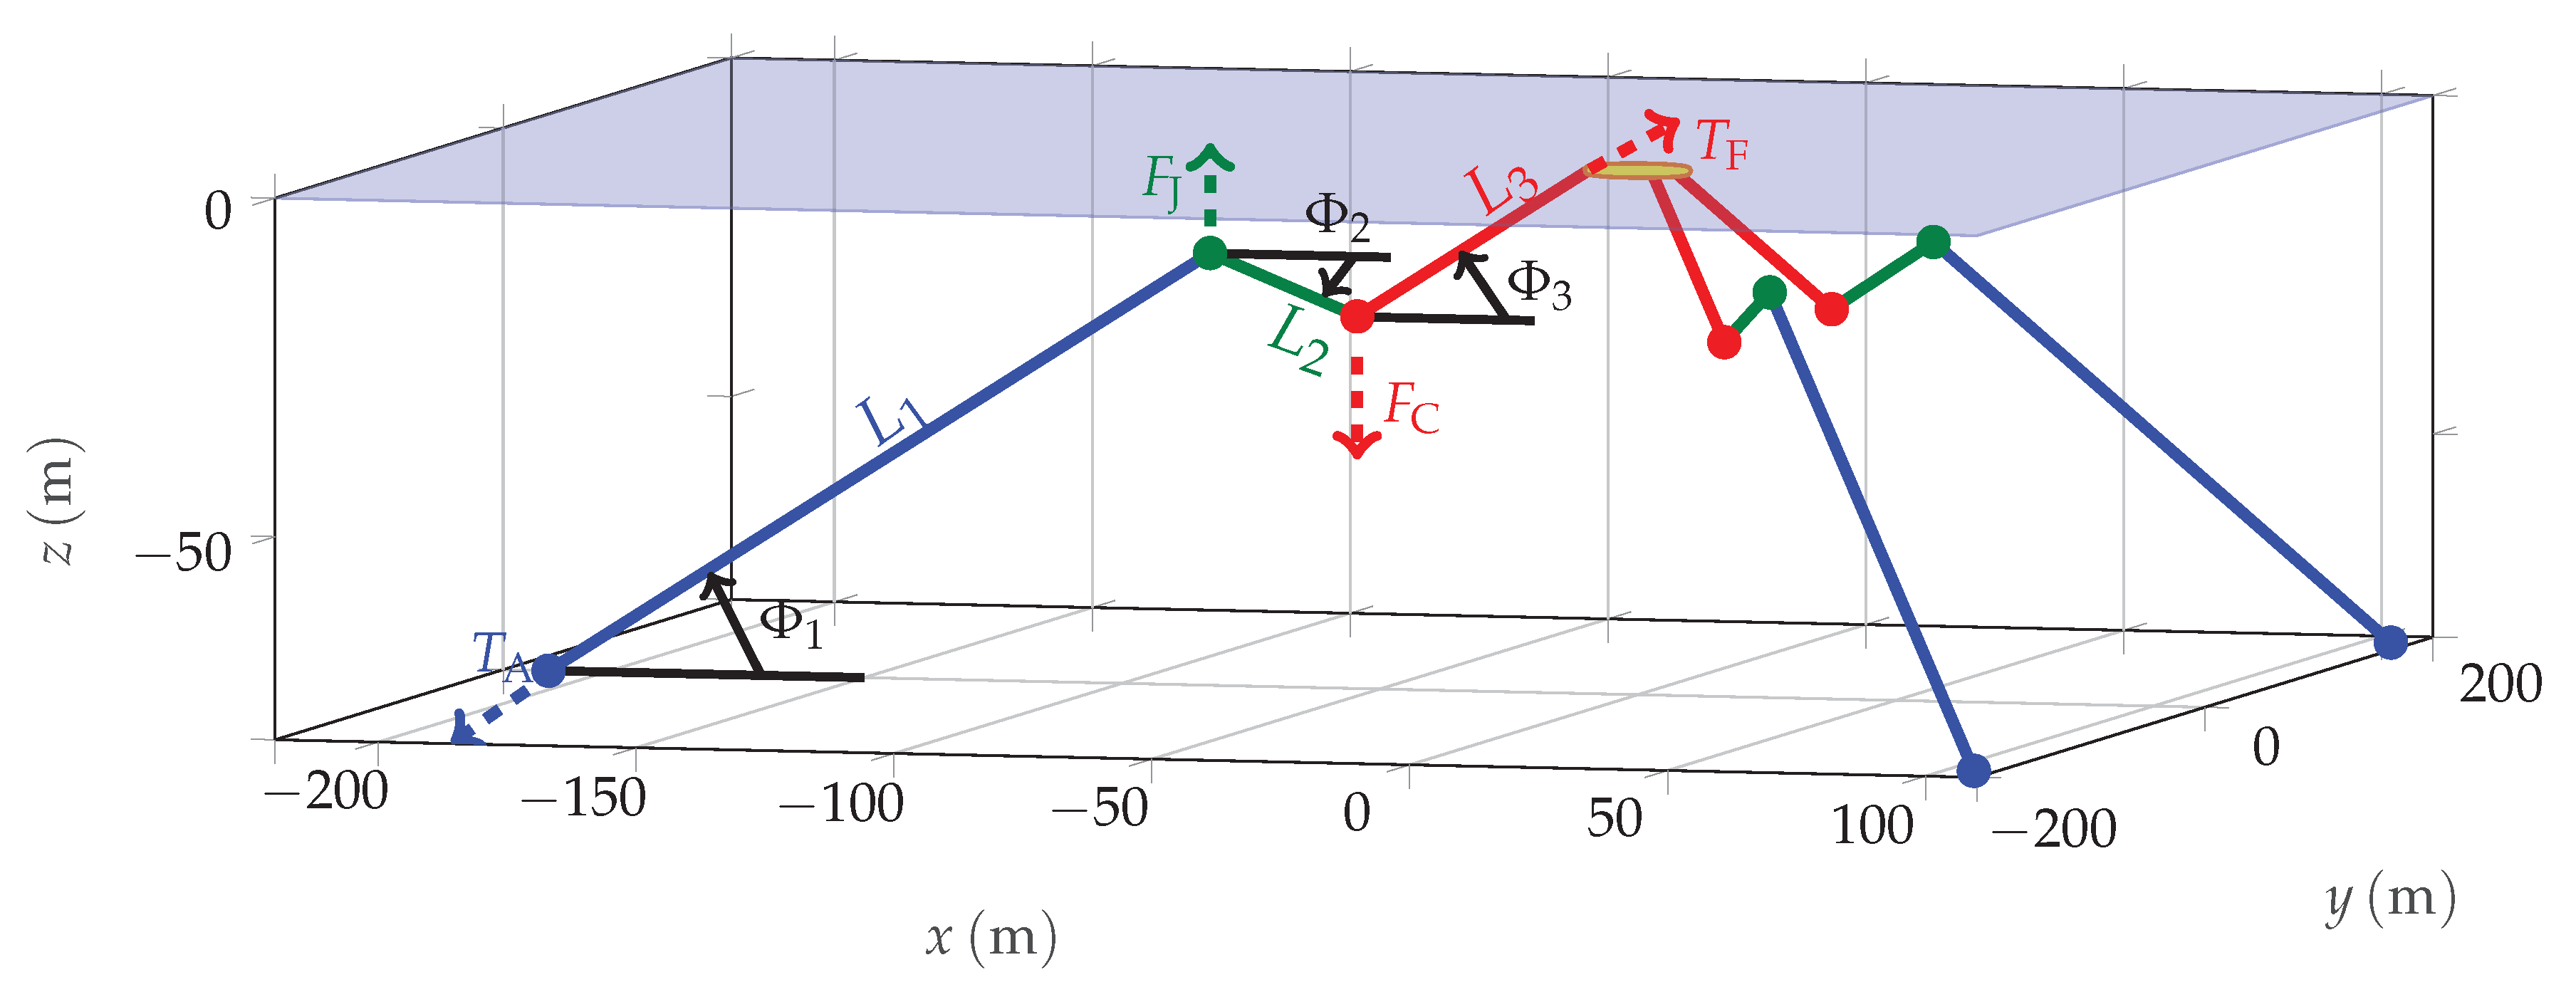
represents the line submerged weight per unit length. Such parameters are simple linear combinations of the five unknowns of the system: tension at the buoy fairlead (
), tension at the anchor (
) and angles of each line to the horizontal direction
, as shown in
Figure 5. Knowing the tension and the angles of each line, it is possible to compute the total force and total torque acting on the buoy. Note that the nonlinear system of equations in (
2) is solved numerically, as no explicit algebraic solution can be obtained. This model has been already used for parametric design analysis in [
15,
52] thanks to its flexibility, and was part of an overall validated model in [
31].
3.2. MoorDyn
MoorDyn [
24] is an open source lumped-mass mooring dynamic solver. MoorDyn’s version considered in this paper is
v1.00.03C, but there will be other considerations on a more recent version
v1.01.01C, which includes a beta model for horizontal friction with the seabed [
24].
Moordyn operates in three steps:
It creates a QS model that computes each node position, based on the provided input file.
Then, dynamic relaxation is used to allow the system to settle to initial equilibrium, also including dynamic drag and acceleration forces.
At each time step, MoorDyn calculates the tension at each fairlead and the motion (position, velocity and acceleration) of each node.
Although conceptually simple, the actual implementation of MoorDyn may be delicate, as it is found to be prone to numerical instability and quite sensitive to the choice of the input parameters. Such difficulties have limited the success of MoorDyn, despite the undeniable advantage of being open source, thus free of charge. The following subsections briefly comment on the appropriate set-up to avoid the undesirable numerical instabilities, when avoidable, while highlighting cases where the implementation of MoorDyn is inherently troublesome.
3.2.1. Input File
The two most important coefficients that affect numerical stability in the input file are listed below.
Damping coefficient
Bottom stiffness
The main challenge in selecting such coefficients is their little physical interpretation and measurability. In version v1.00.03C of MoorDyn, it is possible to define the damping coefficient in relative terms as a damping ratio. For the configuration in this paper it is found that a damping ratio of 0.8 hinders numerical instability. As the mooring line in the configuration considered in this paper does not lay on the floor, the bottom stiffness value is irrelevant.
3.2.2. QS Initial Phase
MoorDyn initially creates a QS model for the computation of the initial positions of each node of the lumped-mass model, which are then used in the dynamic relaxation phase to find the initial condition of equilibrium. If the input conditions are too far from the initial conditions, the software may not reach convergence and fail. To avoid this problem, the coordinates of the jumpers are approximately computed in order to be close to the initial conditions, favouring a successful dynamic relaxation.
3.2.3. Dynamic Relaxation Phase
Even if the model was appropriately implemented during QS initial phase, convergence towards stable initial conditions requires additional care. In particular, especially for 6-DoF simulations, a ramp function is necessary to reach the required initial displacement values in order to avoid any abrupt variations that would cause instability. It is also possible to change the initial condition convergence threshold from the input file to improve convergence. A further pragmatic expedient to improve convergence is to increase the drag coefficient acting on the lines, even by a factor of 5, in order to artificially damp out large accelerations of the mooring nodes.
3.2.4. Simulation Phase
During MoorDyn execution, instability may arise due to both time discretisation (time step of the time-advancing scheme) and spatial discretisation (number of nodes in the mooring lines).
3.2.5. Scale
Although tuning the parameters exposed in
Section 3.2.1,
Section 3.2.2,
Section 3.2.3 and
Section 3.2.4 reduce the likelihood of numerical instability, it is found that the scale of the tested case may be predominant. In fact, if the device is as small as the one tested in the experiments, it is found that MoorDyn is very sensitive to tuning parameters and often encounters numerical instability. This may be due to a high resonance of the system, which interferes with numerical convergence. Therefore, as no appropriate numerical set-up was found, moorDyn is excluded from the comparison hereafter.
3.3. OrcaFlex
OrcaFlex by Orcina [
23] is a mooring and WEC dynamic solver. This section wants to set a focus on Orcaflex mooring solver features only, because WEC dynamic is not considered in this paper.
OrcaFlex is one of the most popular software in the offshore field [
11]. The model has been built in experimental scale with data already mentioned in
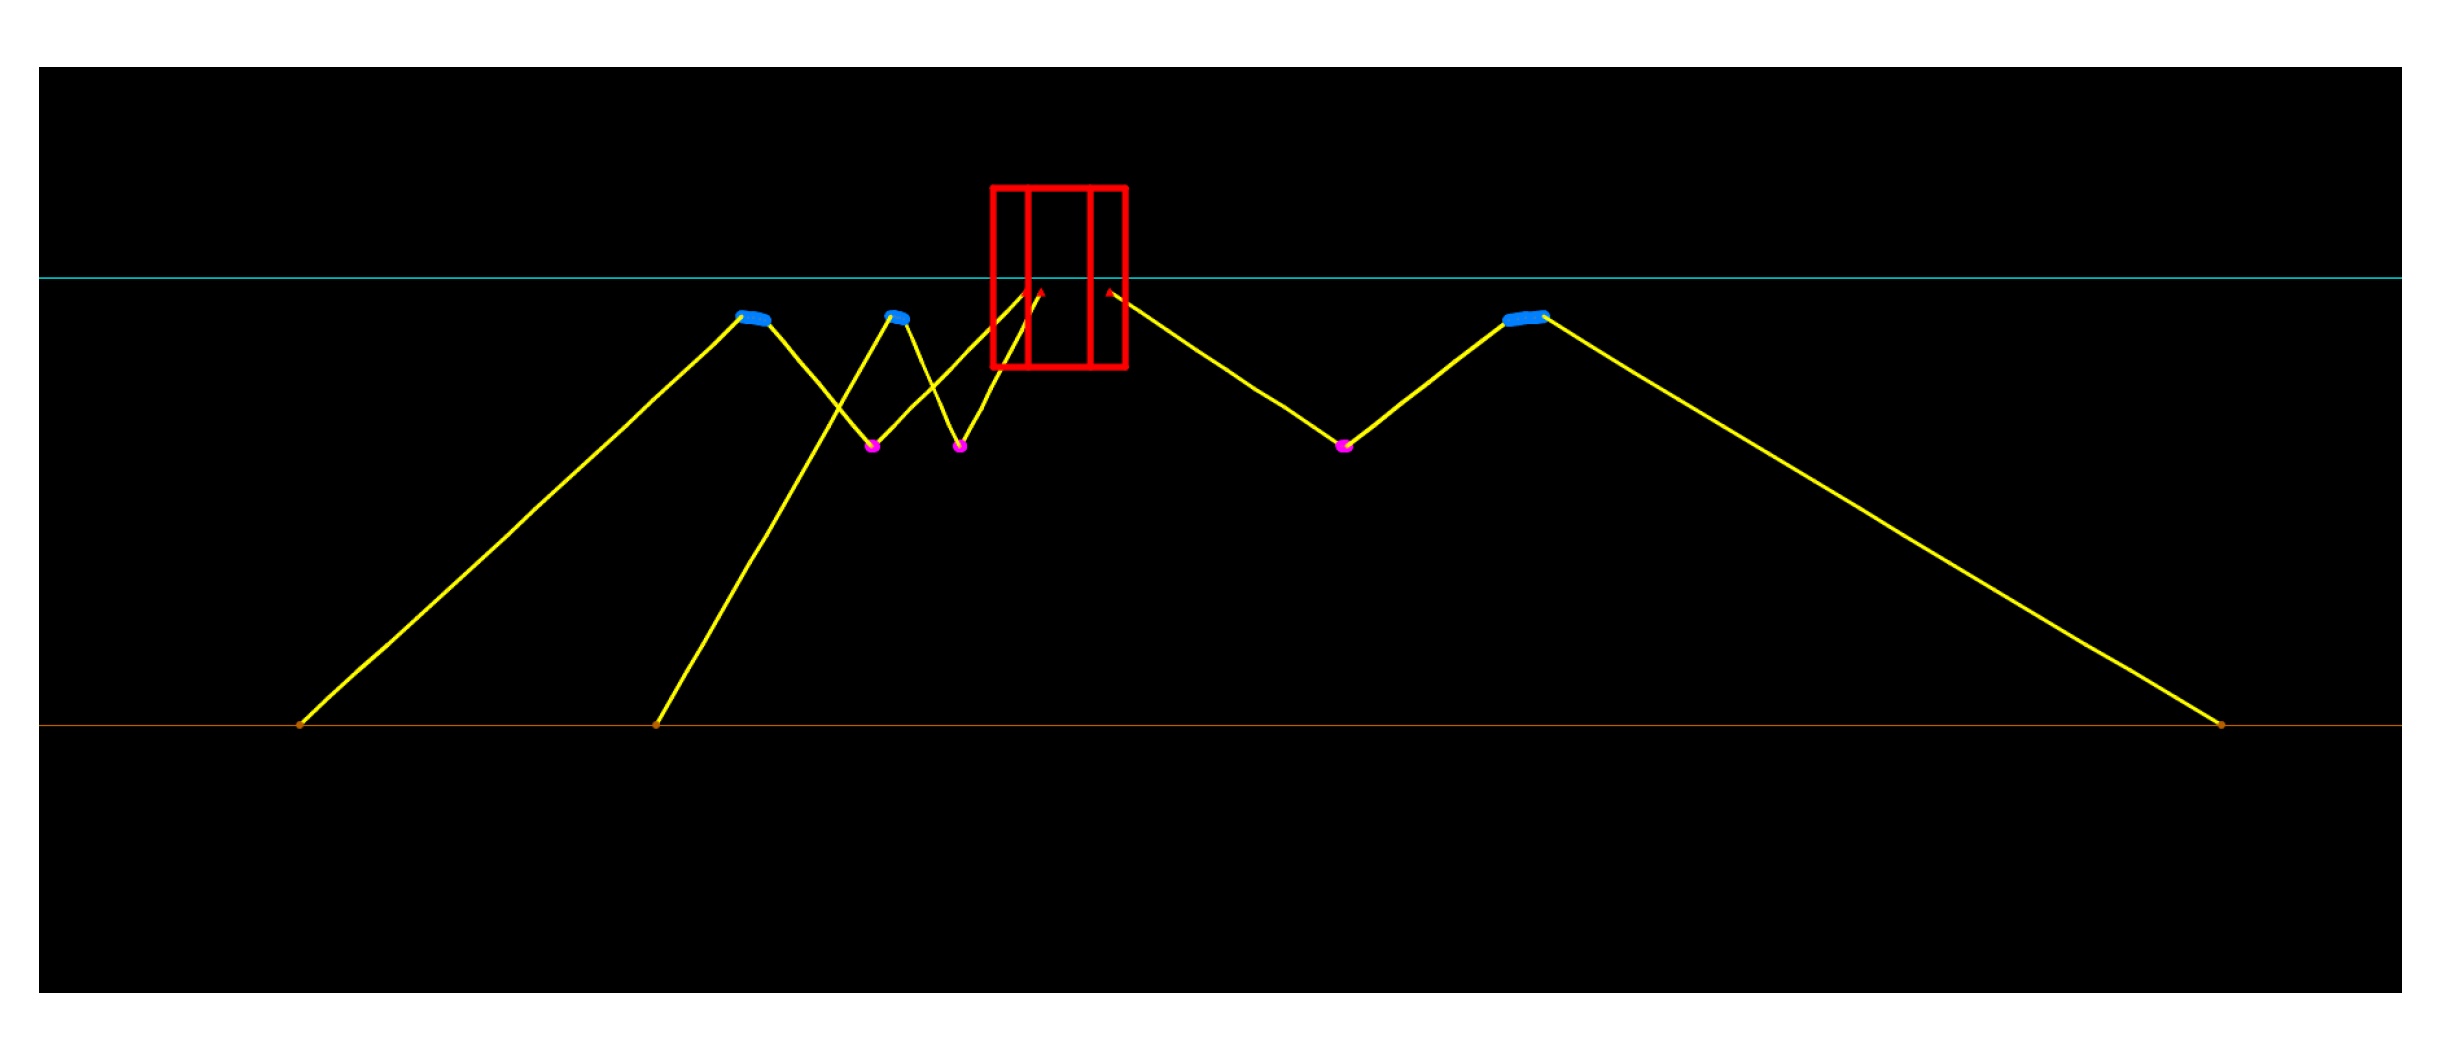
Table 3. A graphical representation of the model set-up is presented in
Figure 6, with the buoy not represented, as the floater dynamics is not solved.
Some of the lines’ properties could be difficult to evaluate during the experimental campaign, but they are crucial for mooring simulations. Such properties have been evaluated using OrcaFlex cable wizard, which provides cable details using data from existing catalogues. Lines were discretised by 0.1 m segment, which means that each line is divided into 73 segments to obtain a fine segmentation and avoid convergence problems. Besides lines, other uncertainties are related to the jumper and clump-weight properties. Weight and net buoyancy are known as they are easy to measure, while hydrodynamic properties have to be estimated. The jumper was modelled in OrcaFlex as a cylinder with a height of
m, while the clump-weight was modelled as a sphere with diameter of
m, for which the hydrodynamic properties were taken from the literature [
58].
4. Comparison and Validation
As already mentioned in
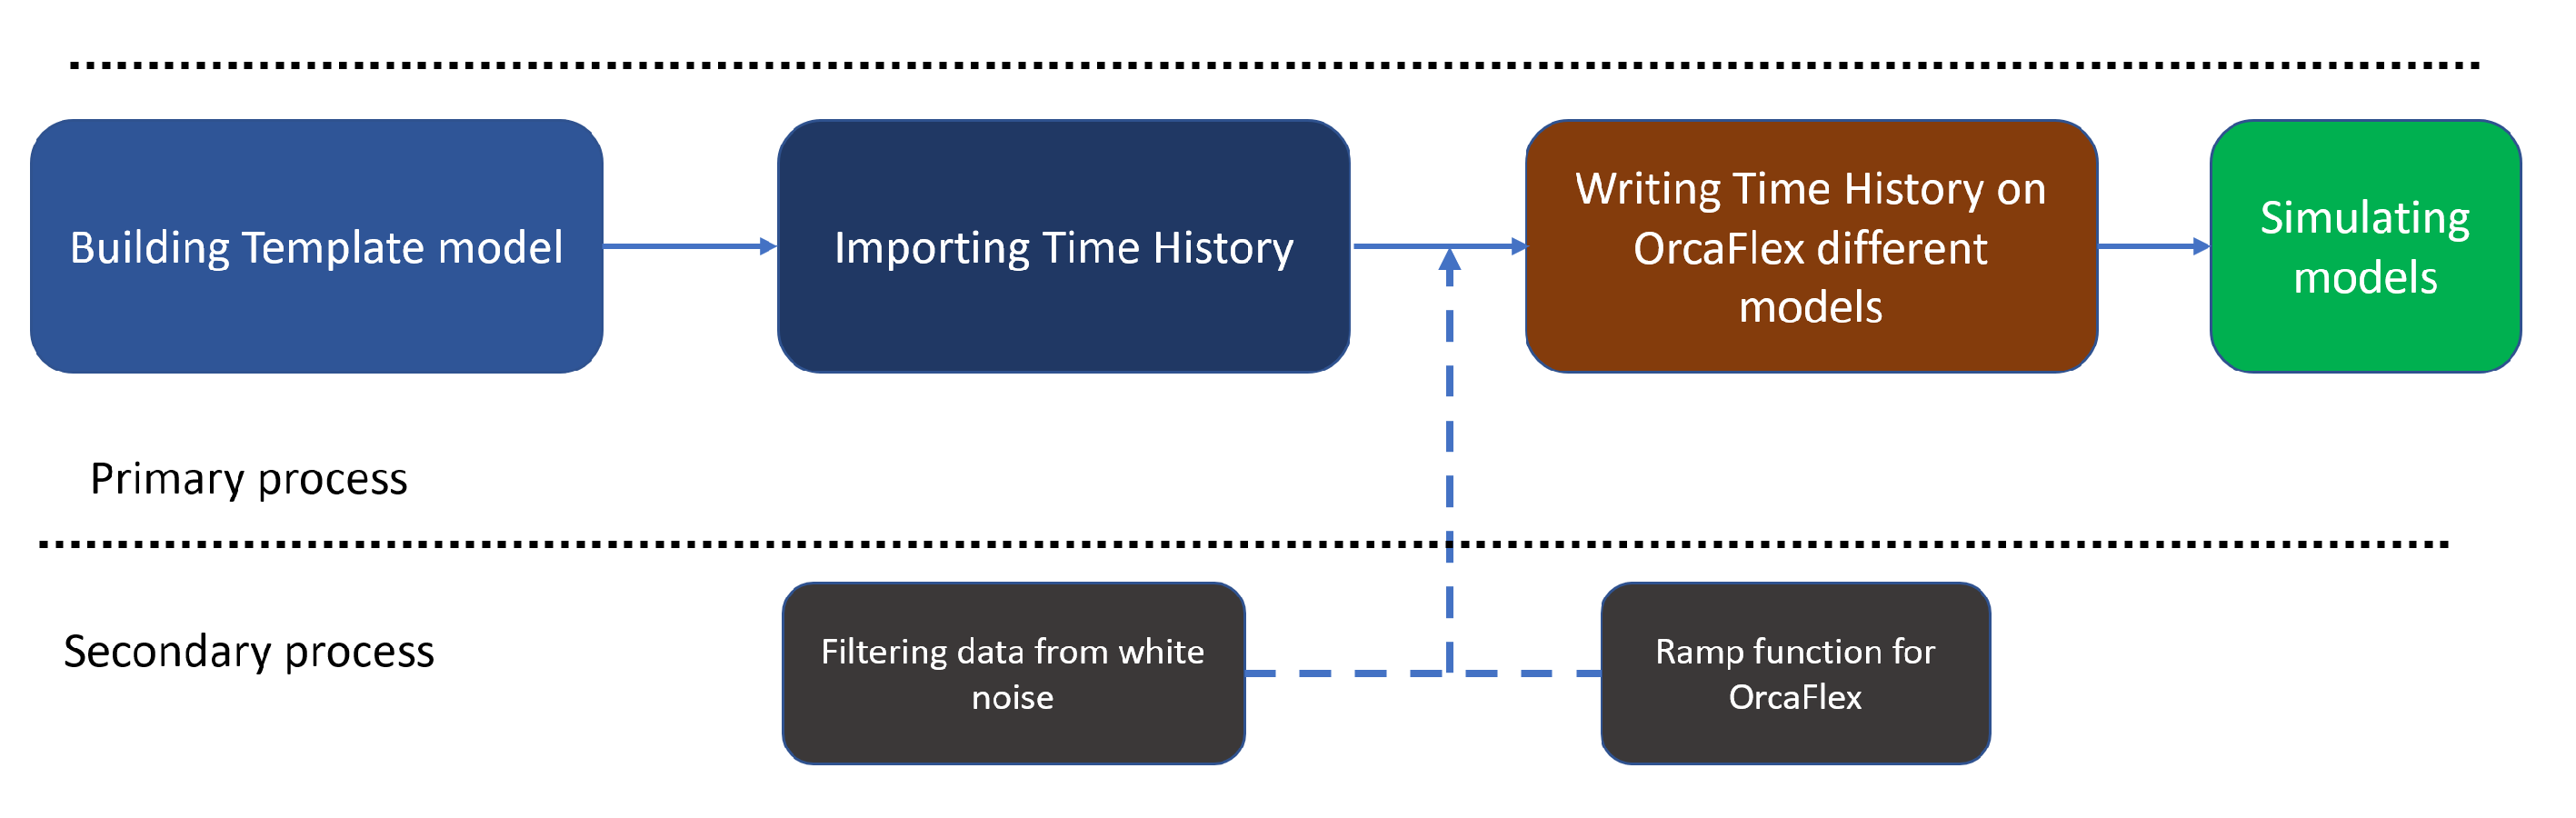
Section 3, an uncoupled simulation approach is followed, in order to focus on the mooring model only, while the dynamic response of the floater is the same for all models, equal to the experimental tests. The numerical simulation process for the OrcaFlex model is schematically shown in
Figure 7, and is conceptually equivalent for the QS model.
As the kinematic experimental data is affected by some signal noise, the first step is to filter data at an appropriate frequency in order to avoid loss of meaningful data. In practice, the frequency energy content of the response of the floater is extracted by means of a fast Fourier transform (FFT). Then, the cut-off frequency (
) is chosen to be 50% higher then the peak frequency (
), but always greater than 0.12 Hz. Afterwards, a low-pass filter is applied to the kinematic data.
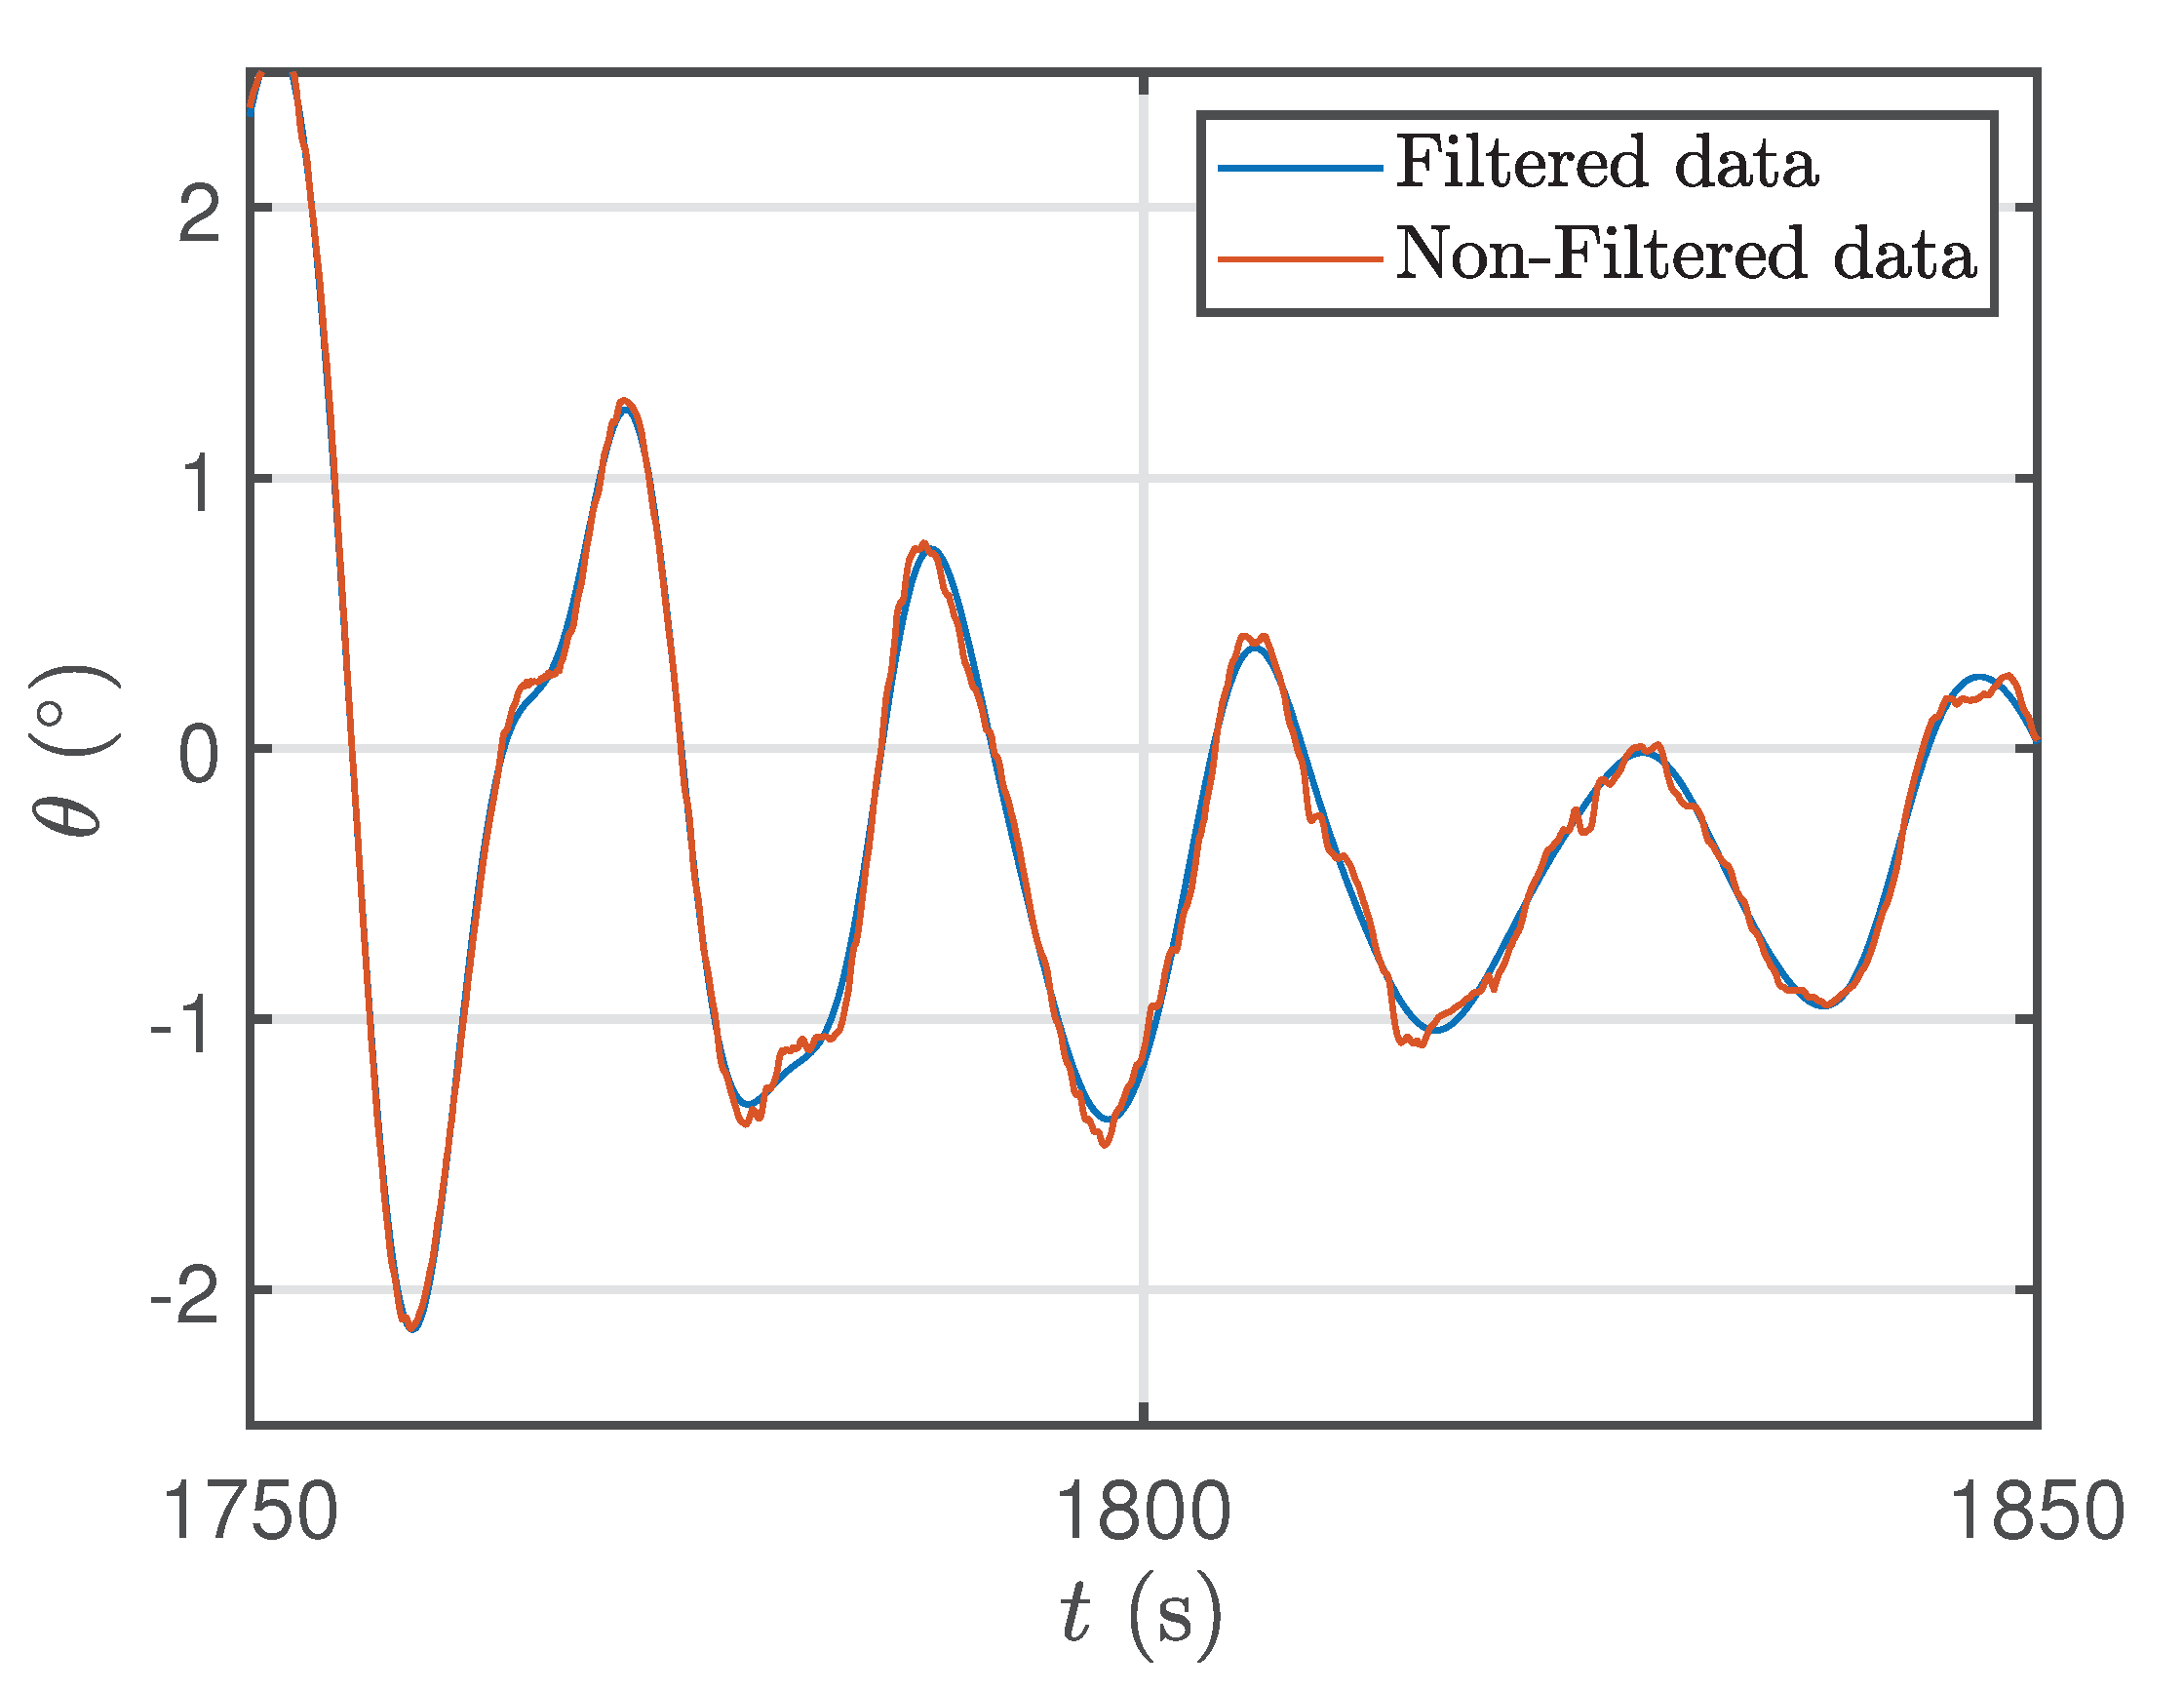
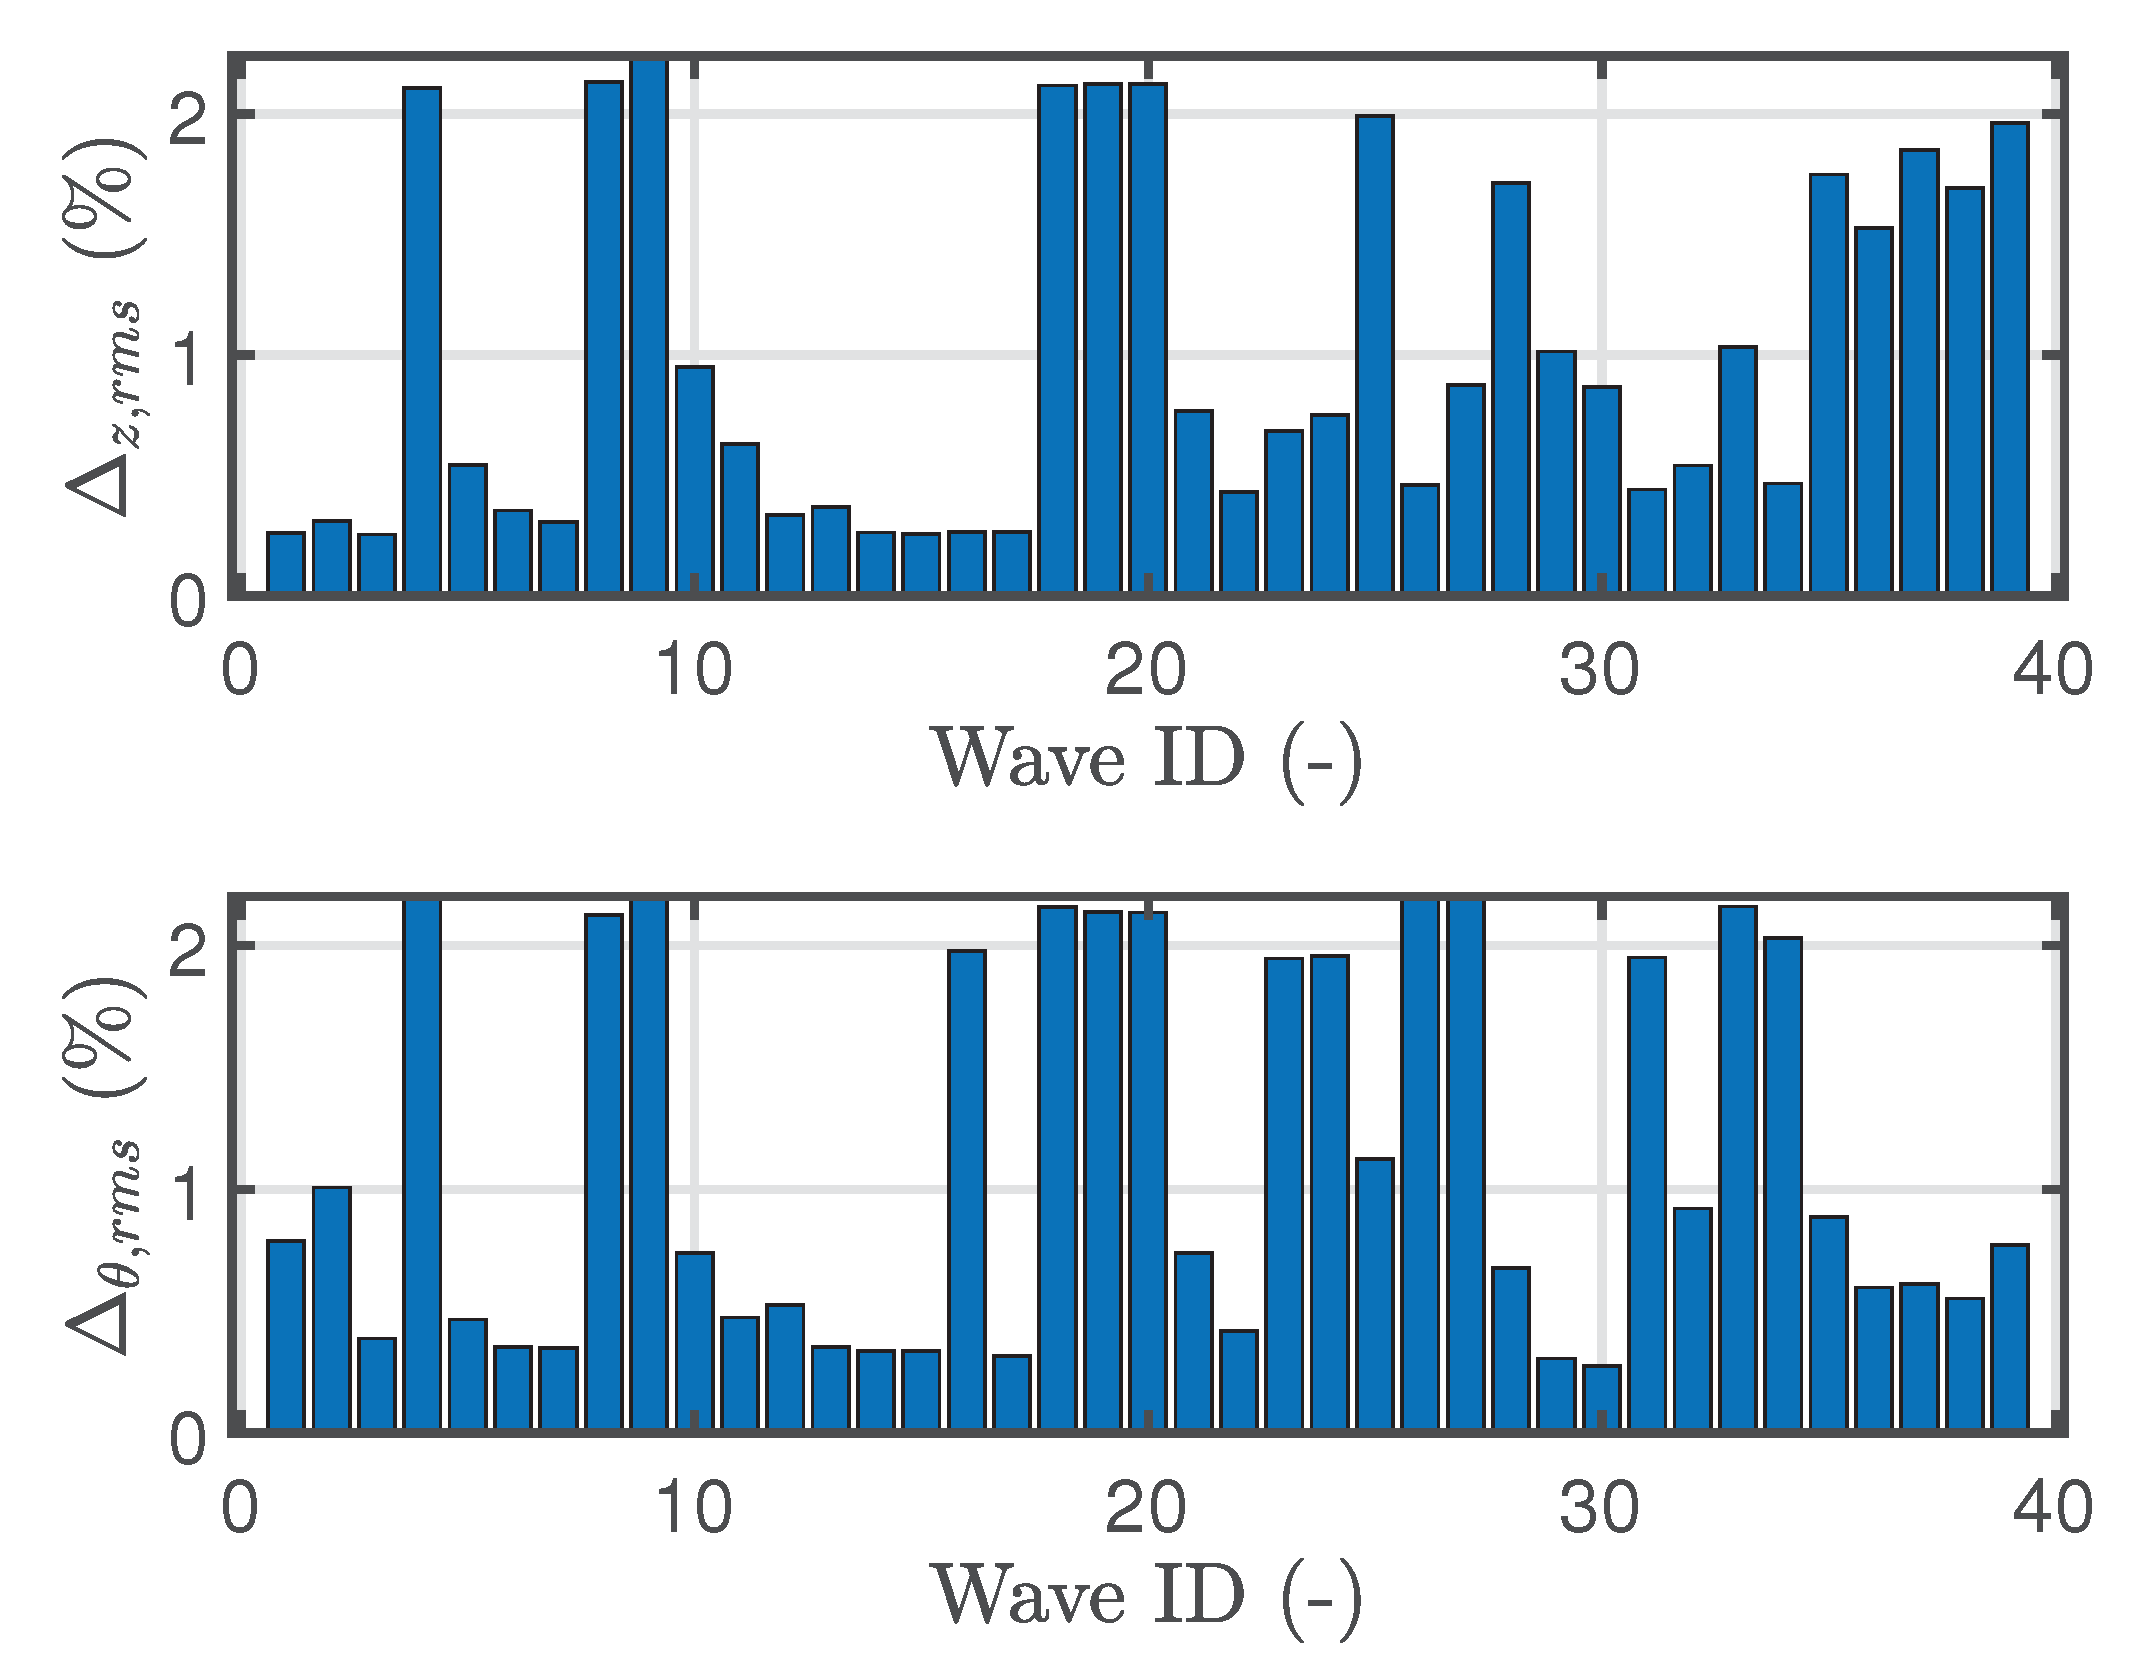
Figure 8 shows an example of time-series comparison between filtered and non-filtered data, while
Figure 9 shows the relative root mean square variation in heave and pitch for different tests, before and after filtering, where the kinematic data variation in heave has been calculated as
and likewise for pitch.
Figure 9 certifies that the error between filtered and non-filtered data is negligible, ensuring correct kinematic input for the mathematical models. Furthermore, a linear ramp function was used to reach the initial condition of each test. The same kinematic data were imported in the QS model, presented in
Section 3.1, in order to perform a fair comparison between the two models.
One of the objectives of this paper is to compare the performance, in terms of computational time and accuracy, of different models, in order to provide some indications on the applicability of each model to different applications. MoorDyn is also considered in the comparison
Table 5, because it is a promising software for cable dynamic thanks to its agility and Matlab interface. The order or magnitude of the relative computational time is given, defined as the ratio between run-time (on a single processor) and simulated time, and computed as the average over the whole data set. As expected, the QS model is one order of magnitude faster than the dynamic models. However, OrcaFlex can benefit from parallelisation, which is not an available feature in MoorDyn.
Models accuracy comparison is made considering only the front fairlead tension, because this line is the one facing the incoming wave side, thus the most affected by device surge motion.
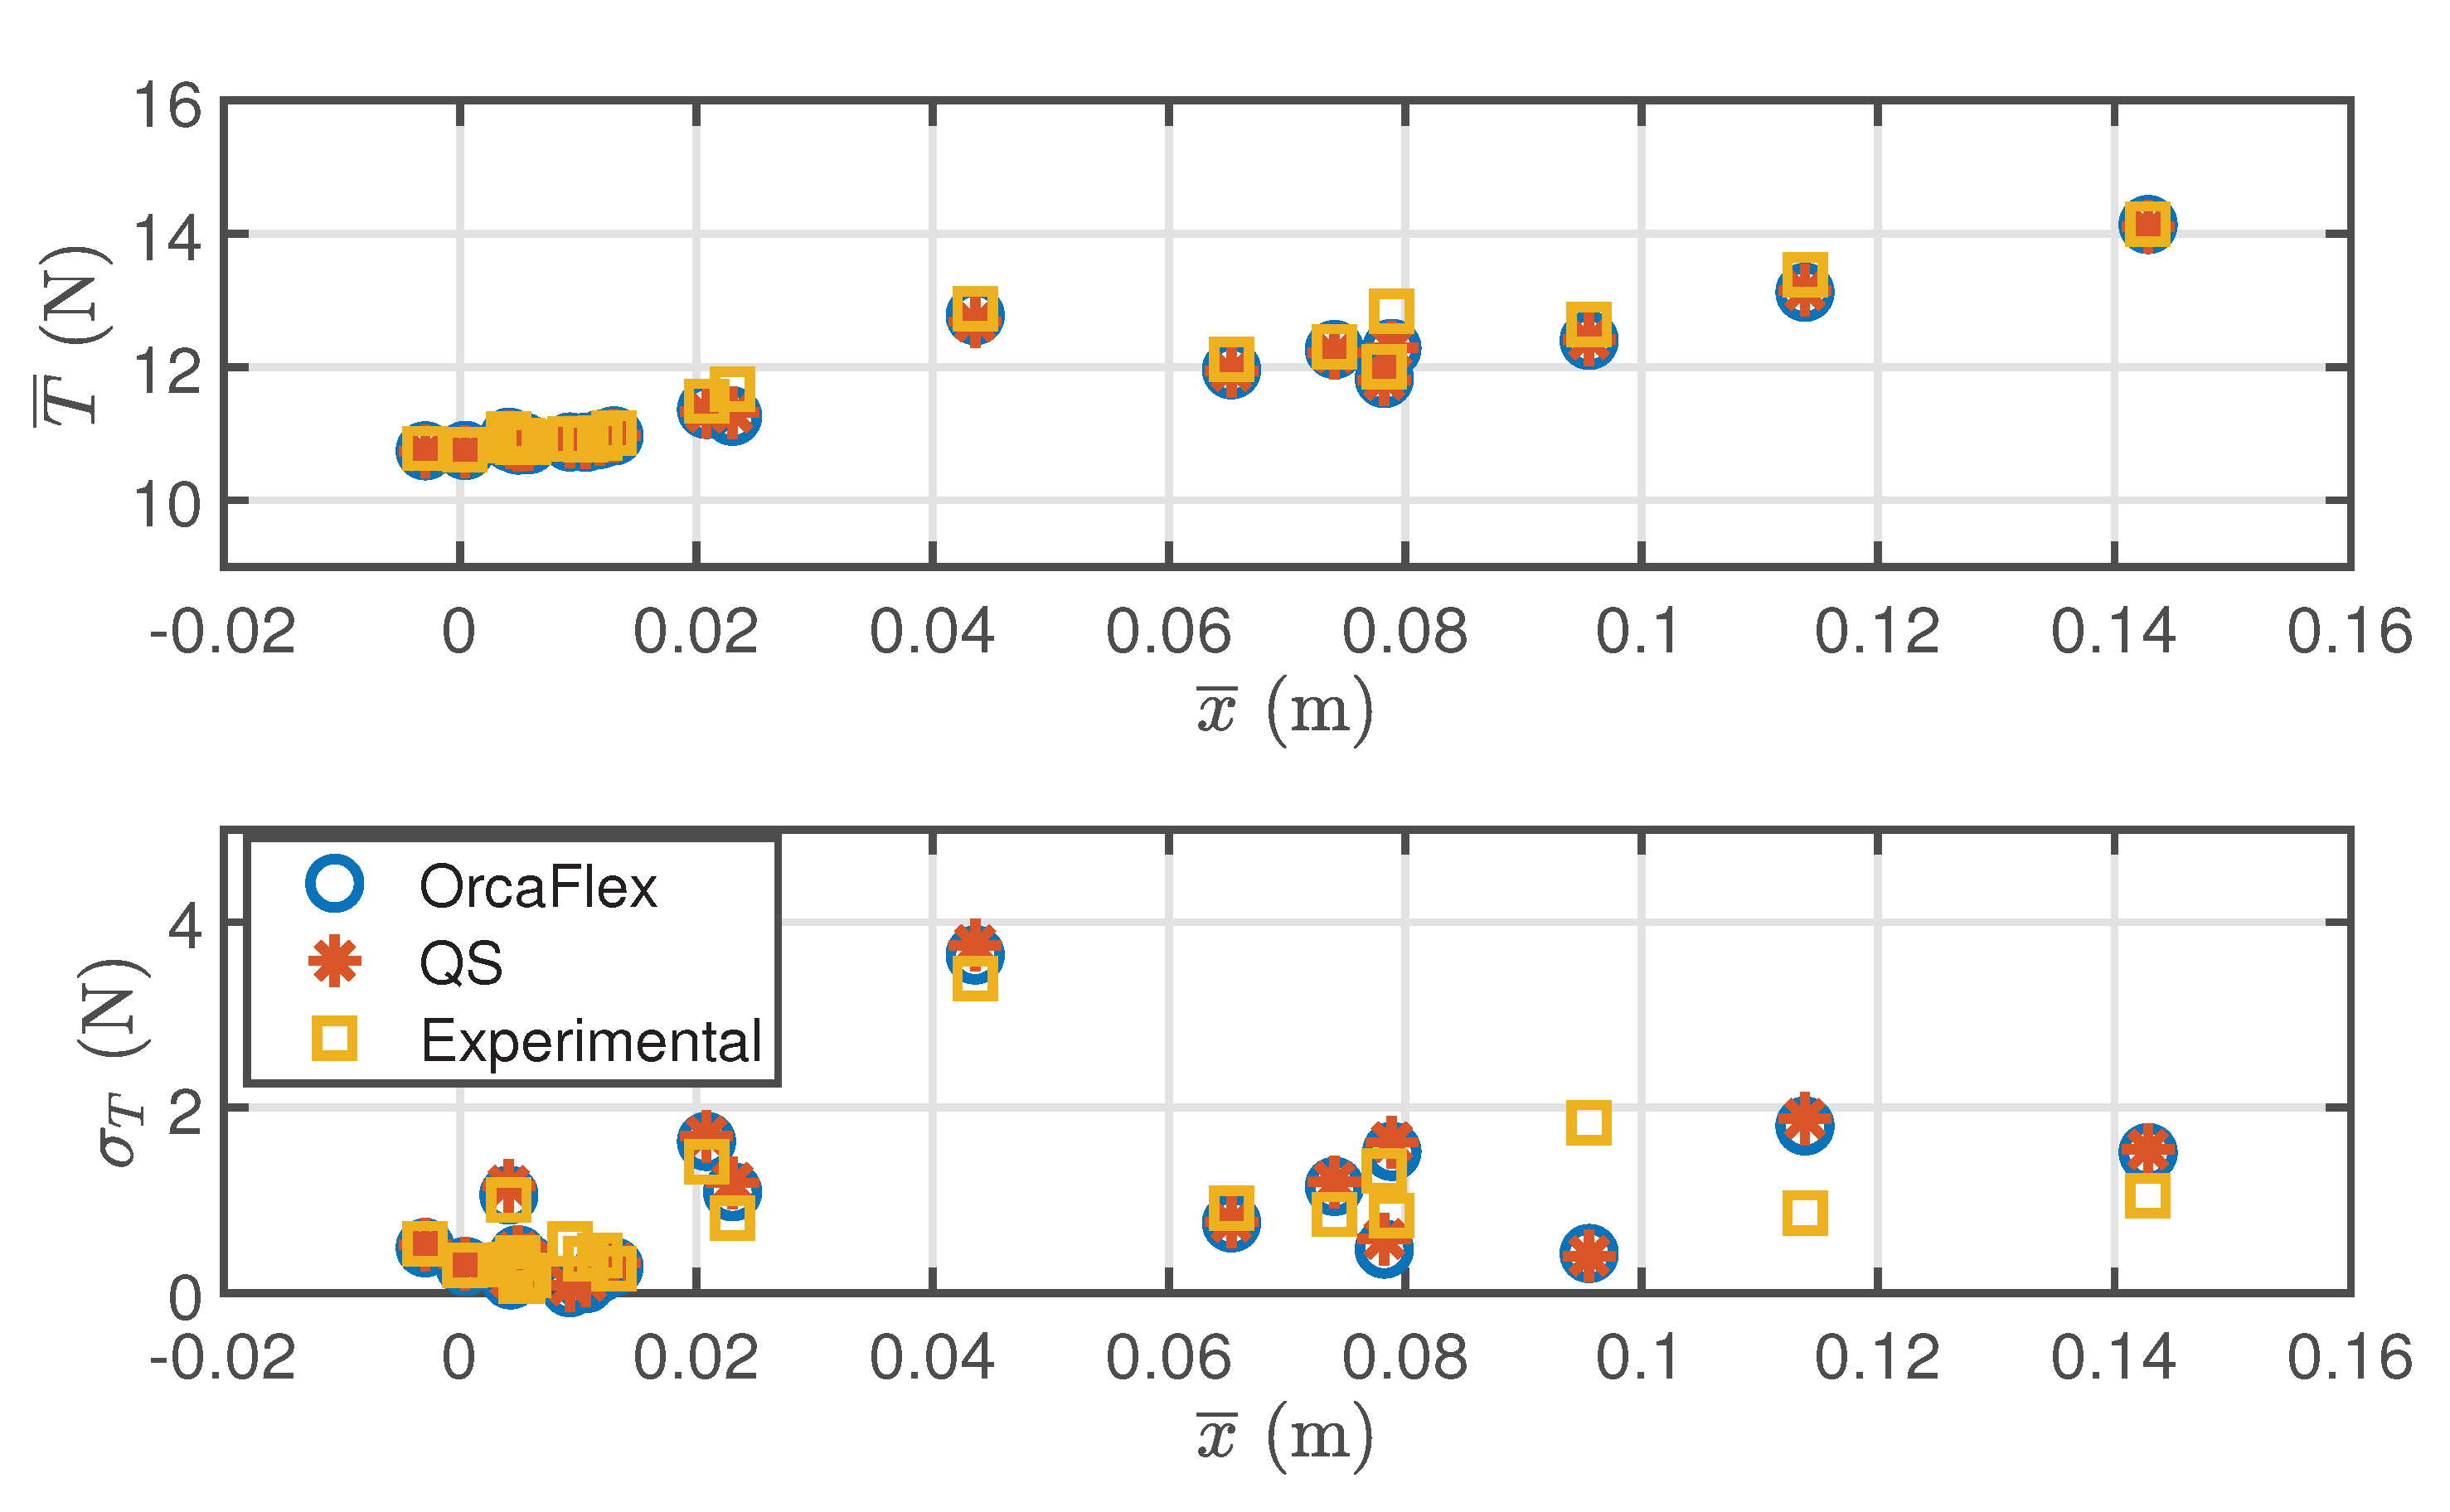
Figure 10 compares the mean tension (
) and the standard deviation of the tension (
) at the fairlead of the front line (line 1), showing the two models (QS and OrcaFlex) and experimental results. The two mathematical models mostly overlap and appear to be equivalent. Such a good agreement between a static and a dynamic mooring modelling approach is justified by the low speed of mooring components and especially by the semi-taut nature of the mooring configuration. Furthermore, the WEC inherently acts as a low-pass filter, due to its inertial properties, so that the high-frequency dynamics of the mooring model are not excited, favouring the matching between QS and OrcaFlex models.
Comparing both numerical models with experimental data, an overall good fit is also found. In particular, while the mean tension prediction is accurate for all waves, the standard deviation is reproduced with good fidelity for all waves but the ones with ID from 3 to 6 (see
Table 1), which do not closely follow the experimental trend. In order to further analyse such data, a correlation between error and experimental data was considered, using wave steepness, wave period and mean surge of the test as a reference metric. Only correlation using mean surge values has been shown because with the other tested parameters no strong correlation was found.
In
Figure 11, only regular waves have been considered, as they show a larger error in terms of standard deviation between models and experimental data. Therefore, also including irregular waves would make
Figure 11 unreadable.
Figure 11 shows a clear linear correlation between the mean tension and the mean drift in surge. Such a correlation is expected, as surge offset determines mean lines tension. Conversely, considering standard deviation values, differences between models and experimental values increase for higher surge values, showing that correctly reproducing the oscillation of line tension is more challenging when the line pull increases. Therefore, while such mathematical models may be inadequate for extreme events and survivability analysis, they seem appropriate for normal operation and in the power production region, where mean drift and mean tension are supposed to be relatively low.
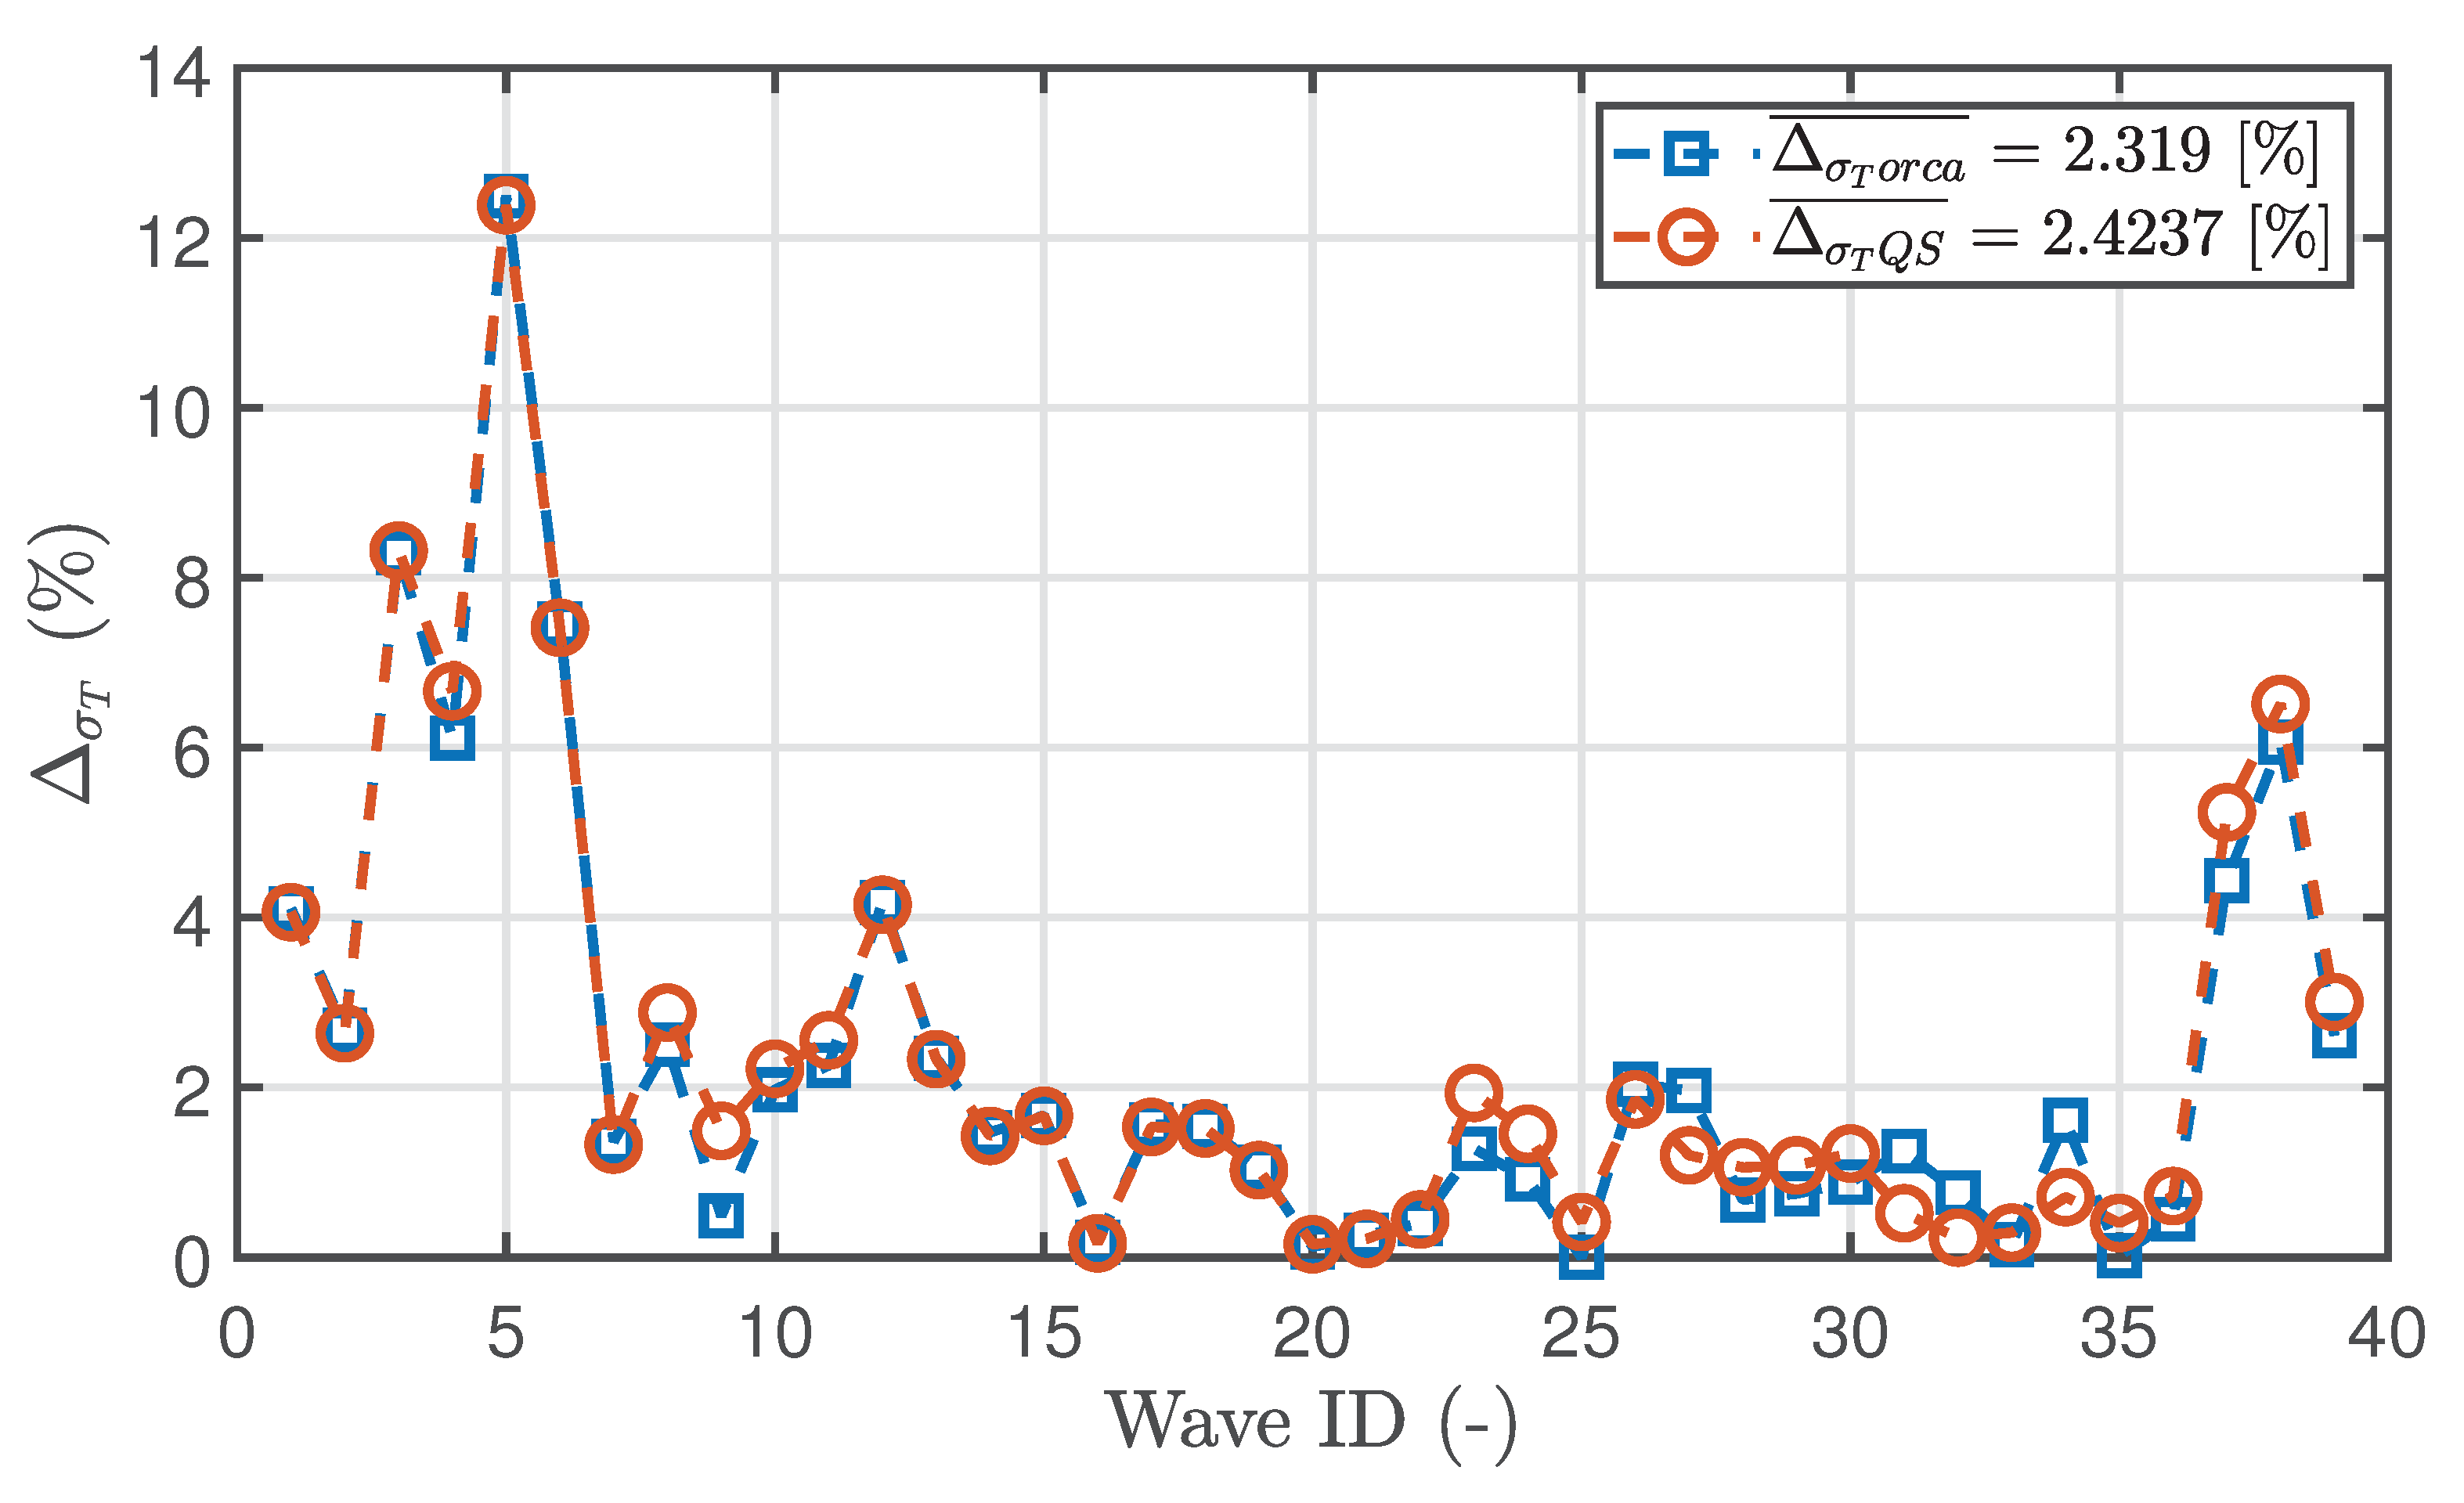
Finally, in order to provide a quantitative evaluation of the overall accuracy of the models for the whole range of considered waves,
Figure 12 shows the error between models and experimental data, defined as standard deviation variation (
) as follows,
where
is the standard deviation from the models (either OrcaFlex or QS),
is the experimental fairlead tension and
is the static tension value of the line. The static tension (or pre-tension) value has been considered for the normalisation, as it is a meaningful quantity, equal for all wave conditions, favouring a fair comparison. The majority of wave conditions show an error below 2%, while poor performance is found for a relatively small number of instances, especially wave ID 3–6.
5. Discussion
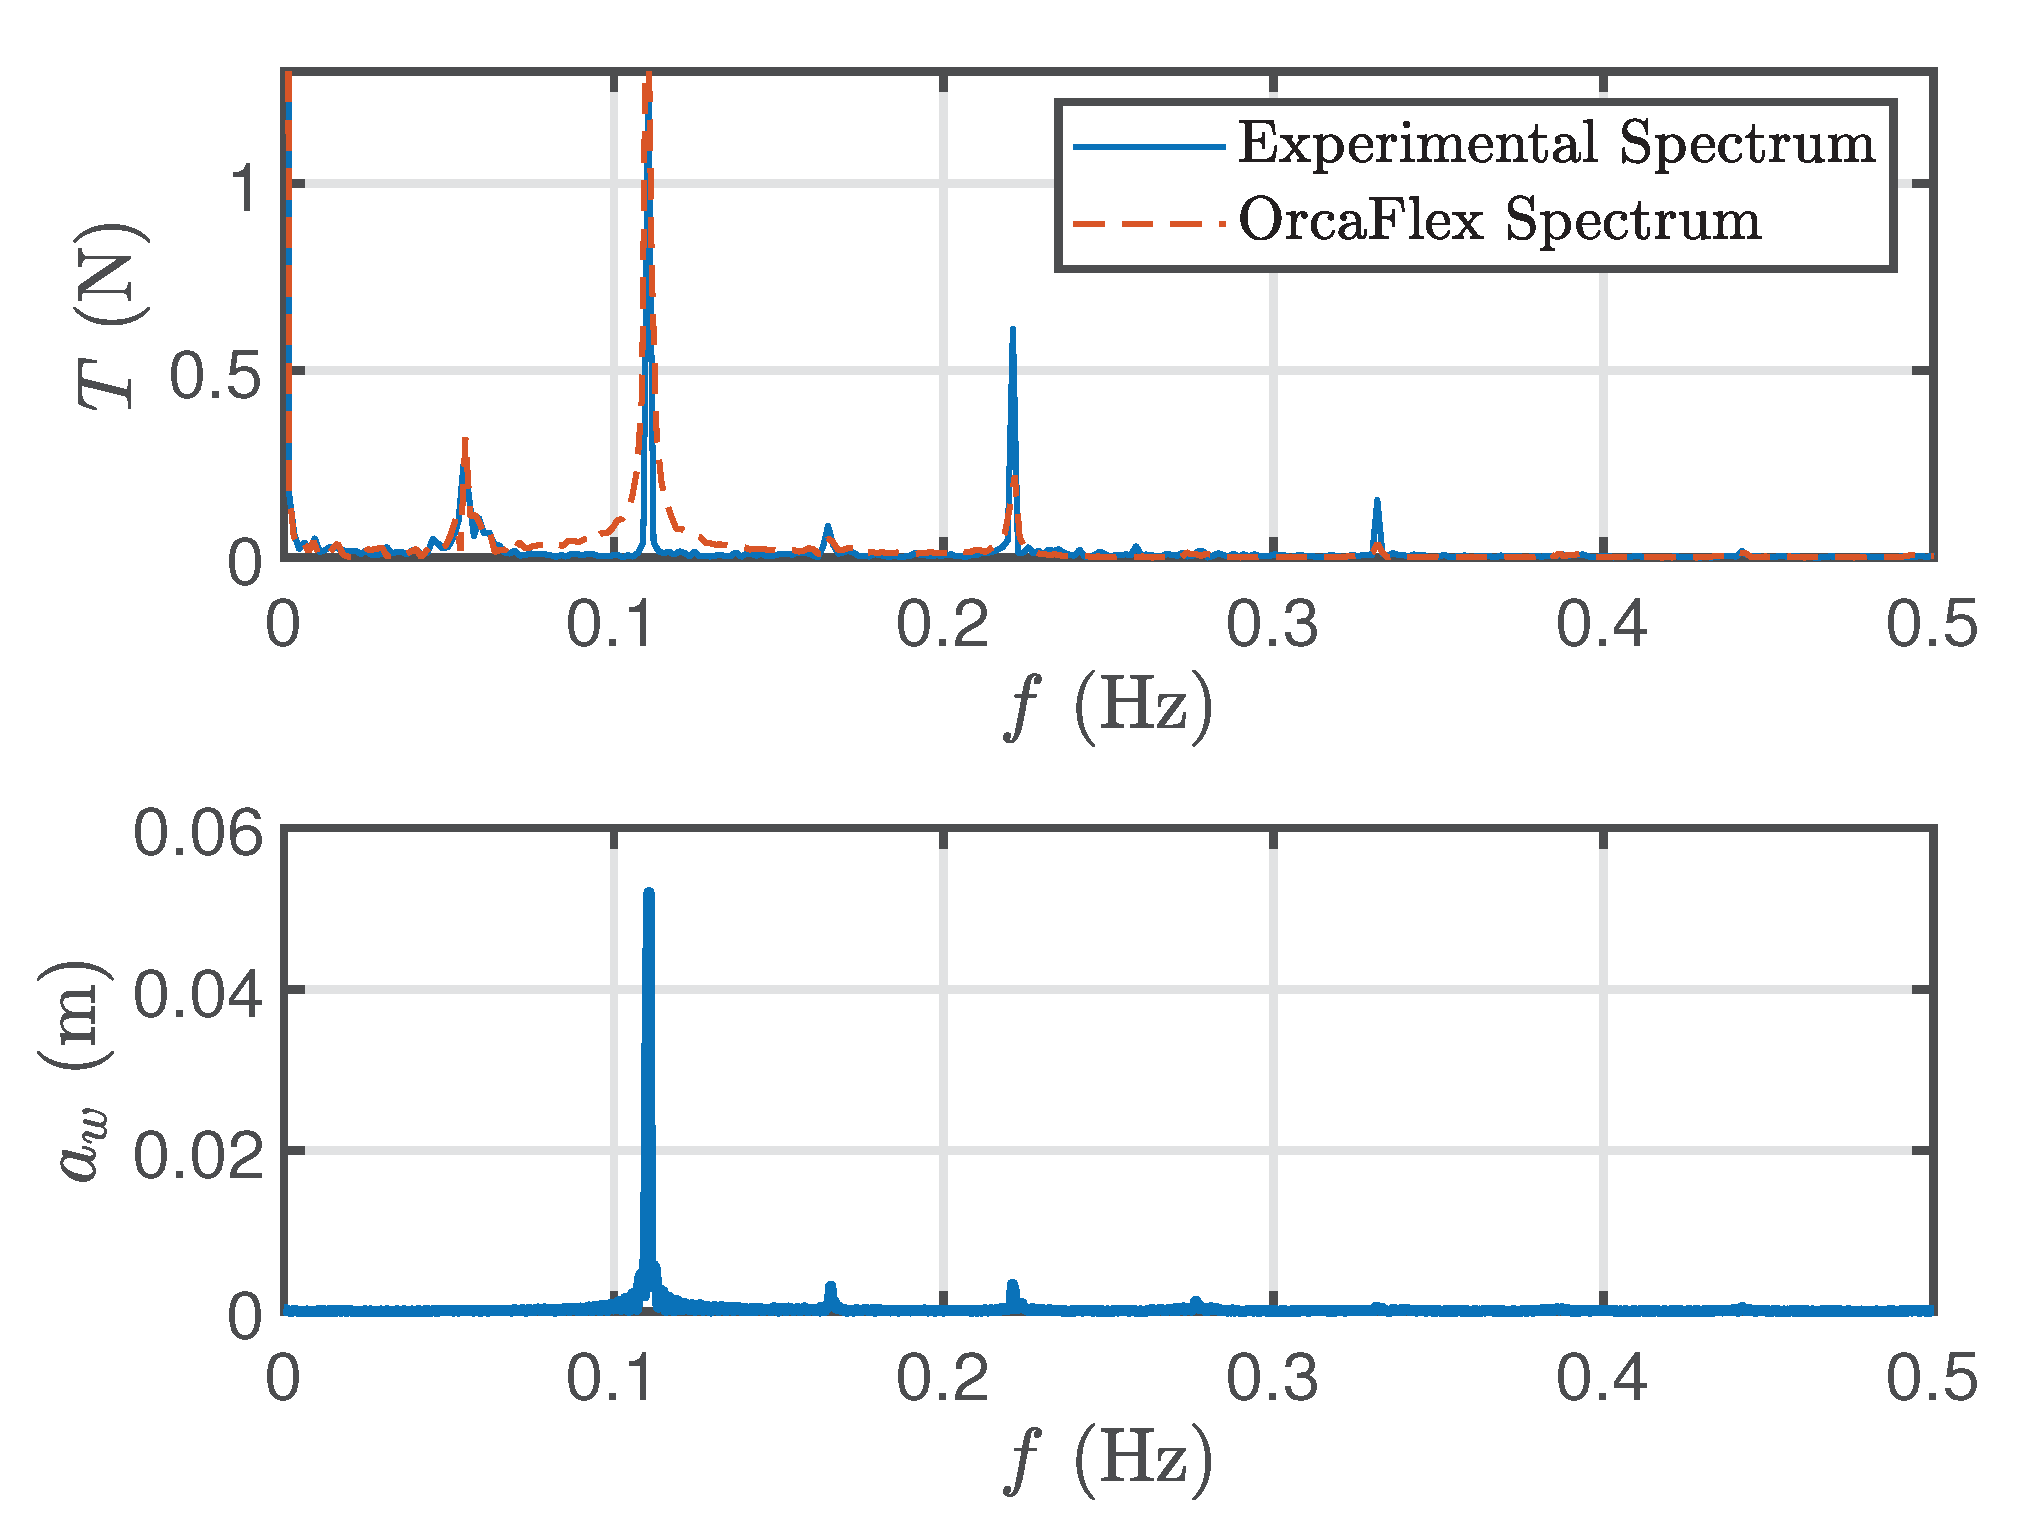
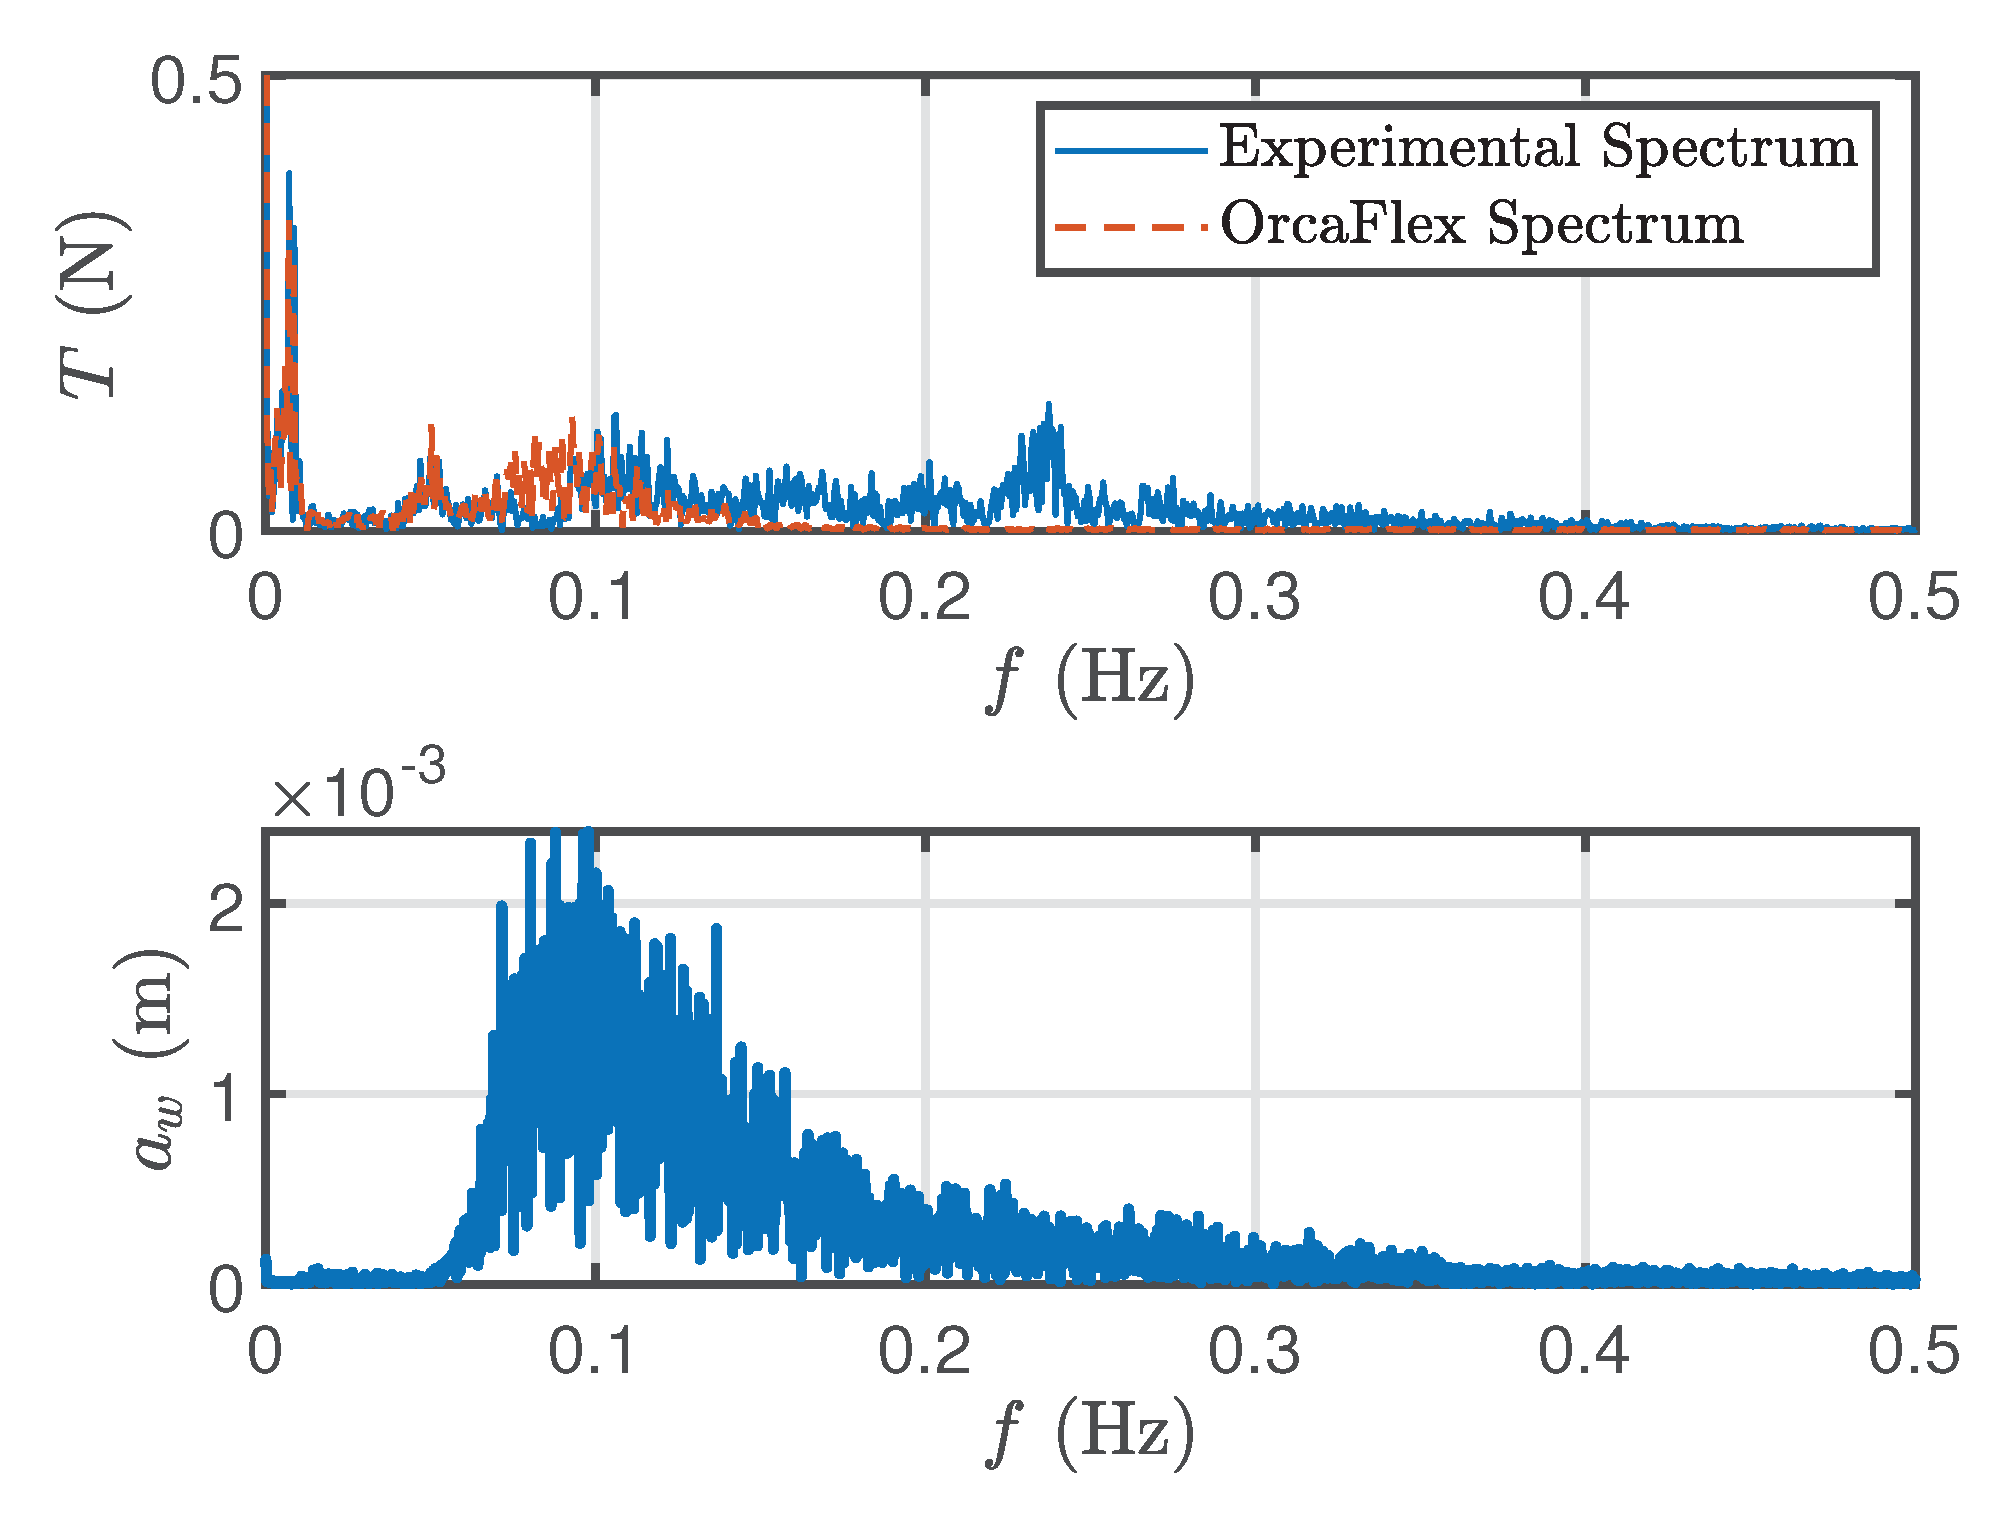
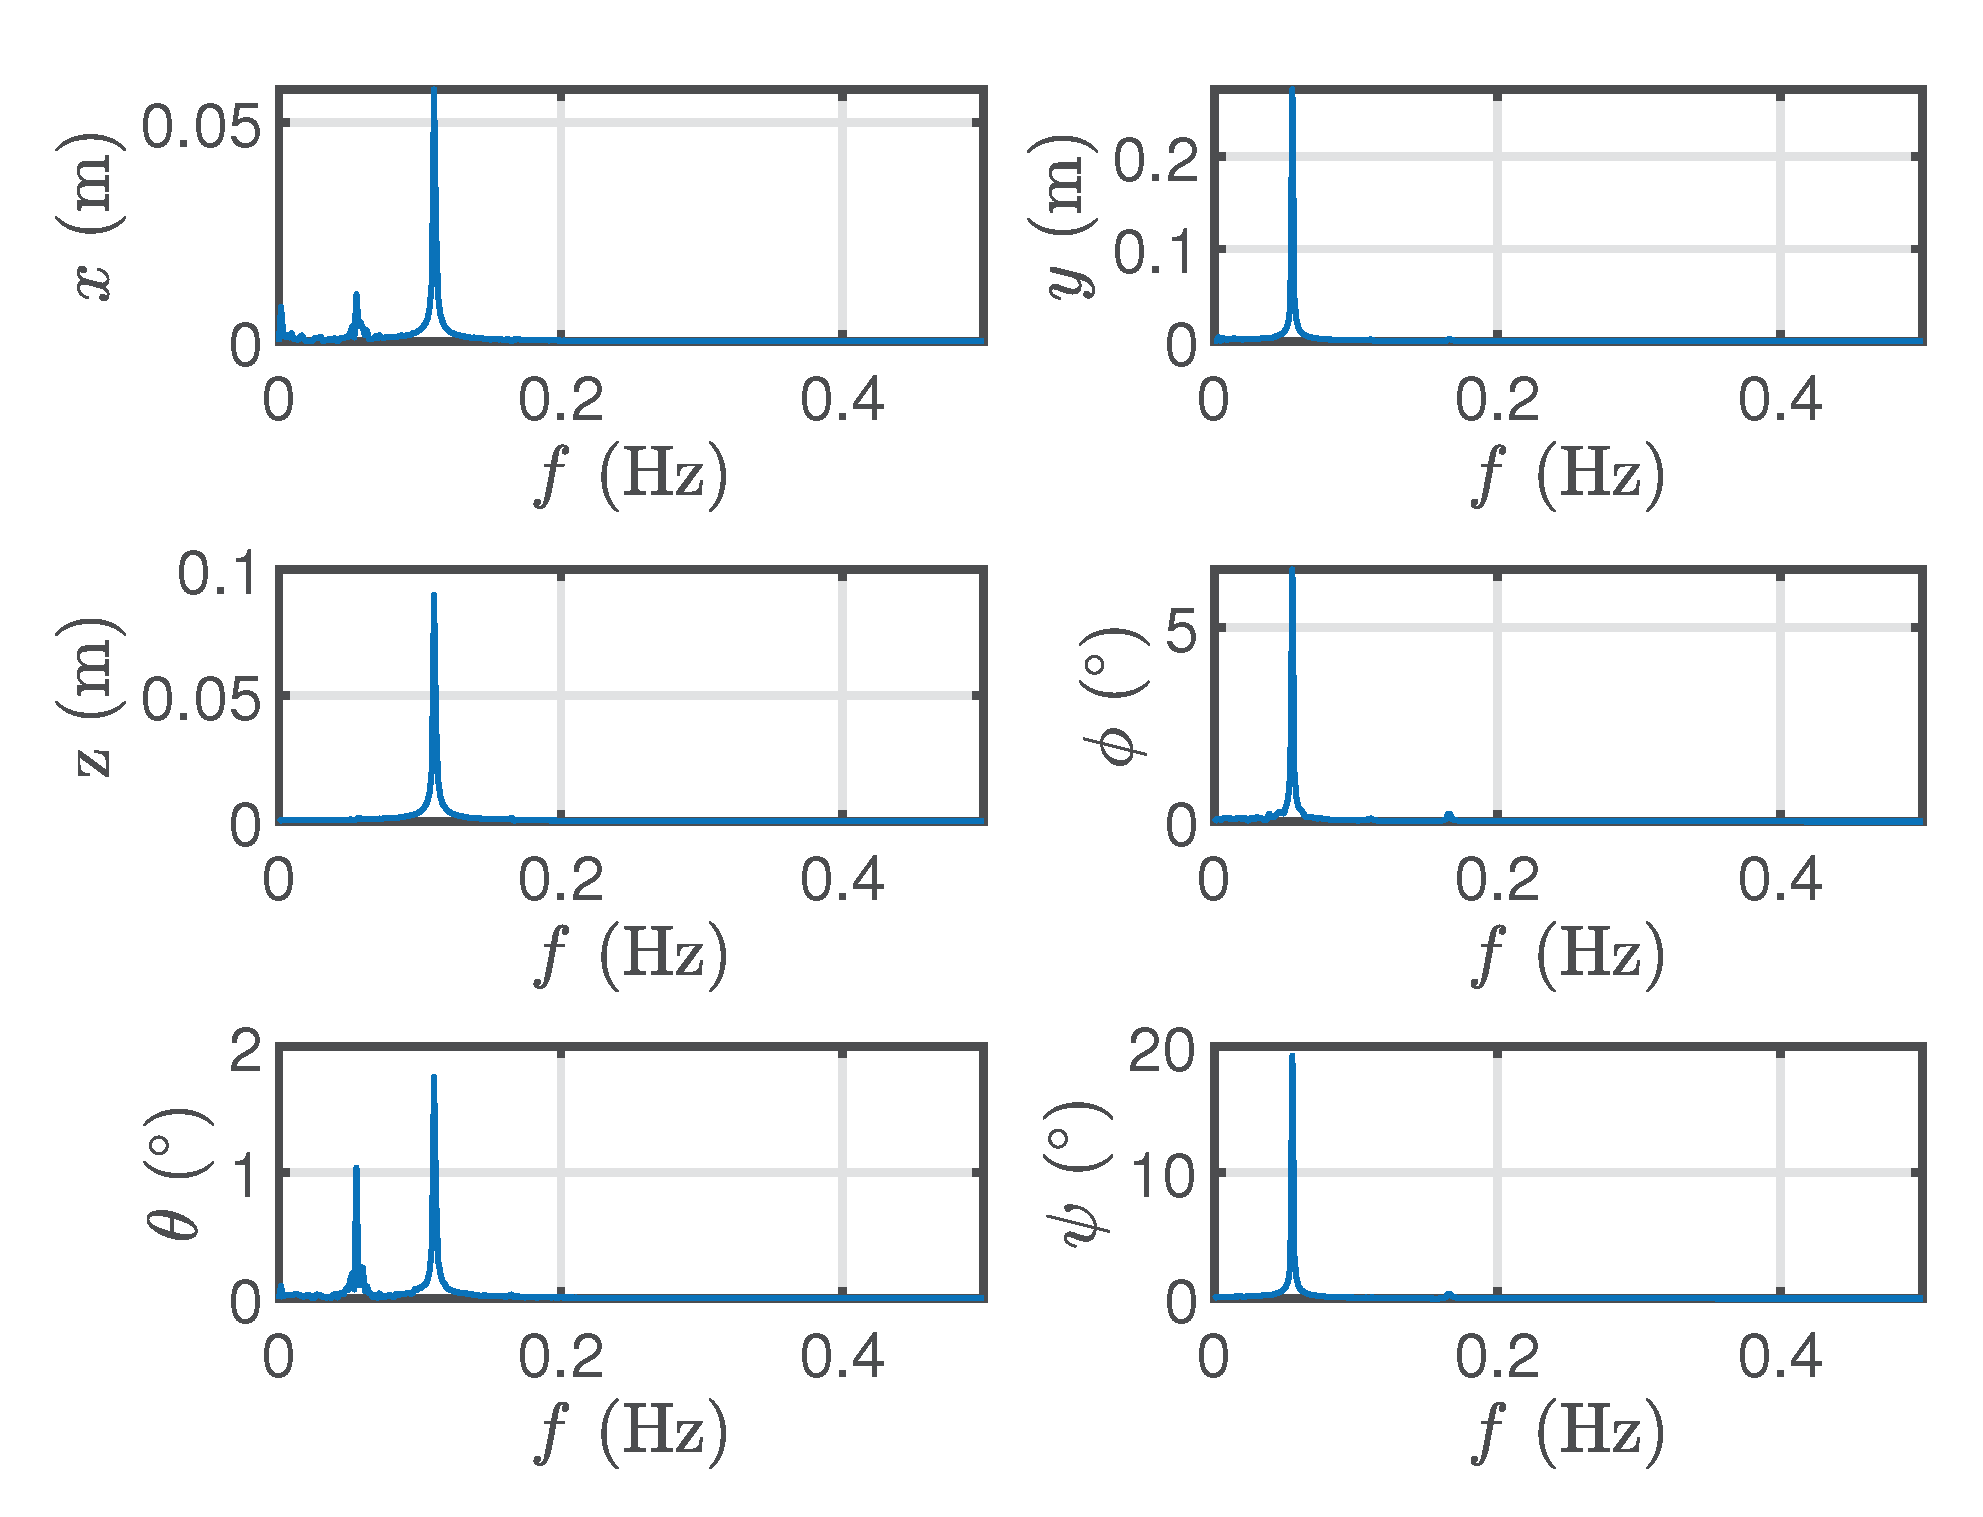
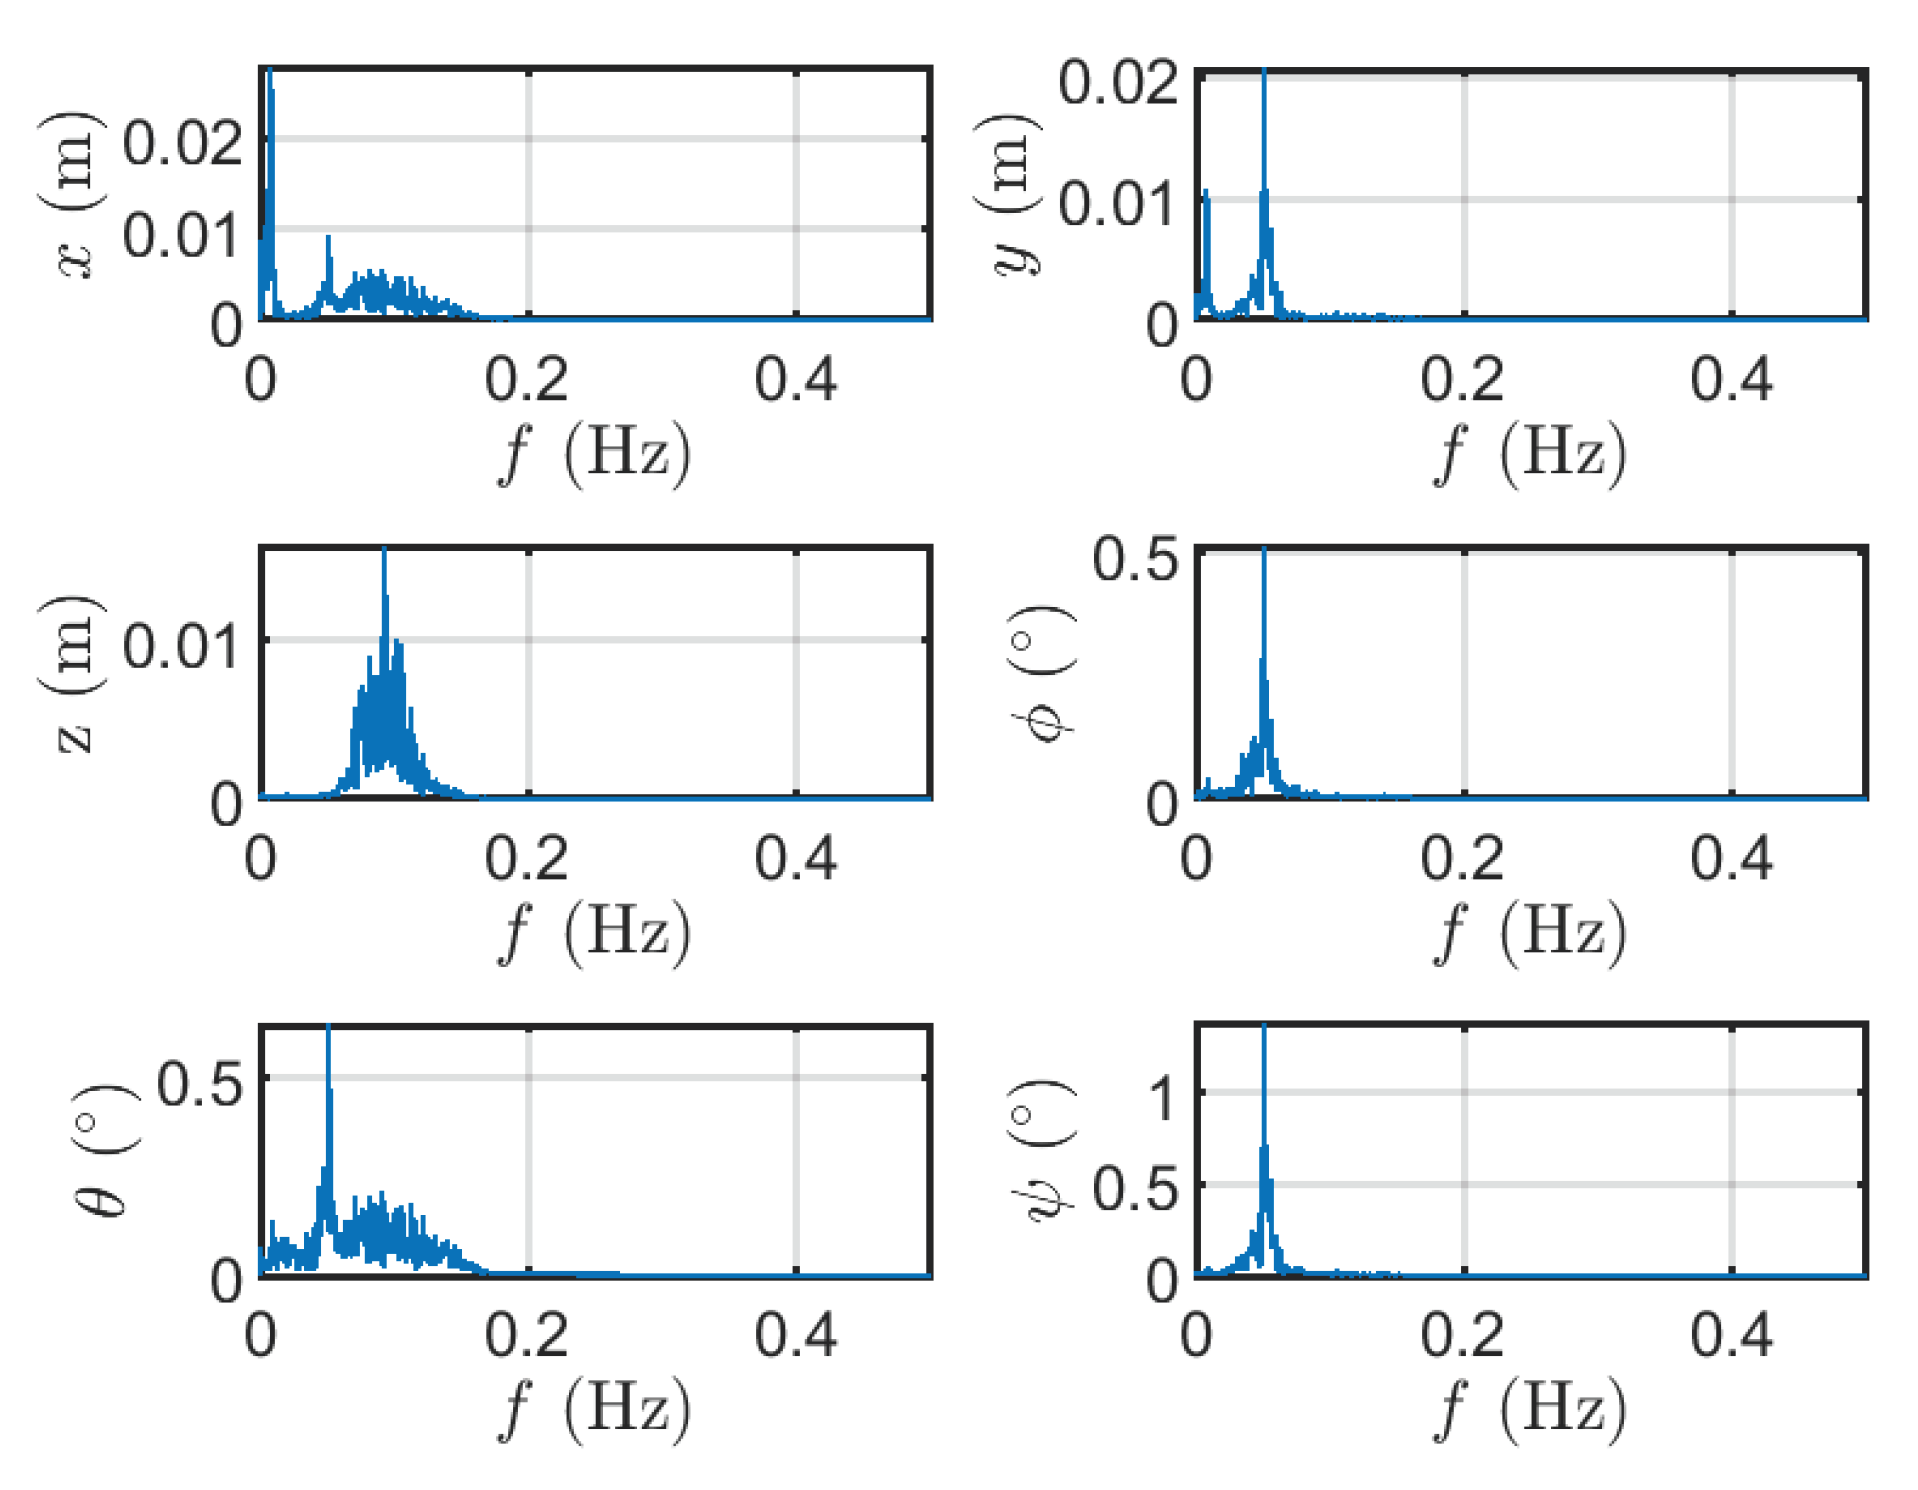
A further investigation has been performed in order to better understand the differences between model and experimental data. After considering the time histories to compare mean and standard deviation values, another comparison has been done in frequency domain. In
Figure 13 and
Figure 14, there are the tension spectra for representative regular and irregular waves (wave ID 1 and wave ID 23, respectively), showing the tension on the top and the incident wave on the bottom. Low-frequency peaks of the tension response are relatively well depicted, in both regular and irregular wave conditions. However, a peak in high-frequency content at ~
Hz is found in the experimental data, while almost absent in the numerical data. This peak is not apparently motivated by some component in wave spectrum, shown in the bottom plot of
Figure 13 and
Figure 14, nor in device kinematic spectra, shown in
Figure 15 and
Figure 16.
These peaks (present in other waves as well) could be due to an internal resonance of the coupled mooring-WEC system, which can be analysed by a modal analysis built-in tool of OrcaFlex.
In
Table 6, there are the lowest computed modes of the system, referring to the mooring lines. As all three lines are virtually the equal, it can be seen that modes are grouped in triplet, with the first modal frequency equal to ~0.33 Hz. Frequencies identified by OrcaFlex are away from the detected 0.23 Hz of
Figure 13 and
Figure 14. Such a discrepancy between resonance frequency found in the experimental results (~0.23 Hz) and the one from numerical modal analysis (~0.33 Hz) may be caused by model uncertainties. The most impacting uncertainties affecting the model representativeness are the following.
Lines length (high sensitivity of the model).
Lines stiffness (specially for taut, semi-taut mooring).
Attachments properties (jumper and clump weight).
Wave effects on mooring lines.
Anchors position.
In fact, other studies [
37,
59] show that such a semi-taut mooring configuration is prone to experience high-frequency response, typically above the range of frequencies of the floater response. The authors of [
37,
59] also suggest that such a high-frequency resonance is highly sensitive to the mooring lines length and stiffness, as well as the net buoyancy of the riser and clump weight. The level of measure accuracy required to correctly estimate such parameters and the consequent dynamic behaviour at high frequency is not compatible with the measurement resolution and uncertainties at such a small scale of the testing (1:32). Nevertheless, high-frequency components of the mooring loads are important for fatigue analysis, which is outside the scope of application for the modelling approaches here discussed. On the contrary, the focus is on investigations concerning normal operation in the power production region, so that the range of frequencies where the device is responsive is of interest. As floating WECs are effectively low-pass filters, the low-frequency characteristics of the mooring load is of interest, which is reproduced with sufficient accuracy by both QS and OrcaFlex models.
6. Conclusions
The choice of a particular mathematical model is based on an appropriate compromise between different competing objectives: among the most common are accuracy, computational cost, complexity, flexibility and eventual licence cost. This paper attempts to compare three models representative of different priorities: a in-house QS solver, best for computational time and flexibility; a commercial industry-standard software (OrcaFlex), best for accuracy; and an open source software (MoorDyn), clearly best for licence cost (none). In order to compare and validate such modelling approaches, this paper considers a semi-taut mooring system of a 1:32 prototype of the Spar-buoy floating oscillating water column wave energy converter. As a remark, all results and conclusions are specific to the type of mooring configuration (semi-taut lines) and scale (small). It is found that, in such conditions, MoorDyn has numerical instability issues and no appropriate tuning of its parameters was achieved.
Validation of the models has been done by imposing the experimental displacement of the floater and comparing resulting tensions. It is found that the QS model and OrcaFlex show good agreement, so that the increase in complexity is not justified by a significant increase in accuracy for the wave conditions considered, which cover the device operational conditions. However, this conclusion is strongly related to the semi-taut nature of the lines. It is expected that slack mooring lines would show larger discrepancies. Regarding the comparison with wave tank data, it is found that, at frequencies characteristic of the displacement of the floater, there is good agreement. However, experimental data show spectral energy of the tension at a frequency higher than the wave excitation, possibly due to internal resonance of the mooring system. This was not detected in the mathematical model, probably because the natural frequency of the mooring system was not well represented. In fact, the natural frequency is highly dependent on the lines’ parameters, which have a relatively high uncertainty at small scale. However, overall it is found that both the QS and OrcaFlex models are able to accurately predict mooring loads.

 ,
, 


