Evolution of Fracture Aperture in Quartz Sandstone under Hydrothermal Conditions: Mechanical and Chemical Effects


1
Helmholtz Centre Potsdam, GFZ German Research Centre for Geosciences, 14473 Potsdam, Germany
2
Institute of Geosciences, University of Potsdam, 14476 Potsdam, Germany
*
Author to whom correspondence should be addressed.
Minerals 2020, 10(8), 657; https://doi.org/10.3390/min10080657
Submission received: 15 June 2020
/
Revised: 15 July 2020
/
Accepted: 21 July 2020
/
Published: 24 July 2020
Abstract
:Fractures efficiently affect fluid flow in geological formations, and thereby determine mass and energy transport in reservoirs, which are not least exploited for economic resources. In this context, their response to mechanical and thermal changes, as well as fluid–rock interactions, is of paramount importance. In this study, a two-stage flow-through experiment was conducted on a pure quartz sandstone core of low matrix permeability, containing one single macroscopic tensile fracture. In the first short-term stage, the effects of mechanical and hydraulic aperture on pressure and temperature cycles were investigated. The purpose of the subsequent intermittent-flow long-term (140 days) stage was to constrain the evolution of the geometrical and hydraulic fracture properties resulting from pressure solution. Deionized water was used as the pore fluid, and permeability, as well as the effluent Si concentrations, were systematically measured. Overall, hydraulic aperture was shown to be significantly less affected by pressure, temperature and time, in comparison to mechanical aperture. During the long-term part of the experiment at 140 °C, the effluent Si concentrations likely reached a chemical equilibrium state within less than 8 days of stagnant flow, and exceeded the corresponding hydrostatic quartz solubility at this temperature. This implies that the pressure solution was active at the contacting fracture asperities, both at 140 °C and after cooling to 33 °C. The higher temperature yielded a higher dissolution rate and, consequently, a faster attainment of chemical equilibrium within the contact fluid. X-ray µCT observations evidenced a noticeable increase in fracture contact area ratio, which, in combination with theoretical considerations, implies a significant decrease in mechanical aperture. In contrast, the sample permeability, and thus the hydraulic fracture aperture, virtually did not vary. In conclusion, pressure solution-induced fracture aperture changes are affected by the degree of time-dependent variations in pore fluid composition. In contrast to the present case of a quasi-closed system with mostly stagnant flow, in an open system with continuous once-through fluid flow, the activity of the pressure solution may be amplified due to the persistent fluid-chemical nonequilibrium state, thus possibly enhancing aperture and fracture permeability changes.
1. Introduction
The long-term fluid and mass transport in fractured rock masses with low matrix permeability under crustal conditions is of significant importance, e.g., for the accumulation of mineral or ore deposits, and deep geothermal energy utilization. Studies show that water-saturated quartz sands undergo substantial time-dependent compaction at constant pressure, compared to dry aggregates [1]. In addition, elevated temperatures significantly affect the compaction process of propped fractures [2,3]. The mechanism behind these phenomena is considered to be pressure-induced mineral dissolution. These combined effects are typical in hydrothermal, as well as in enhanced geothermal systems (EGS) when injecting or circulating fluids into or within the host rock. This, in turn, determines the sustainability and lifespan of these reservoirs, not least for resource exploitation and energetic use.
Stress-induced mineral dissolution has previously been studied in unconsolidated aggregates (e.g., quartz grains) under diagenetic conditions [4,5,6,7,8,9], and in rock fractures (e.g., novaculite and granite) under hydrothermal conditions [3,10,11,12]. This provided insight into the mechanism of pressure-induced dissolution, which incorporates three processes: minerals in propping asperities (in fractures, or described as grain-to-grain contacts in aggregates) dissolve inside the contact areas, after which the dissolved minerals diffuse from the inside of the contacts to their peripheries through a thin water film between the adjacent asperities, and ultimately deposit on the free pore walls [13,14]. This process consequently drives the irreversible and time-dependent porosity reduction in grain aggregates, and/or permanent fracture closure. In essence, the compaction of aggregates and the fracture closure result from the same mechanism. Pressure solution is described by a rate-limiting process. Therefore, the progress is determined by the slowest of the three processes above [5,14]. In addition to the stress-induced mineral dissolution, the solid phases on the free grain or fracture surfaces can also dissolve into the solvent, which is called free-face dissolution, yielding the retreat of these surfaces [3,15]. The two dissolution processes have opposite effects on the geometric alteration of the fracture’s void space, thus overall determining the evolution of fracture permeability.
Previous studies have focused on the compaction of a fracture associated with pressure solution in an open system with water circulation [2,3,10], but most of these studies lack precise fluid chemical analyses. In an open system with water circulation, equilibrium in rock-fluid (i.e., water) interactions is not reached as a result of the continuous fluid exchange. Therefore, the reaction between the rock and the fluids can continuously proceed [2,3]. In contrast, in a closed system without water circulation in the void space, a chemical equilibrium may be achieved with time, and the diffusion of the solute may be inhibited due to the progressive reduction of the concentration gradients. Therefore, a question can be raised, i.e., will the rate-limiting process of pressure solution reach some relative equilibrium, and does this consequently affect the progress of fracture closure?
Elias and Hajash [16] investigated stress-induced quartz solubility using quartz aggregates in a closed system. Fluid samples were taken three times per week at 150 °C in irregular time intervals. The silica concentrations of the effluents were nonlinearly proportional to the applied pressure. Porosity continuously decreased at 150 °C, but remained constant at 23 °C. It was concluded that both temperature and pressure played important roles in this process. Another study performed by Yasuhara et al. [12] presents a long-term observation of the permeability evolution in Berea sandstone, containing a single saw-cut fracture, over about 1000 days. Effluent sampling and permeability measurements were intermittently conducted at regular time intervals of 5 or 10 days. There was almost no permeability reduction in the sample at 90 °C, while the permeability decreased by about one order of magnitude at 20 °C at the very end of the experiment. The Si concentrations of the effluents decreased with time. This experiment cannot unequivocally prove that the permeability reduction was induced exclusively by pressure solution, for the following reasons: firstly, saw-cut fractures may lead to a large contact area, and the stress distribution on the bridging asperities may not be sufficient for pressure solution; secondly, the applied confining pressure of 7.5 MPa may be insufficient for reaching the minimum activation energy of pressure solution; and finally, the fracture volume is unknown. Even though the initial pore volume was about 7 mL, each sample volume of 7 mL can significantly dilute the fluid within the fracture, because, as the matrix permeability is significantly smaller than the fracture permeability, the fluid mainly flows through the fracture, rather than through the rock matrix.
Three main factors should be seriously considered in the experimental procedure of investigations into pressure solution creep: small contact area ratios and sufficient effective stresses are needed; the volume of each effluent sample should be equal to the fracture volume; and brittle damages or plastic deformations of the fracture due to mechanical compaction need to be precluded. This study presents a long-term experiment with intermittent flow-through permeability measurements, in conjunction with a chemical effluent analysis. Additionally, the rock sample was microstructurally investigated with a µCT scanner before and after the experiment, to quantitatively analyze the induced fracture aperture variations.
2. Sample Material and Experimental Methods
2.1. Sample Preparation and Experimental Apparatus
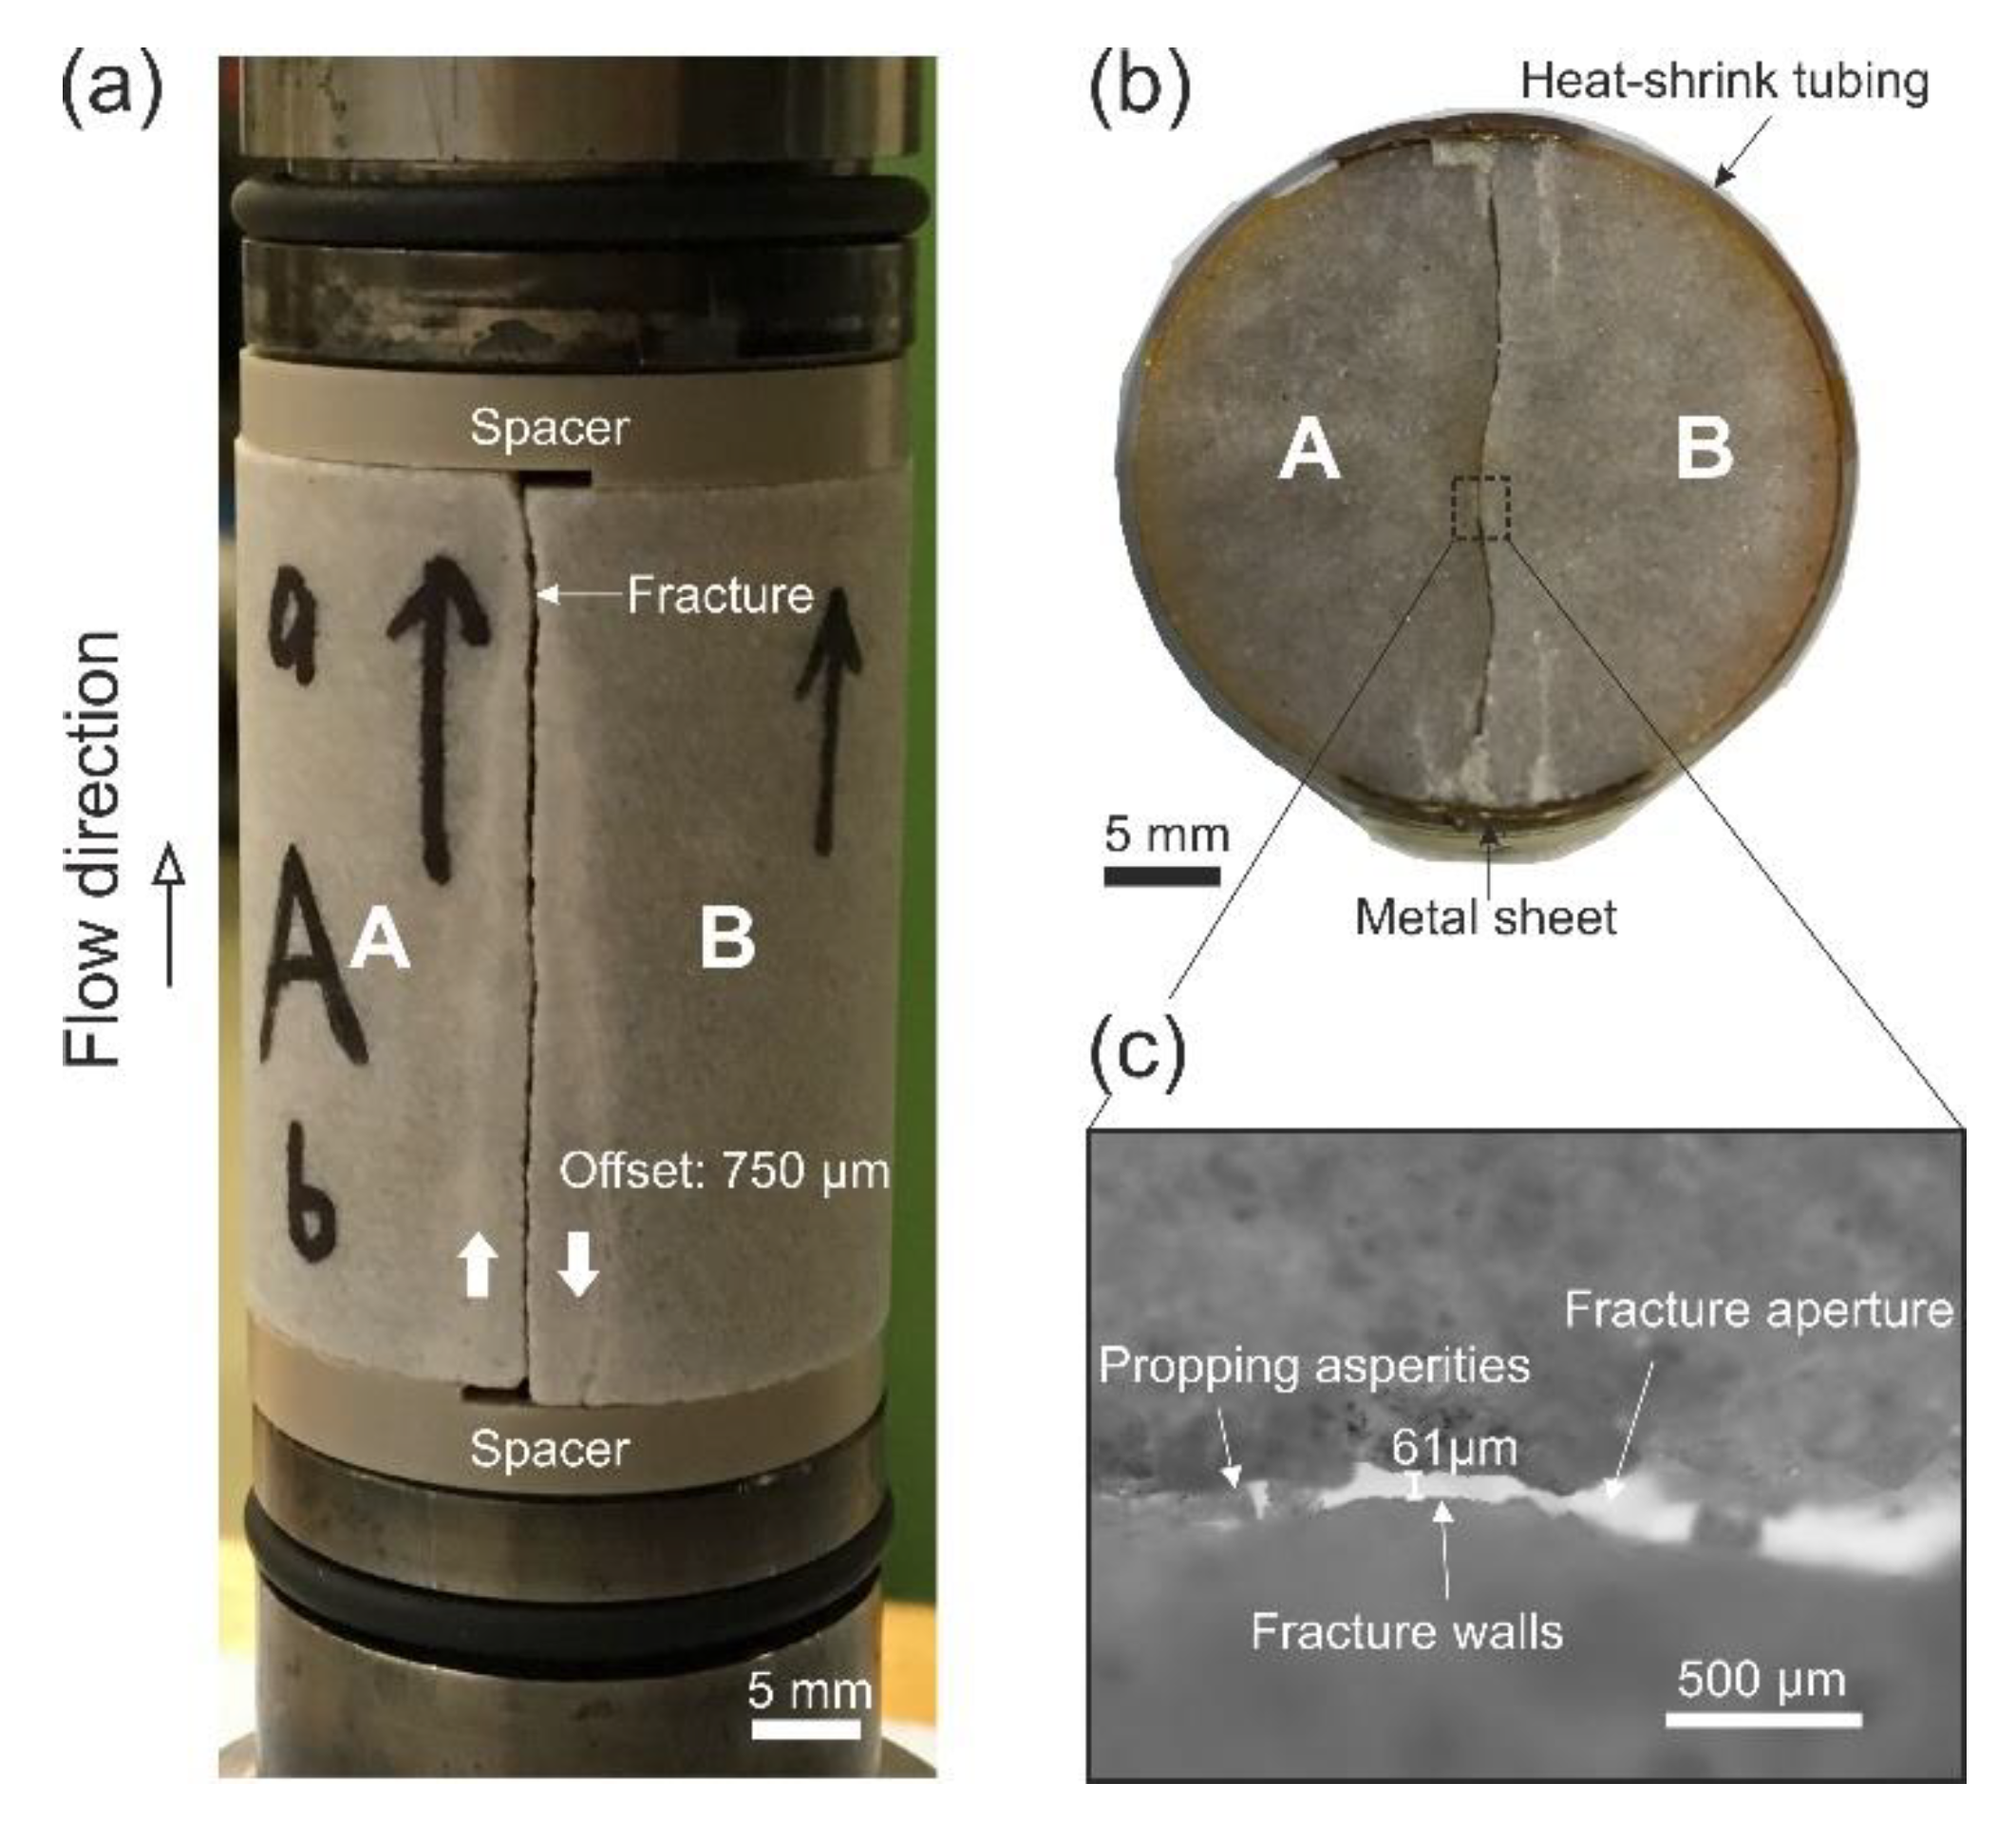
Fontainebleau sandstone was used for this investigation, which is a monomineralic rock with more than 99.5 wt % of quartz. It has a low matrix permeability in the order of 10−18 m2 and a low porosity of ~2.5%. A cylindrical sample with a diameter of 30 mm and a length of 40 mm was split by a Brazilian test setup into two halves. A single tensile fracture in the center of the rock sample was thus generated. Due to the geometry of the two halves, the fracture may immediately close under pressure when its two surfaces are aligned. Moreover, the matched fracture surfaces lead to a large contact area and the stresses on the bridging asperities may be insufficient to induce pressure solution, even under a high confining pressure. Therefore, the two halves were shifted by 750 µm along the principal axis using two spacers placed at the two ends of the sample (Figure 1a). This pre-displaced fracture is different from a shear fracture induced by shear movement under normal stress due to the absence of a gouge. Fracture aperture, in this case, is mainly self-propped by the contacting asperities associated with the fracture’s surface roughness. Figure 1a shows the assembled sample, where a heat-shrink tubing (Figure 1b) restrains the two halves and isolates the confining pressure from the pore pressure medium when the assembly is in the pressure vessel. Representative propping asperities, fracture walls and the fracture aperture are clearly visible in the magnified image taken by a micro-camera (Figure 1c).
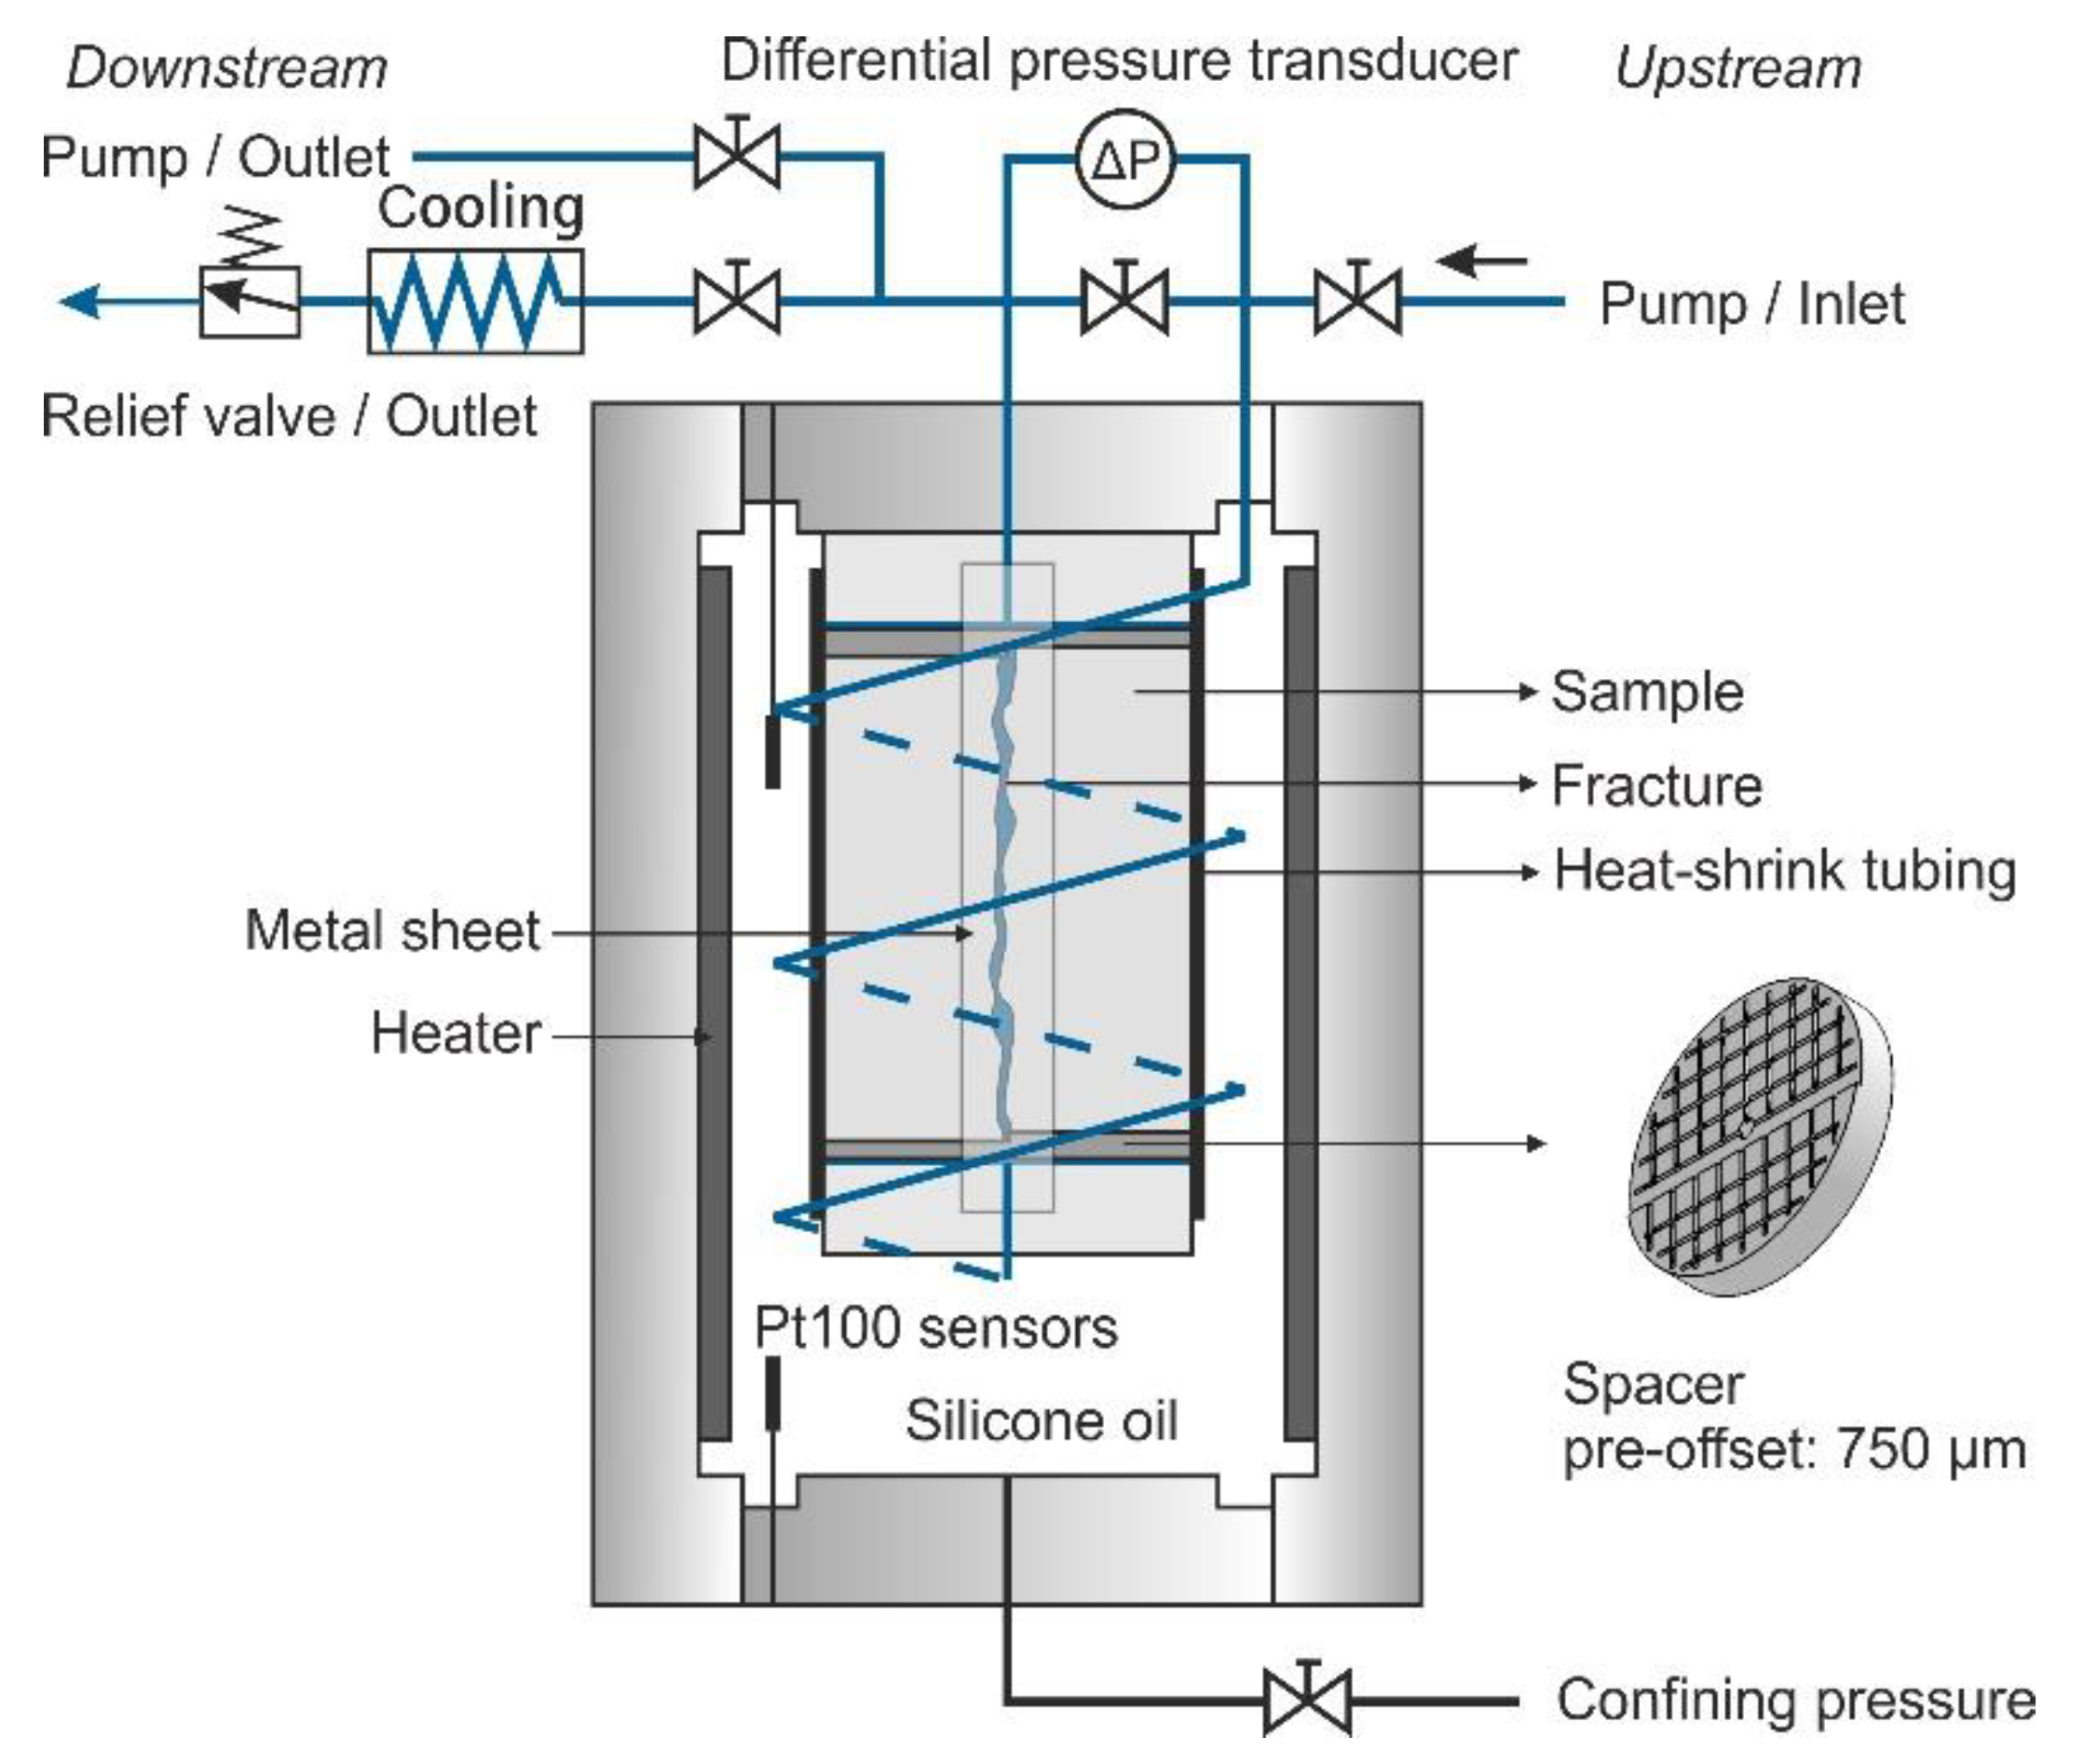
Figure 2 shows a sketch of the experimental apparatus used [17]. The assembled sample is mounted in a hydrostatic pressure vessel, where the confining pressure is produced by a syringe pump (ISCO 65D, Teledyne, Lincoln, Dearborn, MI, USA) using silicone oil. The oil within the pressure vessel can be heated with an electrical resistance heater connected to a temperature controller. The sample bottom is connected to an upstream pump (ISCO 260D, Teledyne, Lincoln, Dearborn, MI, USA) and its upper end is connected to either a similar downstream pump or an adjustable relief valve. The downstream pump is used for maintaining a precise constant pore pressure during the permeability measurements. With the relief valve, the effluents can be sampled at a predefined and constant fluid pressure. A spiral capillary between the relief valve and the sample is placed in cold water (~20 °C) and serves to cool the fluid during sampling. Water flows through the rock sample from the bottom to the top at a constant flow rate when sample permeability is measured. A differential pressure transducer (IPD 40, ICS Schneider Messtechnik, Hohen Neuendorf, Germany; 0~0.6 MPa range) is placed between the upstream and downstream ends of the sample so as to monitor pressure difference during the permeability measurements.
2.2. Experimental Procedures
Before the experiment, the sample was vacuum-saturated with deionized water. When applying confining pressure, pc, to the rock sample for the first time, the contacting asperities will be subject to high stress concentrations, yielding brittle damage and possibly some plastic deformation. The fracture aperture reduction resulting from this mechanical process is not related to any chemical reaction between the rock minerals and the fluid. On the other hand, a temperature increase may cause the volumetric expansion of the rock matrix and lead to geometrical changes of the aperture. Applying non-hydrostatic thermodynamics to pressure solution and free-face dissolution requires the assumption that all solid deformations are elastic and reversible [18].
Therefore, in this study, three loading–unloading confining pressure cycles between 5 MPa and 30 MPa were performed. The pore pressure, pp, was kept constant at 1 MPa throughout the experiment. The temperature, T, was then varied stepwise between room temperature and 140 °C. Permeability was measured at each constant P and T condition. After these initial pressure and temperature variations, constant confining and pore pressures, as well as a constant temperature, were applied for the long-term experiment of 137 days.
Table 1 shows the details of the experimental procedures, where the experiment follows the sequence of mechanical, thermal and chemical operations. Permeability was measured after the fluid flow was halted for time intervals of 8 or 16 days at constant P and T conditions. The effluent was sampled before each permeability measurement.
2.3. Sampling and Chemical Fluid Analysis
Deionized water was used as the permeant throughout the experiment. During the long-term intermittent flow-through experiment (after the mechanical and thermal operations), the flow was stopped for time intervals of 8 or 16 days, during which the fluid within the fracture aperture may gradually reach an elevated element concentration due to fluid–rock interactions. The fluid volume that is in direct contact with the solid phases within the fracture void space should be approximately equal to the aperture volume. However, the rock sample from end to end was not completely isolated from the pore fluid system. The fluid volume within the apparatus’ pore fluid system was significantly larger than the aperture volume. Consequently, the comparatively large volume of the effluent taken for one sample will definitely result in the dilution and mixing of the actual fluid within the fracture, leading to incorrect results of element concentration. On the other hand, one cannot precisely determine the volume within the relief valve and the capillaries at the downstream side. As such, a sample with an improper volume correction may also cause erroneous results.
To better detect and sample the fluid originating from the fracture itself instead, of from any other part of the pore fluid system, 20 continuous effluent subsamples were taken from the outlet capillary (i.e., the relief valve in Figure 2) at a constant flow rate of 0.5 mL/min, having a volume of about 0.5 mL each. A permeability measurement was subsequently conducted. Therefore, the pore fluid system including the fracture was completely flushed with deionized water, causing a reset of the pore fluid composition.
The subsamples were then diluted 10 times and the silica (Si) element concentration was immediately measured by a photometer (Filterphotometer photoLab WTW-S12, (Xylem Analytics, Weilheim, Germany) at a wavelength of 665 nm in a measurable range of 0.1–5 mg/L Si. In addition, two series of subsamples were analyzed with an inductively coupled plasma-optical emission spectrometer (5110 ICP-OES, Agilent, Santa Clara, CA, USA).
Silica may exist as soluble silica, as colloids, or as suspended particles in water. It may also be monomeric or polymeric, depending on the aqueous conditions. The test method of the photometer is based on the blue reduced silicomolybdate complex, and this method can only measure the molybdate-reactive silica (i.e., mainly dissolved silicates, monomeric silica and silicic acid) in water. Highly polymerized or colloidal silica do not react with the molybdate reagent, and consequently cannot be detected. Therefore, the results derived with a photometer may underestimate the actual Si concentration when high amounts of polymers exist. However, and in contrast, ICP-OES is capable of determining the total silica concentration of all silica types in water [19].
2.4. Determination of Fracture Aperture
The downstream side of the pore fluid system was switched from the relief valve to the downstream pump after effluent sampling (Figure 2). Permeability was subsequently measured at a constant flow rate, Q, higher than that used during the sampling procedure. The differential pressure, ΔP, between the sample ends was monitored with a differential pressure transducer. With the assumptions that Darcy’s law is valid and that the flow of the incompressible Newtonian fluid in the fracture is laminar, by applying the parallel plate model and the related so-called “cubic law”, hydraulic aperture, bh, can be expressed as [20,21].
where μ, W and L are fluid viscosity, fracture width (sample diameter) and sample length, respectively.
After each permeability measurement, all valves were closed except for the inlet-valve of the downstream pump to minimize the pore fluid volume. The downstream pump was needed in order to maintain a constant pore pressure (1 MPa) within the sample. Additionally, during the purely mechanical stage 1 (Table 1), the total fluid volume changes, ΔV, in the pore fluid system were monitored during the loading–unloading cycles using the downstream pump. The mechanical aperture changes were subsequently calculated from
where ΔVp is the corresponding pore volume change of the rock matrix, which can be theoretically estimated based on linear isotropic poroelasticity [22]
where Δpe is the effective pressure change, Vb is the sample bulk volume and Kb = 34 GPa is the static bulk modulus of a Fontainebleau sandstone with a porosity of 2.5%, estimated based on [23] and assumed constant in the pressure range between 5 and 30 MPa. The crack porosity of a Fontainebleau sandstone with a porosity of 4%, closed at an applied initial stress of 5 MPa, is only 0.01% [24], which thus can be neglected in the present calculations. Finally, Ks is the solid bulk modulus of the quartz grains, generally taken as 37 GPa [25].
2.5. X-ray Computed Micro Tomography (µCT)
The microstructure of the assembled but dry sample was observed with an X-ray µCT scanner (GE Phoenix nanotom m 180) before and after the experiment, under atmospheric conditions. To ensure the comparability of the data, the same measurement settings (i.e., timing: 500 ms, voltage: 120 kV, current: 90 µA) were used and a total of 1080 slices were taken at a resolution of 20.63 µm. Three-dimensional (3-D) models of the rock sample were then reconstructed based on all of these slices. The fracture void space was finally extracted from the 3-D model and analyzed. Due to the low matrix permeability and the low porosity of the sample, the matrix pore space was not investigated further.
3. Results
3.1. Effects of Pressure and Temperature on Fracture Aperture
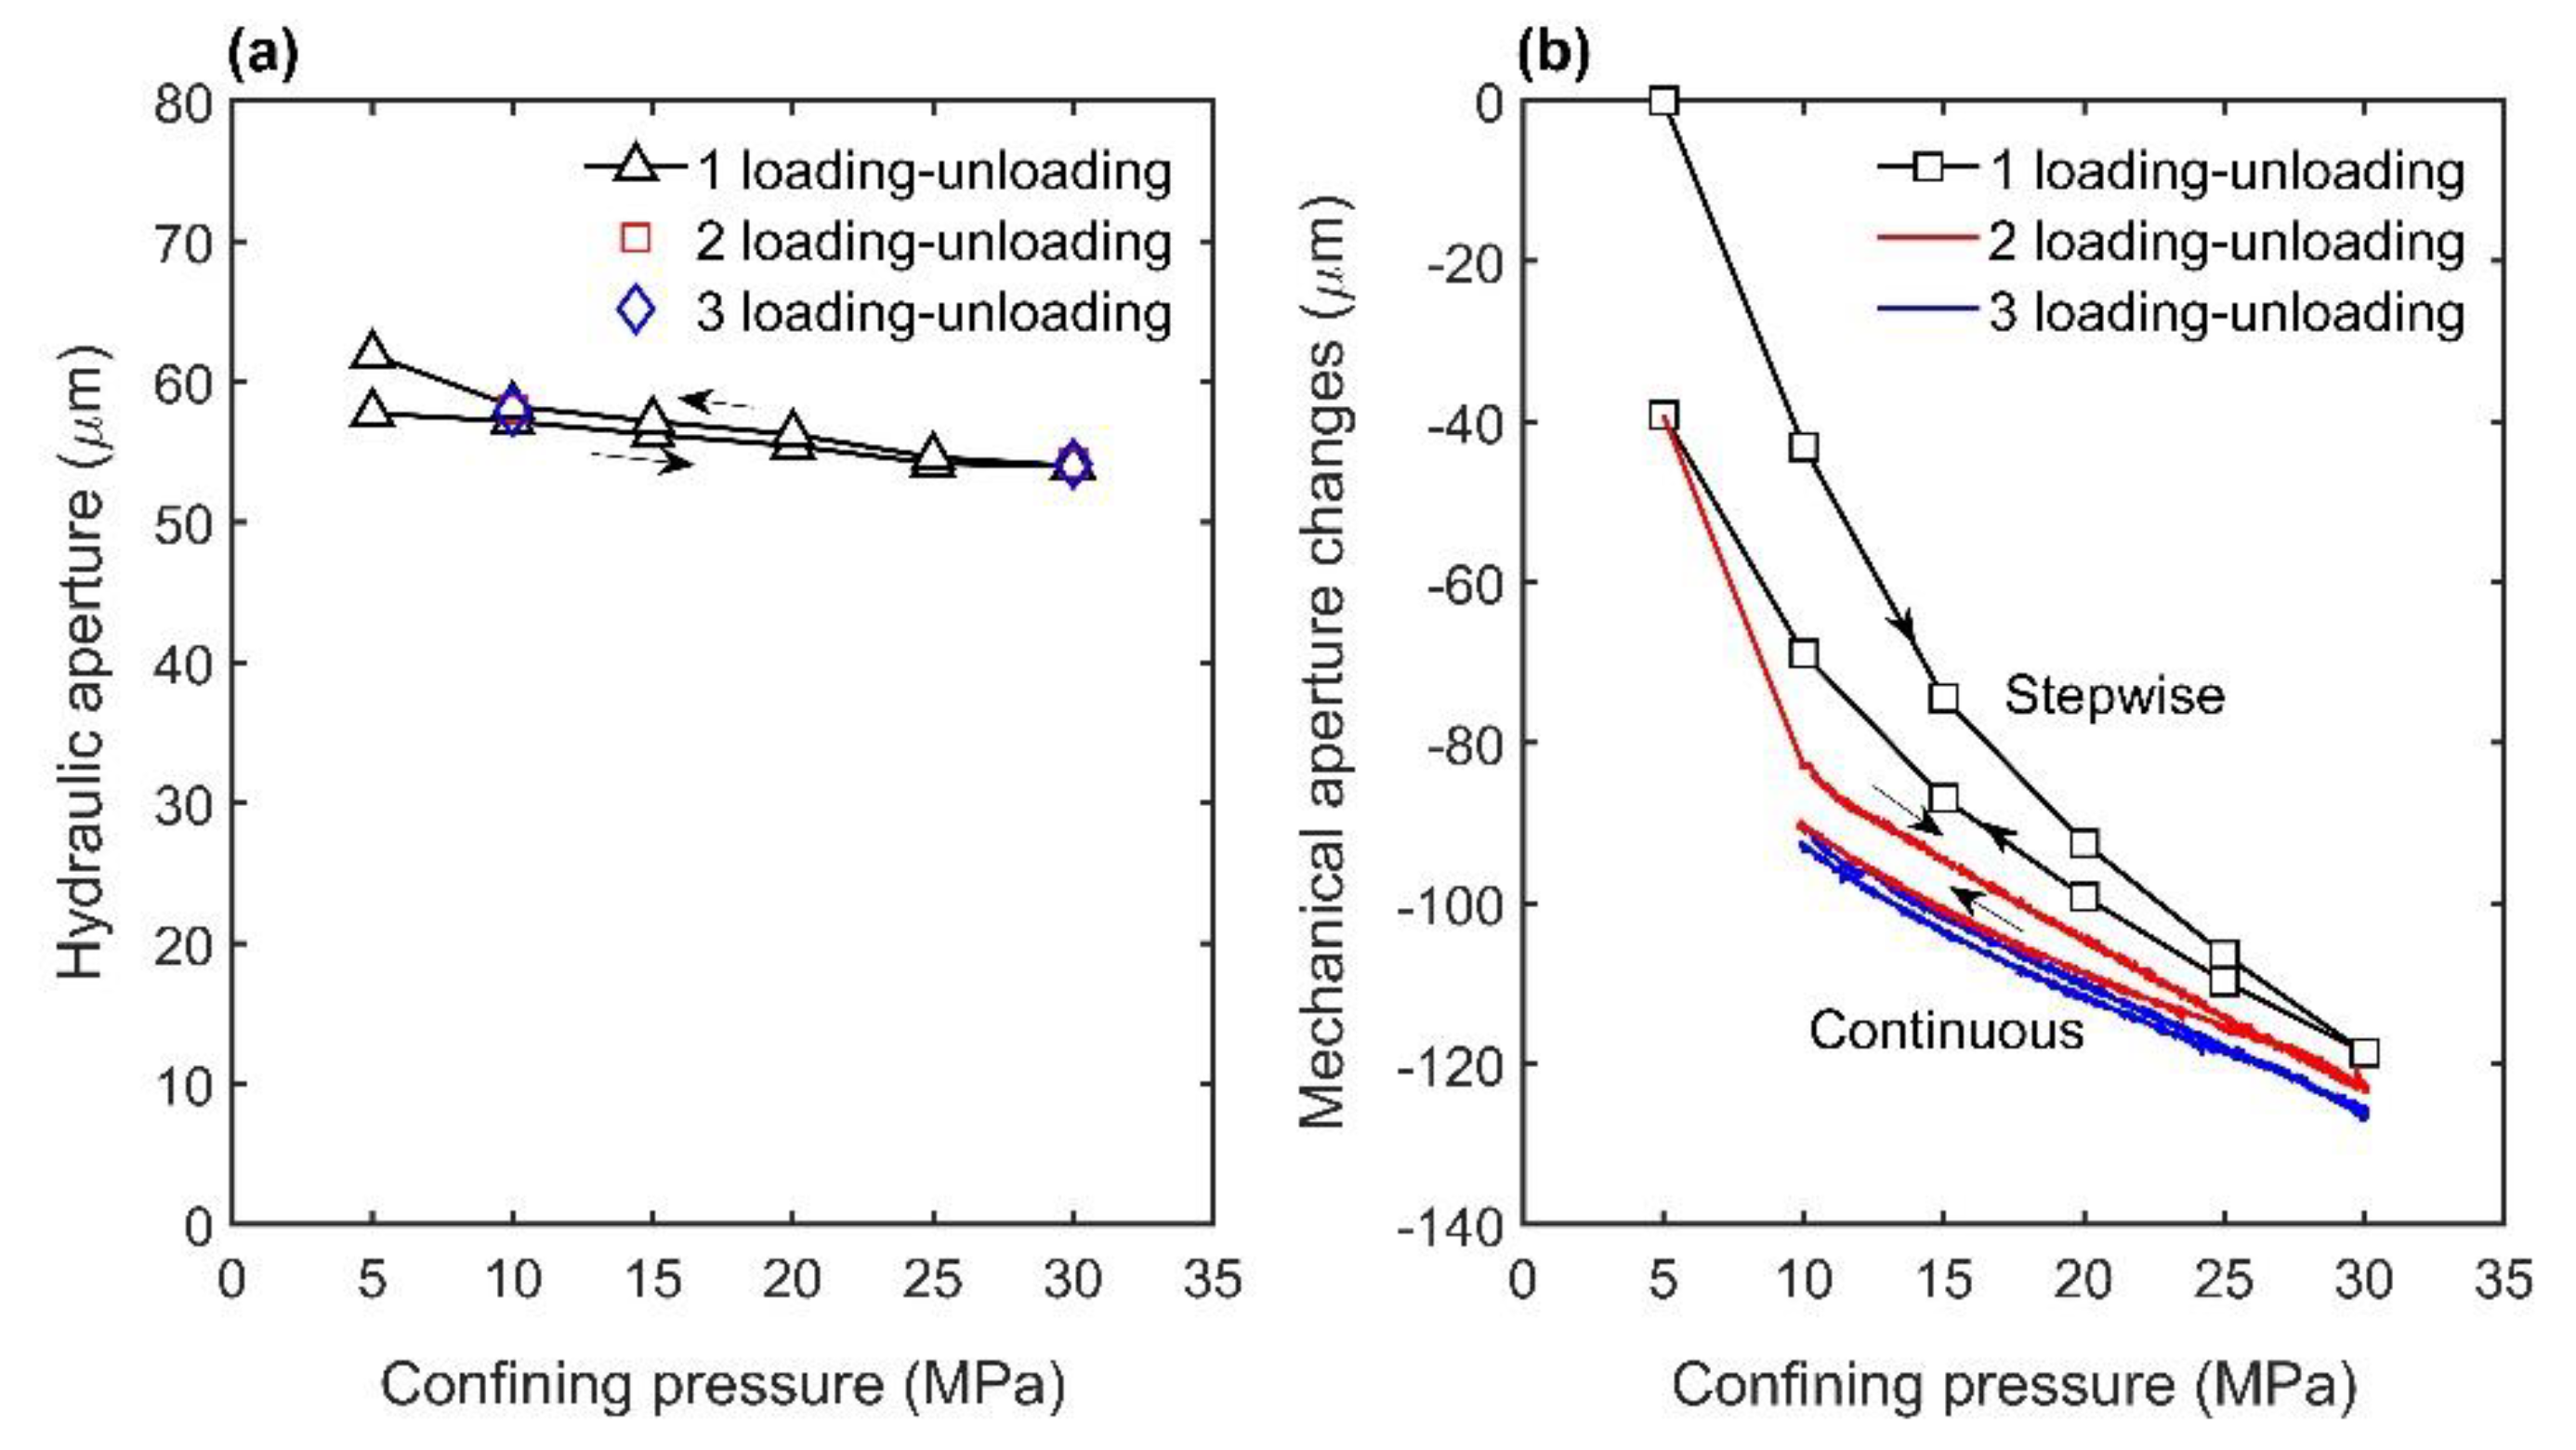
The hydraulic aperture decreased from 57 µm to 54 µm when the confining pressure was increased from 5 MPa to 30 MPa at room temperature (see Table S1. Hydraulic aperture). Unloading stepwise to 5 MPa led to a slight increase of the hydraulic aperture to 62 µm. This could result from the migration of some brittle particles within the fracture during unloading. The subsequent two loading–unloading cycles showed that the hydraulic aperture was ultimately constant, being 58 µm and 54 µm at confining pressures of 10 MPa and 30 MPa, respectively (Figure 3a).
In contrast, Figure 3b shows that the mechanical aperture varies significantly more as the confining pressure is changed (see Table S2. Mechanical aperture). The first loading–unloading cycle, between 5 MPa and 30 MPa, caused an irreversible aperture reduction of about 40 µm. The following two cycles, between 10 MPa and 30 MPa, showed progressively less irreversible fracture closure, which indicates that the mechanical deformation tends to become purely elastic. One can infer that these initial loading–unloading operations have settled and stabilized the fracture, so that any further irreversible changes of fracture aperture can be considered to be fully attributable to other processes, e.g., fluid–rock interactions.
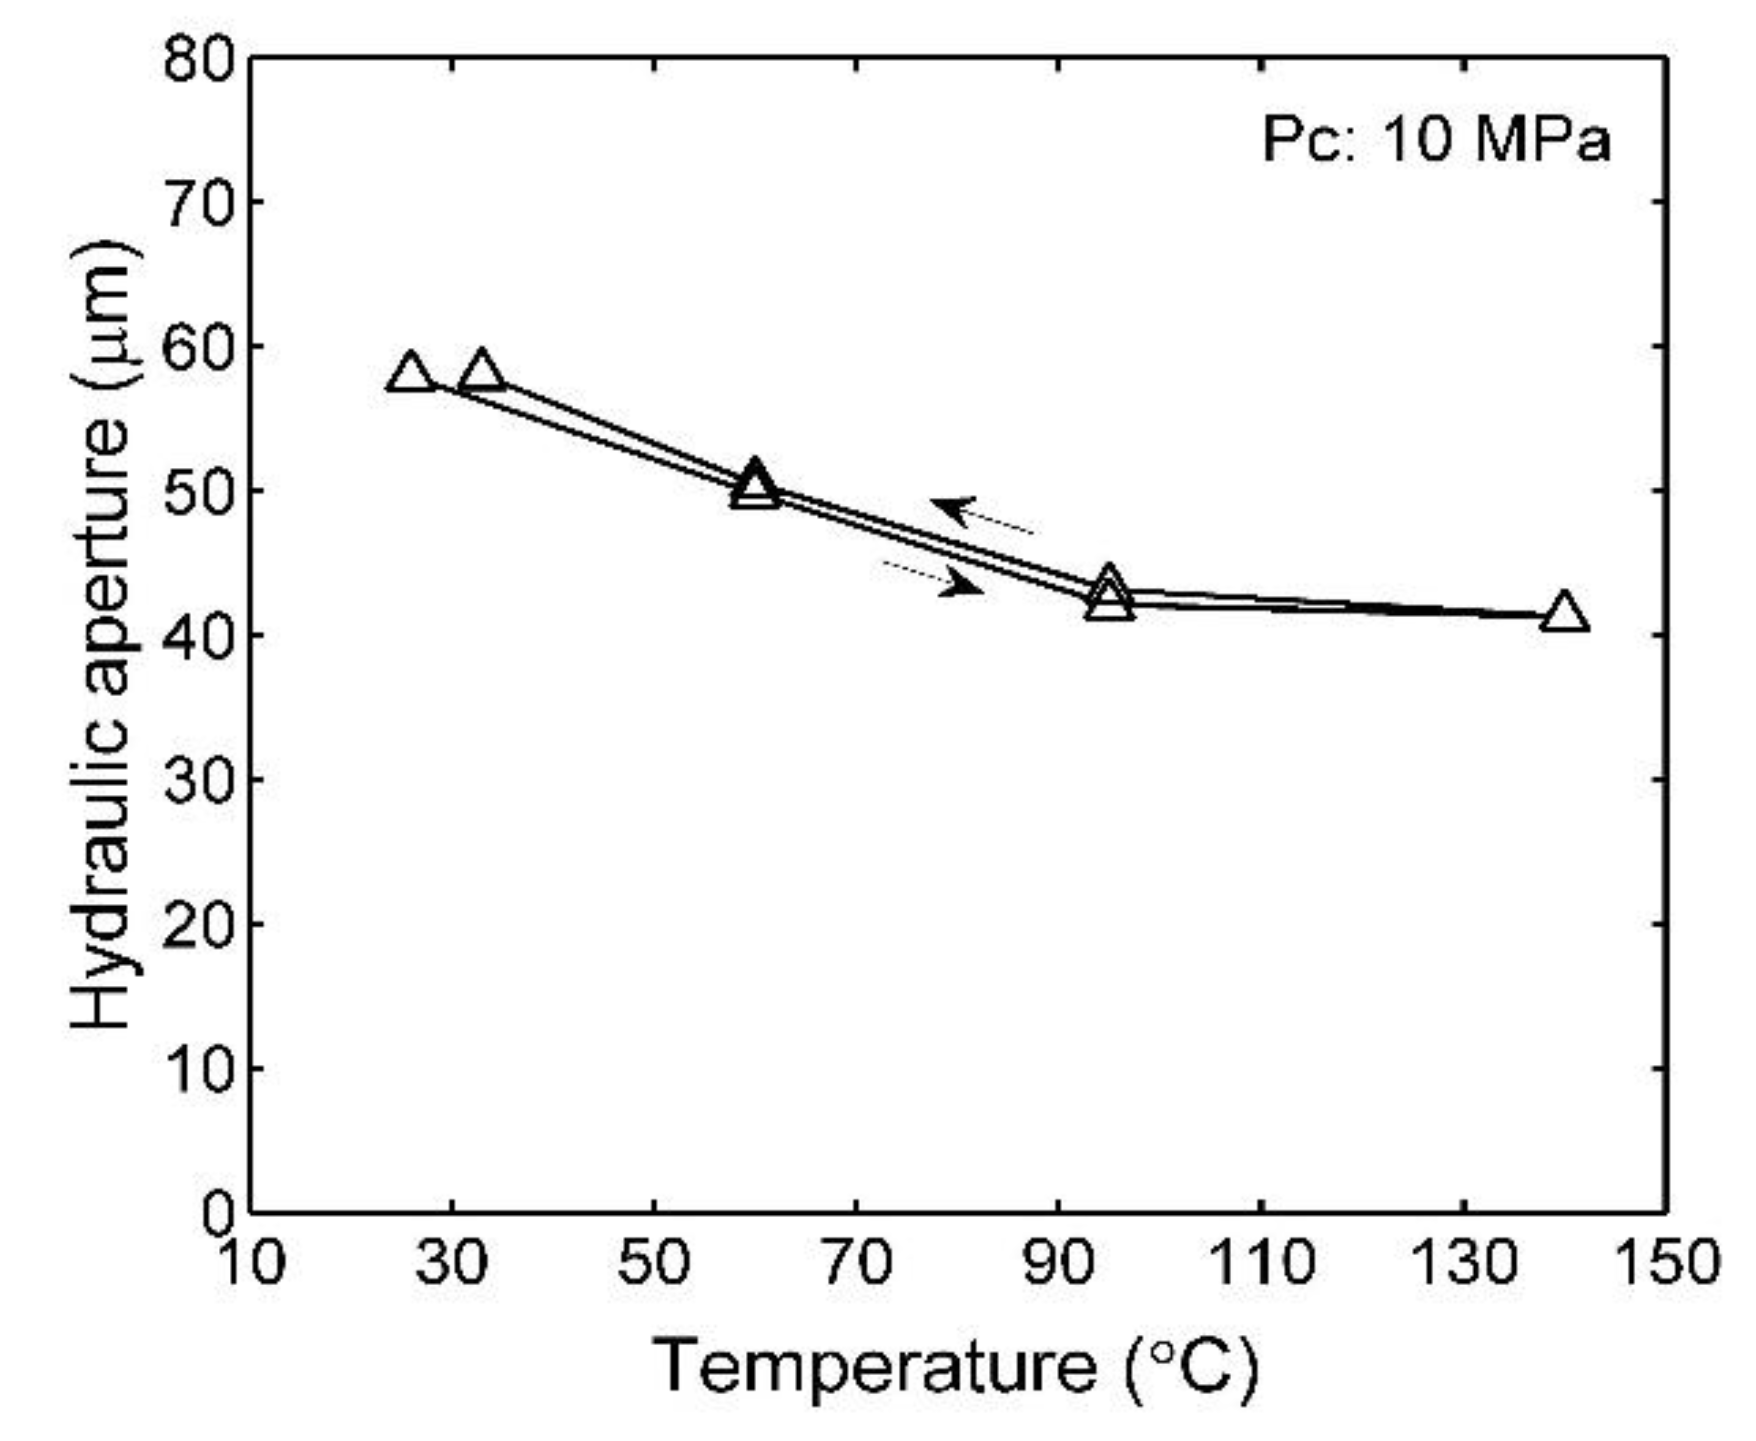
During the subsequent thermal operation stage (Figure 4), the temperature cycle between room temperature and 140 °C, at a constant confining pressure of 10 MPa, caused a fully reversible hydraulic aperture variation between 58 µm (at room temperature) and 41 µm (at 140 °C). Therefore, temperature variation has a very limited effect on irreversible fracture closure, at least for short periods of time.
3.2. Time-Dependent Evolution of Fracture Aperture
After these two sample pre-treatments, it is clear that any further brittle damage and possible plastic deformation has been eliminated for the P-T space of investigation. The confining pressure was subsequently increased to 30 MPa, and the temperature was then increased stepwise from 33 °C to 140 °C. After reaching constant P and T conditions, the hydraulic aperture at the start of the long-term operation was ~37 µm (Figure 5).
Figure 5 shows the resulting hydraulic aperture evolution over time. The variation of the hydraulic aperture was observed to be negligible (ah: 37 µm ± 1 µm) throughout the experiment. When, at the end, the temperature was decreased to 33 °C, the hydraulic aperture recovered fully reversibly, to 59 µm at a 10-MPa confining pressure, when compared to Figure 4.
3.3. Evolution of Effluent Si Concentration
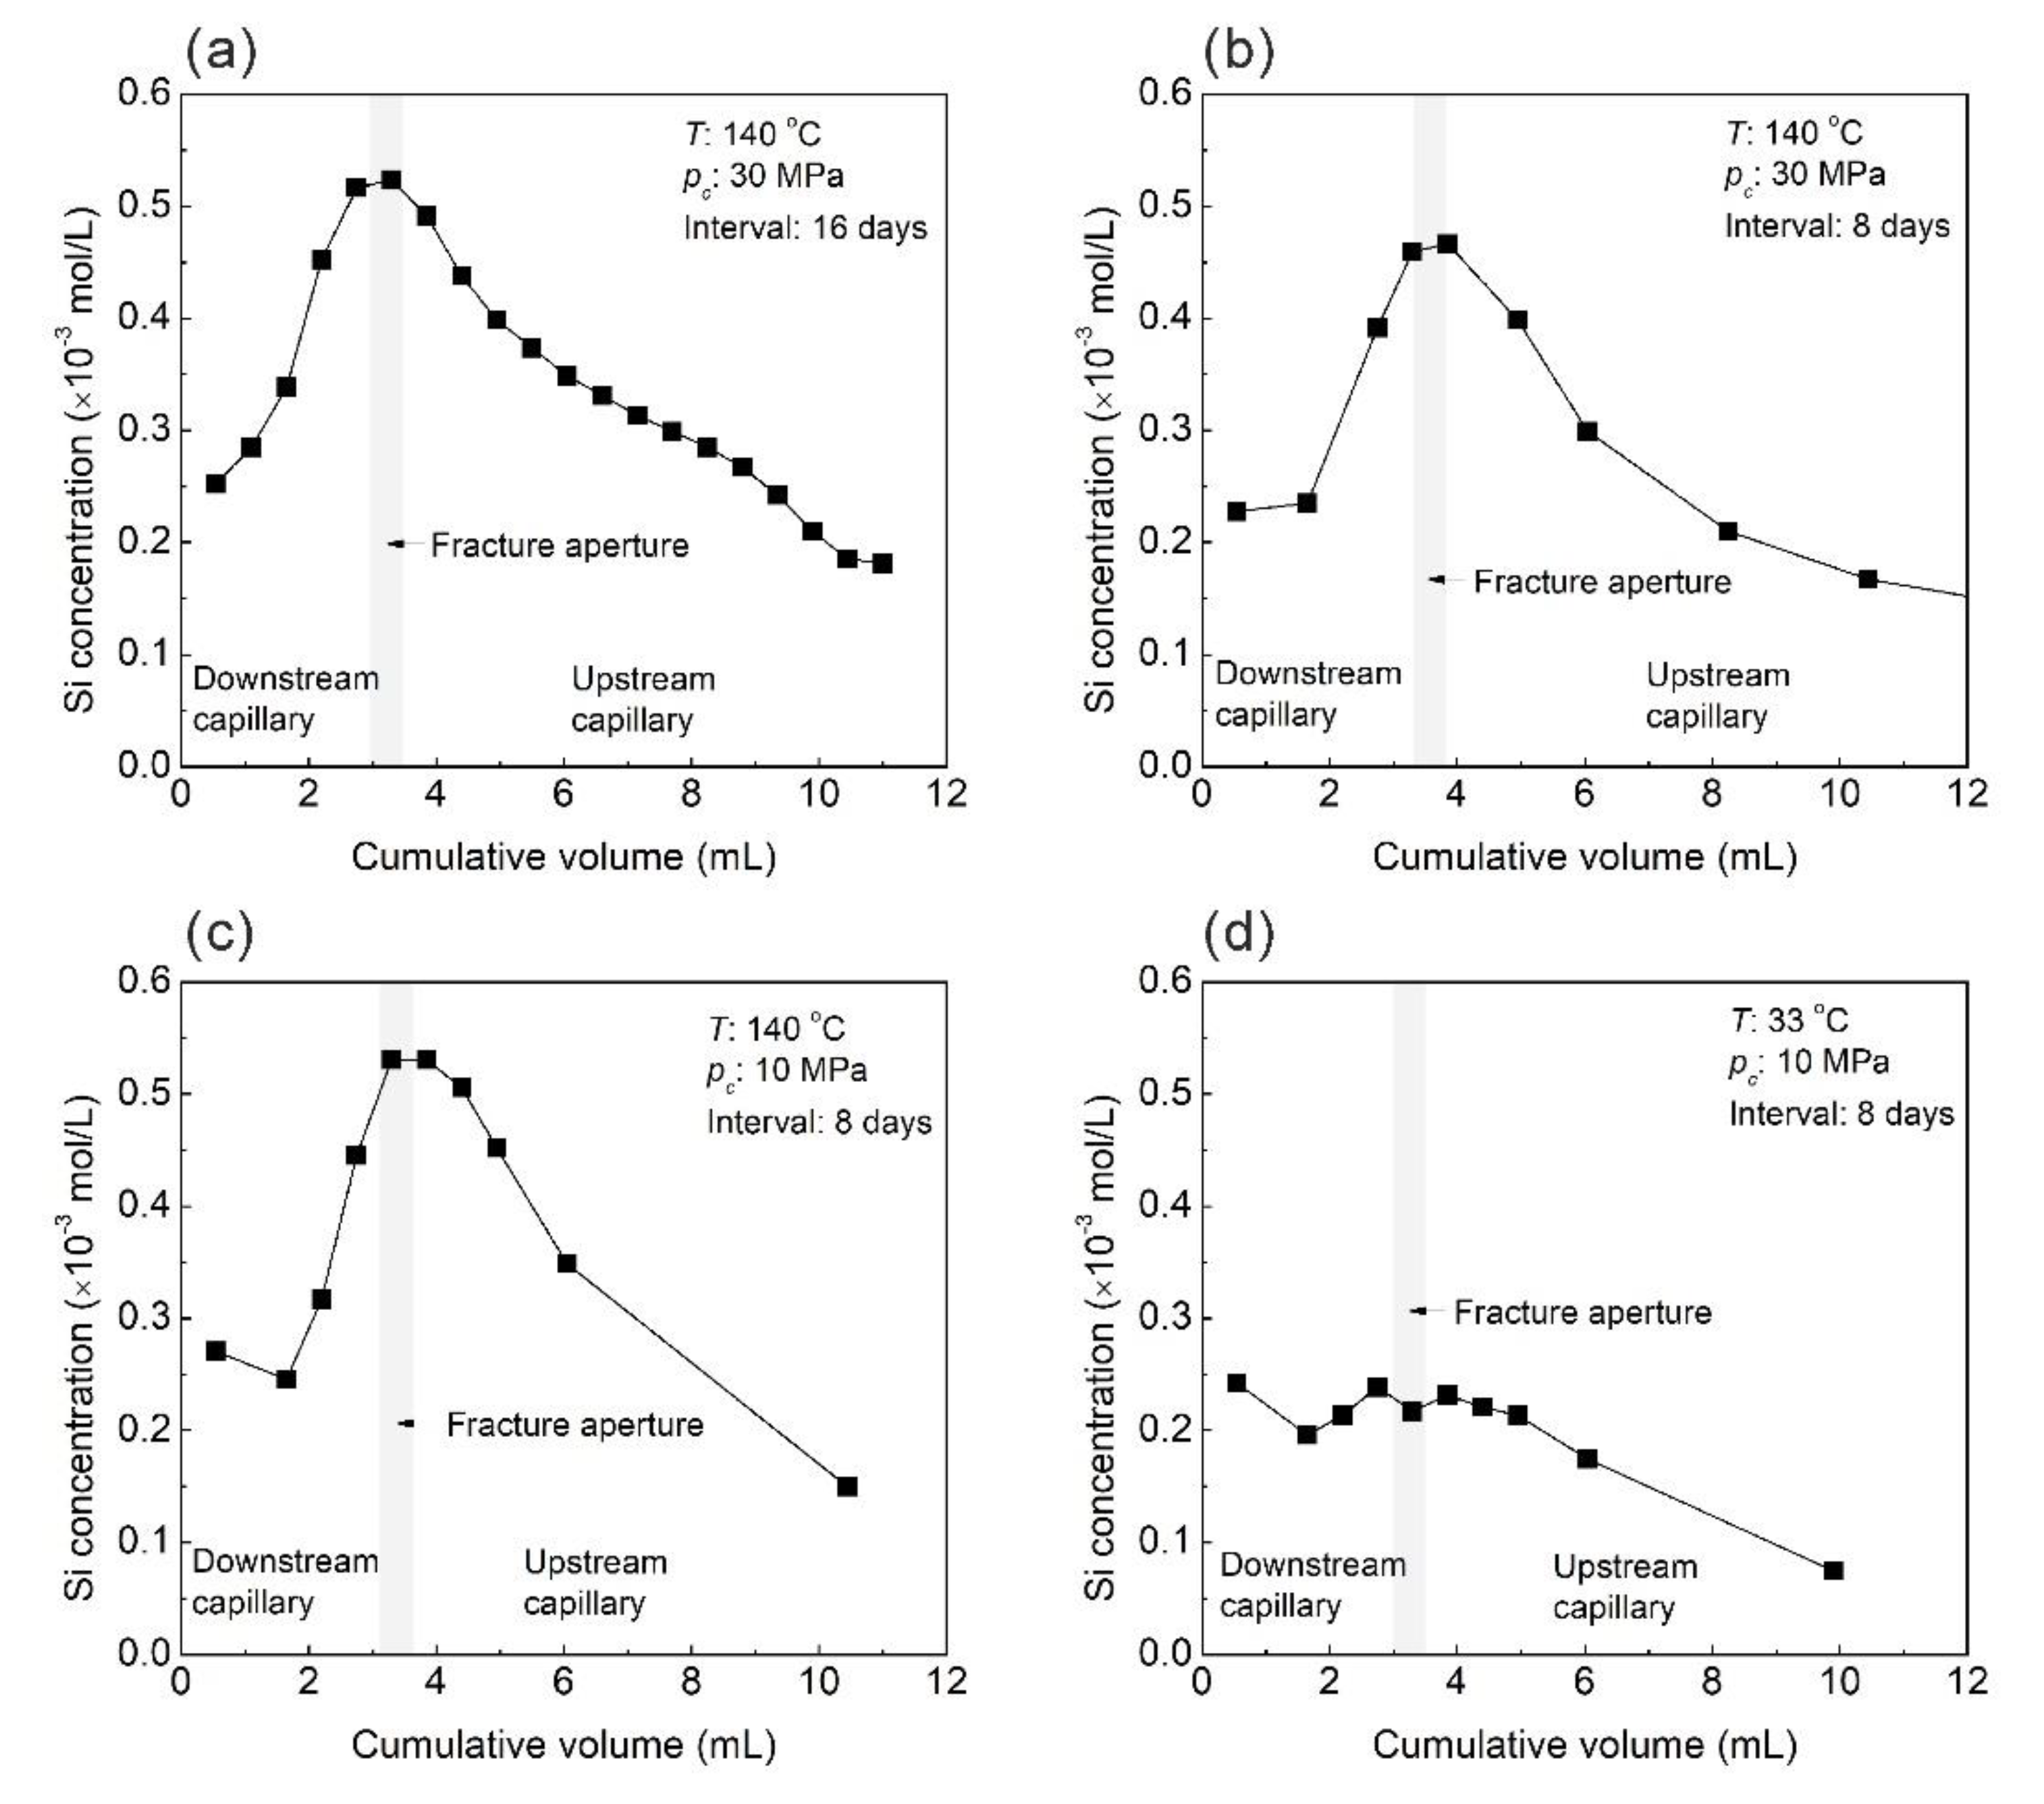
A significant amount of dissolved solid substance was observed in the sampled fluids. Figure 6 shows representative Si concentration profiles along the fracture void space, and parts of the pore fluid system under different P and T conditions after time intervals of 8 or 16 days. As can be seen in Figure 6a, the first effluent measurement taken after the flow was stopped for 16 days clearly reveals that the peak Si concentration is reached in the sixth subsample. Therefore, one can infer that the sixth subsample is the one that best characterizes the fluid directly within the fracture. As such, during subsequent effluent sampling, all (20) subsamples were collected, but only the fifth, sixth and seventh subsamples, as well as some other selected subsamples, were analyzed (see Table S3. Fluid chemistry). This procedure proved sufficient to determine the highest fluid concentration after each time interval of stagnant flow. Therefore, Figure 6b–d show less than 20 individual measurements (black squares).
The Si concentration in the injection fluid is about 3.7 × 10⁻⁶ mol/L as measured by the photometer, and about 4.4×10⁻⁶ mol/L as determined by ICP-OES (see Table S3. Fluid chemistry). Therefore, this injection fluid contains monomeric (soluble) silica almost exclusively, and of negligible concentration, i.e., two orders of magnitude lower than the typical effluent Si concentration. The Si-enrichment of the fluid therefore evidently resulted from a reaction between the rock and the fluid.
A pronounced peak silica concentration was found in all effluents from the experimental stages at 140 °C (Figure 6a–c), but not in the effluent from the final stage at 33 °C (Figure 6d). The concentration profiles illustrate that the dissolved silica migrates from the fracture void space to the upstream and downstream capillaries as a result of diffusion. There are no significant differences in peak Si concentration or profile shape between the samples after a 16-day interval (Figure 6a) or an 8-day interval (Figure 6b) of stagnant flow under the same P and T condition (pc = 30 MPa and T = 140 °C). A comparison of the two 8-day interval profiles, at 140 °C and a 10-MPa or 30-MPa confining pressure (Figure 6b and c), essentially yields the same result. In contrast, after decreasing the temperature from 140 °C to 33 °C at pc = 10 MPa, the effluent Si concentration profile looks different after an 8-day interval of stagnant flow (Figure 6d). There is no obvious concentration peak, and the Si concentration within the fracture decreased to about 0.24 × 10⁻³ mol/L. Overall, this indicates that the Si concentration in the fracture reaches some upper limit in less than 8 days, and that the latter is clearly temperature-dependent but not significantly confining pressure-dependent.
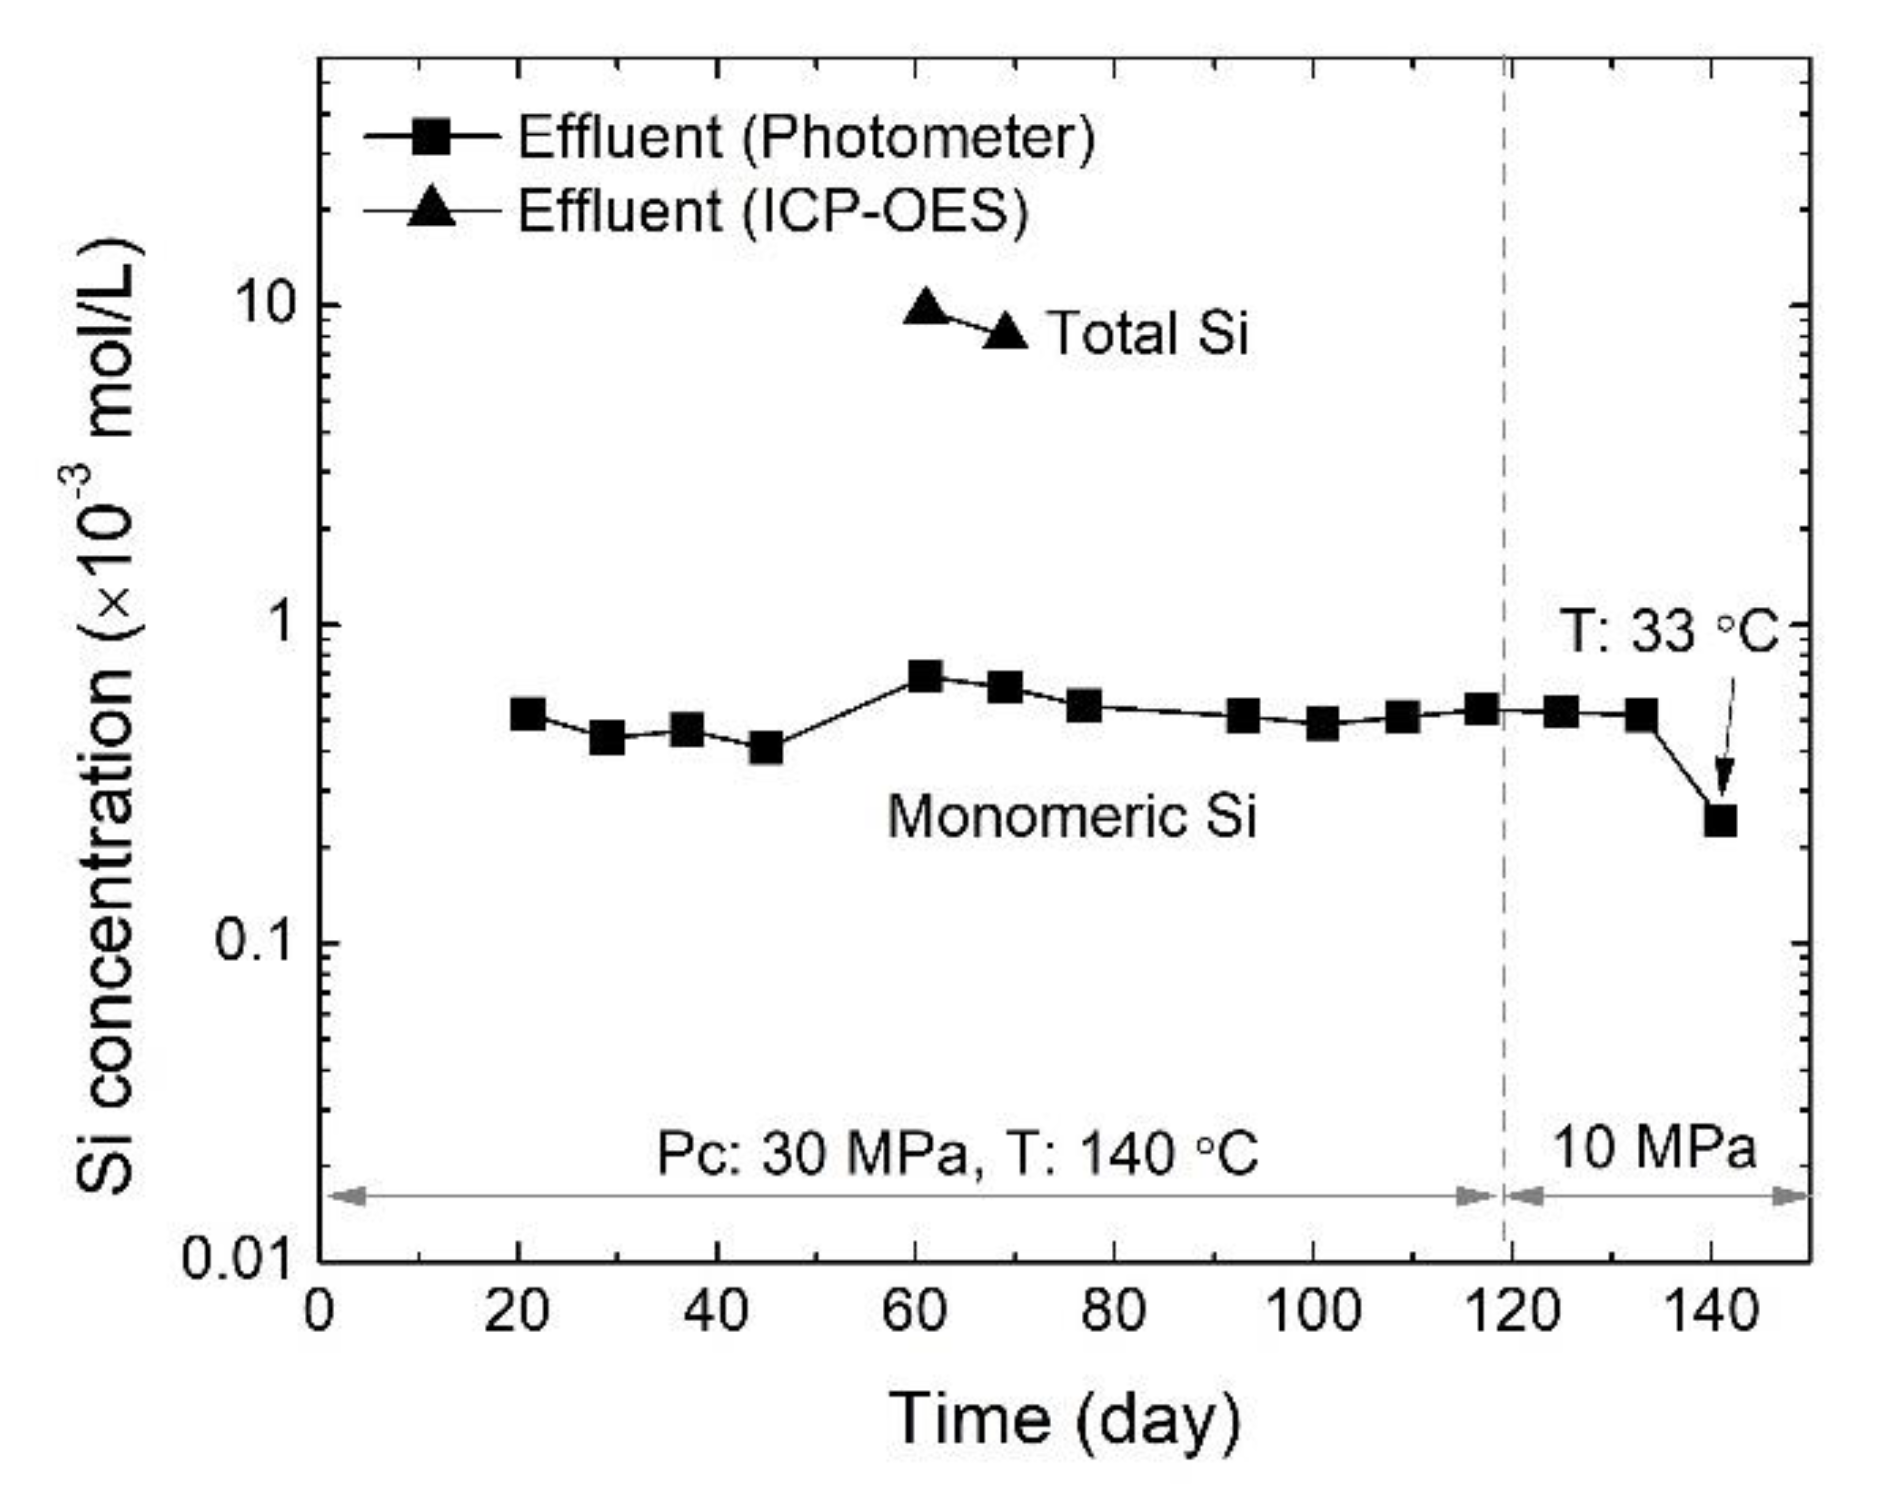
Figure 7 shows the overall peak Si concentrations (i.e., the succession of Si concentrations in the fluid within the fracture void space after time intervals of 8 days or 16 days) as a function of time. As mentioned before, the maximum Si concentration attained is always significantly higher than that of the injection fluid from the upstream pump (~4 × 10⁻⁶ mol/L). Hence, a reaction between the rock and the fluid within the fracture is obvious at all conditions. When comparing all photometer analyses (squares), one notices that the maximum Si concentrations do not show significant variations with time at 140 °C, and they only decreased as the temperature was lowered to 33 °C.
Two additional series of effluent measurements were conducted by ICP-OES. The resulting peak concentrations were 9.64 × 10⁻³ mol/L after a 16-day interval and 8.04 × 10⁻³ mol/L after an 8-day interval (Figure 7), and thus significantly higher than the concentrations measured using the photometer.
It is noticeable that the concentrations measured by ICP-OES are more than an order of magnitude higher than those analyzed using the photometer. This is related to the differences in Si detection between the two methods measuring total and monomeric silica content, respectively. The dissolved silica within the fracture may reach an equilibrium at 140 °C well within the time intervals applied. When the effluent is sampled after passing the cooled spiral capillary (Figure 2), the temperature of the effluent is close to room temperature, likely causing the silica to supersaturate. The sampling of all 20 subsamples took about 20 min at a flowrate of 0.5 mL/min, and preparation of the concentration measurements with the photometer took about 2 h each time. When the silica concentration exceeds the solubility of silica at room temperature, silica polymers may form before the analyses due to a polymerization of the dissolved monomeric silica. It should be noted that the polymerization is time-dependent. Thus, a dilution of the effluents with deionized water by a factor of 10 may decrease the concentration of the remaining monomeric silica within the effluents to below the solubility limit (1.2 × 10⁻⁴ mol/L) at room temperature, halting the polymerization process. Hence, the monomeric silica concentrations (peak) detected by this method are higher than the solubility.
However, the procedure of sampling and that of the concentration measurements was the same for all effluents throughout the experiment, and a peak Si concentration was also observed in the ICP-OES measurements of total silica. Therefore, the observed monomeric silica characteristics reflect the dissolution and diffusion processes of silica within and outside of the fracture void space.
3.4. Microstructure Variations
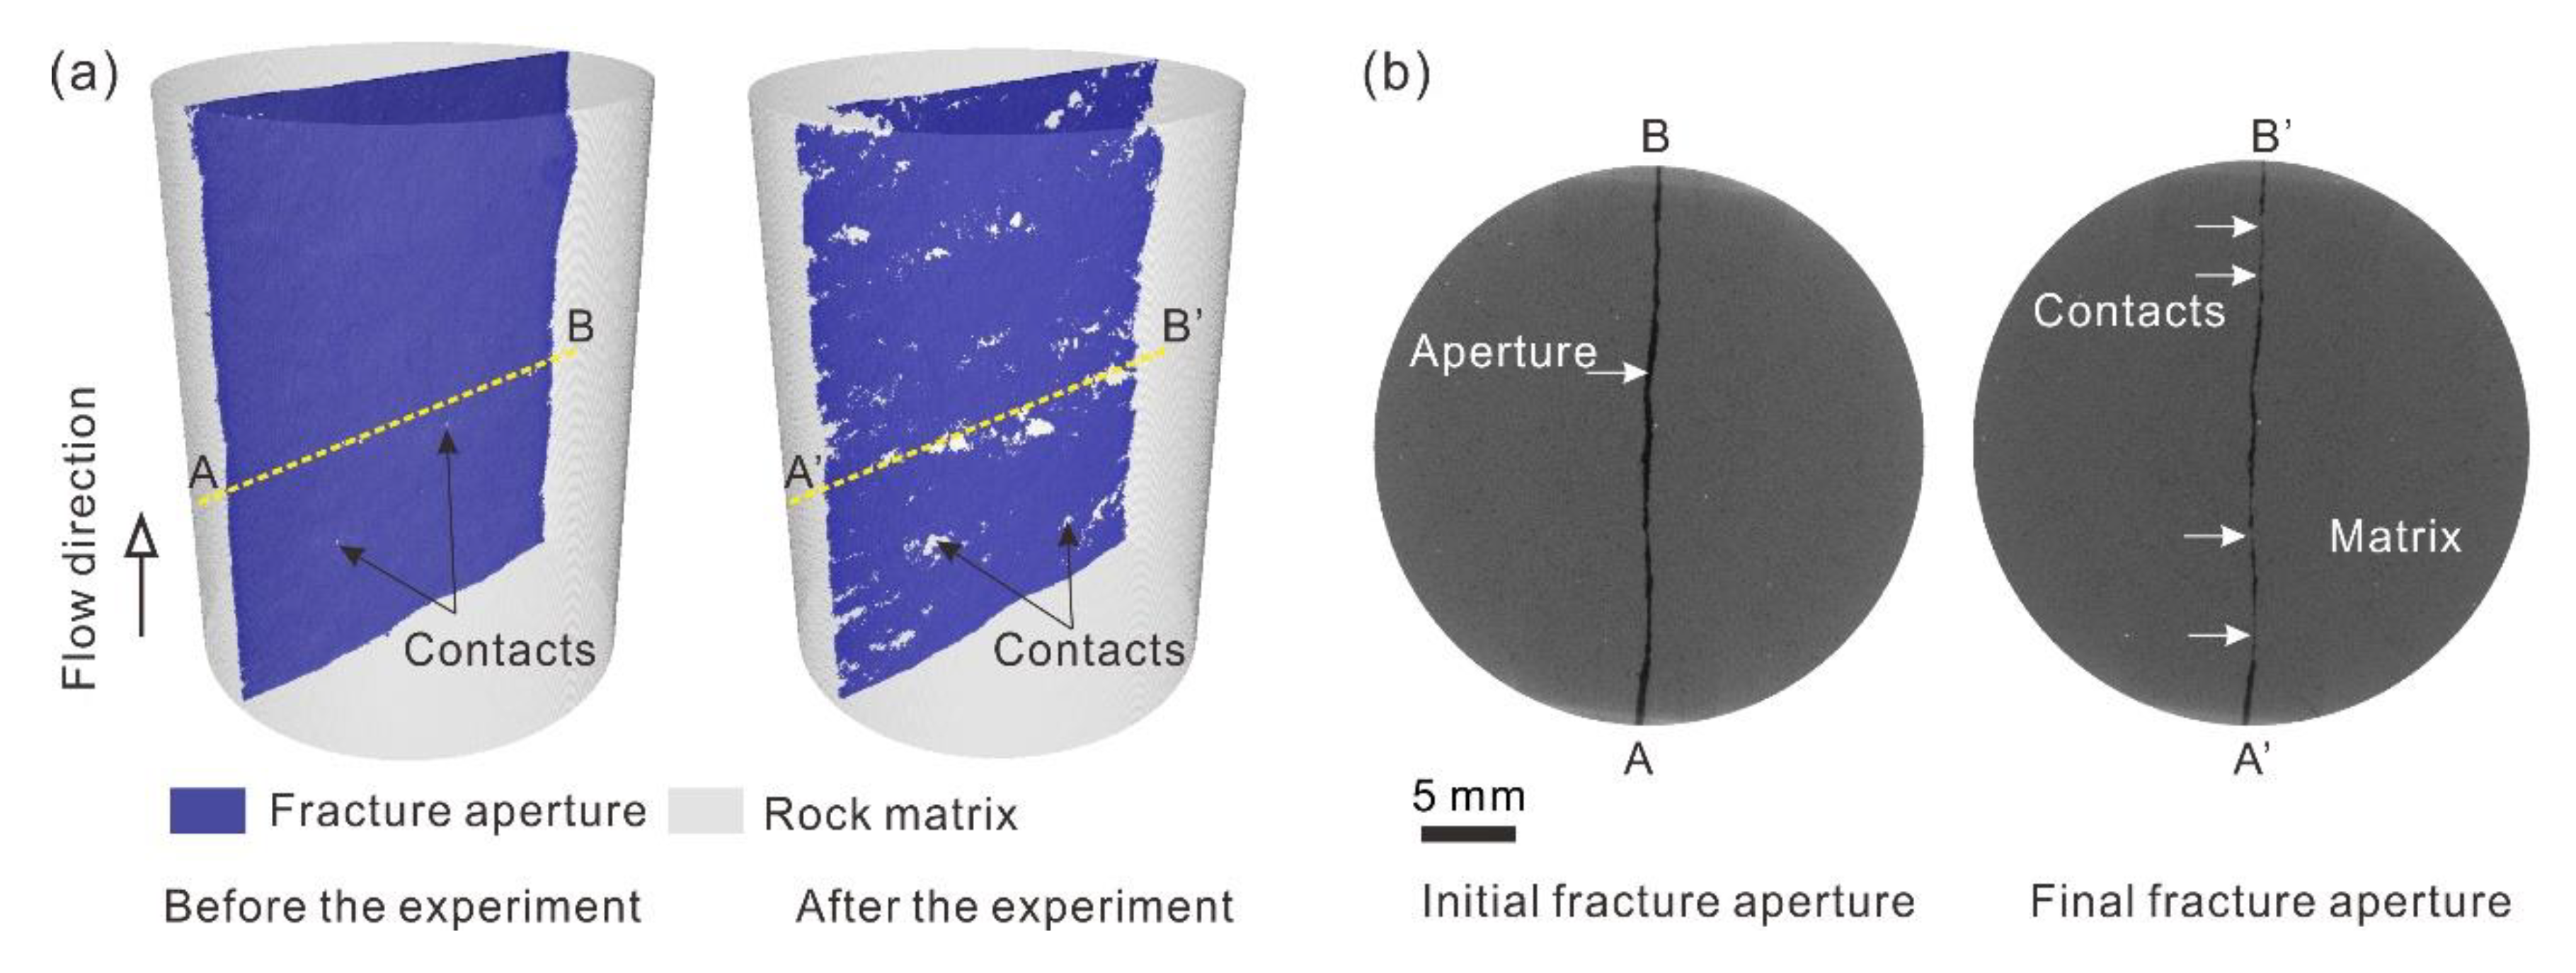
Figure 8 shows two reconstructed µCT 3-D models of the fractured sample, and two corresponding cross-sectional images at the same respective location, before and after the experiment. The fracture void space underwent an obvious change during the overall experiment: the total fracture volume, Vf, decreased from 0.403 cm3 to 0.204 cm3, and the contact area significantly increased. However, one cannot distinguish between the relative effects of mechanical compression during the initial loading–unloading stage 1, and the pressure solution-induced fracture closure during stages 4 and 5 (Table 1). Based on analysis of the extracted fracture void space (i.e., the blue area in Figure 8a), one can derive the contact area ratio, Rc, i.e., the ratio of the total contact area (in white) and the geometric fracture area (2rL), yielding a value of 3.67% after the experiment. It should be noted that the calculated fracture volume and the contact area ratio are digital products that depend on the resolution of the model, and thus may not fully correspond to the true respective properties of the sample. Furthermore, the X-ray µCT scans were conducted under atmospheric conditions, which does affect both parameters Vf and Rc. However, at least semi-quantitatively, the observed relative changes in these parameters evidence the geometric evolution of the fracture, and their values can be used for additional analyses.
4. Discussion
4.1. Mechanical and Thermal Effects on Fracture Aperture
Previous studies of rock cores containing a single fracture have shown that a geometric mismatch of the two fracture faces significantly enhances the samples’ permeability, by increasing the hydraulic aperture in comparison to the well-matched fractures [26,27,28]. Moreover, the mechanical aperture changes of a sample with a fracture wall offset were more significant than the corresponding hydraulic aperture changes observed when changes in stress or pressure were applied [27]. This is because the permanent damage of the fracture’s surfaces is not widespread, and only occurs at some isolated local contacts [26]. For example, the true contact area, bearing the normal stress, is roughly 3.67% of the total geometric area of the fracture plane in the present sample (Section 3.4). The fluid flows predominantly through the void channels defined by the distribution of the true contacts. When the pressure variations led to the purely elastic deformation of the contacting asperities, this coincided with the reversible changes of both the mechanical and hydraulic apertures after several loading–unloading cycles (Figure 3), indicating that any irreversible mechanical compaction has vanished.
In previous studies, elevated temperatures were shown to affect the rock compaction process via either the increased rate of fluid–rock interactions [2,3,16] or the thermally induced overclosure resulting from solid phase expansion [29]. In contrast, in the present study, temperature variations led to fully reversible aperture changes, indicating that the thermal expansion and contraction of the rock’s fracture-matrix assemblage was entirely elastic, at least for short time periods of temperature exposure.
4.2. Chemical Effects on Fracture Aperture in the Long Term
4.2.1. Quartz Solubility
The reaction (dissolution or precipitation) of quartz in aqueous solutions can be expressed as
The solubility of quartz under different temperature and hydrostatic pressure conditions can be directly calculated based on an empirical equation derived by Fournier and Potter II [30], which is shown in Figure 9 (black line). As described previously, pressure solution is operative at grain contact boundaries as a result of the chemical potential differences, Δμ, between the non-hydrostatically stressed boundaries and the stress-free sites, and can be expressed as [31]
where σeff = (pc−pp)/Rc is the normal effective stress on the contacts, Vm is the molar volume of quartz, Δf is the Helmholtz free energy difference, including the plastic dislocation energy and the elastic strain energy, and Us is the surface energy term. The normal stress effect on the chemical potential difference dominates in comparison to the other terms [32]. Accordingly, the contributions of Δf and Us were often omitted from previous studies [11,15,33,34]. The equilibrium constant under stressed conditions is correlated with the equilibrium constant K0 under stress-free conditions, where γσ is the activity coefficient of quartz, assumed to be 1 in a dilute pressure-free fluid, and is the quartz solubility under elevated stress within the contact boundary. This former constant can then be expressed as [31,32]
Here, again, it is assumed that the molar Helmholtz free energy and the surface energy terms are negligible in comparison to the normal stress effect [32]. Further, R is the gas constant and T is the absolute temperature in [K]. K0 depends almost exclusively on temperature, and can be directly estimated from logK0 = 1.881 − 0.002028T − 1560/T [35]. By finally introducing Equation 5 into Equation 6, one can determine the solubility of quartz at the grain contact boundaries at different temperatures. Assuming that the contact area ratio Rc is in the range of 3.67% to ~10%, as derived from the 3-D µCT models (Section 3.4), and for a confining pressure of either 10 MPa or 30 MPa, one obtains the two concentration fields displayed in Figure 9, which indicate the approximate solubility range of quartz in the water film between the grain contacts at different temperatures.
It is noticeable that the measured total silica concentration is significantly higher than the solubility of quartz at hydrostatic pressure and 140 °C, indicating the activity of pressure solution. The reactive (monomeric) silica concentration is about one order of magnitude smaller than the total silica concentration. A comparison with the hydrostatic solubility line indicates that the fluid is likely undersaturated with respect to monomeric silica at the 140 °C stages, but still oversaturated at the 33 °C stage. Possibly, as the fluid was cooled during sampling, precipitation was triggered in the oversaturated Si-rich fluid at 140 °C, and consequently, polymeric and/or colloidal silica may have formed, which could have triggered the oversaturated monomeric silica becoming undersaturated. As the likelihood of precipitation should directly be related to the differential temperature during sampling, monomeric silica may exist metastably at the final 33 °C stage, and consequently, the measured monomeric silica concentration was noticeably higher than the hydrostatic quartz solubility at this temperature.
Pressure solution is a rate-limited process [31,36], and is controlled by the slowest of the three reaction steps [37]. In the present study, the progress of the pressure solution should be linked to, first and foremost, the degree of saturation of the fluid within the water film at 140 °C, which likely is attained rapidly (Section 3.3). The rates of Si diffusion into the free pore fluid, and that of possible Si precipitation therein, then control the kinetics of pressure solution. Diffusion was obvious for all experimental stages at 140 °C, but was significantly less pronounced for the 33 °C stage (Figure 6). However, as the monomeric silica concentration at 33 °C was higher than the corresponding hydrostatic quartz solubility at this temperature, this indicates that pressure solution was active during all stages of the long-term part of the experiment, even under low temperature and pressure conditions. Overall, and in agreement with previous studies, it can be concluded that pressure solution is enhanced by temperature [16], and that any effect of temperature on this process is greater than that of pressure or stress [12].
4.2.2. Pressure Solution-Induced Deformation
To distinguish the effects of free face dissolution and pressure solution on the silica concentration of the effluents, it is assumed that the quartz dissolution has reached equilibrium after the respective time intervals of stagnant flow. The measured amount of Si in the effluent then consists of two components, i.e., dissolved silica, either from the free fracture walls or from the contacting asperities. Since the pressure solution rate is significantly higher than the normal dissolution rate of quartz [6], the Si concentration in the pore fluid mainly increases due to the diffusion of dissolved silica from the stressed asperities into the pore fluid, which, in turn, may also decelerate the dissolution of quartz on the free fracture walls.
The rate of mechanical fracture aperture variations, dbm/dt, can be related to the pressure solution rate, ṁstr(t), of the stressed asperities (yielding fracture closure) and the free face dissolution rate, ṁfre(t), of the fracture walls (enlarging the fracture void space),
where ρ is the density of quartz. Here, the total silica concentration, as measured by ICP-OES, is used to estimate the dissolved mass resulting from pressure-induced quartz dissolution, as well as the theoretical quartz solubility [30], in order to calculate the amount of free face dissolution. Due to the diffusion of the dissolved silica from the fracture toward the upstream and downstream pore fluid system, the entire enclosed fluid volume needs to be accounted for, which can be defined by the observed concentration profiles after the respective time intervals of stagnant flow (Figure 6),
where Vs is the subsample volume, Wm is the molar weight of quartz, and n is the total number of the subsamples, taking n = 20 for the calculation. and are the total silica concentration in the effluent and the silica concentration of the ith subsample attributed to free face dissolution, respectively. The ICP-OES data of day 69 at 140 °C was used for the calculation (see Table S3. Fluid chemistry). Although there is some lack of data in this suite of subsamples, it is assumed that the ICP-OES results and the amount of dissolved silica from the free fracture walls follow the same trend as the monomeric silica concentration (see data interpolation in Table S3. Fluid chemistry). Assuming that the contact area ratio is constant throughout the experiment, for a contact area ratio, Rc, in the range of 3.67% to 20% (Section 3.4), this yields Δbm ≈ −16.49 µm to −2.85 µm after the respective time interval and at 140 °C. Every sampling procedure resets the fluid concentration in the fracture and restarts this process. Therefore, the total mechanical aperture change during the long-term experiment (13 individual sampling events) is −214.3 µm to −37.0 µm, wherein the calculation result is sensitively dependent on the assumed contact area ratio. The final contact area ratio was obtained numerically based on the µCT models, which may be prone to uncertainty in representing the true contact area ratio due to resolution limitations and the analytical conditions (i.e., room temperature and atmospheric pressure). However, it was observed that the fracture aperture exhibited almost purely elastic deformation after three loading–unloading cycles (Figure 3), which implies that the contact area ratio is linearly proportional to the normal stress [38]. Therefore, one can infer that the actual contact area ratio is greater than 3.67% under stressed conditions within the pressure vessel.
Based on the changes in fracture volume from 0.403 cm3 to 0.204 cm3, as derived from the µCT models (Section 3.4), one can estimate the corresponding changes of the mechanical aperture, bm,
As a result, the mechanical aperture decreased from 335.8 µm to 170.0 µm (i.e., Δbm = 165.8 µm), which is consistent with the magnitude of irreversible fracture closure measured during stage 1 (Figure 3b). On the other hand, well-connected fracture voids were observed in the 3-D model after the long-term experiment (Figure 8a), which allow the fluid to flow through. Free face dissolution and pressure solution creep are two competing processes, whereby the dominant one will control whether the fracture will, overall, tend to open or close. Obviously, during the intermittently conducted long-term experiment, the so-induced geometrical changes of the fracture void space were insufficient to significantly affect the hydraulic aperture, as this property was shown to remain almost constant (Figure 5).
4.3. Effects of Stress Corrosion-Induced Subcritical Cracking
When water and tensile stresses are present in the rock material, stress corrosion-induced subcritical cracking can also contribute to fracture deformation [14,39,40]. Resulting from the applied normal stress, concentrated tensile stresses may occur at the periphery of the contacting asperities perpendicular to the contact area. Hence, subcritical cracking may induce the time-dependent deformation or progressive failure of the asperities, which could lead to fracture closure [14]. Particularly under hydrothermal conditions, the crack growth velocity increases with increasing temperature [41].
Both pressure solution and subcritical cracking result in very similar geometric responses from the fracture, but these result from completely different mechanisms. Pressure solution mainly leads to an increase in the contact area, accompanied by a decrease in the normal stress on the fracture plane. In contrast, subcritical cracking is directly controlled by the stress and chemical processes operating at the crack tips. Consequently, this may yield the rupturing of the contacting asperities promoting the closure of the fracture. Obviously, this latter process would have a rather limited effect on the effluent concentration. However, in the present study, a significantly enhanced amount of Si, as well as Si oversaturation, were observed in the effluent at 140 °C and 33 °C, respectively (Figure 9). This indicates that pressure solution was active during the entire experiment. Moreover, the average fracture closure rate throughout the 137 days for which the experiment was conducted at 140 °C, as calculated from the chemical effluent data and the estimated contact area ratio (Section 4.2.2), is in the range of 3.1 × 10⁻¹² m/s ~ 1.8 × 10⁻¹¹ m/s. This range is orders of magnitude lower than the subcritical cracking-induced fracture closure rate (> 10−8 m/s at 150 °C) estimated for a fractured novaculite sample theoretically investigated previously [14]. Therefore, although one cannot fully neglect any effect of subcritical cracking on fracture closure, under the present experimental conditions, pressure solution overall likely dominated in fracture deformation.
However, both mechanisms may likely operate in parallel. When pressure solution is inactive or very slow (e.g., under low stress and/or low temperature conditions), subcritical cracking would govern fracture deformation. In contrast, when pressure solution dominates, the progressive increase of the fracture contact area will additionally inhibit subcritical cracking by reducing the normal fracture stress. In summary, one can infer that subcritical cracking may occur at an early stage in the process, whereat mechanical effects dominate over chemical ones [14]. In the long term, however, pressure solution determines the rate at which fracture aperture will change.
4.4. Implications
Based on the above considerations, it is implied that pressure solution is more significant than other effects in the deformation of fractures, particularly for long-term exposure under high temperature conditions, as found in enhanced geothermal or unconventional reservoir systems. Accordingly, the fracture aperture is more susceptible to changes when coupled hydro-thermo-mechano-chemical processes operate under such conditions [3,42]. The present fluid chemistry data indicate that the Si concentration in the pore fluid can have a significant effect on the progress of pressure solution. This implies that any alteration of the chemical fluid–rock equilibrium, e.g., by injection of undersaturated fluids, might accelerate this process, leading to an enhanced closure of the fracture. Moreover, cold water injection or hot water production may reduce temperature locally, and this would change the concentration of the dissolved silica, accelerating polymerization and precipitation, which finally impacts fracture permeability. Despite simplifications in terms of mineralogy, fluid composition and experimental duration, the results of this study demonstrate the importance of temperature and fluid elemental concentration in the evolution of fracture aperture.
5. Conclusions
The purpose of this experimental study was to constrain the mechanical, thermal and long-term chemical feedbacks of pressure, temperature and fluid–rock interactions on the hydraulic and mechanical aperture of a single macroscopic tensile fracture in a pure quartz sandstone core. Fracture aperture changes resulting from mechanical compaction comprised both the irreversible and reversible (i.e., elastic) portions. The hydraulic aperture was less variable in comparison to the mechanical aperture, due to a manually pre-induced mismatch of the two fracture surfaces with an offset of 750 µm. Furthermore, hydraulic aperture changes, as a result of temperature cycling, where shown to be fully reversible, and thus thermoelastic.
After any brittle and/or plastic deformation of the fracture had vanished, a long-term intermittent flow-through experiment, comprising systematic effluent Si concentration analyses, was conducted. Quartz dissolution was found to be active regardless of the effective pressure (9 MPa and 29 MPa) and temperature (33 °C and 140 °C). The Si concentration of the pore fluid increased substantially toward a maximum within a short period of time (i.e., in less than 8 days), indicating chemical equilibrium. Differences in the time intervals of stagnant flow (i.e., 8 days or 16 days) did not seem to significantly affect the respective maximum effluent concentration. Furthermore, macroscopic silica diffusion from the fracture into the upstream and downstream pore fluid system was clearly observed. Silica dissolution predominantly resulted from pressure solution at the contacting fracture asperities. The total Si concentration in the effluent, attributed to the fracture void, was significantly higher than the quartz solubility under the same P and T conditions, and precipitation may have occurred therein. The progressive increase in Si concentration within the fracture should feed back into the pressure solution process, thus decelerating pressure solution creep. However, based on microstructural observations via µCT scanning, the theoretically estimated changes in mechanical aperture were found to be substantial. In contrast, the measured hydraulic aperture was shown to remain more or less constant during the 140 days of the long-term part of the experiment.
Noticeably, it was found that elevated temperatures significantly accelerate the dissolution process and result in higher pore fluid Si concentrations. This implies that fractures in deep geological structures and reservoirs will be more susceptible to pressure solution-induced effects, regarding geometric aperture changes and related variations of hydraulic fracture properties, than shallow ones at lower temperatures. However, the present experiment was conducted in a quasi-closed pore fluid system, with flow only occurring during sampling and subsequent permeability measurements taken for short periods of time. As such, the question of whether a fracture will remain open, ultimately close, or approach some constant aperture in an open system with continuous fluid flow, e.g., in a geological reservoir used to extract geothermal energy, should be the focus of a related future study. Moreover, further efforts are required in order to undertake the direct measurement of fracture deformations, in addition to the hydraulic measurements. Details of time-dependent fracture closure, in conjunction with fluid chemical analyses, will improve our understanding of these coupled mechano-chemical processes.
Supplementary Materials
The following data are available online at https://www.mdpi.com/2075-163X/10/8/657/s1: Table S1. Hydraulic aperture, Table S2. Mechanical aperture, Table S3. Fluid chemistry.
Author Contributions
C.C. designed and conducted the experiment and analyses, and wrote the original draft. H.M. designed and supervised this study, discussed the results and edited the manuscript. All authors have read and agreed to the published version of the manuscript.
Funding
C.C. is grateful for a fellowship granted by the China Scholarship Council (grant number: 201606410056) to perform this study.
Acknowledgments
The authors thank Ulrike Hoffert (GFZ Potsdam) for her suggestions on the methods of fluid sampling and effluent analysis, Sabine Tonn (GFZ Potsdam) for her help with the chemical measurements using ICP-OES, and Erik Rybacki (GFZ Potsdam) for his assistance with the X-ray μCT measurements. Constructive reviews by two anonymous reviewers are gratefully acknowledged and helped to improve the manuscript.
Conflicts of Interest
The authors have no conflicts of interest to declare.
References
- Schutjens, P.M. Experimental compaction of quartz sand at low effective stress and temperature conditions. J. Geol. Soc. Lond. 1991, 148, 3. [Google Scholar] [CrossRef]
- Polak, A.; Elsworth, D.; Yasuhara, H.; Grader, A.S.; Halleck, P.M. Permeability reduction of a natural fracture under net dissolution by hydrothermal fluids. Geophys. Res. Lett. 2003, 30, 20. [Google Scholar] [CrossRef]
- Yasuhara, H.; Polak, A.; Mitani, Y.; Grader, A.; Halleck, P.; Elsworth, D. Evolution of fracture permeability through fluid–rock reaction under hydrothermal conditions. Earth Planet. Sci. Lett. 2006, 244, 1–2. [Google Scholar] [CrossRef]
- Weyl, P.K. Pressure solution and the force of crystallization: A phenomenological theory. J. Geophys. Res. 1959, 64, 11. [Google Scholar] [CrossRef]
- De Boer, R. On the thermodynamics of pressure solution—Interaction between chemical and mechanical forces. Geochim. Cosmochim. Acta 1977, 41, 2. [Google Scholar] [CrossRef]
- De Boer, R. Pressure solution: Theory and experiments. Tectonophysics 1977, 39, 1–3. [Google Scholar] [CrossRef]
- Robin, P.-Y.F. Pressure solution at grain-to-grain contacts. Geochim. Cosmochim. Acta 1978, 42. [Google Scholar] [CrossRef]
- Van Noort, R.; Spiers, C.J.; Pennock, G.M. Compaction of granular quartz under hydrothermal conditions: Controlling mechanisms and grain boundary processes. J. Geophys. Res. 2008, 113, B12. [Google Scholar] [CrossRef] [Green Version]
- Niemeijer, A.; Spiers, C.; Bos, B. Compaction creep of quartz sand at 400–600 °C: Experimental evidence for dissolution-controlled pressure solution. Earth Planet. Sci. Lett. 2002, 195, 3–4. [Google Scholar] [CrossRef]
- Polak, A.; Elsworth, D.; Liu, J.; Grader, A.S. Spontaneous switching of permeability changes in a limestone fracture with net dissolution. Water Resour. Res. 2004, 40, 3. [Google Scholar] [CrossRef]
- Yasuhara, H.; Elsworth, D.; Polak, A. Evolution of permeability in a natural fracture: Significant role of pressure solution. J. Geophys. Res. 2004, 109, B3. [Google Scholar] [CrossRef]
- Yasuhara, H.; Kinoshita, N.; Ohfuji, H.; Takahashi, M.; Ito, K.; Kishida, K. Long-term observation of permeability in sedimentary rocks under high-temperature and stress conditions and its interpretation mediated by microstructural investigations. Water Resour. Res. 2015, 51, 7. [Google Scholar] [CrossRef] [Green Version]
- Tada, R.; Maliva, R.; Siever, R. A new mechanism for pressure solution in porous quartzose sandstone. Geochim. Cosmochim. Acta 1987, 51, 9. [Google Scholar] [CrossRef]
- Yasuhara, H.; Elsworth, D. Compaction of a Rock Fracture Moderated by Competing Roles of Stress Corrosion and Pressure Solution. Pure Appl. Geophys. 2008, 165, 7. [Google Scholar] [CrossRef] [Green Version]
- Lu, R.; Nagel, T.; Shao, H.; Kolditz, O.; Shao, H. Modeling of dissolution-induced permeability evolution of a granite fracture under crustal conditions. J. Geophys. Res. Solid Earth 2018, 123, 7. [Google Scholar] [CrossRef]
- Elias, B.P.; Hajash, J.A. Changes in quartz solubility and porosity due to effective stress: An experimental investigation of pressure solution. Geology 1992, 20, 5. [Google Scholar] [CrossRef]
- Milsch, H.; Spangenberg, E.; Kulenkampff, J.; Meyhöfer, S. A new apparatus for long-term petrophysical investigations on geothermal reservoir rocks at simulated in-situ conditions. Transp. Porous Med. 2008, 74, 1. [Google Scholar] [CrossRef] [Green Version]
- Engelder, T. A natural example of the simultaneous operation of free-face dissolution and pressure solution. Geochim. Cosmochim. Acta 1982, 46, 69–74. [Google Scholar] [CrossRef]
- Aureli, F.; Ciprotti, M.; D’Amato, M.; do Nascimento da Silva, E.; Nisi, S.; Passeri, D.; Sorbo, A.; Raggi, A.; Rossi, M.; Cubadda, F. Determination of total silicon and SiO2 particles using an ICP-MS based analytical platform for toxicokinetic studies of synthetic amorphous silica. Nanomaterials 2020, 10, 5. [Google Scholar] [CrossRef]
- Witherspoon, P.A.; Wang, J.S.; Iwai, K.; Gale, J.E. Validity of cubic law for fluid flow in a deformable rock fracture. Water Resour. Res. 1980, 16, 6. [Google Scholar] [CrossRef] [Green Version]
- Zimmerman, R.W.; Bodvarsson, G.S. Hydraulic conductivity of rock fractures. Transp. Porous Med. 1996, 23, 1. [Google Scholar] [CrossRef] [Green Version]
- Carroll, M.M.; Katsube, N. The role of Terzaghi effective stress in linearly elastic deformation. J. Energ. Resour. Tech. 1983, 105, 4. [Google Scholar] [CrossRef]
- Arns, C.H.; Knackstedt, M.A.; Pinczewski, W.V.; Garboczi, E.J. Computation of linear elastic properties from microtomographic images: Methodology and agreement between theory and experiment. Geophysics 2002, 67, 5. [Google Scholar] [CrossRef]
- David, E.C.; Fortin, J.; Schubnel, A.; Guéguen, Y.; Zimmerman, R.W. Laboratory measurements of low- and high-frequency elastic moduli in Fontainebleau sandstone. Geophysics 2013, 78, 5. [Google Scholar] [CrossRef]
- Sulem, J.; Ouffroukh, H. Hydromechanical behaviour of Fontainebleau sandstone. Rock Mech. Rock Eng. 2006, 39, 3. [Google Scholar] [CrossRef]
- Durham, W.B.; Bonner, B.P. Self-propping and fluid flow in slightly offset joints at high effective pressures. J. Geophys. Res. 1994, 99, B5. [Google Scholar] [CrossRef]
- Vogler, D.; Amann, F.; Bayer, P.; Elsworth, D. Permeability evolution in natural fractures subject to cyclic loading and gouge formation. Rock Mech. Rock Eng. 2016, 49, 9. [Google Scholar] [CrossRef]
- Crawford, B.R.; Tsenn, M.C.; Homburg, J.M.; Stehle, R.C.; Freysteinson, J.A.; Reese, W.C. Incorporating scale-dependent fracture stiffness for improved reservoir performance prediction. Rock Mech. Rock Eng. 2017, 50, 12. [Google Scholar] [CrossRef]
- Rutqvist, J. Fractured rock stress-permeability relationships from in situ data and effects of temperature and chemical-mechanical couplings. Geofluids 2015, 15, 1–2. [Google Scholar] [CrossRef] [Green Version]
- Fournier, R.O.; Potter II, R.W. An equation correlating the solubility of quartz in water from 25 to 900 C at pressures up to 10,000 bars. Geochim. Cosmochim. Acta 1982, 46, 10. [Google Scholar] [CrossRef]
- Paterson, M. Nonhydrostatic thermodynamics and its geologic applications. Rev. Geophys. 1973, 11, 2. [Google Scholar] [CrossRef]
- Renard, F.; Park, A.; Ortoleva, P.; Gratier, J.-P. An integrated model for transitional pressure solution in sandstones. Tectonophysics 1999, 312, 2–4. [Google Scholar] [CrossRef]
- Yasuhara, H. A mechanistic model for compaction of granular aggregates moderated by pressure solution. J. Geophys. Res. 2003, 108, B11. [Google Scholar] [CrossRef]
- Ogata, S.; Yasuhara, H.; Kinoshita, N.; Cheon, D.-S.; Kishida, K. Modeling of coupled thermal-hydraulic-mechanical-chemical processes for predicting the evolution in permeability and reactive transport behavior within single rock fractures. Int. J. Rock Mech. Min. Sci. 2018, 107. [Google Scholar] [CrossRef]
- Rimstidt, J.D.; Barnes, H. The kinetics of silica-water reactions. Geochim. Cosmochim. Acta 1980, 44, 11. [Google Scholar] [CrossRef]
- De Boer, R.; Nagtegaal, P.; Duyvis, E. Pressure solution experiments on quartz sand. Geochim. Cosmochim. Acta 1977, 41, 2. [Google Scholar] [CrossRef]
- Gratier, J.-P.; Dysthe, D.K.; Renard, F. The Role of Pressure Solution Creep in the Ductility of the Earth’s Upper Crust. In Advances in Geophysics; Dmowska, R., Ed.; Elsevier: Amsterdam, The Netherlands, 2013; pp. 47–179. [Google Scholar]
- Kling, T.; Vogler, D.; Pastewka, L.; Amann, F.; Blum, P. Numerical simulations and validation of contact mechanics in a granodiorite fracture. Rock Mech. Rock Eng. 2018, 51, 9. [Google Scholar] [CrossRef]
- Waza, T.; Kurita, K.; Mizutani, H. The effect of water on the subcritical crack growth in silicate rocks. Tectonophysics 1980, 67, 1–2. [Google Scholar] [CrossRef]
- Atkinson, B.K. Stress corrosion and the rate-dependent tensile failure of a fine-grained quartz rock. Tectonophysics 1980, 65, 3–4. [Google Scholar] [CrossRef]
- Nara, Y.; Hiroyoshi, N.; Yoneda, T.; Kaneko, K. Effects of relative humidity and temperature on subcritical crack growth in igneous rock. Int. J. Rock Mech. Min. Sci. 2010, 47, 4. [Google Scholar] [CrossRef] [Green Version]
- Yasuhara, H.; Kinoshita, N.; Ohfuji, H.; Lee, D.S.; Nakashima, S.; Kishida, K. Temporal alteration of fracture permeability in granite under hydrothermal conditions and its interpretation by coupled chemo-mechanical model. Appl. Geochem. 2011, 26, 12. [Google Scholar] [CrossRef]
Figure 1.
(a) The cylindrical rock sample contains a single tensile fracture along its principal axis. (b) The assembled sample (view after the experiment) is constrained by heat-shrink tubing and a metal sheet is placed between the fracture edges and the heat-shrink tubing to prevent the latter from punching under confining pressure. (c) A magnified image shows a representative microstructure of the fracture aperture (after the experiment), wherein propping asperities keep the fracture open and the free fracture walls are directed toward the void space.

Figure 2.
Schematic illustration of the experimental apparatus used for the flow-through experiment. The assembled sample is mounted in a hydrostatic confining pressure vessel and isolated by heat-shrink tubing. The lower and upper sample ends are connected to syringe pumps (ISCO 260D), and a relief valve placed in parallel at the downstream side is used for effluent sampling.

Figure 3.
(a) Hydraulic fracture aperture and (b) mechanical fracture aperture changes as a function of confining pressure at a constant pore pressure of 1 MPa. The first loading–unloading cycle between 5 and 30 MPa was performed stepwise in 5-MPa intervals, and the latter two cycles between 10 and 30 MPa were conducted continuously. Permeability was measured at each respective constant pressure level.

Figure 4.
Hydraulic fracture aperture as a function of temperature at constant pore pressure (1 MPa) and constant confining pressure (10 MPa).
Figure 4.
Hydraulic fracture aperture as a function of temperature at constant pore pressure (1 MPa) and constant confining pressure (10 MPa).

Figure 5.
Evolution of hydraulic fracture aperture under different confining pressure and temperature conditions as a function of time during the long-term flow-through experiment (black triangles).
Figure 5.
Evolution of hydraulic fracture aperture under different confining pressure and temperature conditions as a function of time during the long-term flow-through experiment (black triangles).

Figure 6.
Si concentrations (as measured by a photometer) in the subsamples obtained from the relief valve as a function of cumulative volume. The gray stripe indicates the Si concentration in the fluid from the fracture void, and all the other dots are the Si concentrations in the fluids from the downstream and upstream capillaries, respectively. The fluids were sampled: (a) at 140 °C and a pc of 30 MPa after 16 days, (b) at 140 °C and a pc of 30 MPa after 8 days, (c) at 140 °C and a pc of 10 MPa after 8 days, and (d) at 33 °C at a pc of 10 MPa after 8 days of stagnant flow, respectively.

Figure 7.
Evolution of maximum Si concentration of each series of effluent subsamples as a function of time and under different confining pressure and temperature conditions.
Figure 7.
Evolution of maximum Si concentration of each series of effluent subsamples as a function of time and under different confining pressure and temperature conditions.

Figure 8.
(a) Three-dimensional (3-D) models of the fractured sample core before (left) and after (right) the flow-through experiment as obtained from the X-ray µCT scans. The fracture void (in blue) was extracted from the reconstructed 3-D models. (b) Images of the cross-sections AB and A’B’, with their locations in the core shown in (a), taken perpendicular to the long sample axis before (left) and after (right) the flow-through experiment.

Figure 9.
Si concentration as a function of inverse temperature 1/T (K−1). The dots indicate the respective measured Si concentrations under the corresponding P and T conditions (see chemical data in S2). The solubility of quartz in water at a hydrostatic pressure of 1 MPa (black line) is taken from Fournier and Potter II [30].


Table 1.
Experimental conditions (pressures and temperatures) and the duration of each stage.
| No. | Operation | Duration (Days) | pc (MPa) | pp (MPa) | Temperature T (°C) |
|---|---|---|---|---|---|
| 1 | Mechanical | Short-term | 5↔10↔15↔20↔25↔30 a | 1 | 26 |
| 2 | Thermal | Short-term | 10 | 1 | 26↔60↔95↔140 b |
| 3 | 0–4 | 30 | 1 | 33→59→86→112→140 c | |
| 4 | Chemical | 4–117 | 30 | 1 | 140 |
| 5 | 117–133 | 10 | 1 | 140 | |
| 6 | 133–141 | 10 | 1 | 33 |
a Confining pressure was varied stepwise in a cycle between 5 and 30 MPa and was further varied twice continuously in a cycle between 10 and 30 MPa. b Temperature was cycled stepwise between room temperature and 140 °C. c Temperature was increased stepwise to 140 °C and was then maintained constant for the long-term observations.
© 2020 by the authors. Licensee MDPI, Basel, Switzerland. This article is an open access article distributed under the terms and conditions of the Creative Commons Attribution (CC BY) license (http://creativecommons.org/licenses/by/4.0/).
Share and Cite
MDPI and ACS Style
Cheng, C.; Milsch, H. Evolution of Fracture Aperture in Quartz Sandstone under Hydrothermal Conditions: Mechanical and Chemical Effects. Minerals 2020, 10, 657. https://doi.org/10.3390/min10080657
AMA Style
Cheng C, Milsch H. Evolution of Fracture Aperture in Quartz Sandstone under Hydrothermal Conditions: Mechanical and Chemical Effects. Minerals. 2020; 10(8):657. https://doi.org/10.3390/min10080657
Chicago/Turabian StyleCheng, Chaojie, and Harald Milsch. 2020. "Evolution of Fracture Aperture in Quartz Sandstone under Hydrothermal Conditions: Mechanical and Chemical Effects" Minerals 10, no. 8: 657. https://doi.org/10.3390/min10080657
Note that from the first issue of 2016, this journal uses article numbers instead of page numbers. See further details here.