Prediction of Odor Concentration Emitted from Wastewater Treatment Plant Using an Artificial Neural Network (ANN)


1
Department of Land, Water and Environment Research, Korea Institute of Civil Engineering and Building Technology, 283, Goyangdae-Ro, Ilsanseo-Gu, Goyang, Gyeonggi-Do 10233, Korea
2
Department of Civil and Environmental Engineering, Sejong University, 209, Neungdong-Ro, Gwangjin-Gu, Seoul 05006, Korea
*
Author to whom correspondence should be addressed.
Atmosphere 2020, 11(8), 784; https://doi.org/10.3390/atmos11080784
Submission received: 9 June 2020
/
Revised: 16 July 2020
/
Accepted: 23 July 2020
/
Published: 24 July 2020
(This article belongs to the Special Issue Application of Machine Learning in Air Pollution)
Abstract
:The odor emitted from a wastewater treatment plant (WWTP) is an important environmental problem. An estimation of odor emission rate is difficult to detect and quantify. To address this, various approaches including the development of emission factors and measurement using a closed chamber have been employed. However, the evaluation of odor emission involves huge manpower, time, and cost. An artificial neural network (ANN) is recognized as an efficient method to find correlations between nonlinear data and prediction of future data based on these correlations. Due to its usefulness, ANN is used to solve complicated problems in various disciplines of sciences and engineering. In this study, a method to predict the odor concentration in a WWTP using ANN was developed. The odor concentration emitted from a WWTP was predicted by the ANN based on water quality data such as biological oxygen demand, dissolved oxygen, and pH. The water quality and odor concentration data from the WWTP were measured seasonally in spring, summer, and autumn and these were used as input variations to the ANN model. The odor predicted by the ANN model was compared with the measured data and the prediction accuracy was estimated. Suggestions for improving prediction accuracy are presented.
1. Introduction
Odor is an environmental pollutant that causes displeasure and health risk to human beings. Residents are weary of the installation of foundational environmental facilities such as wastewater treatment plants (WWTPs) near their neighborhoods owing to the bad odor emitted from their operations. Therefore, this issue of emanating odor from WWTPs must be addressed. Over the last decade, governments around the world have spent enormous amounts to mitigate odor [1].
The estimation of the odor concentration of is a prerequisite for the design of collecting systems and deodorization facilities. However, odor concentration varies widely as it is generated and volatilized into the atmosphere during different stages of wastewater treatment such as aeration, biological treatment, and sludge disposal. Therefore, measuring odor concentration is an essential and challenging task [2].
A simple method for measuring odor is instrumental analysis. However, this method is faced with difficulties in accurately measuring odor as various malodorous compounds are mixed in the odor gas and their concentrations fluctuate depends on environmental conditions. The other way to measure odor is the olfactometry method that expresses the intensity of mixed odor based on the sensitivity of the human nose. This method is good in terms of ease of measurement of mixed odor gas and intuitively describing the odor concentration [3]. However, this method is time and manpower intensive. For these reasons, though odor concentration in WWTPs is important and necessary, it is monitored only occasionally.
In WWTPs, the water quality of effluent and inflow is monitored daily through a well-established instrumentation system. Water quality parameters including biological oxygen demand (BOD), total suspended solid (TSS), and oxidation reduction potential (ORP) are monitored continuously. Unfortunately, these parameters are not related directly to odor emission but they influence the activity of microorganisms and the generation of odor. Therefore, it is impossible to predict odor concentration based on water quality data using statistical estimation such as regression analysis.
An Artificial Neural Network (ANN) is a system that processes information based on a structure that is similar to the human neural network. In the human body, information is introduced and transmitted through neurons and the final processing is conducted. ANN operates in a similar way of learning using input variables and by determining their weights. The output data are exported to the result based on the weights of the input variables and extrapolation. ANN can functionalize non-linear data based on the relationships between complex data. ANN is used for processing nonlinear data in various fields including environmental engineering [4].
ANNs have been applied to predict odor. The prediction processes can be structured based on the classification and regression methods. This classification method identifies substances present in the sample and predicts the smell experienced by the human nose. Numerous studies have been conducted on odor classification in recent decades. Odor characteristics were predicted based on functional group or ligands using ANNs [5]. Nozaki and Nakomoto predicted human perception of odorants from a spectrum of gas chromatography patterns [6]. Shang et al. made machine-learning-based olfactometer predictions based on the molecular chemistry of odorants [7]. These efforts were confined to classification and did not predict odor intensity or concentration.
Odor intensity or concentration has previously been predicted using regression methods. While some studies quantified the measurement of odors in terms of OU/m3, others predicted odor intensity [8]. Byliński et al. applied an ANN to predict odor concentration emitted from the post-digestion sludge of a WWTP based on volatile fatty acid content and pH of sludge [9]. A study on the prediction of odor concentration using the signal pattern of a gas sensor array suggested the use of a machine learning algorithm and simulation methods to improve prediction accuracy [10]. In addition to the above studies, the estimation of water treatment process or patterns and the prediction of biological oxygen demand concentration based on odor concentration has been reported [11].
However, these predictions were conducted using principal component analysis, which involves a significant amount of data and long evaluation period to identify and quantify each component using instrumental analysis. Moreover, many restraints are faced while deploying these instruments in the field [8]. To overcome these limitations, we propose an odor concentration prediction method based on water quality data that is automatically measured daily using a tele-measuring system. If odor concentration can be predicted based on water quality parameters such as BOD, TSS, and pH, the assessment and control of odor will be possible. The aim of this study is to suggest an alternative approach to monitor and controlling odor using continuous real-time data. To achieve this goal, a prediction model for odor concentration in WWTPs was provided using the RandomForest (RF) Regressor. Odor emanating from the WWTP was measured using the olfactometric method and water quality data were obtained from the facility’s officer. From these data, odor concentration was predicted using the ANN model.
2. Materials and Methods
2.1. Data Acquisition
The samples for analysis were collected using Tedlar bags and a lung sampler. The Tedlar bags were prepared by cleaning thoroughly with nitrogen gas prior to use. The lung sampler equipped with the Tedlar bag was located at the center of each process of the WWTP. Odor gas was sucked into the Tedlar bag and sealed with a cap. The samples were transported and analyzed within 6 h. The analysis was conducted based on the reference standard for dynamic olfactometry EN 13725 [12]. Some target odorants were quantified instrumental analysis. Gas chromatography equipped with frame photometric detector (GC-2010 plus, SHIMADZU, Japan) was utilized for sulfuric compounds including hydrogen sulfide, methyl mercaptan, and dimethyl sulfide. Acetaldehyde and butyl aldehyde were quantified by gas chromatography-mass spectrometry (597B, Agilent, USA). The detection limits of the instruments were 0.001 ppmv.
Six sampling points at the WWTP were selected for sampling: grit chamber-industrial wastewater (IW), grit chamber-municipal wastewater (MW), first sedimentation tank (MW), first sedimentation tank (IW), aerobic biotreatment, and anaerobic biotreatment. Sampling and analysis were performed monthly from May to September of 2018.
2.2. Artificial Neural Network
ANN is widely used for the prediction of useful data from nonlinear variables. ANN consists of input, hidden, and output layers. The input layer accepts the input variables and conducts transmission. The hidden layer transmits the variation to the output layer. The output layer produces the end output of the structure. Each layers are linked by nodes (neurons) each of which perform a specific nonlinear activation function. A hidden node produces an intermediate output by performing a weighted sum of the inputs and then transforms it with a transfer function. The hidden nodes transfer the data to the connected nodes in the next layer until the output layer finishes by producing the end output.
In this study, the ANN model was developed using the RF which is an open source program. RF is an ensemble learning model with a combination of decision tree and bootstrap aggregation. In the RF, a number of decision trees are generated, and they are combined for classification or regression. The individual decision trees are randomly extracted from the original samples with replacement. The prediction results obtained from each decision tree are averaged as an RF prediction.
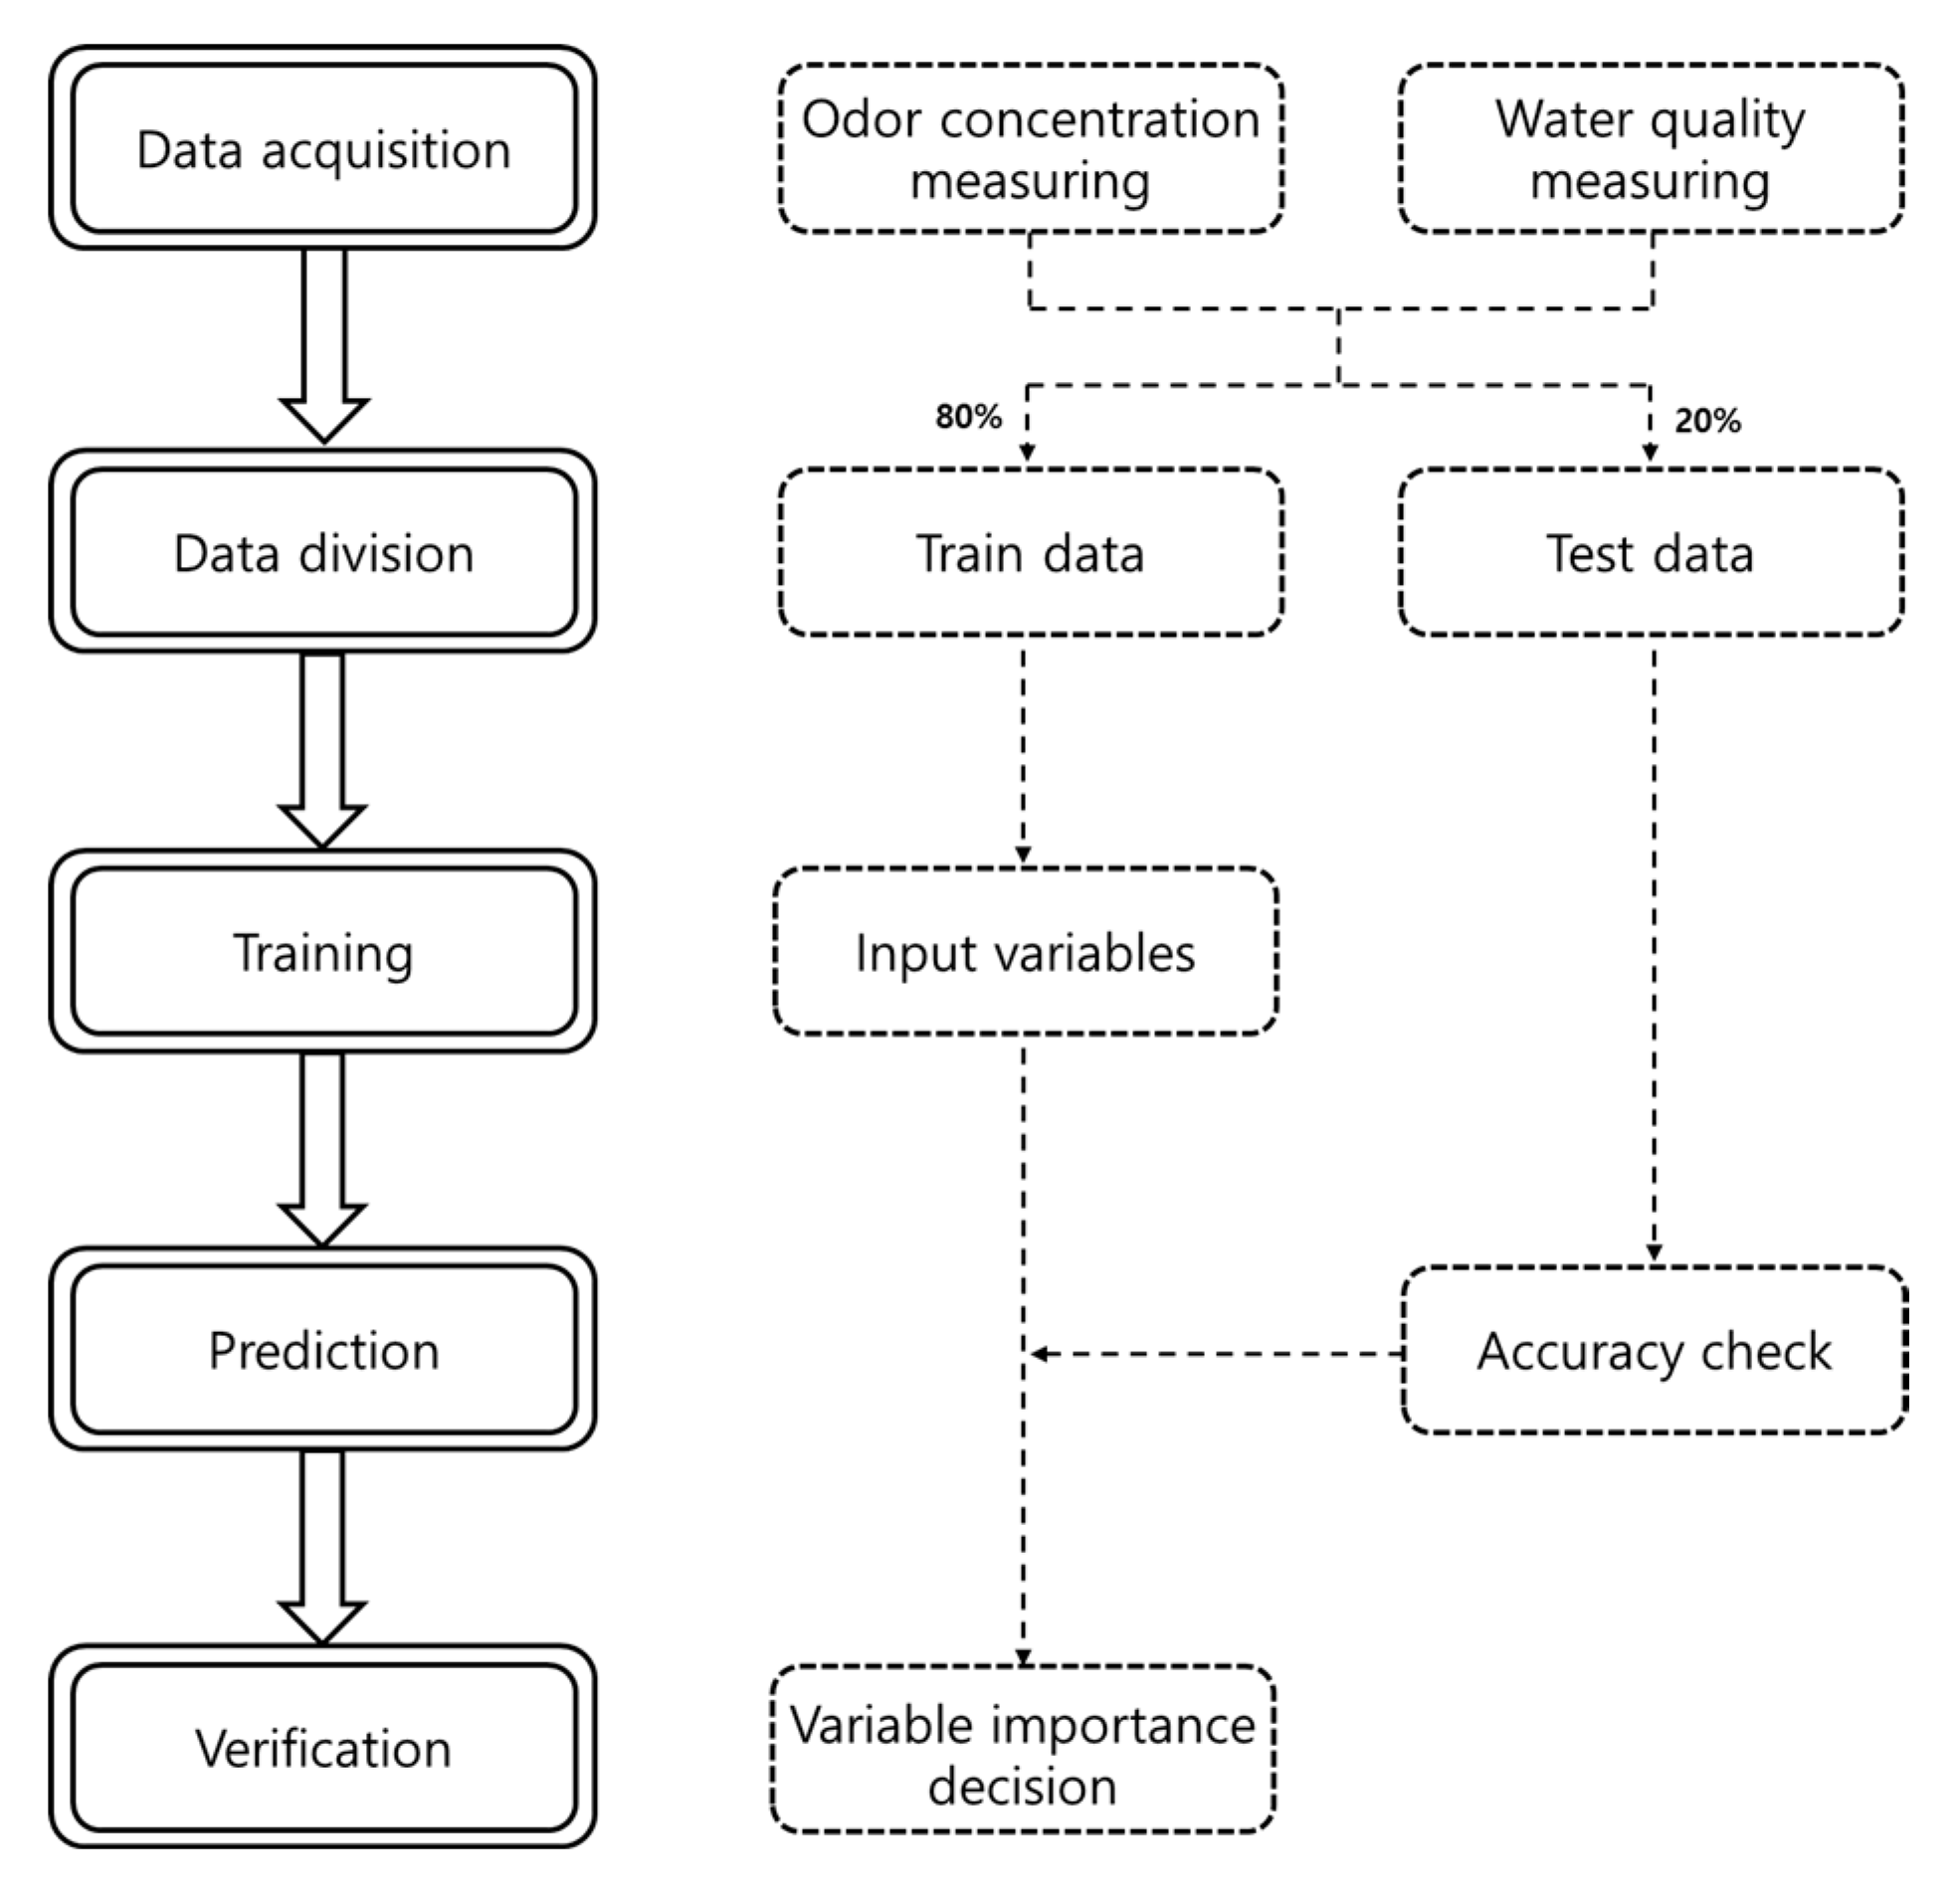
Although selecting input variable data is very important to obtain high prediction accuracy, the systematic selection of input variables has not yet been proposed. The selection of input variables for ANNs depends on the expert’s experience and intuition. Therefore, machine learning for the regression of odor prediction was performed using supervised learning. The processes of training and predictions are described in Figure 1.
From the obtained dataset, 80% was used as training data while the remaining 20% was utilized as test data. Initially, all variables were used for the RF and the corresponding prediction accuracies were checked. The variables used in this study were BOD, TSS, ORP, water temperature, pH, dissolved oxygen (DO), and volatile suspended solid (VSS). After that, one variable was used for prediction and the accuracy was calculated. The prediction accuracy was calculated by Equation (1) below:
where is the number of samples, is the ith element of the measured data, and and are data predicted by the ANN model and its mean value, respectively. The importance level was estimated based on the accuracy. Finally, variables that can most precisely predict the odor concentration were selected and then the RF model was verified.
3. Results
3.1. Odor Characteristics
Prior to the prediction of the odor concentrations, the odor characteristic in the WWTP were monitored at the six identified locations on a monthly basis from May to September of 2018. The range of the odor concentrations are described in Table 1. The maximum concentration measured was 3000 OU/m3 in the grit chamber for municipal wastewater (MW), while the maximum of 30,000 OU/m3 was detected in the first sedimentation tank for industrial wastewater (IW). Odor is mainly generated because of the decomposition of organics and the reduction of sulfate ions in the MW. However, the odorants dissolved in the IW are released to the atmosphere rather than natural generation. Therefore, the odor intensity in the case of IW is stronger than that of the MW. According to instrumental analysis of the odor gases, hydrogen sulfide (H2S) and methyl mercaptan (MM) are the principal odorants in the gas released from the MW grit chamber (Table 1). Moreover, acetaldehyde and butyraldehyde were additionally detected with H2S and MM in the gas from the IW grit chamber. Acetaldehyde and butyraldehyde have lower detection thresholds and their odor intensities are stronger than that of H2S.
The aim of this study is to predict odor concentration based on the water quality variables. Since odor from the MW is formed by anaerobic degradation, water quality contains the generation characteristics. However, water quality parameters such as BOD or TSS cannot show characteristics of odor in the IW. This implies that the prediction of odor in the IW using the variables obtained from the WWTP will have a low accuracy. In the first sediment tank for the IW, a high concentration of 30,000 OU/m3 was observed.
In the biotreatment processes, maximum odor concentrations of 1000 OU/m3 for the aerobic process and 300 OU/m3 for the anaerobic process were detected. Although the odorants are usually formed in an anaerobic condition, in this case, the concentration was high at the location of the aerobic process. This is attributed that odor dissolved in water was released to atmosphere by the action of the blower, that is, stripping. On the other hand, the anaerobic bioreactor is sealed thoroughly, and this is attributed to the mitigation of odor by the deodorization facilities. These external parameters, such as blowing, suction, and sealing cannot be trained to be included in the ANN. Therefore, this could also be a factor in the reduced prediction accuracy.
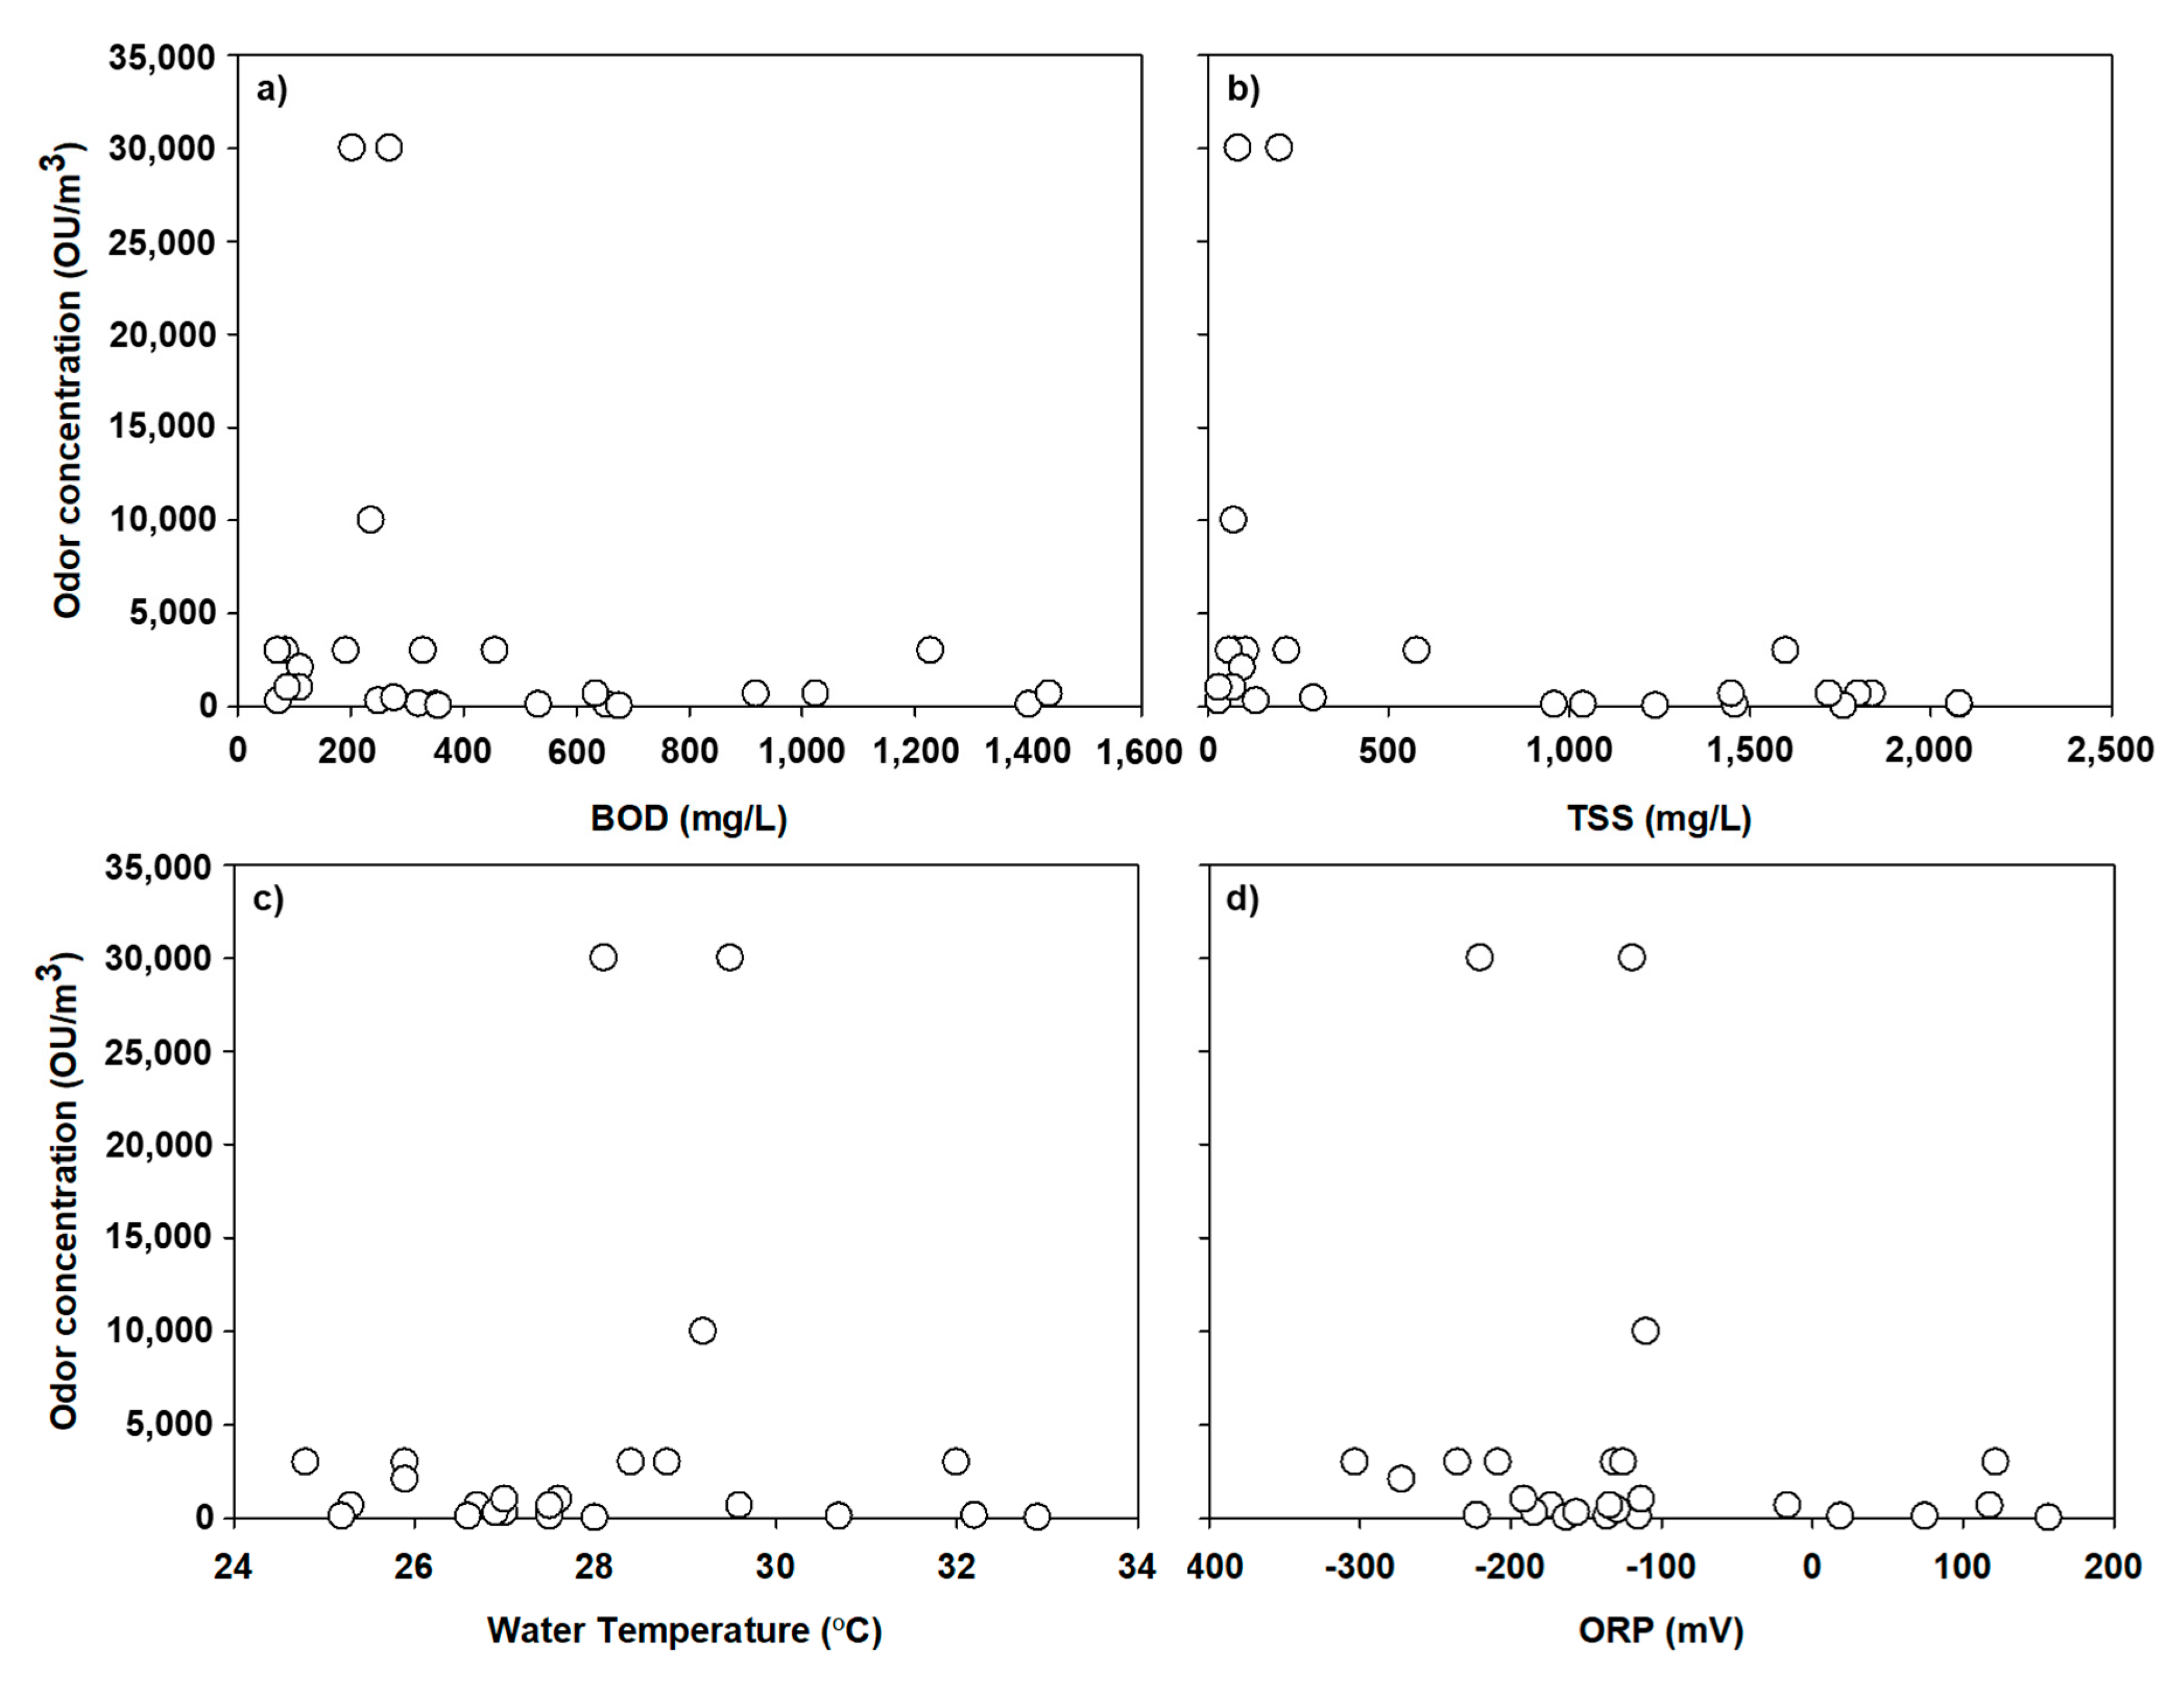
Regression analysis was performed to identify the correlation between the variables and odor concentration. Figure 2 shows the correlation between the variables and odor concentrations. No significant correlation was found between odor concentration and the variables. The generation of odor is influenced by various factors apart from BOD or TSS such as microorganisms and their activities, nutrient salts present in the wastewater and other factors. It is evident that the correlation between odor concentration and water quality is complex and it is a nonlinear function. Therefore, it is impossible to predict odor concentration using statistical approaches such as multiple or linear regression analyses.
However, there are many studies that have obtained an output with high prediction accuracy from the complex nonlinear variables. Park et al. (2018) observed an accuracy of 80% for the prediction of particulate matter concentration in subway stations. They used nonlinear variables such as particulate matter concentration outside subway stations, subway frequency, and ventilation rate as inputs. Dou et al. calculated the discharge coefficients for flood prediction using an ANN model with variables of relative waterhead and gate opening [14]. Janes et al. estimated odor intensity emanating from a pork farm from ammonia and hydrogen sulfide concentrations [15]. Therefore, ANN can be gainfully employed to achieve the aim of this study.
3.2. Odor Prediction
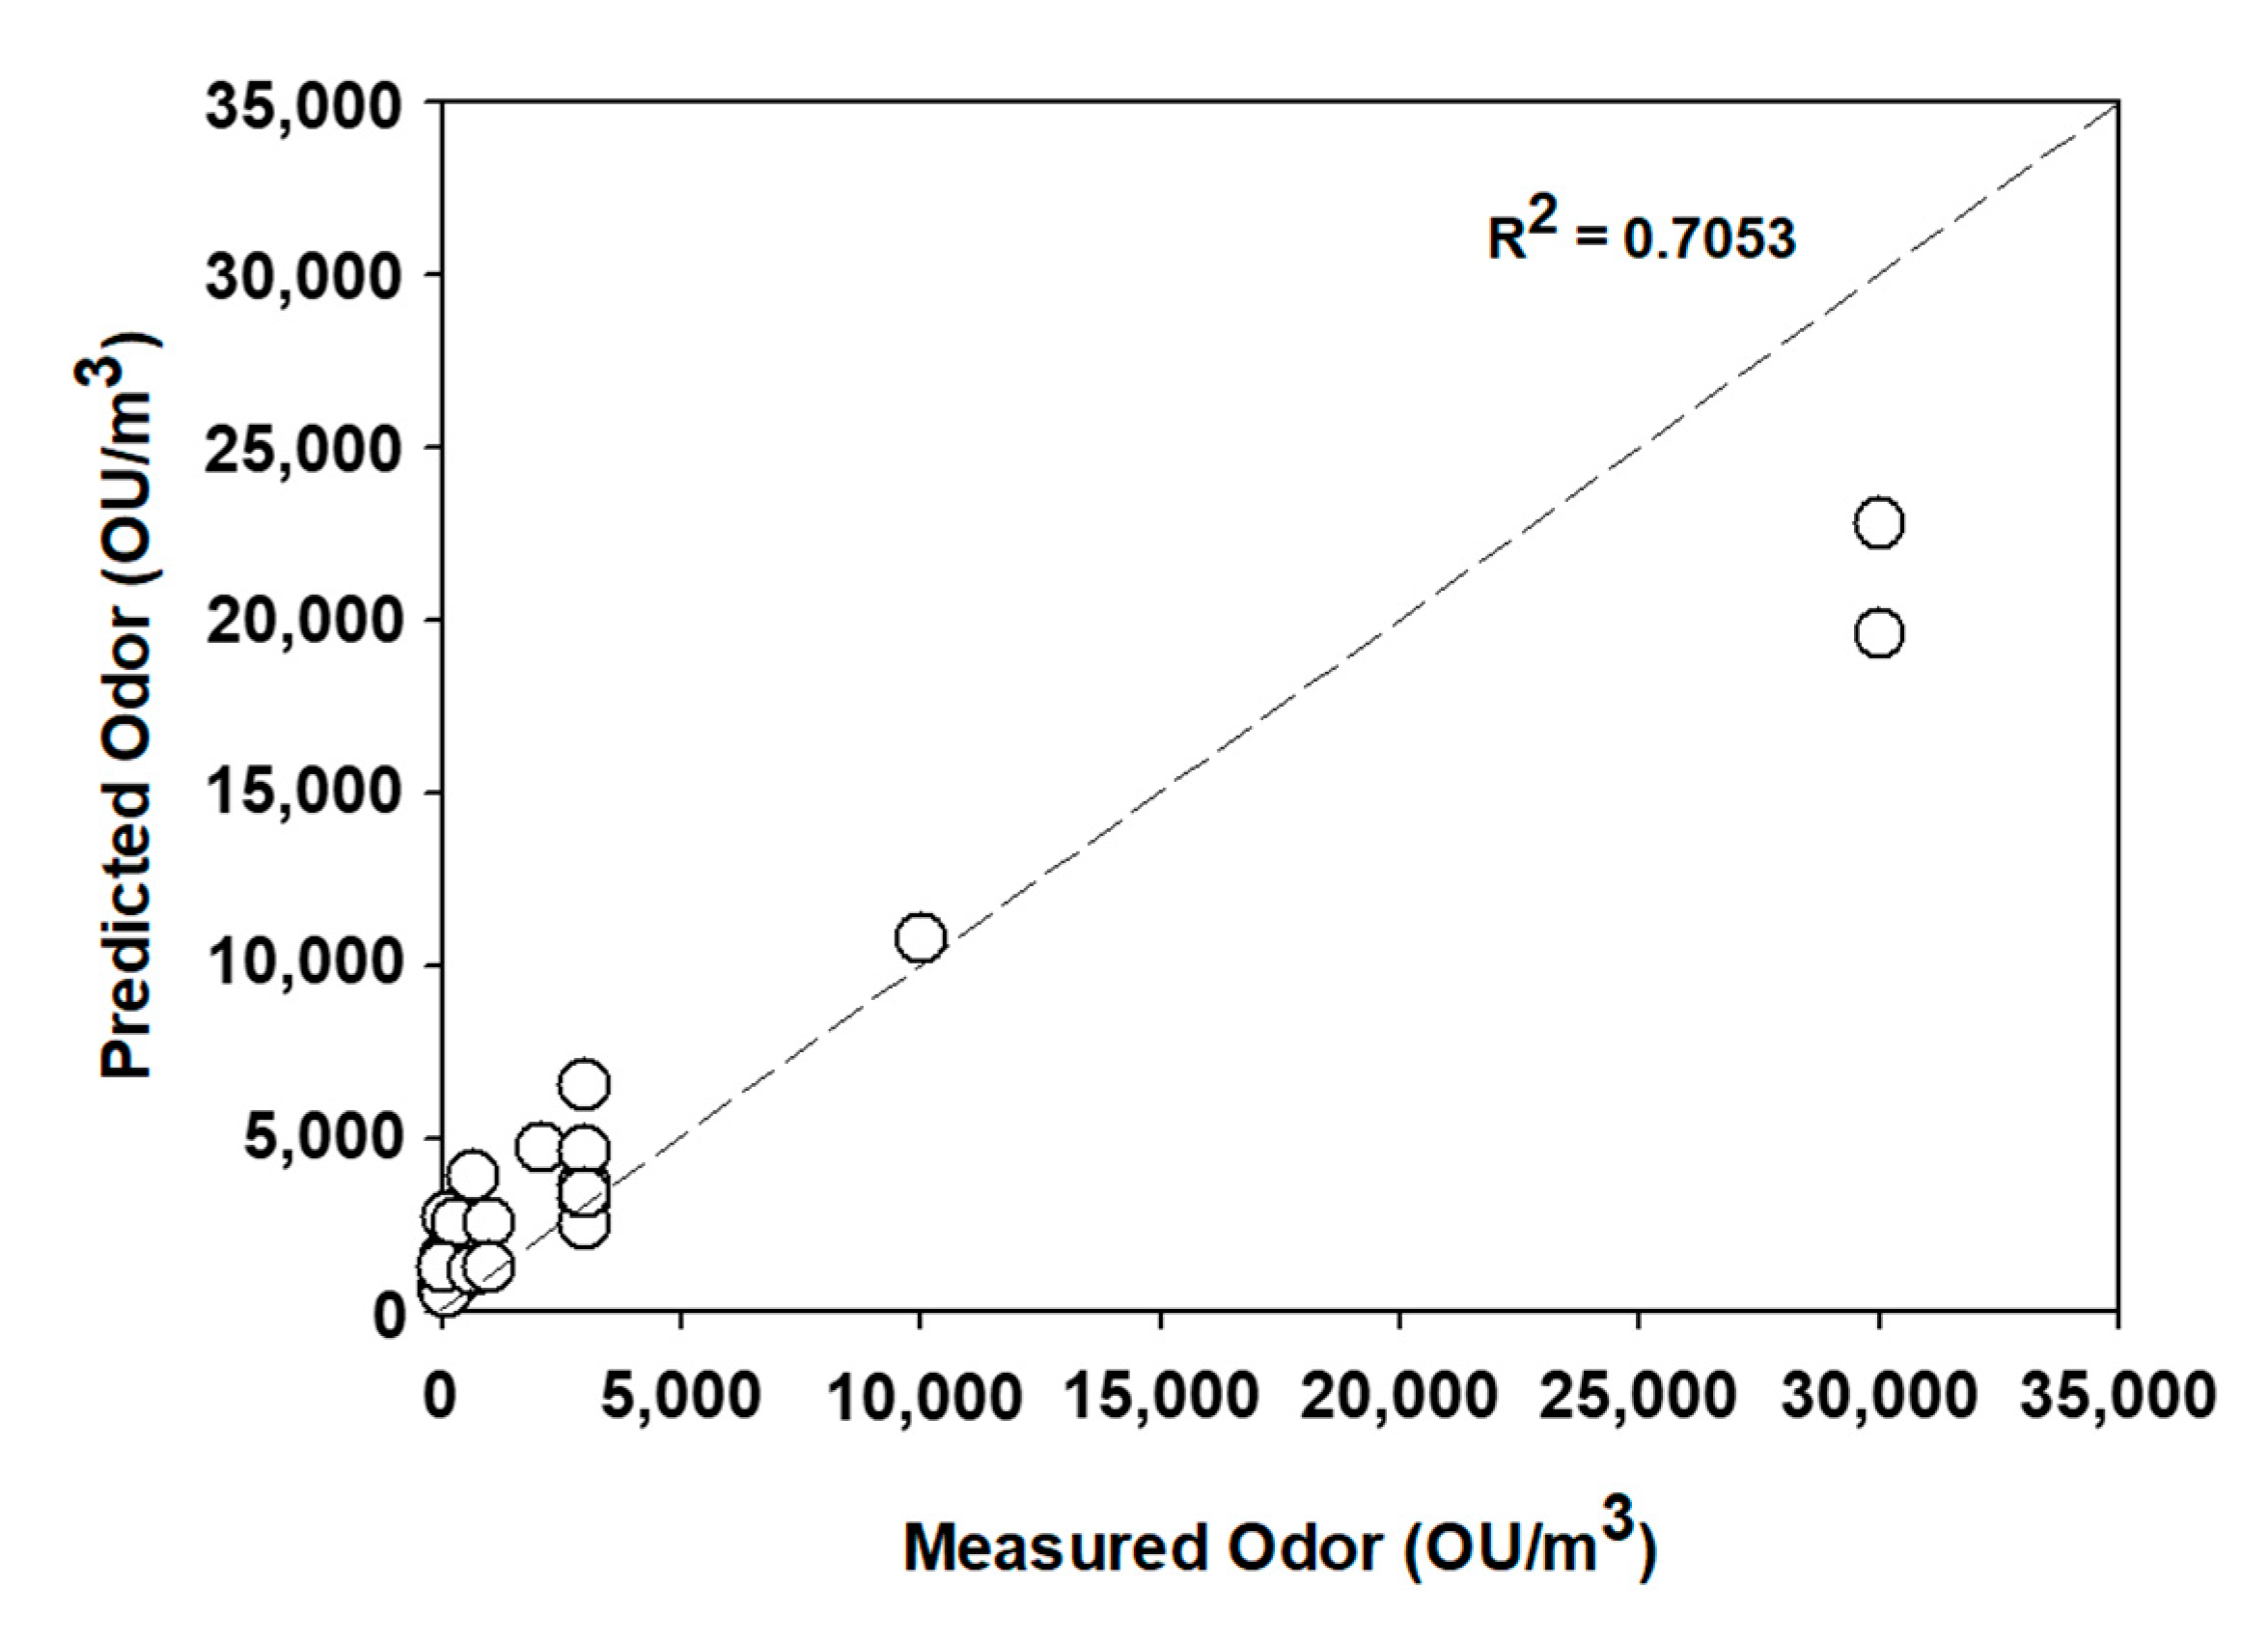
All water quality variables were used as inputs for the prediction of odor concentrations before sorting them according to their weight ranks. The variables according to order of sorting are BOD, TSS, volatile suspended solids (VSS), pH, dissolved oxygen (DO), water temperature, and ORP. The prediction result is described in Figure 3. The coefficient of determination between the measured and predicted odor concentration was 0.7053 indicating a prediction accuracy of 70%. The prediction values were larger than the measured values when the measured concentration was less than 5000 OU/m3 and smaller for measured concentrations higher than 30,000 OU/m3. The WWTP considered in this study treated municipal and industrial wastewater simultaneously. The point of observation for industrial wastewater was the first sedimentation tank. The highest concentration of odor was emitted from the industrial wastewater (Table 1). Therefore, most of the odor came from dissolved chemicals rather than through biological generation. It means that odor emission was not governed by water quality parameters such as BOD and TSS, resulting in smaller prediction values than that of the measured concentrations.
The prediction accuracy by inputting all variables was approximately 70%. Since ANN performs the prediction by assigning weights for the input variables, some variables might reduce the accuracy. The selection of input variables is very important to avoid this accuracy reduction phenomenon. The most common method is sorting of variables based on their statistical significance. However, there is no correlation between the water quality data obtained from the officer and the odor concentrations (see Figure 2). Therefore, prediction was conducted with the exception of each of the variables in order.
The importance of ranking of input variables based on prediction accuracy is detailed in Table 2. Among the variables, it can be seen that the exclusion of water temperature had the most influence on prediction accuracy. When the water temperature was excluded from the ANN, the accuracy was reduced to 66%. This can be attributed to the effect of water temperature on solubility that influences the emission of odor. Excluding BOD or TSS showed similar accuracies. The other variables had a negative effect on prediction accuracy as they are rarely related to odor emission.
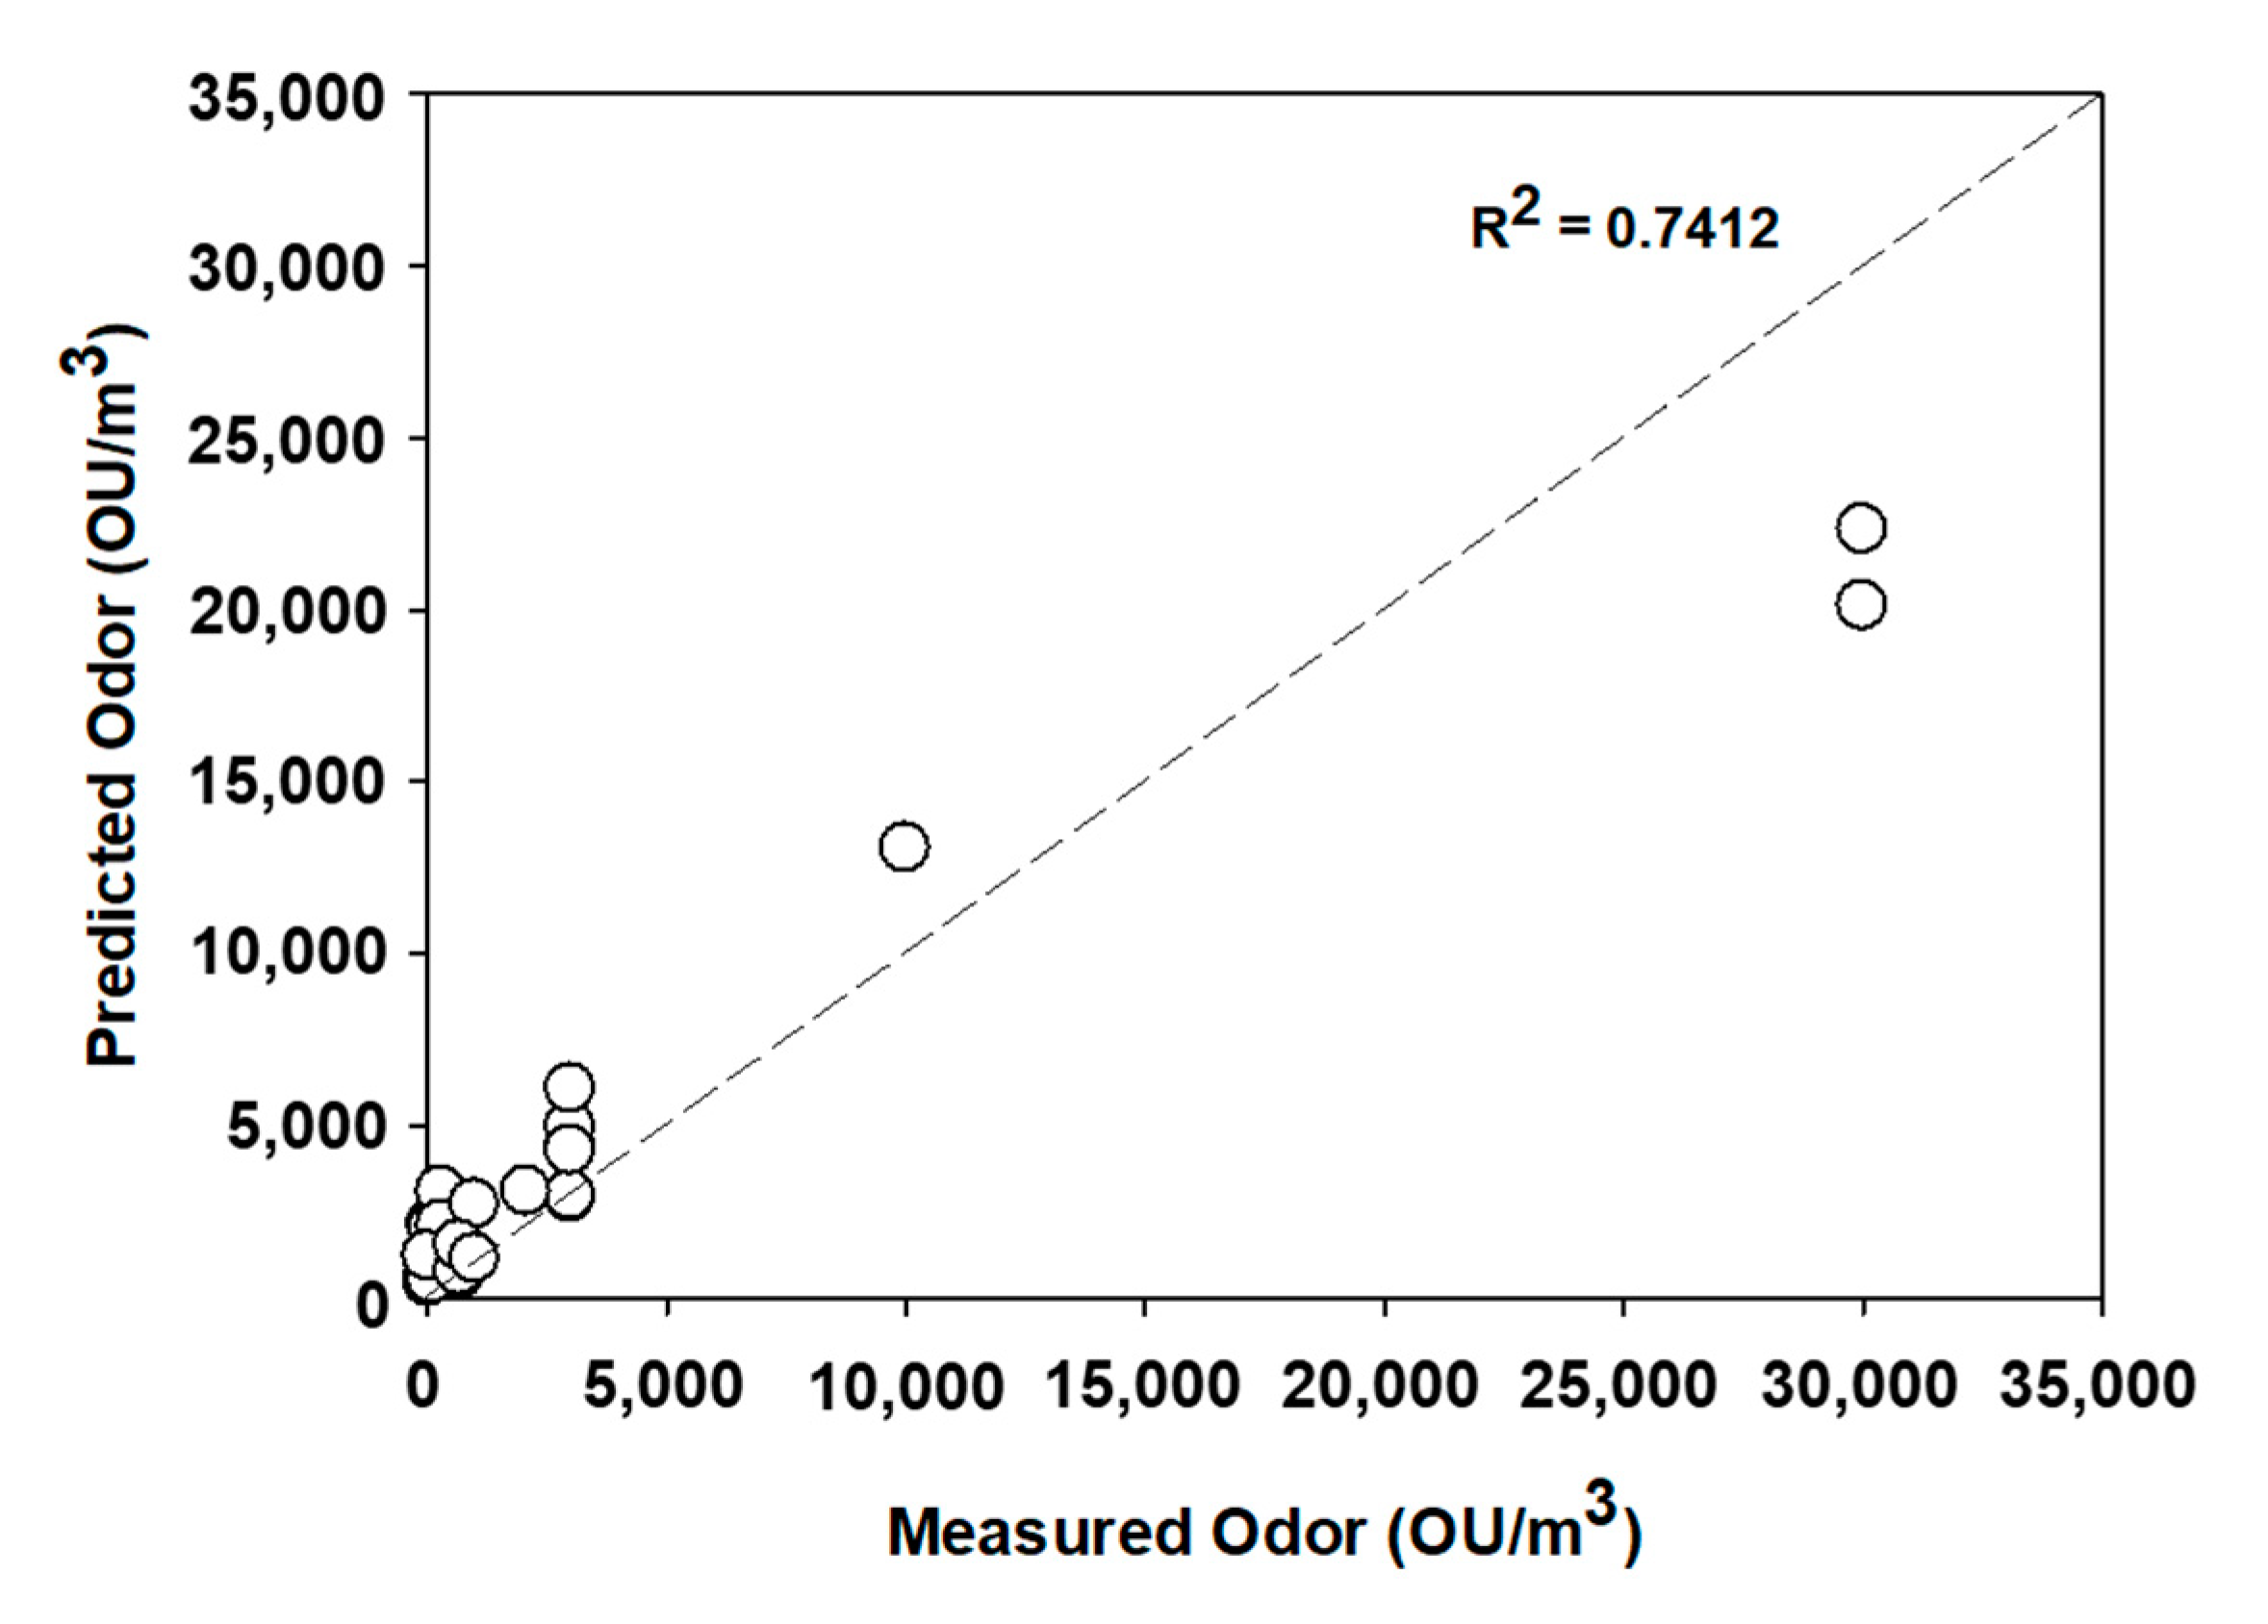
Based on the importance of the variables, DO and ORP were excluded for the computation of prediction accuracy. Figure 4 shows the prediction results. The prediction accuracy was improved to 74%. However, the prediction result after excluding only DO only was 0.7432. This is because of the interaction of the variables. ORP and DO are related to anaerobic decomposition. Therefore, simultaneous input of ORP and DO might have a negative effect on the model’s prediction capability. In conclusion, by excluding only DO, the best prediction accuracy was achieved.
However, the prediction accuracy of 74% is not a satisfactory value. It was due to the characteristics of the input variables used in this study. The input variable is extremely important for accurate predictions using ANNs. However, the main factors influencing prediction accuracy were external variables that were not related to the water quality parameters considered in this study. Qdais et al. (2010) suggested an ANN model for estimating methane yield in anaerobic digestion [16]; they used key water quality parameters in the anaerobic digestion process such as total solids, total volatile solids, pH, and water temperature. However, these are key parameters in anaerobic digestion process i.e., there are obvious correlation between water quality and methane yield. Therefore, they obtained the prediction accuracy of R2>87%. Rincón et al. predicted the olfactometric concentration of odor from odor activity values during the composting process [17]; they reported that the prediction accuracy was less than 76% and some key odor substances affected the accuracy. Janes et al. predicted odor emitted from a pork farm with an accuracy of less than 83% by means of the characteristics of the variables [15]. In fact, the accuracy in this study was dramatically increased to 92% in this study when hydrogen sulfide concentration was used as an input variable along with water quality data (data not shown). However, that was not in accordance with the aim of this study.
In addition, the insufficient quantity of data (approximately 130 data points) is likely to be another contributing factor in the reduced accuracy achieved. Generally, more than 1000 data points are required for appropriate training of the ANN. Prediction accuracy can be improved through continuous monitoring and data acquisition and application of that data in this ANN model. Though the prediction accuracy was low, this is could be used as referential approach in odor generation sites.
4. Conclusions
In this study, odor emitted from a WWTP was predicted from water quality data using an ANN model. The prediction accuracy was 70% when all the variables were included, and it was improved to 74% by excluding data pertaining to DO. However, external environmental conditions weaken the prediction accuracy, and this issue will be addressed in a future study. Furthermore, the treatment facility is likely to operate more efficiently based on instantaneous odor concentration measurements.
Author Contributions
Data curation and writing-original draft preparation, J.-H.K.; data curation J.S.; visualization, S.S.Y. and B.-J.L.; writing-review and editing H.W.J. All authors have read and agreed to the published version of the manuscript.
Funding
This subject is supported by Korea Ministry of Environment (MOE: 2017-0007-00001) as “Public Technology Program based on Environmental Policy”.
Acknowledgments
We acknowledge the anonymous reviewers for their valuable comments.
Conflicts of Interest
The authors declare no conflict of interest.
References
- Kim, H.; Lee, H.; Choi, E.; Choi, I.; Shin, T.; Im, H.; Ahn, S. Characterization of odor emission from alternating aerobic and anoxic activated sludge systems using real-time total reduced sulfur analyzer. Chemosphere 2014, 117, 394–401. [Google Scholar] [CrossRef] [PubMed]
- Lewkowska, P.; Cieślik, B.; Dymerski, T.; Konieczka, P.; Namieśnik, J. Characteristics of odors emitted from municipal wastewater treatment plant and methods for their identification and deodorization techniques. Environ. Res. 2016, 151, 573–586. [Google Scholar] [CrossRef] [PubMed]
- Blanco-Rodríguez, A.; Camara, V.F.; Campo, F.; Becherán, L.; Durán, A.; Vieira, V.D.; Garcia-Ramirez, A.R. Development of an electronic nose to characterize odours emitted from different stages in a wastewater treatment plant. Water Res. 2018, 134, 92–100. [Google Scholar] [PubMed]
- Park, S.; Kim, M.; Kim, M.; Namgung, H.G.; Kim, K.T.; Cho, K.H.; Kwon, S.B. Predicting PM10 concentration in Seoul metropolitan subway stations using artificial neural network (ANN). J. Hazard. Mater. 2018, 341, 75–82. [Google Scholar] [CrossRef] [PubMed]
- Pelosi, P.; Zhu, J.; Knoll, W. From gas sensors to biomimetic artificial noses. Chemosensors 2018, 6, 32. [Google Scholar] [CrossRef] [Green Version]
- Nozaki, Y.; Nakamoto, T. Odor impression prediction from mass spectra. PLoS ONE 2016, 11, e0157030. [Google Scholar] [CrossRef] [PubMed]
- Shang, L.; Liu, C.; Tomiura, Y.; Hayashi, K. Machine-learning-based olfactometer: Prediction of odor perception from physicochemical features of odorant molecules. Anal. Chem. 2017, 89, 11999–12005. [Google Scholar] [CrossRef] [PubMed]
- Zarra, T.; Galang, G.; Ballesteros, F., Jr.; Belgiorno, V.; Naddeo, V. Environmental odour management by artificial neural network—A review. Environ. Int. 2019, 133, 105189. [Google Scholar] [CrossRef] [PubMed]
- Byliński, H.; Sobecki, A.; Gębicki, J. The use of artificial neural networks and decision trees to predict the degree of odor nuisance of post-digestion sludge in the sewage treatment plant process. Sustainability 2019, 11, 4407. [Google Scholar] [CrossRef] [Green Version]
- Mirshahi, M.; Partovi Nia, V.; Adjengue, L. Automatic odor prediction for electronic nose. J. Appl. Stat. 2018, 45, 2788–2799. [Google Scholar] [CrossRef]
- Onkal-Engin, G.; Demir, I.; Engin, S.N. Determination of the relationship between sewage odour and BOD by neural networks. Environ. Model. Softw. 2005, 20, 843–850. [Google Scholar] [CrossRef]
- CEN, E. Air Quality-Determination of Odor Concentration by Dynamic Olfactometry; European Committee for Standardization: Brussels, Belgium, 2003. [Google Scholar]
- Nagata, Y.; Takeuchi, N. Measurement of odor threshold by triangle odor bag method. Odor Meas. Rev. Chem. 2003, 118, 118–127. [Google Scholar]
- Dou, M.; Qin, C.; Li, G.; Wang, C. Research on calculation method of free flow discharge based on artificial neural network and regression analysis. Flow Meas. Instrum. 2020, 72, 101707. [Google Scholar] [CrossRef]
- Janes, K.R.; Yang, S.X.; Hacker, R.R. Pork farm odour modelling using multiple-component multiple-factor analysis and neural networks. Appl. Soft Comput. 2005, 6, 53–61. [Google Scholar] [CrossRef]
- Qdais, H.A.; Hani, K.B.; Shatnawi, N. Modeling and optimization of biogas production from a waste digester using artificial neural network and genetic algorithm. Resour. Conserv. Recycl. 2010, 54, 359–363. [Google Scholar] [CrossRef]
- Rincón, C.A.; De Guardia, A.; Couvert, A.; Wolbert, D.; Le Roux, S.; Soutrel, I.; Nunes, G. Odor concentration (OC) prediction based on odor activity values (OAVs) during composting of solid wastes and digestates. Atmos. Environ. 2019, 201, 1–12. [Google Scholar] [CrossRef]
Figure 1.
Procedure of machine learning.

Figure 2.
Comparison between odor concentrations and input variables of (a) BOD, (b) TSS, (c) water temperature, and (d) ORP.
Figure 2.
Comparison between odor concentrations and input variables of (a) BOD, (b) TSS, (c) water temperature, and (d) ORP.

Figure 3.
Correlation between measured and predicted odor using all water quality data.

Figure 4.
Correlation between the measured and predicted odor concentrations using five water quality parameters (excluding DO and ORP).
Figure 4.
Correlation between the measured and predicted odor concentrations using five water quality parameters (excluding DO and ORP).


Table 1.
The concentration range of odor at the identified process locations of the WWTP.
| Odor (Unit) | Threshold a (ppm, v/v) | Grit Chamber (MW) | 1st Sediment Tank (MW) | Aerobic Biotreatment | Anaerobic Biotreatment | Grit Chamber (IW) | 1st Sediment Tank (IW) |
|---|---|---|---|---|---|---|---|
| Olfactometry (OU/m3) | – | 2080–3000 | 2080–3000 | 669–1000 | 100–300 | 3000–30,000 | 10,000–30,000 |
| Hydrogen Sulfide (μmole/mole) | 0.00041 | 14.835–29.070 | 2.202–11.200 | ND b | ND | 1.142–253.75 | 109.000–138.250 |
| Methyl Mercaptan (μmole/mole) | 0.000070 | 0.141–0.337 | 0.211–0.294 | 0.111–0.205 | 0.003–0.004 | 0.259–2.353 | 0.000–1.116 |
| Dimethyl Sulfide (μmole/mole) | 0.0030 | ND | 0.000–0.074 | 0.059–0.061 | 0.003–0.005 | 0.047–0.328 | ND |
| Acetaldehyde (μmole/mole) | 0.0015 | ND | 0.130-0.335 | ND | ND | ND | 0.066–0.102 |
| Butylaldehyde (μmole/mole) | 0.00067 | ND | 0.025-0.693 | ND | ND | ND | 0.008–0.013 |
a Nagata [13]; b ND: below detection limit.
Table 2.
Importance of ranking of input variables based on their prediction accuracy.
| Ranking | Content | R2 |
|---|---|---|
| 1 | Water Temperature | 0.6633 |
| 2 | BOD | 0.7027 |
| 3 | TSS | 0.7064 |
| 4 | VSS | 0.7133 |
| 5 | pH | 0.7174 |
| 6 | ORP | 0.7336 |
| 7 | DO | 0.7432 |
© 2020 by the authors. Licensee MDPI, Basel, Switzerland. This article is an open access article distributed under the terms and conditions of the Creative Commons Attribution (CC BY) license (http://creativecommons.org/licenses/by/4.0/).
Share and Cite
MDPI and ACS Style
Kang, J.-H.; Song, J.; Yoo, S.S.; Lee, B.-J.; Ji, H.W. Prediction of Odor Concentration Emitted from Wastewater Treatment Plant Using an Artificial Neural Network (ANN). Atmosphere 2020, 11, 784. https://doi.org/10.3390/atmos11080784
AMA Style
Kang J-H, Song J, Yoo SS, Lee B-J, Ji HW. Prediction of Odor Concentration Emitted from Wastewater Treatment Plant Using an Artificial Neural Network (ANN). Atmosphere. 2020; 11(8):784. https://doi.org/10.3390/atmos11080784
Chicago/Turabian StyleKang, Jeong-Hee, JiHyeon Song, Sung Soo Yoo, Bong-Jae Lee, and Hyon Wook Ji. 2020. "Prediction of Odor Concentration Emitted from Wastewater Treatment Plant Using an Artificial Neural Network (ANN)" Atmosphere 11, no. 8: 784. https://doi.org/10.3390/atmos11080784
Note that from the first issue of 2016, this journal uses article numbers instead of page numbers. See further details here.