Article

Evidence of Hydrocarbon-Rich Fluid Interaction with Clays: Clay Mineralogy and Boron Isotope Data from Gulf of Cádiz Mud Volcano Sediments

by
Rubén Martos-Villa
1,
M. Pilar Mata
2,*,
Lynda B. Williams
3,
Fernando Nieto
4,5,
Xabier Arroyo Rey
6 and
C. Ignacio Sainz-Díaz
4
1
Facultad de Ciencias del Mar y Ambientales, Universidad de Cádiz, Av. República Saharaui s/n, 11510 Puerto Real, Spain
2
Instituto Geológico y Minero de España, Rios Rosas, 23, 28003 Madrid, Spain
3
School of Earth & Space Exploration, Arizona State University, Tempe, AZ 85287-1404, USA
4
Instituto Andaluz de Ciencias de la Tierra, CSIC-Universidad de Granada, Av. De las Palmeras, 4, 18100 Granada, Spain
5
Universidad de Granada-CSIC, Av. Fuentenueva s/n, 18002 Granada, Spain
6
Centro de Asistencia a la Investigación de Técnicas Geológicas, Universidad Complutense de Madrid, Jose Antonio Novais 2, 28040 Madrid, Spain
*
Author to whom correspondence should be addressed.
Minerals 2020, 10(8), 651; https://doi.org/10.3390/min10080651
Submission received: 25 May 2020 / Revised: 14 July 2020 / Accepted: 17 July 2020 / Published: 23 July 2020
(This article belongs to the Special Issue From Diagenesis to Low-Grade Metamorphism)

Abstract

:
Clay dehydration at great depth generates fluids and overpressures in organic-rich sediments that can release isotopically light boron from mature organic matter, producing 10B-rich fluids. The B can be incorporated into the tetrahedral sites of authigenic illite during the illitization of smectite. Therefore, the crystal-chemical and geochemical characterization of illite, smectite or interlayered illite–smectite clay minerals can be an indicator of depth (temperature) and reactions with the basin fluids. The aim of this study was to determine the detailed clay mineralogy, B-content and isotopic composition in illite–smectite rich samples of mud volcanoes from the Gulf of Cádiz, in order to evaluate interactions of hydrocarbon-rich fluids with clays. Molecular modeling of the illite structure was performed, using electron density functional theory (DFT) methods to examine the phenomenon of B incorporation into illite at the atomic level. We found that it is energetically preferable for B to reside in the tetrahedral sites replacing Si atoms than in the interlayer of expandable clays. The B abundances in this study are high and consistent with previous results of B data on interstitial fluids, suggesting that hydrocarbon-related fluids approaching temperatures of methane generation (150 °C) are the likely source of B-rich illite in the studied samples.

1. Introduction

Mud volcanoes (MVs) are generated by extrusion activity involving the transport of clay-rich sediments, liquids and gases (mainly methane) from deeper regions to the surface [1,2,3,4,5,6,7,8]. In recent years, both the source of material and fluids have been the focus of research as they give us important information about the presence of hydrocarbon resources at depth or global methane fluxes to the atmosphere [9,10,11,12]. Extensive work has been done in the study of fluid sources and pathways in sedimentary basins, where a close relation exists between fluids and the nature of clays, as a result of clay dehydration at depth resulting in smectite illitization processes [13]. The illitization process generates fluids and overpressures at temperature ranges of ~80 to ~150 °C [14,15,16] and smectite is transformed to randomly interstratified (R0) illite–smectite minerals (I-S) and to more illitic ordered (R1–R3) I-S [14,15,16,17,18,19].
Boron is abundant in marine sediments [20] and sedimentary clay minerals illite/smectite (I-S) [21,22], which contain orders of magnitude more boron than other common diagenetic minerals (e.g., quartz, carbonates and feldspars). Boron is a highly mobile element, preferring aqueous phases to that of most minerals [23]. Thus, by understanding how the aqueous B is incorporated into clay minerals, important insights may be gained to the fluid and chemical dynamics of a sedimentary basin. To use this geochemical tool, one must be able to interpret the boron isotopic composition of paleofluids that were present in a basin at the time of clay mineral diagenesis. Boron is incorporated into the clay mineral structure in tetrahedral sites and can also be adsorbed to clay surfaces, including those in the clay interlayers [24,25]. B adsorption on clays causes a preferential 10B uptake in tetrahedral sites of the clay related to bond strength. There is a coordination change of B from trigonal in water (at pH < 7) to tetrahedral on the clay surfaces [26,27]. This fractionation of B isotopes between trigonal and tetrahedral coordination during fluid–rock interactions is temperature dependent and insensitive to mineral composition [24,28].
Several recent studies have highlighted the potential utility of B-isotope ratios as a tracer for fluid–rock interactions [25,26,29,30]. The adsorption of B on clay surfaces has been extensively studied [27,31,32], because it can be easily exchanged [26]. However, fixed-B is more useful for interpreting paleofluid B composition because the B-isotopic composition is fixed when B substitutes for Si as Si–O bonds are broken.
Thermal maturation of organic matter during the burial process produces oil, wet gas and dry gas (mainly methane). Numerous studies of light stable isotopes in clays (e.g., [32,33,34,35,36]) have shown that trace elements (N, B and Li) commonly found in I-S are associated with hydrocarbon-related fluids generated during the maturation of organic source rocks. In these studies, it was shown that the light isotope of each of these “heteroatoms” released from organic matter dominates the fluids, thus these trace elements are ideal tracers of organic inputs to pore fluids. Thus, organic matter can release considerable amounts of B, producing 10B-rich fluids [24]. Late-stage or deep diagenesis of clay minerals [37] coincides with the time/temperatures associated with organic maturation processes that lead to the expulsion and accumulation of hydrocarbons. Thus, 10B-rich fluids are a source of B that can be incorporated into the tetrahedral layers of illite during the process of illitization of smectite at depth. The authigenic illite preferentially incorporates 10B, thus the remaining fluids are relatively enriched in 11B [24]. Therefore, the crystal-chemical and geochemical characterization of illite, smectite or interlayered illite–smectite (I-S) clay minerals can be an indicator of temperature and reactions with the basin fluids.
Molecular modeling is a useful tool for determining many aspects of minerals at atomistic scale helping the interpretation of many experimental phenomena related with minerals, especially clay minerals [38,39,40], including with borate anions [41]. In this work, Density Functional Theory (DFT) methods were used to obtain information about the incorporation of B into the clay mineral structure, for understanding the experimental results.
In the Gulf of Cádiz, extensive work has been done on the study of fluid sources and pathways [42,43,44,45,46], including basin-scale reactive-transport models [47]. These studies conclude that clay mineral dehydration during reaction of smectite to illite, from Mesozoic to Tertiary shale and marl units has been the major influence on fluid compositions in many of the Mud volcanoes [42]. Some samples from deep, hotter regions are associated with B and Li-rich fluid compositions, which have been associated with production of methane from organic rich sediments [48,49]. The chemical analysis of clay minerals and the study of the diagenetic evolution of these units is therefore of high interest in order to better characterize the fluid circulation system present in fluid venting areas such as the Gulf of Cádiz.
In this work, a detailed mineralogical characterization of samples coming from several mud volcanoes and the content and isotopic values of B in clay minerals were analyzed to determine the diagenetic evolution of clay minerals and the possible depth (temperature), origin and interaction of clay minerals present in the mud breccia with the methane bearing fluids.

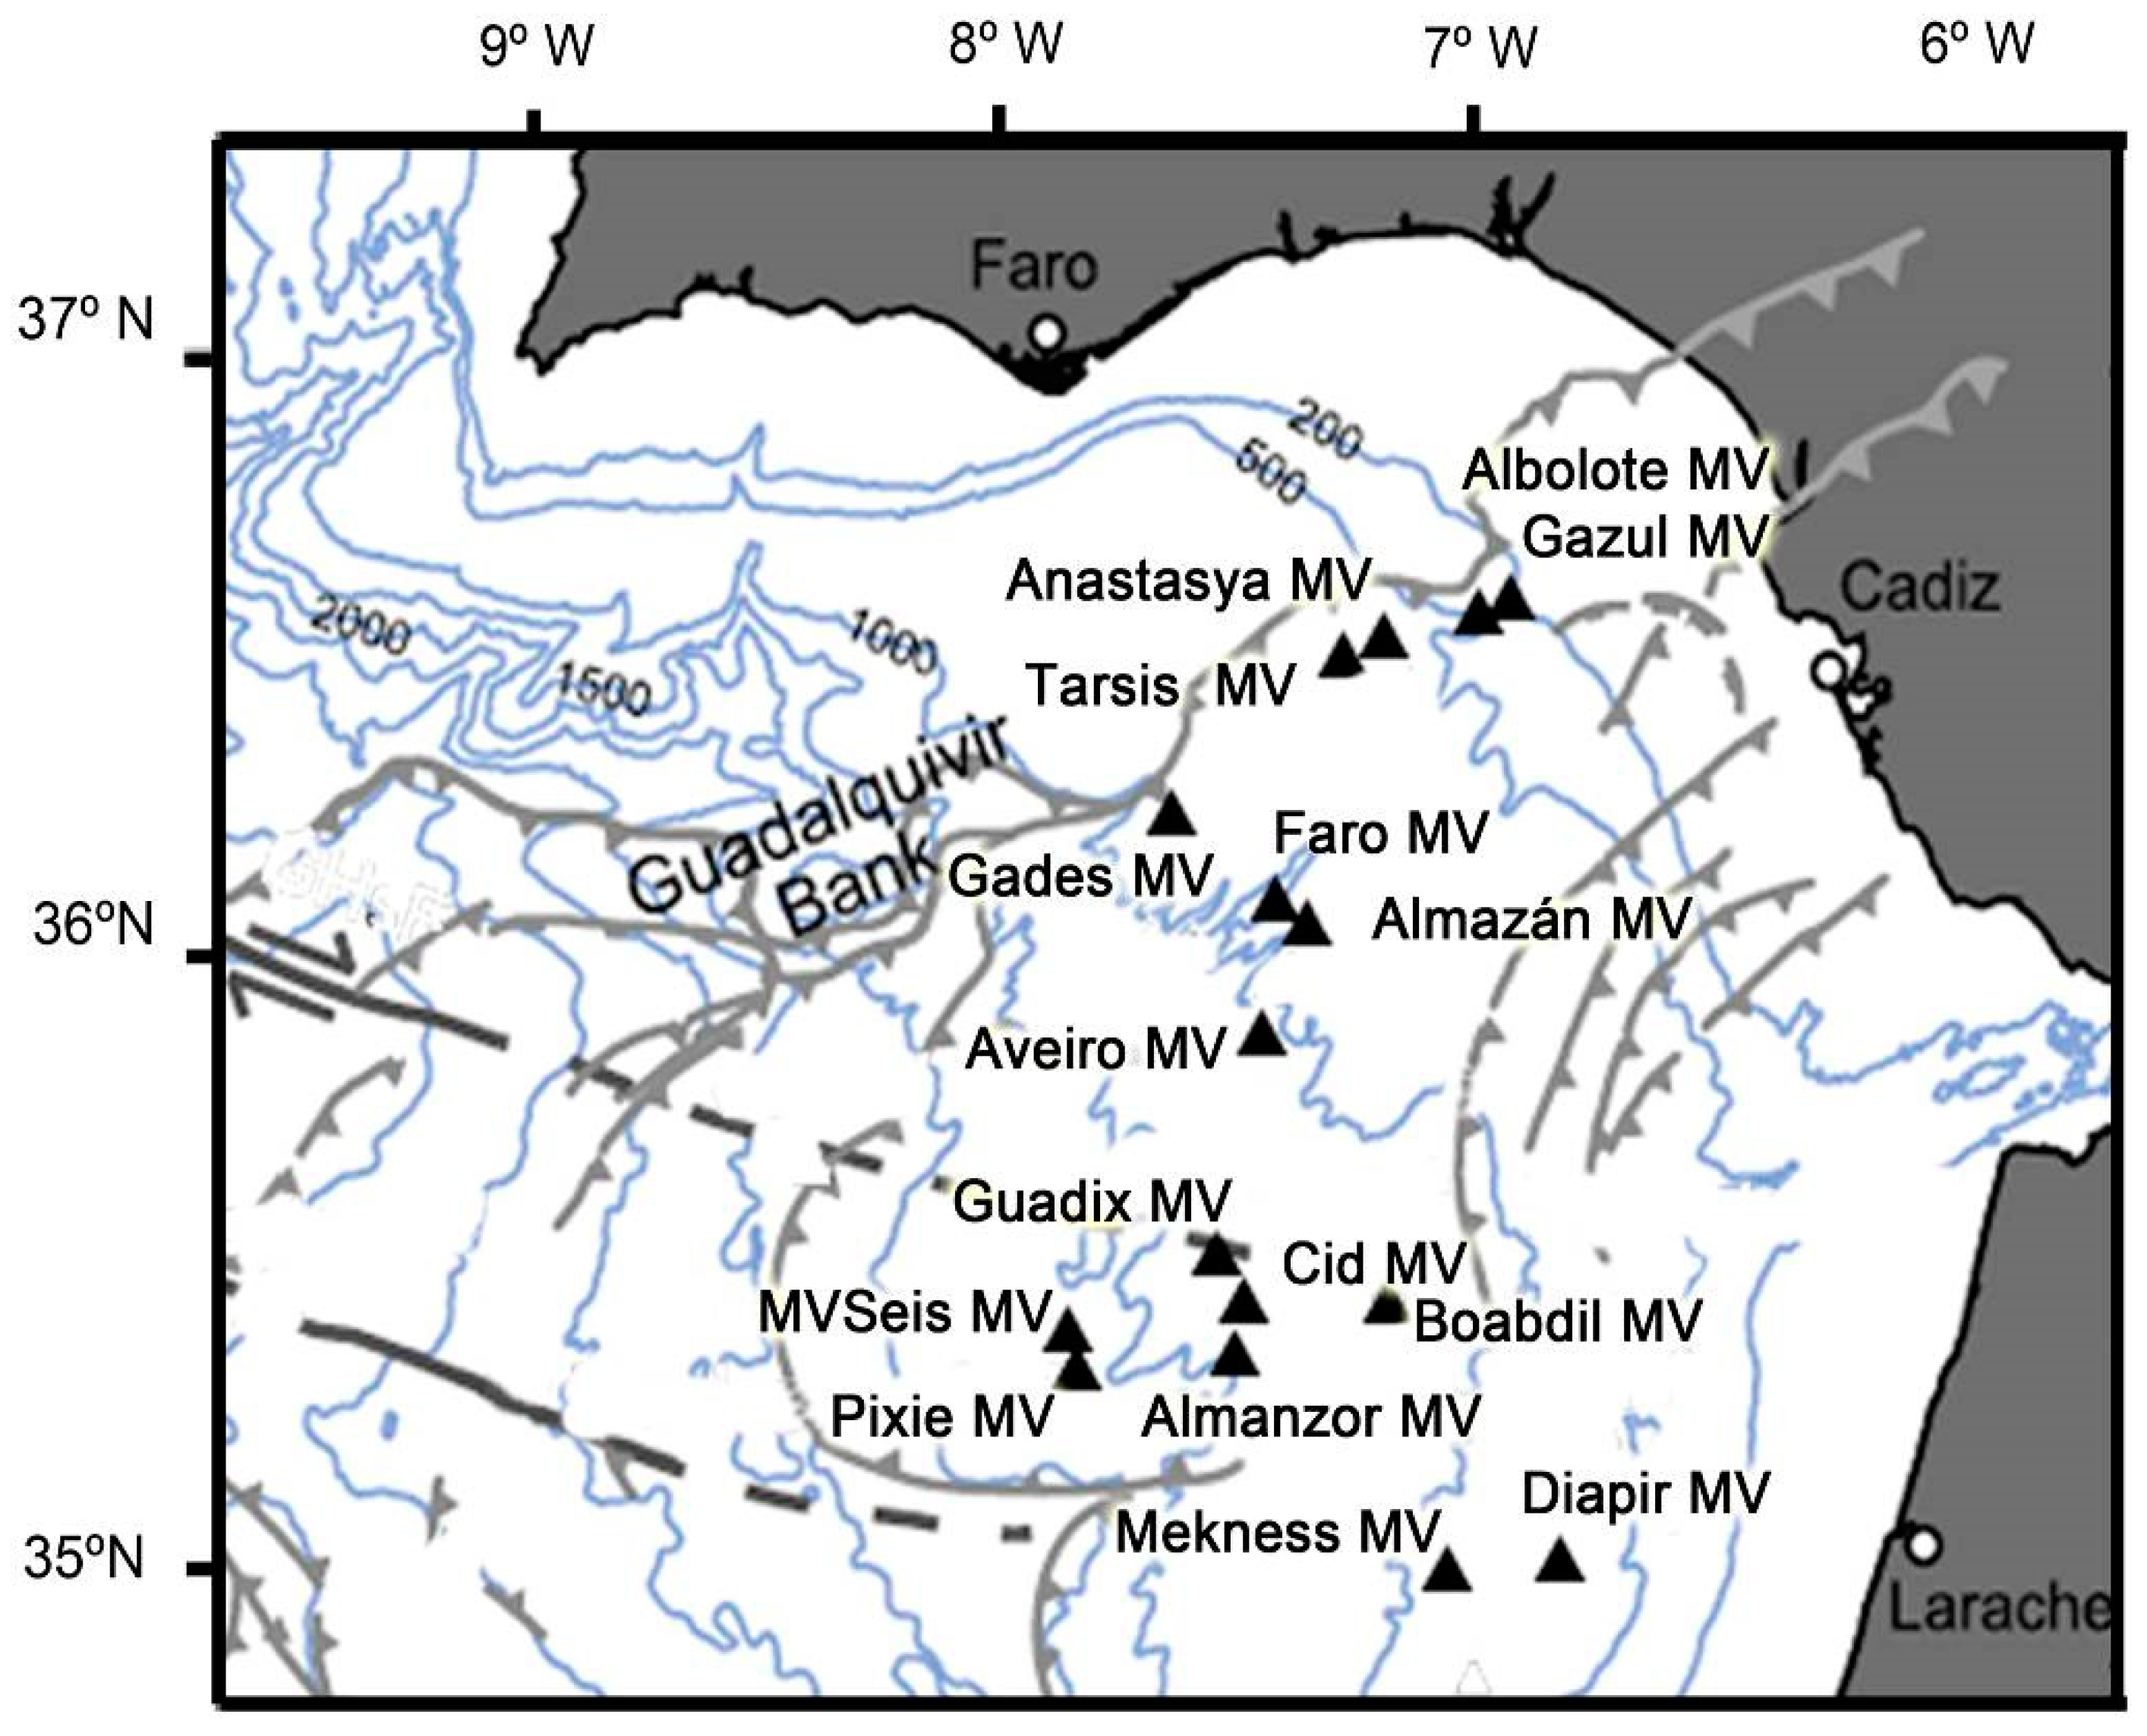
2. Geological Setting

The Gulf of Cádiz is located at the front of the Gibraltar arc, the westernmost tectonic belt of the Alpine Mediterranean compressional system, which has formed in response to the convergence between the African and Eurasian plates. It has a complex geological history and has undergone several episodes of rifting, compression and strike-slip motion since the Triassic [50]. During Tortonian times (11.2–7.1 Ma), allochthonous units took place in the Gulf of Cádiz formed by the westward migration of the Alborán domain associated with the formation of the Betic–Rifian Arc. This Guadalquivir allochthonous unit [51] consists of a mixture of Triassic, Cretaceous, Paleogene and Neogene sedimentary units overlying the Paleozoic basement [50], and is responsible for diapirism of huge volumes of mud and salt of Triassic units and under-compacted Early–Middle Miocene plastic marls [50,51] (Figure 1).
Throughout this area, several methane gas-related seafloor structures have been identified, including mud volcanoes, areas of carbonate crusts and chimneys, gas pipes and mud mounds [51,52,53,54,55,56,57,58,59]. Gravity cores were collected during the ANASTASYA/01, MVSeis/08 and CHICA/11 cruises on board of Cornide de Saavedra and Hespérides. Samples come from short gravity cores (up 2 m long) taken on the top of 16 mud volcanoes of the Gulf of Cádiz. Table 1 shows the location of the gravity cores of this study. Mud volcanoes are located in several zones in the Gulf of Cádiz (Figure 1) from 353 to 1639 m depth, more than 100 km apart from north to south. A detailed description of morphologies and processes can be found in [55,60]. Previous studies on the mineralogy of mud breccia [61] show that cores from the mud volcanoes are made of several units (hemipelagic and mud breccia) showing similar bulk mineralogical composition of quartz, clay minerals, scarce calcite and dolomite and pyrite, with slight differences in type of clay minerals between different mud volcanoes.

3. Experimental Methodology

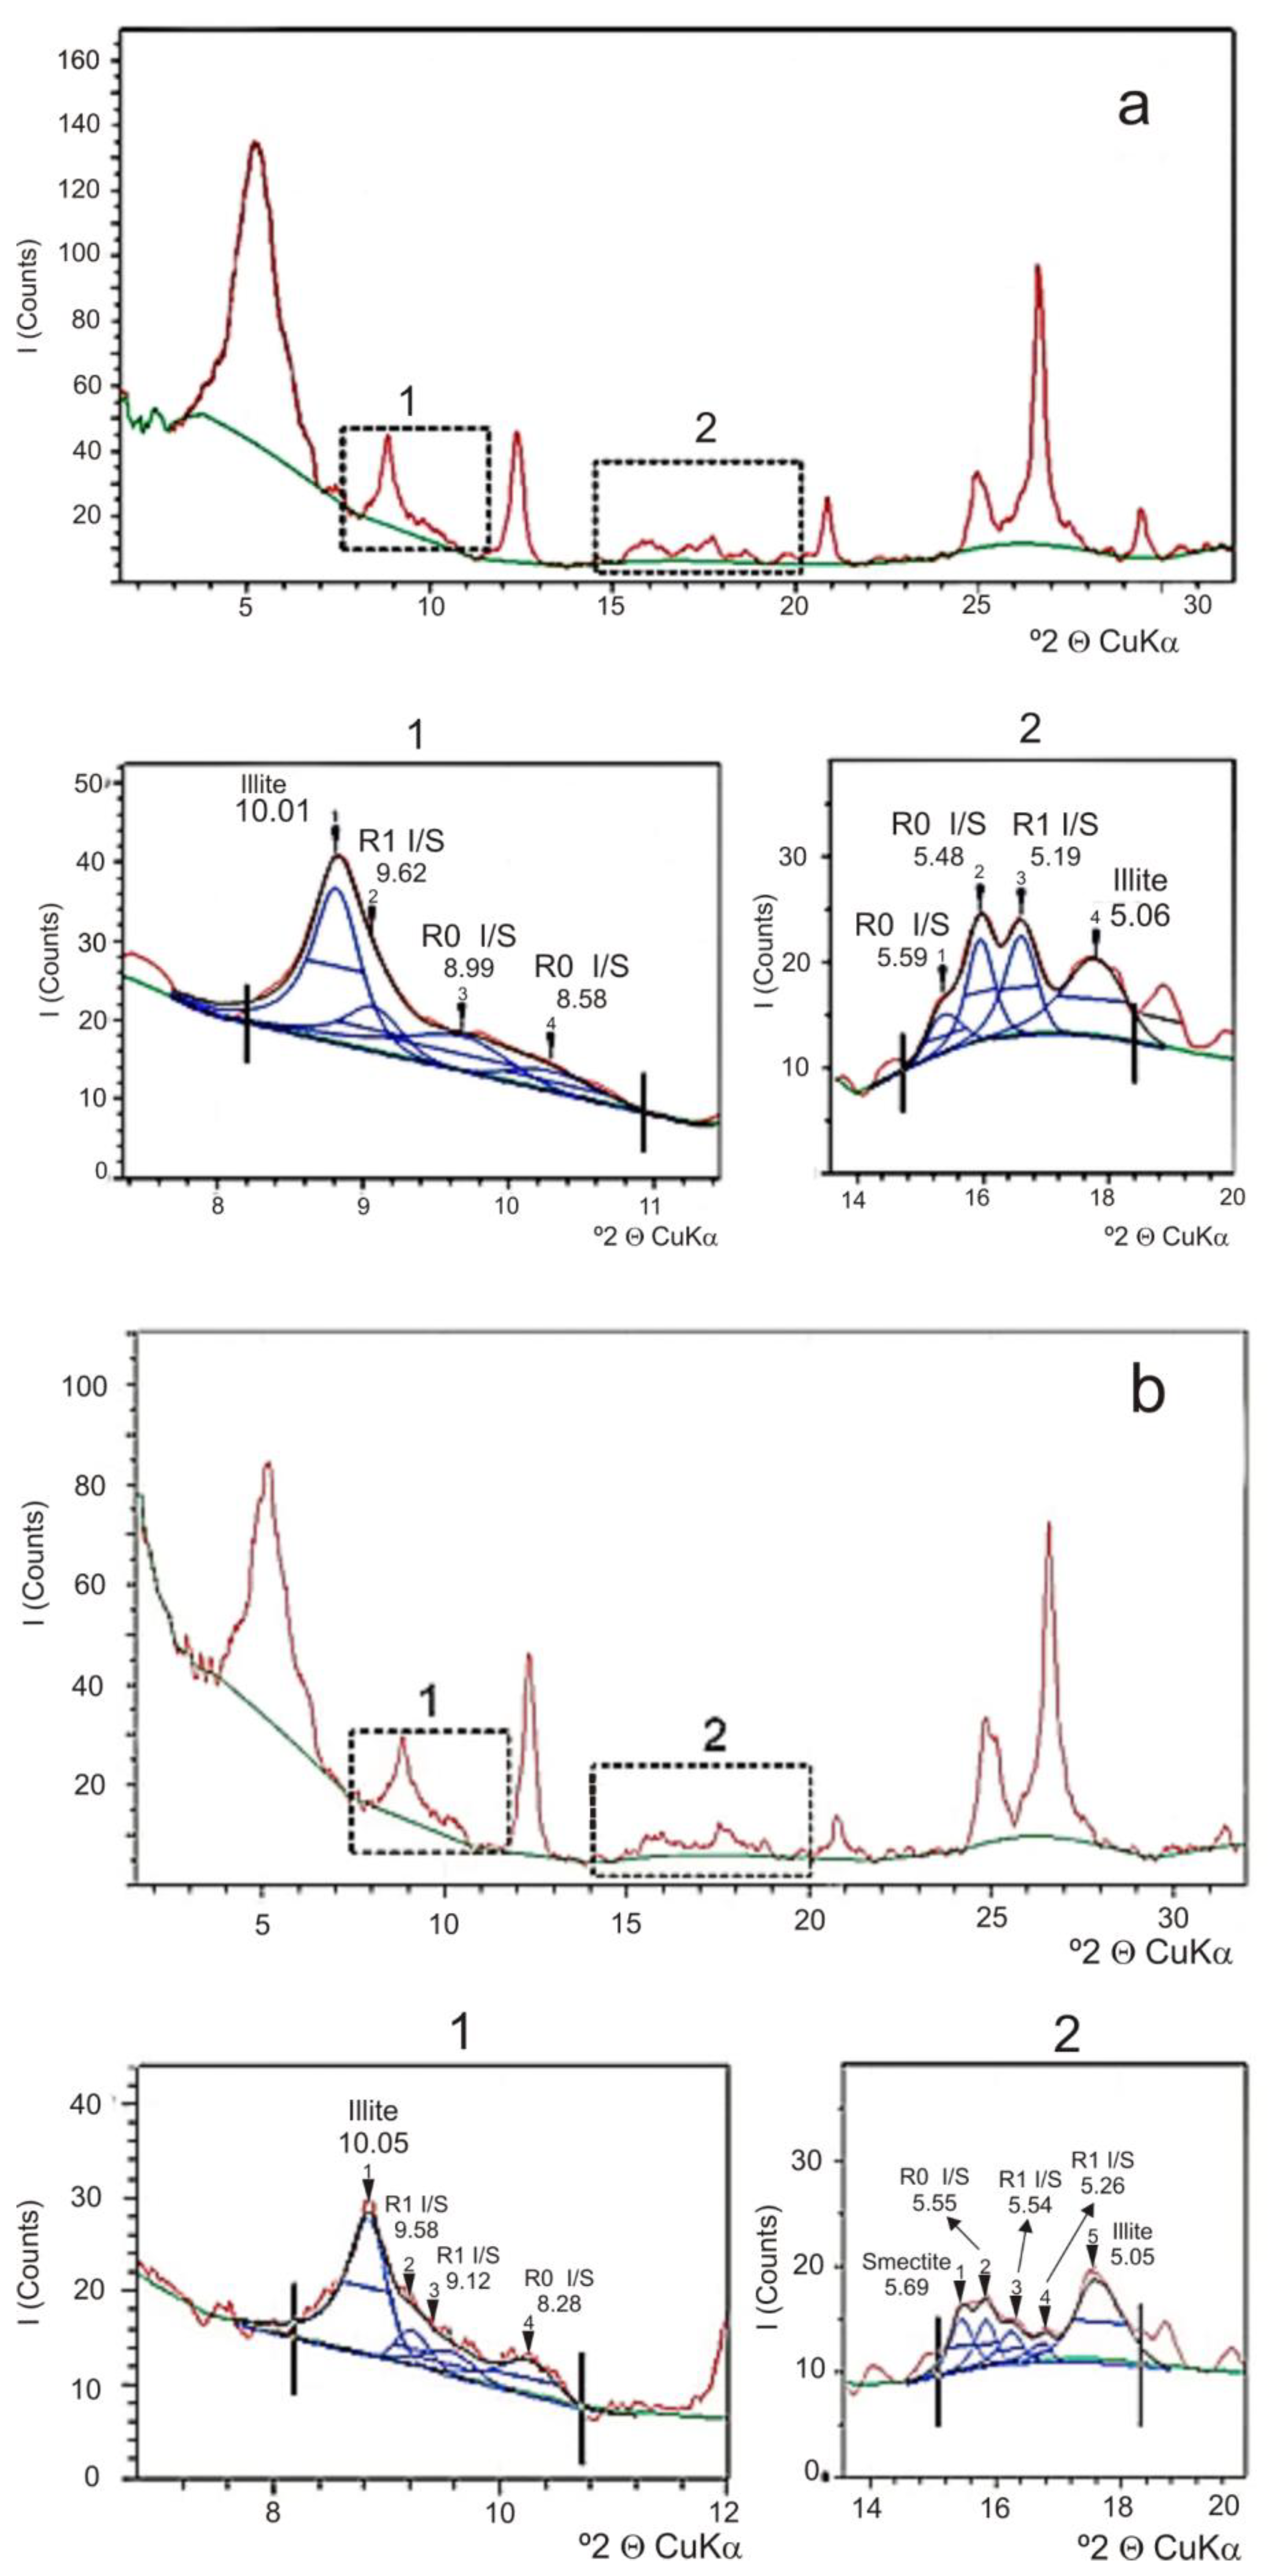
3.1. X-ray Diffraction and Deconvolution

X-ray diffraction (XRD) patterns of oriented samples with a size fraction of <2 µm were obtained using a Bruker D8 Advance diffractometer, located at The University of Cádiz (Cádiz, Spain), with a graphite monochromator, operating at 40 kV and 40 mA using Cu-Kα radiation. Each sample was first washed with distilled water until the supernatant was chloride-free, sonicated and then the <2-µm fraction was separated by centrifugation [62]. Each suspension was smeared on glass slides and air dried in atmospheric conditions. The slides were then saturated with ethylene glycol at 80 °C for 24 h to ensure maximum saturation. XRD patterns were acquired on the oriented clay mounts in both air dried and ethylene glycol saturated state to determine the percent of illite in I-S [63]. To discriminate between detrital smectite and I-S mixed-layer phases, deconvolution of the patterns obtained from the oriented mount after glycolation were performed using the MacDiff 4.2.6 program (4.2.6, Johann Wolfgang Goethe-Universität, Frankfurt, Germany). The determination of the illite percentage (% illite) and type of order (Reichweite; R) in I-S was performed according to the position of XRD peaks 001/002 and 002/003 in the regions 8–11° 2θ and 14–19° 2θ, respectively [64,65]

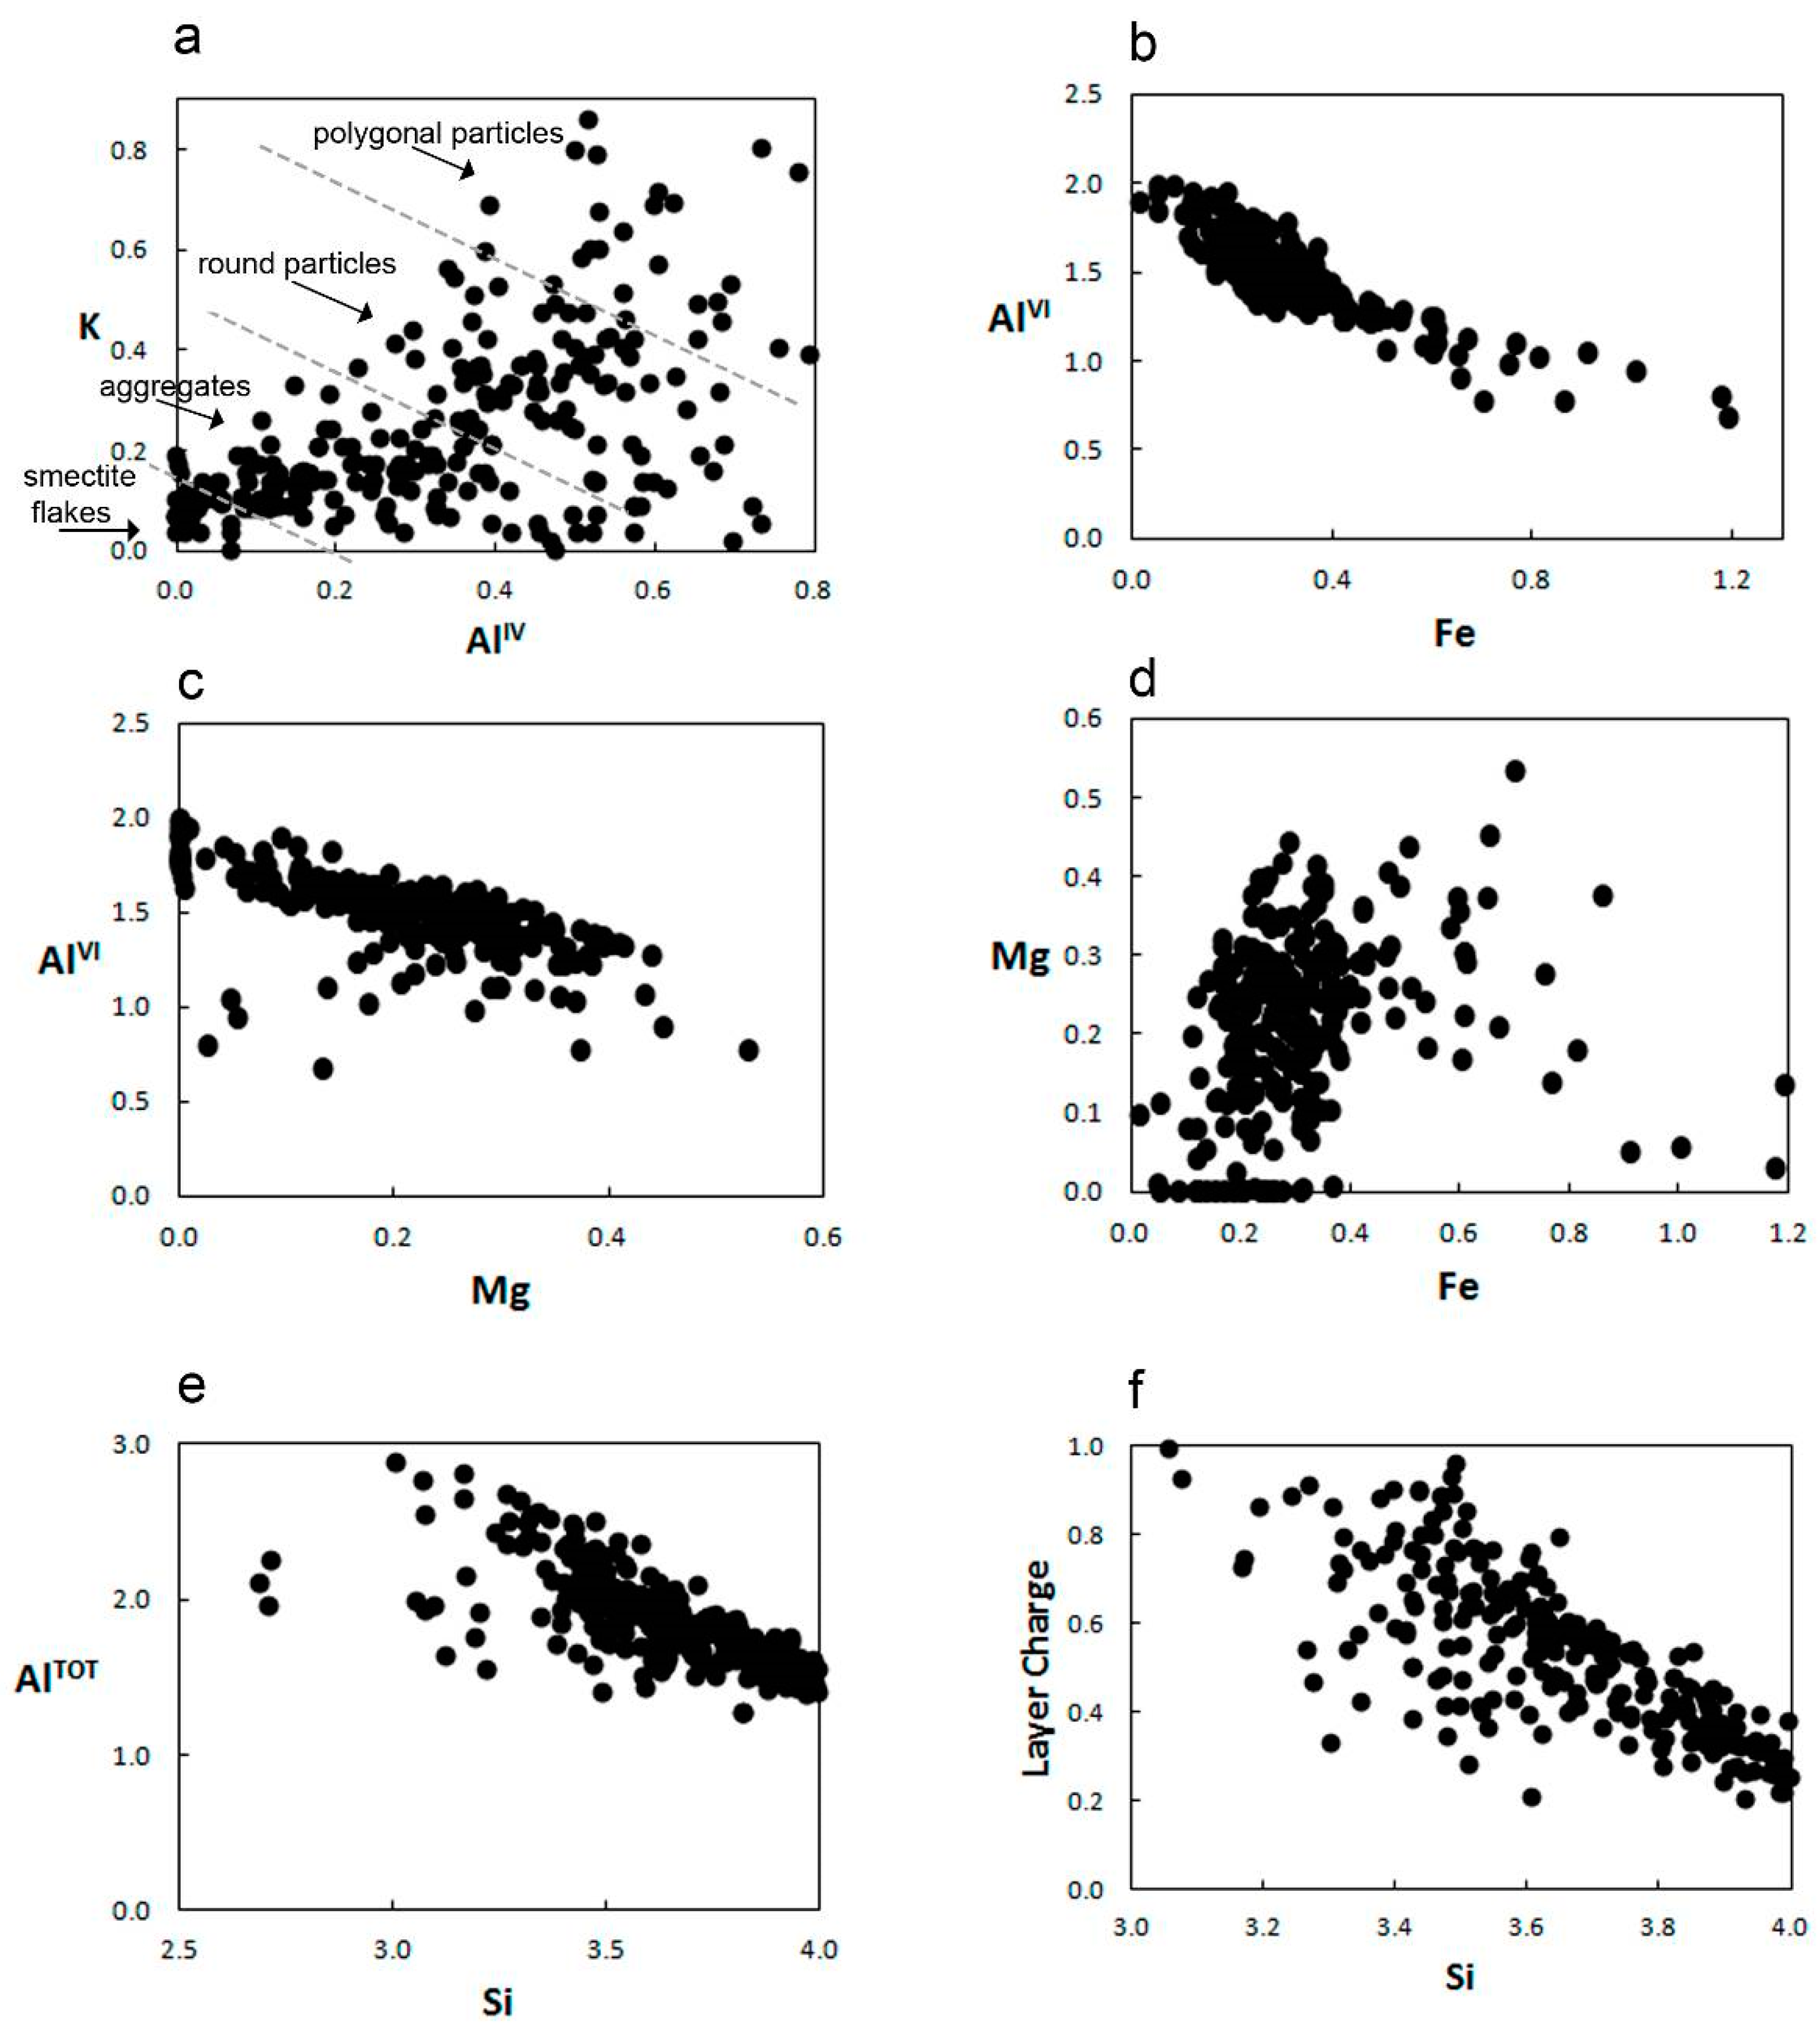
3.2. Transmission Electron Microscopy

Grain morphology within the bulk and <2-µm fractions and quantitative chemical analyses by analytical electron microscopy (AEM) were obtained using a Philips CM20 transmission electron microscope (TEM) at the University of Granada (Granada, Spain). Powdered portions deposited on a holey C-coated Au grid were used to collect AEM spectra in scanning transmission electron microscopy (STEM) mode on areas of 200 Å× 1000 Å using a 70-Å diameter spot size. To check volatilization of light elements, analyses were taken at 15 and 40 s. The structural formulae of smectites, micas and interstratified I-S were calculated on the basis of 22 negative charges, i.e., O10(OH)2, adjusting the occupation of the octahedral sheet to 2 atoms per formula unit.

3.3. Secondary Ion Mass Spectrometry

Secondary ion mass spectrometry (SIMS) (Arizona State University SIMS Facility, Tempe, AZ, USA) was used to characterize the content and isotopic composition of B in the clay minerals. Analytical protocols for measurement of B contents and δ11B values have been described elsewhere [49,66,67,68] and particularly for measurements of clay minerals by [24].

3.3.1. Sample Preparation

Boron is strongly adsorbed to the surfaces of clay minerals at room temperature, with a distribution coefficient >30 [68]. During burial, B can be found in two sites of clay minerals: exchangeable B in the interlayer and substituted B in the tetrahedral layer. Therefore, special preparations are required to separate exchangeable B from that held in the silicate framework before any isotope analysis of the structurally substituted B. First, the samples were treated with a 1N solution of mannitol a B-complexing polyhydric alcohol, which removes exterior surface B contamination [69], but not clay interlayer B. Samples were sonicated in an ultrasonic disaggregator, centrifuged at high speed to concentrate particles (or clusters of minerals), and then washed in triplicate in “B-free” deionized water filtered through Amberlite resin [33]. An aliquot of the mannitol-treated sample was mounted for isotope analysis of the total B (B tetrahedral + B interlayer) by drying a 5-mL suspension onto a one-inch (25-mm) diameter B-free glass slide. Several samples were placed on a single round B-free glass slide, including standards. Then, the measurement of total-B content was determined by SIMS using a calibration curve based on the counts of B (mass 11) relative to Si (mass 30). The calibration curve was measured on standard reference materials with known B-content [33].
The remaining clay was cation exchanged with 1 N NH4Cl by standard procedures [62] to remove exchangeable B from the interlayer [70]. Samples were rinsed again in mannitol and then mounted for isotope analysis as above. These samples only contain B substituted in tetrahedral sites.

3.3.2. Boron Content and Isotope Analysis

A Cameca IMS 6f at Arizona State University (Tempe, AZ, USA) was used with a primary beam of mass-filtered 16O ions accelerated at 12.5 kV onto the sample held at 9 kV for a total impact energy of ~21.5 kV. Primary beam currents below 10 nA were used with beam diameters defocused to 40–60 µm. Positive secondary ions were accelerated away from the sample, and energy filtering (−75 V sample offset) was used for measurements of B-content [66]. No energy filtering was used for isotope ratio measurements.
B isotope ratios are reported in delta notation as:
δ11B = [{(11B/10Bsample)/(11B/10Bstandard) − 1}*1000] − IMF
where the standard is NBS SRM 951, boric acid, with a 11B/10B ratio of 4.0437 [71]. The instrumental mass fractionation (IMF) is determined by measuring a mineral standard on which the δ11B is known. B-isotope analyses were calibrated by measuring clay mineral standard IMt-1 (Silver Hill Illite) from the Clay Minerals Repository (http://www.clays.org/sourceclays) that had been characterized by bulk thermal ionization mass spectrometry (TIMS) [24], with a δ11B of −9 ± 0.6‰. The isotope ratio analyses averaged 50–100 cycles of measurements on each spot (depending on the B-content) and analytical errors were compared to predicted errors. Where analytical errors were >2 times predicted errors, the analysis was discarded. Multiple spots were analyzed on each sample and results were averaged. The internal standard was measured in between analyses of the unknowns to test for changes in IMF due to instrumental drift.

3.4. Computational Methodology

We created models of Al(OH)3 and B(OH)3 molecules enveloped in a hydrogen-bonding network of water molecules which simulates B- and Al-rich fluids that are present in the illitization process (at low pH). Two different models of illite structures were also created: one of them with tetrahedral Al (Al-illite) and the other one with B incorporated to the tetrahedral layer by replacing the Al (B-illite). The comparison of energies of these optimized components can show us whether the incorporation of B in the tetrahedral sites is energetically favorable. Furthermore, montmorillonite models were created to compare optimization energies between montmorillonite with B as hydroxide (B(OH)4) in the interlayer and montmorillonite with B in the tetrahedral layer, replacing Si sites.
The electronic structure of Al(OH)3 and B(OH)3 molecules was studied by quantum chemical calculations with the Hartree–Fock approximation and the second-order Moeller–Plesset method for all electrons. A triple-ζ basis set with polarization functions was used for all atoms including H atoms (MP2/6-311G** level) as implemented in the Gaussian03 program package [72]. All geometries were fully optimized using the Berny analytical gradient method. No geometry constraint was applied to the molecules. Normal mode analyses were performed to the same level to confirm the nature of the various stationary points, finding only positive eigenvalues for minima.
Ab initio total energy calculations of the periodic illite crystal models and Al(OH)3 and B(OH)3 hydrated models were performed using density functional theory (DFT) methods implemented in the SIESTA program (version 3.0, Max Centre of Excellence, Modena, Italy) [73]. The generalized gradient approximation (GGA) was used with the Perdew–Burke–Ernzerhof (PBEsol) parameterization of the exchange-correlation function optimized for solids [74]. Core electrons were replaced by norm-conserving pseudopotentials [75]. Calculations were restricted to the Γ point in the irreducible wedge of the Brillouin zone. In all structures, the geometry of each atom was relaxed by means of conjugated gradient optimizations at constant experimental volume. In SIESTA, the basis sets are made of strictly localized numerical atomic orbitals (NAOs) with a localization cut-off radius corresponding to an energy shift of 270 meV. The basis sets used here are double-Z polarized (DZP) following the perturbative polarization scheme. This approach was successfully used in previous calculations on phyllosilicates [76] and hydrated systems [77,78,79]. A uniform mesh with appropriate plane-wave cut-off energy is used to represent the electron density, the local part of the pseudopotential, and the Hartree and exchange-correlation potentials. Total energy calculations were performed with cut-off energy values of 350 Ry. These conditions are consistent with previous studies with phyllosilicates [39,80].

Models

Based on previous works reporting quantum mechanical calculations [81,82], models of hydrated Al(OH)3 and B(OH)3 molecules were created, consisting of Al(OH)3 or B(OH)3 molecules optimized at MP2/6-311G** level, encaged in a cavity of a hydrogen-bonded network formed by 24 water molecules. Those models were also optimized using the DFT methodology implemented in the SIESTA program in the same conditions as the mineral structures.
Illite models were based on previous pyrophyllite models [38]. Pyrophyllite is a dioctahedral phyllosilicate [83] with a structure similar to illite, but without cation substitutions causing the layer charge on basal siloxane surfaces. The trans-vacant crystal form was used in all models [39]. To obtain a reasonable size illite model, a 4 × 2 × 1 supercell was generated. Two types of illite models were created, Al-illite and B-illite. The Al-illite model was generated from the supercell by replacing eight tetrahedrally coordinated Si4+ by Al3+, and four octahedral Al3+ were replaced by Mg2+. Layer charge is balanced by twelve K+ cations per supercell in the interlayer, resulting in a simulation cell composition of [K12][Al28Mg4][Si56Al8]O160(OH)32. The B-illite model was created similar to Al-illite model, but replacing one of tetrahedral Al3+ by B3+, resulting in a simulation cell composition of [K12] [Al28Mg4][Si56A7B1]O160(OH)32.
In both cases, maximum dispersion of the substituted cations in the tetrahedral and octahedral sheets was made according to previous studies [40,84]. Initial lattice parameters of each 4 × 2 × 1 illite supercell are a = 21.14 Å, b = 18.35 Å, c = 9.79 Å; α = 91°, β = 100°, γ = 90°.
Montmorillonite models were created with a unit cell of a = 5.16 Å, b = 8.97 Å, c = 13.61 Å; α = 91.2°, β = 100.5°, γ = 89.6°, leaving enough space in the interlayer for avoiding additional variables related with interlayer complexes. Supercells of 2 × 2 × 1 were generated by replacing one octahedral Al3+ by Mg2+. Layer charge is balanced with one K+ cation per supercell. Two montmorillonite models were created: One with the salt K+ B(OH)4- in the interlayer, resulting in a simulation cell composition of [B(OH)4-][K2][Al15Mg1][Si32]O80(OH)16, and the other with B replacing one tetrahedral Si atom and Si(OH)4 in the interlayer, resulting in a simulation cell composition of [Si(OH)4][K2] [Al15Mg1][Si31B1]O80(OH)16. In the illite and montmorillonite models the effect of the presence of water molecules can be considered similar in both cases with B and without B complex for the study on which is focused this work. Then, water molecules were not included to avoid additional computational effort and convergency problems found in our preliminary calculations.

4. Results

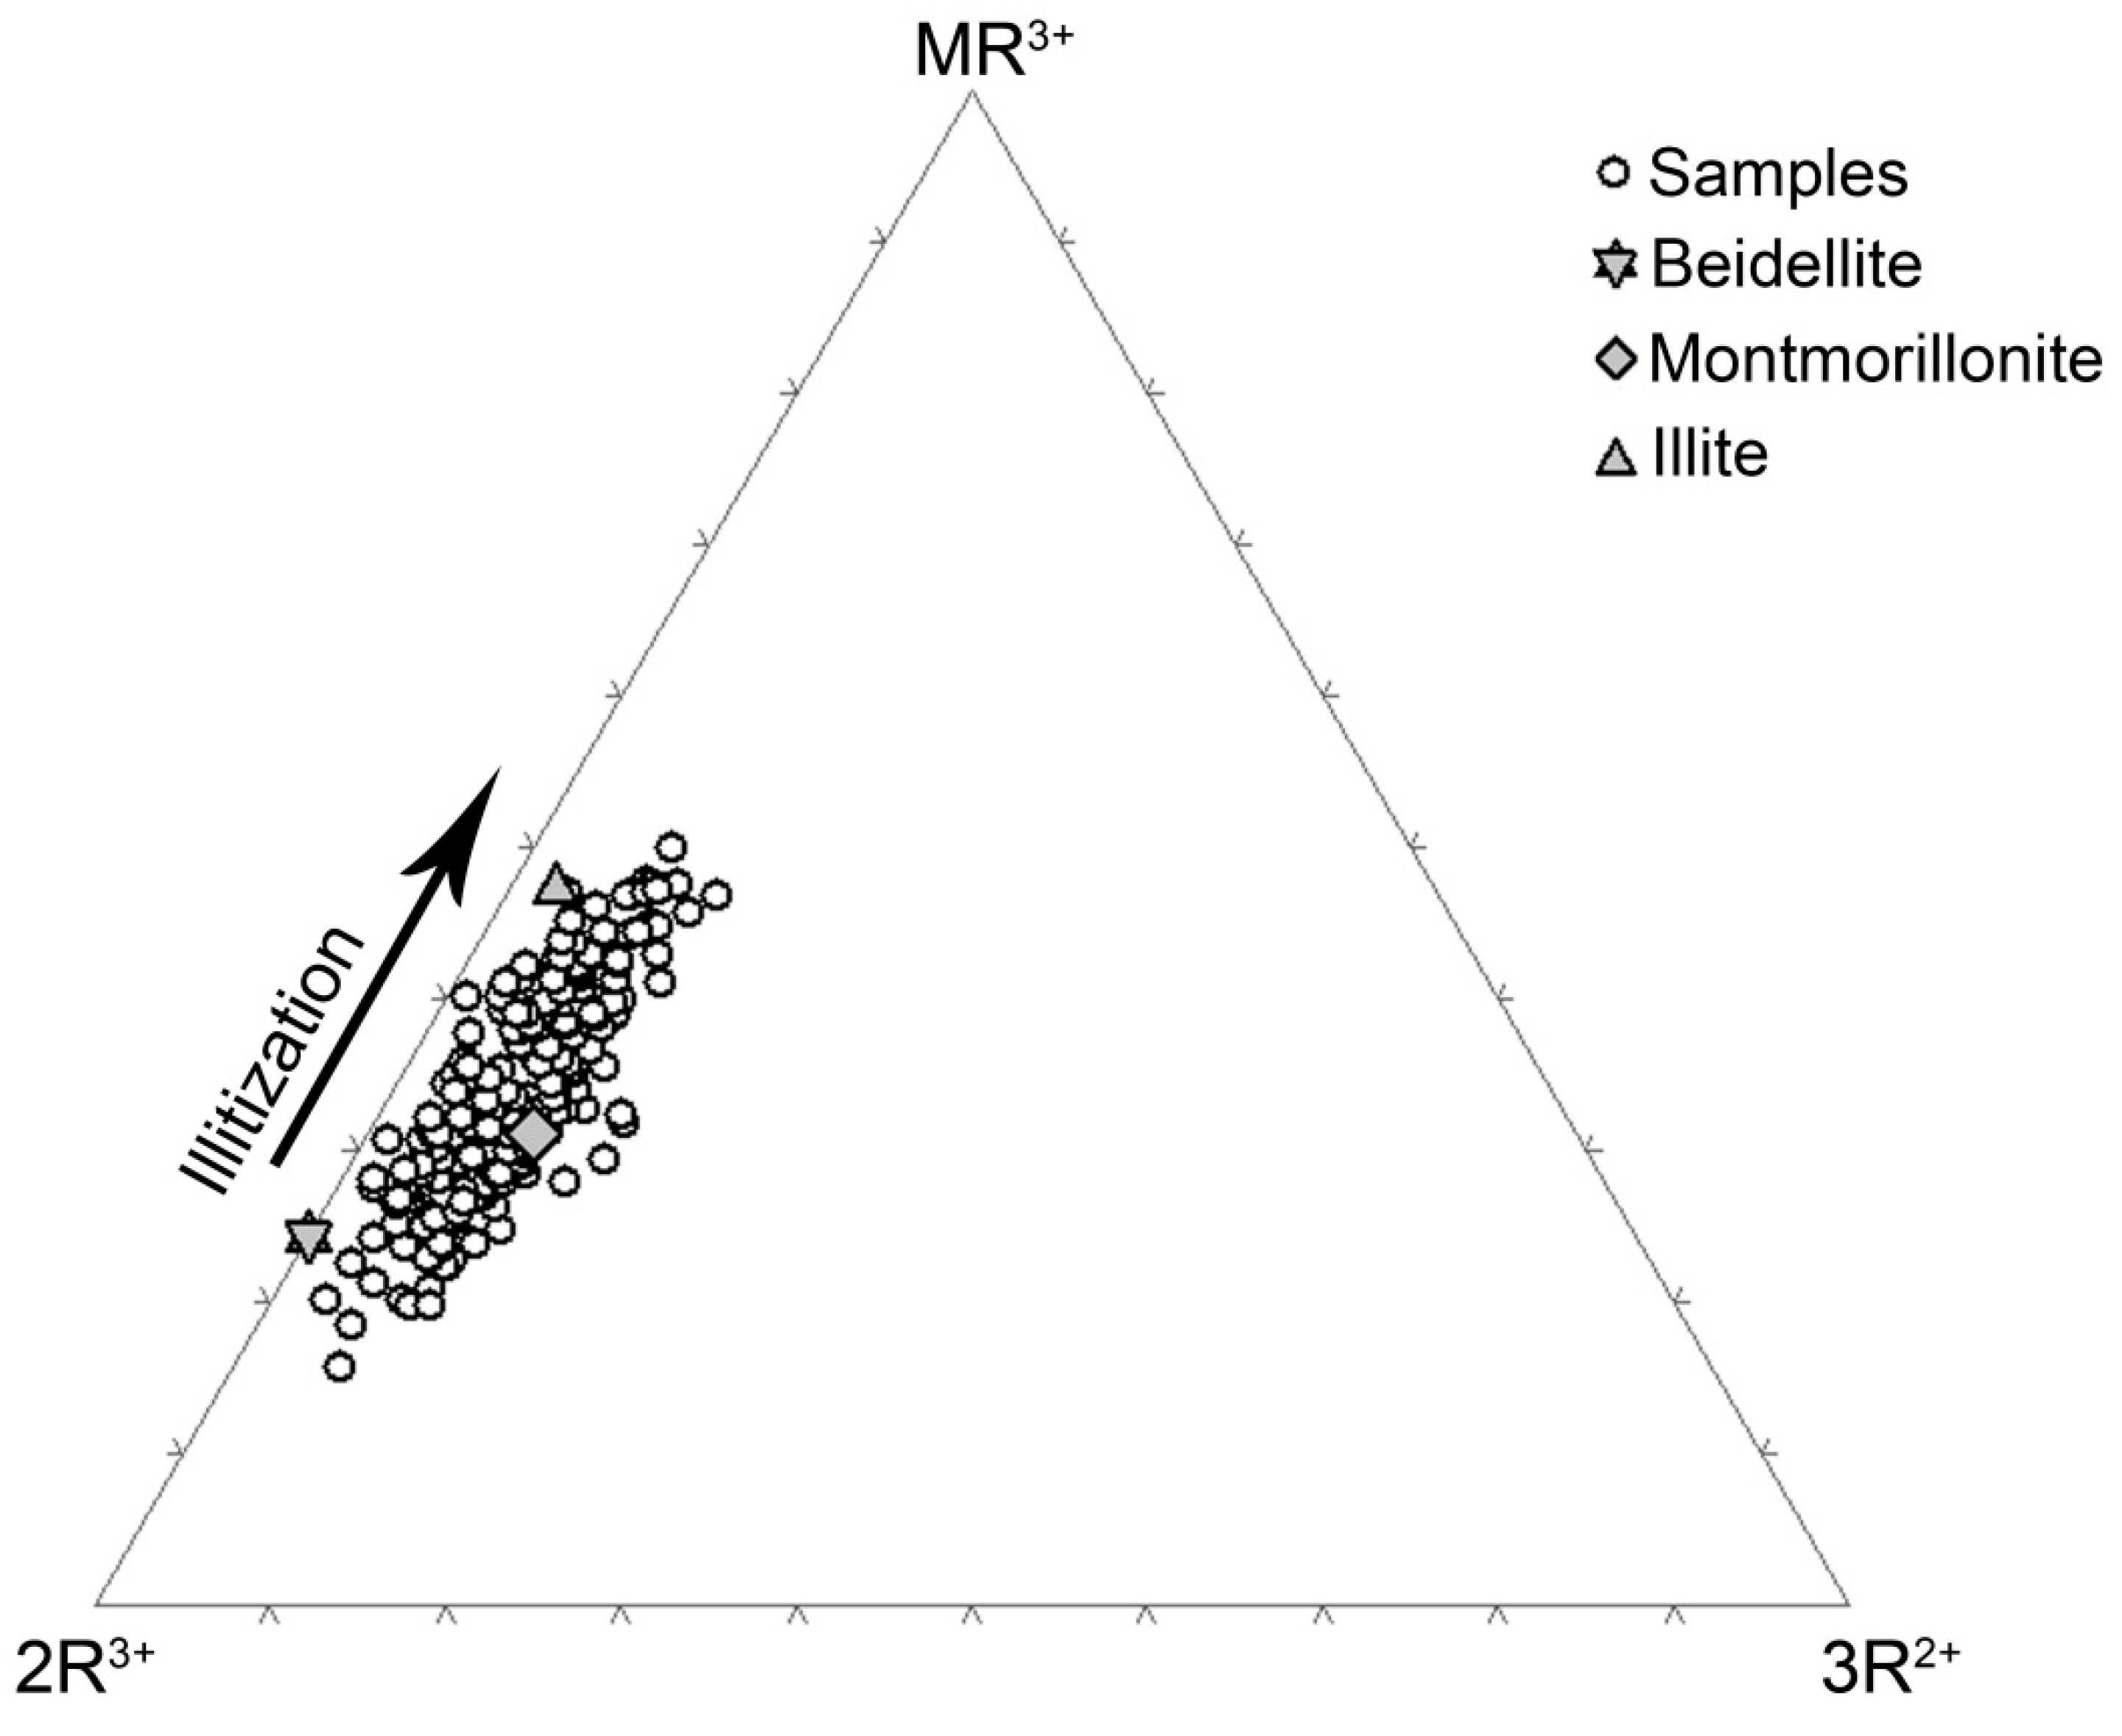
4.1. Clay Mineralogy

XRD and TEM analyses of samples were performed to characterize the clay minerals. Although preliminary XRD data indicated that samples were mainly smectite [61], the deconvolution (using MacDiff 4.2.6) of the pattern obtained from the oriented mount after glycolation in the regions 8–11° 2θ and 14–19° 2θ showed that detrital micas and mixed-layer I-S phases are present in addition to smectite (Figure 2). I-S from all samples have similar characteristics, presenting Reichweite (R) values corresponding to both the R0 (random ordering) and R1 (nearest neighbor) ordering stages (Table 2).
The deconvolution of the peaks corresponding to 001/002 and 002/003 reflections into small peaks allows estimating the proportion of illite in each I/S, because each d value corresponds to R-ordering type.
A detailed TEM study combining chemistry and the imagery of individual clay–mineral particles on the holey carbon grid showed the expected morphological differences between the smectite and I-S: smectite displayed typical aggregates and flakes of irregular and wavy outlines and I-S showed individual crystals with more euhedral shapes and clear outlines (Figure 3). These morphologies are consistent with previous TEM observations on smectite illitization [85]. Kaolin hexagonal particles and palygorskite fibers were also present in the samples in minor amounts (Figure 3).
Figure 4 shows compositional variation of individual clay crystals determined by analytical electron microscopy (AEM). Figure 4a is a plot of tetrahedral Al content vs. interlayer K, showing trends that relate to particle morphology as defined by [85]. Chemical ranges correlate with TEM observations, where smectite flakes, aggregates, round and polygonal particles are characterized. The substitution of Al by Fe in the octahedral sites provides a well-defined negative relationship between these two elements (Figure 4b).
A similar negative relationship is also observed between Al and Mg (Figure 4c). No significant trends were found between Si and Fe or Si and Mg (not shown). However, there is a poorly defined positive relationship between Fe and Mg (Figure 4d). There is a negative relationship between Al TOT and Si (Figure 4e), indicating the generation of tetrahedral charge. Figure 4f shows the relationship between layer charge and Si content, where mainly beidellitic samples have more than half of the layer charge produced by tetrahedral substitutions. However, montmorillonite samples can be also represented by larger amounts of Si.
The plot of data in MR3–2R3–3R2 diagram [86] (Figure 5) clearly shows different chemical ranges in the samples analyzed, from montmorillonite and beidellite to illite compositions. The presence of I-S phases is represented by multiple points with compositions between smectite and illite.

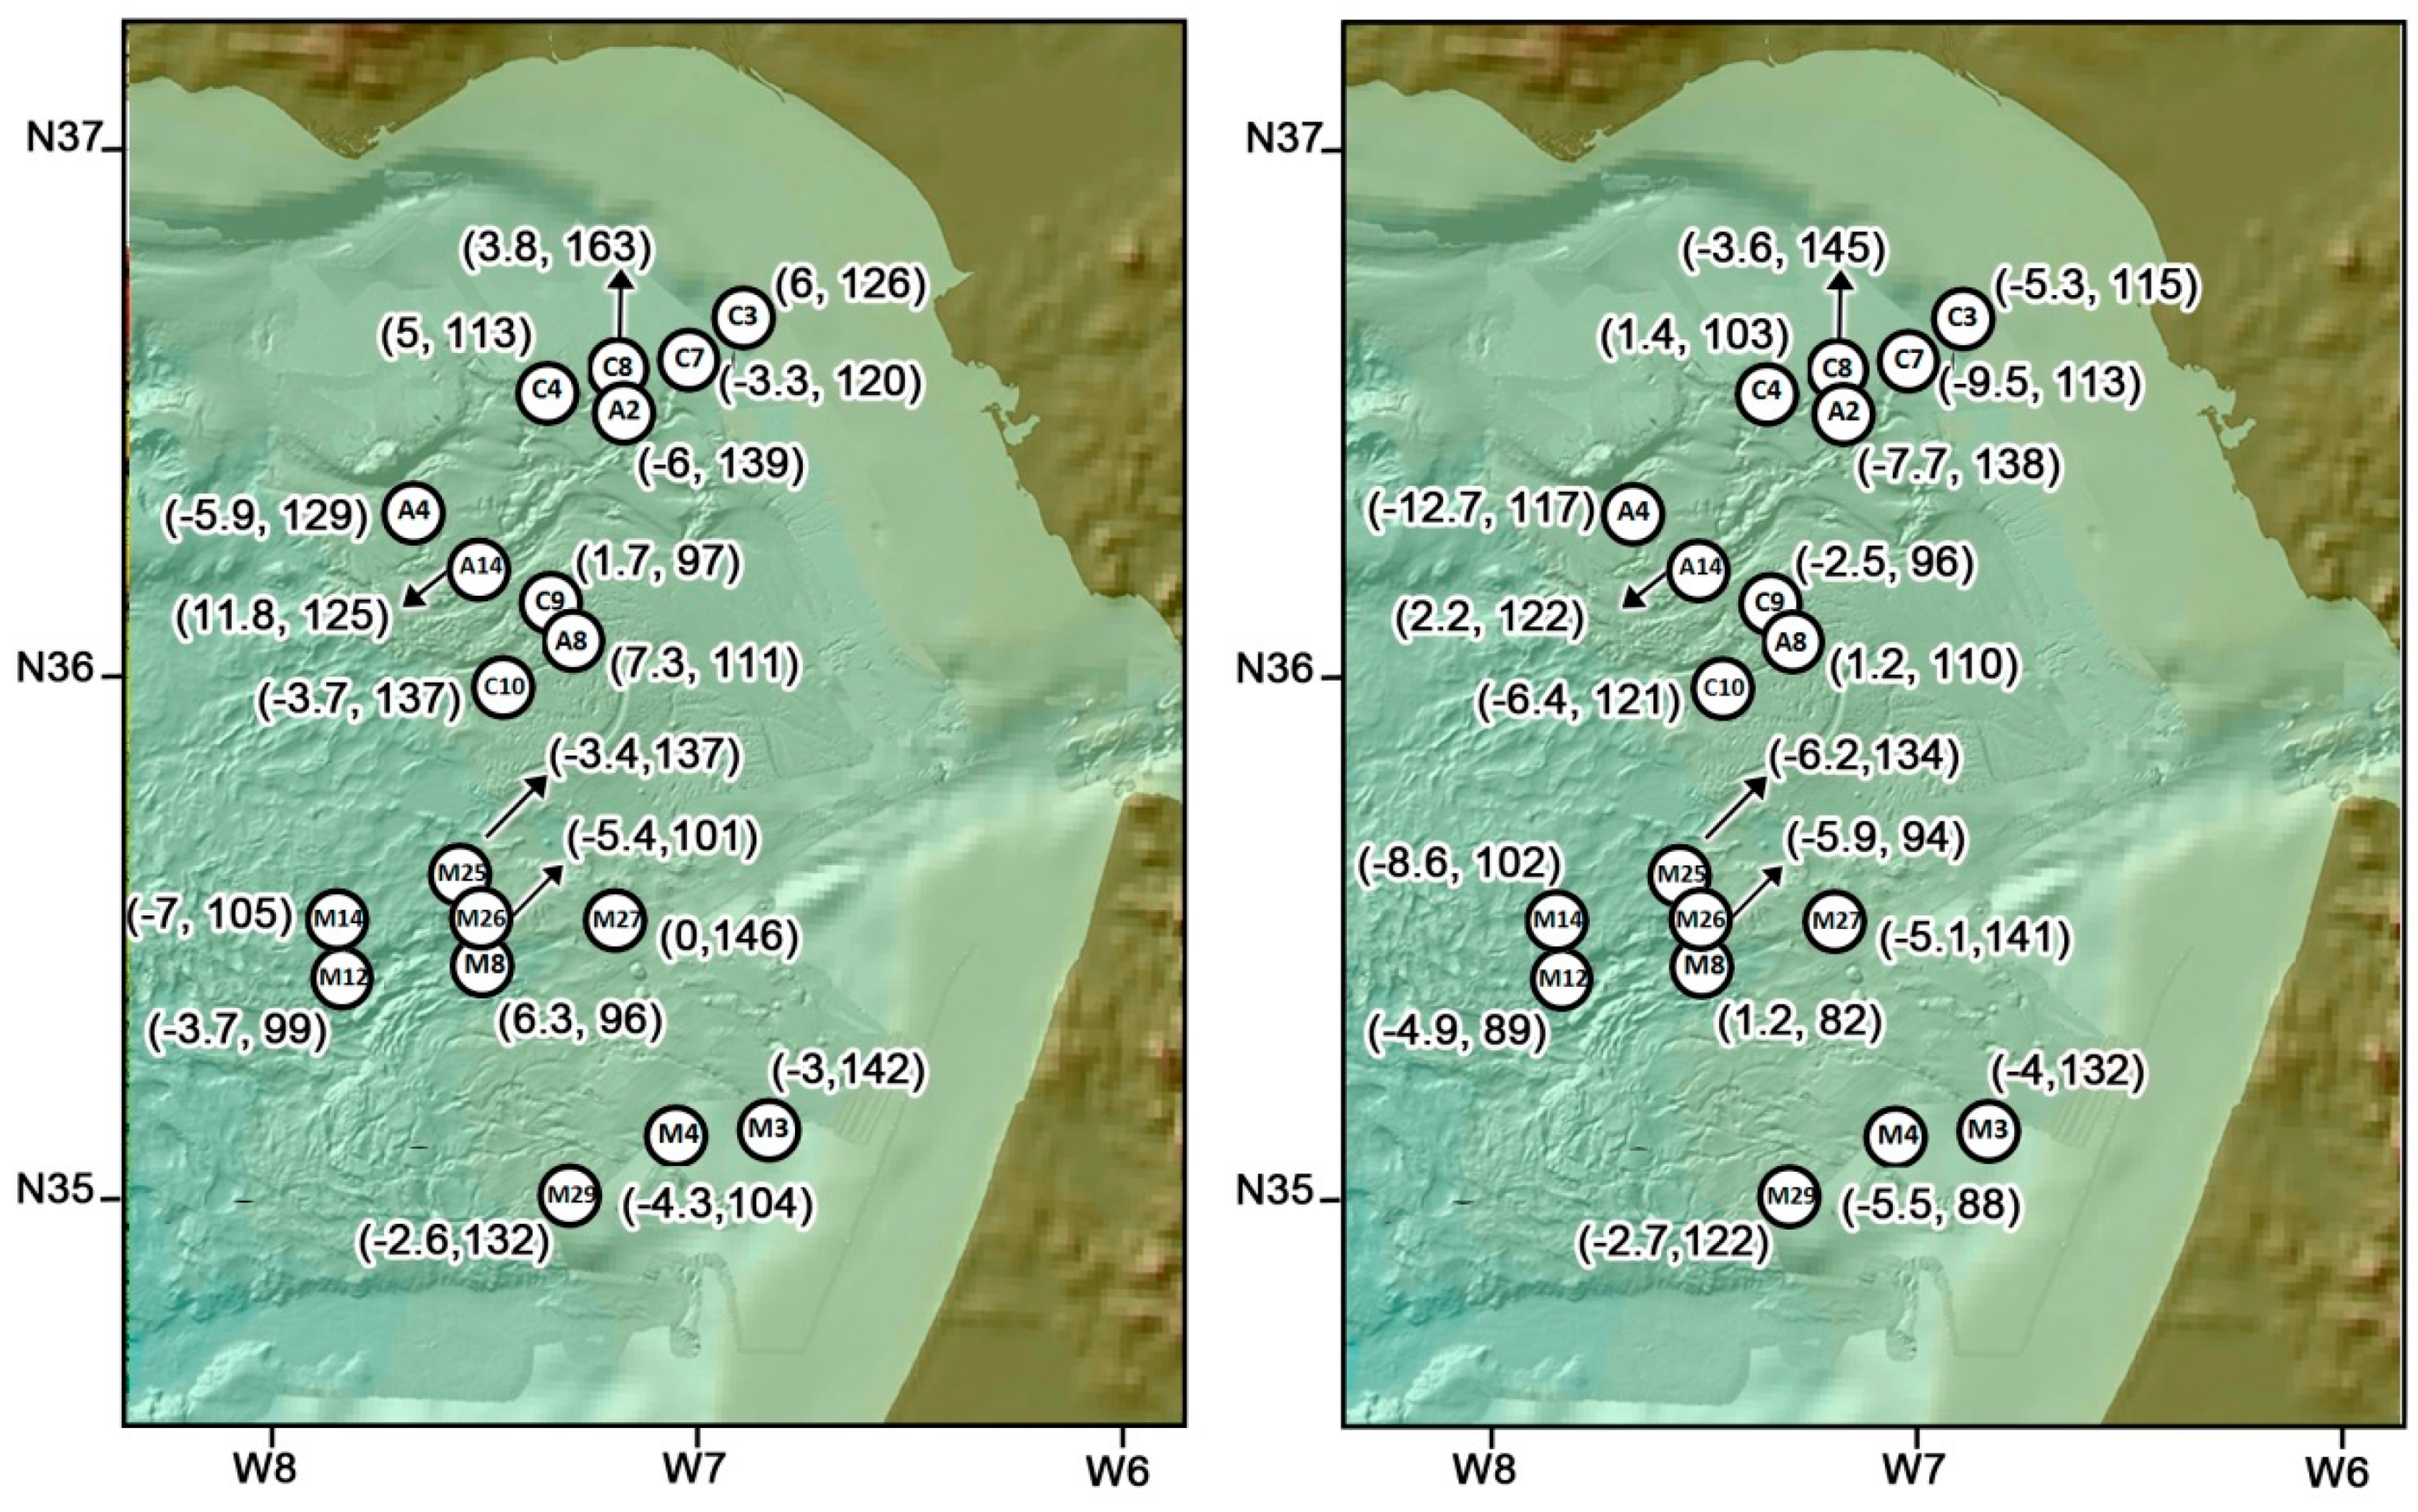
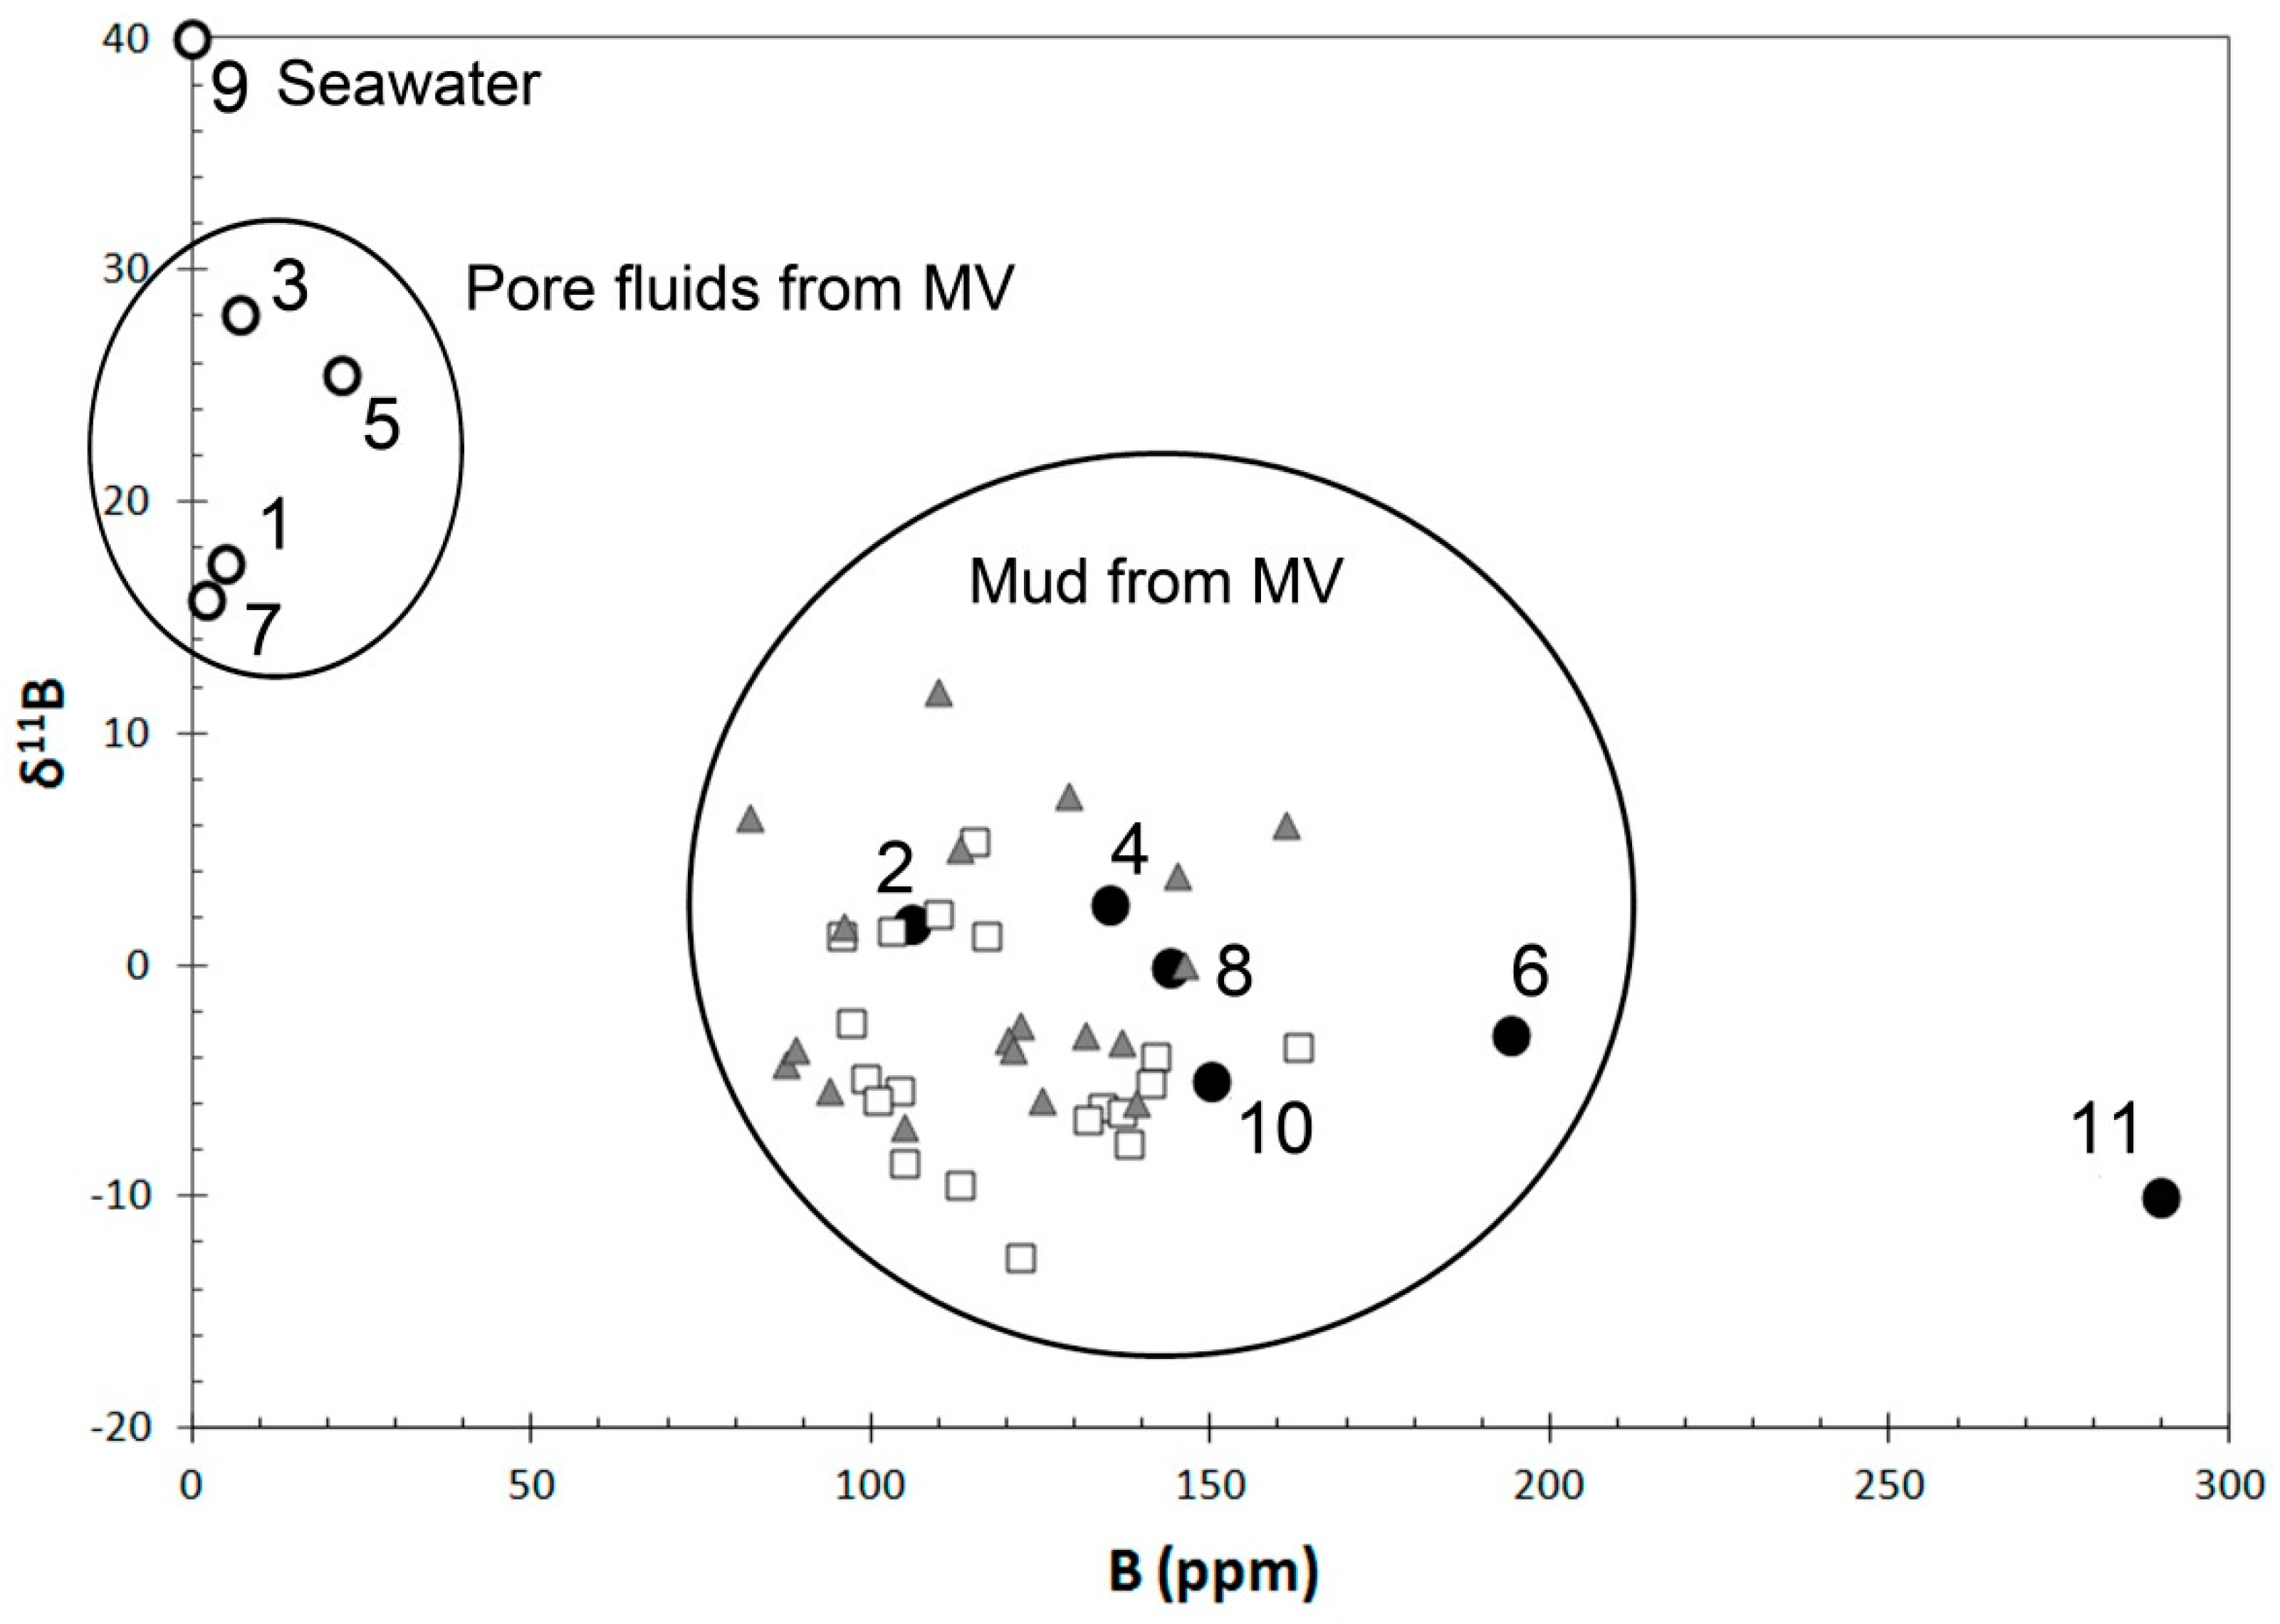
4.2. Boron Content and Isotopes

The bulk B-content of the clay minerals studied range from 97 to 146 ppm. Cation exchanged (xc) samples contain slightly less B than the bulk mannitol washed (mw) samples, due to the loss of interlayer B after cation exchange. This implies that most of the B in the clay is fixed in the tetrahedral layer (structurally bound) and only minor amounts of B were held in the I-S interlayer. Figure 6 shows that there are no spatial correlations between δ11B values and mud volcanoes locations or bathymetric depth.

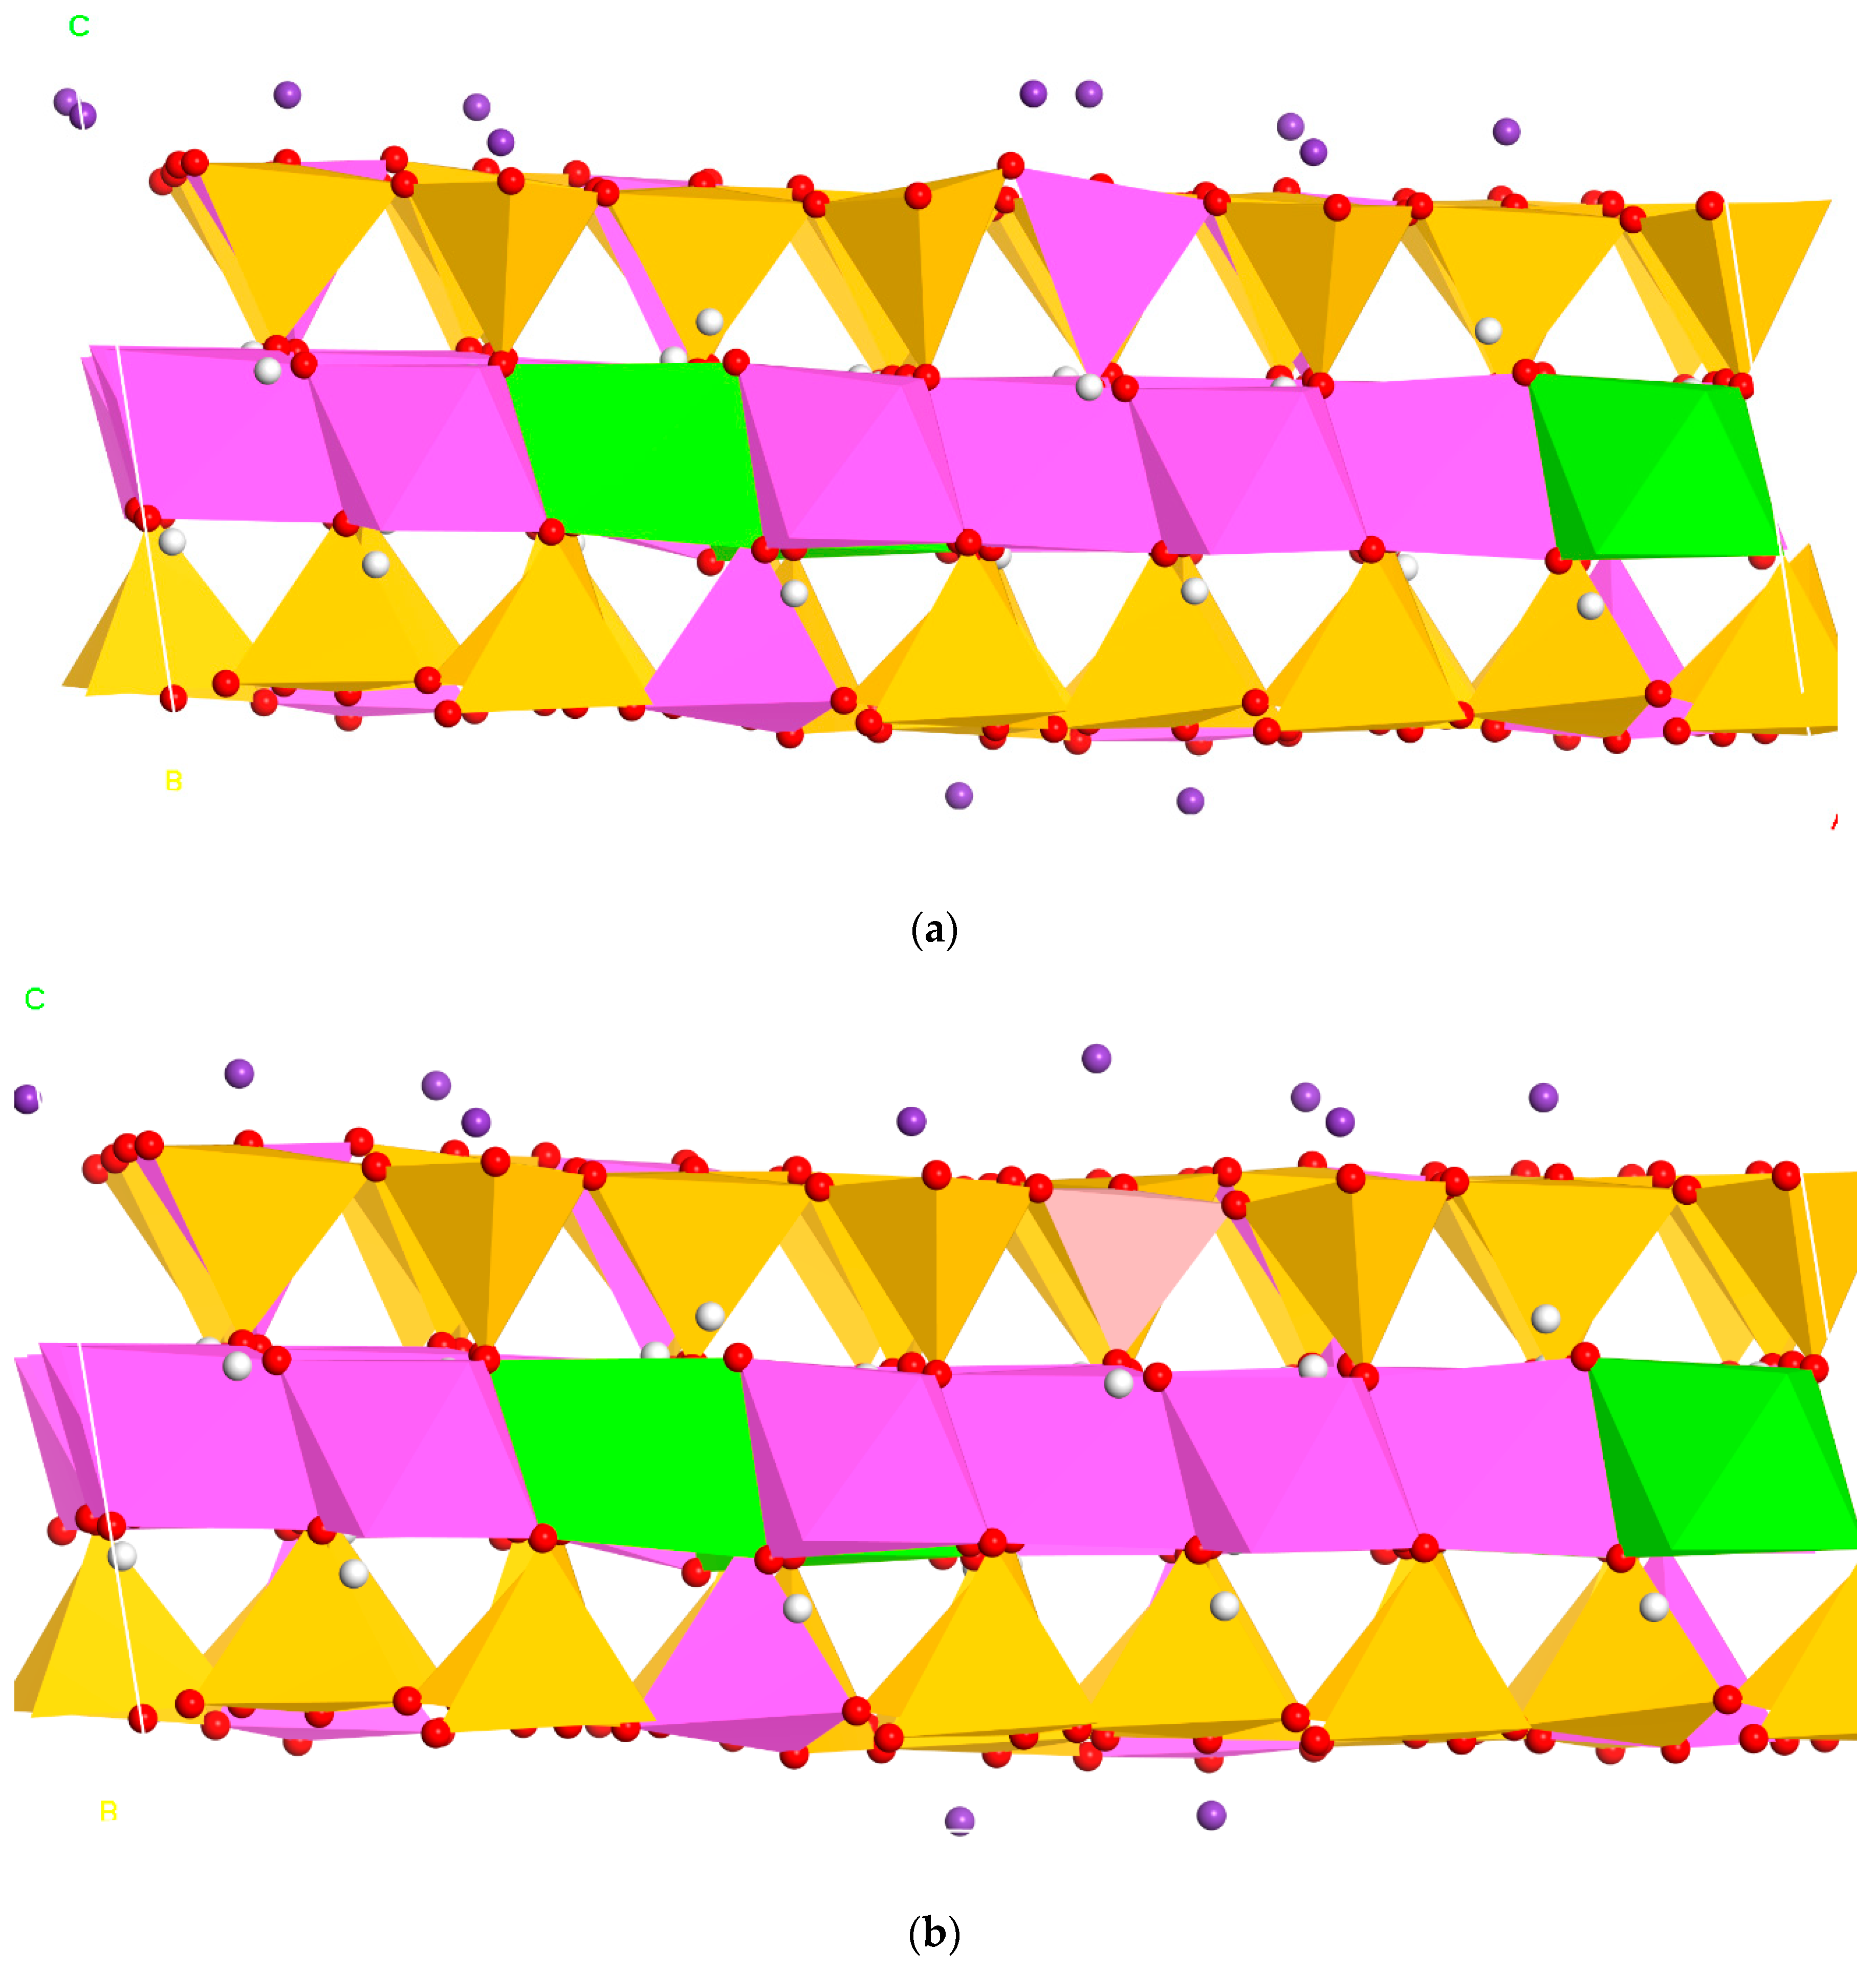
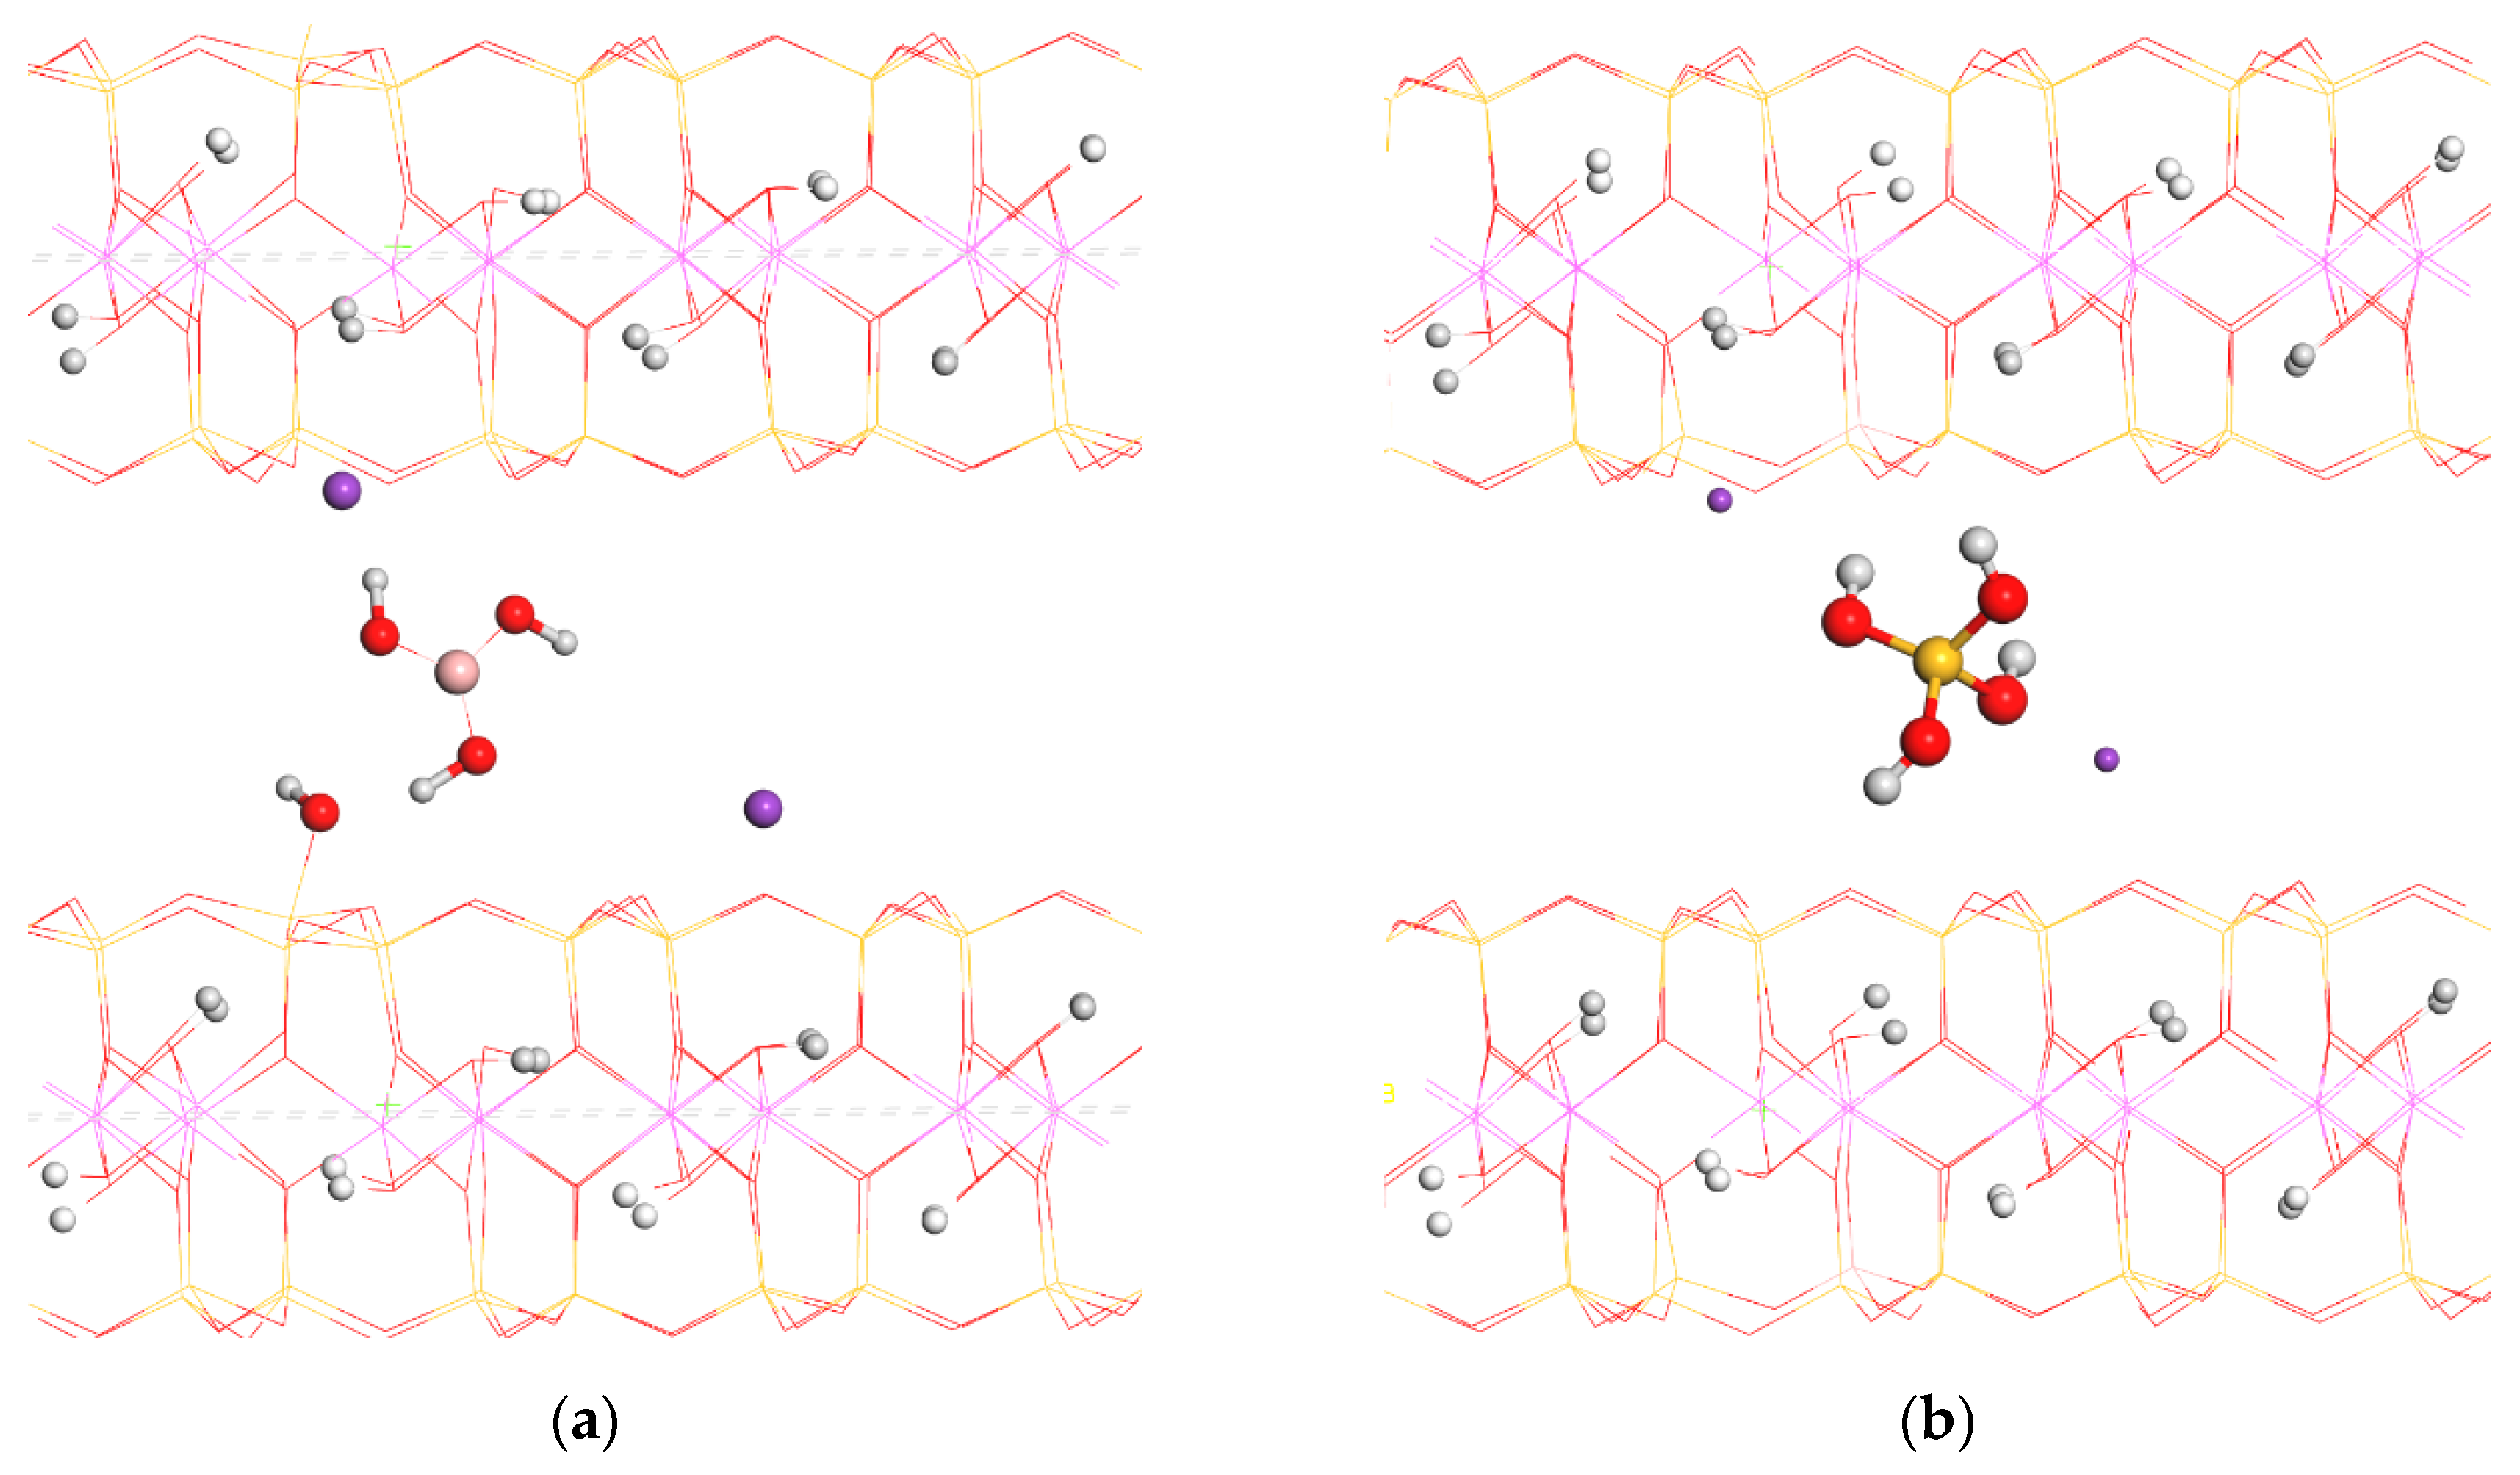
4.3. Computational Modeling

Geometry optimizations of Al-illite and B-illite models were performed at constant and variable volumes. The lattice parameters and the main geometrical features of the optimized structures are consistent with experimental values (Table 3), with a mean basal d(001) value of 10.02 Å for Al-illite and 10.03 Å for B-illite. The main geometrical features of the hydrated Al(OH)3 and B(OH)3 models (Figure 6) are presented in Table 4. This table shows average values being smaller bond distances in B(OH)3 molecule than in Al(OH)3. These bond lengths are consistent with B-O and Al-O distances observed in the B-illite model described in Table 4. In the B hydrated complexes, the structure is highly symmetric with the cation and O atoms in the same plane according to previous studies at gas phase [88], whereas the H atoms are twisted to a different plane and oriented towards the vicinal O atom of the same molecule. However, in the Al(OH)3 hydrated complex, the Al cation forms a pyramidal form with the O atoms; similar non-planar configurations have been reported in Al hydrates previously [89]. There are strong H bonding interactions between the metal hydroxides and the surrounding water molecules. Hence, different B-O bond lengths are found d(B-O1) = 1.355 Å, d(B-O2) = 1.371 Å and d(B-O3) = 1.394 Å and consequently different BO-H bond lengths are found, d(O1-H) = 1.023 Å, d(O2-H) = 1.004 Å and d(O3-H) = 1.002 Å. This can be explained due to a strong H bond with one water molecule d(O1H…Ow) = 1.563 Å, d(O2H…Ow) = 1.633 Å, d(BO2…Hw) = 1.495 Å, d(O3H…Ow) = 1.795 Å, Some correlation can be observed: a stronger H bond, a longer O-H bond and a stronger B-O bond length is. A similar effect is observed in Al(OH)3 with d(Al-O1) = 1.743 Å, d(Al-O2) = 1.787 Å and d(Al-O3) = 1.836 Å and also strong H bonds d(O1H…Ow) = 1.554 Å, d(O2H…Ow) = 1.640 Å and d(AlO2…Hw) = 1.262 Å, d(O3H…Ow) = 1.567 Å. During the optimizations, proton exchanges are observed by dissociation of water molecules, according to previous works on Al hydrates [90].
The optimization energies of the two illite models (Figure 7) are compared with the energies of the hydrated Al(OH)3 and B(OH)3 models by proposing the next reaction:
UAl-illite + UB(OH)3B-illite + UAl(OH)3
where U is the internal energy of the system. Our results shows that UAl-illite+UB(OH)3 is less stable (−105751.2580 eV) than UB-illite + UAl(OH)3 (−105751.6327 eV) in 36.7 KJ/mol. This means that the fixation of B on the illite tetrahedral layer instead of Al atoms is energetically favorable.
The optimization energies of the two montmorillonite models (Figure 8) are also compared, showing that montmorillonite with tetrahedral B is more stable (−48414.1023 eV) than montmorillonite with interlayer B(OH)4 (−48413.1163 eV), again proving that the incorporation of B in the tetrahedral layer is a energetically favorable process. Furthermore, in the optimized model of montmorillonite with interlayer K+B(OH)4, it can be noticed that this salt is dissociated in B(OH)3 and K+(OH). The B(OH)3 forms a H bond with basal tetrahedral O atoms, d(O…H) = 1.75 Å, and with the OH anion d(O…H) = 1.68 Å. Our energetic result is consistent with previous empirical studies [92] that indicated B(OH)3 dominates in the I-S interlayer space.
Further calculations will be performed exploring these phyllosilicate models with different moisture grade (water molecules) and several pressure conditions (sediments environments) to complete this study but they are out of the scope of the present work.

5. Discussion

5.1. Clay Mineralogy and Diagenetic Evolution of Deep Sediments in the Gulf of Cádiz

TEM images and XRD data show that smectite and interstratified illite–smectite (I-S) are present as well as other clay minerals such as detrital mica, kaolin plates and palygorskite. The chemical analyses conducted on individual particles, indicate that all smectite and I-S phases are dioctahedral, with Al as the main octahedral cation. Notably, Si from the smectite layers in the mixed-layered I-S decreases as illitization progresses (Figure 5). Focusing on the nature of interlayer cations, the compositional analysis shows a wide range of variations in the content of K, Na, Ca and Mg, but the dominant cation is K. There is a good correlation between the interlayer K content and tetrahedral Al (Figure 4a). From this plot, together with the observations of these morphologies by TEM (Figure 3), it can be inferred that the increase in the illitization produces morphological and chemical changes that increases K and tetrahedral Al in clay particles. This is supported by the percentage of illite in I-S and Reichweite (R) estimations (Table 2 and Figure 5).
Some smectite–illite transformation characteristics can be observed in the MR3+–2R3+–3R2+ ternary diagram (Figure 5) [86]. In this diagram, the chemical composition of clay particles is represented together with ideal compositions of the discrete phases involved in the transformation (montmorillonite, beidellite and illite). The dioctahedral character of the phases involved in the illitization process is represented by the distance of the data from the 3R2+ apex. Furthermore, for illite-rich phases, an increase in the layer charge and interlayer cations can be seen, represented by the trend of the data towards the MR3+ apex.
All the clay geochemical trends are related to prograde diagenetic changes, where the dominant clay minerals provide clues about the burial/thermal history of sedimentary basins [19]. The reduction of expandable layers or the smectite–illite transformation processes have been related to the evolution of petroleum systems, as illitization of smectite overlaps the oil window [93,94,95,96,97,98], as discussed by numerous papers addressing the potential for reaction through solid state transformation or dissolution/precipitation mechanisms [17,19,61,85]. Although the coexistence of different I-S phases in a sample can correlate with a prograde evolution in a diagenetic sequence, in this study, the physical mixture of clay minerals may come from different stratigraphic units as a result of fluid expulsion during emplacement of the mud volcano [13]. Nevertheless, morphological changes observed by TEM (polygonal to euhedral) point to similar mechanisms described previously [85] in a series of experimental hydrothermal conditions as seen by X-ray diffraction and TEM, where they suggest illitization mechanism driven by dissolution/crystallization processes.
MV clay mineral samples in this study, with δ11B values ranging from +2.2 to 12.7 and an average of −2.2‰ fixed-B abundances, are relatively high, 82–145 ppm. Again, a precipitation process is the most probable mechanism to incorporate B in the tetrahedral layer of illite as described previously by the authors of [68,99], showing that, during diagenesis, as temperatures approach 120 °C, B-adsorption becomes negligible and substitution of Si by B occurs as illite forms [100]. Molecular models presented in this work are in agreement with this statement, as these calculations prove that it is energetically favorable for B to reside in the tetrahedral sites of illite. Although B-O bonds in the tetrahedral layer are shorter (1.48 Å) than Al-O and Si-O bonds (1.78 and 1.67 Å, respectively), the lattice parameters of B-illite models are similar to the Al-illite model and to the experimental illite values, meaning that the incorporation of B in tetrahedral sites has no effect on the crystal structure.
Boron geochemistry has been studied recently in different environments as an indicator of fluid circulation and diagenetic grade. A set of samples from different mud volcanoes around the world as indicators of progressive diagenesis show a good correlation between B contents and δ11B isotopic values [101,102], although these studies did not carefully separate tetrahedral B from interlayer (trigonal) B. Besides B, the uptake of N in illite (as NH4+ substituting for K+) increases during diagenesis as illitization proceeds and has been studied in hydrocarbon-bearing sedimentary basins suggesting a kerogen source for both elements [32,103,104,105]
The nature of clay and clasts present in the mud breccia of the Gulf of Cádiz mud volcanoes can be used to infer the possible depth of the underlying units [42,56]. In Yuma mud volcano in the Moroccan margin, more than 200 clasts from the mud breccia were studied [106], displaying a very complex mixture of material from the sedimentary successions. The reconstructed sedimentary succession showed sediments at least as old as Eocene, with the presence of several clayey units Miocene in age (Aquitanian and Tortonian).
The detailed clay mineral characterization and the chemical composition made in this study indicates that although I-S content can vary among the mud volcanoes, the clay mineralogy is similar to that found in Tertiary units (Miocene in age) common in Mediterranean Messinian sediments. The Messinian clay minerals taken in DSDP legs 13 and 42A contained large amounts of smectite and are constant throughout the Mediterranean Basin [107,108]. Similar results were found by [109] and [110] in the Lower Messinian in Sicily or by [111] in the Upper Cenomanian–Turonian sediments in the high Atlas in Morocco. In addition, clays (dioctahedral smectite and illite) are a common component in the Miocene–Pliocene lithostratigraphic formations (Gibraleon clays) of the lower Guadalquivir Basin [112,113,114].
Based on the δ11B values of I-S in MVs of the Gulf of Cádiz (−12.7‰ to +5.3‰; Table 5), the average clays equilibrated in fluid with δ11B < 10‰, (calculated using the mineral-water fractionation factor 1000 ln α min-water = 3.28 − 10.35 (1000/T); [33], which is significantly more 10B-enriched than seawater (+39‰). We interpret the B-isotope composition of the I-S in MVs of the Gulf of Cádiz to result from illitization of the smectite-rich sediments, probably from Messinian sources over a range of temperature during organic maduration of primary source rocks (~80–150 °C). Hydrocarbon-related fluids generated at temperatures of methane production (~150 °C) are enriched in 10B [24,115], thus hydrocarbon related fluids are the likely source of isotopically light B in I-S in all the studied samples, from north to south and from the shelf to 1639 m depth. There are no mineralogical sources in these sediments that could be a source of such high concentrations of 10B-enriched fluids.

5.2. B Isotopes and Origin of Fluids in the Gulf of Cádiz

The affinity of the light isotope 10B for tetrahedral coordination and the heavy isotope 11B for trigonal coordination was shown by [27]. Hence, during illitization, clay minerals will concentrate 10B in the process of crystallization under hydrothermal conditions [24]. It was shown [116] that kerogen in the Gulf of Mexico sedimentary basin oil source rocks have a B isotopic composition of −4‰ to +10‰. B-isotopic values from Gulf of Cadiz mud volcano samples are similar to those previously reported by [116] (Figure 9). However, mud volcano samples show higher dispersion of δ11B data ranging from −7‰ to +11.8‰ for the bulk (mw) samples and from −12.7‰ to +5.3‰ for the cation exchanged (xc) clay samples (Table 5), perhaps reflecting mineralogical variations arising from mixed fluid sources, as expected in the processes of expulsion of fluids in a mud volcano. Table 5 shows that there are small differences in isotopic compositions between mannitol and cation exchanged samples indicating that the interlayer B is isotopically heavier than the tetrahedral-B.
Figure 10 represents B concentration and B isotope composition of MV from different locations. It can be seen that the pore fluids from MV clay minerals are 11B-enriched compared to the clay minerals. While this may in part reflect the mineral–water fractionation of B, it also reflects the mixing of basinal water with seawater (+39.5‰). Using the B-isotope fractionation equation for pH < 7 [33], the fractionation between illite and water at 150 °C (methane generation temperature) is −1.2‰. Therefore, an illite precipitated with δ11B −12.7‰ (Table 5, Sample A4 48-50 (xc)) would be in equilibrium with +8.4‰ water. This isotopically light δ11B water composition, compared to seawater, is consistent with 10B enrichment from organic sources. Furthermore, Gulf of Cádiz MV samples show δ11B compositions near values associated with source rock kerogen samples in other hydrocarbon-rich sedimentary basins (e.g., [99]). The higher δ11B values measured in some samples (up to +5.3‰) may represent more mixing with seawater or samples less influenced by hydrocarbon-related waters. Seawater contains only about 5 ppm B, thus the high B content of the mud volcanoes requires a high fluid:rock ratio, as expected for MVs. Furthermore, where the water pH was higher than ~8, B(OH)4 dominates the fluid, and, because 10B prefers tetrahedral coordination, there is little fractionation between B(OH)4 dominated fluid and illite [28].
These data are consistent with previous results shown by [43,45], based on Li and Sr isotope data from interstitial water, suggesting that the fluid geochemistry in MVs from the Gulf of Cádiz is influenced by overpressuring caused by clay dehydration at several kilometers depth. Temperatures approached 150 °C where thermogenic methane is produced and illitization ends. These clay and marl units underneath mud volcanoes in the Gulf of Cádiz, are Mesozoic and Tertiary in age (mainly Tortonian-Messinian) and have been considered as the oil source rock in the area [44]. A complex scenario of hydrocarbon fluid generation at depth and migration to the upper units, dehydration of clays and mixing with methane-rich fluids, and a later mixing with shallow gas was proposed by [121] to explain the distinct composition of fluids of this area. The detailed clay mineral characterization together with the B-isotopic composition is used in this study to provide additional information on the fluid geochemistry obtained in this area by the authors of [43,44,45,46,121,122]. These new data allow us to corroborate that illitization is an important process in the generation of fluids in MVs and can be one of the driving forces of mud volcanism in the area. Boron geochemistry is also relevant in elucidating both mineral processes and fluid origins, as previously proposed by the authors of [25,43,102]. This also is in agreement with other works that show the importance of the relationship of clays and petroleum in oil formation, migration, accumulation and storage [122,123].

6. Conclusions

Mud volcanoes in the marine environment usually involve a mixture of clays dragged up by fluids from underlying units of various depths. The detailed characterization of the clays, as well as B isotopic compositions contributes to our understanding of the geological model of the area. Those data show that mixed-layer illite–smectite phases and other clay minerals present in the mud volcano samples were derived from depths where temperatures were great enough to generate B from organic source rock. The illitization process occurs at temperatures close to oil generation [37]. During the illitization process, B released from kerogen, enriched in 10B, was incorporated into the tetrahedral layer of diagenetic illite. The Gulf of Cadiz MVs are dominated by minerals with high B-content and low δ11B, suggesting that they formed at depth, in equilibrium with hydrocarbon-related fluids at temperatures hot enough to have generated methane that is associated with these MVs. This interpretation is supported by theoretical atomistic calculations demonstrating the preferred incorporation of 10B in the tetrahedral sheet rather than in the interlayer space of the I-S. From an oil industry point of view, this contribution is very important, as it helps to prospect for hydrocarbon reservoirs, since δ11B gives information on the organic matter maturation state of the oilfield.

Author Contributions

All authors contributed to writing, reviewing and editing the final document. Conceptualization, R.M.-V. and M.P.M.; Software and computational analysis, C.I.S.-D. and R.M.-V.; XR-diffraction and TEM data and interpretation, F.N., R.M.-V., X.A.R. and M.P.M.; B analysis, L.B.W. and R.M.-V.; writing original draft preparation, R.M.-V.; and funding acquisition and supervision of the project, M.P.M. All authors have read and agreed to the published version of the manuscript.

Funding

This research was funded RNM-3581 CADHYS project and a doctoral scholarship of the Junta de Andalucía (Spain) to Rubén Martos.

Acknowledgments

Samples were obtained in the framework of TASYO (MAR-98-0209), MOUNDFORCE—EUROCORE-EUROMARGINS 01-LEC-EMA06F and INDEMARES-LIFE projects, on board of RVs Hespérides and Cornide de Saavedra. The authors thank M. Mar Abad of the Centro de Instrumentación Científica (CIC) of Granada, Andalusian project RNM-1897 and PAIDI-groups RNM-328 and RNM-363 of the Andalusia Government for the financial support, as well as the Supercomputational Center of the Granada University (UGRGRID), the Centro Técnico de Informática of CSIC and the Spanish institute of Oceanography for providing samples of mud volcanoes. We acknowledge the Arizona State University National SIMS Facility supported by the US National Science Foundation grant (EAR-0948878).

Conflicts of Interest

The authors declare no conflict of interest.

References

  1. Milkov, A.V. Worldwide Distribution of Submarine Mud Volcanoes and Associated Gas Hydrates. Mar. Geol. 2000, 167, 29–42. [Google Scholar] [CrossRef]
  2. Kopf, A.J. Significance of Mud Volcanism. Rev. Geophys. 2002, 40, 1005. [Google Scholar] [CrossRef] [Green Version]
  3. Etiope, G.; Feyzullayev, A.; Baciu, C.L. Terrestrial Methane Seeps and Mud Volcanoes: A Global Perspective of Gas Origin. Mar. Pet. Geol. 2009, 26, 333–344. [Google Scholar] [CrossRef]
  4. Mazzini, A.; Etiope, G. Mud Volcanism: An Updated Review. Earth Sci. Rev. 2017, 168, 81–112. [Google Scholar] [CrossRef] [Green Version]
  5. Bonini, M. Mud Volcanoes: Indicators of Stress Orientation and Tectonic Controls. Earth Sci. Rev. 2012, 115, 121–152. [Google Scholar] [CrossRef]
  6. Dimitrov, L.I. Mud Volcanoes-the Most Important Pathway for Degassing Deeply Buried Sediments. Earth Sci. Rev. 2002, 59, 49–76. [Google Scholar] [CrossRef]
  7. Bonini, M.; Tassi, F.; Feyzullayev, A.-A.; Aliyev, C.S.; Capecchiacci, F.; Minissale, A. Deep Gases Discharged from Mud Volcanoes of Azerbaijan: New Geochemical Evidence. Mar. Pet. Geol. 2013, 43, 450–463. [Google Scholar] [CrossRef]
  8. Mazzini, A. Mud Volcanism: Processes and Implications. Mar. Pet. Geol. 2009, 26, 1677–1680. [Google Scholar] [CrossRef]
  9. Sokol, E.; Kokh, S.; Kozmenko, O.; Novikova, S.; Khvorov, P.; Nigmatulina, E.; Belogub, E.; Kirillov, M. Mineralogy and Geochemistry of Mud Volcanic Ejecta: A New Look at Old Issues (A Case Study from the Bulganak Field, Northern Black Sea). Minerals 2018, 8, 344. [Google Scholar] [CrossRef] [Green Version]
  10. Loher, M.; Pape, T.; Marcon, Y.; Römer, M.; Wintersteller, P.; Praeg, D.; Torres, M.; Sahling, H.; Bohrmann, G. Mud Extrusion and Ring-Fault Gas Seepage—Upward Branching Fluid Discharge at a Deep-Sea Mud Volcano. Sci. Rep. 2018, 8, 6275. [Google Scholar] [CrossRef]
  11. Etiope, G.; Milkov, A.V. A New Estimate of Global Methane Flux from Onshore and Shallow Submarine Mud Volcanoes to the Atmosphere. Environ. Geol. 2004, 46, 997–1002. [Google Scholar] [CrossRef]
  12. Etiope, G. Natural Gas. Seepage: The Earth’s Hydrocarbon Degassing; Springer-Verlag: Berlin, Germany, 2015. [Google Scholar] [CrossRef]
  13. López-Rodríguez, C.; De Lange, G.J.; Comas, M.; Martínez-Ruiz, F.; Nieto, F.; Sapart, C.J.; Mogollón, J.M. Recent, Deep-Sourced Methane/Mud Discharge at the Most Active Mud Volcano in the Western Mediterranean. Mar. Geol. 2019, 408. [Google Scholar] [CrossRef]
  14. Hower, J.; Eslinger, E.V.; Hower, M.E.; Perry, E.A. Mechanism of Burial Metamorphism of Argillaceous Sediment: 1. Mineralogical and Chemical Evidence. Bull. Geol. Soc. Am. 1976, 87, 725–737. [Google Scholar] [CrossRef]
  15. Abid, I.A.; Hesse, R.; Harper, J.D. Variations in Mixed-Layer Illite/Smectite Diagenesis in the Rift and Post-Rift Sediments of the Jeanne d’Arc Basin, Grand Banks Offshore Newfoundland, Canada. Can. J. Earth Sci. 2004, 41, 401–429. [Google Scholar] [CrossRef]
  16. Arostegui, J.; Sangüesa, F.J.; Nieto, F.; Uriarte, J.A. Thermal Models and Clay Diagenesis in the Tertiary-Cretaceous Sediments of the Alava Block (Basque-Cantabrian Basin, Spain). Clay Miner. 2006, 41, 791–809. [Google Scholar] [CrossRef] [Green Version]
  17. Velde, B.; Vasseur, G. Estimation of the Diagenetic Smectite to Illite Transformation in Time-Temperature Space. Am. Miner. 1992, 77, 967–976. [Google Scholar]
  18. Altaner, S.P.; Ylagan, R.F. Comparison of Structural Models of Mixed-Layer Illite/Smectite and Reaction Mechanisms of Smectite Illitization. Clays Clay Miner. 1997, 45, 517–533. [Google Scholar] [CrossRef]
  19. Merriman, R.J.; Peacor, D.R. Very Low-Grade Metapelites: Mineralogy, Microfabrics and Measuring Reaction Progress. In Low-Grade Metamorphism; Martin, F., Doug, R., Eds.; Blackwell Publishing Ltd.: Oxford, UK, 1999; pp. 10–60. [Google Scholar] [CrossRef]
  20. Goldschmidt, V.M.; Peters, C. The Geochemistry of Boron. In The Geochemistry of Boron; Walker, C.T., Ed.; Dowden, Hutchinson and Ross: Stroudsburg, PA, USA, 1932. [Google Scholar]
  21. Harder, H. Boron Content of Sediments as a Tool in Facies Analysis. Sediment. Geol. 1970, 4, 153–175. [Google Scholar] [CrossRef]
  22. Spivack, A.J.; Palmer, M.R.; Edmond, J.M. The Sedimentary Cycle of the Boron Isotopes. Geochim. Cosmochim. Acta 1987, 51, 1939–1949. [Google Scholar] [CrossRef]
  23. Govett, G.J.S. Introduction to Exploration Geochemistry: AA Levinson. J. Geol. 1976, 84, 503–504. [Google Scholar] [CrossRef]
  24. Williams, L.B.; Hervig, R.L.; Holloway, J.R.; Hutcheon, I. Boron Isotope Geochemistry during Diagenesis. Part I. Experimental Determination of Fractionation during Illitization of Smectite. Geochim. Cosmochim. Acta 2001, 65, 1769–1782. [Google Scholar] [CrossRef]
  25. Williams, L.B.; Hervig, R.L. Exploring Intra-Crystalline B-Isotope Variations in Mixed-Layer Illite-Smectite. Am. Mineral. 2002, 87, 1564–1570. [Google Scholar] [CrossRef]
  26. Palmer, M.R.; Spivack, A.J.; Edmond, J.M. Temperature and PH Controls over Isotopic Fractionation during Adsorption of Boron on Marine Clay. Geochim. Cosmochim. Acta 1987, 51, 2319–2323. [Google Scholar] [CrossRef]
  27. Palmer, M.R.; Swihart, G.H. Boron Isotope Geochemistry: An Overview. Rev. Mineral. 1996, 33, 708–744. [Google Scholar]
  28. Hervig, R.L.; Moore, G.M.; Williams, L.B.; Peacock, S.M.; Holloway, J.R.; Roggensack, K. Isotopic and Elemental Partitioning of Boron between Hydrous Fluid and Silicate Melt. Am. Mineral. 2002, 87, 769–774. [Google Scholar] [CrossRef]
  29. Pennisi, M.; Bianchini, G.; Kloppmann, W.; Muti, A. Chemical and Isotopic (B, Sr) Composition of Alluvial Sediments as Archive of a Past Hydrothermal Outflow. Chem. Geol. 2009, 266, 123–134. [Google Scholar] [CrossRef]
  30. Schwarcz, H.P.; Agyei, E.K.; McMullen, C.C. Boron Isotopic Fractionation during Clay Adsorption from Sea-Water. Earth Planet. Sci. Lett. 1969, 6, 1–5. [Google Scholar] [CrossRef]
  31. Keren, R.; Mezuman, U. Boron Adsorption by Clay Minerals Using a Phenomenological Equation. Clays Clay Miner. 1981, 29, 198–204. [Google Scholar] [CrossRef]
  32. Środoń, J. Evolution of Boron and Nitrogen Content During Illitization of Bentonites. Clays Clay Miner. 2010, 58, 743–756. [Google Scholar] [CrossRef]
  33. Williams, L.B.; Clauer, N.; Hervig, R.L. Quantitative Mineralogy and Microanalysis of Sediments and Sedimentary Rockstle. In Quantitative Mineralogy and Microanalysis of Sediments and Sedimentary Rocks; Mineralogical Association of Canada Short Course: Québec, QC, Canada, 2012; pp. 55–73. [Google Scholar]
  34. Williams, L.B.; Środoń, J.; Huff, W.D.; Clauer, N.; Hervig, R.L. Light Element Distributions (N, B, Li) in Baltic Basin Bentonites Record Organic Sources. Geochim. Cosmochim. Acta 2013, 120, 582–599. [Google Scholar] [CrossRef]
  35. Bobos, I.; Williams, L.B. Boron, Lithium and Nitrogen Isotope Geochemistry of NH4-Illite Clays in the Fossil Hydrothermal System of Harghita Bãi, East Carpathians, Romania. Chem. Geol. 2017, 473, 22–39. [Google Scholar] [CrossRef]
  36. Köster, M.H.; Williams, L.B.; Kudejova, P.; Gilg, H.A. The Boron Isotope Geochemistry of Smectites from Sodium, Magnesium and Calcium Bentonite Deposits. Chem. Geol. 2019, 510, 166–187. [Google Scholar] [CrossRef]
  37. Eberl, D.D. Three Zones for Illite Formation during Burial Diagenesis and Metamorphism. Clays Clay Miner. 1993, 41, 26–37. [Google Scholar] [CrossRef]
  38. Molina-Montes, E.; Donadio, D.; Hernández-Laguna, A.; Sainz-Díaz, C.I. DFT Research on the Dehydroxylation Reaction of Pyrophyllite 2. Characterization of Reactants, Intermediates, and Transition States along the Reaction Path. J. Phys. Chem. A 2008, 112, 6373–6383. [Google Scholar] [CrossRef] [PubMed]
  39. Sainz-Diaz, C.I.; Escamilla-Roa, E.; Hernández-Laguna, A. Quantum Mechanical Calculations of Trans-Vacant and Cis-Vacant Polymorphism in Dioctahedral 2:1 Phyllosilicates. Am. Mineral. 2005, 90, 1827–1834. [Google Scholar] [CrossRef]
  40. Palin, E.J.; Dove, M.T.; Hernández-Laguna, A.; Sainz-Díaz, C.I. A Computational Investigation of the Al/Fe/Mg Order-Disorder Behavior in the Dioctahedral Sheet of Phyllosilicates. Am. Mineral. 2004, 89, 164–175. [Google Scholar] [CrossRef]
  41. Ay, A.N.; Zumreoglu-Karan, B.; Kalinichev, A.G.; Rives, V.; Trujillano, R.; Temel, A. Layered Double Hydroxide–Borate Composites Supported on Magnetic Nanoparticles: Preparation, Characterization and Molecular Dynamics Simulations. J. Porous Mater. 2020, 27, 735–743. [Google Scholar] [CrossRef]
  42. Hensen, C.; Nuzzo, M.; Hornibrook, E.; Pinheiro, L.M.; Bock, B.; Magalhães, V.H.; Brückmann, W. Sources of Mud Volcano Fluids in the Gulf of Cadiz—Indications for Hydrothermal Imprint. Geochim. Cosmochim. Acta 2007, 71, 1232–1248. [Google Scholar] [CrossRef]
  43. Nuzzo, M.; Hornibrook, E.R.C.; Gill, F.; Hensen, C.; Pancost, R.D.; Haeckel, M.; Reitz, A.; Scholz, F.; Magalhães, V.H.; Brückmann, W.; et al. Origin of Light Volatile Hydrocarbon Gases in Mud Volcano Fluids, Gulf of Cadiz—Evidence for Multiple Sources and Transport Mechanisms in Active Sedimentary Wedges. Chem. Geol. 2009, 266, 350–363. [Google Scholar] [CrossRef] [Green Version]
  44. Scholz, F.; Hensen, C.; Reitz, A.; Romer, R.L.; Liebetrau, V.; Meixner, A.; Weise, S.M.; Haeckel, M. Isotopic Evidence (87Sr/86Sr, Δ7Li) for Alteration of the Oceanic Crust at Deep-Rooted Mud Volcanoes in the Gulf of Cadiz, NE Atlantic Ocean. Geochim. Cosmochim. Acta 2009, 73, 5444–5459. [Google Scholar] [CrossRef] [Green Version]
  45. Scholz, F.; Hensen, C.; De Lange, G.J.; Haeckel, M.; Liebetrau, V.; Meixner, A.; Reitz, A.; Romer, R.L. Lithium Isotope Geochemistry of Marine Pore Waters – Insights from Cold Seep Fluids. Geochim. Cosmochim. Acta 2010, 74, 3459–3475. [Google Scholar] [CrossRef] [Green Version]
  46. Haffert, L.; Haeckel, M.; Liebetrau, V.; Berndt, C.; Hensen, C.; Nuzzo, M.; Reitz, A.; Scholz, F.; Schönfeld, J.; Perez-Garcia, C.; et al. Fluid Evolution and Authigenic Mineral Paragenesis Related to Salt Diapirism—The Mercator Mud Volcano in the Gulf of Cadiz. Geochim. Cosmochim. Acta 2013, 106, 261–286. [Google Scholar] [CrossRef]
  47. Schmidt, C.; Burwicz, E.; Hensen, C.; Wallmann, K.; Martínez-Loriente, S.; Gràcia, E. Genesis of Mud Volcano Fluids in the Gulf of Cadiz Using a Novel Basin-Scale Model Approach. Geochim. Cosmochim. Acta 2018, 243, 186–204. [Google Scholar] [CrossRef]
  48. Williams, L.B.; Crawford, E.W.; Hervig, R.L. Tracing Hydrocarbons in Gas Shale Using Lithium and Boron Isotopes: Denver Basin USA, Wattenberg Gas Field. Chem. Geol. 2015, 417, 404–413. [Google Scholar] [CrossRef] [Green Version]
  49. Teichert, Z.; Bose, M.; Williams, L.B. Lithium Isotope Compositions of U.S. Coals and Source Rocks: Potential Tracer of Hydrocarbons. Chem. Geol. 2020, 549, 119694. [Google Scholar] [CrossRef]
  50. Maldonado, A.; Somoza, L.; Pallarés, L. The Betic Orogen and the Iberian-African Boundary in the Gulf of Cadiz: Geological Evolution (Central North Atlantic). Mar. Geol. 1999, 155, 9–43. [Google Scholar] [CrossRef]
  51. Medialdea, T.; Vegas, R.; Somoza, L.; Vázquez, J.T.; Maldonado, A.; Díaz-Del-Río, V.; Maestro, A.; Córdoba, D.; Fernández-Puga, M.C. Structure and Evolution of the “Olistostrome” Complex of the Gibraltar Arc in the Gulf of Cádiz (Eastern Central Atlantic): Evidence from Two Long Seismic Cross-Sections. Mar. Geol. 2004, 209, 173–198. [Google Scholar] [CrossRef]
  52. Casas, D.; Ercilla, G.; Baraza, J. Acoustic Evidences of Gas in the Continental Slope Sediments of the Gulf of Cadiz (E Atlantic). Geo Mar. Lett. 2003, 23, 300–310. [Google Scholar] [CrossRef]
  53. Somoza, L.; Díaz del Río, V.; León, R.; Ivanov, M.; Fernández-Puga, M.C.; Gardner, J.M.; Hernández-Molina, F.J.; Pinheiro, L.M.; Rodero, J.; Lobato, A.; et al. Seabed Morphology and Hydrocarbon Seepage in the Gulf of Cádiz Mud Volcano Area: Acoustic Imagery, Multibeam and Ultra-High Resolution Seismic Data. Mar. Geol. 2003, 195, 153–176. [Google Scholar] [CrossRef] [Green Version]
  54. Fernández-Puga, M.C.; Vázquez, J.T.; Somoza, L.; Díaz del Rio, V.; Medialdea, T.; Mata, M.P.; León, R. Gas-Related Morphologies and Diapirism in the Gulf of Cádiz. Geo Mar. Lett. 2007, 27, 213–221. [Google Scholar] [CrossRef]
  55. León, R.; Somoza, L.; Medialdea, T.; Vázquez, J.T.; González, F.J.; López-González, N.; Casas, D.; del Pilar Mata, M.; del Fernández-Puga, M.C.; Giménez-Moreno, C.J.; et al. New Discoveries of Mud Volcanoes on the Moroccan Atlantic Continental Margin (Gulf of Cádiz): Morpho-Structural Characterization. Geo Mar. Lett. 2012, 32, 473–488. [Google Scholar] [CrossRef]
  56. León, R.; Somoza, L.; Medialdea, T.; González, F.J.; Díaz-del-Río, V.; Fernández-Puga, M.C.; Maestro, A.; Mata, M.P. Sea-Floor Features Related to Hydrocarbon Seeps in Deepwater Carbonate-Mud Mounds of the Gulf of Cádiz: From Mud Flows to Carbonate Precipitates. Geo Mar. Lett. 2007, 27, 237–247. [Google Scholar] [CrossRef]
  57. Palomino, D.; López-González, N.; Vázquez, J.-T.; Fernández-Salas, L.-M.; Rueda, J.-L.; Sánchez-Leal, R.; Díaz-del-Río, V. Multidisciplinary Study of Mud Volcanoes and Diapirs and Their Relationship to Seepages and Bottom Currents in the Gulf of Cádiz Continental Slope (Northeastern Sector). Mar. Geol. 2016, 378, 196–212. [Google Scholar] [CrossRef]
  58. Toyos, M.H.; Medialdea, T.; León, R.; Somoza, L.; González, F.J.; Meléndez, N. Evidence of Episodic Long-Lived Eruptions in the Yuma, Ginsburg, Jesús Baraza and Tasyo Mud Volcanoes, Gulf of Cádiz. Geo Mar. Lett. 2016, 36, 197–214. [Google Scholar] [CrossRef]
  59. Carvalho, L.; Monteiro, R.; Figueira, P.; Mieiro, C.; Almeida, J.; Pereira, E.; Magalhães, V.; Pinheiro, L.; Vale, C. Vertical Distribution of Major, Minor and Trace Elements in Sediments from Mud Volcanoes of the Gulf of Cadiz: Evidence of Cd, As and Ba Fronts in Upper Layers. Deep Sea Res. Part. I Oceanogr. Res. Pap. 2018, 131, 133–143. [Google Scholar] [CrossRef]
  60. Díaz-del-Río, V.; Somoza, L.; Martínez-Frias, J.; Mata, M.P.; Delgado, A.; Hernandez-Molina, F.J.; Lunar, R.; Martín-Rubí, J.A.; Maestro, A.; Fernández-Puga, M.C.; et al. Vast Fields of Hydrocarbon-Derived Carbonate Chimneys Related to the Accretionary Wedge/Olistostrome of the Gulf of Cádiz. Mar. Geol. 2003, 195. [Google Scholar] [CrossRef]
  61. Martín-Puertas, C.; Mata, M.P.; Fernández-Puga, M.C.; Díaz del Río, V.; Vázquez, J.T.; Somoza, L. A Comparative Mineralogical Study of Gas-Related Sediments of the Gulf of Cádiz. Geo Mar. Lett. 2007, 27. [Google Scholar] [CrossRef]
  62. Jackson, M.L. Soil Chemical Analysis—Advanced Course. In Soil Chemical Analysis: Advanced Course, 2nd ed.; M.L.Jackson: Madison, WI, USA, 1969. [Google Scholar]
  63. Huff, W.D. X-Ray Diffraction and the Identification and Analysis of Clay Minerals. Clays Clay Miner. 1990, 38, 448. [Google Scholar] [CrossRef]
  64. Moore, D.M.; Reynolds, R.C.J. X-Ray Diffraction and the Identification and Analysis of Clay Minerals, 2nd ed.; Oxford University Press: Oxford, UK, 1997. [Google Scholar]
  65. Arostegui, J.; Arroyo, X.; Nieto, F.; Bauluz, B. Evolution of Clays in Cretaceous Marly Series (Alava Block, Basque Cantabrian Basin, Spain): Diagenesis and Detrital Input Control. Minerals 2019, 9, 40. [Google Scholar] [CrossRef] [Green Version]
  66. Hervig, R.L. Boron Mineralogy, Petrology and Geochemistry. In Reviews in Mineralogy; American Mineralogist, Ed.; Mineralogical Society of America: Chantilly, VA, USA, 1996; Volume 33, pp. 789–800. [Google Scholar]
  67. Chaussidon, M.; Robert, F.; Mangin, D.; Hanon, P.; Rose, E.F. Analytical Procedures for the Measurement of Boron Isotope Compositions by Ion Microprobe in Meteorites and Mantle Rocks. Geostand. Geoanal. Res. 1997, 21, 7–17. [Google Scholar] [CrossRef]
  68. You, C.F.; Spivack, A.J.; Gieskes, J.M.; Martin, J.B.; Davisson, M.L. Boron Contents and Isotopic Compositions in Pore Waters: A New Approach to Determine Temperature Induced Artifacts—Geochemical Implications. Mar. Geol. 1996, 129, 351–361. [Google Scholar] [CrossRef]
  69. Hingston, F. Reactions between Boron and Clays. Soil Res. 1964, 2, 83–95. [Google Scholar] [CrossRef]
  70. Zhang, L.; Chan, L.-H.; Gieskes, J.M. Lithium Isotope Geochemistry of Pore Waters from Ocean Drilling Program Sites 918 and 919, Irminger Basin. Geochim. Cosmochim. Acta 1998, 62, 2437–2450. [Google Scholar] [CrossRef]
  71. Catanzaro, E. Boric Acid: Isotopic and Assay Standard Reference Materials; National Bureau of Standards Institute for Materials Research: Washington, DC, USA, 1970. [Google Scholar]
  72. Frisch, M.J.; Trucks, G.W.; Schlegel, H.B.; Frisch, M.J.; Trucks, G.W.; Schlegel, H.B.; Scuseria, G.E.; Robb, M.A.; Cheeseman, J.R.; Montgomery, J.A.; et al. Gaussian 03: Revision B.05. Available online: https://gaussian.com/g03citation/ (accessed on 1 January 2003).
  73. Soler, J.M.; Artacho, E.; Gale, J.D.; Garcia, A.; Junquera, J.; Ordejon, P.; Sanchez-Portal, D. The SIESTA Method for Ab Initio Order-N Materials Simulation. J. Phys. Condens. Matter 2002, 14, 2745–2779. [Google Scholar] [CrossRef] [Green Version]
  74. Perdew, J.P.; Ruzsinszky, A.; Csonka, G.I.; Vydrov, O.A.; Scuseria, G.E.; Constantin, L.A.; Zhou, X.; Burke, K. Restoring the Density-Gradient Expansion for Exchange in Solids and Surfaces. Phys. Rev. Lett. 2008, 100, 136406. [Google Scholar] [CrossRef] [Green Version]
  75. Troullier, N.; Martins, J. Efficient Pseudopotentials for Plane-Wave Calculations. Phys. Rev. B Condens. Matter 1991, 43, 1993–2006. [Google Scholar] [CrossRef]
  76. Hernández-Laguna, A.; Escamilla-Roa, E.; Timón, V.; Dove, M.T.; Sainz-Díaz, C.I. DFT Study of the Cation Arrangements in the Octahedral and Tetrahedral Sheets of Dioctahedral 2:1 Phyllosilicates. Phys. Chem. Miner. 2006, 33, 655–666. [Google Scholar] [CrossRef]
  77. Martos-Villa, R.; Guggenheim, S.; Mata, M.P.; Sainz-Díaz, C.I.; Nieto, F. Interaction of Methane Hydrate Complexes with Smectites: Experimental Results Compared to Molecular Models. Am. Mineral. 2014, 99. [Google Scholar] [CrossRef]
  78. Martos-Villa, R.; Francisco-Márquez, M.; Mata, M.P.; Sainz-Díaz, C.I. Crystal Structure, Stability and Spectroscopic Properties of Methane and CO2 Hydrates. J. Mol. Graph. Model. 2013, 44. [Google Scholar] [CrossRef]
  79. Martos-Villa, R.; Mata, M.P.; Sainz-Díaz, C.I. Characterization of CO2 and Mixed Methane/CO2 Hydrates Intercalated in Smectites by Means of Atomistic Calculations. J. Mol. Graph. Model. 2014, 49. [Google Scholar] [CrossRef]
  80. Ortega-Castro, J.; Hernández-Haro, N.; Hernández-Laguna, A.; Sainz-Díaz, C.I. DFT Calculation of Crystallographic Properties of Dioctahedral 2:1 Phyllosilicates. Clay Miner. 2008, 43, 351–361. [Google Scholar] [CrossRef]
  81. Tossell, J.A. Theoretical Studies on Aluminate and Sodium Aluminate Species in Models for Aqueous Solution: A1(OH)3, Al(OH)4-, and NaAl(OH)4. Am. Mineral. 1999, 84, 1641–1649. [Google Scholar] [CrossRef]
  82. Tossell, J.A. Boric Acid, “Carbonic” Acid, and N-Containing Oxyacids in Aqueous Solution: Ab Initio Studies of Structure, PKa, NMR Shifts, and Isotopic Fractionations. Geochim. Cosmochim. Acta 2005, 69, 5647–5658. [Google Scholar] [CrossRef]
  83. Lee, J.H.; Guggenheim, S. Single Crystal X-Ray Refinement of Pyrophyllite-1Tc. Am. Mineral. 1981, 66, 350–357. [Google Scholar]
  84. Sainz-Diaz, C.I.; Palin, E.J.; Hernández-Laguna, A.; Dove, M.T. Octahedral Cation Ordering of Illite and Smectite. Theoretical Exchange Potential Determination and Monte Carlo Simulations. Phys. Chem. Miner. 2003, 30, 382–392. [Google Scholar] [CrossRef]
  85. Ferrage, E.; Vidal, O.; Mosser-Ruck, R.; Cathelineau, M.; Cuadros, J. A Reinvestigation of Smectite Illitization in Experimental Hydrothermal Conditions: Results from X-Ray Diffraction and Transmission Electron Microscopy. Am. Mineral. 2011, 96, 207–223. [Google Scholar] [CrossRef]
  86. Velde, B. Clay Minerals: A Physico-Chemical Explanation of Their Occurrence; Velde, B., Ed.; Elsevier: Amsterdam, The Netherlands, 1985. [Google Scholar] [CrossRef]
  87. Arroyo Rey, X. Evolución de Las Esmectitas e Interestratificados I/S En La Serie Carbonatada Del Cretácico Superior Del Bloque Alavés. Implicaciones Sobre El Mecanismo de Illitización Durante La Diagénesis. Ph.D. Thesis, Universidad del País Vasco/Euskal Herriko Unibertsitatea, Bilbao, Spain, 2010. [Google Scholar]
  88. Applegarth, L.M.S.G.A.; Pye, C.C.; Cox, J.S.; Tremaine, P.R. Raman Spectroscopic and Ab Initio Investigation of Aqueous Boric Acid, Borate, and Polyborate Speciation from 25 to 80 °C. Ind. Eng. Chem. Res. 2017, 56, 13983–13996. [Google Scholar] [CrossRef]
  89. James Evans, R.; Rustad, J.R.; Casey, W.H. Calculating Geochemical Reaction Pathways—Exploration of the Inner-Sphere Water Exchange Mechanism in Al(H2O)63+(Aq) + NH2O with Ab Initio Calculations and Molecular Dynamics. J. Phys. Chem. A 2008, 112, 4125–4140. [Google Scholar] [CrossRef]
  90. Bylaska, E.J.; Valiev, M.; Rustad, J.R.; Weare, J.H. Structure and Dynamics of the Hydration Shells of the Al3+ Ion. J. Chem. Phys. 2007, 126, 104505. [Google Scholar] [CrossRef]
  91. Gualtieri, A.F. Accuracy of XRPD QPA Using the Combined Rietveld-RIR Method. J. Appl. Crystallogr. 2000, 33, 267–278. [Google Scholar] [CrossRef]
  92. Rustad, J.R.; Bylaska, E.J.; Jackson, V.E.; Dixon, D.A. Calculation of Boron-Isotope Fractionation between B(OH)3(Aq) and B(OH)4-(Aq). Geochim. Cosmochim. Acta 2010, 74, 2843–2850. [Google Scholar] [CrossRef]
  93. Burst, J.F. Diagenesis of Gulf Coast Clayey Sediments and Its Possible Relation to Petroleum Migration. AAPG Bull. 1969, 58, 553–554. [Google Scholar]
  94. Pollastro, R.M. Considerations and Applications of the Illite/Smectite Geothermometer in Hydrocarbon-Bearing Rocks of Miocene to Mississippian Age. Clays Clay Miner. 1993, 41, 119–133. [Google Scholar] [CrossRef]
  95. Hillier, S. Illite/Smectite Diagenesis in Devonian Lacustrine Mudrocks from Northern Scotland and Its Relationship to Organic Maturity Indicators. Clay Miner. 1989, 24, 181–196. [Google Scholar] [CrossRef]
  96. Hillier, S.; Mátyás, J.; Matter, A.; Vasseur, G. Illite/Smectite Diagenesis and Its Variable Correlation with Vitrinite Reflectance in the Pannonian Basin. Clays Clay Miner. 1995, 43, 174–183. [Google Scholar] [CrossRef]
  97. Bauluz, B.; Peacor, D.R.; Gonzalez Lopez, J.M. Transmission Electron Microscopy Study of Illitization in Pelites from the Iberian Range, Spain: Layer-by-Layer Replacement? Clays Clay Miner. 2000, 48, 374–384. [Google Scholar] [CrossRef]
  98. Huggett, J.M.; Cuadros, J. Low-Temperature Illitization of Smectite in the Late Eocene and Early Oligocene of the Isle of Wight (Hampshire Basin), U.K. Am. Mineral. 2005, 90, 1192–1202. [Google Scholar] [CrossRef]
  99. Clauer, N.; Williams, L.B.; Fallick, A.E. Genesis of Nanometric Illite Crystals Elucidated by Light-Element (Hydrogen, Lithium, Boron and Oxygen) Isotope Tracing, and K–Ar and Rb–Sr Dating. Chem. Geol. 2014, 383, 26–50. [Google Scholar] [CrossRef] [Green Version]
  100. Perry, E.A. Diagenesis and the Validity of the Boron Paleosalinity Technique. Am. J. Sci. 1972, 272, 150–160. [Google Scholar] [CrossRef]
  101. Kopf, A.; Deyhle, A. Back to the Roots: Boron Geochemistry of Mud Volcanoes and Its Implications for Mobilization Depth and Global B Cycling. Chem. Geol. 2002, 192, 195–210. [Google Scholar] [CrossRef]
  102. Sokol, E.V.; Kokh, S.N.; Kozmenko, O.A.; Lavrushin, V.Y.; Belogub, E.V.; Khvorov, P.V.; Kikvadze, O.E. Boron in an Onshore Mud Volcanic Environment: Case Study from the Kerch Peninsula, the Caucasus Continental Collision Zone. Chem. Geol. 2019, 525, 58–81. [Google Scholar] [CrossRef]
  103. Środoń, J.; Paszkowski, M. Role of Clays in the Diagenetic History of Nitrogen and Boron in the Carboniferous of Donbas (Ukraine). Clay Miner. 2011, 46, 561–582. [Google Scholar] [CrossRef]
  104. Lindgreen, H.; Drits, V.A.; Sakharov, B.A.; Salyn, A.L.; Wrang, P.; Dainyak, L.G. Illite-Smectite Structural Changes during Metamorphism in Black Cambrian Alum Shales from the Baltic Area. Am. Mineral. 2000, 85, 1223–1238. [Google Scholar] [CrossRef]
  105. Boudou, J.P.; Schimmelmann, A.; Ader, M.; Mastalerz, M.; Sebilo, M.; Gengembre, L. Organic Nitrogen Chemistry during Low-Grade Metamorphism. Geochim. Cosmochim. Acta 2008, 72, 1199–1221. [Google Scholar] [CrossRef] [Green Version]
  106. Ovsyannikov, D.O.; Sadekov, A.Y.; Kozlova, E.V. Rock Fragments from Mud Volcanic Deposits of the Gulf of Cadiz: An Insight into the Eocene-Pliocene Sedimentary Succession of the Basin. Mar. Geol. 2003, 195, 211–221. [Google Scholar] [CrossRef]
  107. Chamley, H.; Dunoyer De Segonzac, G.; Melieres, F. Clay Mineralogy of Upper Miocene Sediments of the Mediterranean Basin. In Deep Sea Drilling Project Reports and Publication; U.S. Government Publishing Office: Washington, DC, USA, 1978; Volume XLI, pp. 389–395. [Google Scholar] [CrossRef]
  108. Chamley, H. Geodynamic Control on Messinian Clay Sedimentation in the Central Mediterranean Sea. Geo Mar. Lett. 1989, 9, 179–184. [Google Scholar] [CrossRef]
  109. De Visser, J.P. Clay Mineral Stratigraphy of Miocene to Recent Marine Sediments in the Central Mediterranean. Geol. Ultraiect. 1992, 75, 1–243. [Google Scholar]
  110. Azzaro, E.; Bellanca, A.; Neri, R. Clay Mineral Studies of the Tripoli Formation (Lower Messinian), Sicily. Clay Miner. 1988, 23, 309–321. [Google Scholar] [CrossRef]
  111. Daoudi, L.; Rocha, F.; Ouajhain, B.; Dinis, J.L.; Chafiki, D.; Callapez, P. Palaeoenvironmental Significance of Clay Minerals in Upper Cenomanian–Turonian Sediments of the Western High Atlas Basin (Morocco). Clay Miner. 2008, 43, 615–630. [Google Scholar] [CrossRef]
  112. Van Den Berg, B.C.J.; Sierro, F.J.; Hilgen, F.J.; Flecker, R.; Larrasoaña, J.C.; Krijgsman, W.; Flores, J.A.; Mata, M.P.; Bellido Martín, E.; Civis, J.; et al. Astronomical Tuning for the Upper Messinian Spanish Atlantic Margin: Disentangling Basin Evolution, Climate Cyclicity and MOW. Glob. Planet. Chang. 2015. [Google Scholar] [CrossRef] [Green Version]
  113. Pérez-Asensio, J.N.; Larrasoaña, J.C.; Samankassou, E.; Sierro, F.J.; Garcia-Castellanos, D.; Jiménez-Moreno, G.; Salazar, Á.; Maria Salvany, J.; Ledesma, S.; Mata, M.P.; et al. Magnetobiochronology of Lower Pliocene Marine Sediments from the Lower Guadalquivir Basin: Insights into the Tectonic Evolution of the Strait of Gibraltar Area. GSA Bull. 2018. [Google Scholar] [CrossRef] [Green Version]
  114. Barnolas, A.; Larrasoaña, J.C.; Pujalte, V.; Schmitz, B.; Sierro, F.J.; Mata, M.P.; van den Berg, B.C.J.; Pérez-Asensio, J.N.; Salazar, Á.; Salvany, J.M.; et al. Alpine Foreland Basins. In The Geologiy of Iberia: A Geodynamic Approach; Quesada, C., Oliveira, J., Eds.; Springer: Cham, Switzerland, 2019; pp. 7–59. [Google Scholar] [CrossRef]
  115. Williams, L.; Hervig, R. Boron Isotope Composition of Coals: A Potential Tracer of Organic Contaminated Fluids. Appl. Geochem. 2004, 19, 1625–1636. [Google Scholar] [CrossRef]
  116. Williams, L.B.; Hervig, R.L.; Hutcheon, I. Boron Isotope Geochemistry during Diagenesis. Part II. Applications to Organic-Rich Sediments. Geochim. Cosmochim. Acta 2001, 65, 1783–1794. [Google Scholar] [CrossRef]
  117. Henry, P.; Le Pichon, X.; Lallemant, S.; Lance, S.; Martin, J.B.; Foucher, J.-P.; Fiala-Médioni, A.; Rostek, F.; Guilhaumou, N.; Pranal, V.; et al. Fluid Flow in and around a Mud Volcano Field Seaward of the Barbados Accretionary Wedge: Results from Manon Cruise. J. Geophys. Res. Solid Earth 1996, 101, 20297–20323. [Google Scholar] [CrossRef]
  118. Delisle, G.; Von Rad, U.; Andruleit, H.; Von Daniels, C.; Tabrez, A.; Inam, A. Active Mud Volcanoes On-And Offshore Eastern Makran, Pakistan. Int. J. Earth Sci. 2002, 91, 93–110. [Google Scholar] [CrossRef]
  119. Kopf, A.; Robertson, A.H.F.; Clennell, M.B.; Flecker, R. Mechanisms of Mud Extrusion on the Mediterranean Ridge Accretionary Complex. Geo Mar. Lett. 1998, 18, 97–114. [Google Scholar] [CrossRef]
  120. Clennell, M.B. The Mélanges of Sabah, Malaysia. Ph.D. Thesis, Royal Holloway, University of London, London, UK, 1992. [Google Scholar]
  121. Nuzzo, M.; Tomonaga, Y.; Schmidt, M.; Valadares, V.; Faber, E.; Piñero, E.; Reitz, A.; Haeckel, M.; Tyroller, L.; Godinho, E.; et al. Formation and Migration of Hydrocarbons in Deeply Buried Sediments of the Gulf of Cadiz Convergent Plate Boundary—Insights from the Hydrocarbon and Helium Isotope Geochemistry of Mud Volcano Fluids. Mar. Geol. 2019, 410, 56–69. [Google Scholar] [CrossRef]
  122. Pan, C.; Jiang, L.; Liu, J.; Zhang, S.; Zhu, G. The Effects of Calcite and Montmorillonite on Oil Cracking in Confined Pyrolysis Experiments. Org. Geochem. 2010, 41, 611–626. [Google Scholar] [CrossRef]
  123. Lei, H.; Shi, Y.; Guan, P.; Fang, X. Catalysis of Aluminosilicate Clay Minerals to the Formation of the Transitional Zone Gas. Sci. China Ser. D Earth Sci. 1997, 40, 130–136. [Google Scholar] [CrossRef]
Figure 1. Structural and bathymetrical map of the Gulf of Cádiz. The MVs investigated within this study are represented by triangles. Modified from [44].
Minerals 10 00651 g001
Figure 2. Example of deconvoluted XRD patterns calculated by MacDiff software in two representative samples: (a) M4 18-22 sample; and (b) M27 18-22 sample. Red line represents experimental glycolated XRD, blue lines are deconvoluted peaks and black line represents the sum of deconvoluted peaks. Deconvoluted peaks are represented in d values in Å noted above the peaks which allow the determination of R type and percent illite according to [64].
Minerals 10 00651 g002
Figure 3. TEM micrographs of the major phases present. Sme, Smectite; Kln, Kaolinite; Plg, Palygorskite; I/S, Illite–smectite interstratified. Samples: (a) M8 58-62; (b) M12 50-54; (c) C9 84-85; (d) C8 23-24; (e) M25 34-38; and (f) A2 48-50.
Minerals 10 00651 g003
Figure 4. Compositional variation of the smectites and I-S phases normalizing to 10 O atoms and 2 (OH) groups per structural formula. (a) K content vs. tetrahedral Al (AlIV); (b) Tetrahedral Aluminum (AlIV) vs. Fe content; (c) Tetrahedral Aluminum (AlIV) vs. Mg content; (d). Mg vs. Fe content; (e) Total Al (Al TOT) vs. Si content; (f) Layer charge vs Si.
Minerals 10 00651 g004
Figure 5. AEM chemical data of the smectite illitization process represented in a MR3–2R3–3R2 diagram [86]. MR3+: (Na+ + K+ + 2Ca2+ + 2Mg2+); 2R3+: (Al3+ + Fe3+ – MR3+)/2; 3R2+: (Fe2+ + Mg2+ + Mn2+)/3. Modified from [87].
Minerals 10 00651 g005
Figure 6. Optimized structures of the hydrated Al(OH)3 (a) and B(OH)3 (b) models. H, O, Al and B atoms are represented in light-gray, red, pink and orange, respectively. Water molecules are represented as sticks.
Minerals 10 00651 g006
Figure 7. Optimized crystal structure of: the Al-illite model (a); and the B-illite model (b). The H, O and K atoms are represented in light-gray, red and fuchsia, respectively. The Si, Al, Mg and B polygons are in yellow, pink, green and orange, respectively.
Minerals 10 00651 g007
Figure 8. Optimized crystal structures of montmorillonite with: interlayer B(OH)3 model (a); and montmorillonite with tetrahedral B and Si(OH)4 in the interlayer model (b). The H, O, K, Si, Al and B are represented in light-grey, red, fuchsia, pink and orange, respectively.
Minerals 10 00651 g008
Figure 9. Gulf of Cádiz bathymetric map modified from [60] showing mud volcanoes locations with B isotopes and abundances in each sample: (Left) Mannitol washed samples; and (Right) NH4Cl exchanged samples. Values in brackets are δ11B (‰), B content (ppm).
Minerals 10 00651 g009
Figure 10. Summary of data of B-isotope trends and fluid/rock interactions in sedimentary basins: white squares, fixed B in xc; gray triangles, total B mw samples; 1, 2, Barbados pore fluids and mud respectively [117]; 3, 4, Makran pore fluids and mud [118]; 5, 6, Mediterranean pore fluids and mud [119]; 7, 8, Malaysia pore fluids and mud [120]; and 9, 10, 11, Seawater, source rock kerogen and muscovite pods from Gulf of Mexico, respectively [24].
Minerals 10 00651 g010
Table 1. Geographical position of the MVs sampled in the framework of this study. All M3 samples correspond to a diapiric structure, not a mud volcano.
Mud VolcanoSamplesWater Depth (m)Location
Lat.Long.
DiapirM3 10-1460034°59′42.4″ N6°49′50.4″ W
MeknessM4 18-2269434°59′06.6″ N7°04′21.6″ W
AlmanzorM8 58-62144035°20′57.6″ N7°30′40.4″ W
PixieM12 66-70163935°20′13.2″ N7°50′38.4″ W
MVSeisM14 138-142161135°23′42.6″ N7°51′28.8″ W
GuadixM25 34-38143535°30′56.4″ N7°32′45.0″ W
CidM26 50-54133035°26′29.4″ N7°29′04.2″ W
BoabdilM27 18-22110635°25′49.2″ N7°10′45.0″ W
GazulM29 106-11041136°33′29.4″ N6°56′06.0″ W
AlboloteC3 32-3335336°34′27.2″ N6°52′46.6″ W
TarsisC4 36-3755036°29′17.4″ N7°14′39.9″ W
AnastasyaC7 38-39, A2 48-5045736°31′20.9″ N7°09′04.8″ W
AlmazánC9 84-85, A8 70-7183036°03′08.0″ N7°20′01.6″ W
AveiroC10 27-28106035°52′19.1″ N7°26′15.2″ W
FaroA14 26-3079536°05′31.8″ N7°23′44.4″ W
GadesA4 48-5091536°14′17.4″ N7°37′01.2″ W
Table 2. I-S peaks characteristic of the deconvoluted XRD patterns. Illite proportions were calculated following standard [64] procedures.
SampleR°2θ (001/002)/% Illite°2θ (002/003)/% Illite°Δ2θ/% Illite
M3 10-14R010.31/10%15.75/10%5.44/10%
R09.85/45%16.25/50%6.40/45%
R19.17/80%16.83/75%7.66/75%
Illite8.7817.618.93
M4 18-22R010.29/10%15.83/15%5.54/15%
R09.82/45%16.16/45%6.34/45%
R19.18/80%17.07/80%7.89/80%
Illite8.8317.518.68
M8 58-62R010.32/10%15.78/10%5.46/10%
R19.64/55%16.61/60%6.97/60%
Illite8.8417.728.88
M12 66-70R010.35/10%15.82/10%5.47/10%
R09.99/40%16.04/35%6.05/35%
R19.54/65%16.70/60%7.16/65%
R19.30/75%16.97/75%7.67/75%
Illite8.8917.738.84
M14 132-138R010.22/15%15.86/15%5.64/15%
R19.78/50%16.48/55%6.70/55%
R19.36/75%16.90/75%7.54/75%
Illite8.8217.568.74
M25 34-38R19.72/55%16.45/55%6.73/55%
R19.16/80%17.04/80%7.88/80%
Illite8.7317.718.98
M26 50-54R010.23/15%15.82/15%5.59/15%
R19.74/55%16.44/55%6.70/55%
Illite8.7917.658.86
M27 18-22R010.17/25%15.96/25%5.79/25%
R19.68/55%16.40/55%6.72/55%
R19.22/75%16.85/75%7.63/75%
Illite8.8317.538.70
M29 106-110R010.05/30%15.99/30%5.94/30%
R19.74/55%16.32/55%6.58/55%
R19.19/80%17.11/80%7.92/80%
Illite8.8617.828.96
C3 32-33R010.30/10%15.80/10%5.50/10%
R09.76/50%16.28/50%6.52/50%
Illite8.8717.818.94
C4 36-37R010.09/30%15.97/25%5.88/25%
R19.81/45%16.29/50%6.48/50%
Illite8.8417.748.9
C7 36-37R010.06/30%15.98/25%5.92/30%
R19.55/60%16.58/60%7.03/60%
Illite8.9217.748.82
C8 23-24R010.07/30%15.99/30%5.92/30%
R19.68/55%16.52/55%6.84/55%
Illite8.9717.698.72
C9 84-85R010.28/15%15.84/15%5.56/15%
R19.67/55%16.46/55%6.79/55%
Illite8.8717.758.88
C10 27-28R19.18/80%17.06/80%7.88/80%
Illite8.8717.818.94
A2 48-50R010.22/20%15.83/20%5.61/20%
R09.81/50%16.35/50%6.54/50%
R19.31/75%16.92/75%7.61/75%
Illite8.8117.698.88
A4 48-50R010.08/30%15.98/25%5.90/30%
R19.66/55%16.47/55%6.81/55%
R19.33/75%17.04/80%7.71/75%
Illite8.9017.808.90
A8 110-111R09.77/50%16.19/45%6.42/45%
Illite8.8417.788.94
A14 26-30R09.94/40%16.12/40%6.18/40%
Illite8.7917.368.57
Table 3. Cell parameters and select interatomic distances of Al-illite and B-illite unit cells (distances in Å and angles in °).
FeaturesExp aAl-illiteB-Illite
a5.225.245.24
b9.029.109.08
c10.0710.0910.08
d(001)10.0210.0210.03
α90.0101.1101.1
β95.795.895.9
γ90.089.989.9
d(Si-O)1.651.671.67
d(B-O) 1.48
d(AlVI-O)1.961.951.94
d(O-H) 0.970.97
a XRD experimental data [91].
Table 4. Interatomic distances of hydrated Al(OH)3 and B(OH)3 models (distances in Å and angles in °).
Average Features
Hydrated Al(OH)3 ModelHydrated B(OH)3 Model
d(Al-O)1.75d(B-O)1.37
d(O-H)1.01d(O-H)1.01
α(Al-O-H)120.11α(B-O-H)110.83
d(Hw-Ow)1.05d(Hw-Ow)1.05
d(Hw…Ow)1.50d(Hw…Ow)1.55
d(HAl…Ow)1.76d(HB…Ow)1.67
Table 5. Boron isotope analysis. mw, Mannitol washed samples; xc, NH4Cl exchanged samples. Standard IMt-1 is analyzed to determine IMF for each analytical session. This value is subtracted from the delta value. SE is standard error of the average. PE is predicted error, which is the best possible error based on counting statistics.
SamplePreparation 11/10IMFδ11BSE ‰PE ‰nB (ppm)
M3 10-14mw39.192−27.8−31.00.93142
xc39.151−27.8−40.30.83132
M4 18-22mw39.139−27.8−4.30.61.03104
xc39.090−27.8−5.50.50.5288
M8 58-62mw39.568−27.86.32.01.4396
xc39.361−27.81.20.50.4282
M12 66-70mw39.163−27.8−3.70.90.5299
xc39.115−27.8−4.90.10.6289
M14 138-142mw39.030−27.8−70.10.62105
xc38.965−27.8−8.60.50.52102
M25 34-38mw39.305−24.6−3.40.60.42137
xc39.192−24.6−6.20.60.42134
M26 50-54mw39.224−24.6−5.40.60.32101
xc39.204−24.6−5.90.50.4294
M27 18-22mw39.442−24.600.70.32146
xc39.236−24.6−5.10.80.42141
M29 106-110mw39.337−24.6−2.60.50.32132
xc39.171−24.6−6.70.60.32122
C3 32-33mw39.685−24.660.60.32126
xc39.657−24.65.30.80.52115
C4 36-37mw39.644−24.650.70.52113
xc39.499−24.61.40.60.42103
C7 38-39mw39.309−24.6−3.30.60.42120
xc39.058−24.6−9.50.60.42113
C8 23-24mw39.596−24.63.80.90.52163
xc39.297−24.6−3.60.70.42145
C9 84-85mw39.220−31.81.70.50.4297
xc39.050−31.8−2.50.50.4296
C10 27-28mw39.001−31.8−3.70.60.42137
xc38.892−31.8−6.40.70.42121
A2 48-50mw38.908−31.8−60.70.42139
xc38.840−31.8−7.70.80.42138
A4 48-50mw38.913−31.8−5.90.80.42129
xc38.638−31.8−12.70.80.42117
A8 110-111mw39.446−31.87.30.80.42111
xc39.200−31.81.20.70.42110
A14 26-30mw39.628−31.811.80.70.52125
xc39.240−31.82.20.70.42122

