Carbide to Graphite Transition Control by Thermal Analysis in Grey Cast Irons

Faculty of Materials Science and Engineering, Politehnica University of Bucharest, 313 Spl. Independentei, 060042 Bucharest, Romania
*
Author to whom correspondence should be addressed.
Metals 2020, 10(8), 993; https://doi.org/10.3390/met10080993
Submission received: 1 July 2020
/
Revised: 10 July 2020
/
Accepted: 17 July 2020
/
Published: 23 July 2020
(This article belongs to the Special Issue Solidification and Crystallization of Foundry Alloys)
Abstract
:The present work compared the solidification pattern of un-inoculated and inoculated hypoeutectic grey cast irons (3.7–3.8% CE), focused on carbide to graphite formation transition, by the use of an adequate experimental technique, able to measure real stable (Tst) and metastable (Tmst) eutectic temperatures. Have been used three ceramic cups for investigating thermal analysis: (i) for normal solidification; (ii) with addition of Te for Tmst measurement; (iii) with more inoculant addition for Tst measurement. As a general rule, measured values appear to be lower compared with calculated values (as chemical composition effects), with an average difference at 14.4 °C for Tst and 8.3 °C for Tmst. It is found a good relationship between the undercooling degree at the lowest eutectic temperature (ΔT1) and at the end of solidification (ΔT3), reported to measured Tmst. The free carbides formation (chill tendency) is in good relationship with the undercooling degree during the eutectic reaction, reported to measured Tmst, especially for thin and medium wall thickness castings. The real measured Tmst instead of calculated Tmst is compulsory for the thin wall castings production, very sensitive to carbides to graphite transition. In the present experimental conditions, no visible relationship appears to be between chill tendency and undercooling at the end of solidification (ΔT3).
1. Introduction
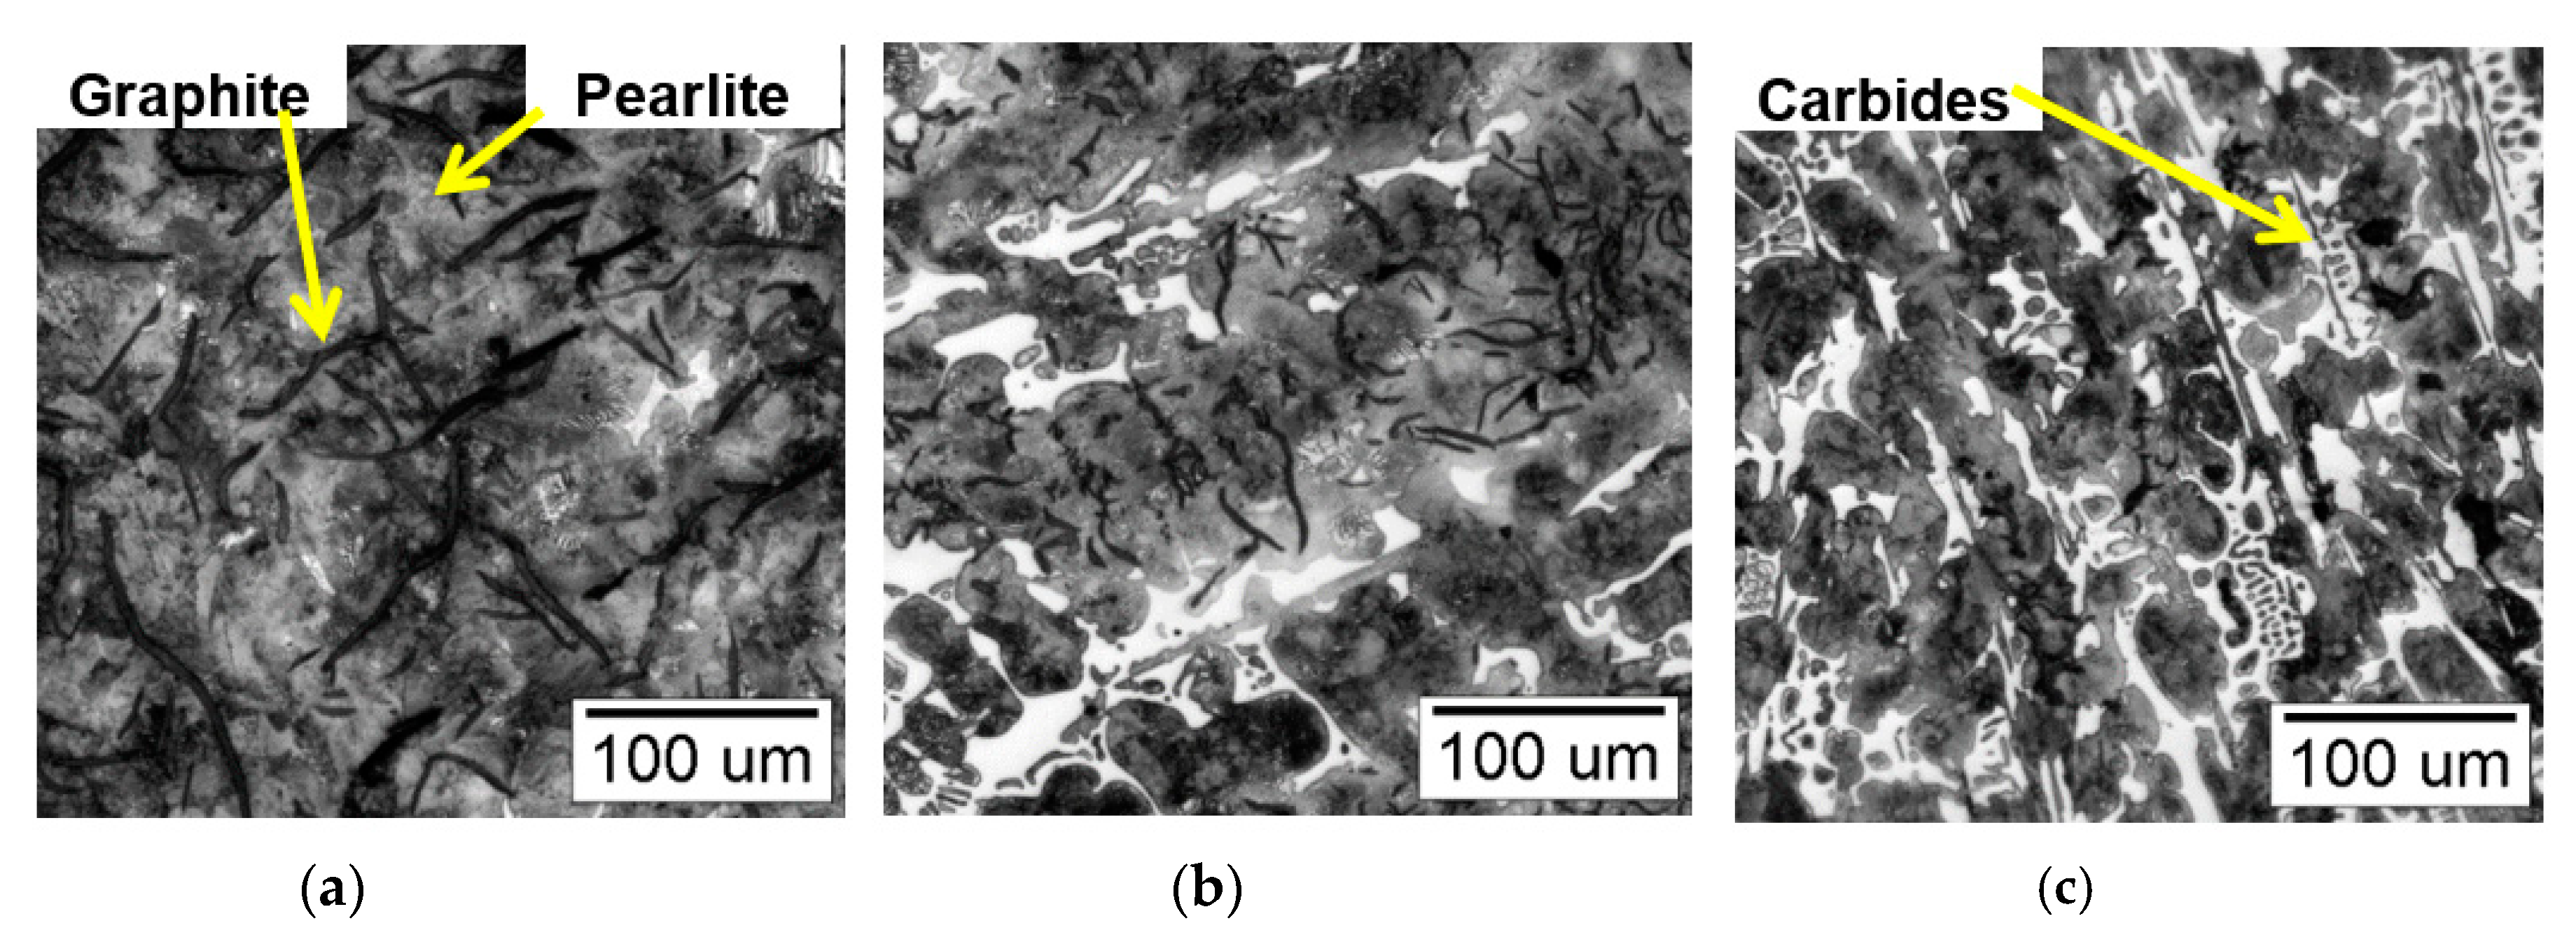
Commercial cast iron is a typical multi-phase, natural metal matrix composite, including a ferrous matrix and graphite, carbides, phosphides, sulphides, nitrides etc. Figure 1 illustrates typical structures with different carbide/graphite ratios. Cementite, an iron carbide ((Fe, X)3C) usually alloyed with other elements (X = Cr, Mn, V, Mo, Ti, Nb etc.) has the highest hardness (~660 HB), whilst graphite is a relatively soft, low density material. Cementite promotes hardness and wear resistance, but negatively affects machinability, strength, ductility, toughness and thermal properties of the as-cast structure.
Transition from carbide to graphite formation is usually the target of cast iron production, especially for thin wall castings (such as for the automotive industry), and this objective is usually obtained by cast iron inoculation.
Inoculation is a graphitizing treatment of the molten iron, in order to obtain an as-cast structure without carbides and with high quality graphite shape. Generally, this treatment is applied to forestall solidification at excessive eutectic undercooling degree, favourable for carbides occurrence or/and undesired graphite morphologies, such as D-type lamellar graphite. FeSiAlX alloys including inoculating elements, such as Ca, Ba, Sr, Zr, Ce, La etc act to promote and participate in the creation of micron sized active compounds in the iron melt, to act as effective graphite nucleation sites.
The well inoculated iron undergoes less eutectic undercooling, as a result of the improvement to existing nucleation sites or by new nucleation sites developing. It was found that the increasing of the solidification cooling rate from the base up to the apex of wedges test samples led to graphite to carbide transition, more visible for lower cooling modulus castings (from W3 up to W1 ASTM A 367), and especially for un-inoculated cast irons [1,2].
Generally, carbides formation in cast irons must be avoided. Iron castings without carbides or with strong controlled carbide/graphite ratio in the structure represent more than 90% of the total iron castings worldwide produced. From the formation energy point of view, carbides are favoured, so graphite presence in the structure must be sustained. There are different possibilities to attend this target, including adequate charge materials and chemical compositions of the base iron, optimum melting procedure, efficient inoculation treatment, controlled pouring parameters, adequate moulding system etc. The problem is to have a control on the solidification potential of the cast irons and to predict its behaviour, including carbide to graphite transition, before the castings are produced.
Thermal analysis, based on the recorded cooling curves and their derivatives is one of the most effective technique, with a large industrial application, in control of solidification process in production of all of metallic castings, such as for aluminium alloys [3,4,5,6,7,8,9,10,11,12,13,14,15,16], copper alloys [3,17], zinc alloys [18], steel [19,20,21,22] and cast irons [1,8,23,24,25,26,27,28,29,30,31,32,33]. Thermal analysis is also applied on solid state evaluation of the structure characteristics of other special metallic materials, as effects of different influencing factors, such as heat treatment and quenching media on the CuAlFeMn quaternary shape memory alloy [34].
A high number of research programs are recorded, in laboratory and plant trials, in order to elucidate the problems, to better define usual applied parameters, to find other useful parameters, to connect thermal analysis parameters to practical castings properties, etc. At the moment, a lot of cast iron foundries in the world use this analysis technique, with rapid obtained results, which decide if the iron is well prepared for castings or it must be rejected (with lost money). In many cases only one thermal analysis is made, and the results indicating the acceptance or rejection of the batch, even though the result may not be reliable.
In cast iron solidification process, cooling curve and its derivatives analysis is generally used to identify the representative events which occur from the first solid state phase formation (primary austenite or graphite), through eutectic reaction (the start of eutectic nucleation, the lowest eutectic temperature and the highest eutectic temperature) up to the end of solidification. A large volume of information could be obtained, to predict carbides or graphite formation, graphite morphologies (inclusively peculiar forms for each type of graphite-lamellar, compacted or nodular), eutectic cells characteristics (size, count, distribution), inter-cells phases which are typically present at the end of solidification, but also expected mechanical properties.
The measured representative temperatures on the cooling curves must be reported to equilibrium eutectic temperatures, in both stable (graphitic) (Tst) and metastable (carbidic) (Tmst) systems. As Tst > Tmst and ΔTs = Tst − Tmst interval generally varied in 5–50 °C range, depending on a large number of factors, it is very important to identify the real position of the cooling curve in this interval. And also, the difference between the representative temperatures and eutectic temperatures Tst or Tmst, considered as undercooling in commercial irons, non-equilibrium solidified. Traditionally, these temperatures are simple calculated depending on the total chemical composition of the tested cast iron, or only silicon content, the most important influencing factor in this respect. For general application conditions this solution to establish Tst and Tmst is acceptable, but for critical solidification conditions, in iron castings production, it is not enough.
The main objective of the present work was to compare the solidification pattern of un-inoculated and inoculated hypoeutectic grey cast irons, focused on carbide to graphite formation transition, by the use of an adequate experimental technique, able to measure real Tst and Tmst eutectic temperatures, and their evaluation referring to the calculated temperatures. It was tested the possible relationship between the solidification under-cooling degrees and chill (carbide) sensitiveness, at different iron castings solidification conditions.
2. Materials and Methods
The present paper is designed to check the level of thermal analysis parameters variations, in apparently similar casting conditions. For this reason, it is paid attention on the deeply chemical characterization of the experimental irons, with 5 time repeating of the melting, for the same charge materials make-up. In this respect, the base pig iron was prepared in a coreless induction furnace (acid lining, 150 kg capacity, 1000 Hz, 155 KW) from selected steel scrap, graphitic re-carburizer, low aluminium ferrosilicon and FeMn, in order to ensure a control on the test irons, obtained by re-melting of this primary iron in a smaller coreless induction furnace (graphite crucible induction furnace, 10 kg, 8000 Hz), in the same conditions. Each heat was controlled to ensure similar thermal and chemistry history.
The target was to obtain more experimental data, in relatively the same production conditions, typically for industrial applications. Average values were used, but also the range of variation of different parameters was also considered, to evaluate their peculiar sensitiveness to possible external influencing factors.
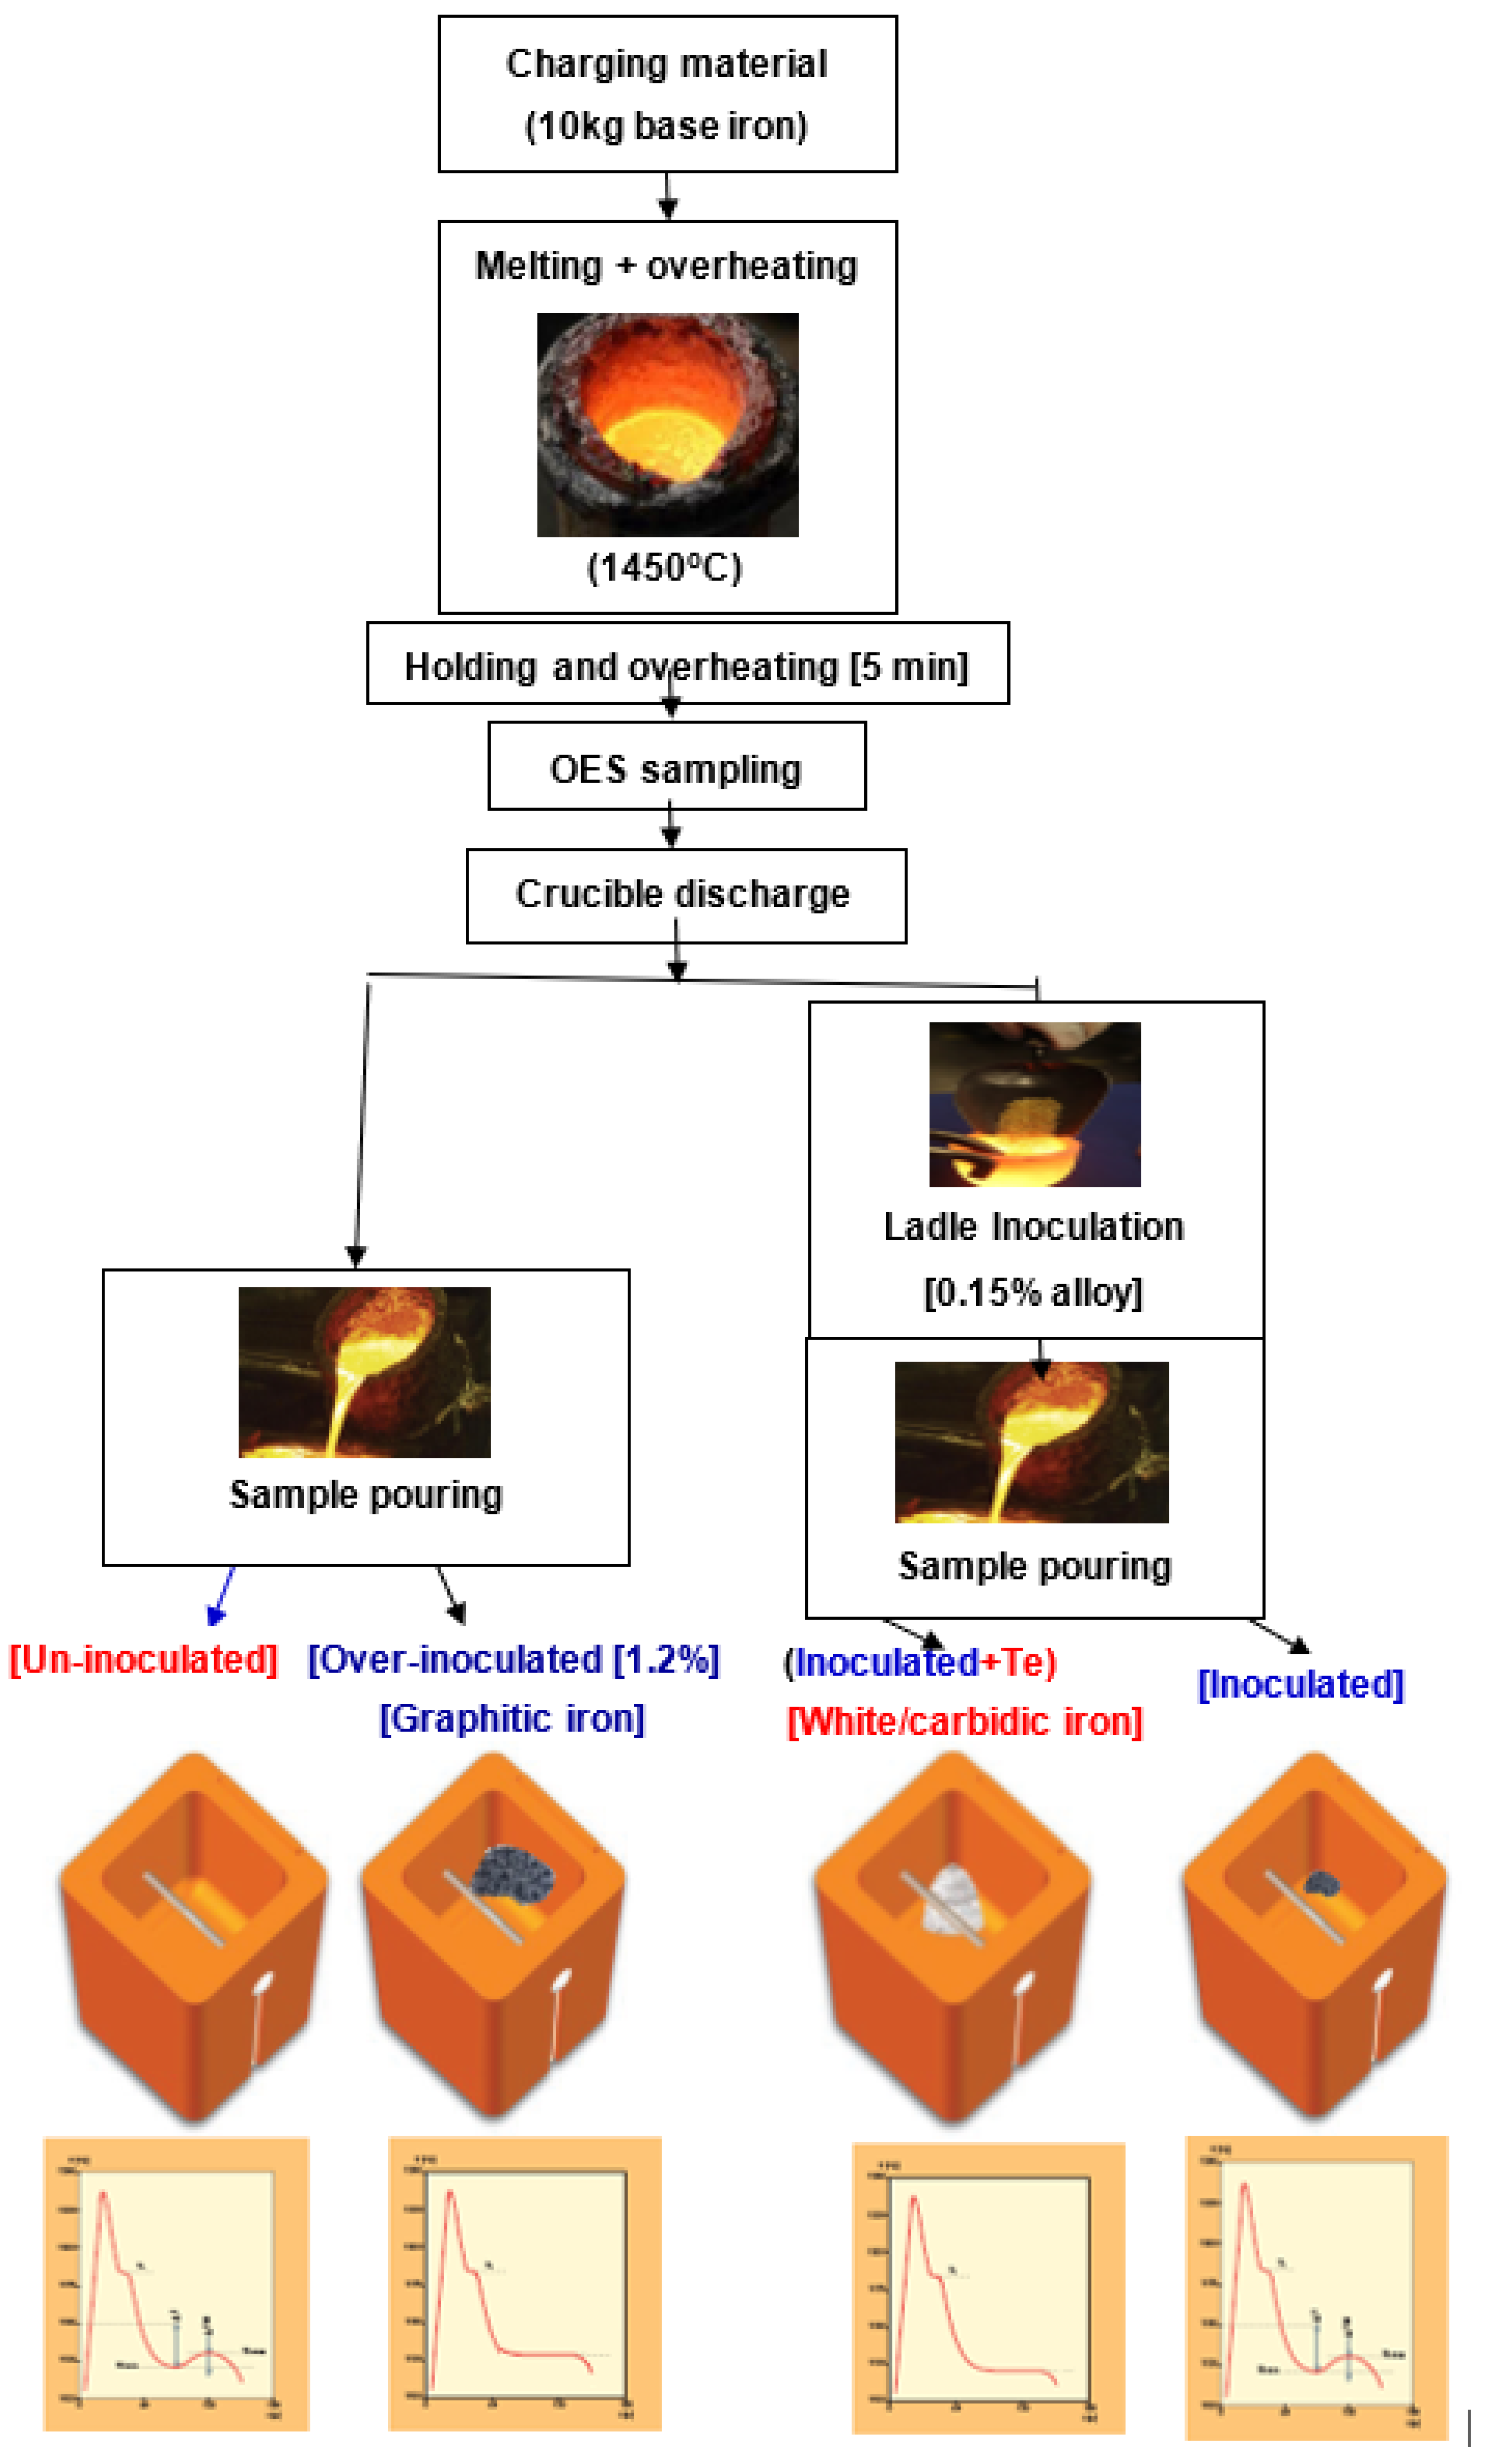
After a heating at 1470 °C and holding at this temperature for 5 min, in the melting furnace, the base iron was tapped at 1460 °C in the pouring ladle (1450 °C), also used as inoculation recipient (10 kg capacity). The temperature was measured by Digilance IV Heraeus Electro-nite apparatus (Heraeus Electro-nite International, Houthalen, Belgium) including a multi-immersion thermocouple type. 0.15 wt.% Sr-FeSi alloy (73–78%Si, max. 0.1%Ca, max. 0.5%Al, 0.6–1.0%Sr, Fe-bal) was used as the inoculant, at 0.2–0.7 mm particle size range, and Sr as representative inoculating element in grey cast irons. Table 1 and Figure 2 illustrate the experimental schedule of the work, for applied thermal (cooling curve) analysis according to [35].
Chill (carbide formation sensitiveness) evaluation was recorded by the use of wedges samples W1, W2 and W3, defined by ASTM A 367 (Table 2) [1,2], cast in furan resin mould. Two wedge samples, at the same type, were cast for each experimental heat. The weight of wedge samples, checked after the shakeout, was included in the following range: 51–59 g and 55.8 g as the average for W1, 121–147 g and 132.9 g, as the average for W2, and 263–274 g and 271.2 g the as average for W3, respectively. Cooling modulus is defined by volume to total external area ratio.
Fractures of wedge samples were analysed, for evaluation of clear chill (CC, that portion nearest the apex, entirely free of grey areas) and total chill (TC, the region from the junction of grey fracture to the first appearance of chilled iron). The average value of the two wedge samples measurements was considered.
As Table 1 and Figure 2 show, it was designed an experimental program to consider some important possible foundry situations in grey iron castings production, such as un-inoculation and normal inoculation, and excessive/over inoculation or inoculation followed by a strong anti-graphitizing factor application (tellurium (Te) in this case).
Un-inoculated iron [A], ladle inoculated with 0.15% alloy iron [B], Te-added in the ceramic cup for normal ladle inoculated iron [C], and over-inoculation with 1.2% alloy in the ceramic cup of the base iron [D] were the experimental variants subjected to thermal analysis.
The solidification process was investigated by Quick-cupTM cooling curve analysis [35], with thermocouple included in a ceramic cup (see Figure 2) having a cooling modulus of approximately 7.5 mm (equivalent to 30 mm diameter bar). The average weight of cast iron samples obtained in ceramic cups was included in the 348–363 g range.
The three cups thermal analysis system was created by a Japanese company and applied by Kimura Foundry Group in Japan, to measure Tst and Tmst equilibrium temperatures, in stable and metastable systems [36,37]. The present paper compares all of the cooling curves and their first derivative parameters, for the considered experimental variants, offering a larger scale of information, especially on the two extreme experimented conditions.
Chemical composition is evaluated for un-inoculated and normal (0.15% alloy) inoculated irons, for all of the tested iron melt heats. In this respect, it is used OES–Optical Emission Spectroscopy (SPECTROLAB M 10, Hybrid Optic) capable of determining very low levels of minor active elements. Samples (34–35 mm diameter, 3.7–3.9 mm thickness, 25.7–26.8 g weight) have been cast in metal mould.
3. Results and Discussion
3.1. Chemical Composition
The present paper is designed to check the level of variation of the thermal analysis parameters, in apparently similar casting conditions. For this reason, it was paid attention on the deeply chemical characterization of the experimental irons (including 26 checked elements and three control factors), with five times repetition of the melting, for the same charge materials make-up. Table 3 shows the base chemical composition of test cast irons. Other found elements (wt.%): 0.0010–0.0011 Al, 0.00045–0.00069 Zr, 0.0125–0.0135 Ti, 0.005–0.015 N, 0.045–0.047 Cr, 0.042–0.043 Ni, 0.053–0.055 Cu, 0.009–0.012 Mo, 0.0039–0.0043 V, 0.0042–0.0043 Sn, 0.00040–0.00063 Sb, 0.0029–0.0031 As, 0.0019–0.0021 Bi, <0.0002 Pb, 0.0040–0.0045 Co, 0.0055–0.0060 Nb, <0.0002 W, <0.0008 Te, 0.0009–0.010 B, 0.0007–0.0009 Zn, <0.0001 La.
It is demonstrated that a cast iron foundry is expected to obtain a variation in the chemistry in apparently similar working conditions. Only the base elements, such as carbon, silicon, manganese, phosphorus and sulphur, usually reported, is not enough for a real evaluation of the solidification process in the cast iron field, in industrial conditions. Two complex chemistry control factors were used: carbon equivalent CE, Equation (1) and pearlitic influencing factor Px, Equation (2) according to Thielemann work [38]. The mentioned work refers to ductile iron, but it is also useful in grey cast iron field, to illustrate the effects of a complex chemical composition on the carbon solubility in the iron melt or on the pearlite formation sensitivity, respectively.
CE (%) = C (%) + 0.31 (%Si) − 0.027 (%Mn) + 0.33 (%P) + 0.40 (%S) − 0.063 (%Cr) − 0.015 (%Mo) + 0.053 (%Ni) + 0.22 (%Al) + 0.026 (%Co) + 0.074 (%Cu) − 0.135 (%V) + 0.11 (%Sn) + 0.115 (%Sb)
Px = 3.0 (%Mn) − 2.65 (%Si − 2.0) + 7.75 (%Cu) + 90 (%Sn) + 357 (%Pb) + 333(%Bi) + 20.1 (%As) + 9.60(%Cr) + 71.7 (%Sb)
According to the general carbon equivalent range (CE = 3.7–3.8%), the experimental cast irons are characterized by a hypo-eutectic position (CE < 4.3%), commonly used for industrial applications. Intentionally the tested grey cast irons were designed in critical solidification conditions, as low manganese and very low sulphur content, typically for actual electric melting conditions, in the foundries which simultaneously produce grey [lamellar graphite] and ductile [nodular graphite] cast irons. As result, (%Mn) × (%S) < 0.01, comparing to 0.03–0.06 beneficial level for grey cast iron, to promote smaller values of undercooling.
This critical solidification position is also strengthened by very low content of residual aluminium and zirconium, found as active elements in the first step of (Mn,X)S compounds formation, major graphite nucleation sites in commercial grey cast irons [25,26,27,28,39,40,41]. Chemical composition is also characterized by limited excessive manganese content (ΔMn < 0.2), free carbides formation promoter. Usual content of titanium and nitrogen characterizes tested cast irons. The base chemical composition and minor elements show graphitizing or anti-graphitizing effects, promoting graphite or carbides, and also, they could have ferritic or pearlitic effects, at high significance for castings properties. Pearlitic factor Px [38] is typically at 5.0–5.5 level, according to low silicon content and very low minor elements content, for manganese at low limit in grey cast irons.
3.2. Thermal (Cooling Curve) Analysis Parameters
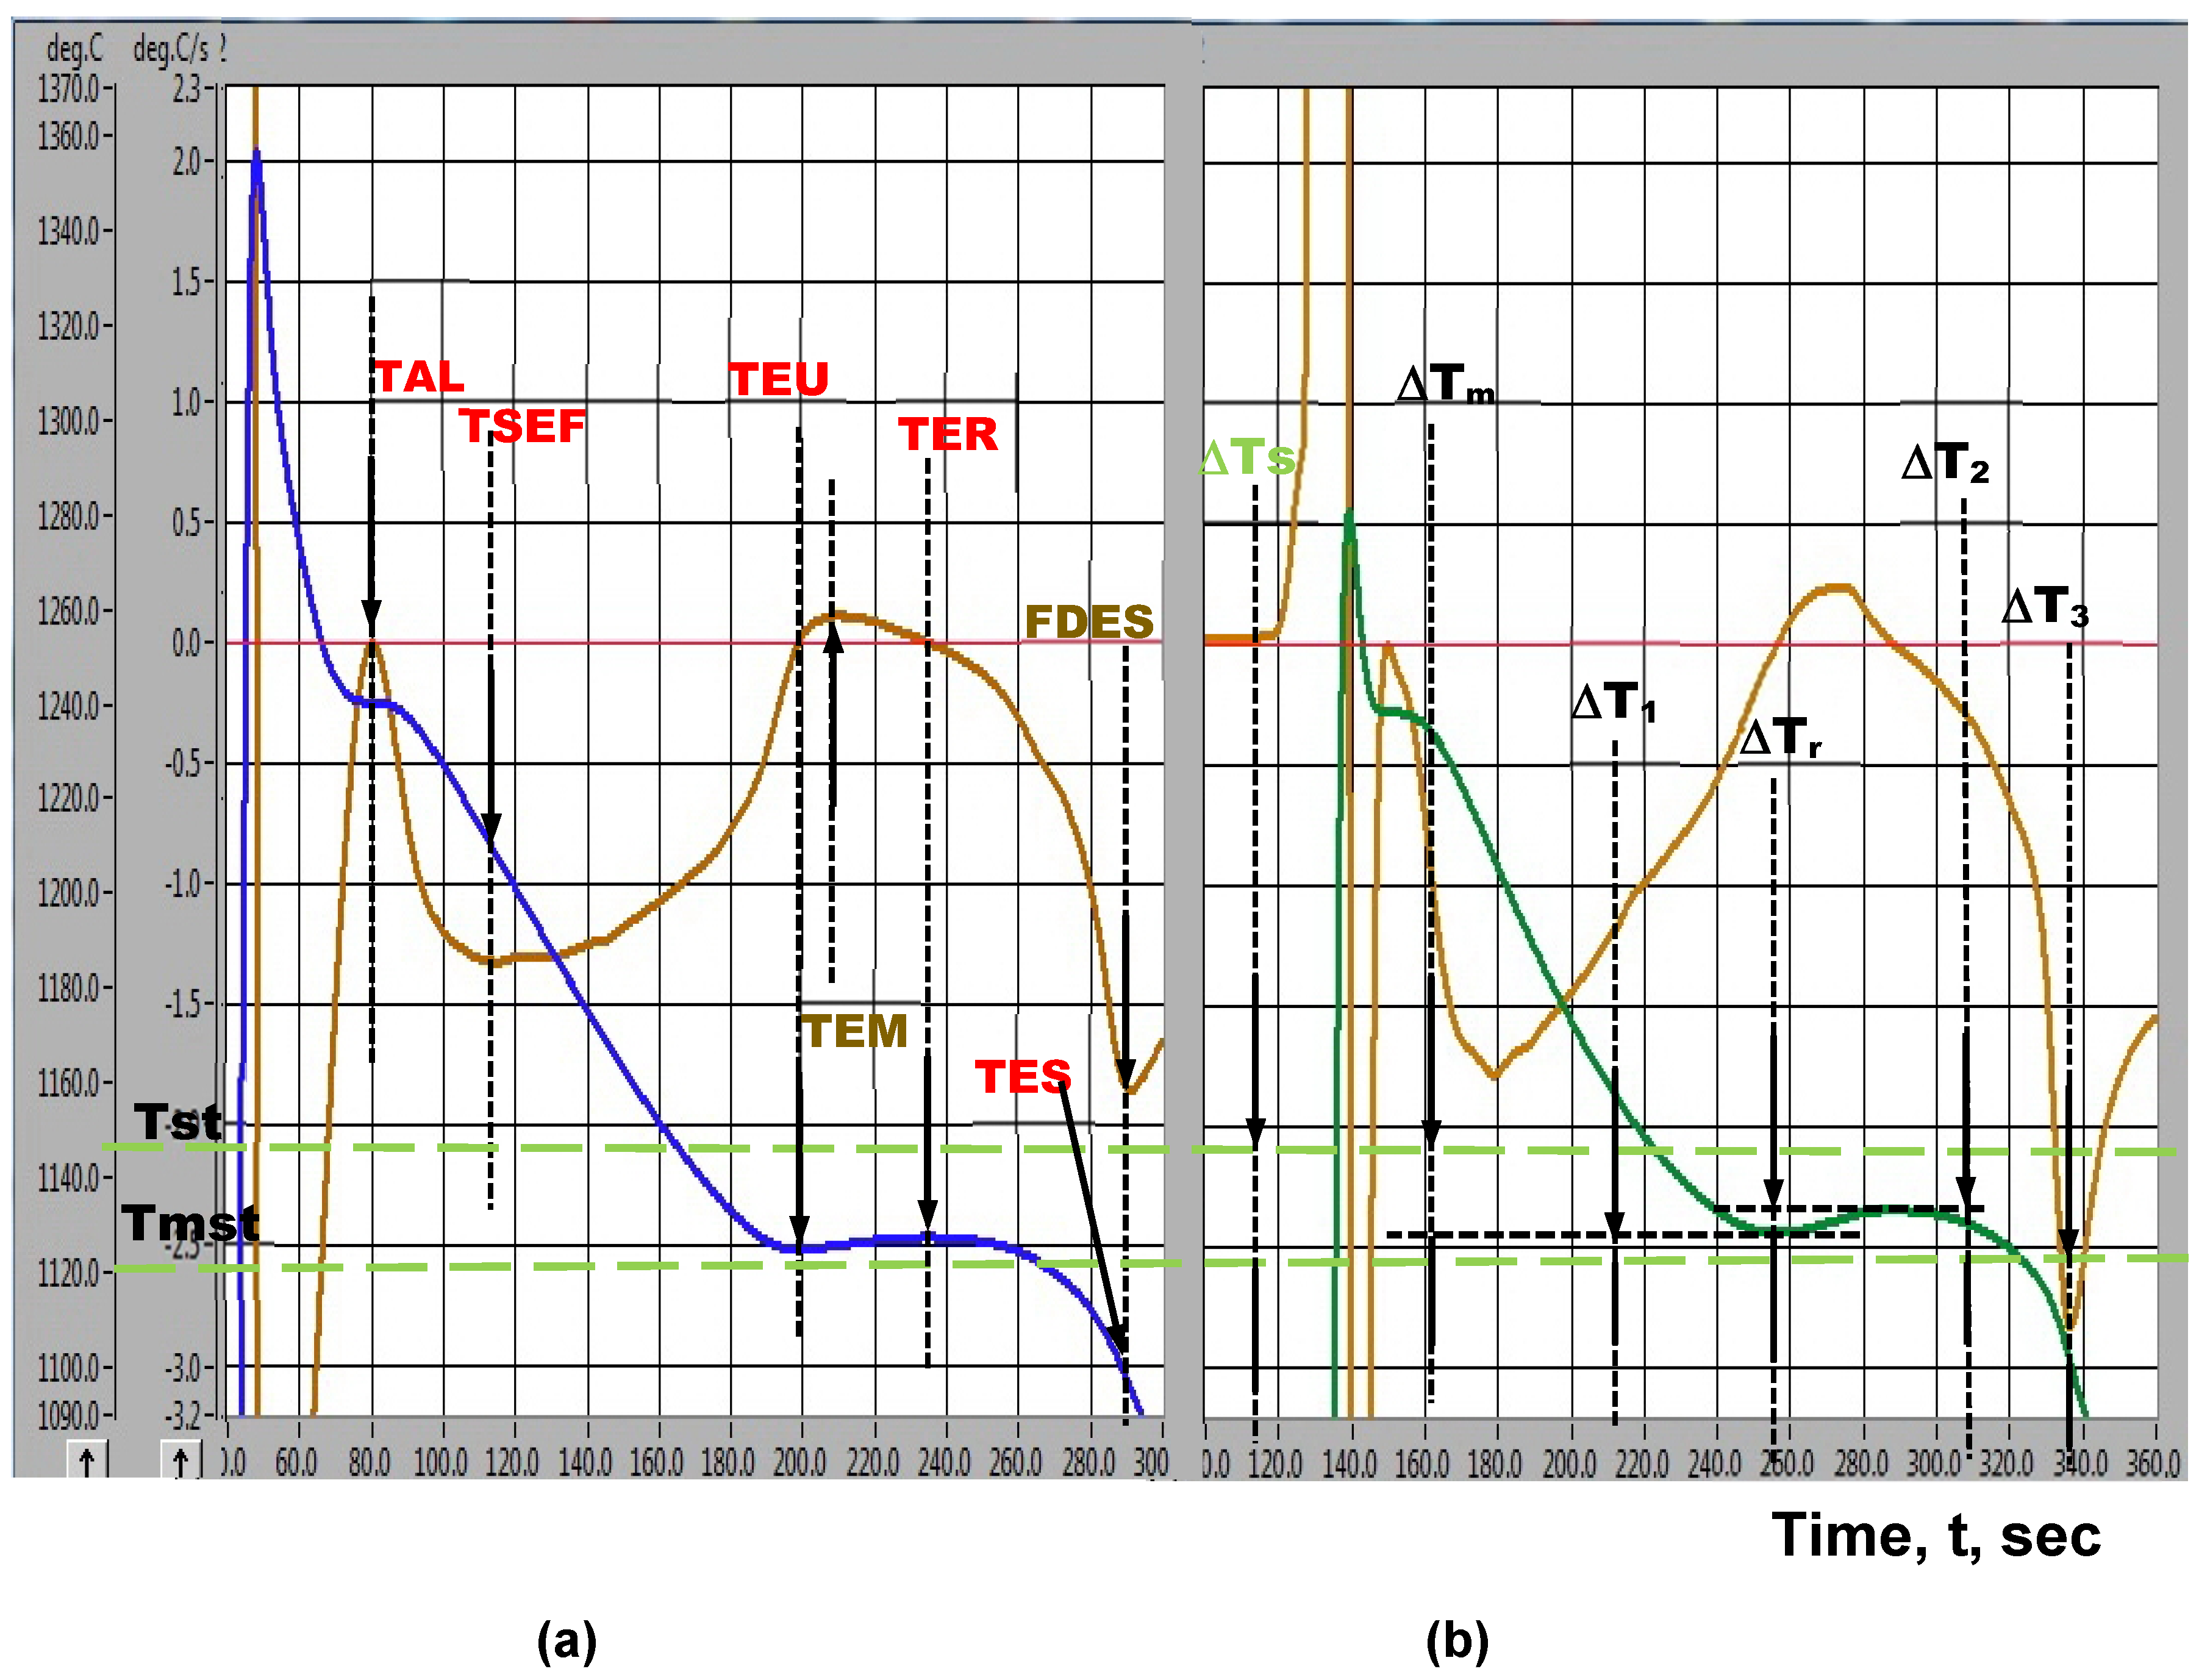
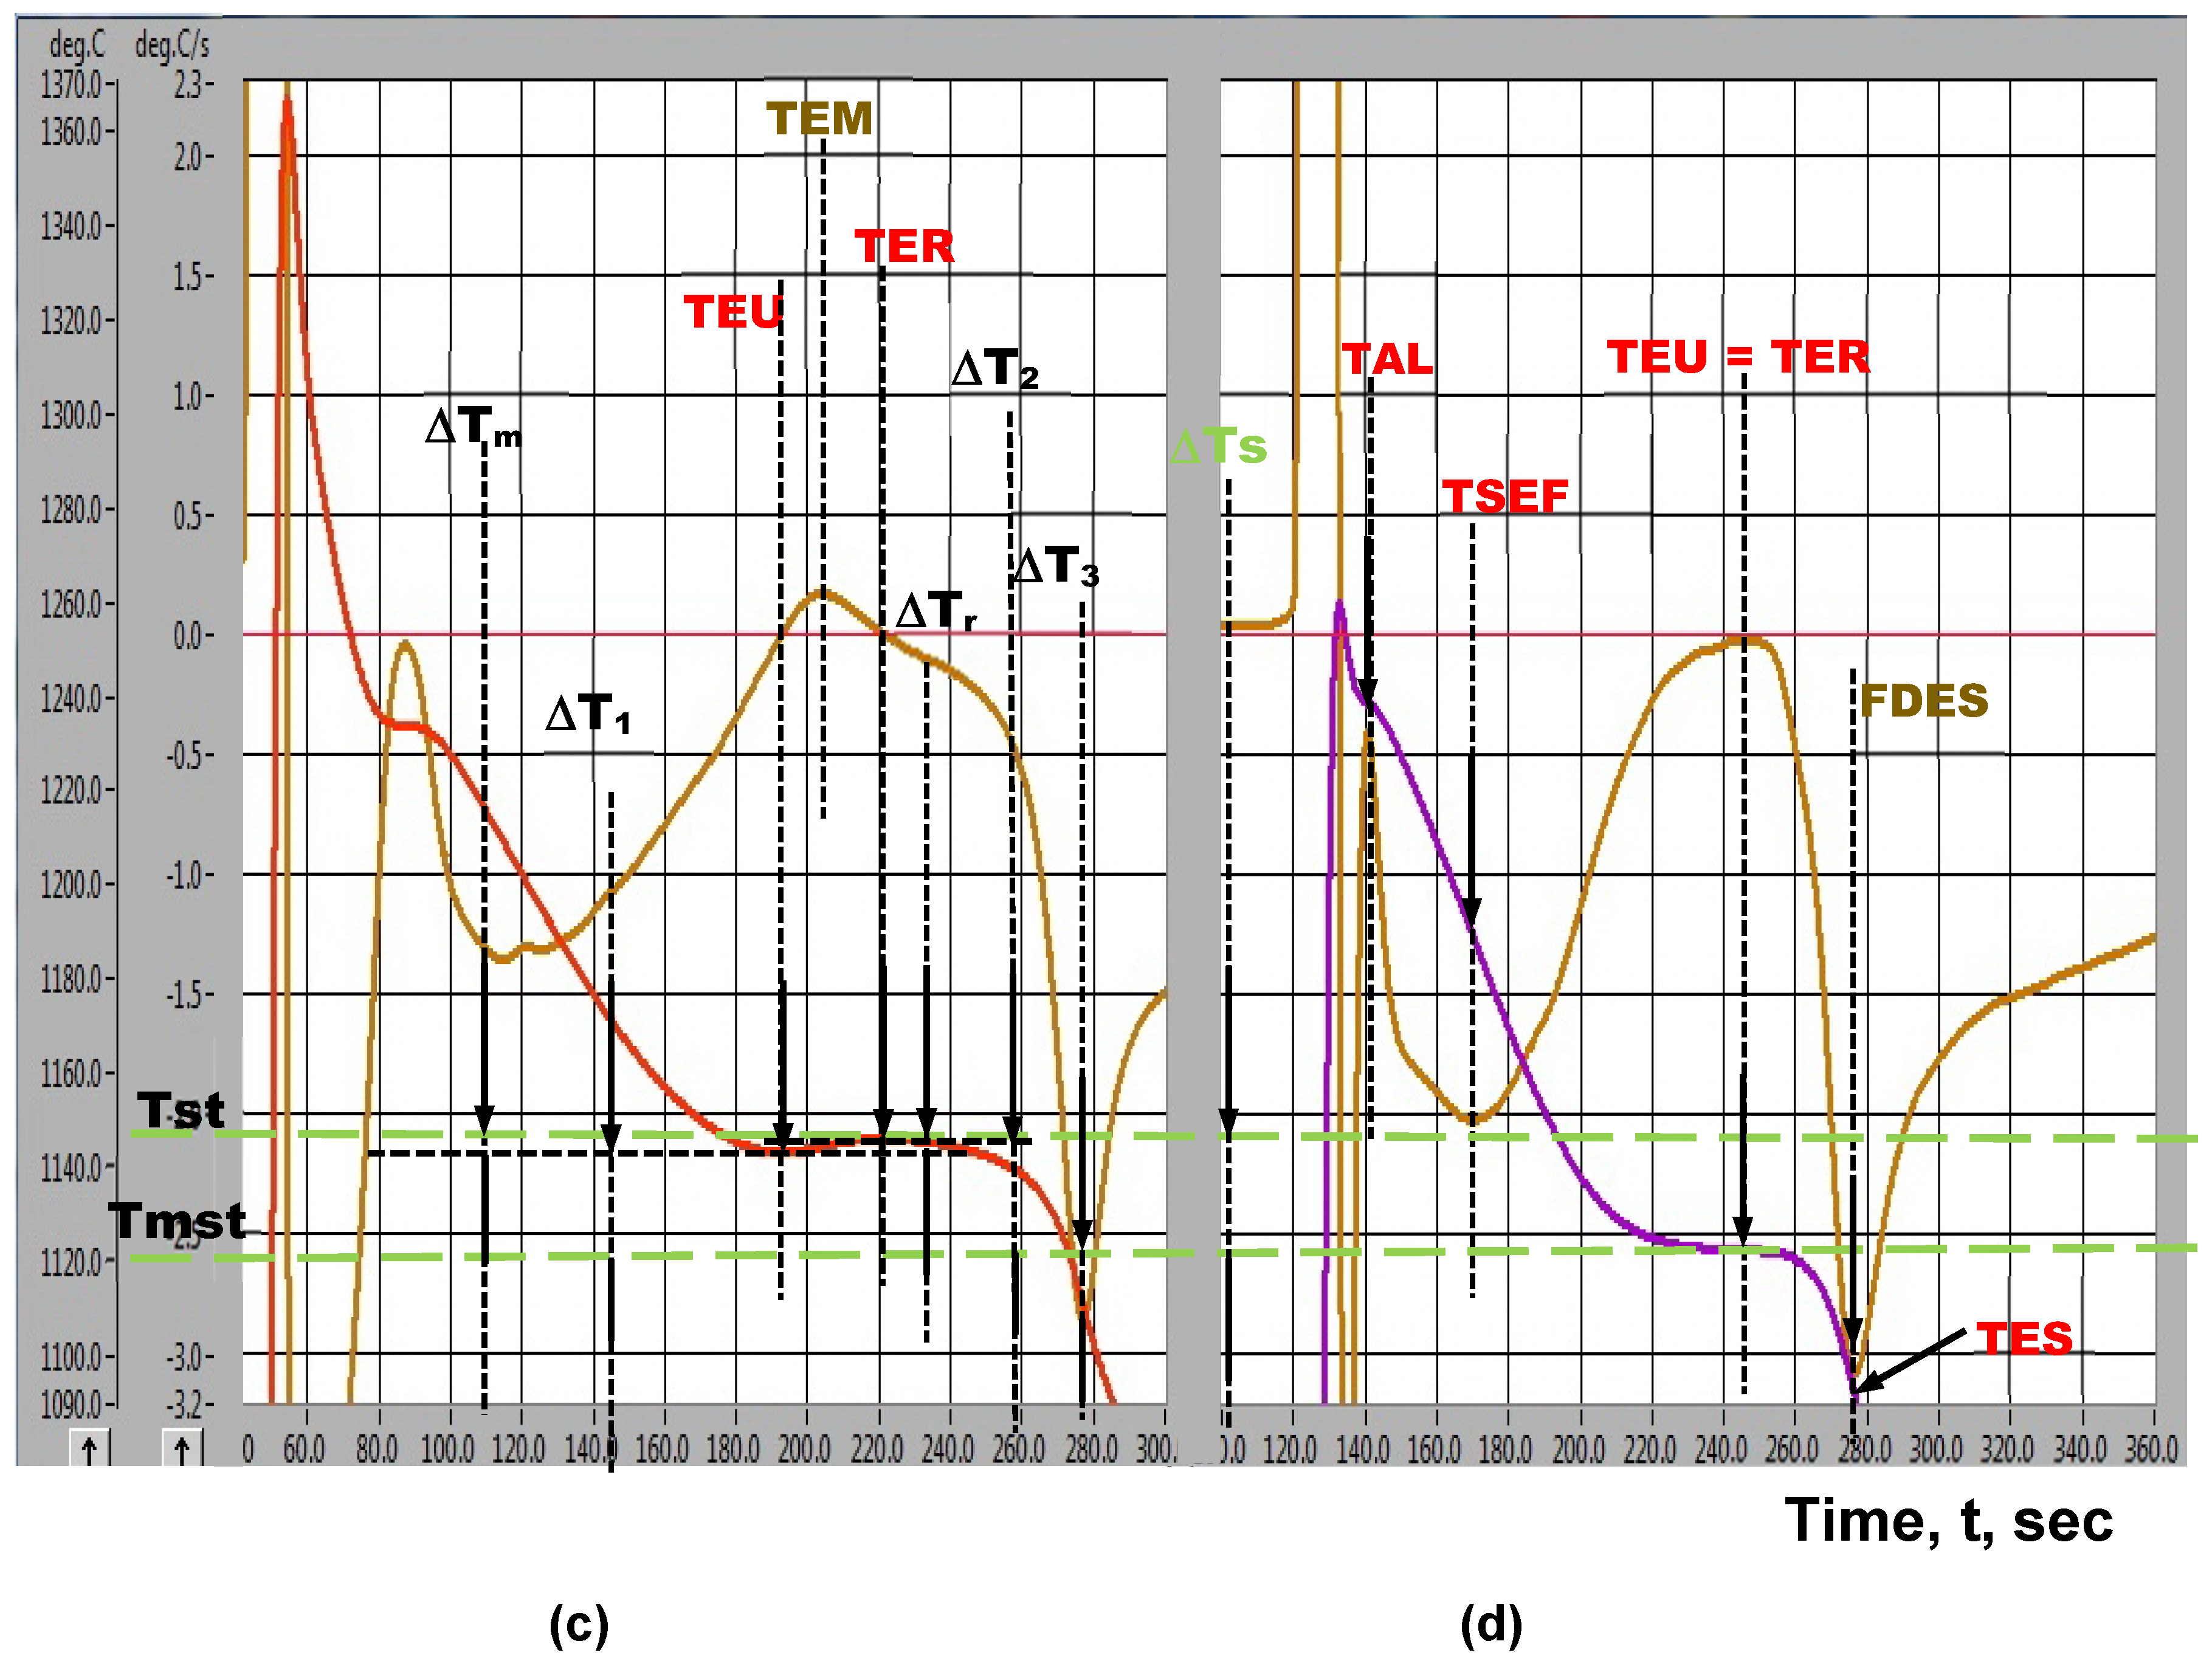
The typical cooling curves and their first derivatives, of the test cast irons variants (Table 1, Figure 2), obtained by thermal analysis are shown in Figure 3. The found representative parameters on these curves are as following: TAL—temperature of austenitic liquidus, °C; TSEF—temperature of the start of eutectic freezing (nucleation), °C; TEU—lowest temperature of eutectic undercooling, °C; TER—temperature of graphitic recalescence, °C; TES—temperature of the end of solidification (end of solidus), °C; Tst—stable (graphitic) eutectic equilibrium temperature, °C; Tmst—metastable (carbidic) eutectic equilibrium temperature, °C; ΔTs—range of equilibrium eutectic temperature (ΔTs = Tst − Tmst), °C; ΔTm—maximum degree of undercooling referring to the stable eutectic temperature (ΔTm = Tst − TEU), °C; ΔTr—eutectic recalescence (ΔTr = TER − TEU), °C; ΔT1—maximum undercooling at the beginning of eutectic reaction, referring to metastable eutectic temperature (Tmst): ΔT1 = TEU − Tmst, °C; ΔT2—undercooling at the temperature of eutectic recalescence, referring to metastable eutectic temperature (Tmst): ΔT2 = TER − Tmst, °C; ΔT3—undercooling at the end of solidification, referring to metastable eutectic temperature (Tmst): ΔT3 = TES — Tmst, °C; FDES—minimum values of the first derivative of cooling curves at the end of eutectic solidification, °C·s−1; TEM—maximum eutectic recalescence rate, °C·s−1.
One important approach of the present work referred to the more realistic evaluation of the eutectic temperatures, in stable (Tst) and metastable (Tmst) systems, by calculation and by measurement, respectively. Equations (3) and (4) show the usually used possibility to calculate these temperatures as silicon content major influence [42]:
Tst = 1153 + 6.7 (% Si)
Tmst = 1147 − 12 (% Si)
Tellurium addition in the thermal analysis ceramic cup before iron melt pouring led to total carbidic solidification (white cast iron), as carbide formation instead of graphite, so eutectic reaction occurs at high undercooling, with TEU = TER, this measured temperature acting as Tmst temperature.
An over-inoculation treatment (1.2 wt.% Sr-FeSi alloy) applied directly in the thermal analysis ceramic cup led to total graphitic solidification, at very low eutectic undercooling, near to equilibrium conditions. In this case, TER = TEU (or only a little bit TER higher than TEU) could be used as eutectic temperature in the stable (Fe-Graphite) solidification system, noted by Tst [36,37,43].
As it was previously mentioned, the experiments have been repeated 5 times, in typically found conditions in cast iron industry, precisely to check the existence of a possible spreading of results, despite of the base test conditions. For this reason, the results are presented for each heat (usually metallurgical term), as the general range and average, too. As the average value, all of the experimental variants are according to real behaviour of each treated iron, but different thermal analysis parameters have different positions as spreading values. All this information are useful for industrial application. For iron castings producers, it is important to know that there are necessary more thermal analysis tests to establish a robust industrial technology in high quality iron castings production. On the other hand, it is important to know that one specific thermal analysis parameter has a peculiar variation behaviour.
Table 4 deals with obtained values by calculus (Si effect) and measured, in over-inoculated (Tst) and in Te-added (Tmst) cast irons, respectively. Recorded control on the chemical composition, including narrow range of silicon content variation in the 5 experimental heats led to low differences between their average values calculated Tst (0.3 °C) and Tmst (0.6 °C). Despite that, measured values are subject to larger scatter, 4.7 °C for Tst and 1.3 °C for Tmst.
As a general rule, measured values appear to be lower compared with calculated values, with an average difference at 14.4 °C for Tst and 8.3 °C for Tmst, respectively. It results that the usually used solution to evaluate the equilibrium temperature in the both stable and metastable systems, by considering only silicon content, as the most influencing factor in the chemical composition (according to Equations (3) and (4)) could not lead to precise evaluation of the cast iron solidification pattern.
Measured Tst, resulted in an over-inoculation process is also not a solution, as it depends on the accuracy of dissolving of FeSi-based alloy inoculating agent in the iron melt. Generally, higher addition rate of FeSi-based alloy is, higher the scattering results are obtained, as silicon recovery rate, especially at lower treated iron melt volume. Contrarily, very small quantity of tellurium addition and high capacity of this element to dissolve in the iron melt allow lower scattering of obtained results.
It could be concluded that the measurement of the metastable eutectic temperature by incited carbidic solidification (Te alloying) is more precise comparing to the measurement of stable eutectic temperature, incited by graphitic solidification (it is difficult to control a very high amount of silicon bearing ferrosilicon recovery before solidification). It appears that is better to consider the undercooling in different steps of solidification reported to measured metastable eutectic temperature. The highest difference between calculation and measurement appears to be as interval Tst − Tmst: limited level for calculation (0.9 °C) but significant level for measurement (5.3 °C).
In Fe-C system solidification diagram, solidification sequence starts with dendritic austenite formation in hypoeutectic cast irons, defined as less than 4.3% carbon equivalent, such as in the present experimental program (Table 3). First of all, this parameter (TAL) is defined by carbon content and all of the associated elements in the chemical composition, with silicon as the most influencing factor. On the other hand, the applied metallurgical treatments could influence the austenite nucleation sites, while local solidification conditions, varying from melt to melt (temperature, pouring time, mould) could also influence the TAL level. In the present experiments, the austenitic liquidus temperature (TAL) mainly depending on the solidification system (stable/graphitic (UI, 0.15 and 1.2 variants) or metastable/carbidic (Te variant)) and silicon contribution of the treatment alloy (Si increased by inoculation and much more for 1.2 wt.% than 0.15 wt.% alloy addition).
Normally, the highest level of austenitic liquidus characterizes the base, un-inoculated iron (the lowest Si content) (1234.3–1244.6 °C) and the lowest TAL was measured for over-inoculated iron (the highest Si content and the highest carbon equivalent) (1217.6–1239.0 °C). Si-contribution of the normal inoculation (0.15 wt.% alloy) decreases the TAL values (1233.1–1242.9 °C), while supplementary Te-addition contributed to more decreasing of this temperature (1232.1–1240.8 °C). The most scattering results level characterizes the over-inoculation cast irons (21.4 °C), where silicon recovery grade could vary in larger range, with the minimum values in normal inoculation cast irons (9.8 °C).
The start of the eutectic freezing (nucleation), TSEF, is less affected by inoculation (1208.1 °C without inoculation, 1204.8 °C for 0.15% inoculation and 1202.0 °C for over-inoculation), while Te-addition, to promote metastable solidification strong decreased this temperature (1187.4 °C), as average values.
The eutectic reaction, defined by the lowest temperature TEU and the highest temperature TER, is stronger affected by the applied treatments (Figure 4). Increasing of the FeSi-based inoculating alloy addition visible increased the both representative temperatures, illustrating a strong graphitizing effect. Te-addition cancelled the normal inoculation effect, decreasing both TEU and TER below of the base (un-inoculated) irons levels, due to promotion of free carbide formation. Similar effect of inoculation was registered also at the end of solidification, as TES continuously increased by inoculant addition increasing.
If un-inoculated and normal inoculated (0.15 wt.%) cast irons are compared, resulting the capacity of this metallurgical treatments to increase all of these three representative temperatures. This means a beneficial effect during eutectic reaction, generally expressed by decreasing the sensitiveness to free carbides formation and increasing capacity to solidify with more favourable graphite morphologies, such as type-A graphite. Higher temperature at the end of solidification process reduces the sensitiveness to form contraction defects (micro-shrinkage) or/and carbides, in inter-eutectic cells area.
More information could be obtained if defined temperatures for eutectic reaction stage and the end of solidification are compared with eutectic temperatures in stable (Tst) or/and metastable (Tmst) systems, through the specific undercooling parameters. The highest undercooling referring to the eutectic temperature in stable/graphitic system is obtained at the first part of eutectic reaction: ΔTm = Tst − TEU. The lowest eutectic temperature TEU could be referred also to metastable eutectic temperature, resulting parameter ΔT1 = TEU − Tmst. This parameter is extremely important, as it point out the sensitiveness to free carbides formation at the beginning of eutectic reaction, if TEU < Tmst and ΔT1< 0, respectively. Contrary, graphite will be formed. Usually ΔTm eutectic undercooling, comparing to stable eutectic temperature Tst is used in solidification model systems, but it is shown that the undercooling ΔT1 referring to metastable eutectic temperature Tmst is a better solution to characterize solidification pattern for the thin wall castings, as positive versus negative values means graphite versus carbides formation, respectively.
Temperature increasing from TEU up to TER as result of heat release during eutectic reaction represents the eutectic recalescence (ΔTr = TER − TEU). This parameter could be important especially for soft mould castings, favouring micro-shrinkage formation. TER−Tmst referring, as ΔT2 undercooling parameter is also important to define carbide or graphite formation at the last part of eutectic reaction: TER < Tmst (ΔT2 < 0) means carbide, while TER > Tmst (ΔT2> 0) favours graphite formation.
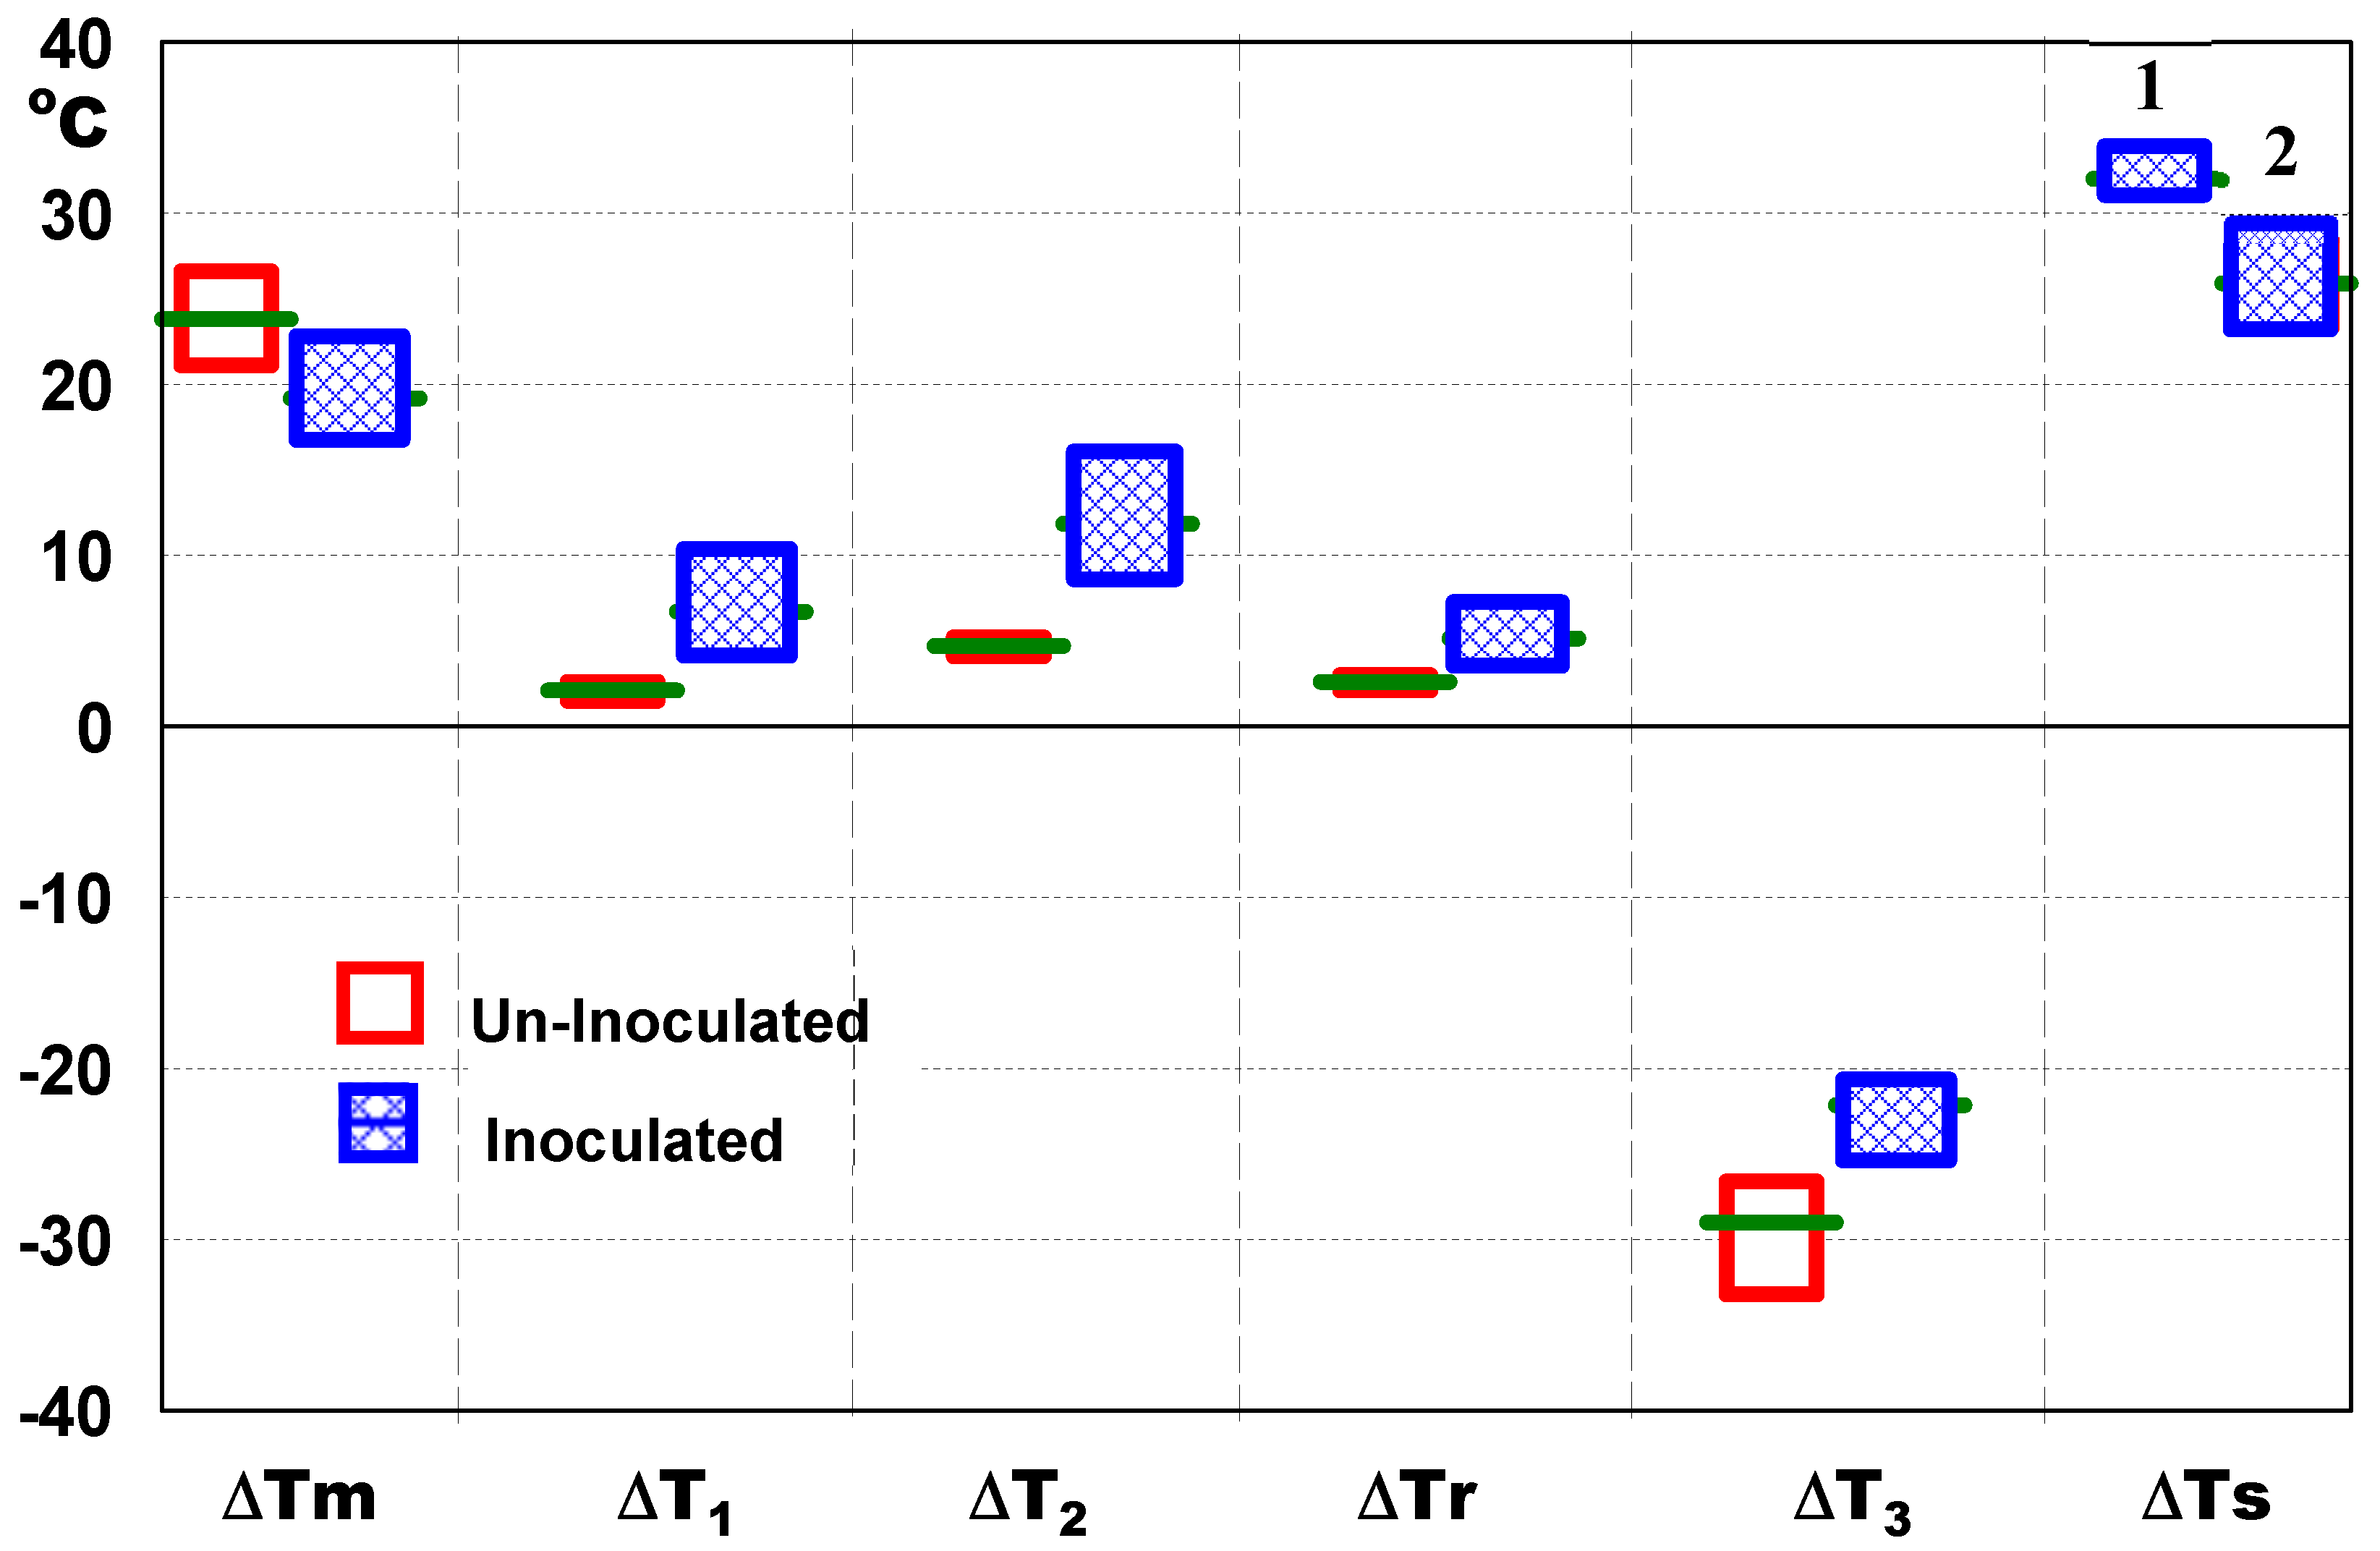
Figure 5 show the level of these undercooling parameters, during eutectic reaction up to the end of solidification, also reported to the eutectic interval, defined by ΔTs = Tst−Tmst, resulted from calculus or measurement. According to its capacity to activate graphite nucleation sites formation, inoculation treatment affected thermal analysis parameters, expressed by undercooling degrees level, on the entire solidification process. As average values, lower level of ΔTm (19.2 °C versus 23.8 °C) and higher position of ΔT1 (6.7 °C versus 2.1 °C) and ΔT2 (11.8 °C versus 4.7 °C) parameters during eutectic reaction and less negative values for ΔT3 (−22.1 °C versus −29.0 °C) parameter at the end of solidification characterize all of the tested inoculated cast irons.
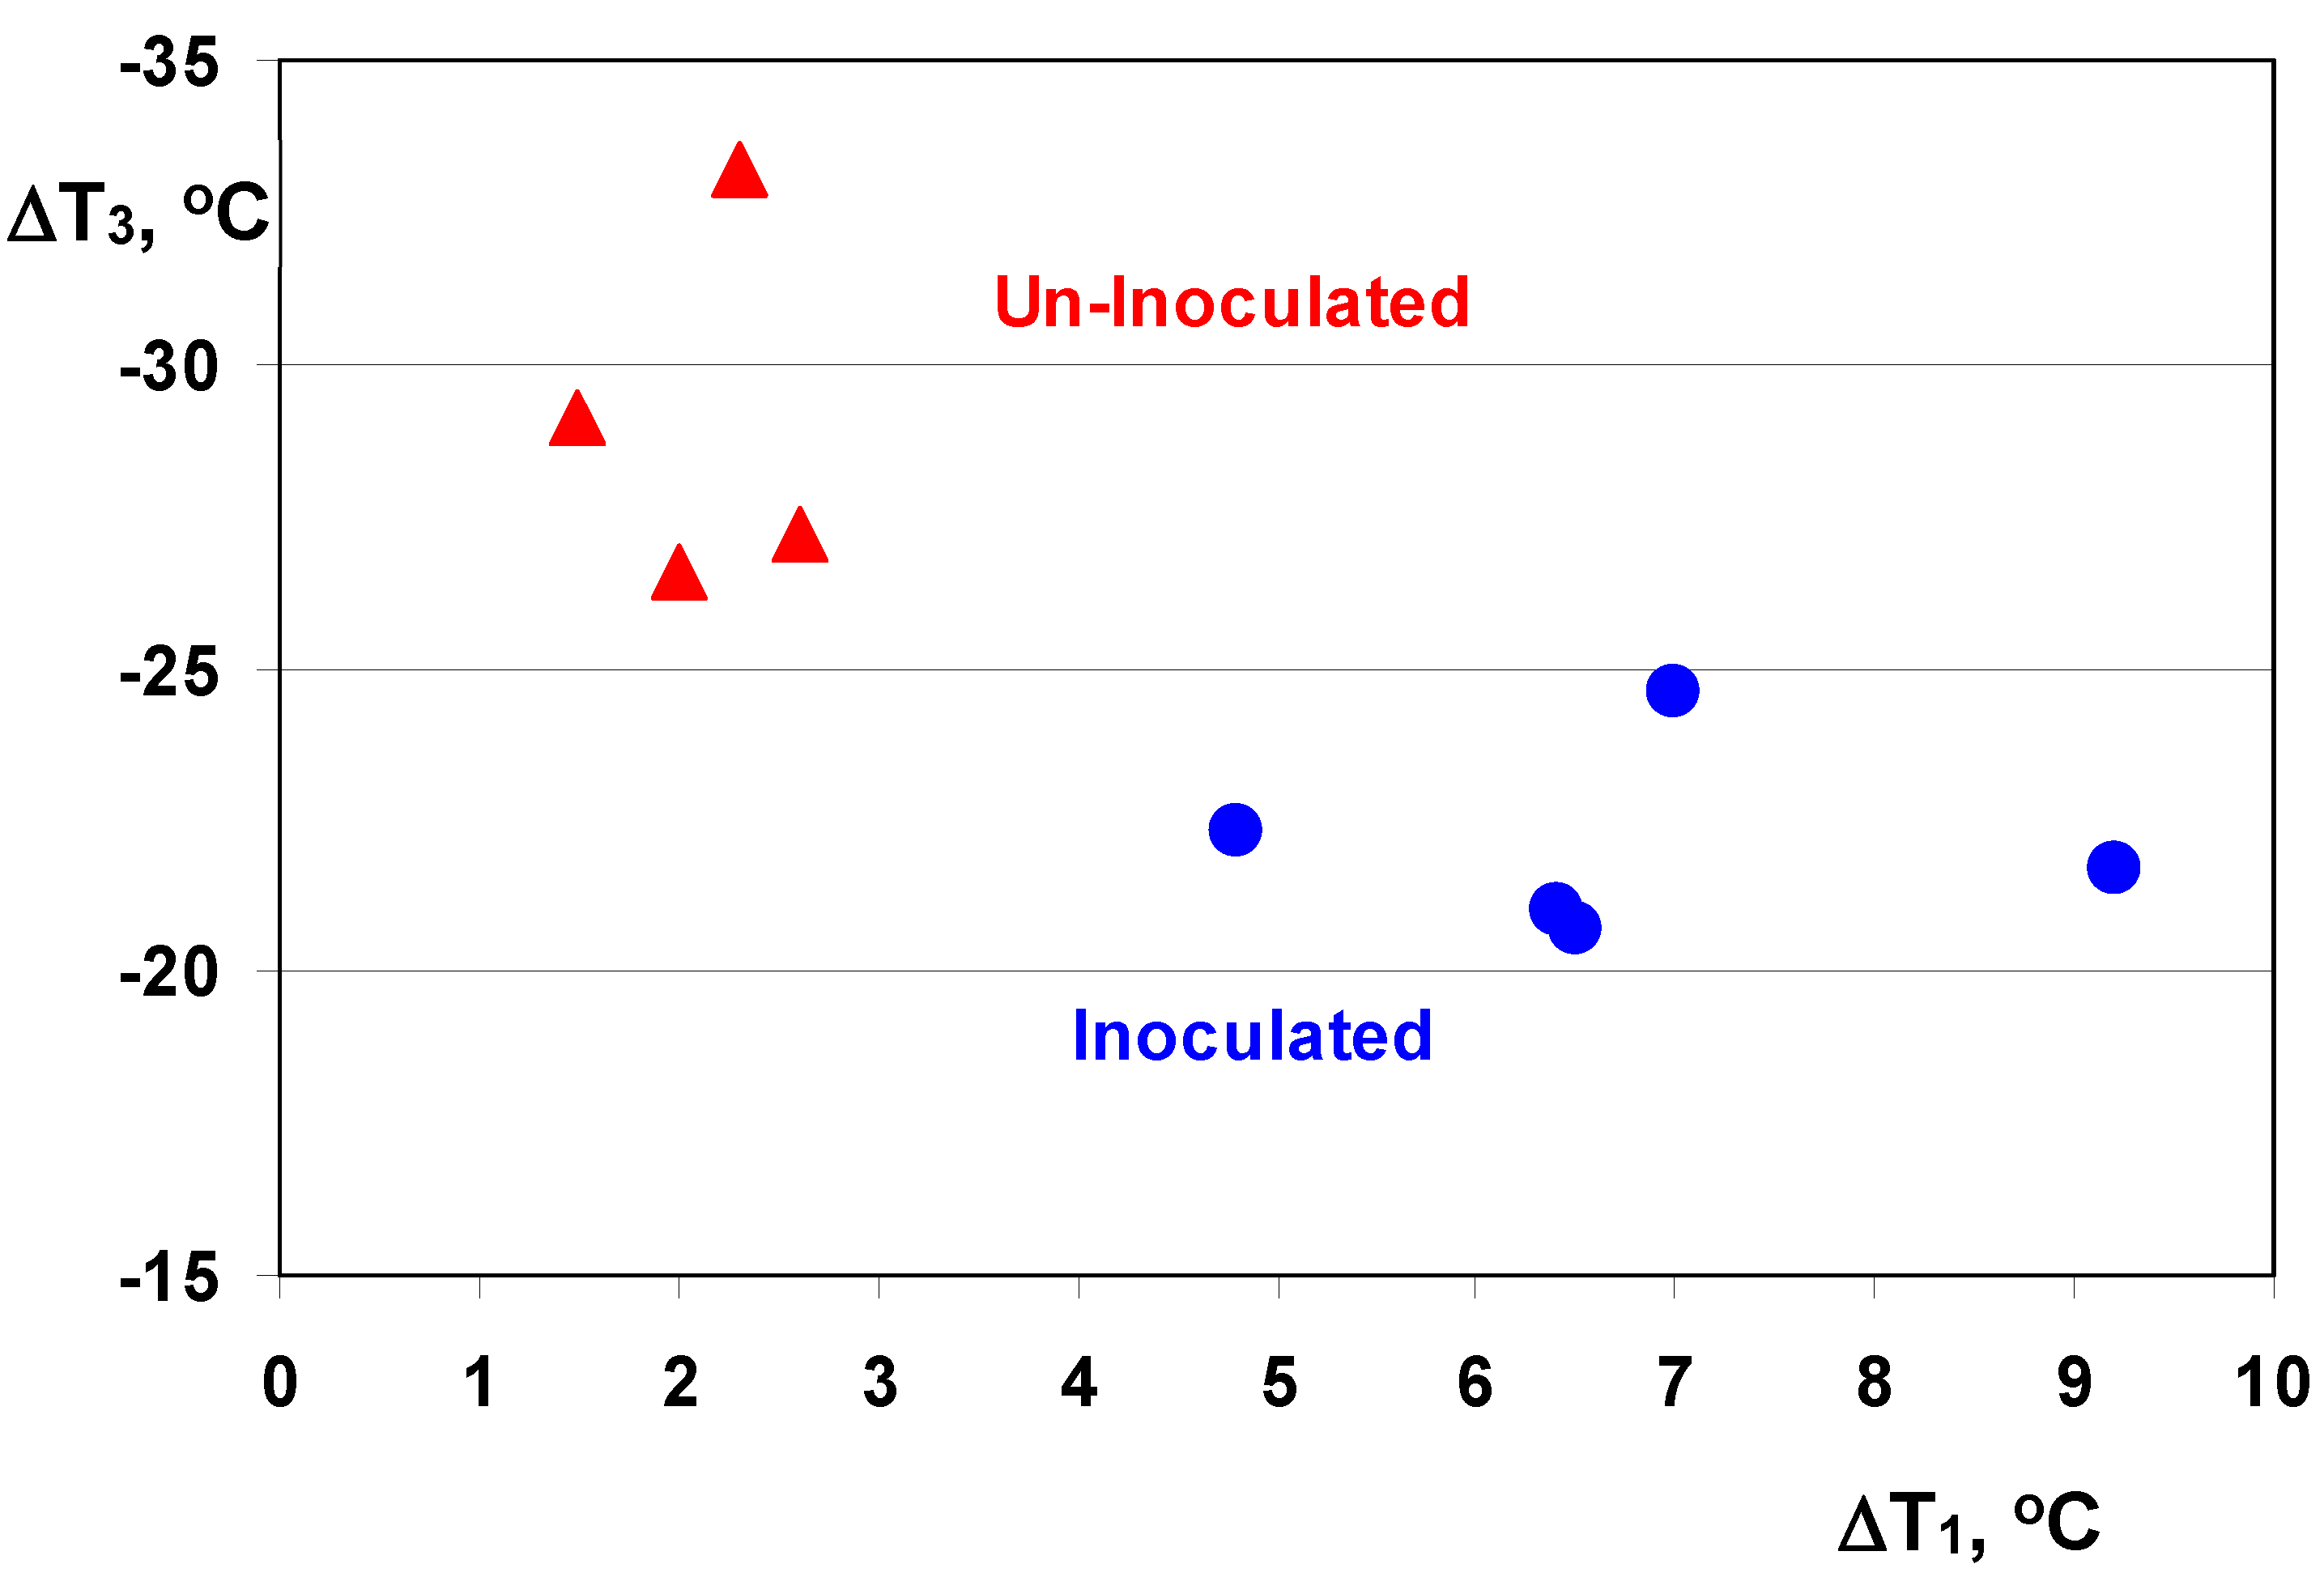
A visible relationship was found between the undercooling referring to the metastable eutectic temperature (Tmst), at the end of solidification (ΔT3) and at the lowest eutectic temperature (ΔT1) (Figure 6). This relationship illustrates two distinct positions of un-inoculated and inoculated cast irons: more negative values for ΔT3 and lower positive values for ΔT1 for the base, un-inoculated irons, compared to inoculated cast irons.
These results sustain at least two possibilities to better capitalize the thermal analysis application to control the solidification process of cast irons: to consider the undercooling referring to metastable eutectic temperature (Tmst versus Tst) and to use ΔT1 parameter, easier and more precise measured to evaluate the solidification conditions of the end of solidification process, typically located under the level of the metastable eutectic temperature for grey iron castings. As usually the thermal (cooling curves) analysis offers information on the solidification on the beginning of eutectic reaction (corresponding to the lowest eutectic temperature, TEU), it is found that by this way could be also obtained useful information on the undercooling at the end of solidification, as these two undercooling degrees (ΔT1 and ΔT3) are in good relationship.
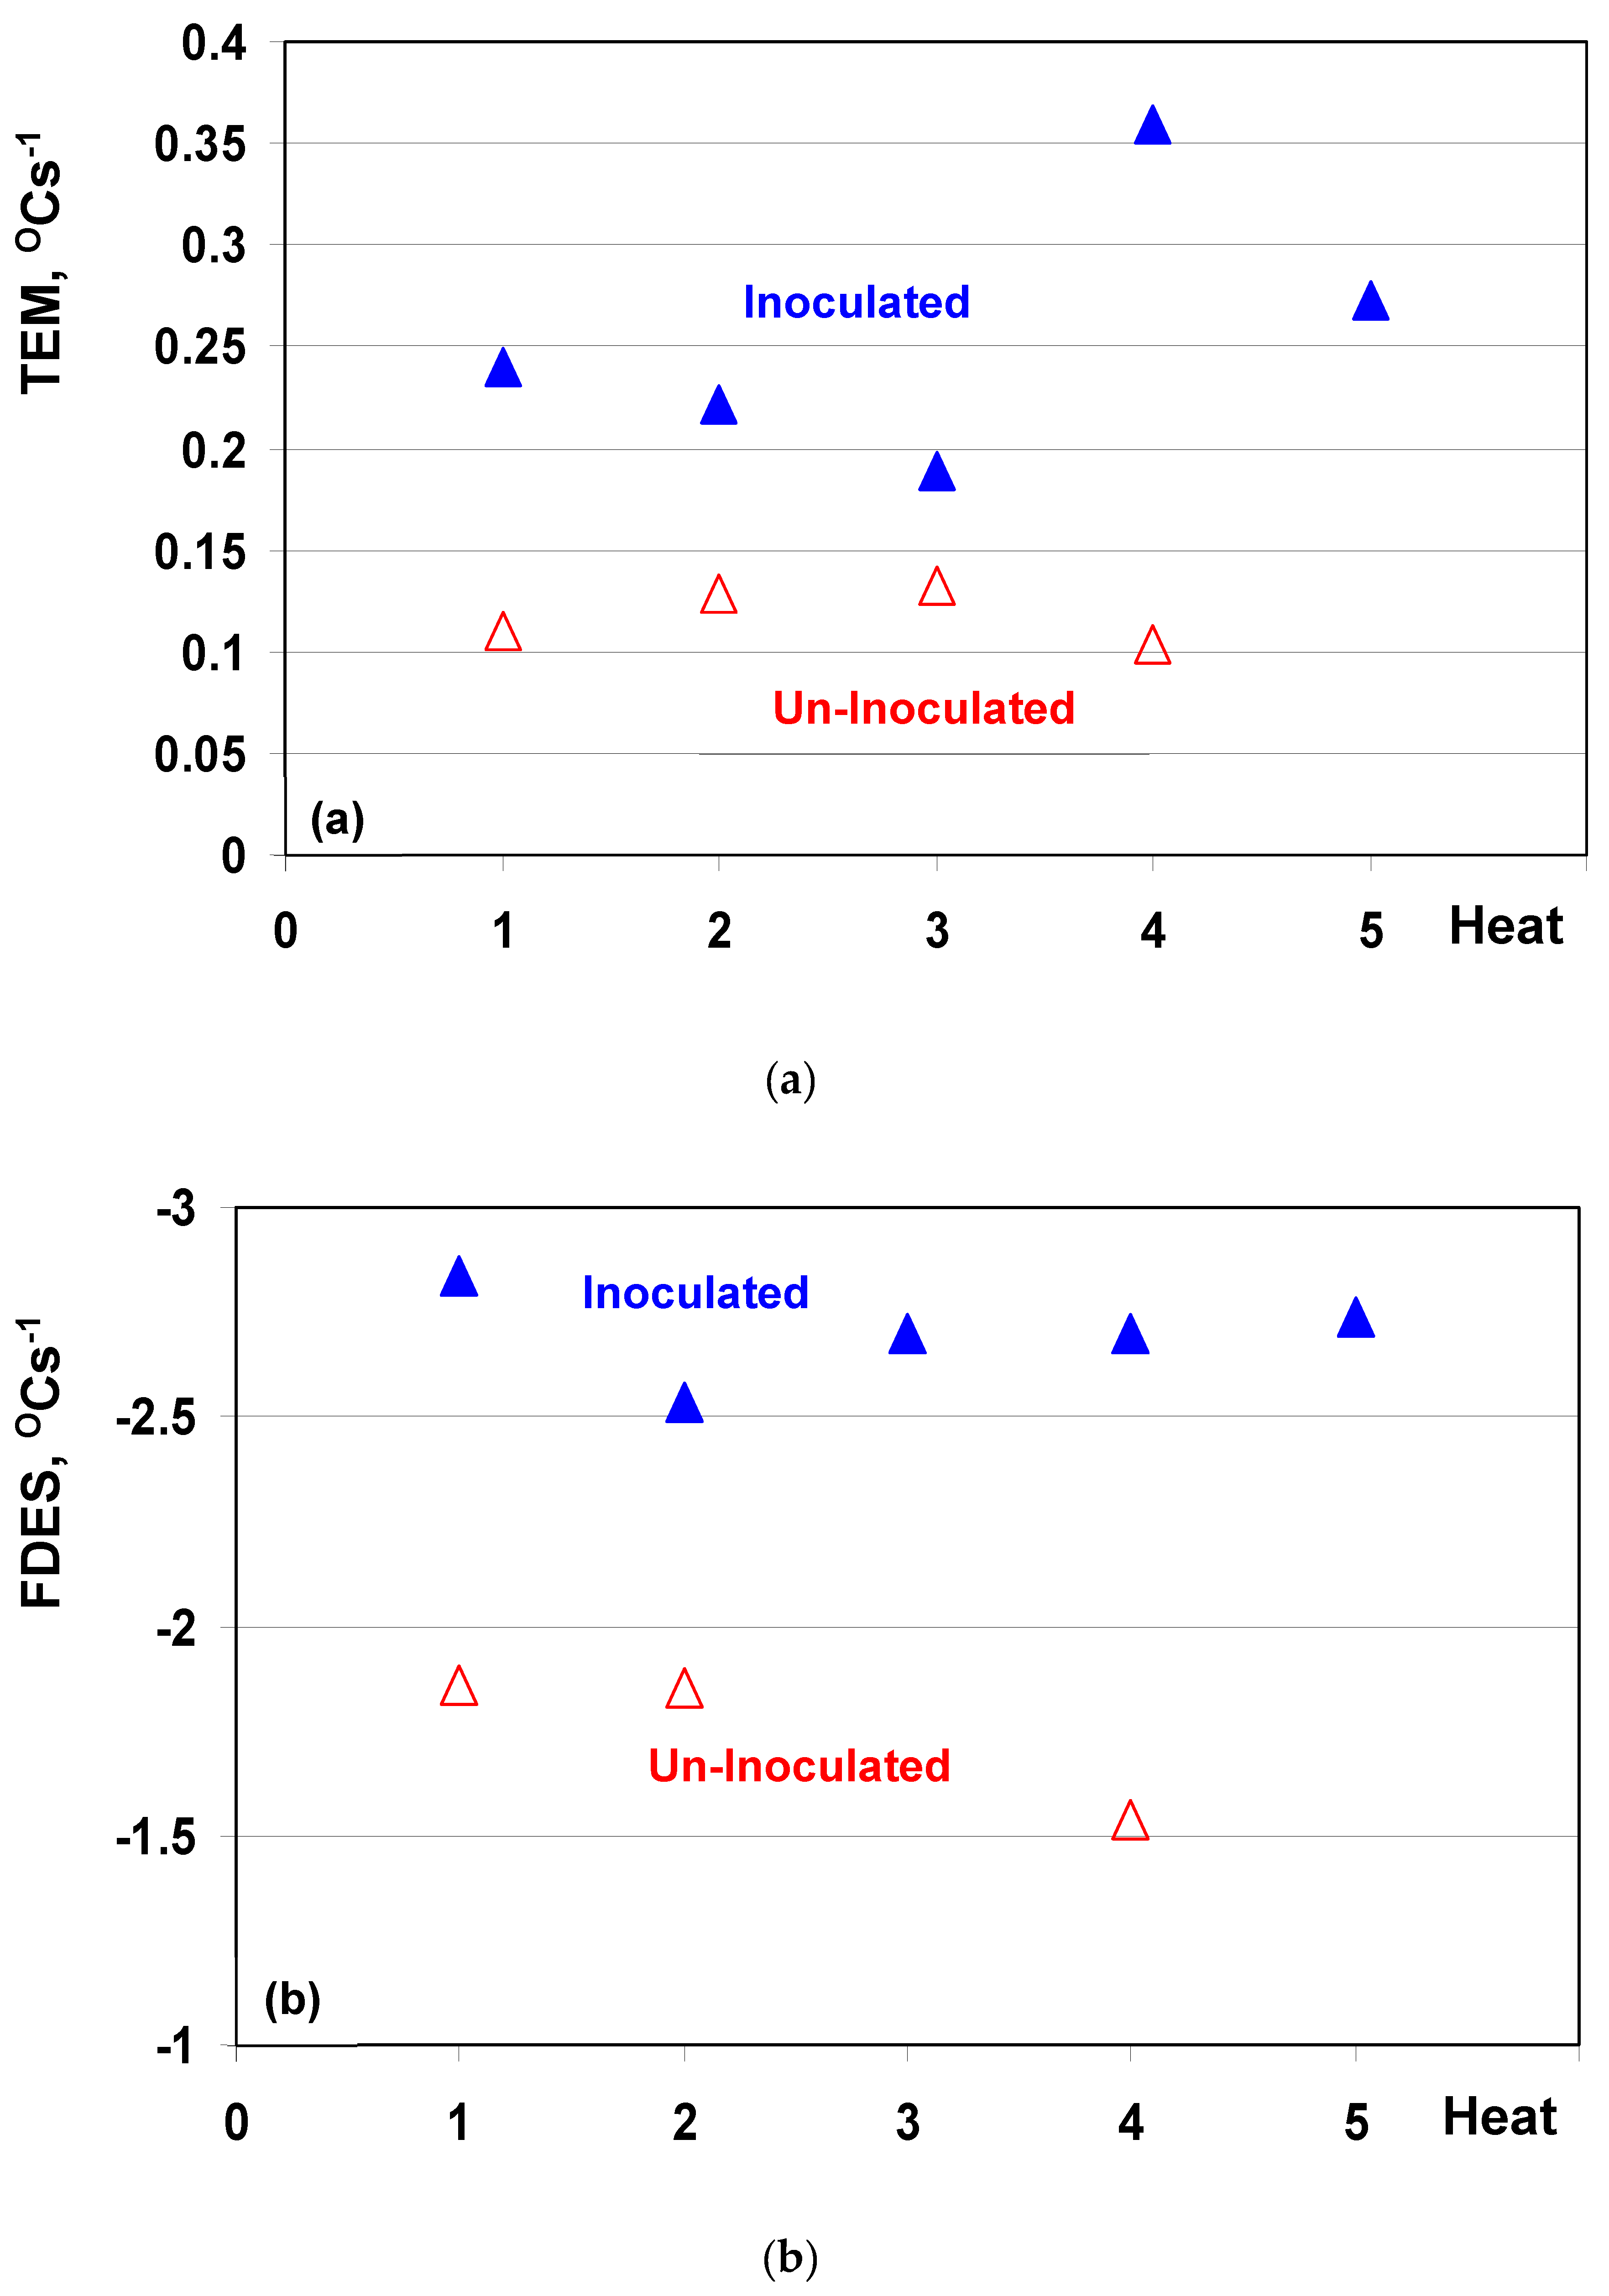
Figure 7 show the most important parameters identified on the first derivative of the cooling curve, for tested un-inoculated and normal inoculated (0.15 wt.% alloy) grey cast irons. For all five experimental heats, inoculation led to higher values for the maximum eutectic recalescence rate (TEM) and more negative values for the first derivative of the cooling rate at the end of solidification (FDES). The second parameter appears to be the most affected by inoculation treatment, as in this case were obtained the lowest scattered values.
3.3. Chill (Carbide Formation) Sensitiveness
In the industrial production of grey iron castings, transition from carbide to graphite formation is usually checked by the use of the wedge shape samples, defined by size and solidification cooling modulus, respectively.
Table 2 shows the size of standard test wedges, according to ASTM A367, usually used in the world foundry industry. Cooling modulus (CM) is defined as the ratio between volume and the total external casting surface and is an expression of the capacity to transfer a given quantity of heat through an existing surface to the mould. Higher cooling modulus equates to slower cooling rate and less undercooling during eutectic solidification, favourable for carbide to graphite transition.
That portion nearest the apex, entirely free of grey areas, is designated as the clear chill zone (CC). The portion from the end of the clear chill zone to the location where the last presence of cementite, or white iron is visible, is designated the mottled zone (MC). The region from the junction of grey fracture to the first appearance of chilled iron (apex) is designated the total chill (TC). The parameter relative clear chill (RCC) was considered in the present work, according to Equation (5) [1]. Both clear chill width (CC) and the maximum width of the test wedge (B) are measured for each obtained casting, in order to obtain the real values for cooling modulus (CM) and relative clear chill (RCC), respectively.
RCC = 100 [CC/B] (%)
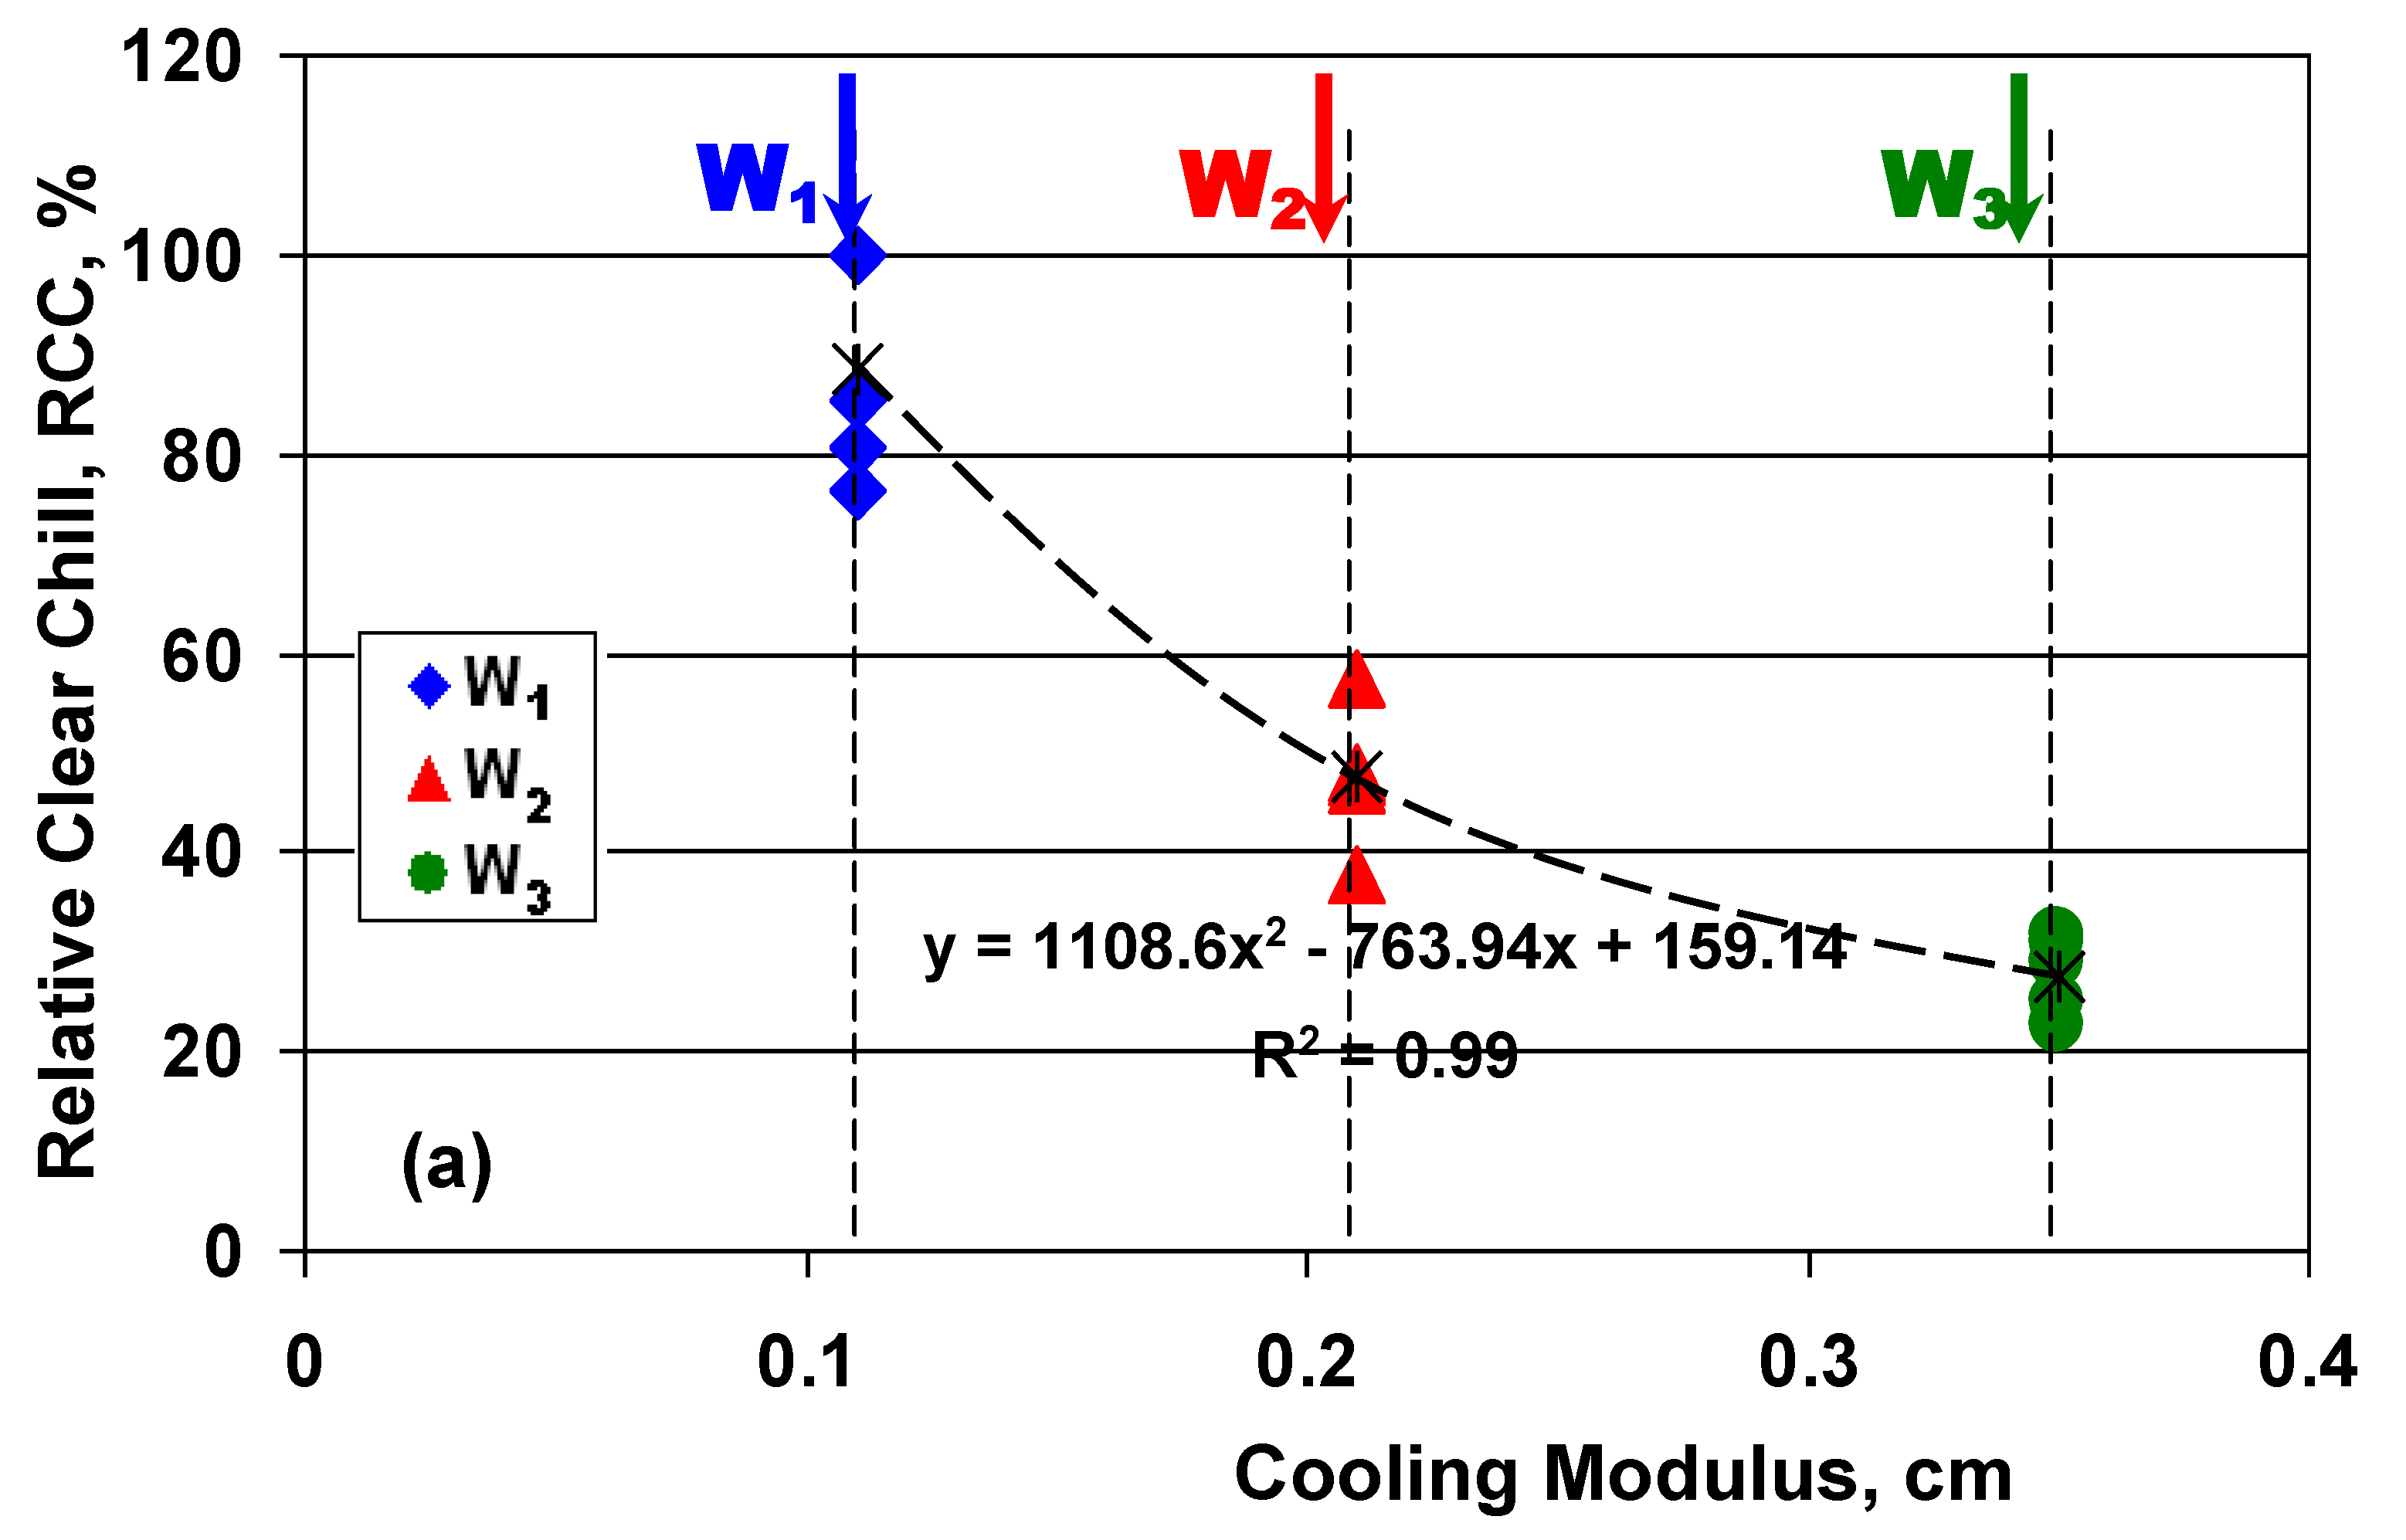
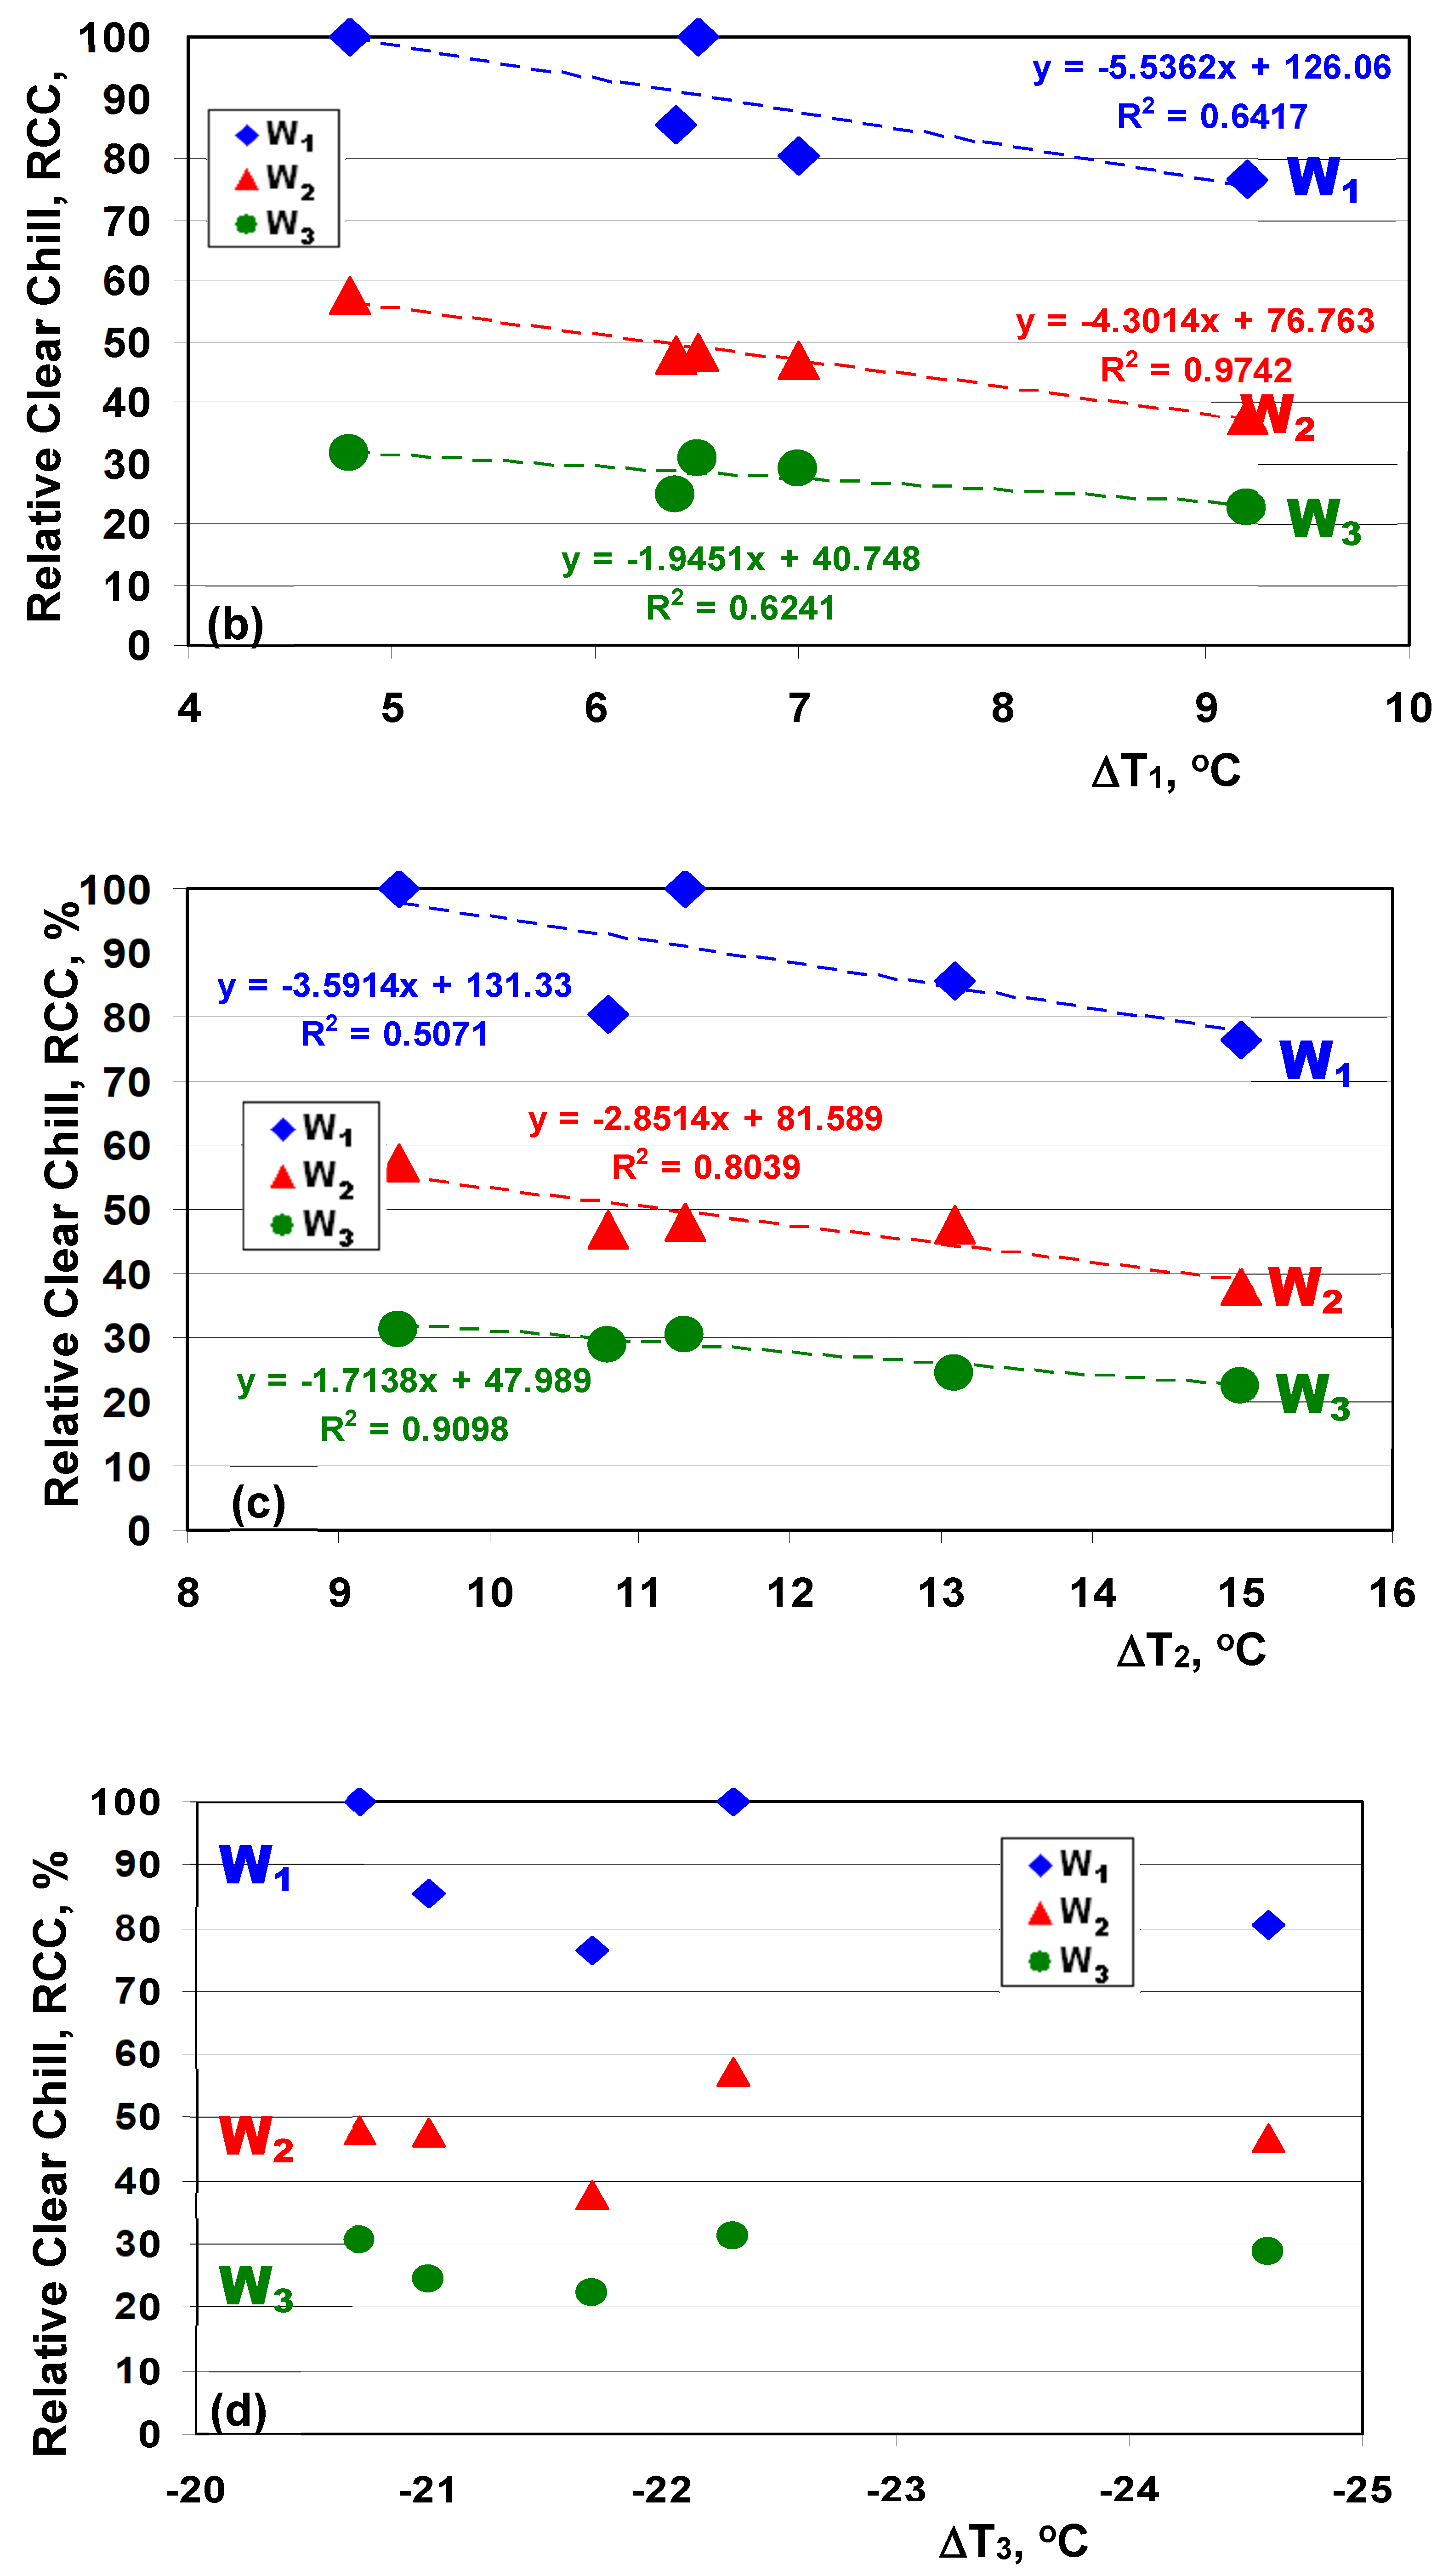
The present experiments focused on the high cooling rate/solidification rate W1, W2 and W3 samples (furan resin mould). Thin wall castings are represented by the highest cooling rate W1 wedge, while the W2 and W3 samples reflect medium cooling rate solidification. Figure 8 summarizes the obtained results for normal inoculated grey cast irons (0.15 wt.% alloy), as effect of the solidification cooling rate, expressed by cooling modulus (Figure 8a), and the relationships between chill (carbides formation sensitiveness) expressed by RCC parameter and the undercooling referring to the metastable eutectic temperature (Tmst), in different moments of solidification: at the lowest (ΔT1—Figure 8b) and the highest (ΔT2—Figure 8c) eutectic temperatures and at the end of solidification (ΔT3 —Figure 8d), respectively.
Increasing of the cooling modulus, corresponding to the decreasing of the solidification cooling rate, led to the decreasing of the sensitiveness to free carbides formation, favouring the graphite precipitation, as the general target in iron castings production. For all of the solidification conditions, marked by the three representative wedge samples (W1—the highest cooling rate, W2, and W3 —the lowest cooling rate), there is a good relationship between chill sensitiveness and the eutectic undercooling referring to the metastable eutectic temperature, on the entire eutectic reaction stage, (Figure 8b,c).
It is found a good relationship between the free carbide’s formation (chill tendency) and the undercooling degree during the eutectic reaction, reported to metastable eutectic temperature (Tmst), for thin and medium wall thickness inoculated grey iron castings. It is underlined that the real measured Tmst instead of calculated Tmst (as chemical composition effect) is compulsory for the thin wall castings production (the highest solidification cooling rate), very sensitive to carbides to graphite transition. No visible relationship appears to be between chill tendency and the undercooling at the end of solidification (Figure 8d).
4. Conclusions
- Traditionally, stable (Tst) and metastable (Tmst) eutectic temperatures are simple calculated as silicon effects, but the approximately obtained level is found to affect the real values of representative solidification undercooling degrees. As a general rule, measured values appear to be lower compared with calculated values, with an average at 14.4 °C for Tst and 8.3 °C for Tmst, respectively.
- It is found that the measured Tst resulted in an over-inoculation process is not a solution, as it depends on the accuracy of dissolving of a high amount of FeSi-based alloy inoculating agent in low volume of iron melt.
- Contrary, very small quantity of tellurium addition and high capacity of this element to dissolve in the iron melt allow to lower scattering of obtained results. Measured Tmst is recommended to be used as reference for evaluation of undercooling during entire stage of solidification.
- Using a thermal analysis system to measure Tmst, instead of its calculation, the relationship between thermal analysis curves and the chill (carbides formation) sensitiveness is improved, especially for lower cooling modulus (higher cooling rate) iron castings.
- As an average value, all of the experimental variants are according to real behaviour of each treated iron variant, but different thermal analysis parameters have different positions as spreading values. The most scattering results level characterizes the over-inoculation cast irons, where silicon recovery grade could vary in larger range, with the minimum values in normal inoculation cast irons.
- For iron castings producers, it is important to know that there are necessary more thermal analysis tests to establish a robust industrial technology in high quality iron castings production.
- It is found that ΔT1 parameter (typically for the first part of eutectic reaction), obtained by referring to measured metastable eutectic temperature Tmst, is a better solution to predict the melt quality, at least as carbide to graphite transition during solidification of thin wall castings, as positive versus negative values means graphite versus carbides formation, respectively.
- It is shown that the inoculation could have different effects, for both temperatures and undercooling degrees measurement, at in three sections of solidification: austenite formation, eutectic reaction and the end of solidification.
- It is found a good relationship between the undercooling degree at the lowest eutectic temperature (ΔT1) and at the end of solidification (ΔT3), reported to measured metastable eutectic temperature (Tmst).
- It is found a good relationship between the free carbide’s formation (chill tendency) and the undercooling degree during the eutectic reaction, reported to measured metastable eutectic temperature (Tmst], especially for thin and medium wall thickness inoculated grey iron castings.
- It is underlined that the real measured Tmst instead of calculated Tmst (as chemical composition effect) is compulsory for the thin wall castings production (the highest solidification cooling rate), very sensitive to carbides to graphite transition.
- In the present experimental conditions, no visible relationship appears to be between chill tendency and undercooling at the end of solidification (ΔT3).
Author Contributions
E.L.N., I.R., A.M.C., S.S. and I.S. contributed equally in conceiving, designing and performing the experiments; analyzing the data; and writing the paper. All authors have read and agreed to the published version of the manuscript.
Funding
This research was funded by the Operational Programme Human Capital of the Ministry of European Funds through the Financial agreement 51668/09.07.2019, SMIS code 124705.
Conflicts of Interest
The authors declare no conflict of interest.
References
- Stan, S.; Chisamera, M.; Riposan, I.; Stefan, E.; Barstow, M. Solidification pattern of un-inoculated and inoculated gray cast irons in wedge test samples. AFS Trans. 2010, 118, 295–309. [Google Scholar]
- Standard A367-85: Standard Test Methods of Chill Testing of Cast Iron; American Society for Testing of Materials: West Conshohocken, PA, USA, 2000; pp. 151–154.
- Emadi, D.; Whiting, L.V.; Nafisi, S.; Ghomashchi, R. Applications of thermal analysis in quality control of solidification process. J. Therm. Anal. Calorim. 2005, 81, 235–242. [Google Scholar] [CrossRef]
- Mahfoud, M.; Prasada Rao, A.K.; Emadi, D. The role of thermal analysis in detecting impurity levels during aluminum recycling. J. Therm. Anal. Calorim. 2010, 100, 847–851. [Google Scholar] [CrossRef]
- Malekan, M.; Shabestari, S.G. Computer-aided cooling curve thermal analysis used to predict the quality of aluminum alloys. J. Therm. Anal. Calorim. 2011, 103, 453–458. [Google Scholar] [CrossRef]
- Ghoncheh, M.H.; Shabestari, S.G.; Abbasi, M.H. Effect of cooling rate on the microstructure and solidification characteristics of Al2024 alloy using computer-aided thermal analysis technique. J. Therm. Anal. Calorim. 2014, 117, 1253–1261. [Google Scholar] [CrossRef]
- Tanski, T.; Labisz, K.; Krupinska, B.; Krupinski, M.; Krol, M.; Maniara, R.; Borek, W. Analysis of crystallization kinetics of cast aluminum-silicon alloy. J. Therm. Anal. Calorim. 2016, 123, 63–74. [Google Scholar] [CrossRef] [Green Version]
- Sparkman, D. Microstructure by Thermal Analysis. AFS Trans. 2011, 119, 413–419. [Google Scholar]
- Apelian, D.; Sigworth, G.K.; Whaler, R. Assessment of grain refinement and modification of Al-Si foundry alloys by thermal analysis. AFS Trans. 1984, 91, 297–307. [Google Scholar]
- Nafisi, S.; Ghomashchi, R.; Hedjazi, J.; Boutorabi, S.M.A. New approaches to melt treatment of Al-Si alloys: Application of thermal analysis techniques. AFS Trans. 2004, 112, 165–177. [Google Scholar]
- Farahany, S.; Ourdjini, A.; Idris, M.H. The usage of computer-aided cooling curve thermal analysis to optimize eutectic refiner and modifier in Al-Si alloys. J. Therm. Anal. Calorim. 2012, 109, 105–111. [Google Scholar] [CrossRef]
- Dobrzanski, L.A.; Krupinski, M.; Labisz, K.; Krupinska, B.; Grajcar, A. Phases and structure characteristics of the near eutectic Al-Si-Cu alloy using derivative thermos-analysis. Mater. Sci. Forum 2010, 638–642, 475–480. [Google Scholar] [CrossRef]
- Backerud, L.; Sigworth, G.K. Recent development in thermal analysis of aluminum casting alloys. AFS Trans. 1989, 97, 459–464. [Google Scholar]
- Dedavid, B.A.; Costa, E.M.; Ferreira, C.R. A study of precipitates formation in AA380.0 aluminum alloys modified by the addition of magnesium. J. Therm. Anal. Calorim. 2002, 67, 473–480. [Google Scholar] [CrossRef]
- Farahany, S.; Ourdjini, A.; Idris, M.H.; Shabestari, S.G. Computer-aided cooling curve thermal analysis of near eutectic Al-Si-Cu-Fe alloys. J. Therm. Anal. Calorim. 2013, 114, 705–717. [Google Scholar] [CrossRef]
- Fornaro, O.; Palacio, H.A. Study of dilute Al-cu solidification by cooling curve analysis. J. Mater. Sci. 2009, 44, 4342–4347. [Google Scholar] [CrossRef]
- Thomson, J.P.; Sadayappan, M.; Sahoo, M. Evaluation of grain refinement of leaded yellow brass (C85800) and Envirobrass III (C89550) using thermal analysis. AFS Trans. 2003, 111, 417–434. [Google Scholar]
- Krupinski, M.; Krupinska, B.; Labisz, K.; Rdzawski, Z.; Borek, W. Influence of cooling rate on crystallization kinetics on the microstructure of cast zinc alloys. J. Therm. Anal. Calorim. 2014, 118, 1361–1367. [Google Scholar] [CrossRef] [Green Version]
- Guerra-Fuentes, L.; Lara, R.D.; Hernandez-Rodriguez, M.A.L.; Salinas-Rodriguez, A.; Garcia-Sanchez, E. Thermal stability and phase transformations of a FV535 steel. J. Therm. Anal. Calorim. 2016, 123, 27–33. [Google Scholar] [CrossRef]
- Gojic, M.; Suceskaand, M.; Rajic, M. Thermal analysis of low alloy Cr-Mo steel. J. Therm. Anal. Calorim. 2004, 75, 947–956. [Google Scholar] [CrossRef]
- Klancnik, G.; Medved, J.; Nagode, A.; Novak, G.; Petrovic, D.S. Influence of Mn on the solidification of Fe-Si-Al alloy for non-oriented electric steel. J. Therm. Anal. Calorim. 2014, 116, 295–302. [Google Scholar] [CrossRef]
- Hakanatapek, S.; Erisir, E.; Gumus, S. Modeling and thermal analysis of solidification in a low alloy steel. J. Therm. Anal. Calorim. 2013, 114, 179–183. [Google Scholar] [CrossRef]
- Stefanescu, D.M. Thermal analysis-theory and applications in metalcasting. Int. J. Metalcasting 2015, 9, 7–22. [Google Scholar] [CrossRef]
- Sparkman, D.; Bhaskaram, C.A. Chill Measurement by Thermal Analysis. AFS Trans. 1996, 104, 969–976. [Google Scholar]
- Chisamera, M.; Stan, S.; Riposan, I.; Costache, G.; Barstow, M. Solidification Pattern of In-Mold and Ladle Inoculated Low Sulfur Hypoeutectic Gray Cast Irons. AFS Trans. 2008, 116, 641–652. [Google Scholar]
- Stan, S.; Chisamera, M.; Riposan, I.; Barstow, M. Applications of thermal analysis to monitor the quality of hypoeutectic cast irons during solidification in sand and metal mould. J. Therm. Anal. Calorim. 2012, 110, 1185–1192. [Google Scholar] [CrossRef]
- Riposan, I.; Chisamera, M.; Stan, S.; Barstow, M. Identifying chill tendency of cast iron melts by thermal analysis. Int. J. Cast Met. Res. 2013, 26, 152–159. [Google Scholar] [CrossRef]
- Riposan, I.; Chisamera, M.; Stan, S. Enhanced quality in electric melt grey cast irons. ISIJ Int. 2013, 53, 1683–1695. [Google Scholar] [CrossRef] [Green Version]
- Klancnik, U.; Habjan, J.; Klancnik, G.; Medved, J. Thermal analysis of indefinite chill cast iron modified with ferrovanadium and ferrotungsten. J. Therm. Anal. Calorim. 2017, 127, 71–78. [Google Scholar] [CrossRef]
- Riposan, I.; Chisamera, M.; Stan, S. Application of cooling curve analysis in solidification pattern and structure control of grey cast irons. J. Therm. Anal. Calorim. 2018, 132, 1017–1028. [Google Scholar] [CrossRef]
- Chisamera, M.; Riposan, I.; Stan, S.; Stefan, E.; Costache, G. Thermal analysis control of in-mould and ladle inoculated grey cast irons. China Foundry 2009, 6, 145–151. [Google Scholar]
- Riposan, I.; Chisamera, M.; Stan, S. New Developments in High Quality Grey Cast Irons. China Foundry 2014, 11, 351–364. [Google Scholar]
- Riposan, I.; Stan, S.; Chisamera, M.; Neacsu, L.; Cojocaru, A.M.; Stefan, E.; Stan, I. Simultaneous thermal and contraction/expansion curves analysis for solidification control of cast irons. China Foundry 2020, 17, 96–110. [Google Scholar] [CrossRef]
- Canbay, C.A.; Karaduman, O.; Unlu, N.; Baiz, S.A.; Ozkul, I. Heat treatment and quenching media effects on the thermodynamical, thermoelastical and structural characteristics of a new Cu-based quaternary shape memory alloy. Compos. Part B. 2019, 174, 106940. [Google Scholar] [CrossRef]
- QuiK-Cup® QuiK-Lab® E Thermal Analysis of Cast Iron. Available online: https://www.heraeus.com/media/media/hen/doc_hen/measurement_instruments/quik-cup.pdf (accessed on 20 June 2020).
- Kanno, T.; Fukuda, Y.; Kang, I.; Morinaka, M.; Nakae, H. Prediction of chilling tendency in cast iron using three cups thermal analysis system. J. JFS 1998, 70, 773–778. [Google Scholar]
- Kanno, T.; Nakae, H. Prediction of graphite types and mechanical properties in cast iron using three cups thermal analysis. J. JFS 2000, 72, 175–180. [Google Scholar]
- Thielemann, T. Zur Wirkung van Spurenelementen in Gusseisen mit Kugelgraphit [Effects of trace elements in nodular graphite cast irons]. Giessereitechnik 1970, 16, 16–24. [Google Scholar]
- Riposan, I.; Chisamera, M.; Stan, S.; White, D. Complex (Mn,X)S compounds-major sites for graphite nucleation in grey cast iron. China Foundry 2009, 6, 352–357. [Google Scholar]
- Riposan, I.; Chisamera, M.; Stan, S.; Hartung, C.; White, D. Three-Stage Model for the Nucleation of Graphite in Grey Cast Iron. Mater. Sci. Technol. 2010, 26, 1439–1447. [Google Scholar] [CrossRef]
- Riposan, I.; Skaland, T. Modification and inoculation of castiron. In Cast Iron Science and Technology Handbook; Stefanescu, D.M., Ed.; American Society of Materials: Cleveland, OH, USA, 2017; pp. 160–176. [Google Scholar]
- Sillen, R.V. Novacast Technologies. 2006. Available online: www.novacast.se (accessed on 10 December 2006).
- Kanno, T.; Iwami, Y.; Kang, I. Prediction of graphite nodule count and shrinkage tendency in ductile cast iron with 1 cup thermal analysis. Int. J. Metalcast. 2017, 11, 94–100. [Google Scholar] [CrossRef]
Figure 1.
Typical structure of grey cast iron (a), <2% carbides and mottled cast irons, (b) 8% carbides; (c) 20% carbides.
Figure 1.
Typical structure of grey cast iron (a), <2% carbides and mottled cast irons, (b) 8% carbides; (c) 20% carbides.

Figure 2.
Experimental schedule for thermal (cooling curve) analysis.

Figure 3.
Representative cooling curve and its first derivative for the tested cast irons: (a) un-inoculated iron; (b) inoculated iron (0.15 wt.% alloy); (c) over-inoculated iron (1.2 wt.% alloy); (d) Te-added iron.
Figure 3.
Representative cooling curve and its first derivative for the tested cast irons: (a) un-inoculated iron; (b) inoculated iron (0.15 wt.% alloy); (c) over-inoculated iron (1.2 wt.% alloy); (d) Te-added iron.


Figure 4.
The lowest (TEU) and the highest (recalescence) (TER) temperatures of eutectic reaction and of the end of solidification (TES) (influence of metallurgical treatments, as average values (a) and the range and average values (b) of un-and-normal inoculated irons (0.15/wt.% alloy), WI—White (carbidic) iron).

Figure 5.
Solidification undercooling degree of un-and-inoculated grey cast irons referring to stable (ΔTm) and metastable (ΔT1, ΔT2, ΔT3) eutectic temperatures, and eutectic recalescence (ΔTr) of the experimental heats (ΔTs: (1) calculated; (2) measured).
Figure 5.
Solidification undercooling degree of un-and-inoculated grey cast irons referring to stable (ΔTm) and metastable (ΔT1, ΔT2, ΔT3) eutectic temperatures, and eutectic recalescence (ΔTr) of the experimental heats (ΔTs: (1) calculated; (2) measured).

Figure 6.
Undercooling referring to the metastable eutectic temperature (Tmst) at the end of solidification (ΔT3) and at the lowest eutectic temperature (ΔT1) relationship.
Figure 6.
Undercooling referring to the metastable eutectic temperature (Tmst) at the end of solidification (ΔT3) and at the lowest eutectic temperature (ΔT1) relationship.

Figure 7.
Maximum recalescence rate (TEM) (a) and the value of the first derivative of the cooling rate at the end of solidification (FDES) (b) of un-and-inoculated grey cast irons.
Figure 7.
Maximum recalescence rate (TEM) (a) and the value of the first derivative of the cooling rate at the end of solidification (FDES) (b) of un-and-inoculated grey cast irons.

Figure 8.
Relative clear chill (RCC) depending on wedge sample cooling modulus (a), ΔT1 (b), ΔT2 (c) and ΔT3 (d) of inoculated grey cast irons.
Figure 8.
Relative clear chill (RCC) depending on wedge sample cooling modulus (a), ΔT1 (b), ΔT2 (c) and ΔT3 (d) of inoculated grey cast irons.


Table 1.
Experimental procedure schedule of grey cast irons.
| Iron * | CC | Thermal Analysis | Tst | Tmst | Wedge Sample [chill] | ||||
|---|---|---|---|---|---|---|---|---|---|
| Temper.-Time | Under-Cooling | Calculus [Si] | Measured [O-In] | Calculus [Si] | Measured [Te] | ||||
| A | UI | × | × | × | × | - | × | - | - |
| B | In | × | × | × | × | - | × | - | × |
| C | In + Te | × [C = B] | × | × [ΔT(1−3)] | × [C = B] | - | × [C = B] | × | - |
| D | O-In | - | × | × [ΔTm] | - | × | - | - | - |
* UI: un-inoculated; In: inoculated (0.15 wt.% alloy); O-In: over-inoculated (1.2 wt.% alloy); Te: Tellurium addition CC-chemical composition evaluation.
Table 2.
Dimensions of Standard Test Wedges (ASTM A367).
| Wedge No. | Wedge Dimensions (mm) | Angle Deg. (A) | Calculated Parameters | |||
|---|---|---|---|---|---|---|
| Width (B) | Height (H) | Length (L) | Wedge Section Area (mm2) | Cooling Modulus (cm) | ||
| W1 | 5.1 | 25.4 | 101.6 | 11.5 | 64.8 | 0.11 |
| W2 | 10.2 | 31.8 | 101.6 | 18.0 | 162.2 | 0.21 |
| W3 | 19.1 | 38.1 | 101.6 | 28.0 | 363.9 | 0.35 |
| W3½ | 25.4 | 44.4 | 127.0 | 32.0 | 563.9 | 0.45 |
| W4 | 31.8 | 50.8 | 152.4 | 34.5 | 807.7 | 0.54 |
Table 3.
Base chemical composition, pearlitic factor (Px) and carbon equivalent (CE).
| Heat * | Inoc | Chemical Composition (wt.%) | Mn and S | Px | CE (%) | ||||||
|---|---|---|---|---|---|---|---|---|---|---|---|
| C | Si | Mn | P | S | Mn/S | (%Mn) × (%S) | ΔMn | ||||
| 1 | UI | 3.34 | 1.34 | 0.51 | 0.13 | 0.013 | 39.2 | 0.0066 | 0.188 | 5.35 | 3.78 |
| Inoc | 3.27 | 1.41 | 0.50 | 0.13 | 0.013 | 38.4 | 0.0065 | 0.178 | 5.17 | 3.73 | |
| 2 | UI | 3.29 | 1.31 | 0.49 | 0.13 | 0.012 | 40.8 | 0.0059 | 0.170 | 5.38 | 3.72 |
| Inoc | 3.23 | 1.39 | 0.48 | 0.13 | 0.012 | 40.0 | 0.0058 | 0.160 | 5.09 | 3.68 | |
| 3 | UI | 3.38 | 1.31 | 0.51 | 0.14 | 0.014 | 36.4 | 0.0071 | 0.186 | 5.43 | 3.81 |
| Inoc | 3.35 | 1.39 | 0.49 | 0.14 | 0.012 | 40.8 | 0.0059 | 0.170 | 5.21 | 3.80 | |
| 4 | UI | 3.42 | 1.31 | 0.52 | 0.14 | 0.012 | 43.3 | 0.0062 | 0.200 | 5.42 | 3.85 |
| Inoc | 3.31 | 1.4 | 0.49 | 0.15 | 0.013 | 37.7 | 0.0064 | 0.168 | 5.11 | 3.77 | |
| 5 | UI | 3.37 | 1.28 | 0.51 | 0.14 | 0.013 | 39.2 | 0.0066 | 0.188 | 5.49 | 3.79 |
| Inoc | 3.35 | 1.36 | 0.50 | 0.15 | 0.013 | 38.5 | 0.0065 | 0.178 | 5.23 | 3.80 | |
* UI: un-inoculated; Inoc: inoculated (0.15 wt.% alloy); ΔMn = (%Mn) − (1.7*%S + 0.3).
Table 4.
Calculated and measured Tst and Tmst eutectic temperatures of cast irons.
| Heat | Tst, °C | Tmst, °C | ΔTs = Tst − Tmst, °C | |||
|---|---|---|---|---|---|---|
| Calculated [Si] | Measured [TER] [Over-Inoculation] | Calculated [Si] | Measured [TEU = TER] [Te] | Calculated | Measured | |
| 1 | 1162.4 | 1145.7 | 1130.1 | 1122.4 | 32.3 | 23.3 |
| 2 | 1162.3 | 1146.5 | 1130.3 | 1121.2 | 32.0 | 25.3 |
| 3 | 1162.3 | 1150.4 | 1130.3 | 1121.8 | 32.0 | 28.6 |
| 4 | 1162.4 | 1148.2 | 1130.2 | 1122.2 | 32.2 | 26.0 |
| 5 | 1162.1 | 1148.7 | 1130.7 | 1122.5 | 31.4 | 26.2 |
| Range [Difference] | 1162.1– 1162.4 [0.3] | 1145.7– 1150.4 [4.7] | 1130.1– 1130.7 [0.6] | 1121.2– 1122.5 [1.3] | 31.4–32.3 [0.9] | 23.3–28.6 [5.3] |
| Average | 1162.3 | 1147.9 | 1130.3 | 1122.0 | 32.0 | 25.9 |
© 2020 by the authors. Licensee MDPI, Basel, Switzerland. This article is an open access article distributed under the terms and conditions of the Creative Commons Attribution (CC BY) license (http://creativecommons.org/licenses/by/4.0/).
Share and Cite
MDPI and ACS Style
Neacsu, E.L.; Riposan, I.; Cojocaru, A.M.; Stan, S.; Stan, I. Carbide to Graphite Transition Control by Thermal Analysis in Grey Cast Irons. Metals 2020, 10, 993. https://doi.org/10.3390/met10080993
AMA Style
Neacsu EL, Riposan I, Cojocaru AM, Stan S, Stan I. Carbide to Graphite Transition Control by Thermal Analysis in Grey Cast Irons. Metals. 2020; 10(8):993. https://doi.org/10.3390/met10080993
Chicago/Turabian StyleNeacsu, Elena Loredana, Iulian Riposan, Ana Maria Cojocaru, Stelian Stan, and Iuliana Stan. 2020. "Carbide to Graphite Transition Control by Thermal Analysis in Grey Cast Irons" Metals 10, no. 8: 993. https://doi.org/10.3390/met10080993
Note that from the first issue of 2016, this journal uses article numbers instead of page numbers. See further details here.