Estimation of Background Erosion Rate at Janghang Beach due to the Construction of Geum Estuary Tidal Barrier in Korea

1
School of Civil, Architecture and Environmental System Engineering, Sungkyunkwan University, Suwon-si 16319, Korea
2
Graduate School of Water Resources, Sungkyunkwan University, Suwon-si 16319, Korea
*
Author to whom correspondence should be addressed.
J. Mar. Sci. Eng. 2020, 8(8), 551; https://doi.org/10.3390/jmse8080551
Submission received: 15 June 2020
/
Revised: 19 July 2020
/
Accepted: 21 July 2020
/
Published: 23 July 2020
(This article belongs to the Section Coastal Engineering)
Abstract
:In this study, a reduction in sediment budget due to the development of a river watershed, resulting in coastal erosion, was reviewed, and the rate of background erosion was calculated through an examination of the loss of coastal sediment into the open sea. The west coast of the Korean peninsula is severely impacted by the intercept of inflowing sediments from rivers, owing to the watershed development. However, the effects have not fully propagated into the entire coastal area, and thus, the long-term coastal erosion remains insignificant. However, a serious and irrevocable disaster may occur once the coastal erosion begins. Therefore, an analysis of the coastal erosion resulting from changes in the sediment budget, due to the development of the watershed, was conducted on Janghang Songrim Beach. A littoral cell of the Geum River was selected for a quantitative analysis of the decrease in the sediment budget from the watershed development. The rate of coastal sediment loss offshore, which reflects the characteristics of the Janghang Songrim Beach, and the future rate of coastal erosion were calculated. Then, the results were verified by employing geometrically corrected satellite photographs from previous years. This will enable us to predict the time of coastal erosion in the future due to a reduction in the sediment budget and watershed development, and prepare for future disasters resulting from the coastal erosion. Based on research into the components constituting the coastal development, the present study presents theoretical formulae allowing the prediction of the sediment budget and providing a practical contribution to the prevention of coastal erosion, for which additional reliable studies need to be conducted.
1. Introduction
The discharge of sediment into river basins, resulting from changes in land use and forestation, changes in sediment budget in littoral cells through the construction of dams to control water resources, maintenance work conducted on rivers, and installation of underwater weirs, is continuously changing the environment. The construction of dams and estuary barriers can be efficient alternatives to the storage, preservation, and use of water resources; however, this requires the containment of large volumes of soil. The simultaneous construction of dams and estuary barriers along rivers has been known to cause a decline in flowrates, and up to a 95% decrease in the supply of soil level [1]. The indiscriminate development, in particular, of diverse areas comprising river basins and coastal areas since the beginning of industrialization has accelerated the problem of direct and indirect coastal erosion [2].
Some rivers in southern Europe have shown an annual sediment discharge of less than 10% of the amount determined during the 1950s, and the Ebro River in Europe currently shows a sediment discharge that is only 5% of the amount from the same decade [3,4]. Similarly, a study along the Salinas River in California, USA, conducted using a model of the water gate of the Monterey County Water Resources Agency, based on the HEC-2 model of the U.S. Army Corps of Engineers, showed a 32% reduction in the cumulative amount of sediment discharge in comparison with the sediment discharge amount from before the construction of three dams, including the Salinas and Nacimiento dams [5].
In Korea, the damage resulting from coastal erosion due to various factors has been reported since the 1990s, and has become a social issue. Furthermore, no previous assessment is available on the effects of coastal erosion occurring from the intercept of sediment supply from rivers through the development of river basins via construction of dams in the upstream river areas, weirs in the downstream river areas, and estuary barriers, and the resulting changes in the sediment budget in the west coast region of the Korean peninsula. Therefore, as a framework for the analysis on the sediment budget, nine major littoral cells were established for the three seas surrounding the Korean peninsula: the East Sea, Yellow Sea, and Southern Sea; additionally, to help conduct research on the long-term changes along the beachlines and their short-term variabilities, pertinent sub-littoral cells were developed to accumulate measurements along the coastline and conduct biannual observations on the beach profile.
Despite the recognition of the effects of the development in watersheds or rivers on the movement of the littoral drift and on the eventual long-term changes of the coastline, studies in this regard, particularly interpretive ones, have been scarce or non-existent. Studies on the effects of the development of river basins and the resulting coastal erosion started becoming available only recently, with corresponding observations. Furthermore, quantitative studies focusing on the changes in the sediment budget [6,7,8] and the effects, opposite to coastal erosion, of the removal of large scale dams installed in the past in rivers, are now in progress [9,10]. The nature of the effects, which require decades to emerge, can be partially attributed to the above factors. However, contrary to the diverse quantitative analyses conducted by Bruun [11], Zang [12], and Cho et al. [13], on the effects of the sea level rise on coastal erosion, which have been extensively analyzed, the methodology for a temporal interpretation of the effects of coastal erosion due to changes in the environment, including the loss of sand resulting from the installation of submerged breakwaters or a reduced amount of sediment, is yet to be presented.
Thus far, three types of studies have been conducted on littoral cells. The first type represents studies conducted through the development of littoral and sub-littoral cells for an analysis of the littoral cell budget; the second type of studies represents quantitative analyses conducted on how the annual amount of inflowing sand from river flows accumulates along the beach, and how it is lost; and the third type involves studies on the prediction of the shoreline position based on an analysis of the inflow and discharge of sands in the littoral or sub-littoral cells. The U.S. Army Corps of Engineers [14,15] predicted the amounts of inflowing sand and littoral sediment based on the concept of littoral sediment, based upon which Caldwell [16] conducted an analysis of the regional sediment budget. Dolan et al. [17], and Kana and Stevens [18] quantified the source and sink of sediments affecting the sediment budget by employing a “conceptual sediment budget”, and constructed a component dataset to verify the validity of the developed model.
Kraus and Rosati [19,20] presented a mass conservation formula for sediment budget, and attempted to classify the components of such a budget in concrete terms, and Patsch and Griggs [21] contributed to a quantitation of the components of the sediment budget in areas around Eureka and Santa Cruz in California, USA, by employing a box model, which exploits the concept of conservation of matter. Recently, the Environment Agency [22] in the United Kingdom presented the Practitioners’ Guideline for Sediment Budget Analysis, which includes the concrete essentials and volume of littoral drift for an analysis of the sediment budget to prepare for a severe loss of the total amount of sediment.
Such presentations of littoral drift are useful as basic data for the evaluation of the effects of the respective background erosion rate resulting from the development of coastal waters and coastal landward boundaries as factors affecting coastal erosion, as well as for an analysis of the balance in the sediment budget. Kaminsky et al. [23] conducted a study to predict the future shoreline (2020) by employing past satellite images (1950–1990), sediment discharge from rivers, and littoral sediment from the Columbia River Littoral Cells in the southwest part of Washington state and the northwest part of Oregon; however, the study applied a scenario-based prediction, and thus, a study on the background erosion rate considering deficiency in the sediment in a littoral cell remains insufficient.
In the present study, the concept of loss of sand to the open sea and its methodology are presented to predict the evolution of the coastline resulting from the reduction in the river sediment discharge. This will enable the analysis of the temporal effects of the reduction in the sediment load in rivers. To verify its validity, the presented methodology was applied to Janghang Songrim Beach of Janghang Eub, Seocheon County, Chungcheongnam-do, located in the vicinity of the Geum River estuary barrier. The reduction in the sediment budget was quantitated by analyzing the states of development in the watershed (construction of dams and estuary barriers), and the quantitated results were applied to the area employed in the present study to identify the loss of sediment into the open sea by using past satellite photographs to predict the annual inflow amount of sand into the Janghang Songrim Beach. The width of the shoreline retreat in the future (for the years 2050 and 2100) is also predicted.
2. Site Description
The area selected for the analysis on river basin development is the drainage area of the Guem River, flowing into the West Sea of the Korean peninsula. The river basin area, river channel length, and average width of the river basin are approximately 9915 , 384.8 km, and 25 km, respectively. The upstream area of the Geum river bed is comprised of coarse gravel with a median grain size of approximately 43 mm, which tends to change, while moving downstream, to fine gravel with a median grain size of 17 mm, and ultimately to very fine gravel [24]. The entire river basin area consists of 63% forest, 15% rice paddies, 11% fields, 9% urban areas, and 3% grassy areas and bare ground. In 1975, the forest area occupied 65% of the entire river basin, and has been decreasing continuously, reaching 62% in 2015. By contrast, the urban area tended to increase every year, occupying 9% of the river basin in 2015 [25].
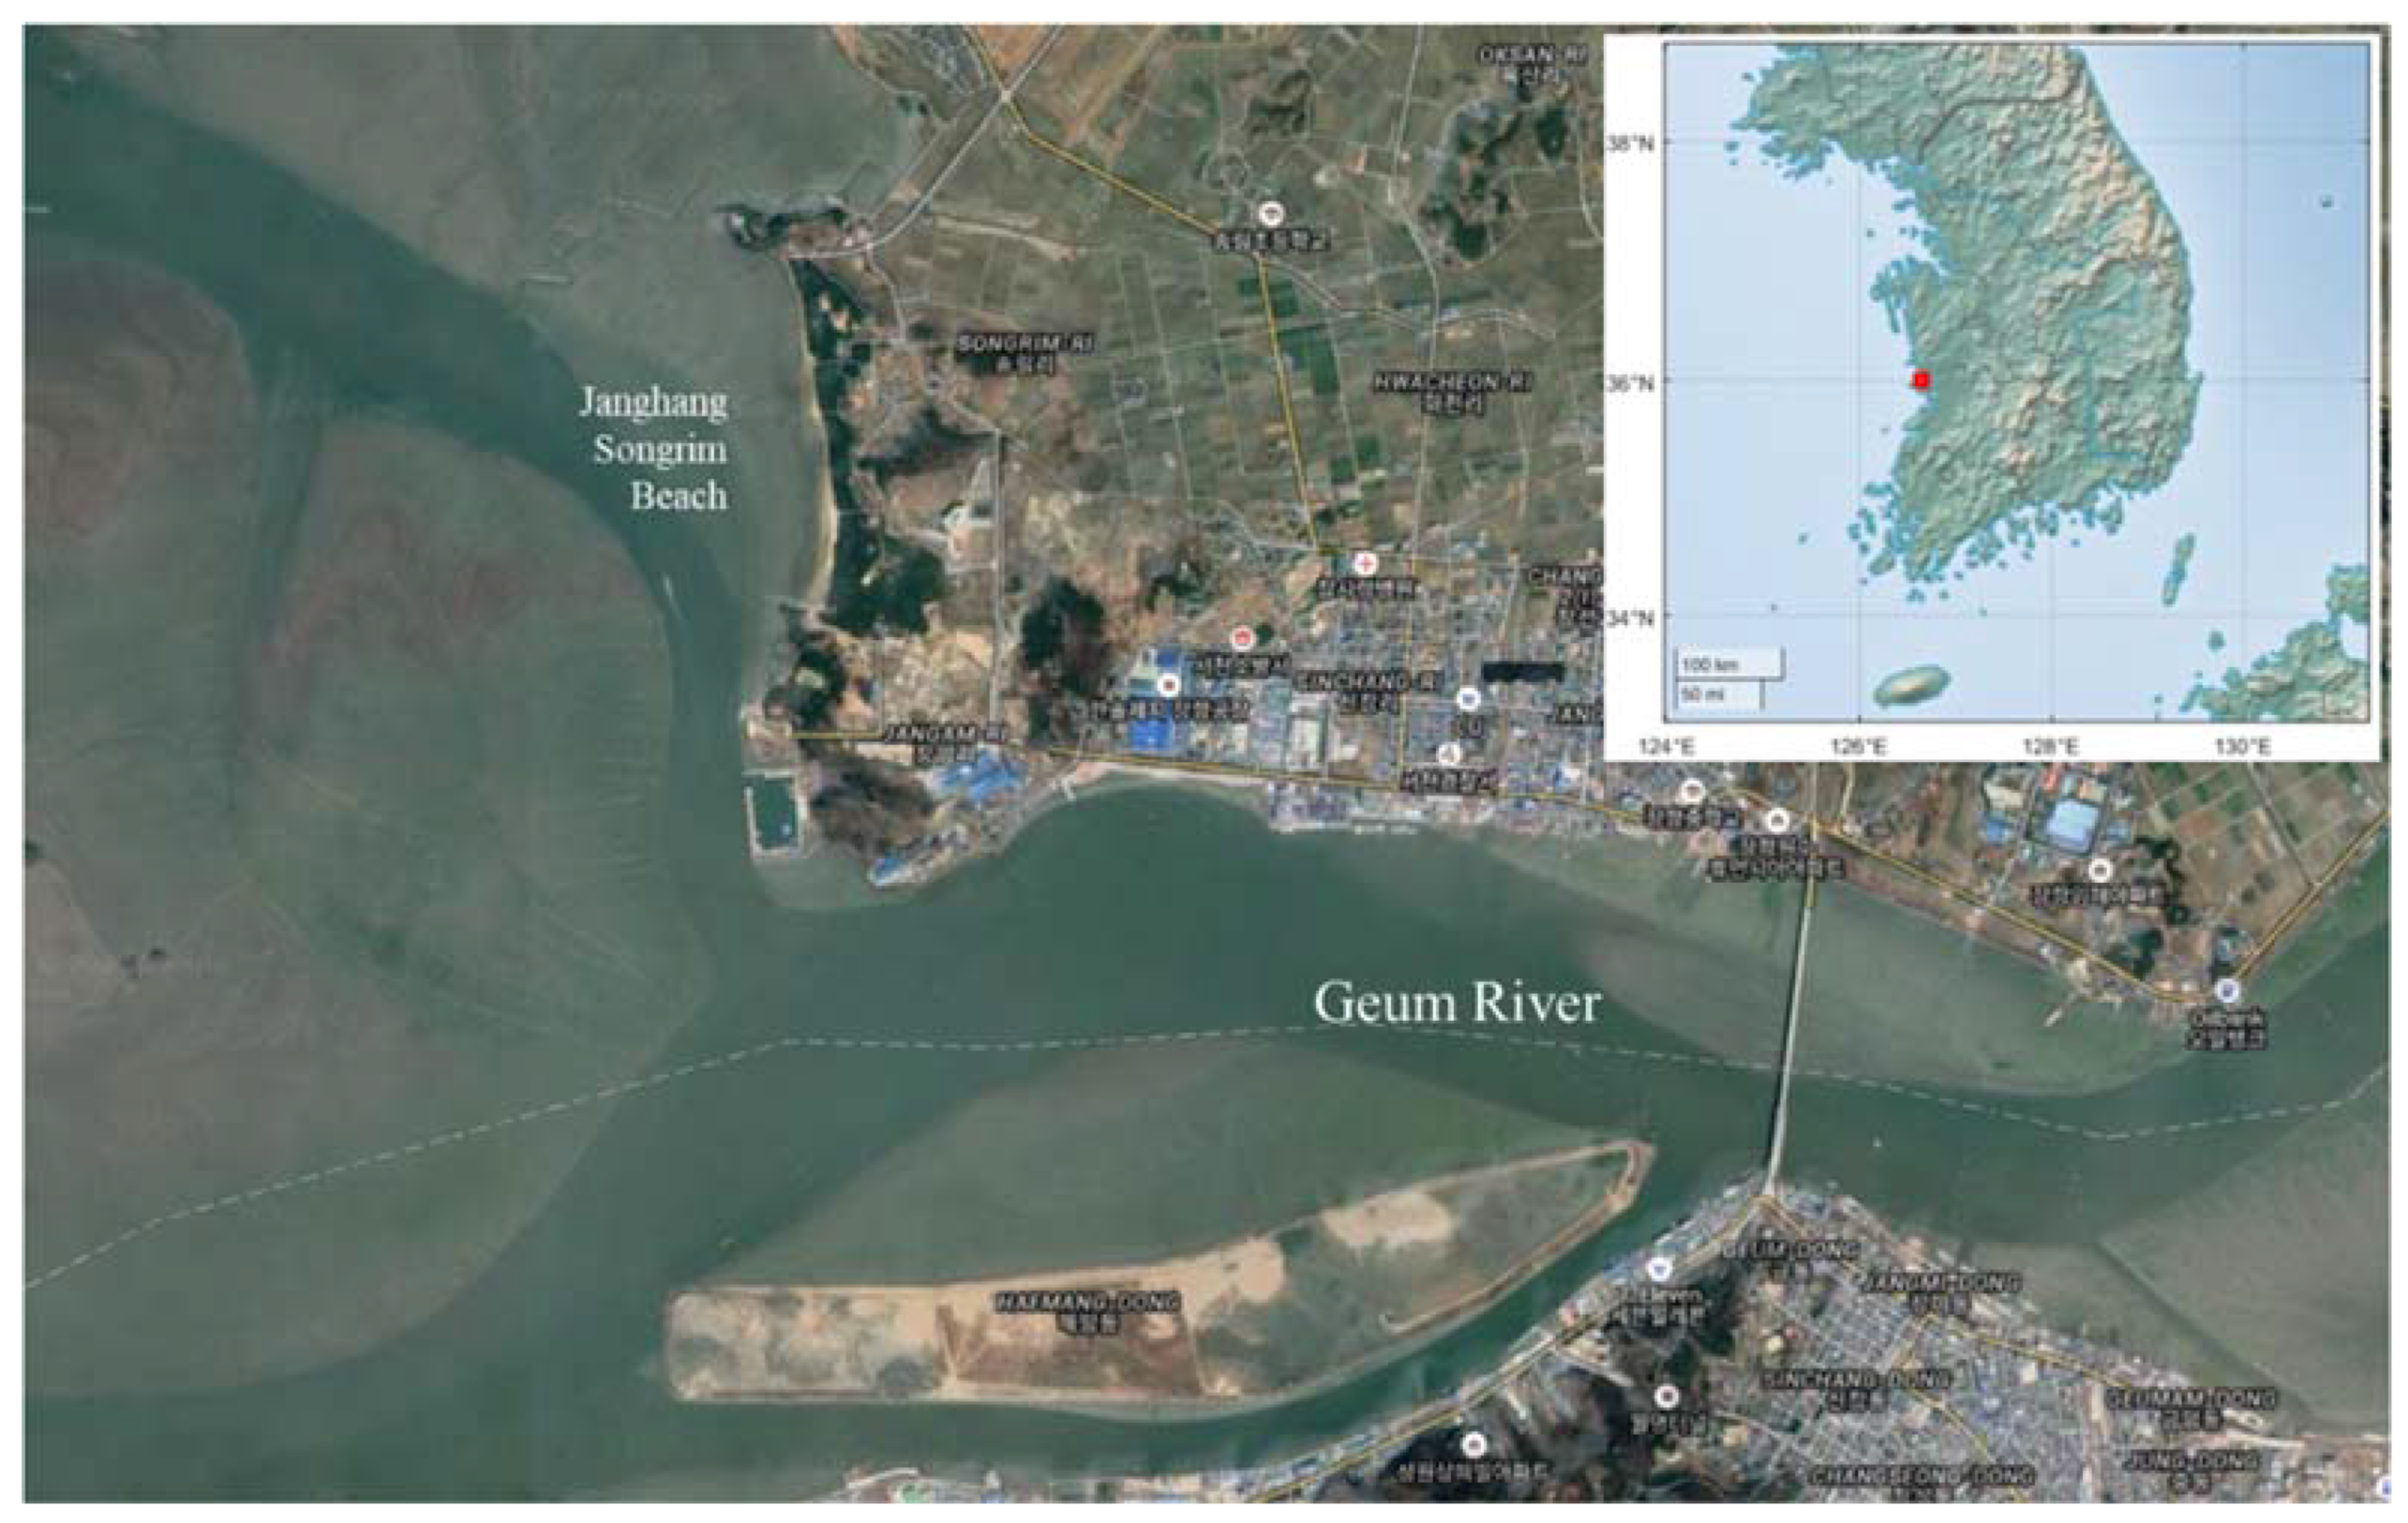
The Janghang Songrim Beach, located in the southwest part of the Korean peninsula, which is close to the Geum River estuary, and is thus exposed to the effects of the inflow of sands discharged from the river, is considered in this study (Figure 1). At over 1 km in length, Songrim is a sandy beach surrounded by a wind break forest of pine trees, which attracts tourists, mostly families. The beach is also inhabited by seasonal birds in their respective habitats. However, according to the results of the coastal erosion monitoring, the gradual erosion of the beach has been ongoing for 35 years, since 1985 when the construction of the Geum River estuary barrier was completed. The area is currently classified as vulnerable to damage from coastal erosion [26].
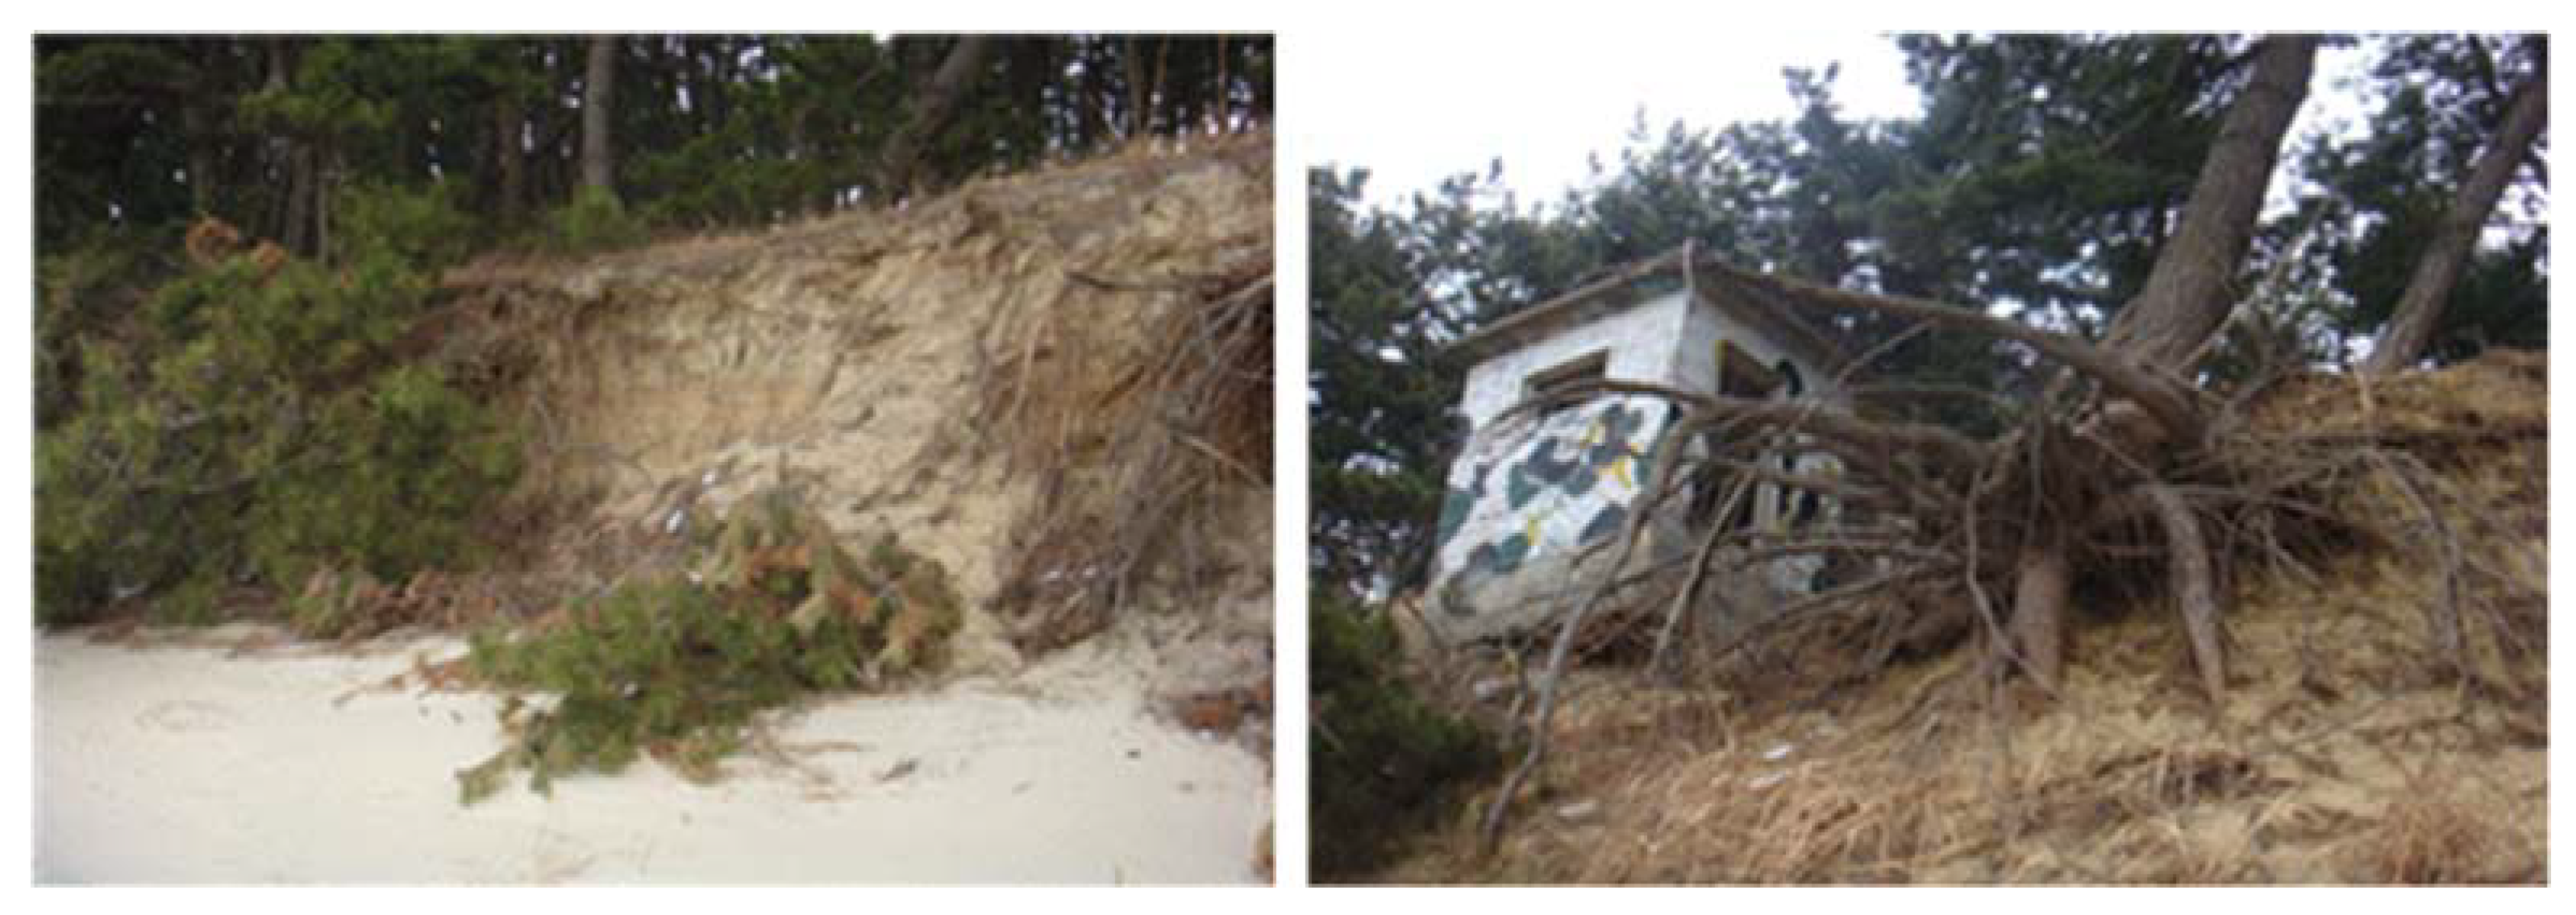
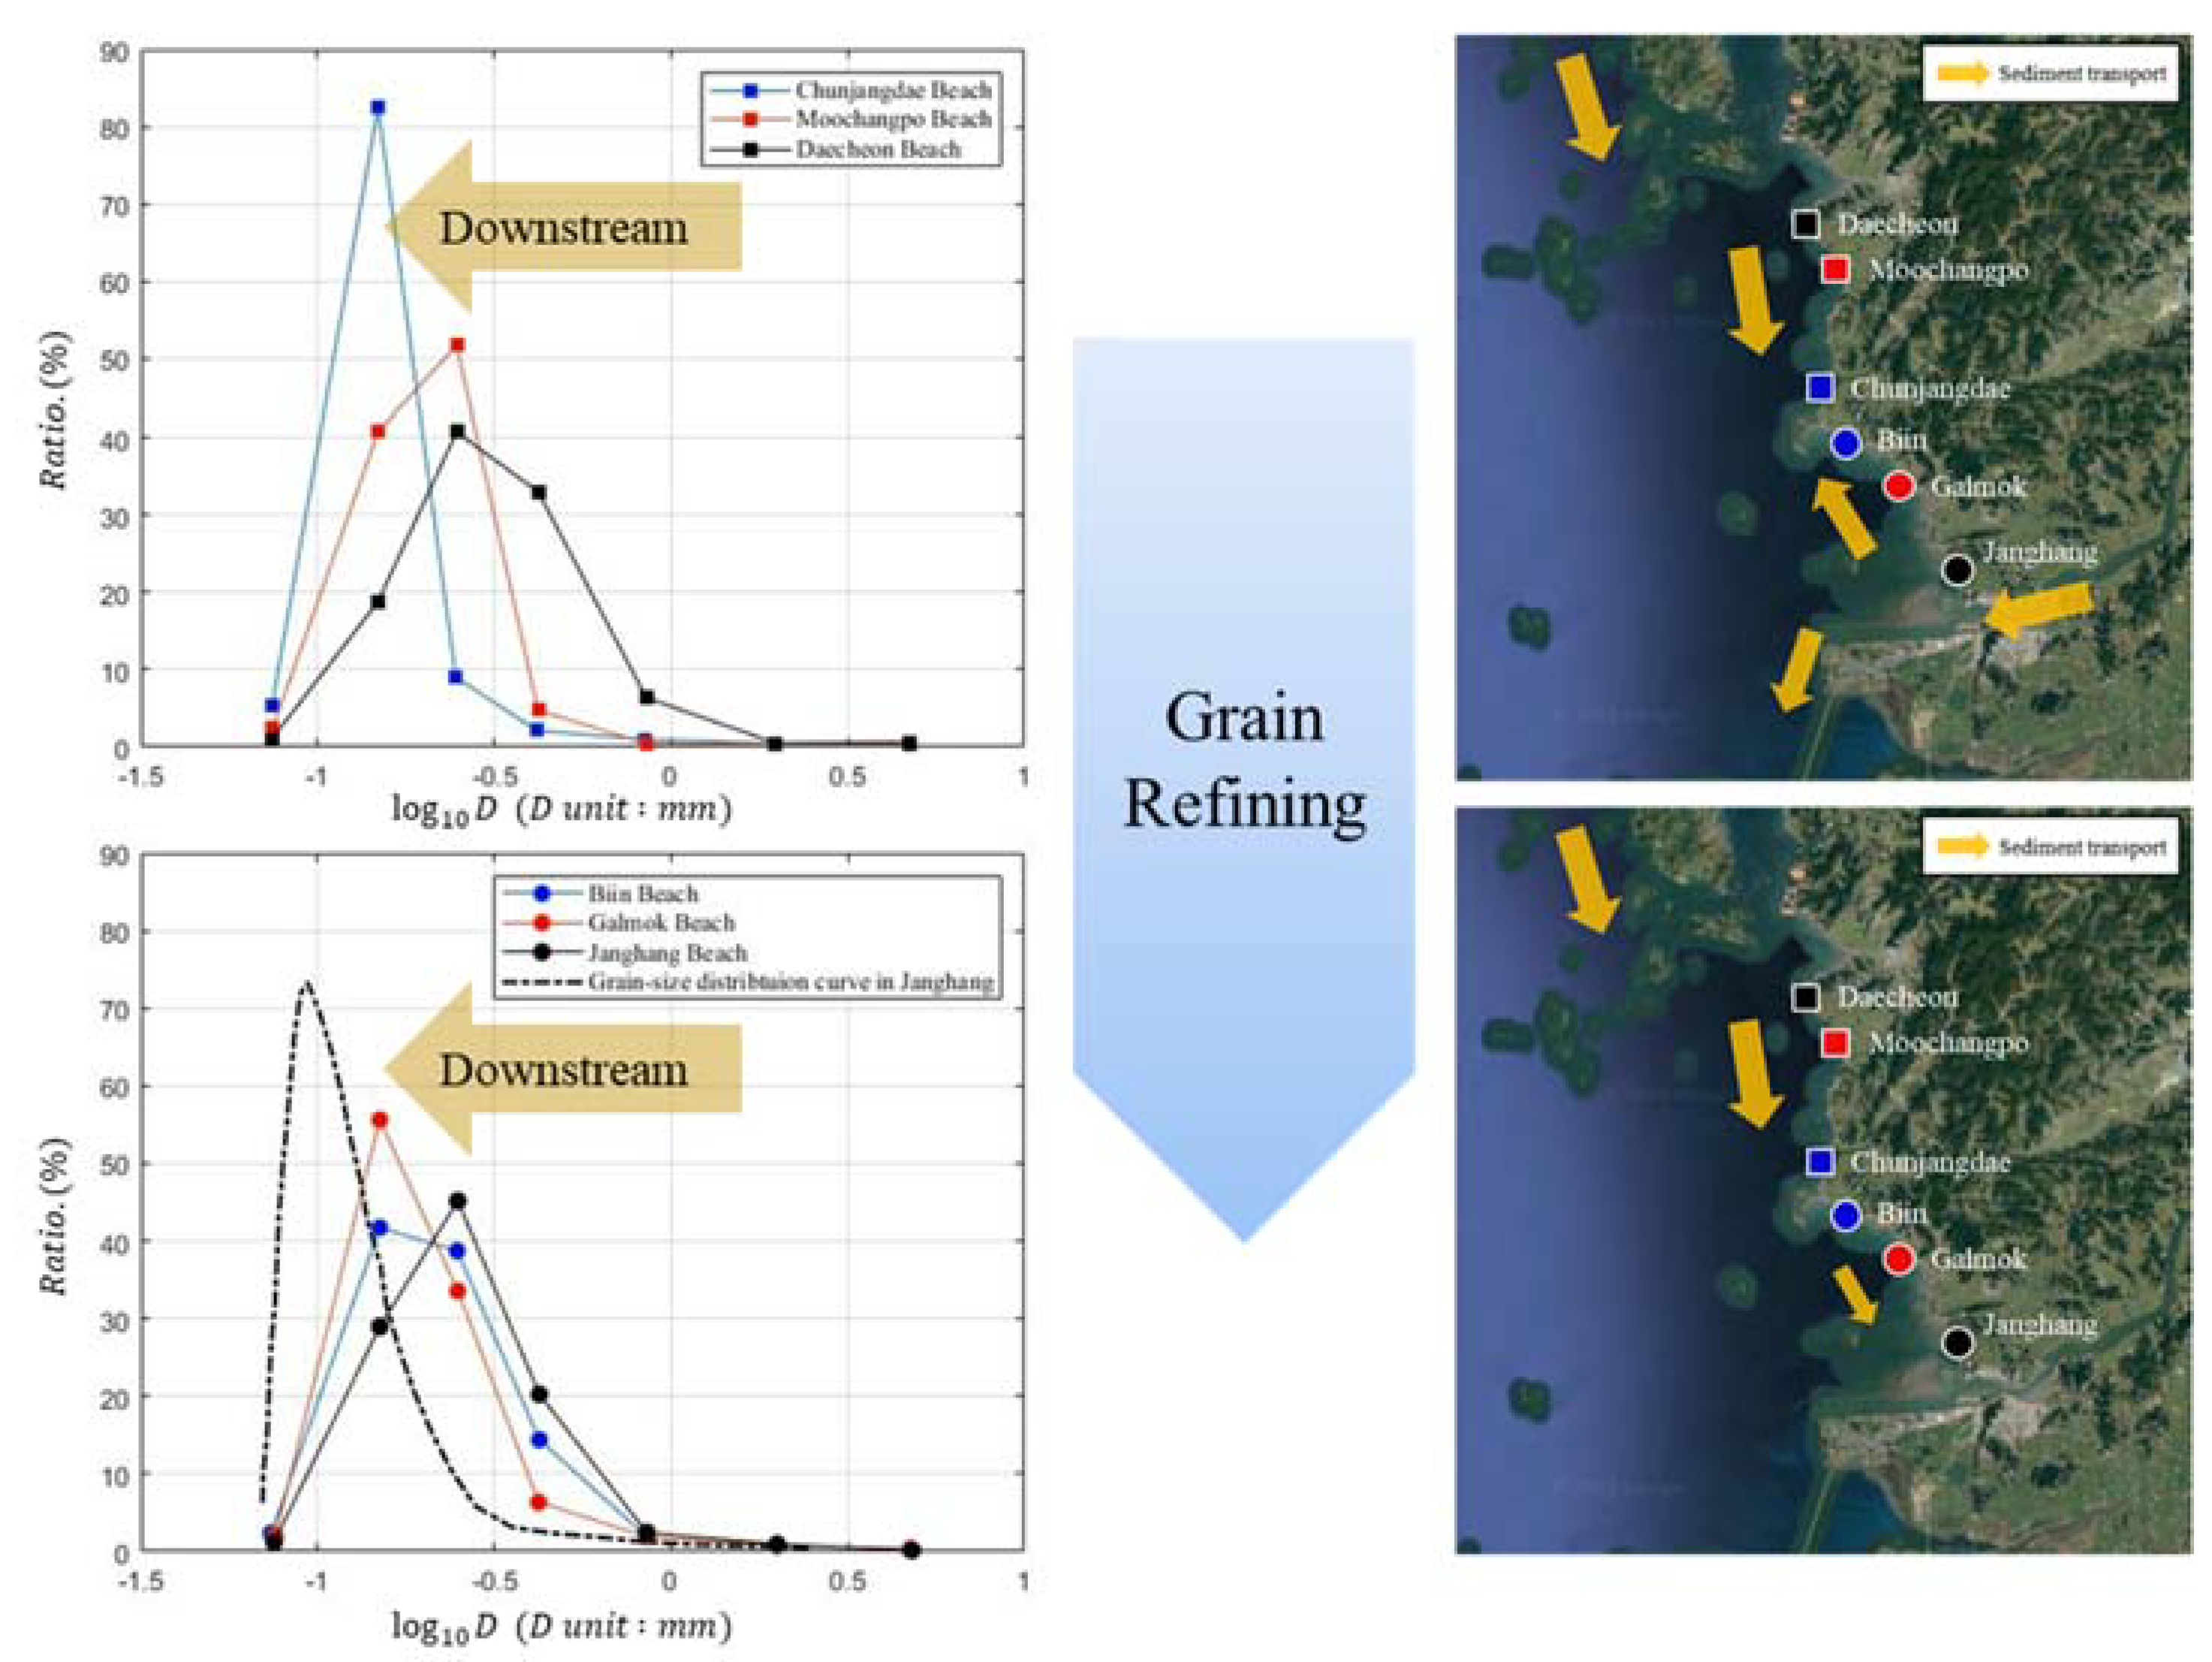
Figure 2 shows a photograph captured in 2012, when the roots of the pine trees in the wind break forest were exposed, owing to the evolving erosion to the edge of the beach, indicating the risk of damage from the collapse of nearby structures. Additionally, the accumulation of sediment of the sands discharged from the Geum River was interrupted by the construction of the estuary barrier, which caused the northward drift of the littoral to change to a southward direction, eventually resulting in the sands peripheral to the beach turning into fine grains (Figure 3).
3. Theoretical Background
3.1. Mass Conservation in Littoral Cell
To properly understand the progression or retreat of the beachline, knowledge of the origination and mechanism of the sediment inflow, as well as its subsequent movement, is essential. The varying changes in the coastline are mainly affected by sea waves, and most of the short-term changes are dependent on the conditions of such waves; a sudden erosion of the beach can recover quickly when the sea waters become calm. The time to recover from erosion extends from a few days, in the case of high waves, to several months, and the erosion is attributable to changes in the direction of the seasonal waves. However, in the case of a continuous progression or retreat of the entire beachline for a long period, a break in the state of equilibrium of the sediment budget occurs, resulting from changes in the amount of inflow (source) and discharge (loss) of sediment.
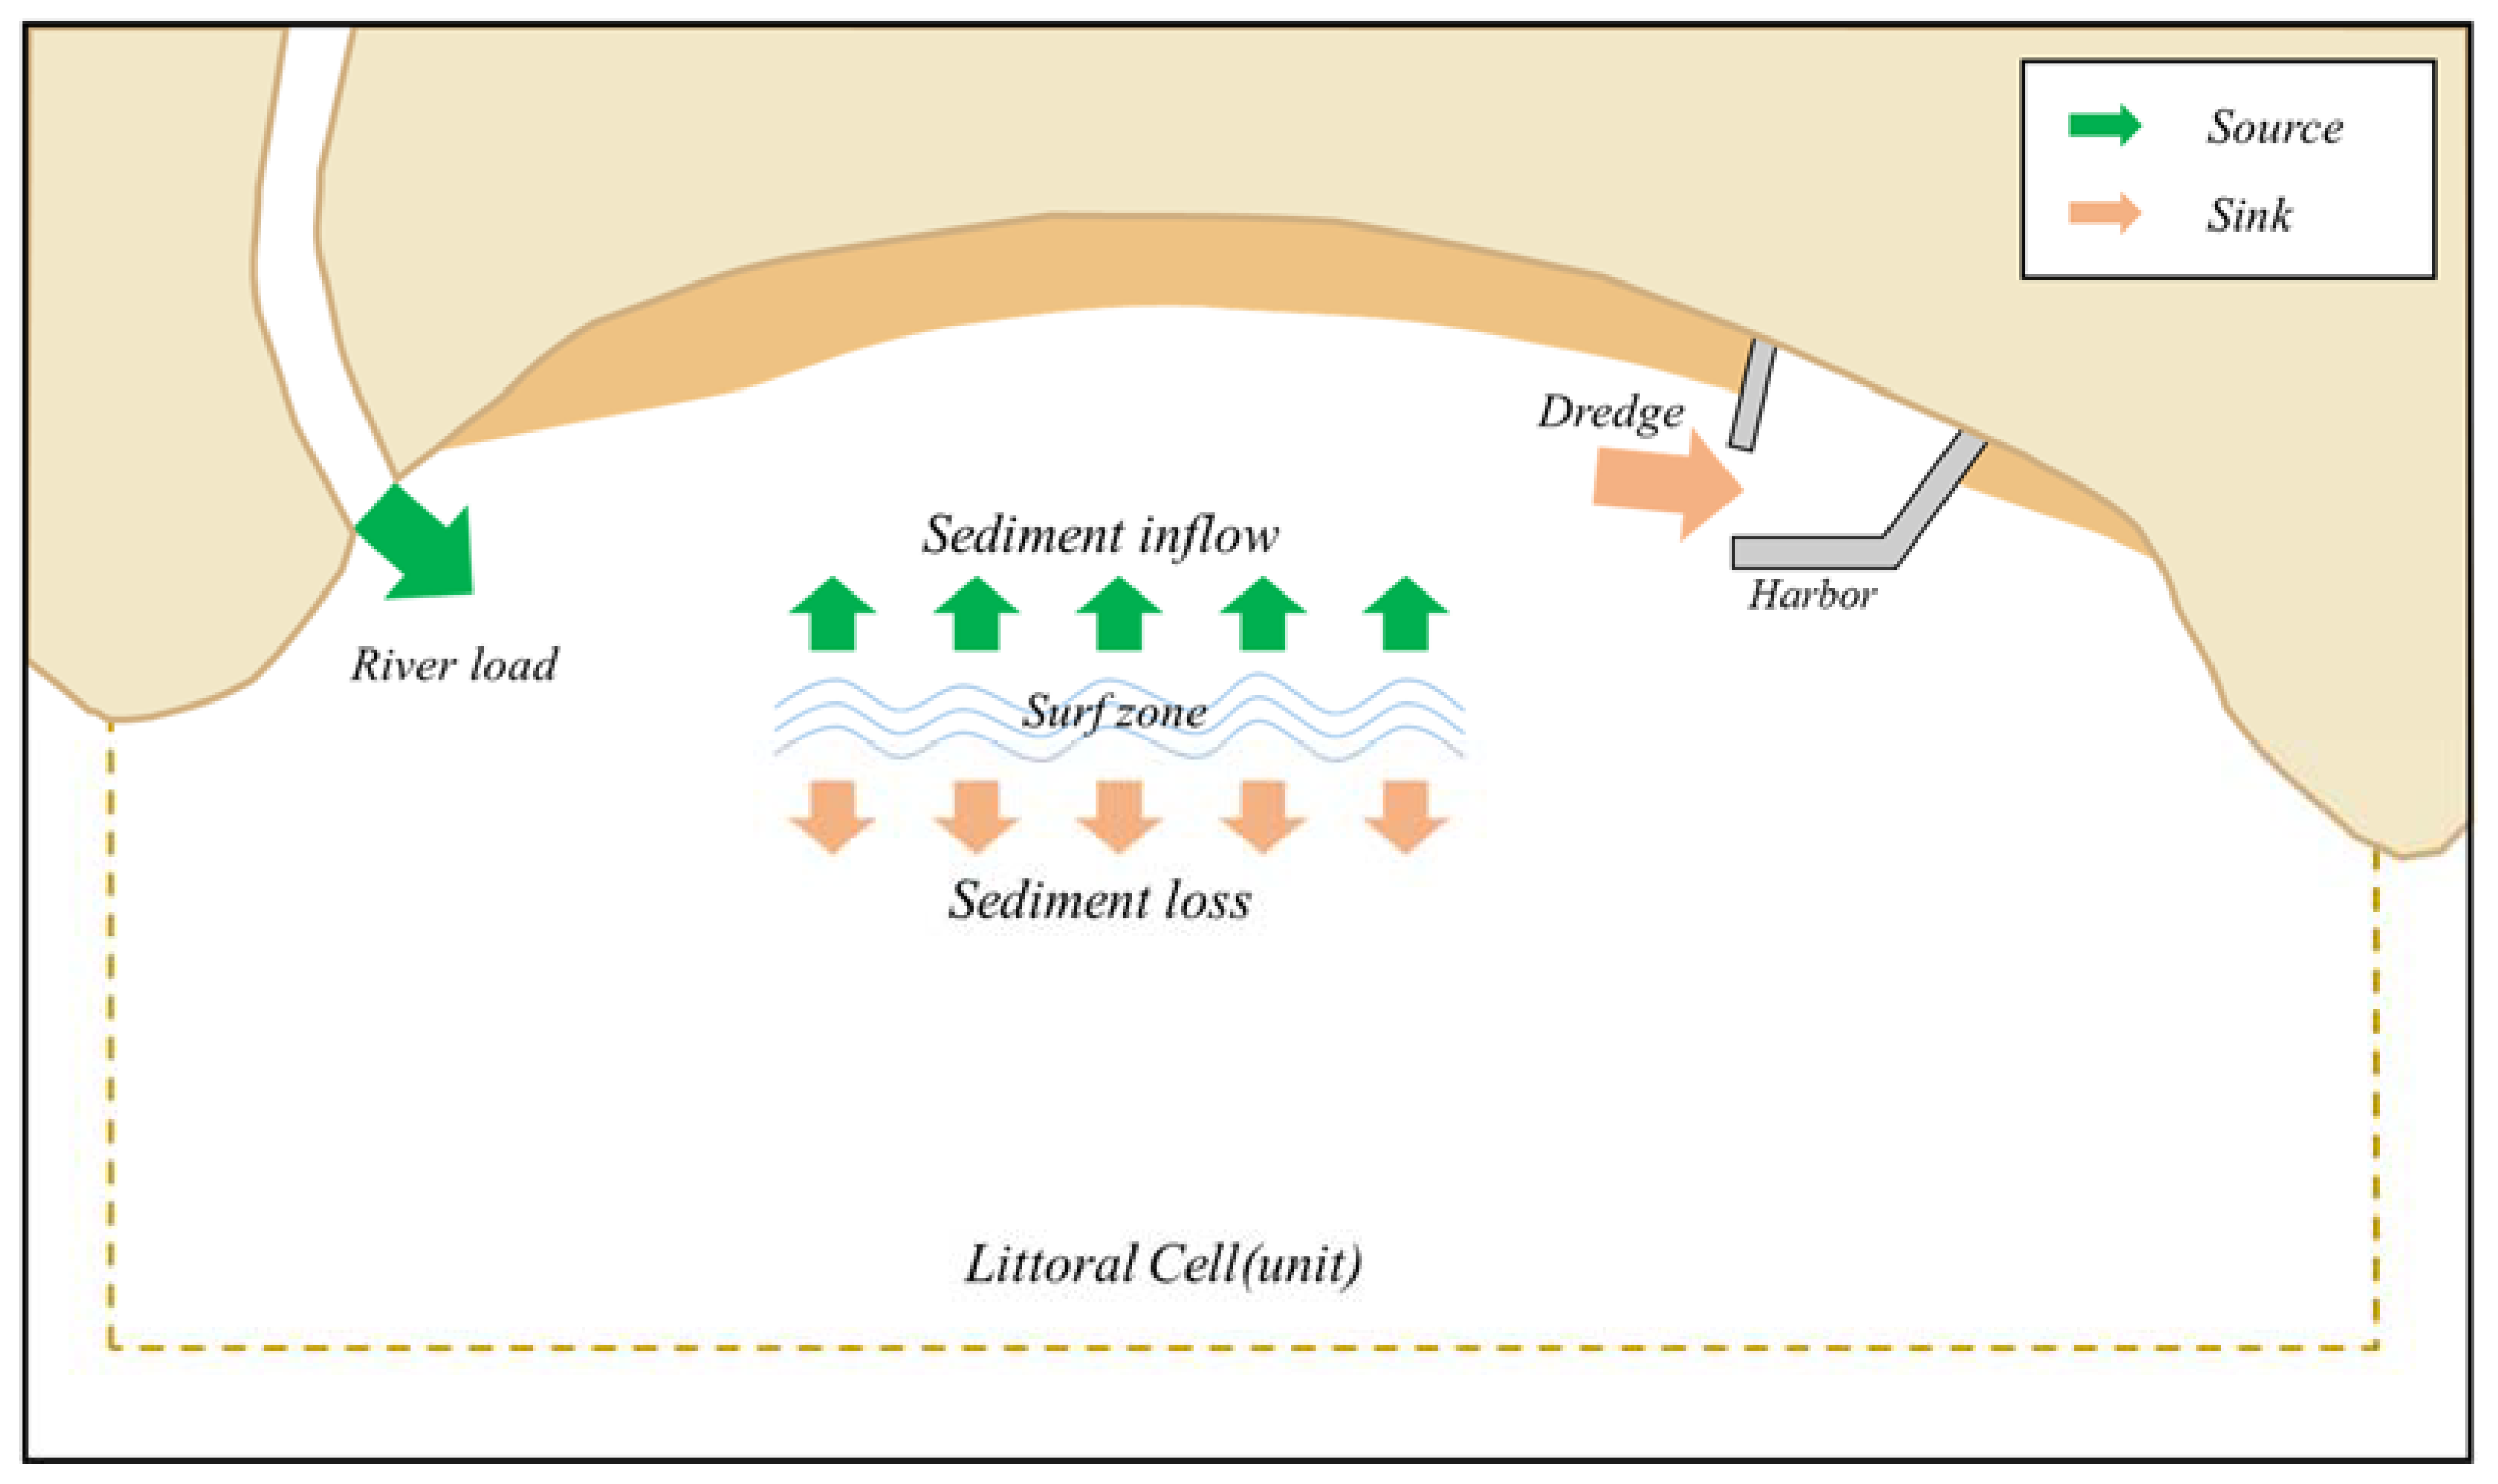
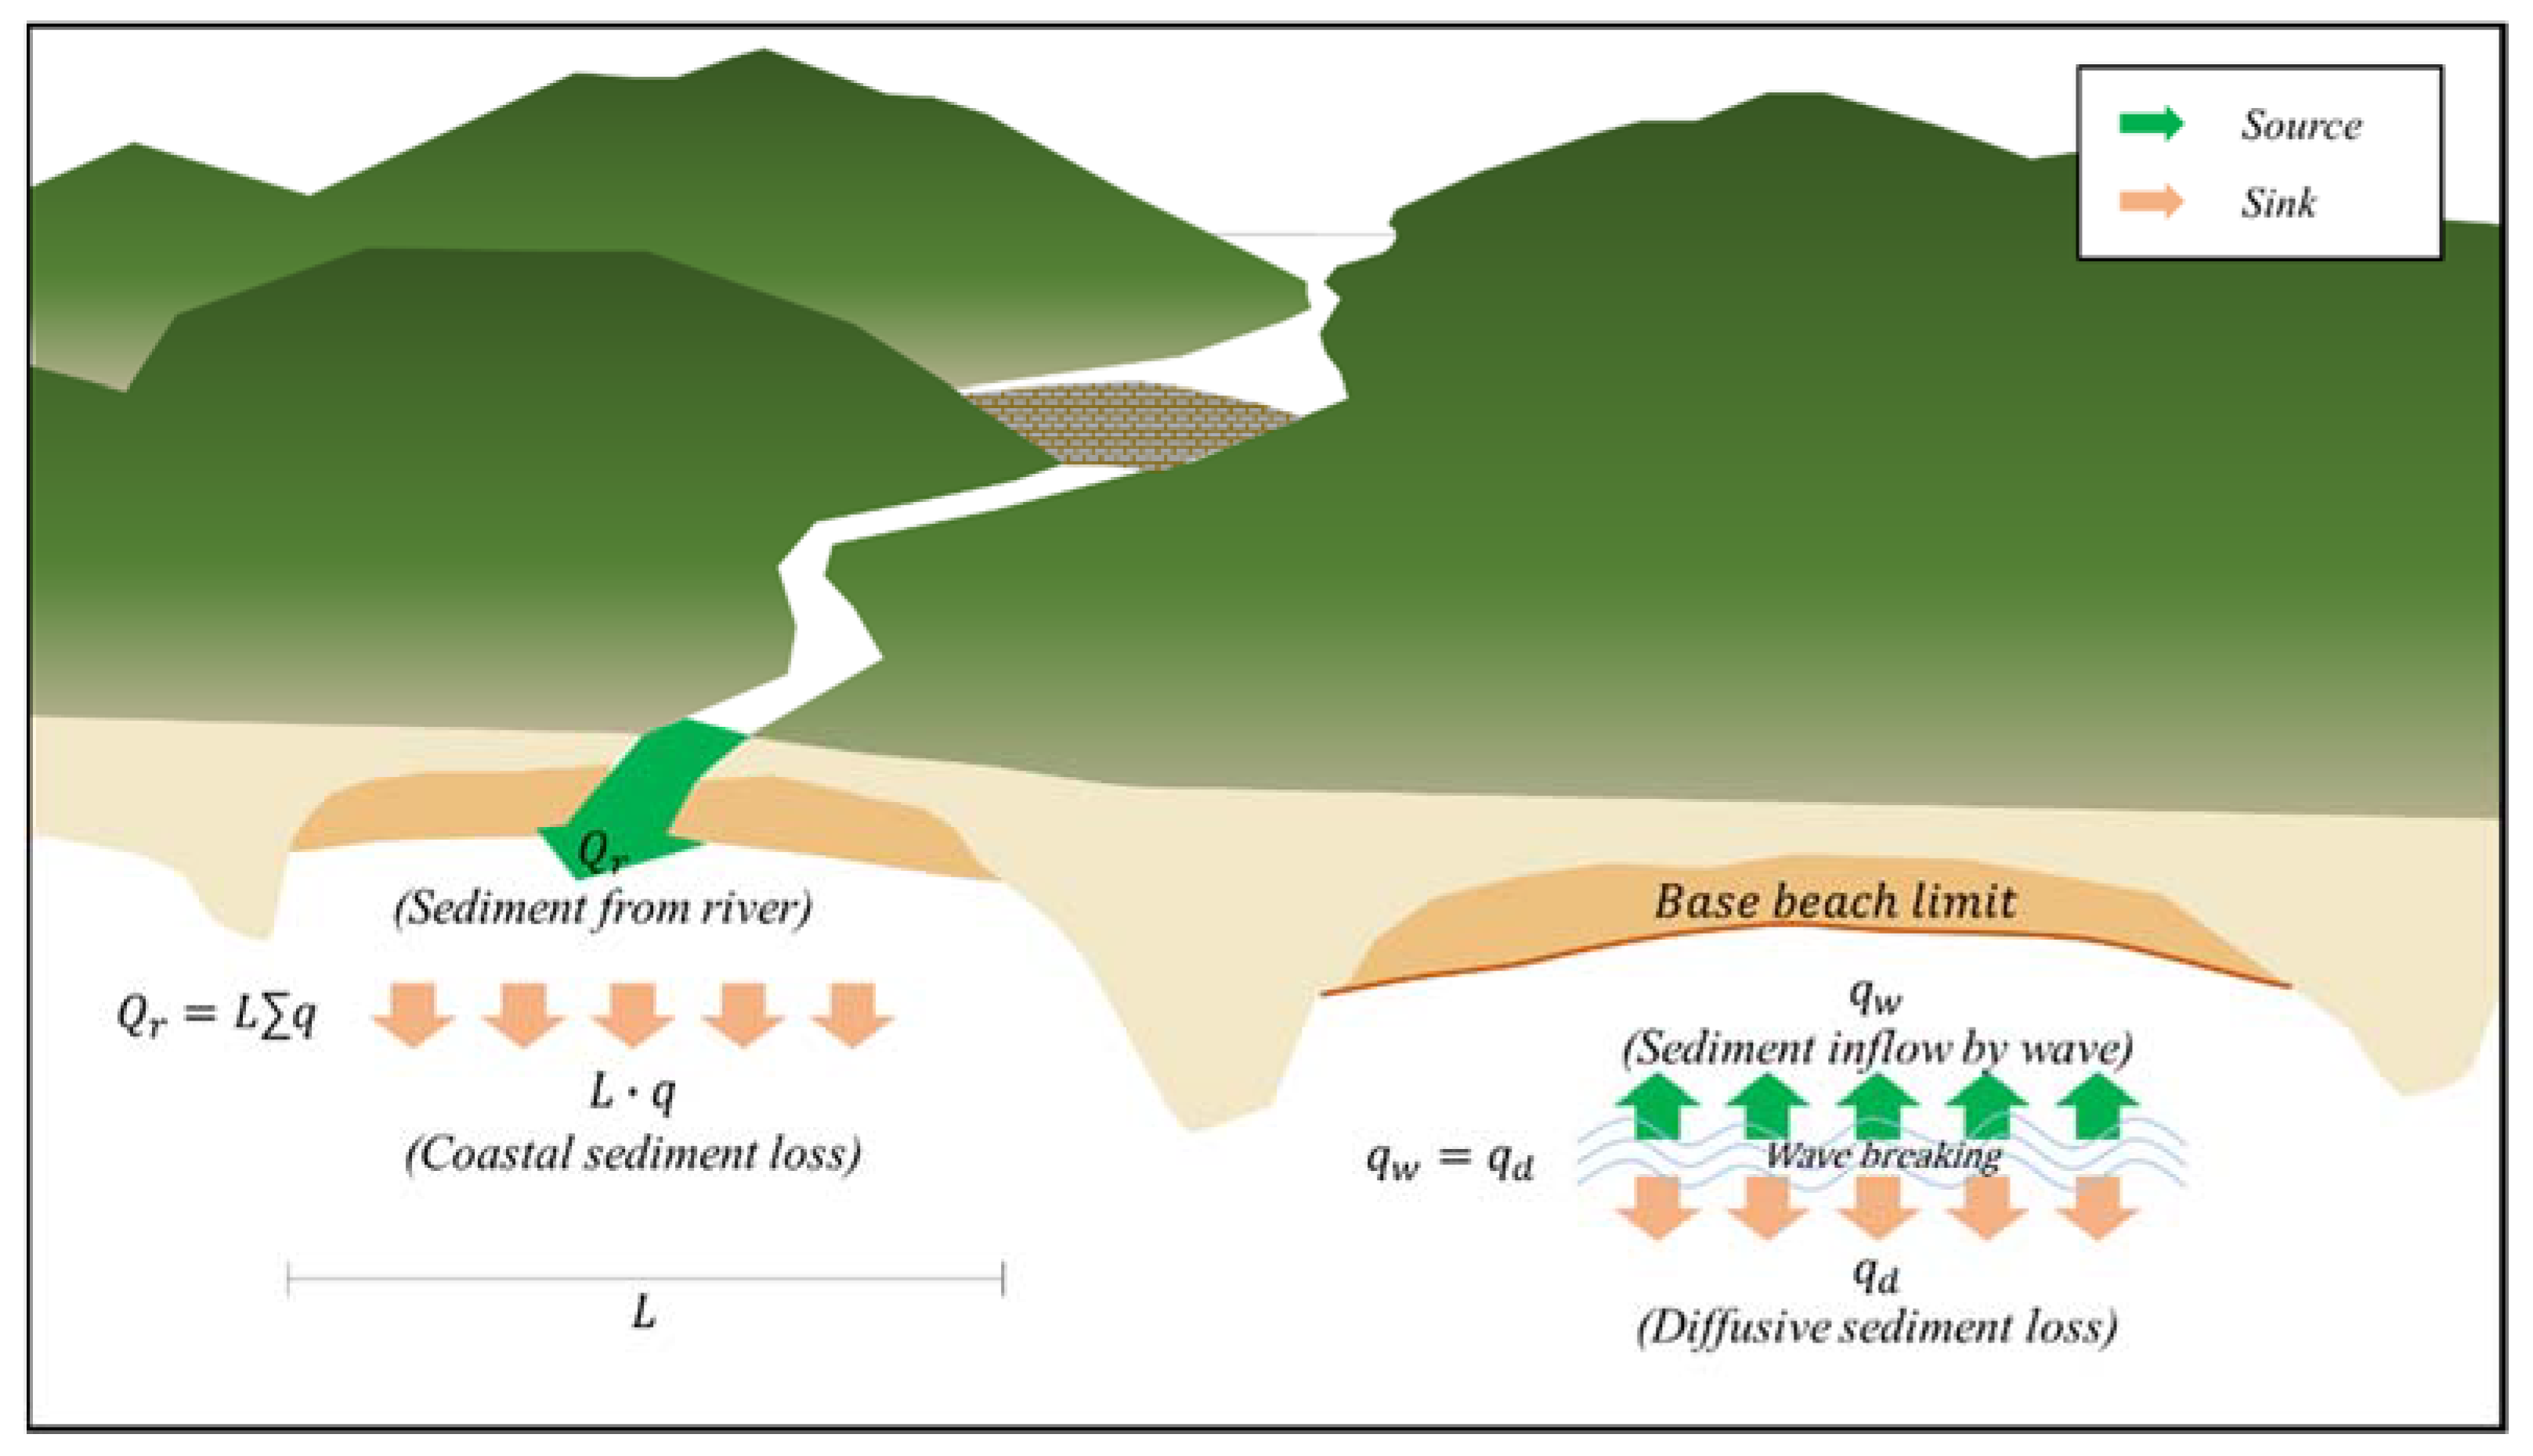
To identify changes in the amount of inflow of sediment onto a beach, an analysis of the sediment budget in a littoral cell, in which the inflow and sediment discharges are counted based on the components constituting the beach, is needed [27,28,29]. Figure 4 below shows the system of the sediment budget in a littoral cell.
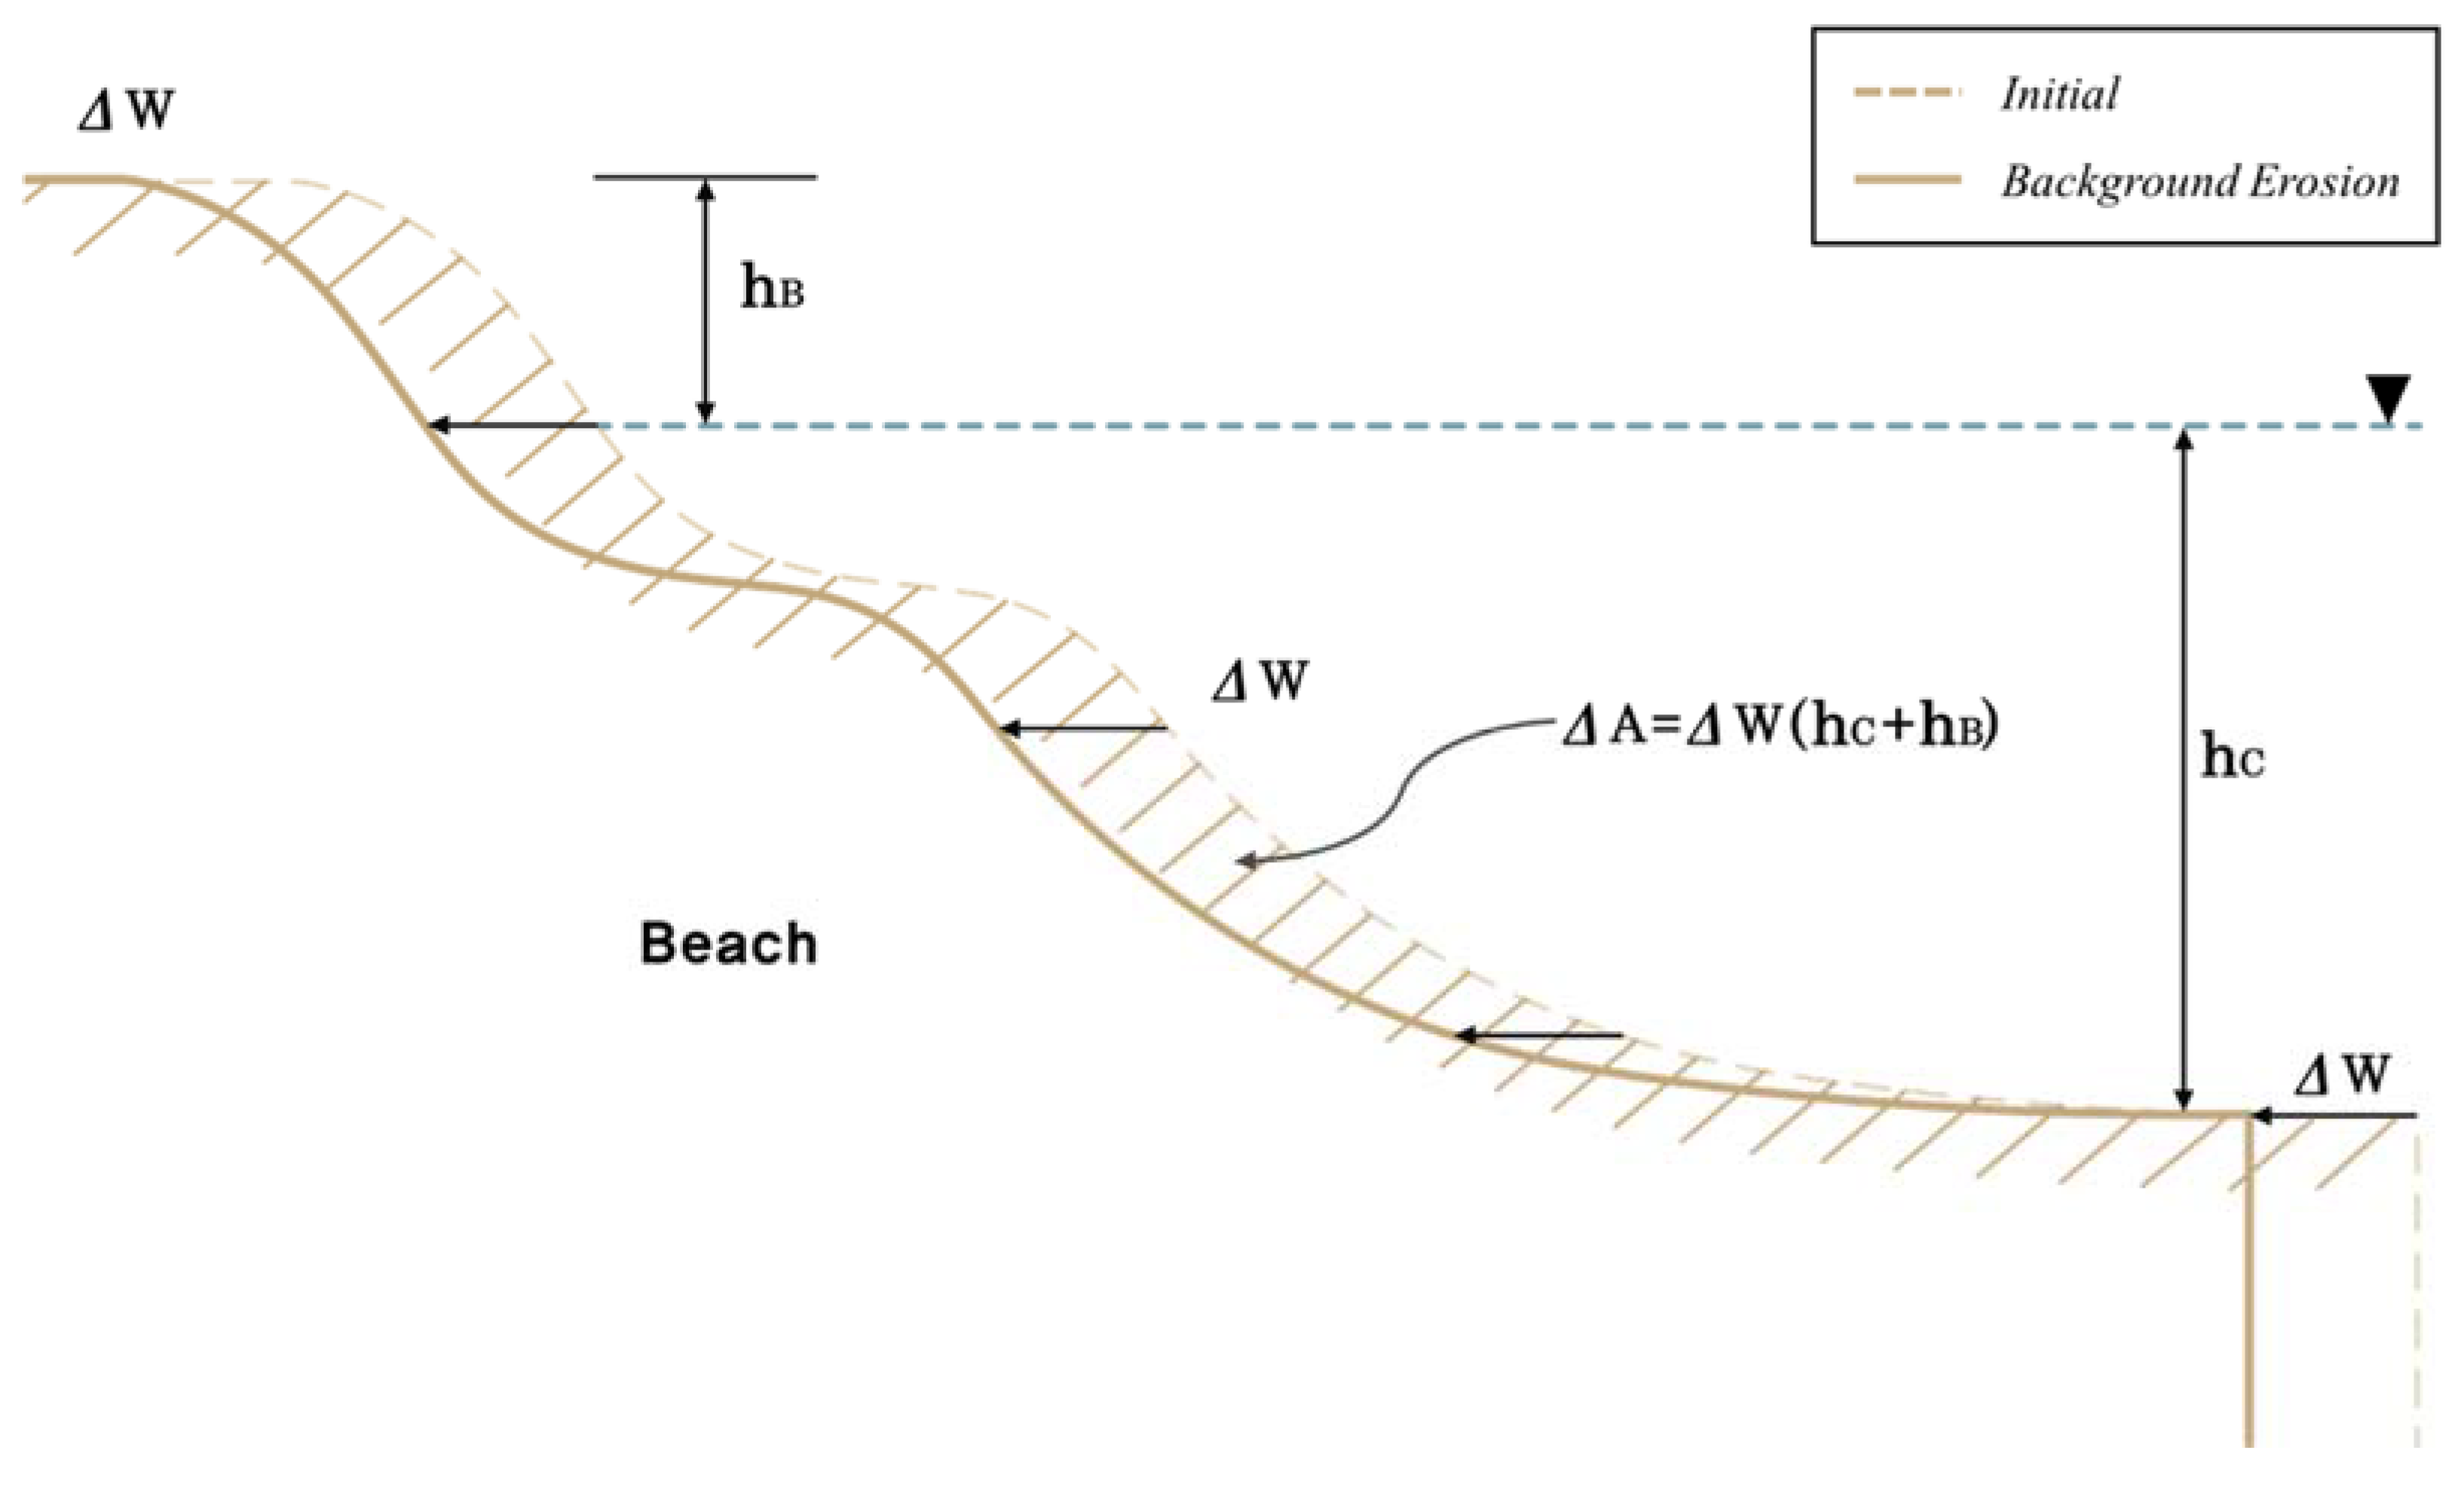
The simultaneous erosion occurring along an entire beach is regarded as erosion from changes in sediment budget in a corresponding littoral cell; this implies that the amount of loss of sediment is greater than the inflow. As illustrated in Figure 5, the width of the beachline erosion (ΔW), owing to a reduction in the sediment budget determined from the analysis, is estimated by employing the mass conservation formula for a sediment budget. In the analysis, a decrease in the width of the beachline erosion, owing to a reduction in the sediment budget, is regarded as one of the major causes of background erosion in a littoral cell.
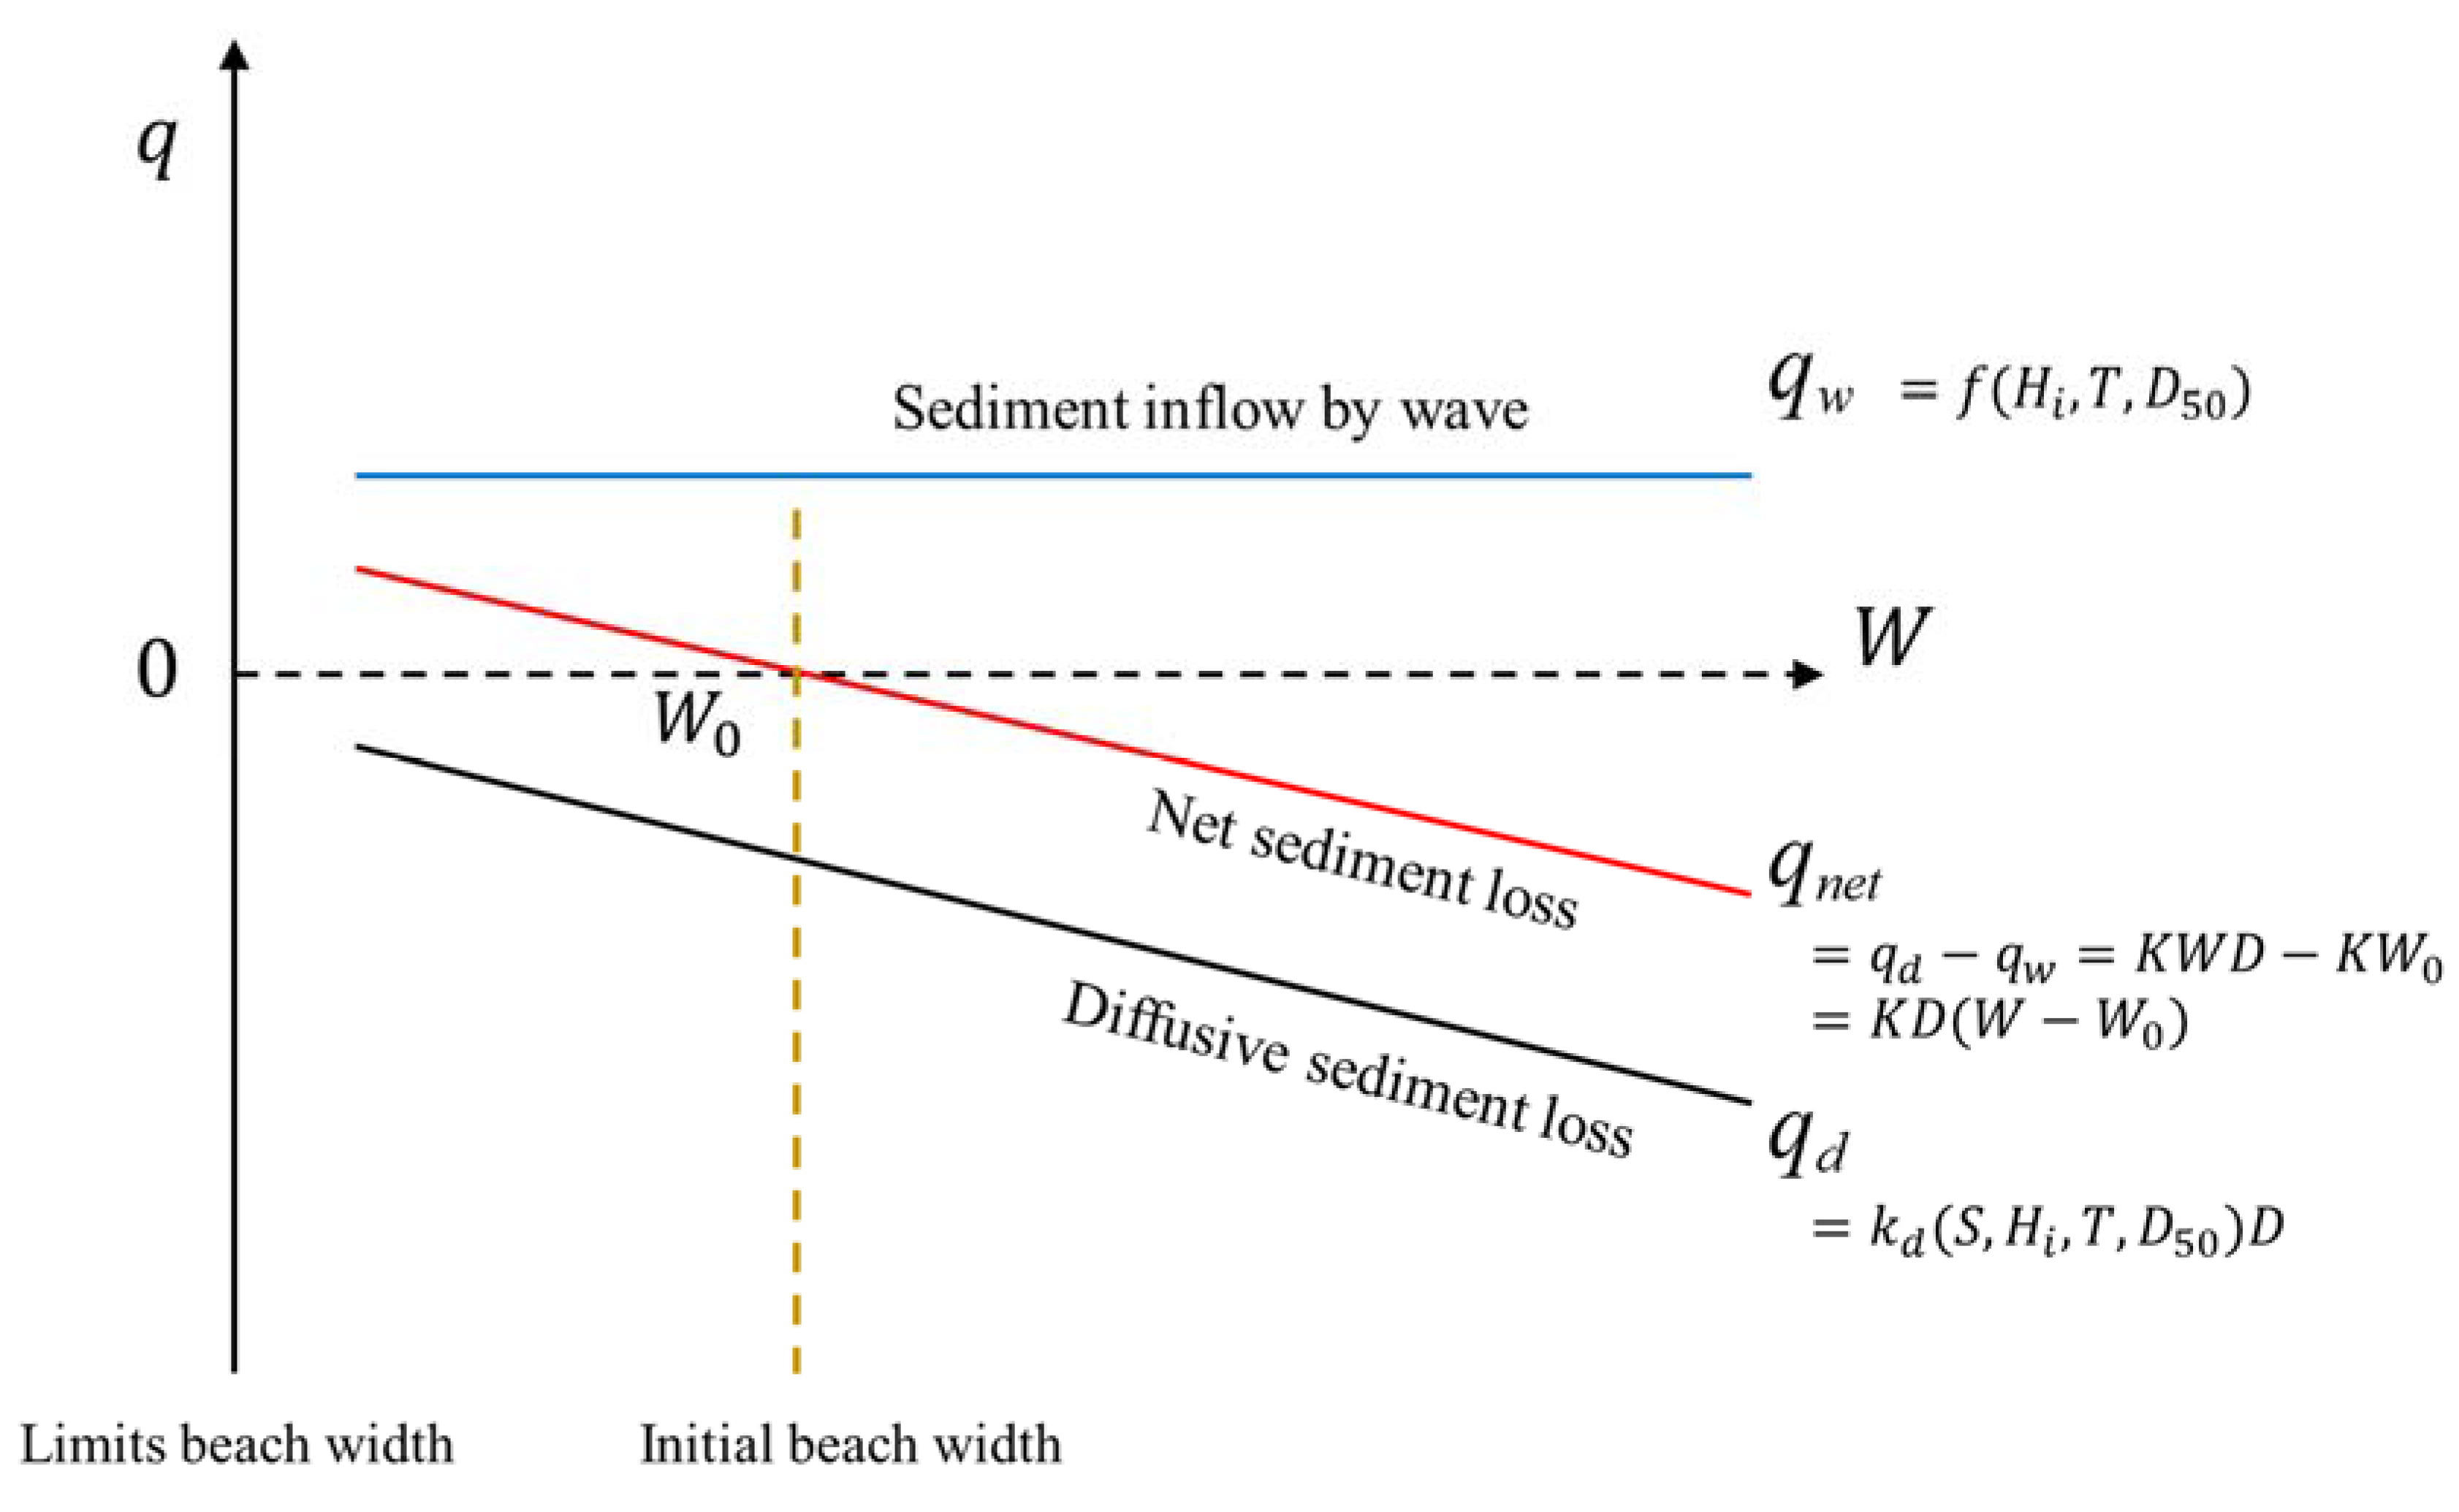
The inflow of sediment by sea waves can be regarded based on the characteristics of the wave environment, which are independent of the beach width. However, the loss of sediment by the breaking waves in the surf zone can be assumed to be proportional to the degree of exposure to open sea according to the extension of the shoreline (beach width), yielding the following equation (Figure 6).
Here, denotes the coastal sediment loss rate offshore, and refers to the vertical width of the littoral drift limit, which is regarded as the sum of the height of the “berm” and “closure depth” (), both of which specify the characteristics of the beach. In addition, denotes the width of a standard beach, in which the shoreline is in a state of equilibrium (Figure 7).
3.2. Coastal Sediment Loss Rate
An estimation of the coastal sediment loss rate is difficult. However, when the presence of the discharge amount of sediment from rivers with the current shoreline ( is at equilibrium, the coastal sediment loss rate can be estimated by exploiting the relationship between the discharge amount of sediment from the river ( and the loss of sediment to the open sea, as defined in Equation (3).
Here, the length of the beach () and the vertical width of the littoral drift () were assumed to be constant values. The denominator is an indicator representing the stability of the littoral cell; a higher value of the indicator corresponds to a decrease in , suggesting smaller changes in the width of the shoreline erosion. If the amount of sediment discharged from a river is negligible and insignificant in comparison with that of an inflow from the waves, it can be regarded as .
3.3. Shoreline Change from Background Erosion
The development of the watershed or coastal area and gathering of marine sand trigger changes in the inflow and sediment discharge in a littoral cell; the changes in the amount of sand in a littoral cell can be estimated by exploiting the principle of sand mass conservation (Equation (4)).
Therefore, the coastal sediment loss rate () is taken as a constant innate to each littoral cell, and the width of the past beach is a consequence diminished by in comparison with the current width along with the reduced amount of inflow of sands (). If the sediment amount decreases to by the development of a watershed comprising dams, submerged weirs, barriers, and tide embankments, the width of the future beach () can be obtained from the theoretical formula expressing temporal changes in the beach width, as presented in Equation (5).
Here, denotes the initial shoreline, and the effects of the reduction in the amount of littoral drift is assumed to be directly applied to the corresponding littoral cell.
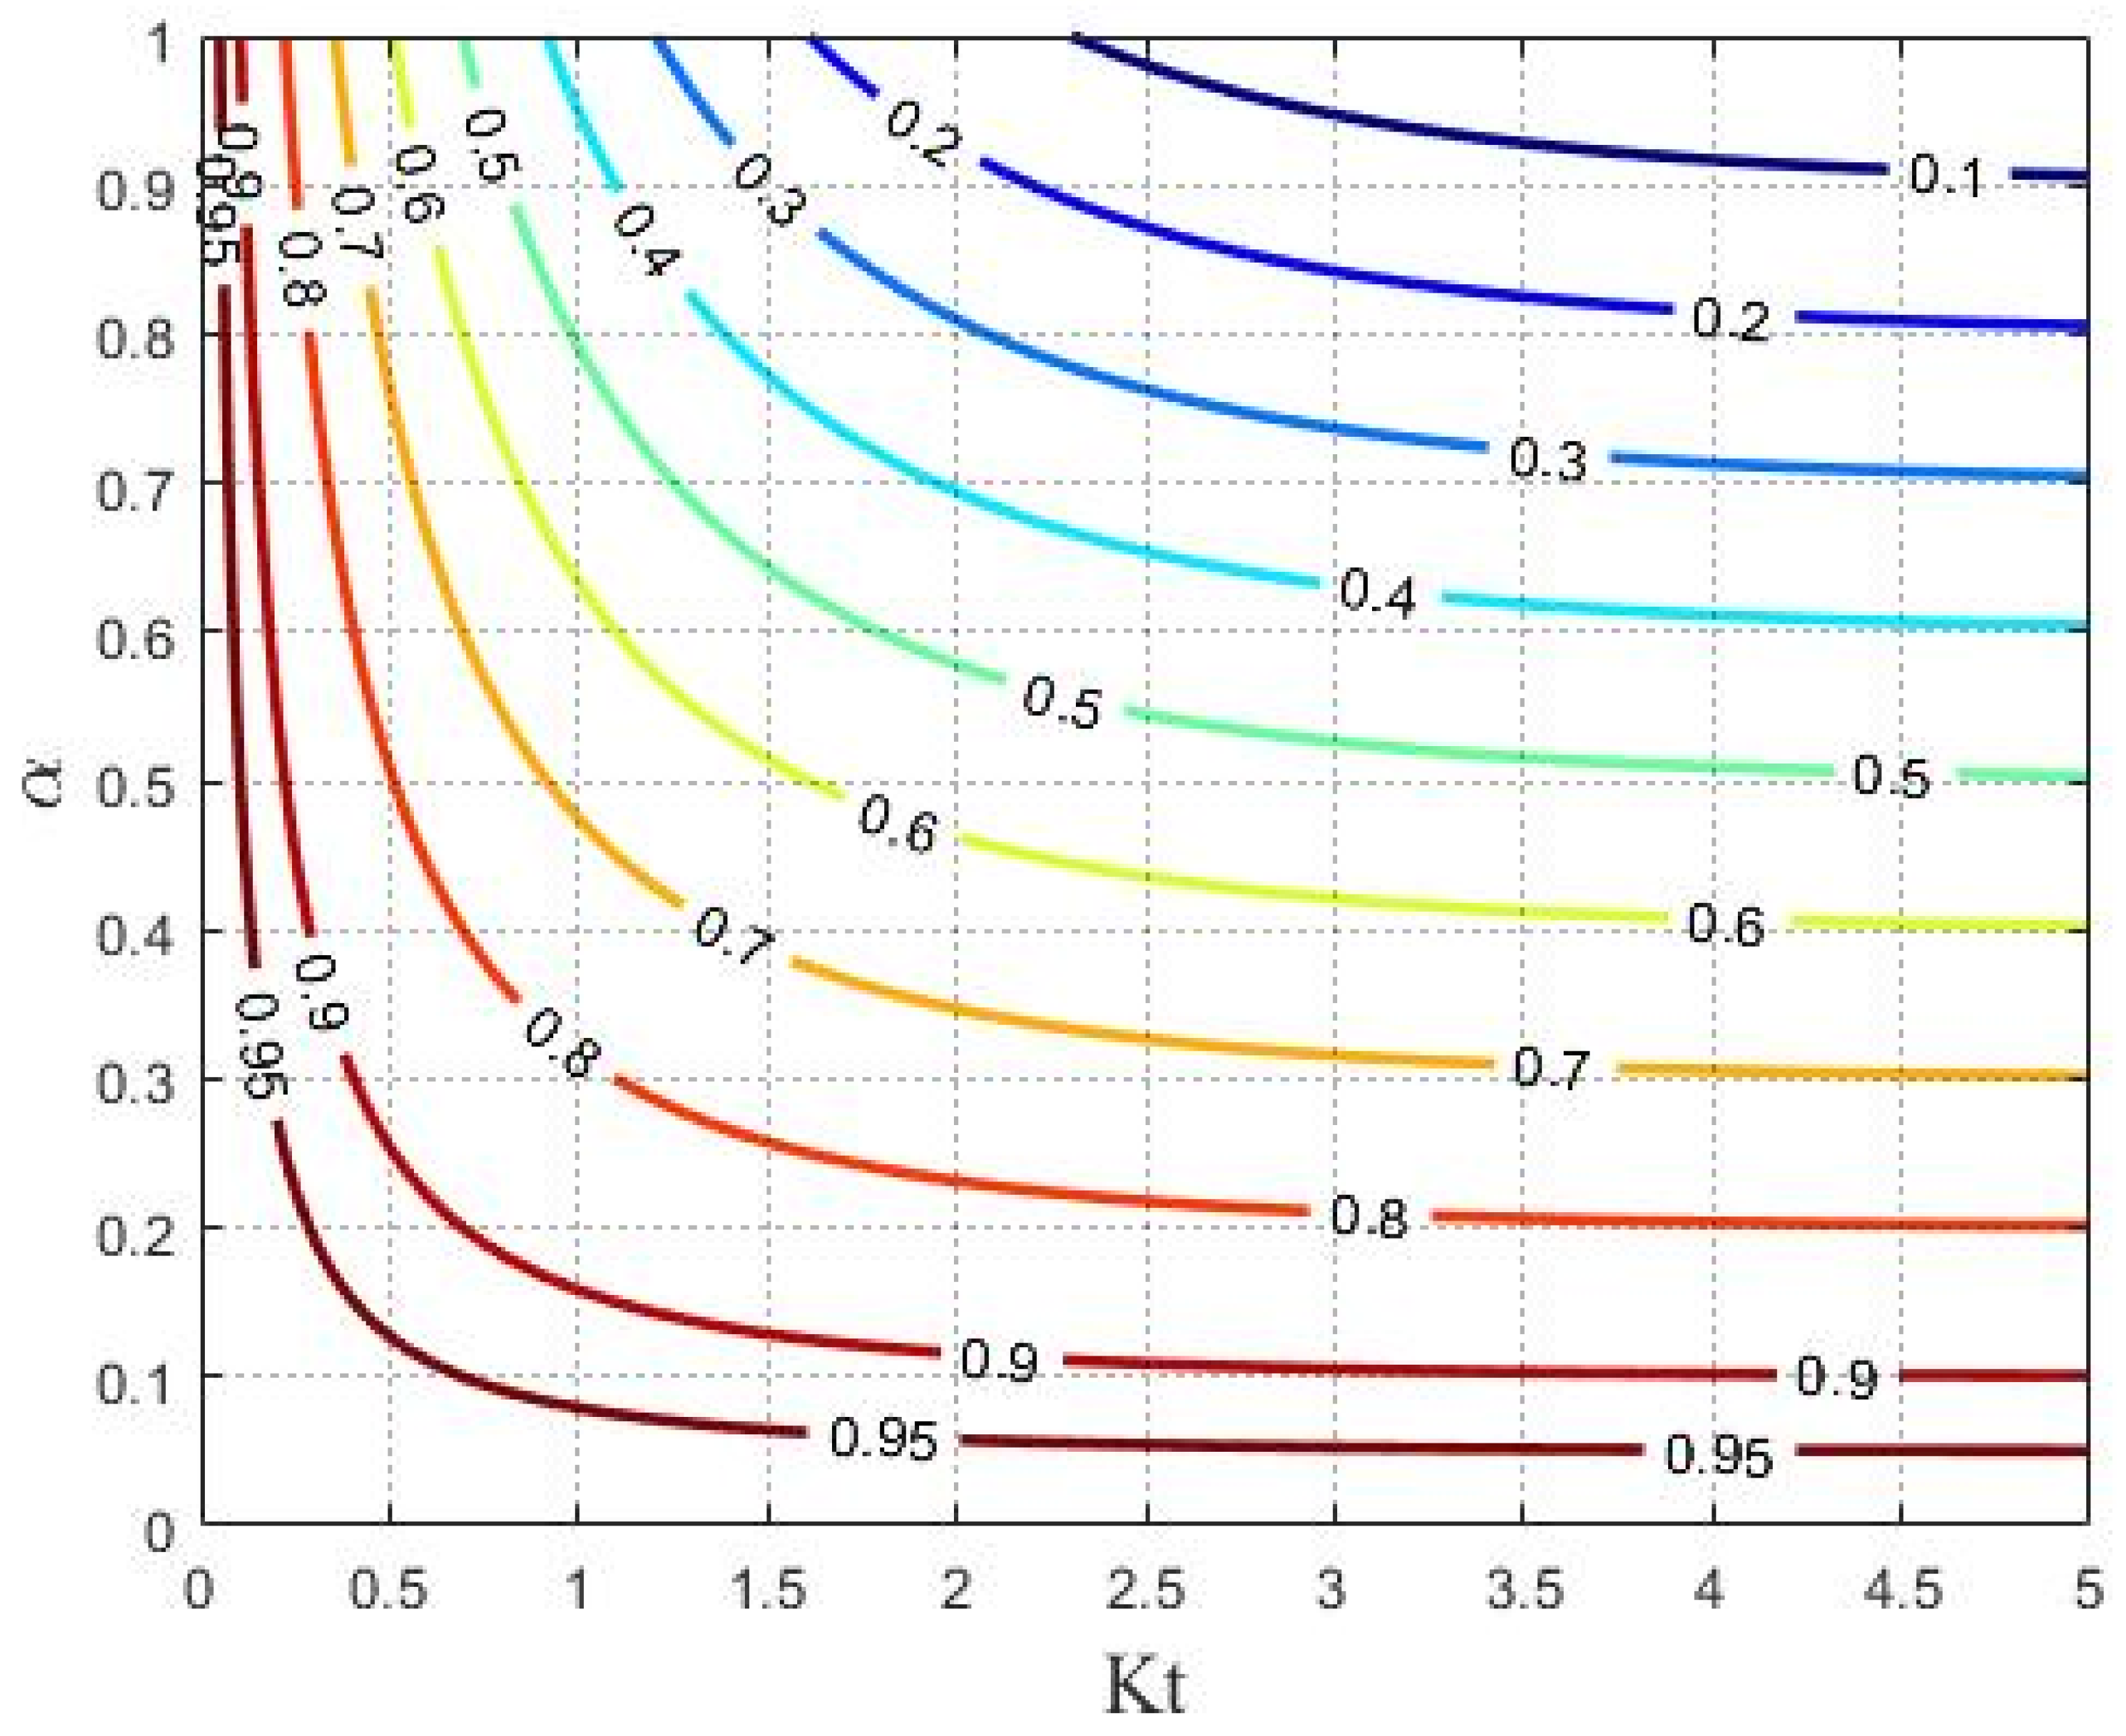
By using the equation above, the dimensionless value of the width of the beach can be obtained as the current width of the beach corresponding to the dimensionless coefficient, , which is a product of the time, sediment amount loss rate, and reduction rate of the river sedimentation amount () (Figure 8).
4. Results
4.1. Estimation of Reduction in Sediment Volume by Dam Construction in Geum Estuary
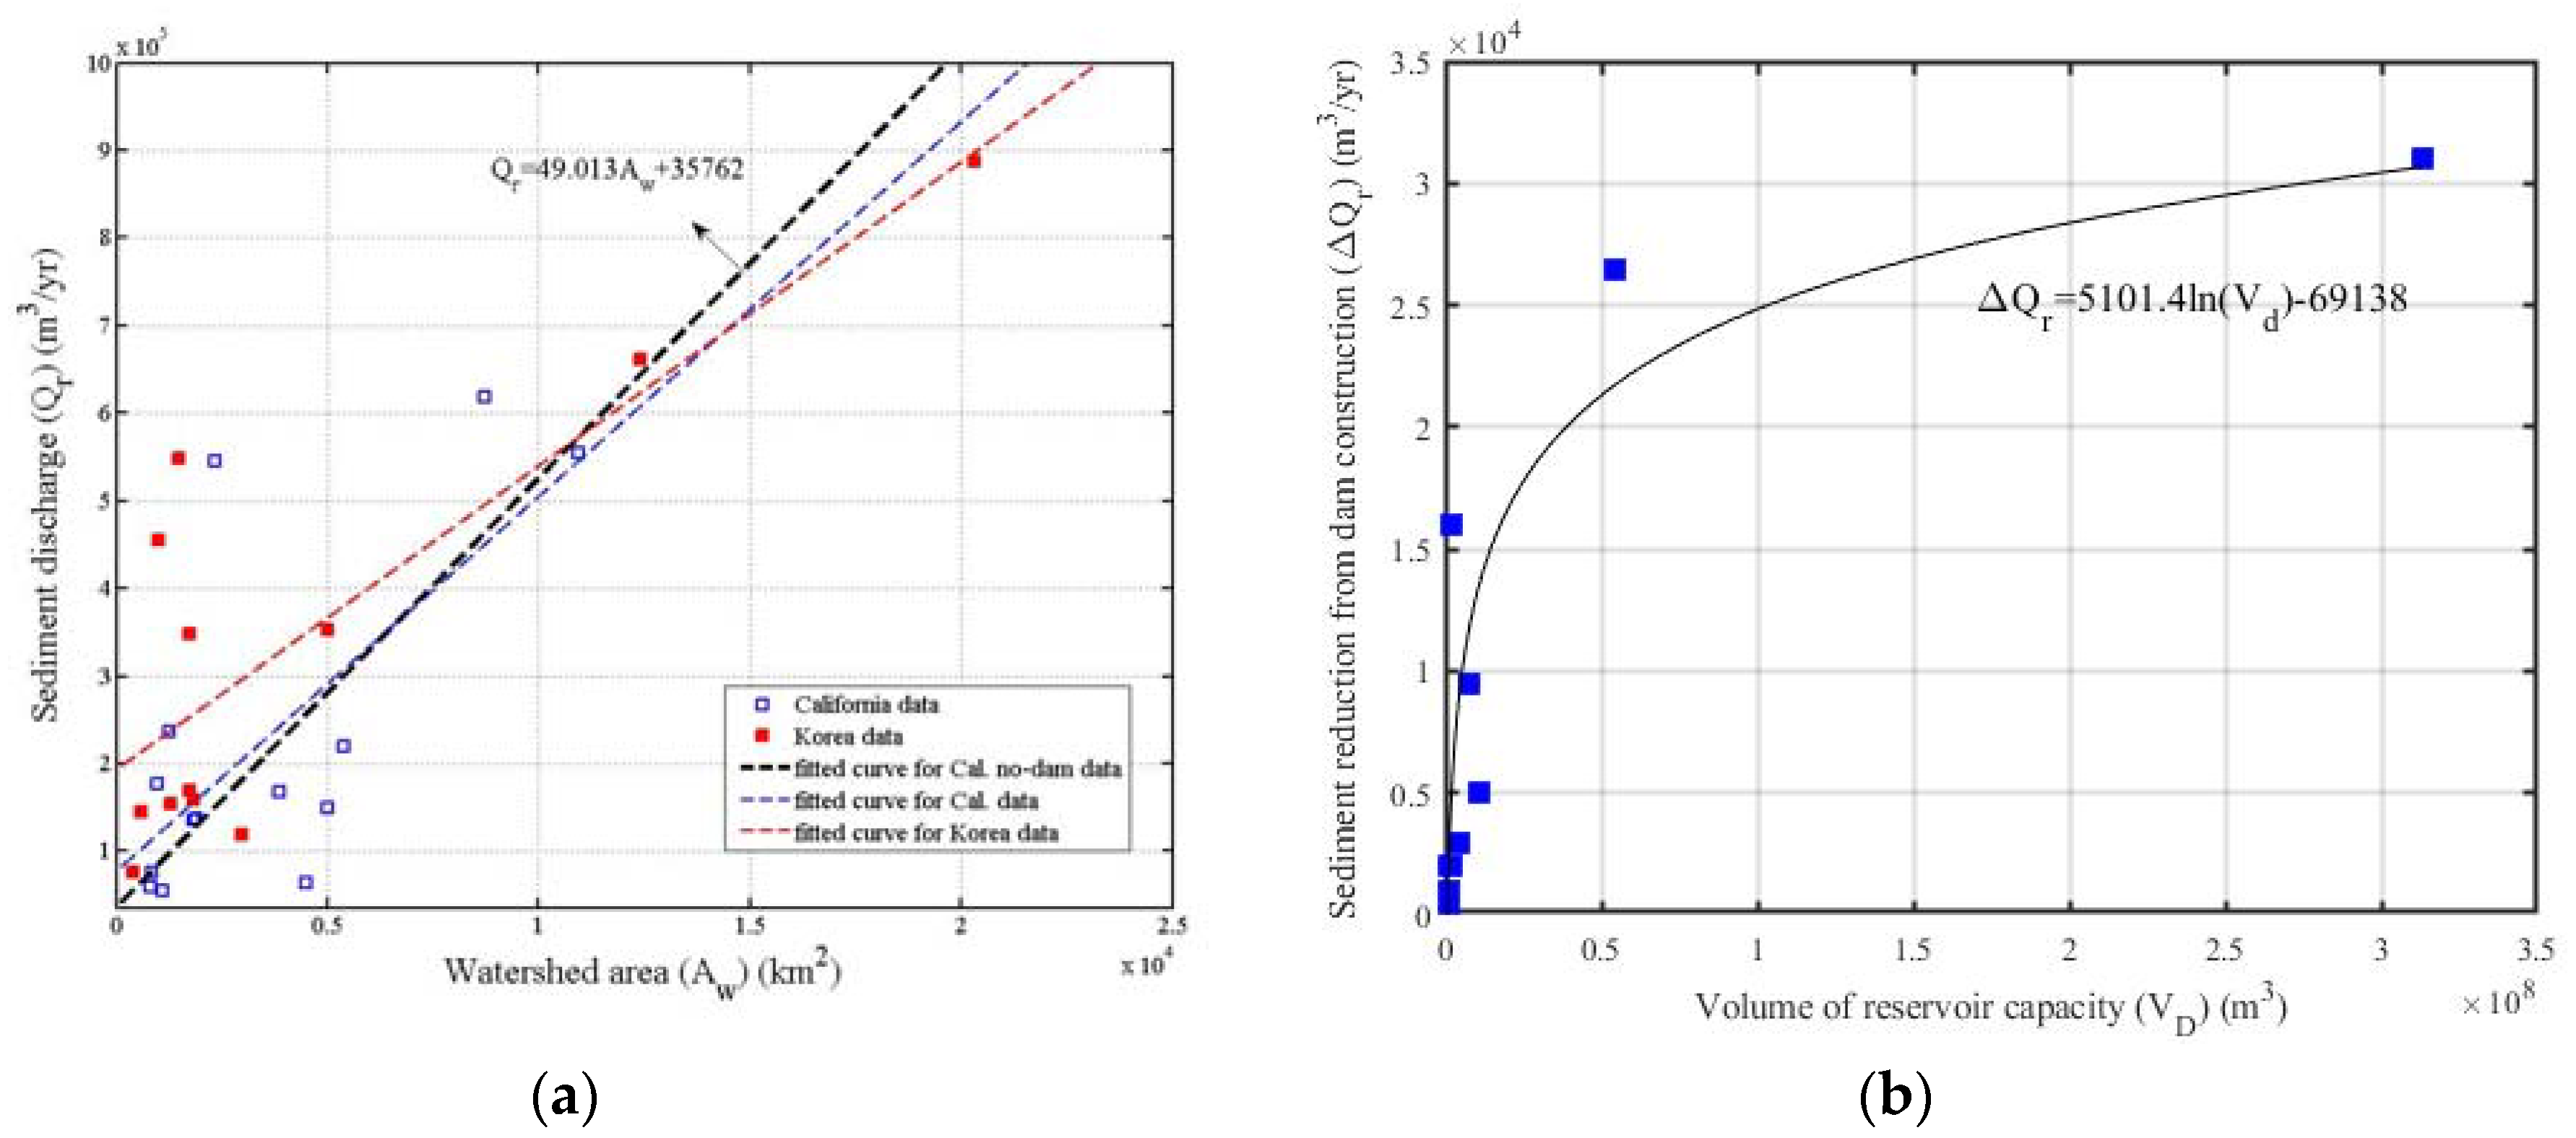
In the present study, the formulas expressing the discharge amount of sediment and representing the reduction in the amount of sediment discharge corresponding to the reservoir capacity of the dam are required for a cascade analysis of the dam construction effects on sediment discharge into Geum Estuary. Willis and Griggs [5] investigated the sediment amount discharged from the natural (no dam) rivers in California, USA as shown in Table 1, and obtained a fitted curve for the sediment loading rate naturally discharged from the watershed as
Furthermore, Slagel and Griggs [30] also presented the results on the reduction in the accumulated amount of sediment along the seashore of California (Table 2, symbols in Figure 9b). Equation (7), which is the fitted curve obtained by using log function as shown in Figure 9b, is for the calculation of the sediment reduction from dam construction.
where and represent the amount of sediment reduction after dam construction, and the volume of reservoir capacity, respectively. Both Equations (6) and (7) enable us to simply estimate the reduction ratio of sediment discharge into Geum Estuary.
The application of the empirical formulae obtained from studies conducted by Willis and Griggs [5] and Slagel and Griggs [30] to other regions with different environments would be unreasonable owing to uncertainties estimated to be significant. Therefore, we examine if the pattern of sediment discharge in Korea shows a similar trend when compared with those in the region of California, given in Table 1. However, the amount of annual sediment discharge for Korean major rivers presented in Table 3 are all considered as actual sediment discharges. Thus, as shown in Figure 9a, data are plotted only for the actual sediment discharges and compared with the regression curve of Equation (6), which was fitted from no-dam data. Correlation analysis was taken for both data sets to examine the similarity and the result shows 69% for actual discharge for California data, and 82% for actual discharge for Korea data. The deviation ratio from the fitted curve is defined as below and calculated as 0.61 and 0.41 for the California and Korea data sets, respectively, showing more agreement with the latter (Equation (8)). Thus, Equation (6) is taken into account to be acceptable to the Korean watershed environment on sediment generation.
Here, subscript implies the number of data.
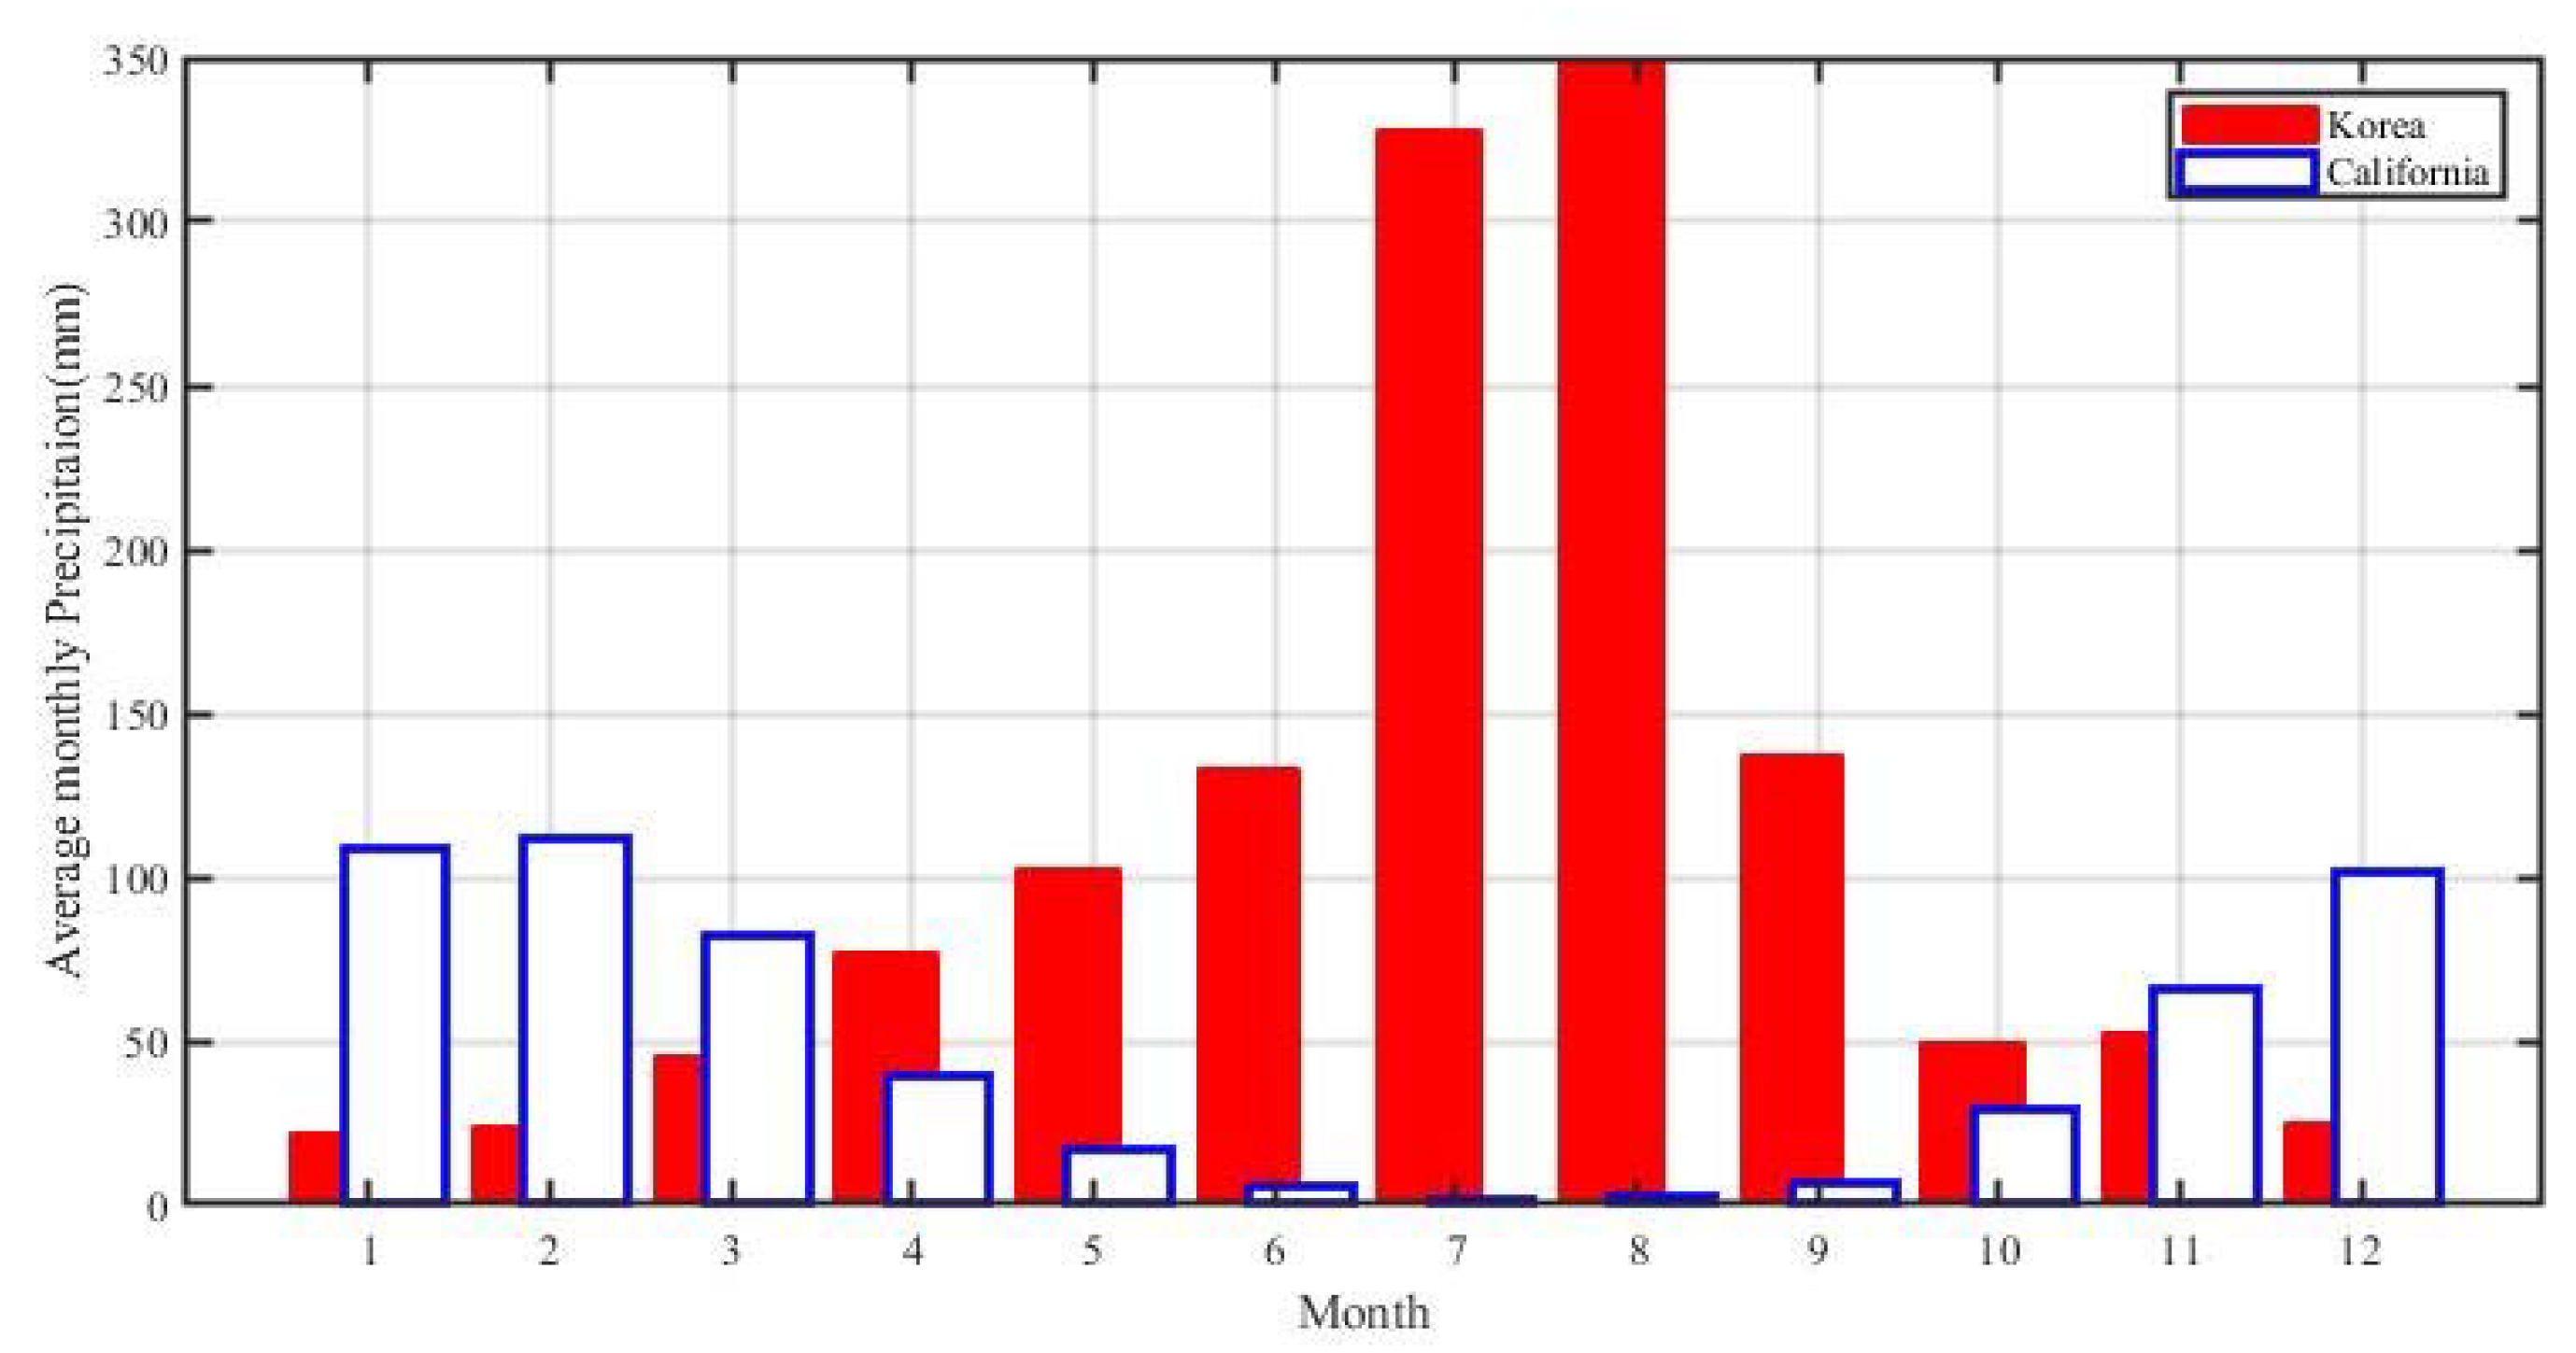
Therefore, the generation of the average annual amount of discharge of sediment from both the regional rivers in California and the rivers in Korea are in a similar order to each other, particularly for sediment inflowing from wider areas of the watershed. Consequently, we consider that Equation (6) would be acceptable for estimating the reduction ratio of sediment discharge into Geum Estuary, despite the amount of precipitation in Korea therein, which was about double for both mean and standard deviation of precipitation (Table 4, Figure 10). Such differences can be compensated by the high land use and the unit consumption of water (number of population) in Korea.
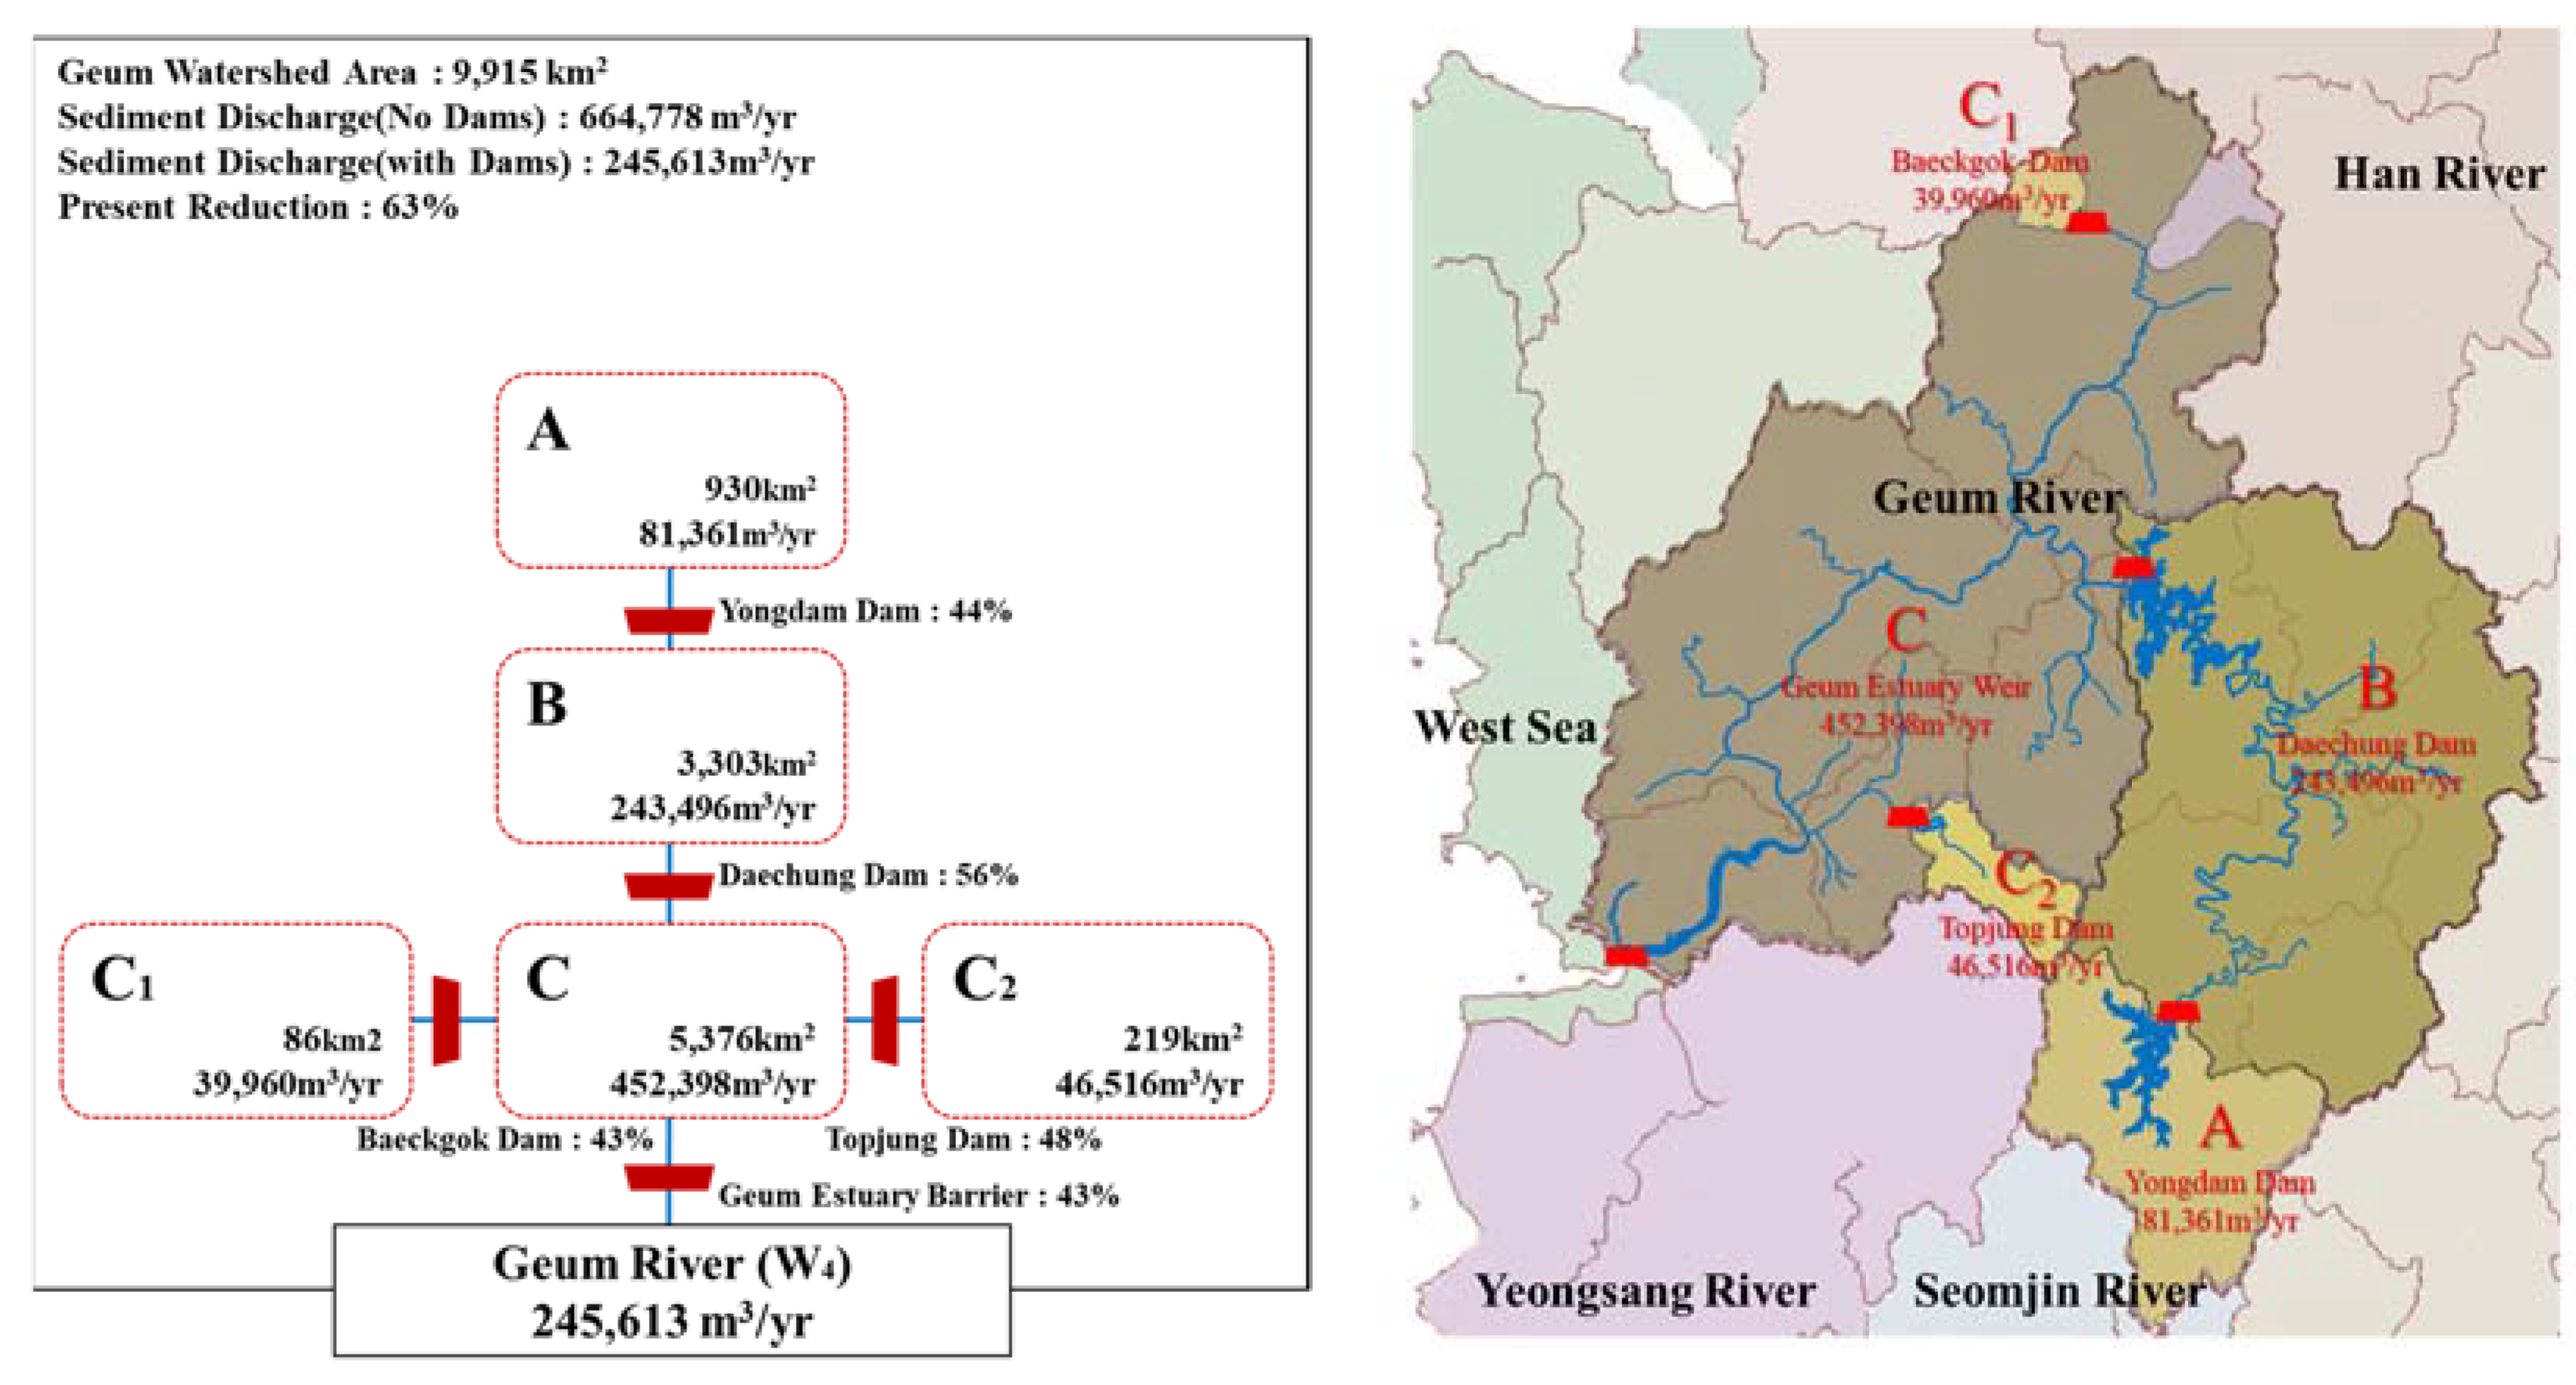
Now we estimate the cumulative amount of inflow of sediment reaching an estuary of the Geum River by employing the cascade analysis method. Before the estuary of Geum River, four dams and one estuary barrier and a pertinent area of the river basin are located and regarded as major consequences of the development of river basin as shown in Figure 11. The watershed of the main stream of the Geum River, which is other than the combination of independent intervals of the river, has a subordinate configuration wherein the sediment discharged from the dams constructed in the upstream area of the river affects the sediment discharged from dams constructed in the downstream area, and thus, the calculation of sediment discharged from the latter considers the amount of sediment discharged from the former.
The cumulative amount of sediment inflow of Geum River to its estuary was calculated by applying the reservoir capacity of dams constructed in the watershed of Geum River and is presented in Table 5. The annual amount of sediment generated in the watershed of Geum River was estimated to be approximately 664,778 , and the reduction in the amount of sediments due to construction of the four dams in the watershed and the Geum estuary barrier was estimated to be 63%, and thus, 37% of the amount of generated sediment (approximately 245,613 per year) was calculated as the amount reaching the estuary of Geum River.
4.2. Geometric Correction of Aerial Photographs
Aerial photographs captured in 1947, 1985, and 2000, which were provided by the National Geographic Information Institute, and satellite photographs (2014), provided by a portal site in Korea, were used for the present study (Table 6).
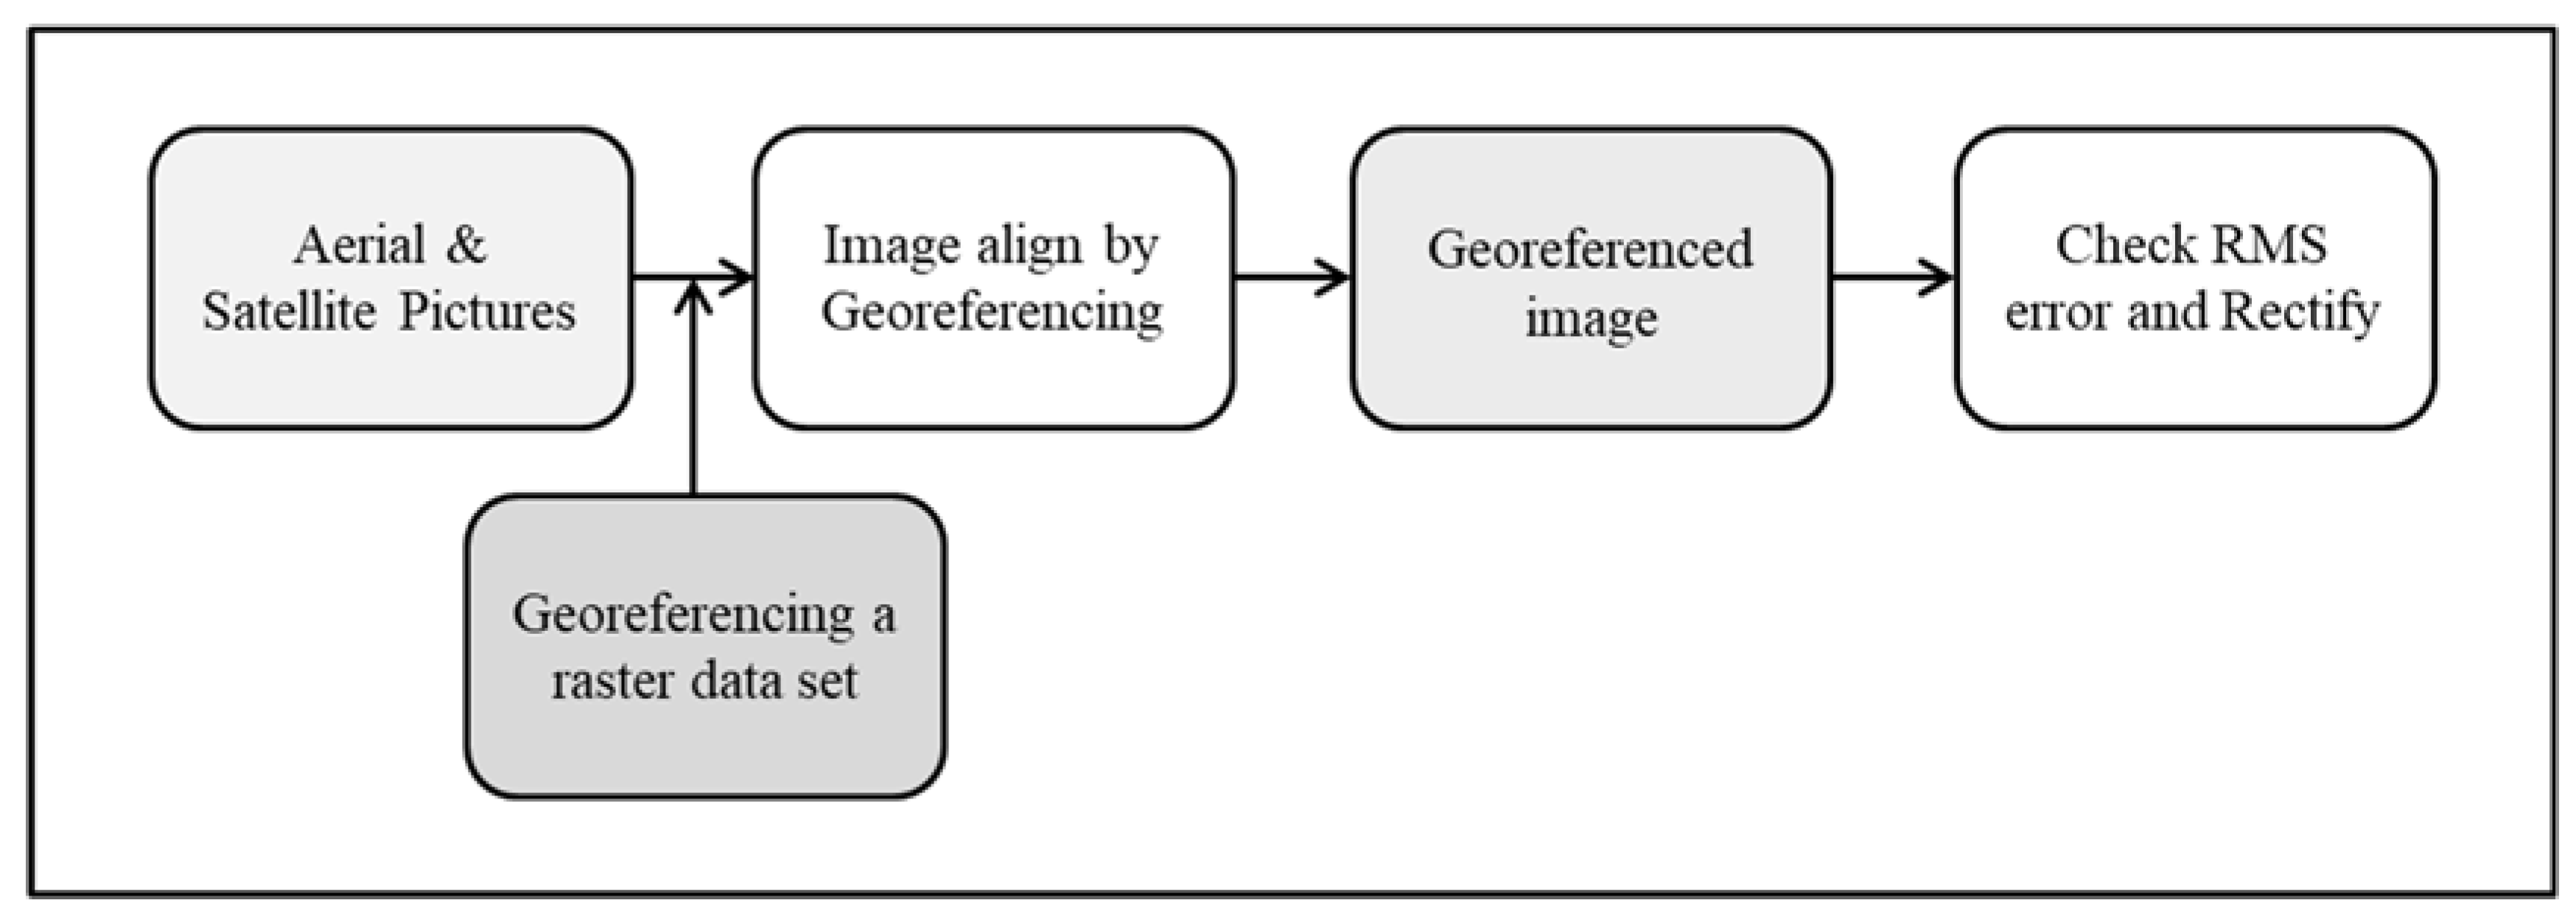
The methods employed for image correction can be broadly classified into geometric and orthodiagraphic corrections, wherein the method of geometric correction, using the ground control point, is basically a process of geometrical transformation of planar images, as depicted in Figure 12.
For the geometric correction of the original aerial photographs performed in the present study, the coordinates and available data of the continuous digital maps of the area of Janghang Eub, Seocheon County, Chungcheongnam-do Province, provided by the National Geographic Information Institute, were used. For the correction studies, the commercially available “Georeferencing” function of “Arcmap” is applied, as shown in Figure 13.
For the image correction, the coordinate information and available continuous digital map of Janghang Eub, Seocheon County, Chungcheongnam-do Province were used, along with aerial and satellite photographs to register and correct the image coordinates by designating the structures and roads as control points. Upon completion of the geometric image correction, the points with large errors in the “link table” were removed to correct the images. The corrected images are presented in Figure 14.
4.3. Estimation of Coastal Sediment Loss Rate(K)
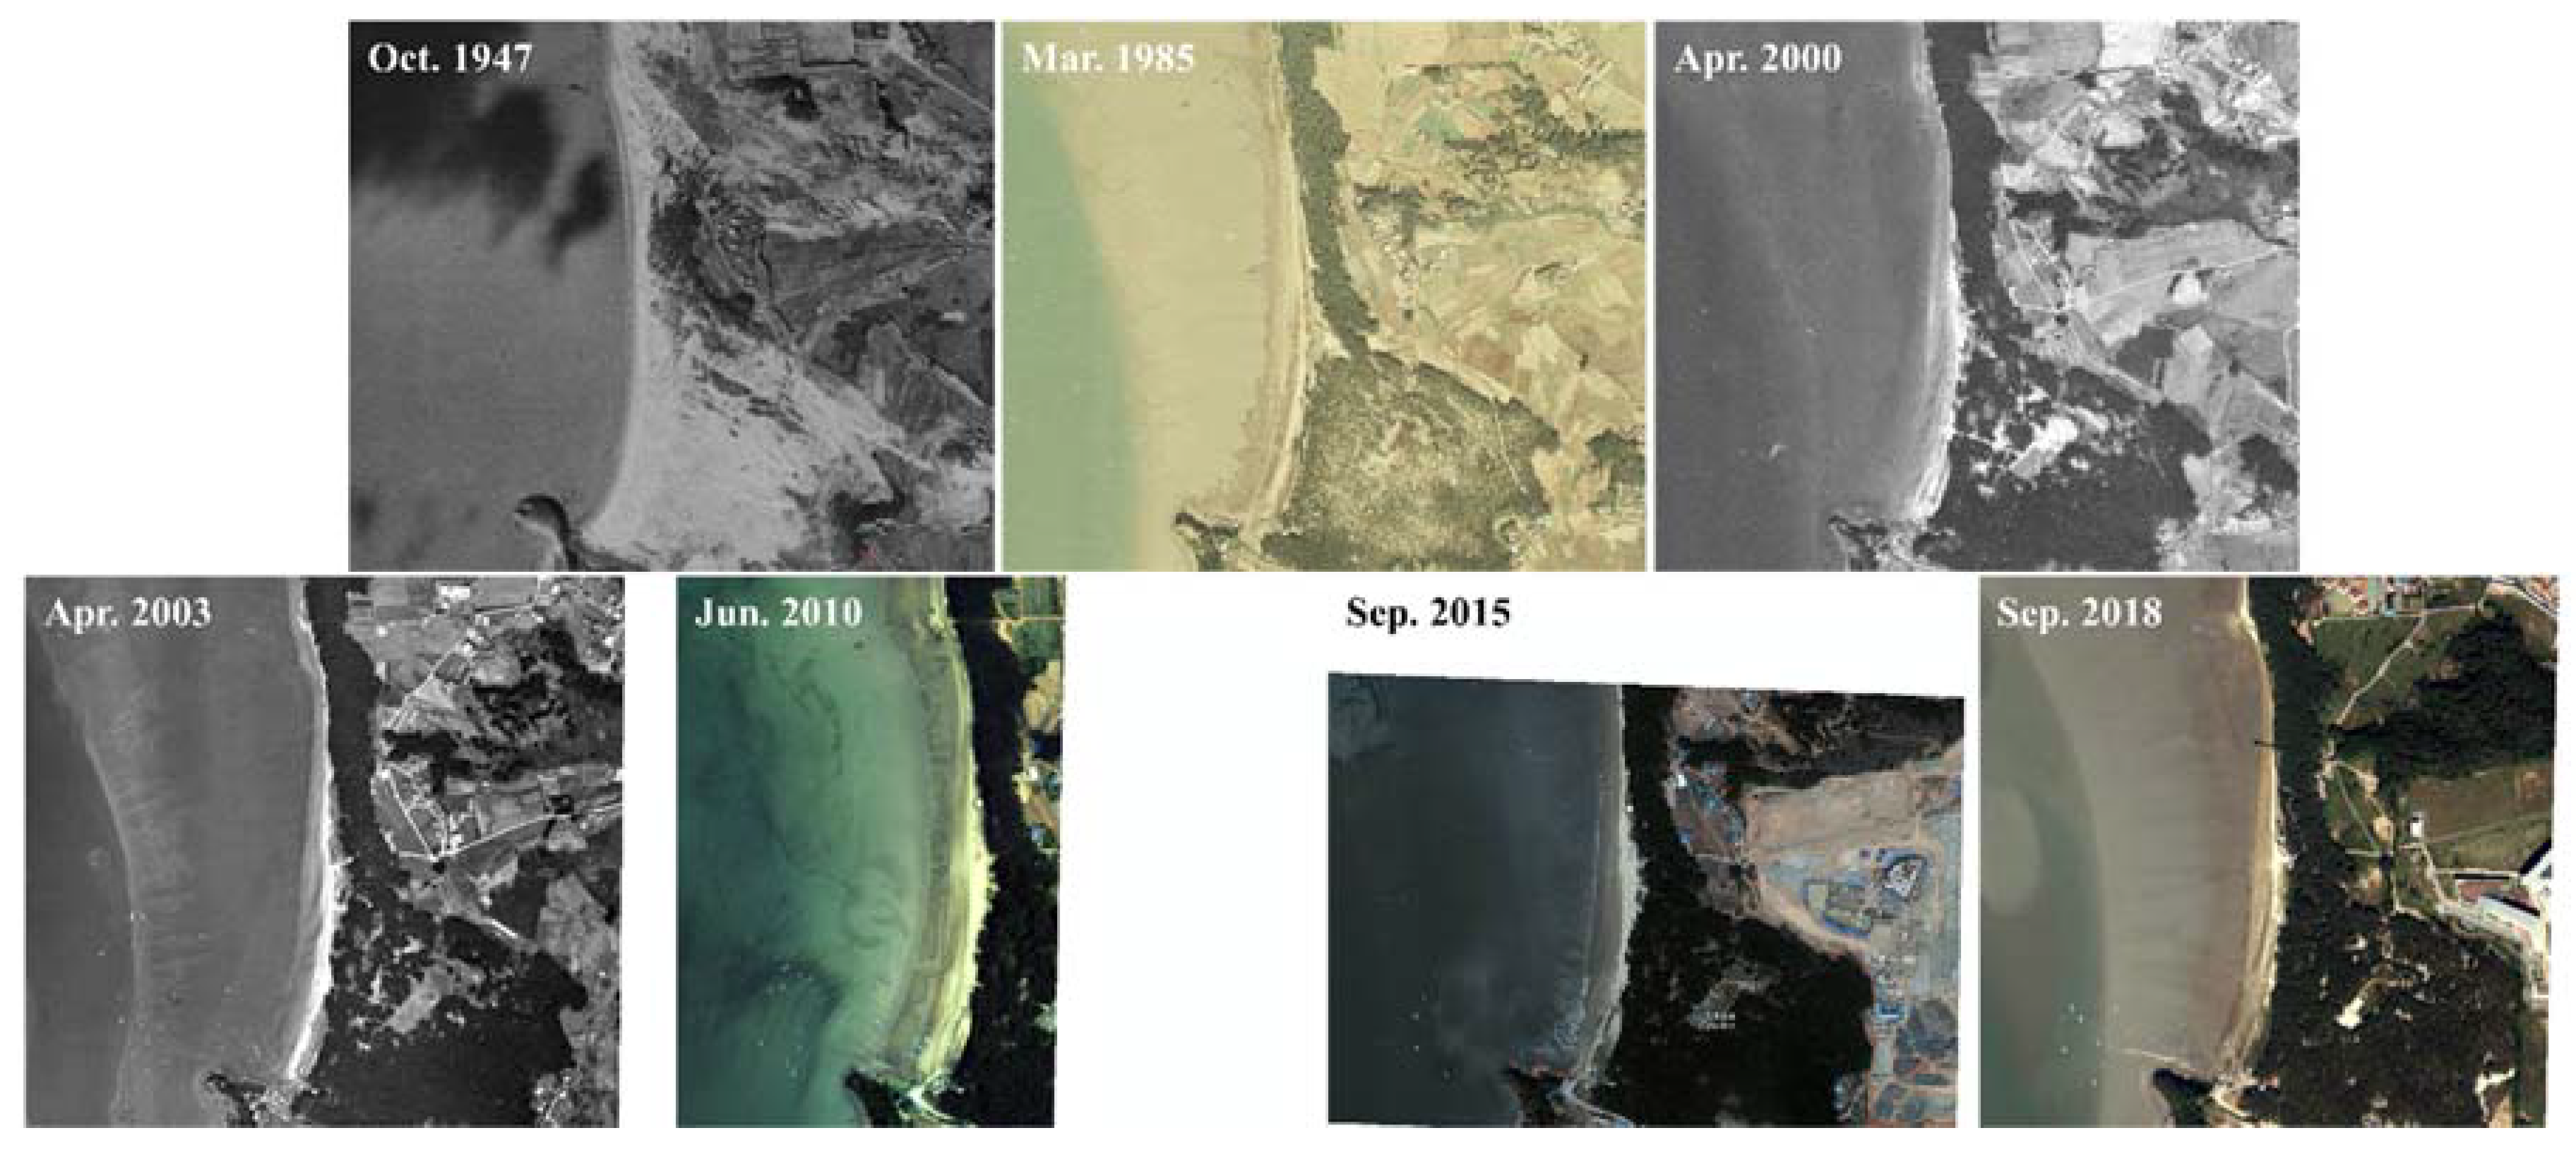
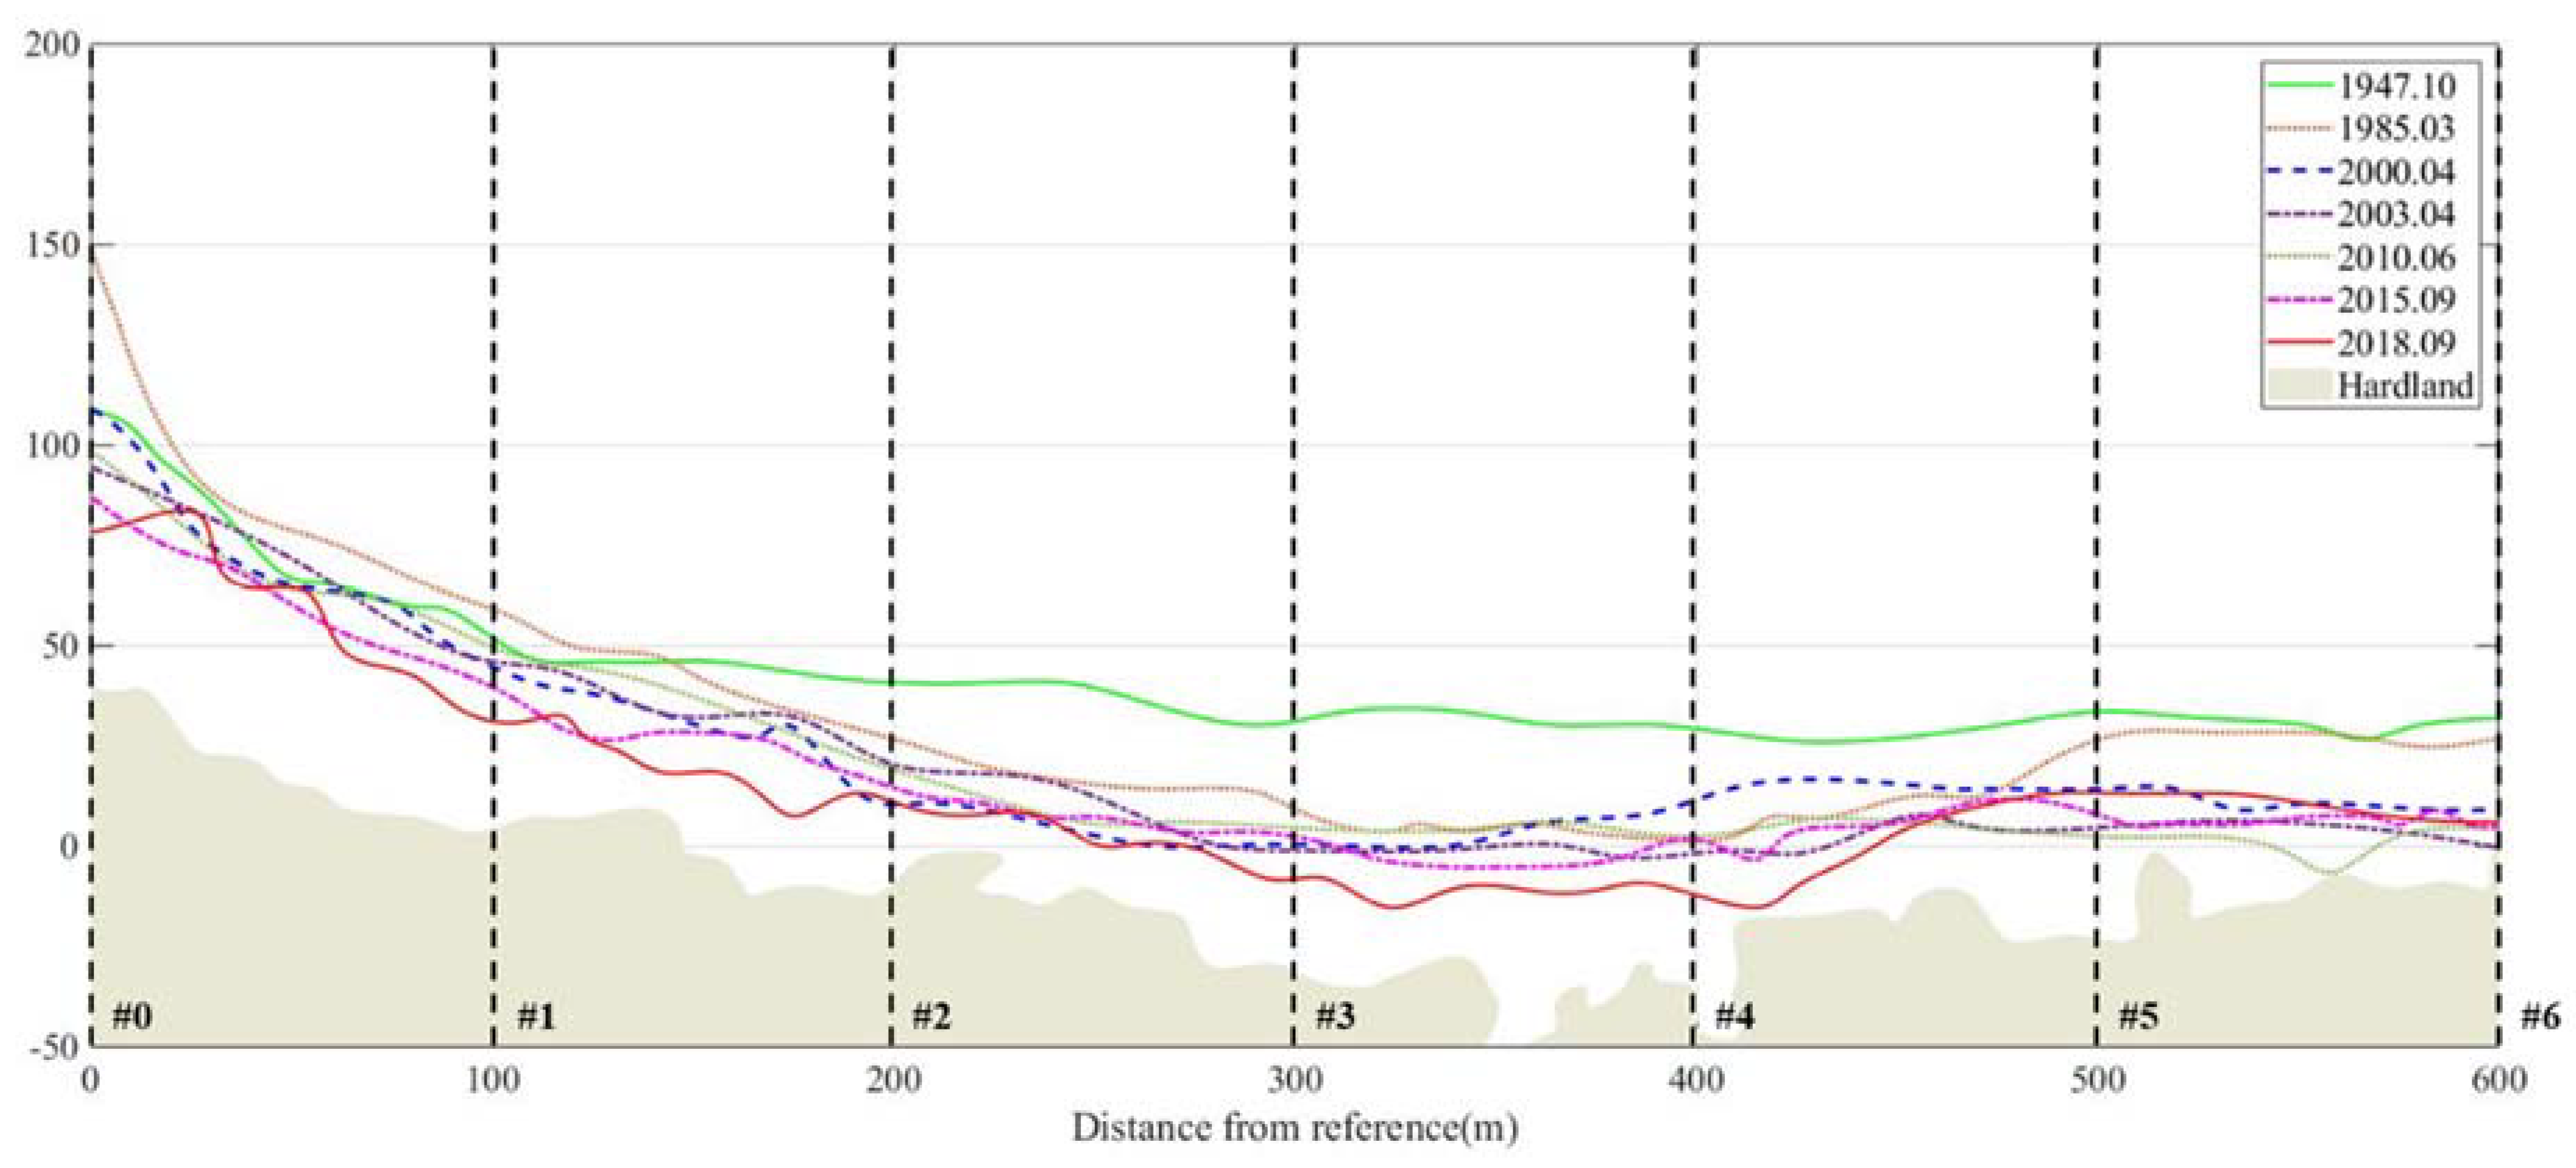
The area of the Janghang Songrim Beach, Seocheon County, Chungcheongnam-do Province in the photograph captured in 1947 shows an intact, wide sandy beach. The corrected photograph captured in 1985 is considered to be the beach before the construction of the Geum estuary barrier, which was completed in 1990, and thus the shorelines from the years 1985, 2000, 2003, 2010, 2015, and 2018 were extracted to examine the changes that occurred in the width and area of the beach.
During the period of 1947 to 2018, the baselines were set using a spacing of 100 m on the Janghang Songrim Beach (Figure 15), and the changes in baseline, area, and width of the beach in each sector, are shown in Table 7. By examining the changes that occurred in the width of Janghang Songrim Beach, a gradual progression of beach erosion was found. In particular, with respect to the changes in width of the beach during the period of 1985 to 2000, approximately 14 m of erosion occurred. Approximately 27% of the erosion occurred in 1985, when the average width of the beach was approximately 52 m. In terms of the total beach area, a serious long-term beach erosion also appeared (Table 7).
As mentioned above, an estimation of the coastal sediment loss rate is difficult. Therefore, in this study, the coastal sediment loss rate of the Janghang Songrim Beach was estimated through aerial photographs (Table 7). The rate was estimated by analyzing the change in the temporal beach width obtained through the aerial photographs. Therefore, the coastal sediment loss rate () in the Janghang Songrim Beach of the littoral cell of Geum River, selected for the present study, is calculated as 0.035 per year.
Thus, the rate of sediment loss from the effective inflow of sediment reaching the Janghang Songrim Beach from the sediment generated at the watershed and reaching the estuary of the Geum River was estimated to be approximately 3%, or 6923 , the data for which were available using the coastal sediment loss rate calculated based on an analysis of the aerial photographs.
5. Discussion
5.1. Estimation of Background Erosion Rate
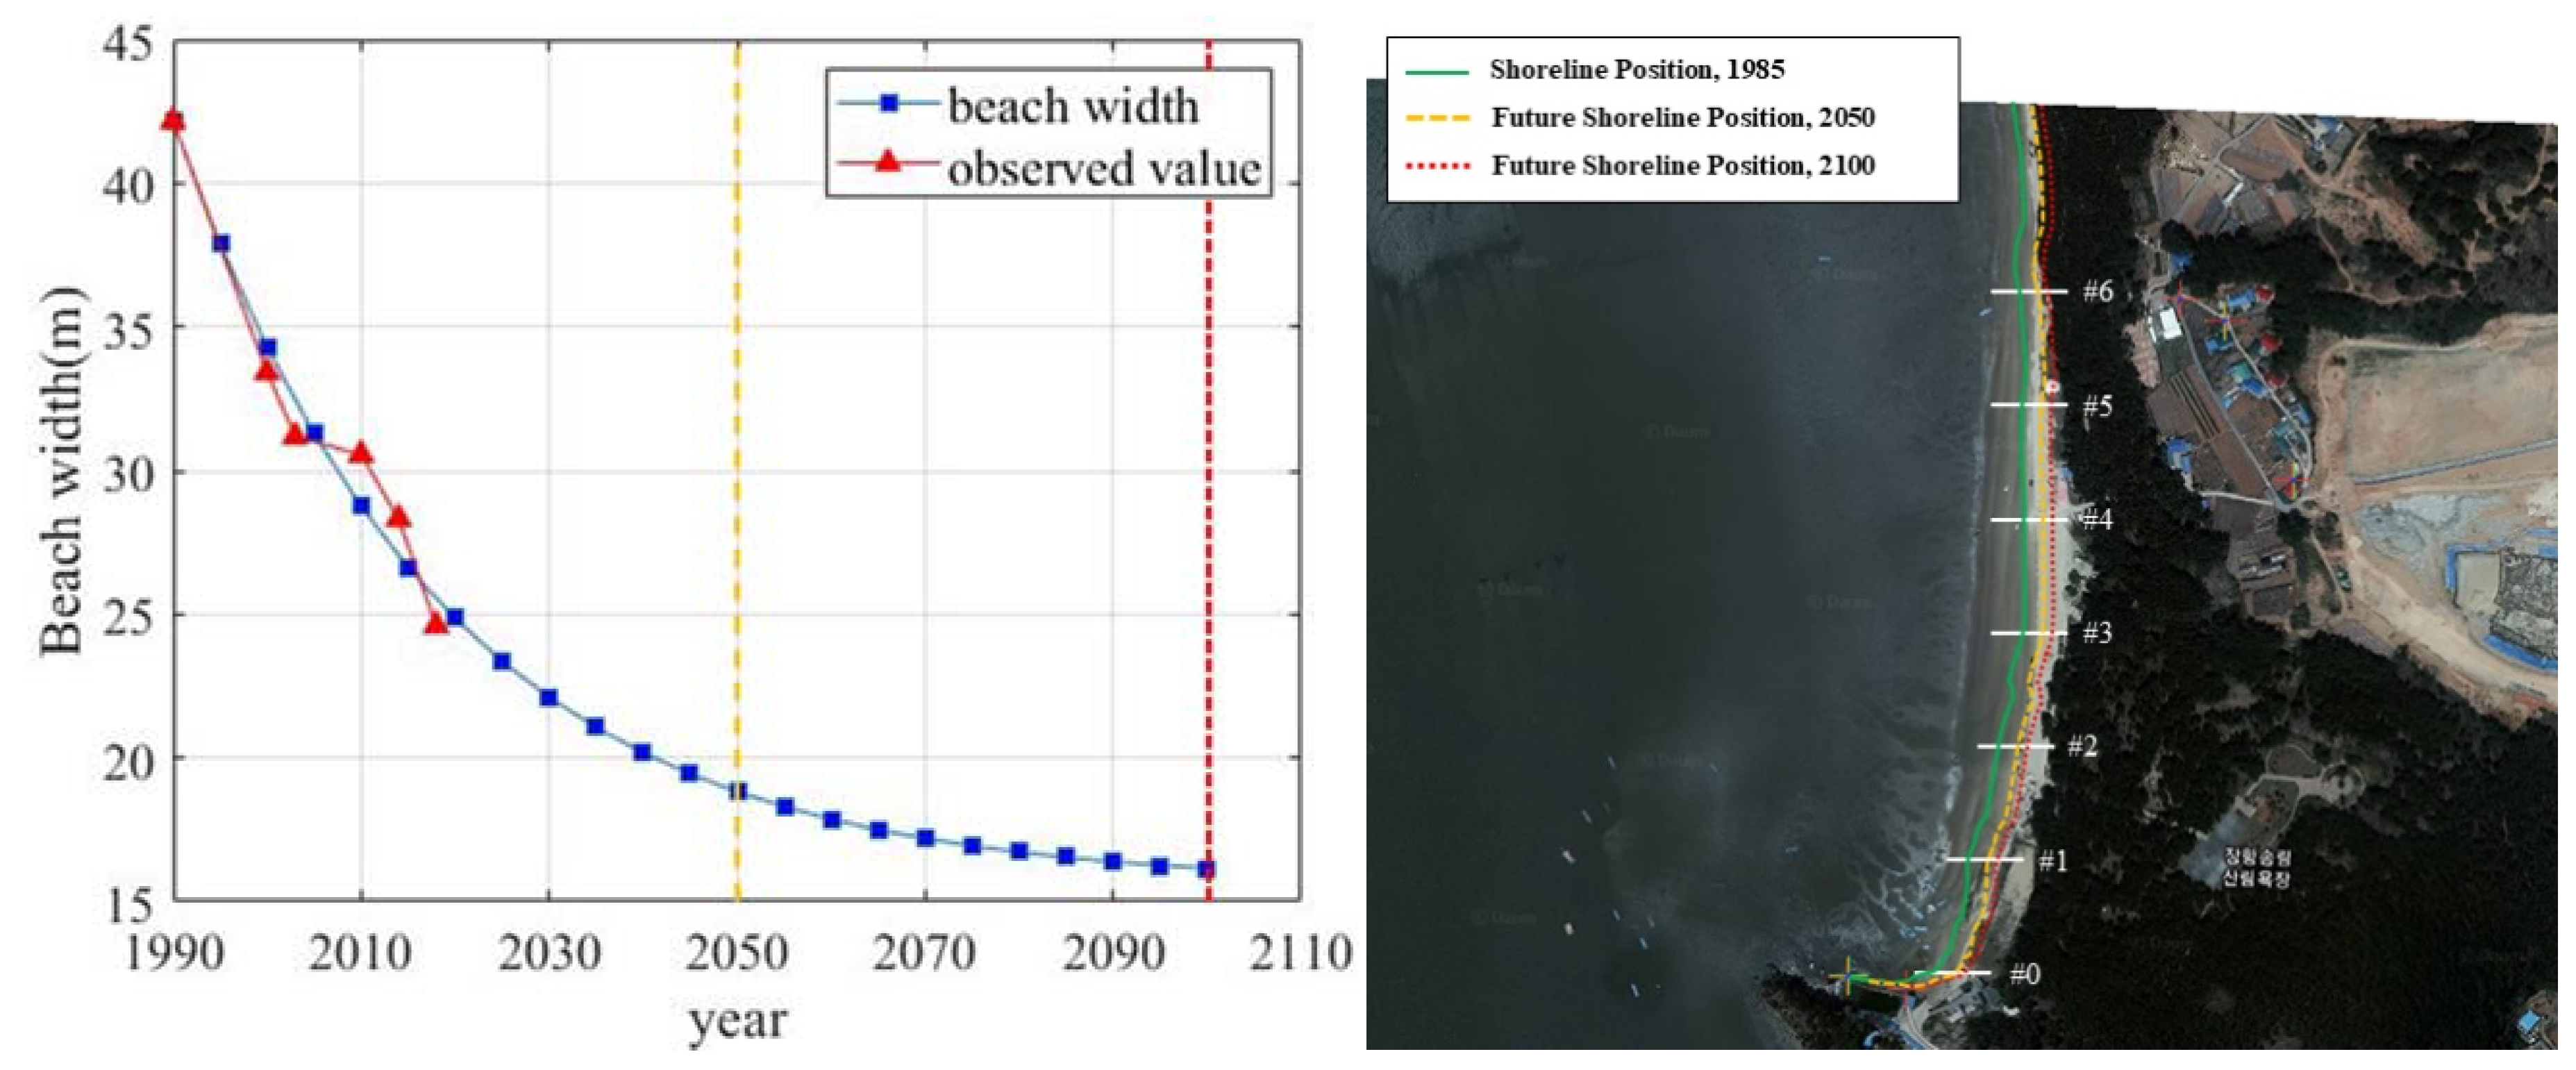
The background erosion rate in the estuary of Geum River estimated for the years 2050 and 2100 (, ), from the point of application of the decreasing rate of inflow of sediment due to development of the watershed of Geum River (the completion of the construction of the estuary barrier of Geum River), was estimated by employing the calculated coastal sediment loss rate, i.e., 0.035/yr. It was 19 m and 16 m, respectively, whereas the background erosion rate for the width of the beach in 2050 and 2100 was estimated to be 55% and 62% through Equation (5) (Figure 16).
5.2. Discussion on Closure Depth in Macro-Tidal Coast
The coastal sediment loss rate is estimated from the relationship between the sediment discharge of the river and the loss of sediment through Equation (3) based on the mass conservation equation. The amount of discharge of sediment () from the watershed of Geum River was estimated to be approximately 245,613 . The entire length of the beach () matches the entire length, approximately 19.5 km, of the littoral cell of Geum River, whereas for the average width of the beach (), 42 m, was used; in this case, the width of the beach area in the aerial photograph captured before 1985 (before completion of the construction of the Geum estuary barrier) was used by considering the changing characteristics of the major seasonal waves rather than the average width of the beach corresponding to each baseline.
Methods for calculating the closure depth have been presented by several researchers [33,34,35]. In the present study, Equation (10), which was regarded as rather pertinent to the value of the average closure depth resulting from an improvement by Birkemeier [33] through a derivation from Equation (9), was used, because Equation (9), suggested by Hallermeier [34], tended to show overestimations in the design of the beach profile.
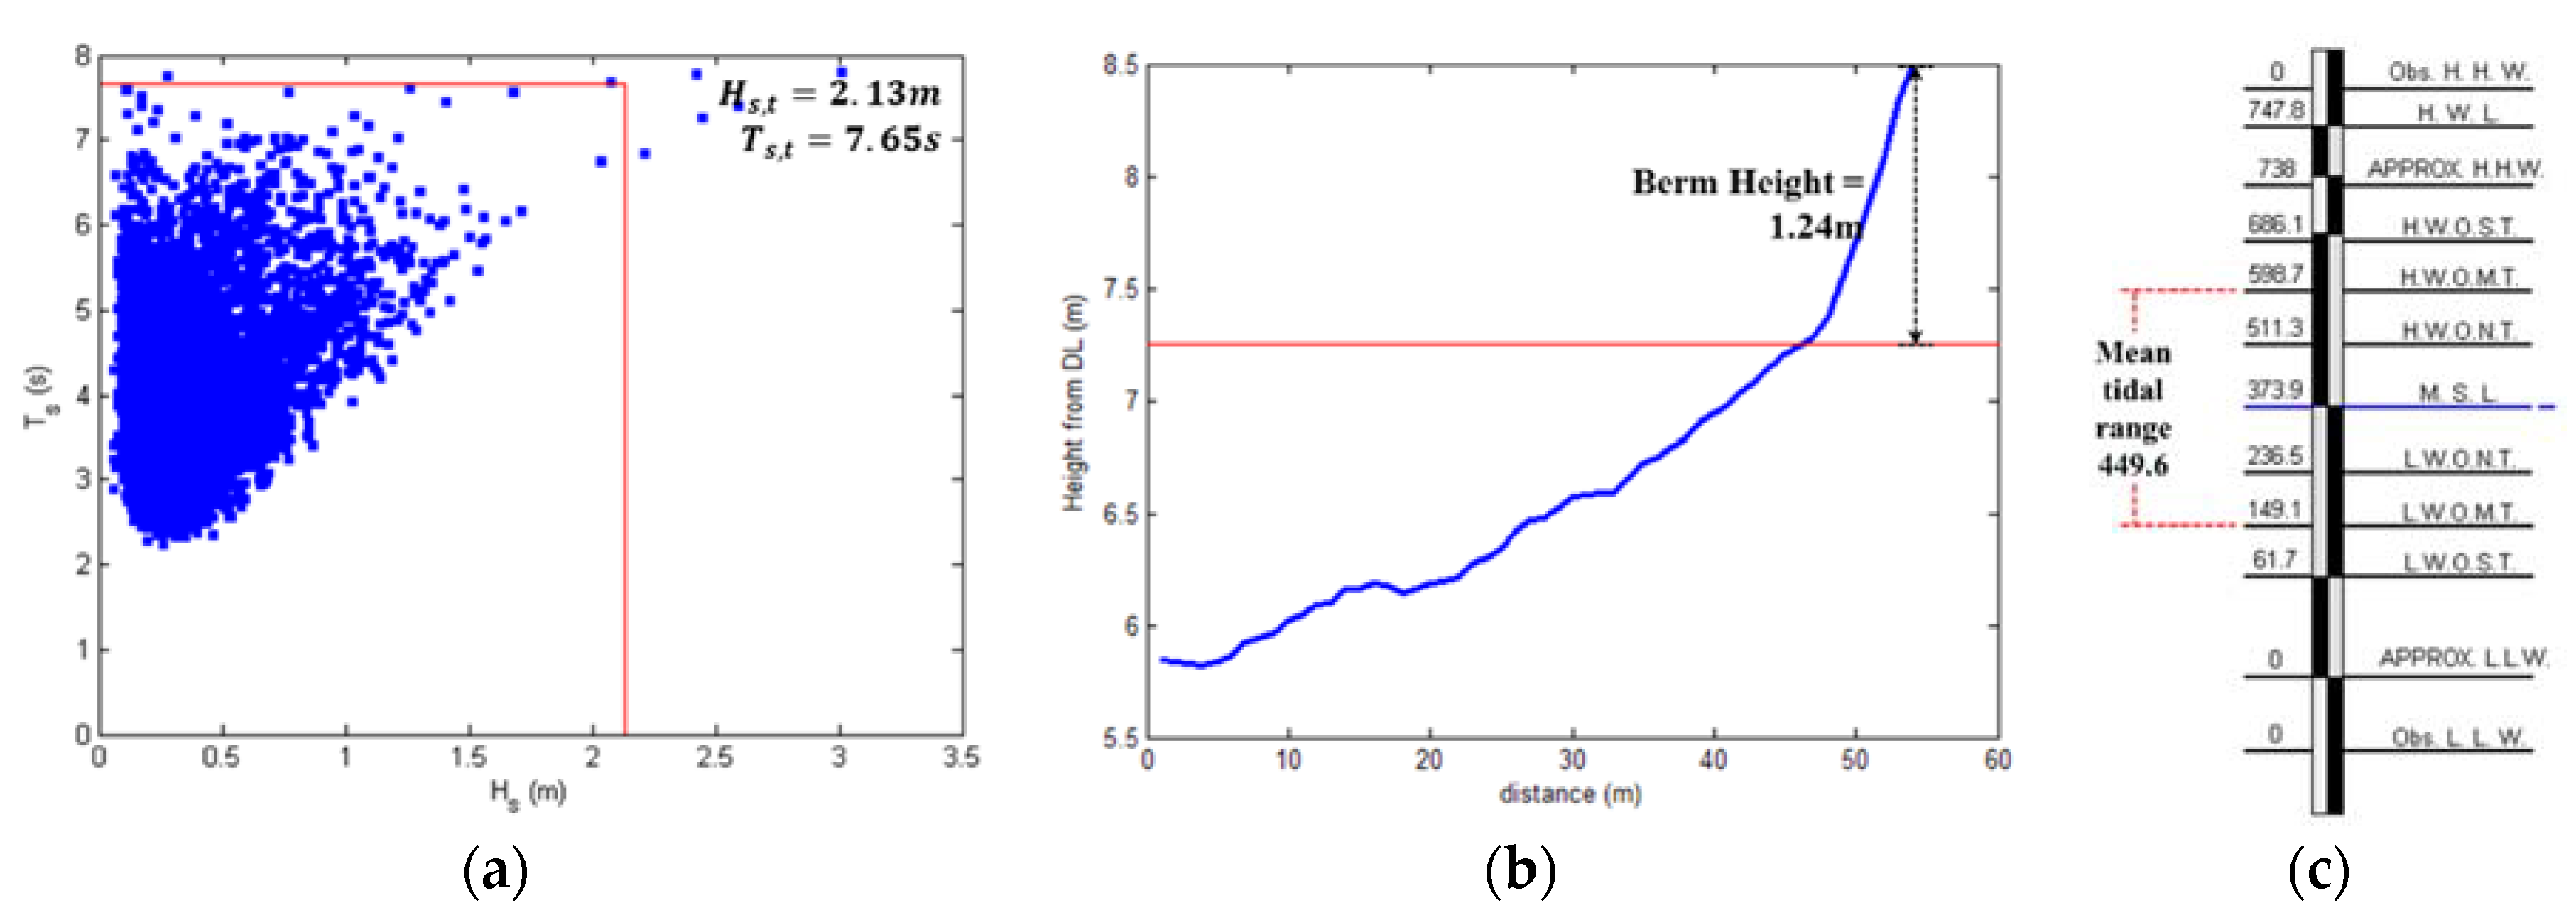
Here, and are the significant wave height and cycle corresponding to the annual excessive appearance frequency of 0.137%, which exceeds 12 h per year. The values of and were calculated using data with 1 h intervals of the wave height in the West Sea observed from 1 January to 31 December, 2014 by an observatory buoy installed in the West Sea by the Korea Hydrographic and Oceanographic Agency (KHOA). The resulting closure depth () was calculated as 3.27 m (Figure 17a).
On 17 August 2015, the shore profile of Janghang Songrim Beach was observed using the Network RTK. The high water mark of the beach was 7.25 m (from the datum level (DL)), based upon which the height of the beach () was calculated. The calculated height of the beach profile was 1.24 m (Figure 17b). The vertical height () of the Janghang Songrim Beach was calculated as the sum of the closure depth () and the height of the beach profile (), i.e., 4.51 m, for which the effect of the tide owing to the larger tidal range along the west coast of the Korean peninsula should be taken into account for a calculation of the closure depth (). Further discussion on the tidal effect in determining the closure depth will be shown in Section 5. The average tidal range, observed at the tide station in Janghang, was 4.50 m (Figure 17c).
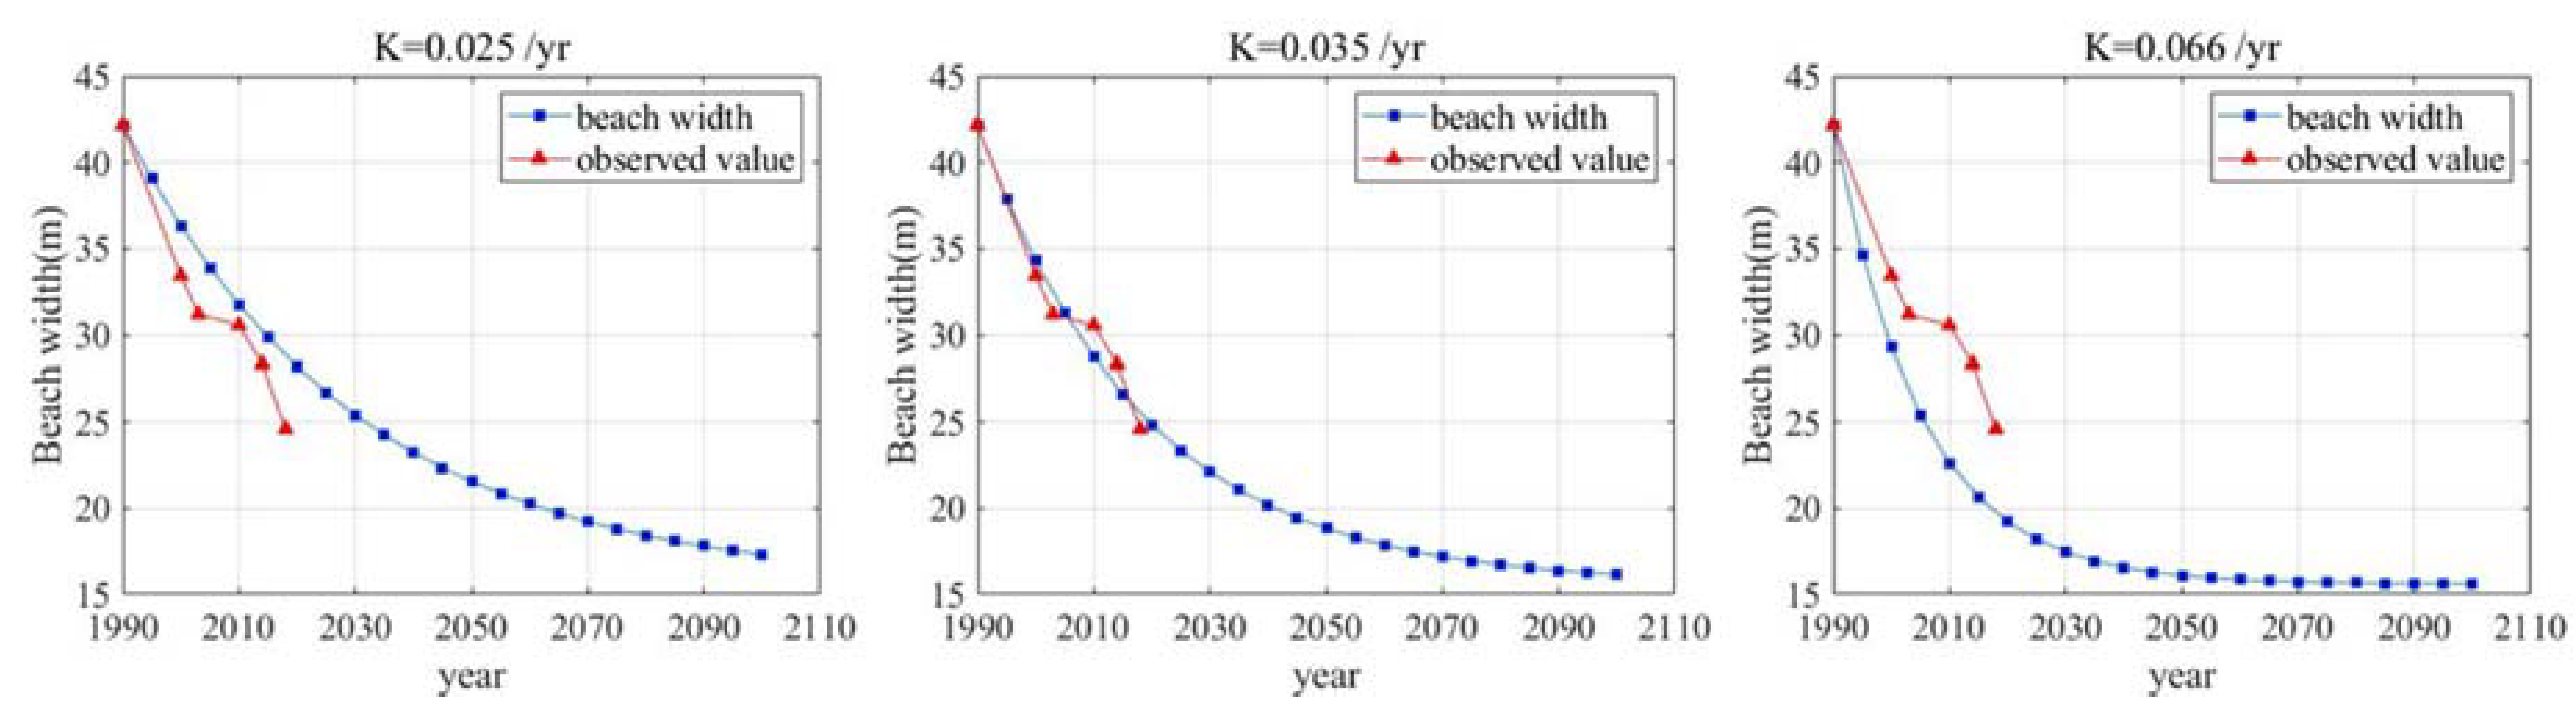
In the previously conducted studies, the characteristics of sediment in the watershed and the coastal sediment loss rate, which were regarded as necessary for the calculation formula, were estimated. However, owing to uncertainties in the rates of inflow and the loss of sediment, the actual changes in the width of the beach in the aerial photograph and the erosion of the width of the future beach according to the coastal sediment loss rate () were analyzed through changes in the vertical range () of the beach profile in the environment of an estuary of Geum River (Table 8). Accordingly, the resulting values of the coastal sediment loss rate () reflect the sensitivity of the erosion of the corresponding beach, whereas the rate of inflow of the sediment represents the converging width of the beach (Figure 18).
The coastal sediment loss rate calculated in the present study, i.e., 0.035/yr, represents the tendency of erosion along the beach similar to that found from the analysis of the aerial photographs. This is expected to be helpful in determining the range of parameters that have greater uncertainty among the parameters included in Equation (3) to calculate coastal sediment loss rate (). The area is difficult to measure vertical height () because its tidal range is up to 4.50 m. Considering the other parameters are almost pre-deterministic in value, the vertical height () for K = 0.035/yr calculated by Equation (3) shall be around 8.5 m range. Therefore, even though more on-site survey and analysis may be necessary, this study shows that the closure depth can be considered to be around 9 m, the value added up with the tidal range on top of the vertical height () calculated under the circumstance without tidal range.
5.3. Discussion on Further Application from Study Findings
The present study has described two major findings: a theoretical equation of littoral sediment budget derived from the principle of mass conservation, which is given in terms of reduction ratio of sediment discharge α and coastal sediment loss rate K, and the usefulness of respective approaches taken to estimate two coefficients in the Janghang beach. Recently, the SWAT (Soil and Water Assessment Tool) model [36,37,38] has often been used to accomplish the accurate estimation of sediment loading, although it requires the high resolution of a DEM (Digital Elevation Model), land use and soil maps, and precipitation data. The accurate estimation of sediment loading into a littoral coast also guarantees the accurate estimation of K indirectly by using Equation (3) if a river discharges directly to the beach.
The coastal sediment loss rate K is often affected by construction of coastal structures such as detached breakwater, groin, seawall, and so on. It definitely causes the change of beach width, which can be estimated by the alternative form of Equation (2),
Here, and denote the coastal sediment loss and the equilibrium shoreline after construction of coastal structures, respectively. In addition, denotes the coastal sediment loss before construction of coastal structures.
As the value is firmly estimated, the theoretical solution obtained from the present study can also be applied to a beach restoration project, since the theoretical solution predicts the temporal variation of beach recession, which eventually returns to the equilibrium original shoreline depending on the K value. The temporal variation is estimated by the alternative form of Equation (5),
Here, denotes the equilibrium shoreline, denotes the beach width after beach nourishment. From Equation (12), the half period of beach nourishment, which is considered as the most important information for beach nourishment, is estimated as
6. Conclusions
In the present study, a methodology enabling the prediction of the background erosion rate of a beach from the reduction in the sediment inflow from rivers, attributed to the development of a watershed, is proposed. The sediment budget, which varied according to the development of the river watershed, was analyzed, and the theoretical formula expressing the temporal changes in the width of the beach was derived based on previous studies, an understanding of the system components that created the beach, and the formula explaining the conservation of sediment (mass conservation). The developed theoretical formula enabled us to estimate the future temporal changes in the beach width.
For validation, the methodology developed in the present study was applied to the Janghang Songrim Beach, Janghang Eub, Seocheon County, Chungcheongnam-do Province, located within the vicinity of the Geum River estuary. The site was selected because it was determined to be the most appropriate area for determining the effects of beach retreat resulting from a reduction in the littoral drift of sediment in the proximal beach area due to the construction of the Geum estuary barrier. An analysis of the sediment budget, the development in the Geum River watershed, and the resulting reduction in the inflow of the sediment, were examined. Additionally, the geometrically corrected aerial images of photographs of the corresponding shoreline were used to examine temporal changes in the shoreline, and verify the applicability of the derived theoretical formula, as well as to calculate the coastal sediment loss rate offshore, the value of which was 0.035 per year.
The coastal sediment loss rate offshore is a significant consequence in studies predicting the basic erosion rate in future littoral cells, along with the rate of reduction in the river sediment. Owing to a lack of data prior to the development of the Geum River watershed or data representing the subsequent variabilities, and to take other uncertainties into account, a sensitivity analysis on the rate of coastal sediment loss was conducted.
From an estimation of the erosion rate in Janghang Songrim Beach, situated within the vicinity of the Geum River estuary, background erosion rates of 55% and 62% for the years 2050 and 2100 were obtained for the beach, respectively. By predicting the amount of time required for the accumulation of effects of the reduced sediment from Geum River, due to the development of a watershed, to affect the beachline, the necessary preparations pertinent to a reduction in the width of the beach and coastal erosion can be made.
The present study, which delved into the background erosion rate based on an analysis of the sediment budget, needs to be complemented by a precise examination of the phenomena of reduction in sediment. Additionally, the dwelling time of the effects of the reduced sediment in the littoral drift due to the construction of dams in the upstream area of the Geum River, and the coastal sediment loss rate offshore, are needed, which were disregarded in the present study owing to the sole application of a theoretical formula for the Geum estuary barrier.
Author Contributions
Supervision, J.L.L.; Writing—original draft, S.L.; Writing—review & editing, J.L.L. All authors have read and agreed to the published version of the manuscript.
Funding
This research was funded by Ministry of Oceans and Fisheries grant number 20180404, Korea.
Conflicts of Interest
The authors declare no conflict of interest.
References
- Korea Environment Institute (KEI). Study on the Effective Mitigation Measures of Coastal Erosion due to Coastal Developments, RE-21; Korea Environment Institute: Sejong-si, Republic of Korea, 2006; pp. 71–118. [Google Scholar]
- Wasyl, J.; Jenkins, S.A.; Skelly, D.W. Sediment bypassing around dams: A potential beach erosion control mechanism. In The California Coastal Aone Experience, Symposium on Coastal and Ocean Management; Domurat, G., Wakeman, T., Eds.; American Society of Civil Engineers: New York, NY, USA, 1978; pp. 251–265. [Google Scholar]
- Batalla, R.J.; Go’mez, C.M.; Kondolf, G.M. River impoundment and changes in flow regime, Ebro River basin, northeastern Spain. J. Hydrol. 2004, 290, 117–136. [Google Scholar] [CrossRef]
- Sanchez-Arcilla, A.; Jimenez, J.A.; Valdemoro, H.I. The Ebro Delta: Morphodynamics and vulnerability. J. Coast. Res. 1998, 14, 754–772. [Google Scholar]
- Willis, C.M.; Griggs, G.B. Reductions in fluvial sediment discharge by coastal dams in California and implications for beach sustainability. J. Geol. 2003, 111, 167–182. [Google Scholar] [CrossRef]
- Foley, M.M.; Jonathan, A.W.; Andrew, R.; Andrew, W.S.; Patrick, B.S.; Jeffrey, J.D.; Matthew, M.B.; Rebecca, P.; Guy, G.; Randal, M.; et al. Coastal habitat and biological community response to dam removal on the Elwha River. Ecol. Monogr. 2017, 87, 552–577. [Google Scholar] [CrossRef]
- Randle, T.J.; Bountry, J.A.; Ritchie, A.; Wille, K. Large-scale dam removal on the Elwha River, Washington, USA: Erosion of reservoir sediment. Geomorphology 2015, 246, 709–728. [Google Scholar] [CrossRef]
- Warrick, J.A.; Jennifer, A.B.; Amy, E.E.; Christopher, S.M.; Timothy, J.R.; Guy, G.; Andrew, C.R.; George, R.P.; Vivian, L.; Jeffrey, J.D. Large-scale dam removal on the Elwha River, Washington, USA: Source-to-sink sediment budget and synthesis. Geomorphology 2015, 246, 729–750. [Google Scholar] [CrossRef]
- Foley, M.M.; Warrick, J.A. Ephemeral seafloor sedimentation during dam removal: Elwha River, Washington. Cont. Shelf Res. 2017, 150, 36–47. [Google Scholar] [CrossRef]
- Warrick, J.A.; Stevens, A.W.; Miller, I.M.; Harrison, S.R.; Ritchie, A.C.; Gelfenbaum, G. World’s largest dam removal reverses coastal erosion. Sci. Rep. 2019, 9, 1–12. [Google Scholar] [CrossRef] [PubMed] [Green Version]
- Bruun, P. Sea-level rise as a cause of shore erosion. J. Waterw. Harb. Coast. Eng. Div. ASCE 1962, 88, 117–130. [Google Scholar]
- Zang, K. Twentieth century storm activity and sea level rise along the U.S. east coast and their impact on shoreline position. Ph.D. Thesis, University of Maryland, College Park, MD, USA, 1997. [Google Scholar]
- Cho, W.; Yoon, J.S.; Hur, D.S.; Lee, J.L. New Profile Fitting Approach for Estimating Beach Recession Resulting from Sea-Level Rise. In Proceedings of the Coastal Sediments 2015, San Diego, CA, USA, 11 May 2015; pp. 1–9. [Google Scholar]
- U.S. ARMY CORPS OF ENGINEERS. Shore of New Jersey from Sandy Hook to Barnegat Inlet, Beach Erosion Control Study; Letter from the Secretary of the Army, House Document No. 361, 84th Congress, 2nd Session; U.S. Government Printing Office: Washington, DC, USA, 1957.
- U.S. ARMY CORPS OF ENGINEERS. Shore of New Jersey from Sandy Hook to Barnegat Inlet, Beach Erosion Control Study; Letter from the Secretary of the Army, House Document No. 362, 85th Congress, 2nd Session; U.S. Government Printing Office: Washington, DC, USA, 1958.
- Caldwell, J.M. Coastal Processes and Beach Erosion. J. Soc. Civ. Eng. 1966, 53, 142–157. [Google Scholar]
- Dolan, T.J.; Castens, P.G.; Sonu, C.J.; Egense, A.K. Review of Sediment Budget Methodology: Oceanside Littoral Cell, California. In Proceedings of the Coastal Sediments ‘87 (ASCE), Reston, VA, USA, 23 May 1987; pp. 1289–1304. [Google Scholar]
- Kana, T.; Stevens, F. Coastal Geomorphology and Sand Budgets Applied to Beach Nourishment. In Proceedings of the Coastal Engineering Practice ‘92 (ASCE), Long Beach, CA, USA, 9 March 1992; pp. 29–44. [Google Scholar]
- Kraus, N.C.; Rosati, J.D. Estimation of Uncertainty in Coastal-Sediment Budgets at Inlets; Coastal Engineering Technical Note CETN IV-16; U.S. Army Engineer Research and Development Center, Coastal and Hydraulics Laboratory: Vicksburg, MS, USA, 1999.
- Kraus, N.C.; Rosati, J.D. Estimating Uncertainty in Coastal Inlet Sediment Budgets. In Proceedings of the 12th Annual National Conference on Beach Preservation Technology (Florida Shore & Beach Preservation Association), Tallahassee, FL, USA, 27 January 1999; pp. 287–302. [Google Scholar]
- Patsch, K.; Gary, G.B. Development of Sand Budgets for California’s Major Littoral Cells; Institute of Marina Sciences University of California: Santa Cruz, CA, USA, 2007. [Google Scholar]
- Environment Agency. Sediment Budget Analysis: Practitioner Guide; 2018. Available online: https://www.gov.uk/government/publications/sediment-budget-analysis-practitioner-guide (accessed on 23 July 2020).
- Kaminsky, G.M.; Buijsman, M.C.; Ruggiero, P. Predicting Shoreline Change at Decadal Scale in the Pacific Northwest, USA. In Proceedings of the 27th International Conference on Coastal Engineering (ICCE), Sydney, Australia, 4 July 2000; pp. 2400–2413. [Google Scholar]
- Ock, G.; Choi, M.; Park, H.G. Temporal Adjustment of Channel Geometry and Spatial Changes in Riverbed Materials along the Downstream Channels of Large Dams in the Geum River basin. Ecol. Resilient Infrastruct. 2019, 6, 287–294. [Google Scholar]
- Lee, J.W.; Park, J.Y.; Jung, C.G.; Kim, S.J. Evaluation of Land Use Change Impact on Hydrology and Water Quality Health in Geum River Basin. J. Korean Assoc. Geogr. Inf. Stud. 2019, 22, 82–96. [Google Scholar]
- Ministry of Oceans and Fisheries (MOF). Investigation of Beach Erosion White Paper; Ministry of Oceans and Fisheries: South Chungcheong Province, Republic of Korea, 2019; pp. 795–825.
- Cooper, N.J. Engineering Performance and Geomorphic Impacts of Shoreline Management at Contrasting Sites in Southern England. Ph.D. Thesis, University of Portsmouth, Hampshire, England, 1997. [Google Scholar]
- Cooper, N.J.; Pethick, J.S. Sediment budget approach to addressing coastal erosion problems in St. Ouen’s Bay, Jersey, Channel Island. J. Coast. Res. 2005, 21, 112–122. [Google Scholar] [CrossRef]
- Pethick, J.S. Geomorphological Assessment Draft Report to Environment Committee; Environment Committee: St. Ouen’s Bay, JE, USA, 1996. [Google Scholar]
- Slagel, M.J.; Griggs, G. Cumulative Losses of Sand to the Major Littoral Cells of California by Impoundment behind Coastal Dams. J. Coast. Res. 2008, 252, 50–61. [Google Scholar]
- Lee, S. Estimation of Sandy Beach Erosion Rate due to Reduction in Sediment Budget. Master’s Thesis, Sungkyunkwan University, Suwon, Korea, 2014. [Google Scholar]
- Ministry of Land Transport and Maritime Affairs. Hydrological Annual Report in Korea 2012; Ministry of Land Transport and Maritime Affairs: Sejong-si, Republic of Korea, 2013.
- Birkemeier, W.A. Field data on seaward limit of profile change. J. Waterw. Port Coast. Ocean Eng. 1985, 111, 598–602. [Google Scholar] [CrossRef] [Green Version]
- Hallermeier, R.J. A profile zonation for seasonal sand beaches from wave climate. Coast. Eng. 1981, 4, 253–277. [Google Scholar] [CrossRef]
- Tarmo, S.; Maija, V.; Maris, E. Spatial variations of wave loads and closure depths along the coast of the eastern Baltic Sea. Est. J. Eng. 2013, 19, 93–109. [Google Scholar]
- Francos, A.; Bidoglio, G.; Galbiati, L.; Bouraoui, F.; Elorza, F.J.; Rekolainen, S.; Manni, K.; Granlund, K. Hydrological and water quality modelling in a medium-sized coastal basin. Phys. Chem. Earth B 2001, 26, 47–52. [Google Scholar] [CrossRef]
- Gassman, P.W.; Reyes, M.R.; Green, C.H.; Arnold, J.G. The Soil and Water Assessment Tool: Historical Development, Applications, and Future Research Directions. Am. Soc. Agric. Biol. Eng. 2007, 50, 1211–1250. [Google Scholar] [CrossRef] [Green Version]
- Wu, K.; Xu, Y.J. Evaluation of the applicability of the SWAT model for coastal watersheds in southeastern Louisiana. J. Am. Water Resour. Assoc. 2006, 42, 1247–1260. [Google Scholar] [CrossRef]
Figure 1.
Location of Janghang Songrim Beach in Geum Estuary, Republic of Korea.

Figure 2.
Coastal erosion situation in Janghang Songrim Beach (Jan. 2014).

Figure 3.
Grain refinement according to change in direction of littoral drift.

Figure 4.
Sediment budget system in littoral cell.

Figure 5.
Background erosion from a reduction in sediment budget.

Figure 6.
Conceptual diagram of source and sink of sediment in the sediment budget.

Figure 7.
Conceptual diagram of coastal sediment loss rate ().

Figure 8.
Diagram of predicted change in background erosion shoreline (dimensionless unit).

Figure 9.
Comparison of (a) annual mean sediment discharge and (b) reduction in sediment volume by dam construction.
Figure 9.
Comparison of (a) annual mean sediment discharge and (b) reduction in sediment volume by dam construction.

Figure 10.
Comparison of monthly mean precipitation in Korea and California [32].
Figure 10.
Comparison of monthly mean precipitation in Korea and California [32].

Figure 11.
Result of sediment discharge in Geum Estuary.

Figure 12.
Overlay analysis process.

Figure 13.
Steps of aerial image correction.

Figure 14.
Aerial photograph of georeferenced Janghang Beach.

Figure 15.
Shoreline data from overlay analysis in Janghang Beach.

Figure 16.
Result of background erosion rate at Janghang Beach.

Figure 17.
(a) , (observatory buoy data from KHOA), (b) berm height, and (c) mean tidal range in Janghang.
Figure 17.
(a) , (observatory buoy data from KHOA), (b) berm height, and (c) mean tidal range in Janghang.

Figure 18.
Parametric sensitivity analysis for coastal sediment loss rate ().


| Major Rivers | Sub-Rivers |
Basin Area (km2) |
Actual Sediment Discharge (With Dam) (m3/yr) |
Natural Sediment Discharge (No Dam) ( ) |
|---|---|---|---|---|
| Smith River | 1823 | 136,475 | ||
| Klamath River | 1248 | 236,465 | ||
| Eel River | 3845 | 168,500 | ||
| Ten Mile and Navarro River | 5010 | 149,615 | ||
| Russian River | 10,952 | 555,000 | ||
| Santa Cruz | 808 | 59,500 | ||
| Southern Monterey Bay | 1905 | 137,152 | ||
| Salinas River | 10,952 | 555,000 | ||
| Carmel River | 2327 | 545,000 | ||
| Carmel River | 808 | 59,500 | ||
| Point Sur and Morro Bay | 848 | 75,939 | ||
| Santa Maria | 8715 | 619,392 | ||
| Arroyo Grande | 396 | 85,500 | ||
| Santa Ynez | 5382 | 219,986 | ||
| Santa Barbara | 1111 | 55,000 | ||
| Santa Monica | 4483 | 63,500 | ||
| Malibu Creek | 285 | 40,600 | ||
| San Pedro | 966 | 177,602 | ||
| L.A. River | 2163 | 178,000 | ||
| San Gabriel | 1837 | 139,000 | ||
| Santa Ana River | 4381 | 290,000 | ||
| San Diego River | 1111 | 55,000 | ||
| San Dieguito River | 896 | 45,000 | ||
| San Luis Rey River | 1450 | 100,000 |
Table 2.
Water storage capacity and sediment discharge behind each dam [30].
Table 2.
Water storage capacity and sediment discharge behind each dam [30].
| Dam |
Loss of Sediment Discharge by Dam (m3/yr) |
Water Storage Capacity (m3) |
|---|---|---|
| Tompson creek | 500 | 830,865 |
| Casitas | 31,000 | 313,000,000 |
| Eaton wash | 1000 | 889,000 |
| Carbon canyon | 2000 | 1,100,000 |
| Cogswell | 5000 | 11,063,000 |
| Pacoima | 3000 | 4,659,000 |
| San clemente | 16,000 | 1,790,000 |
| San gabriel | 28,500 | 54,499,000 |
| San dimas | 2000 | 1,869,000 |
| Big tujunga | 9500 | 7,350,000 |
Table 3.
Sediment discharge and basin area in Korea [31].
Table 3.
Sediment discharge and basin area in Korea [31].
| Area | Point | Basin Area ( ) | Sediment Discharge Modified Einstein) () |
| Han River | Yeoju | 12,408 | 661,793 |
| Munmak | 1491 | 548,975 | |
| Nakdong River | Hyangseok | 1816 | 158,978 |
| Seonsan | 1005 | 455,601 | |
| Waegwan | 1285 | 154,880 | |
| Jukgo | 1717 | 170,054 | |
| Jindong | 20,311 | 887,901 | |
| Jeongam | 2986 | 119,585 | |
| Geum River | Habgang | 5012 | 352,582 |
| Yeongsan River | Seonam | 403 | 75,657 |
| Nampyeong | 576 | 144,784 | |
| Naju | 1719 | 347,684 |
Table 4.
Monthly mean precipitation in Korea and California (unit:
) [32].
Table 4.
Monthly mean precipitation in Korea and California (unit:
) [32].
| January | February | March | April | May | June | July | August | September | October | November | December | Mean | Std. | |
|---|---|---|---|---|---|---|---|---|---|---|---|---|---|---|
| Korea | 21.6 | 23.6 | 45.8 | 77 | 102.2 | 133.3 | 327.9 | 348 | 137.6 | 49.3 | 53 | 24.9 | 112.0 | 112.9 |
| California | 108.3 | 111.8 | 81.9 | 39.4 | 16.4 | 6.0 | 1.6 | 2.6 | 6.9 | 29.0 | 65.6 | 101.7 | 47.6 | 43.8 |
Table 5.
Estimated sediment discharge in Geum Estuary.
| Name |
Completion Date (yr) |
Storage Capacity (103m3) |
Dam Drainage Area (km2) |
Basin Area (km2) |
Accrued Sediment Discharge (m3/yr) |
Reduced Sediment Discharge (m3/yr) |
Sediment Discharge (m3/yr) |
Reduction Rate (%) |
|---|---|---|---|---|---|---|---|---|
| Yongdam Dam(A) | 2001 | 815,000 | 930 | 930 | 81,361 | 35,536 | 81,316 | 44 |
| Daechung Dam(B) | 1980 | 1,490,000 | 667 | 3303 | 197,671 | 38,614 | 243,496 | 56 |
| Baeckgok Dam() | 1984 | 21,800 | 86 | 86 | 39,960 | 17,063 | 39,960 | 43 |
| Topjung Dam() | 1944 | 31,611 | 71 | 219 | 46,516 | 18,958 | 46,516 | 48 |
| Geum Estuary Weir (C) | 1990 | 138,000 | 537 | 5376 | 299,269 | 26,476 | 245,613 | 43 |
| Total | 2291 | 9915 | 664,778 | 245,613 | 63 |
Table 6.
Aerial and satellite imagery information.
| Site | Date | Providers | Image No. | Type |
|---|---|---|---|---|
| Area of Janghang Beach in Geum Estuary, Korea | Oct. 1947 | National Geographic Information Institute | 194710000300070005 | Aerial Photo |
| Mar. 1985 | National Geographic Information Institute | 198500000300910002 | Aerial Photo | |
| Apr. 2000 | National Geographic Information Institute | 200004001400090004 | Aerial Photo | |
| Apr. 2003 | National Geographic Information Institute | 200345 | Aerial Photo | |
| Jun. 2010 | National Geographic Information Institute | 20103424 | Aerial Photo | |
| Sep. 2015 | Daum (Korean portal site) | - | Satellite image | |
| Sep. 2018 | National Geographic Information Institute | 201811610A | Aerial Photo |
Table 7.
Beach width and area of Janghang Beach.
| Date | ||||||||
|---|---|---|---|---|---|---|---|---|
| #0–#1 | #1–#2 | #2–#3 | #3–#4 | #4–#5 | #5–#6 | Total Area | Avg. Width | |
| October, 1947 | 5697 | 4609 | 5215 | 6798 | 4915 | 4218 | 31,452 | 52.42 |
| March, 1985 | 6667 (+970) | 4324 (−285) | 3208 (−2007) | 4020 (−2779) | 3213 (−1702) | 3867 (−351) | 25,297 (−6154) | 42.16 (−10.26) |
| April, 2000 | 5230 (−1437) | 3150 (−1174) | 1927 (−1281) | 3963 (−56) | 3557 (+344) | 2225 (−1642) | 20,051 (−5246) | 33.42 (−8.42) |
| April, 2003 | 5192 (−38) | 3564 (+414) | 2547 (+620) | 3493 (−470) | 2327 (−1230) | 1589 (−636) | 18,709 (−1342) | 31.18 (−2.24) |
| June, 2010 | 5058 (−134) | 3494 (−70) | 2273 (−274) | 3933 (+440) | 2433 (+106) | 1136 (−453) | 18,330 (−379) | 30.55 (−0.63) |
| September, 2015 | 4272 (−786) | 2759 (−735) | 2220 (−53) | 3317 (−616) | 2660 (+227) | 1763 (+627) | 16,991 (−1339) | 28.32 (−2.23) |
| September, 2018 | 4163 (−109) | 2053 (−706) | 1747 (−473) | 2506 (−811) | 2132 (−528) | 2157 (+394) | 14,758 (−2233) | 24.60 (−3.72) |
Table 8.
Parameters of beach width calculation formula from coastal sediment loss rate ().
| Littoral Cell | |||||||
|---|---|---|---|---|---|---|---|
| Geum Estuary | 19.5 | 12 | 245,613 | 0.84 | 0.025 | 0.37 | 42 |
| 19.5 | 8.5 | 245,613 | 1.05 | 0.035 | 0.37 | 42 | |
| 19.5 | 4.5 | 245,613 | 1.39 | 0.066 | 0.37 | 42 |
© 2020 by the authors. Licensee MDPI, Basel, Switzerland. This article is an open access article distributed under the terms and conditions of the Creative Commons Attribution (CC BY) license (http://creativecommons.org/licenses/by/4.0/).
Share and Cite
MDPI and ACS Style
Lee, S.; Lee, J.L. Estimation of Background Erosion Rate at Janghang Beach due to the Construction of Geum Estuary Tidal Barrier in Korea. J. Mar. Sci. Eng. 2020, 8, 551. https://doi.org/10.3390/jmse8080551
AMA Style
Lee S, Lee JL. Estimation of Background Erosion Rate at Janghang Beach due to the Construction of Geum Estuary Tidal Barrier in Korea. Journal of Marine Science and Engineering. 2020; 8(8):551. https://doi.org/10.3390/jmse8080551
Chicago/Turabian StyleLee, Sahong, and Jung Lyul Lee. 2020. "Estimation of Background Erosion Rate at Janghang Beach due to the Construction of Geum Estuary Tidal Barrier in Korea" Journal of Marine Science and Engineering 8, no. 8: 551. https://doi.org/10.3390/jmse8080551
Note that from the first issue of 2016, this journal uses article numbers instead of page numbers. See further details here.