Local Climate Zone Classification Scheme Can Also Indicate Local-Scale Urban Ventilation Performance: An Evidence-Based Study


1
Institute of Atmospheric Environment, China Meteorological Administration, Shenyang 110166, China
2
Regional Climate Centre of Shenyang, Liaoning Meteorological Bureau, Shenyang 110166, China
3
Faculty of Built Environment, University of New South Wales, Sydney 2052, NSW, Australia
*
Authors to whom correspondence should be addressed.
Atmosphere 2020, 11(8), 776; https://doi.org/10.3390/atmos11080776
Submission received: 27 June 2020
/
Revised: 19 July 2020
/
Accepted: 21 July 2020
/
Published: 23 July 2020
(This article belongs to the Special Issue Urban Design Guidelines for Climate Change)
Abstract
:Studies on urban ventilation indicate that urban ventilation performance is highly dependent on urban morphology. Some studies have linked local-scale urban ventilation performance with the local climate zone (LCZ) that is proposed for surface temperature studies. However, there is a lack of evidence-based studies showing LCZ ventilation performance and affirming the reliability of using the LCZ classification scheme to demonstrate local-scale urban ventilation performance. Therefore, this study aims to analyse LCZ ventilation performances in order to understand the suitability of using the LCZ classification scheme to indicate local-scale urban ventilation performance. This study was conducted in Shenyang, China, with wind information at 16 weather stations in 2018. The results indicate that the Shenyang weather station had an annual mean wind speed of 2.07 m/s, while the mean wind speed of the overall 16 stations was much lower, only 1.44 m/s in value. The mean wind speed at Shenyang weather station and the 16 stations varied with seasons, day and night and precipitation conditions. The spring diurnal mean wind was strong with the speeds of 3.56 m/s and 2.21 m/s at Shenyang weather station and the 16 stations, respectively. The wind speed (2.21 m/s at Shenyang weather station) under precipitation conditions was higher than that (1.75 m/s at Shenyang weather station) under no precipitation conditions. Downtown ventilation performance was weaker than the approaching wind background, where the relative mean wind speed in the downtown area was only 0.53, much less than 1.0. The downtown ventilation performance also varied with seasons, day and night and precipitation conditions, where spring diurnal downtown ventilation performance was the weakest and the winter nocturnal downtown ventilation performance was the strongest. Moreover, the annual mean wind speed of the 16 zones decreased from the sparse, open low-rise zones to the compact midrise zones, indicating the suitability of using LCZ classification scheme to indicate local-scale urban ventilation performance. The high spatial correlation coefficients under different seasons, day and night and precipitation conditions, ranging between 0.68 and 0.99, further affirmed that LCZ classification scheme is also suitable to indicate local-scale urban ventilation performance, despite without the consideration of street structure like precinct ventilation zone scheme.
1. Introduction
Because of anthropogenic activities and global climate change [1], cities are experiencing a variety of environmental problems, such as urban warming [1,2], air and water pollution [3,4] and urban flooding [5,6]. Such critical problems have significant human health, social and economic consequences, such as increases in morbidity and mortality, reduction of economic productivity and increases in energy and water consumption [4,7]. Nevertheless, the urbanization remains a rapid upward trend [8], which means the intensity of anthropogenic influences on the urban environment will be intensified [1]. Meanwhile, the global climate change cannot be ceased in the current era and it can only be decelerated in the next several decades under a promising condition. Through this vision, environmental problems in cities will be inevitably aggravated.
Multi-dimensional efforts have been making to address environmental problems in cities. It is, for example, advocated to improve urban energy efficiency through utilising renewable energy and shortening the working distance for alleviating vehicle dependence [9]. Meanwhile, there is also a consensus in the improvement of green and blue infrastructures that play versatile roles in addressing local warming, urban flooding, air pollution and physiological, psychological and physical problems [2,6,10]. Moreover, urban texture and urban morphology have also been an important focus [11,12,13,14,15,16]. The urban texture, e.g., construction materials, can significantly affect urban temperature and urban flooding, through the interaction with solar radiation and heat transfer, as well as the interaction with soil moisture and evaporation [17,18]. Urban morphology which presents the typology of human settlement and the process of forming so has a close relationship with wind and solar radiation [14,16].
Understanding the relationship between urban morphology and wind environment is helpful in understanding the urban ventilation performance that indicates the capacity of wind flows out and into the urban canopy layer. Urban ventilation performance can be assessed by various indicators (e.g., wind velocity, wind velocity ratio, the age of air, pollutant concentration, purging flow rates) for demonstrating the capability of wind in dealing with different problems, such as urban warming mitigation, wind energy potential, pedestrian wind comfort air pollution alleviation and building energy efficiency [16,19,20,21,22]. Various studies have been carried out to investigate wind field around buildings [23,24], airflow mechanism in street canyons [25,26], wind environment in blocks [27,28,29], neighbourhoods and precincts [16,30,31] and urban ventilation corridors in cities [32,33]. In particular, analysing the relationship between local-scale (e.g., neighbourhoods, precincts) urban morphology and wind environment is increasingly important, as it can practically inform local governments, city authorities and developers to perform proper planning and design activities for resilient, healthy and sustainable communities [34].
However, existing studies are not sufficient to support the comprehensive understandings of the relationship between local-scale urban morphology and wind. For instance, Blocken et al. [35] conducted a study in the context of an education precinct in the Netherlands based on numerical simulation to understand its implications for wind comfort and wind safety. Antoniou et al. [36] investigated the wind environment of a compact precinct consisting of low-rise and midrise buildings in Nicosia, Cyprus. Priyadarsini et al. [37] investigated the wind environment in a CBD area of Singapore and pointed out the implications of wind for UHI mitigation that a 35% increase in wind speed can lead to a temperature reduction by 0.7 °C. In order to enhance the cooling potential of sea breeze, Rajagopalan et al. [38] analysed the variation in wind speed with the urban geometry in the Muar region of Malaysia.
Such studies are case-specific, while the local-scale urban morphology is quite complex because of the combination of morphological factors at micro and local scales [16,39]. To overcome this challenge, He et al. [16] proposed an innovative precinct (e.g., neighbourhood, community) morphology classification scheme (also called precinct ventilation zone) that is built upon the urban morphological characteristics of building height, compactness and street structure for characterizing precinct ventilation. Moreover, they applied the precinct morphology classification scheme into the Greater Sydney region of Australia for case studies [40,41,42]. They further compared the precinct ventilation performance in the compact high-rise [40], open midrise [41] and open low-rise precincts [42] with gridiron street structures. Another stream of studies on local-scale ventilation performance is based on the local climate zone (LCZ) scheme that is built upon building height and building surface fraction. For instance, Yang et al. [21] assessed the ventilation performance of distinct local climate zones in the megacity of Shanghai through analysing the frontal area index of different local climate zones. Zhou et al. [43] examined if LCZ scheme could be adopted for understanding the cooling potential of the sea breeze in Sendai, Japan. However, the LCZ scheme is originally developed for land surface temperature studies and it does not consider the potential impact of street structure on local-scale ventilation performance compared with the precinct ventilation zone [16]. Moreover, existing local-scale ventilation studies based on LCZ scheme have only shown ventilation potential or wind cooling potential, while the evidence for validating LCZ ventilation performance has not been given.
Therefore, in order to address this research gap, this study aims to analyse LCZ ventilation performance. This study was conducted in Shenyang, China, by installing weather stations in different local climate zones. This study is of importance to support urban planners and designers to make evidence-based decisions in performing wind-sensitive urban planning and design. The remainder of this paper is structured into several sections. Section 2 introduces the basic information of the case study area of Shenyang, China and the LCZ for analysis. Section 3 presents the data and methods to perform this study. Section 4 analyses and discusses the results and Section 5 concludes this paper.
2. Case Study Area
This study was conducted in Shenyang, the capital city of Liaoning Province, China. Shenyang, the only metropolitan city in Northeast China, has an area of 12,948 km2 and a city area of about 3500 km2. Shenyang experiences a temperate semi-humid continental monsoon climate with distinct seasons and large diurnal temperature differences. The spring and autumn seasons of Shenyang are short in the period during which time the temperatures shift rapidly towards the summer and winter seasons, respectively. The annual average temperature of Shenyang is 8.4 °C. It is really hot in summer. July is generally the hottest month with the average highest temperature of 24.5 °C. The extreme temperature in summer can reach 38.4 °C (2 August 2018). Meanwhile, it is also cold in winters and January is the coldest month with the average lowest temperature of −11.5 °C. In addition, statistics indicate Shenyang has an annual precipitation of 680.0 mm, which is mainly in summer, accounting for 63.2% of the annual total amount.
Shenyang has been experiencing rapid economic development and urbanization with the industrialisation. The urban agglomeration in central and southern Liaoning Province, with the core cities of Shenyang and Dalian, has gradually taken its shape. Under such circumstance, the city of Shenyang is facing the problem of high population density, with the population density reaching 10,952, 11,961 and 12,360 people/km2 in Heping, Shenhe and Huanggu districts, respectively. The high population density has resulted in various issues, such as high building density, low vegetation proportion, air pollution and urban heat island. The wall effect related to the high building density is generally an important cause of urban wind speed reduction, thereby severe air pollution and urban temperature increase [17,44,45,46]. Accordingly, understanding the wind environment in Shenyang is practically meaningful for building resilient, healthy and comfortable cities.
2.1. Synoptic Wind Background
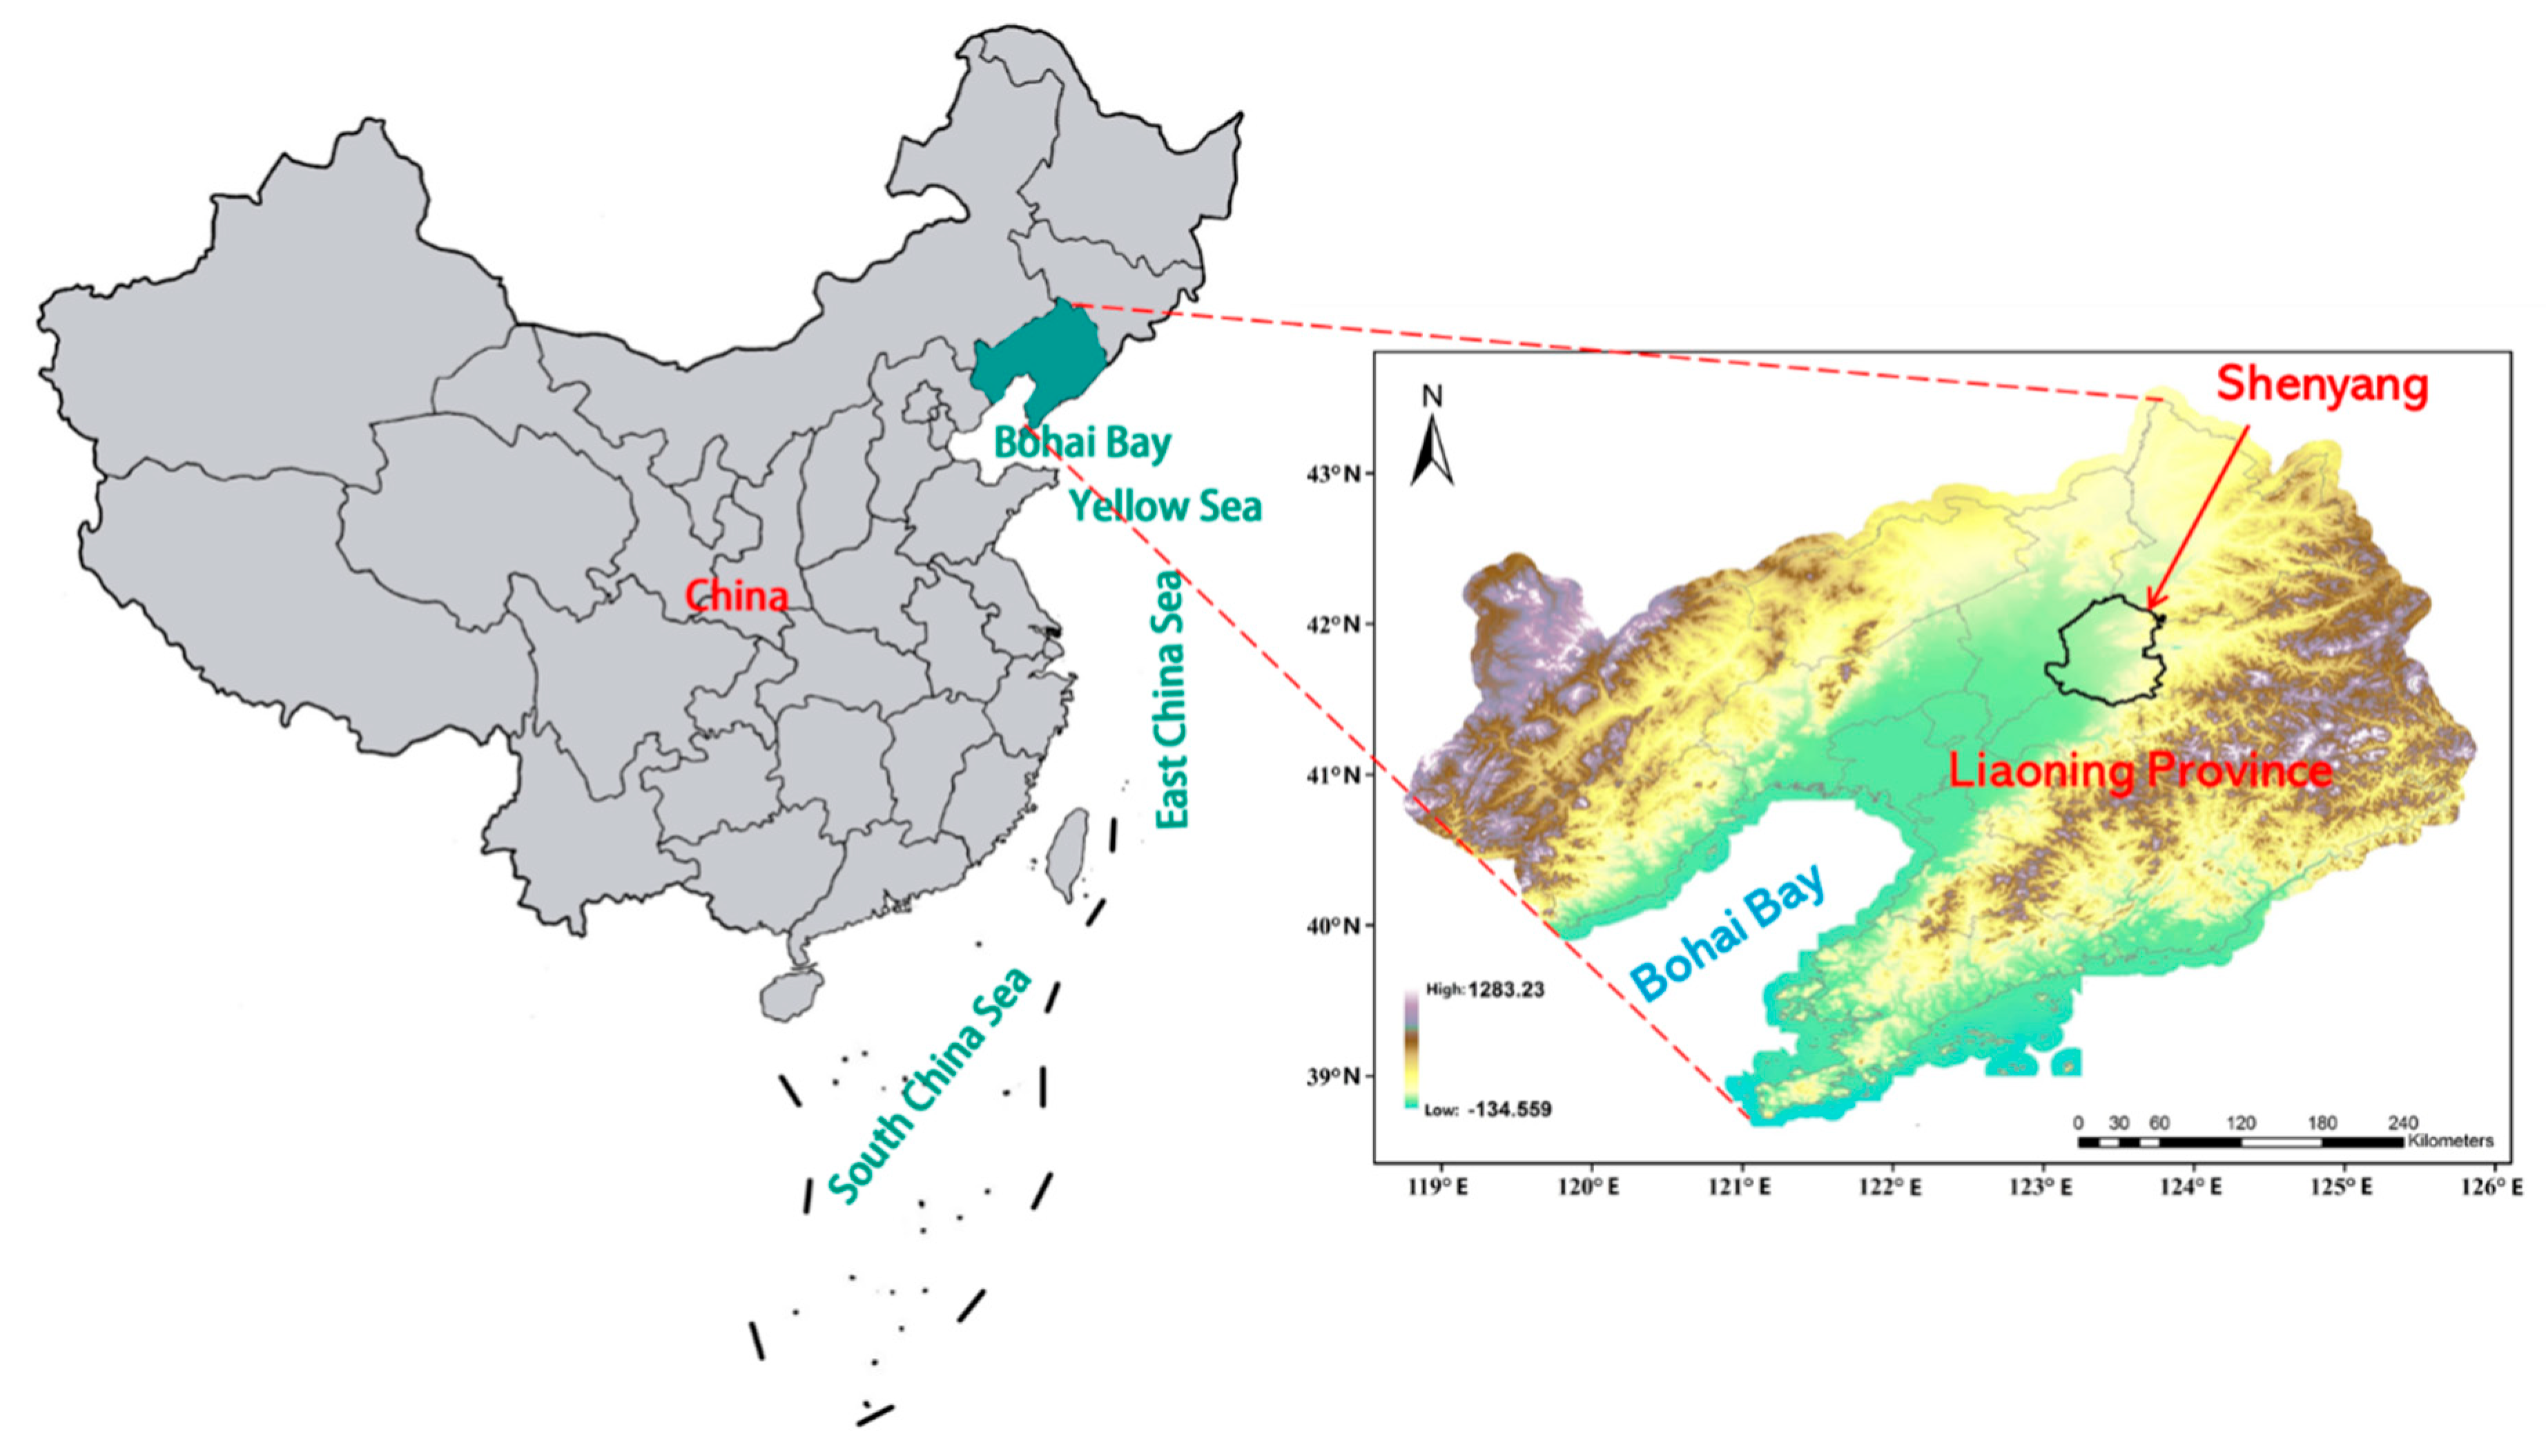
In the analysis of urban wind environment, He et al. pointed out that urban ventilation performance is a synthetic result of synoptic wind background and the urban morphological characteristics. The synoptic wind background is related to the geo-location of Shenyang city. As illustrated in Figure 1, Shenyang is located in the central part of Liaohe Plain, a large alluvial plain formed by the Bohai Bay in the southwest. In contrast, there are hills and mountains on the east and north borders of Shenyang. Under such conditions, the altitude of Shenyang shows large deviations, ranging between 5 and 441 m and exhibiting a gradually decreasing trend from the northeast to southwest. In summer, southerly and south-westerly winds can prevail, and in winter the wind blows from the north and northeast. In addition, there are hills and mountains in Shenyang so that the local air circulations can be compromised [47].
2.2. Urban Morphological Characteristics
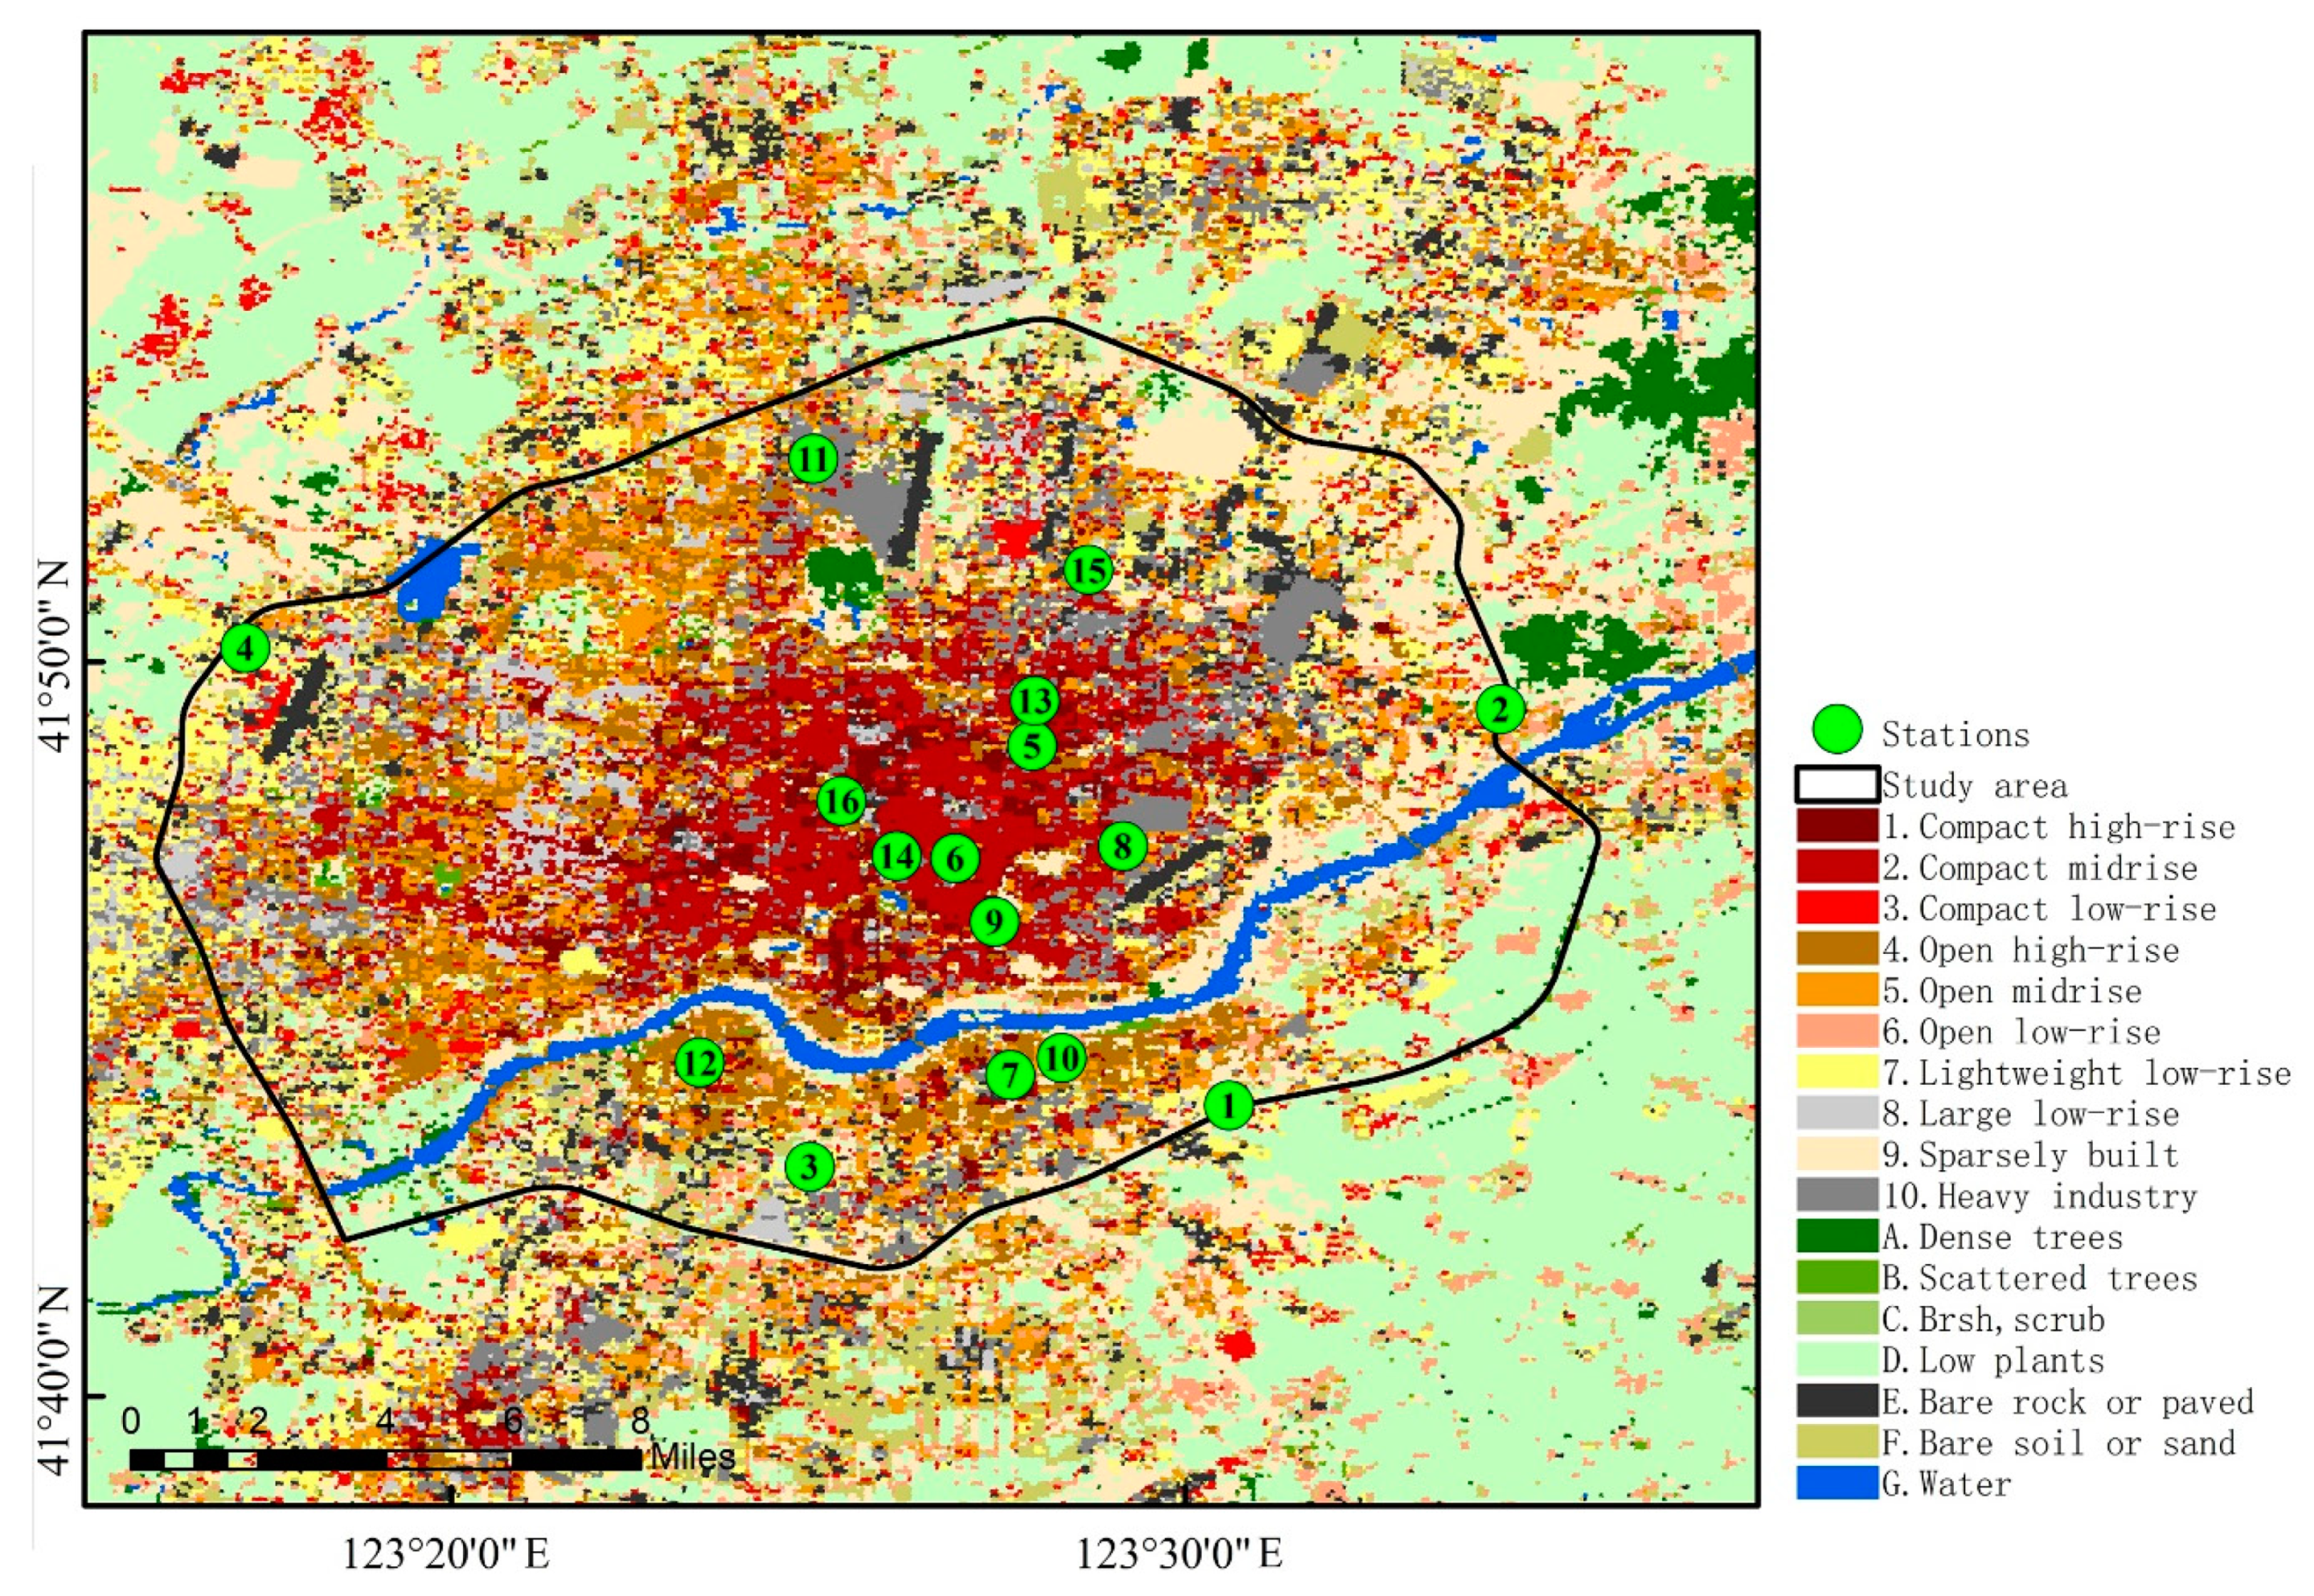
The urban morphological characteristics are represented by specific LCZ types in Shenyang. The local climate zones are identified [14], through artificial recognition and machine learning. The specific classification process is to first select appropriate training zone samples (google earth image on 2 August 2018, no cloud, 30 m resolution) through visual interpretation. Seventeen types of local climate zones were identified, and each type included 5–25 samples according to actual urban morphological characteristics of Shenyang. Moreover, the training area of each type of local climate zone was larger than 1 km2, where the side length was longer than 200 m and the urban morphological characteristics were required to be homogeneous over 1 km2, through these considerations some small areas with heterogeneous or irregular characteristics were excluded in training local climate zones. In addition, a buffer zone with a width of 100 m was reserved between different LCZ training zones in order to avoid uncertain recognition of boundaries. Finally, the LCZ distribution in Shenyang was generated, as illustrated in Figure 2.
Afterwards, sixteen zones, within each area a set of automatic anemometers was mounted and maintained by Liaoning Meteorological Bureau, were selected as the case study areas, as demonstrated in Figure 2. Locations of 16 local climate zones were different, which may show different external (local) wind background. A detailed description of the 16 local climate zones presented in Figure 2 is further provided in Table 1. The LCZ types of the 16 zones included LCZ-2, LCZ-2E, LCZ-2G, LCZ-4G, LCZ-5, LCZ-4,5 and LCZ-9. Such situations were caused by the limited LCZ types in the core area of Shenyang and the constraints of available sensors. Nevertheless, these LCZ types were sufficient to support the analysis of urban ventilation performance of different local climate zones under the synthetic influence of external wind background and urban morphological characteristics [16]. The 16 stations consist of one national weather station (Shenyang weather station) and 15 regional automatic weather stations. The Station 1 (its surrounding area is classified as LCZ-9) is Shenyang Meteorological Station of China Meteorological Administration. Shenyang weather station has been established for more than 30 years and was re-located for three times because of the change of surroundings. The latest re-location took place in 2010, and the new site lied within the suburban area with the sparsely built, low structural landscape. On the other hand, the other 15 stations were gradually deployed by local regional meteorological administration since 2016, and their locations were mainly within the downtown Shenyang (not re-located since then). These locations were selected not only for the maintenance, but also for not being close to the neighbourhood with large structural heterogeneity.
3. Data and Methods
3.1. Data
This study adopts the mean values of the data recorded at a certain weather station to represent the microclimatic characteristics of its corresponding local climate zone. The regional automatic weather stations have been deployed in the downtown Shenyang one by one since 2016, and for each station, the measurement site and its environment were fully considered, especially for wind observation since wind is sensitive to urban morphological characteristics and thereby wind direction and velocity are easily affected by various structures (e.g., buildings, trees). The anemometers (EL15-1A model for wind speed sensor, and EL15-2D model for wind direction vane, both manufactured by Tianjin Meteorological Instrument Factory) were therefore set in relatively open areas (e.g., schools, stadiums), in order to avoid blockage and/or interference effects generated by surrounding buildings and trees and ensure the statistical stationarity and reliability of the measurement data. In addition, the weather stations also recorded the precipitation data (SL3 model manufactured by Shanghai Meteorological Instrument Factory), enabling us to analyse the wind variation under different precipitation conditions (Section 3.3). All anemometers were installed at the 10-m height above ground level. One-year (in 2018) hourly 10-m wind speed, wind direction and precipitation data at 16 weather stations (corresponding to different local climate zones given in Table 1 and Table S1) were obtained. Meanwhile, statistics indicate the data recorded had good completeness (>98%), which is reliable for subsequent analysis.
3.2. Assessment Indicators of Urban Ventilation Performance
Since urban ventilation is critical to several fields (e.g., airflow regime, wind comfort, urban thermal environment and thermal comfort, air pollution), various indicators have been developed to assess urban ventilation performance. In this study, the assessment indicators such as mean wind velocity and relative mean wind speed (RMWS, or relative wind velocity ratio) were adopted to assess the ventilation performance in each zone. The raw data used in this study is hourly collected data, which is averaged over 10 min right before every integral time according to the clock. The mean wind speed or RMWS in the paper is defined as the averaged wind speed (or ratio) over a certain longer period, such as one-year or one-season, using the hourly collected, 10-minute-averaged raw wind speeds recorded at 10 m above ground level.
The wind is the synthetic results of external wind background and LCZ types so that the wind environment in zones is changing with the fluctuating external wind background. The instantaneous wind speed, therefore, cannot accurately demonstrate the ventilation performance in a specific zone. Moreover, the instantaneous wind speed makes it difficult to compare the ventilation performances in different zones as external wind background of a specific zone also varies with different combinations of a larger-scale wind background and urban surfaces. Therefore, the mean wind speed was adopted to assess ventilation performances in different zones.
Relative mean wind speed was adopted to assess ventilation performances in different zones [48]. The RMWS can exclude the influence caused by the fluctuating approaching wind through averaging the ratio of wind velocities in a specific zone to the wind velocity at a reference station Equation (1) [48].
The weather station 1 (LCZ-9) was set as the reference station, as it is the national meteorological station and has the sparsely built characteristics. The wind at this reference station is also less influenced by surrounding built environments and can well represent the approaching wind background. As illustrated in Figure 2, LCZ-1 and LCZ-2 accounts for a large proportion of urban morphology in the downtown of Shenyang. Therefore, the RMWS in LCZ-1 and LCZ-2 (No.13, No.14, No.15 and No.16) was calculated to present downtown ventilation performance. As LCZ-1 and LCZ-2 present the compact midrise built form, the highest urbanization level among the 16 locations, the RMWS in LCZ-1 and LCZ-2 can also indicate the largest ventilation performance differences between the city core and approaching wind.
According to the mean wind speed, the ventilation performances in different zones were compared, building upon which LCZ ventilation performances were further sorted. The LCZ ventilation performance is the combined result of external wind background and LCZ types. However, external wind backgrounds generally indicate seasonal and diurnal/nocturnal variations and urban morphology of different zones is heterogeneous. The combined results of external wind background and LCZ types may accordingly demonstrate temporal variations (e.g., season, day and night, weather condition). The spatial correlation coefficient (η) is therefore proposed to assess the short-term variations (e.g., season, day and night, weather condition) in LCZ ventilation performance compared with the annual LCZ ventilation performance. The spatial correlation coefficient (η) ranges between 0 and 1, where a larger η indicates a stronger consistency between short-term and annual ventilation performances and if η equals to 1.0, there is no difference in short-term and annual ventilation performances. In particular, the η equals to the when conducting the linear regression analysis. In this study, annual LCZ ventilation performance was set as the reference sequence.
3.3. LCZ Ventilation Performance Under Different Scenarios
The LCZ ventilation performance sequence (according to mean wind speed) was analysed at different temporal scales of year, season, day and night and precipitation weather conditions. Moreover, the RMWS in LCZ-1 and LCZ-2 was also analysed to understand the difference in downtown ventilation performance from the approaching wind background.
In the analysis, the diurnal and nocturnal LCZ ventilation performance, the diurnal and nocturnal times were different because of the seasonal variation. According to the sunrise and sunset times, the spring daytime is 6:00–17:00, summer daytime is 5:00–18:00, autumn daytime is 6:00–17:00 and winter daytime is 7:00–16:00.
Since the precipitation process is generally associated with wind, the LCZ ventilation performance was also analysed under different precipitation conditions. In particular, the hourly precipitation of 0.1 mm was adopted as a threshold to screen the conditions of no precipitation and precipitation. Furthermore, the precipitation condition was divided into light rain (≤2.5 mm), moderate rain (2.6–8.0 mm), heavy rain (8.1–15.0 mm) and torrential rain (≥16.0 mm) according to 1-h precipitation (without considering snowfall) [49,50]. Therefore, the LCZ ventilation performance was analysed under fair (no precipitation) and rainy conditions, and further under light, moderate, heavy and torrential rain conditions. Table 2 exhibits the precipitation condition in the 16 stations in Shenyang in 2018. The raining hour decreased gradually following the order of light, moderate, heavy and torrential rain. Moreover, there were limited hours in both heavy rain and torrential rain conditions.
4. Analysis and Discussion
4.1. Mean Wind Speed at Shenyang Weather Station and in Shenyang City
This subsection presents the variation in mean wind speed with several scenarios, such as year, season, day and night and weather conditions. The mean wind speed also exhibits the spatial variations by mean wind speed at Shenyang weather station (No.1, LCZ-9) and mean wind speed of the 16 stations for representing the Shenyang wind condition.
Table 3 presents annual and seasonal mean wind speed at the Shenyang weather station and 16 stations (also refer to Table S2). The annual mean wind speed at Shenyang weather station (No.1, LCZ-9) was 2.07 m/s. However, the annual mean value of the 16 stations was only 1.44 m/s, about 60% of the wind speed at the Shenyang weather stations. This result indicates the construction of urban structures has already lowered the urban ventilation performance. Moreover, the actual wind speed of Shenyang cannot be sufficiently represented by Shenyang weather station, although Shenyang weather station is a national meteorological station. The reduction of urban ventilation performance indicates that there is a need for refined and actual wind speed rather than wind information at only national meteorological stations when analysing the urban ventilation potential of cities.
The wind speed also exhibited seasonal variation, where the mean wind speed at both Shenyang weather station and the 16 stations in spring was the highest among four seasons, with the values of 2.84 m/s and 1.85 m/s. The strongest wind condition in spring is related to its geographic location as well as the macro wind background. Spring is a transitional season between winter and summer, during which period synoptic weather systems move fast. Shenyang is therefore susceptible to cold and warm air mass alternation and thereby high (continental high pressure from Siberia) and low air pressure change frequently. Such conditions result in a northeast vortex before the high pressure extends to the sea and leading to the strong geostrophic winds in Shenyang.
In comparison, the autumn experienced the weakest wind condition, where the wind speed at Shenyang weather station and the 16 stations were 1.63 m/s and 1.16 m/s, respectively. In the autumn, the Siberian air mass gradually strengthens southward and heating mass slowly retreats. However, the East China Sea and the South China Sea are mainly dominated by the low air pressure of retreating heating mass. There is no high and low air pressure alternation in Shenyang. Under such conditions, the air pressure gradient is low. The northeast cold vortex in autumn is, therefore, less than that in spring and the wind was weaker than that in spring. In addition, wind speed at the 16 stations was also lower than that at Shenyang weather station, indicating slower wind speeds in cities compared with the wind speed recorded at the meteorological stations.
Table 4 exhibits the diurnal and nocturnal mean wind speed at Shenyang weather station and the 16 stations (Shenyang city) in four seasons. The wind speed presented by the 16 stations was lower than the wind speed recorded at Shenyang weather station. Both nocturnal and diurnal wind speed reached their largest values in spring, while they experienced the lowest values in autumn. For instance, the diurnal and nocturnal wind speeds at Shenyang weather station were 3.56 m/s and 2.14 m/s, respectively. However, the ones in the autumn were only 2.18 m/s and 1.07 m/s, respectively.
More importantly, the diurnal mean wind speed in four seasons was consistently higher than the nocturnal mean wind speed. For instance, the diurnal mean wind speed at Shenyang weather station in spring reached 3.56 m/s, about 1.5 m/s higher than the nocturnal mean wind speed of 2.14 m/s. The weaker wind condition in the night may be related to the stable atmospheric boundary layer stratification and weaker thermal turbulence. As such, the momentum downward transmission is mainly transported by mechanical turbulence. In comparison, in the daytime, thermal turbulence develops vigorously and then the combined effects of thermal and mechanical turbulences are conducive to the upper momentum downward transmission, resulting in stronger winds near the surface.
Table 5 presents the variation in mean wind speed at Shenyang weather station and the 16 stations with precipitation conditions. Under all scenarios, both no precipitation and different precipitation conditions, mean wind speed at the 16 stations (Shenyang city) was consistently lower than that at the Shenyang weather stations. Meanwhile, the wind speed under precipitation conditions was 2.21 m/s, 0.46 m/s higher than the wind speed (1.75 m/s) under the no precipitation conditions. Under no precipitation conditions, namely under sunny weather conditions that are generally under the control of mesoscale high pressure, background wind speed is even, local strong winds rarely occur and mean wind speed is generally weak. In comparison, under precipitation conditions that generally occur in summer, precipitation, especially moderate, heavy and torrential rain conditions, can be accompanied with local convective weather, resulting in stronger winds near the surface. The wind speed reached 2.33 m/s under torrential rain conditions.
4.2. Downtown Ventilation Performance
The analysis in Section 4.1 indicates that the ventilation performance in Shenyang city was worse than that at the Shenyang weather station (No.1, LCZ-9). Therefore, further analysis was conducted to examine the downtown ventilation performance through the indicator of RMWS. In general, the greater the RMWS is, the better the downtown ventilation performance is, and vice versa. The variation in downtown ventilation performance was analysed in yearly, seasonally, diurnal and nocturnal and different precipitation scenarios.
Table 6 presents the annual and seasonal RMWS. The annual RMWS value of 0.53 (Table 6) shows that the annual downtown ventilation performance was not good, only about 50% of the wind condition at the Shenyang weather station. Among four seasons, the downtown Shenyang experienced the best ventilation performance in winter with the RMWS of 0.60 and experienced the worst ventilation performance in spring with the RMWS of 0.47. In combination with the mean wind speed in different seasons, the RMWS had the practical implications for better urban environments. In spring, the mean wind speed was high and frequent, a low RMWS indicates low wind speed in the downtown area. As such, weak ventilation performance can help reduce the discomfort caused by strong winds. In comparison, in winter, a high RMWS indicates that more cold air could penetrate the downtown areas, increasing the discomfort caused by the cold wind. In summer and autumn, the downtown ventilation performance was less than 0.60, where the potential of wind for addressing urban environmental problems (e.g., UHI) and improving urban liveability was limited. Therefore, to address such problems, it is essential to improve ventilation efficiency in Shenyang.
Table 6 further presents the diurnal and nocturnal downtown ventilation performance in four seasons. The diurnal and nocturnal downtown ventilation performance also indicates the evident seasonal variations, where winter experienced the best ventilation performance and spring underwent the worst ventilation performance, according to the RMWS. Table 6 also indicates that nocturnal ventilation performance was better than the diurnal ventilation performance, where the diurnal RMWS was 0.41, 0.47, 0.49 and 0.56 in spring, summer, autumn and winter, respectively, and the nocturnal RMWS reached to 0.53, 0.61, 0.65 and 0.65, respectively. The weaker downtown ventilation performance may be related to the insignificant thermal difference (weaker UHI phenomenon). Therefore, the ventilation performance in the downtown area is determined by the surface roughness. In comparison, nocturnal UHI can be stronger compared with the diurnal UHI, at which time the heat stored in cities can enhance the thermal turbulence and thereby enhance the downtown ventilation performance.
Table 6 also compares downtown ventilation performance under no precipitation and various precipitation conditions. The downtown ventilation performance (0.65) under no precipitation conditions was better than that (0.49) under precipitation conditions. Downtown ventilation performance weakened with an increase in precipitation level. Such variations in downtown ventilation performance with precipitation conditions may be due to the combined effects of localised precipitation characteristics (Table 2), the obstruction of surface roughness in downtown and thermal uplift led by the downtown surface layer. In particular, the worse downtown ventilation performance may reduce the risks of heavy rain and torrential rain.
4.3. LCZ Ventilation Performance Sequence
4.3.1. Annual LCZ Ventilation Performance and Sequence
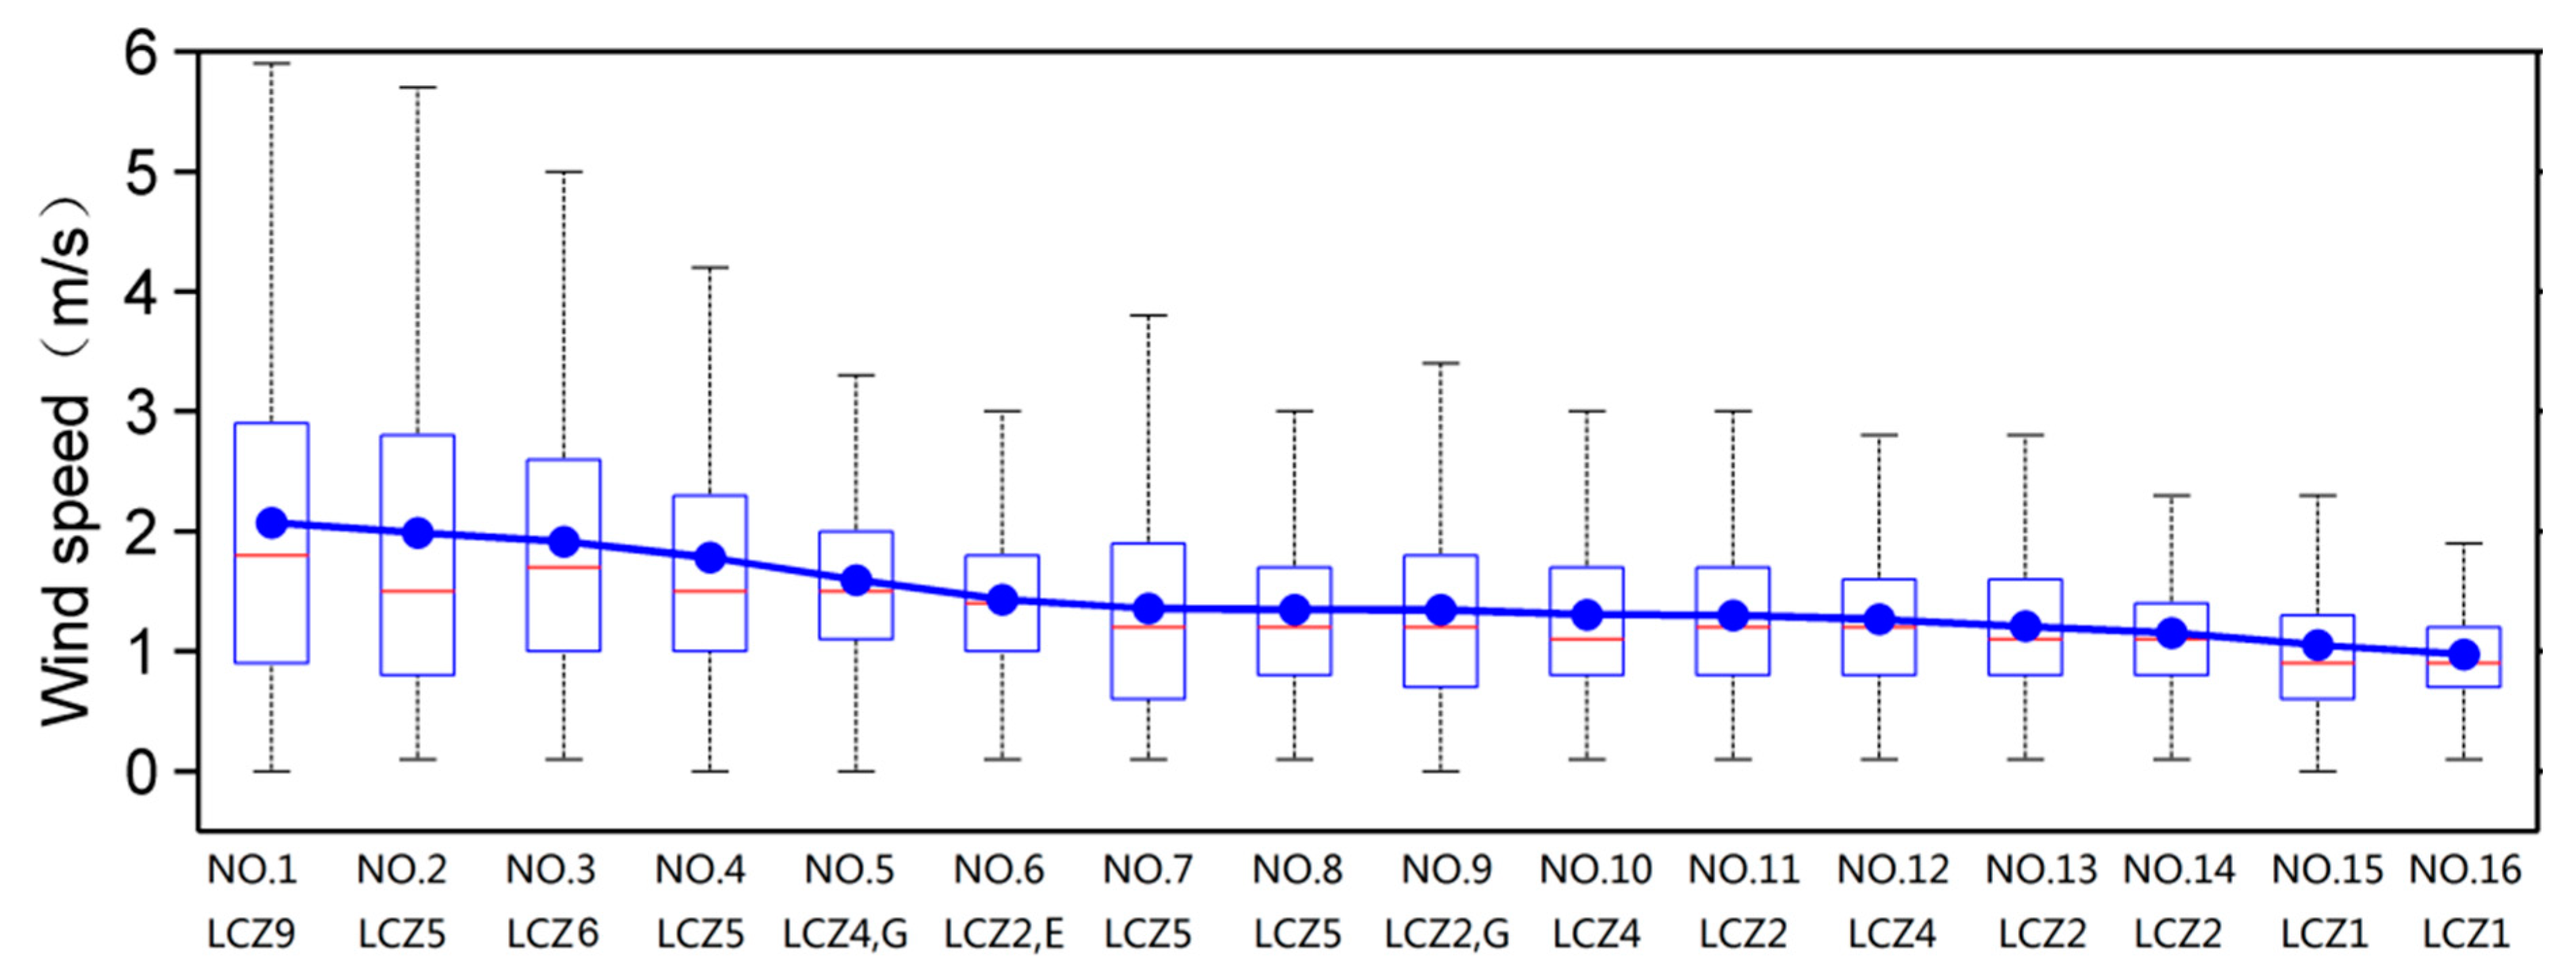
Mean wind speed at the 16 stations is compared in this subsection in order to analyse the LCZ ventilation performance. Figure 3 demonstrates the annual mean wind speed at the 16 stations and the LCZ ventilation performance sequence (original data given in Table S2). The wind speed at stations of No.1, No.2, No.3 and No.4 was high (above 1.9 m/s), higher than the wind speed at the remaining 12 stations. The four stations (e.g., No.1, No.2, No.3, No.4) were located near the city boundary (the black line given in Figure 2). The peripheral locations with low construction levels indicate that the approaching wind was less affected by the urban structures compared with the remaining 12 stations approaching the city centre more. The four stations had LCZ types of LCZ-9, LCZ-5, LCZ-6 and LCZ-5 (Table 1). The sparse and open morphologies were another cause of the higher wind speed at the four stations, compared with the compact morphologies the remaining 12 stations had. LCZ ventilation performance was ranked according to annual mean wind speed at the 16 stations (Figure 3). The results indicate that the wind speed decreased with the weather stations from No.1 to No.16. This indicates that the LCZ ventilation performance decreased with the LCZ types following the order of sparse, open low-rise, open midrise and compact midrise. Such consistent relationships between wind speed and LCZ types confirm the reliability of using the LCZ classification scheme to indicate the local-scale urban ventilation performance.
Although there is a clear relationship between local-scale urban ventilation performance and LCZ types, we keep the argument that LCZ ventilation performance can also be affected by other factors, such as the location of weather stations in a city, the approaching wind condition and the altitude of different stations. It should be noted that there were mixed LCZ types in the 16 stations, such as No.5 (LCZ-4,G), No.6 (LCZ-2,E) and No.9 (LCZ-2,G). The ventilation performance at such four stations was affected by compactness and building height, while the types of G (water) and E (bare soil or paved) were open in morphological characteristics, enabling the increase in mean wind speed in the certain direction from wind blows over the underlying types G or E.
4.3.2. Seasonal LCZ ventilation Performance and Sequence
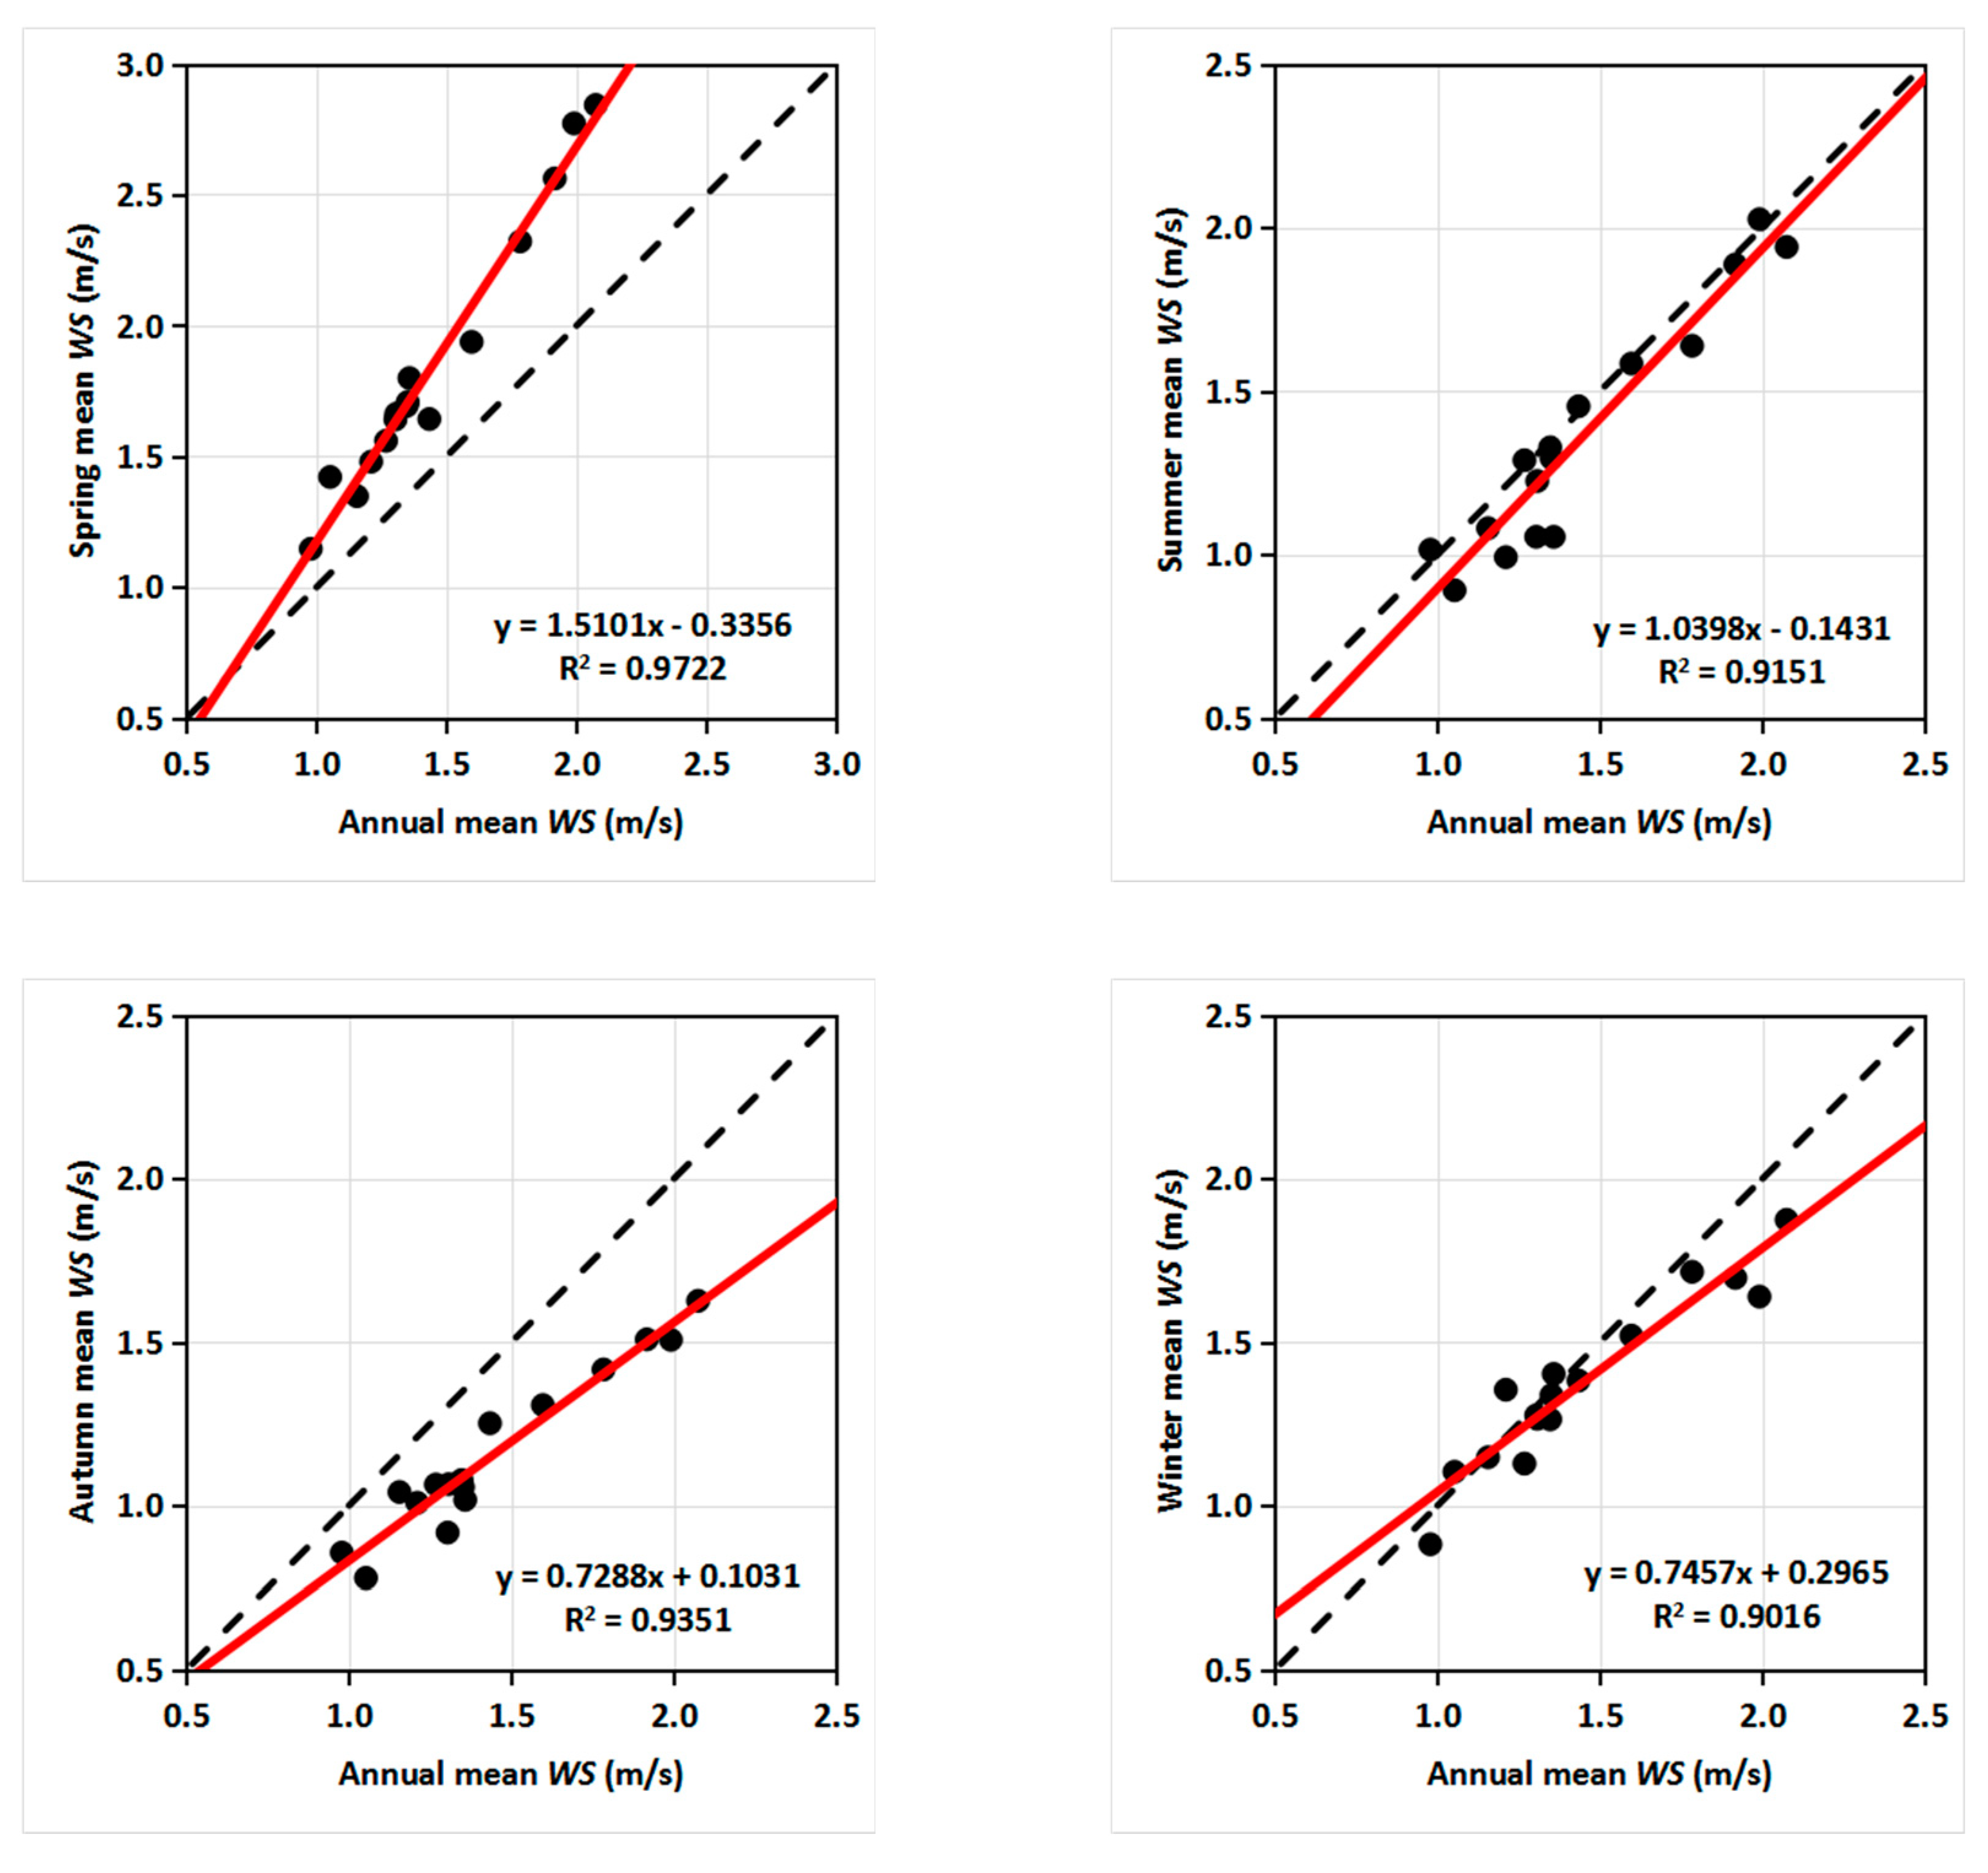
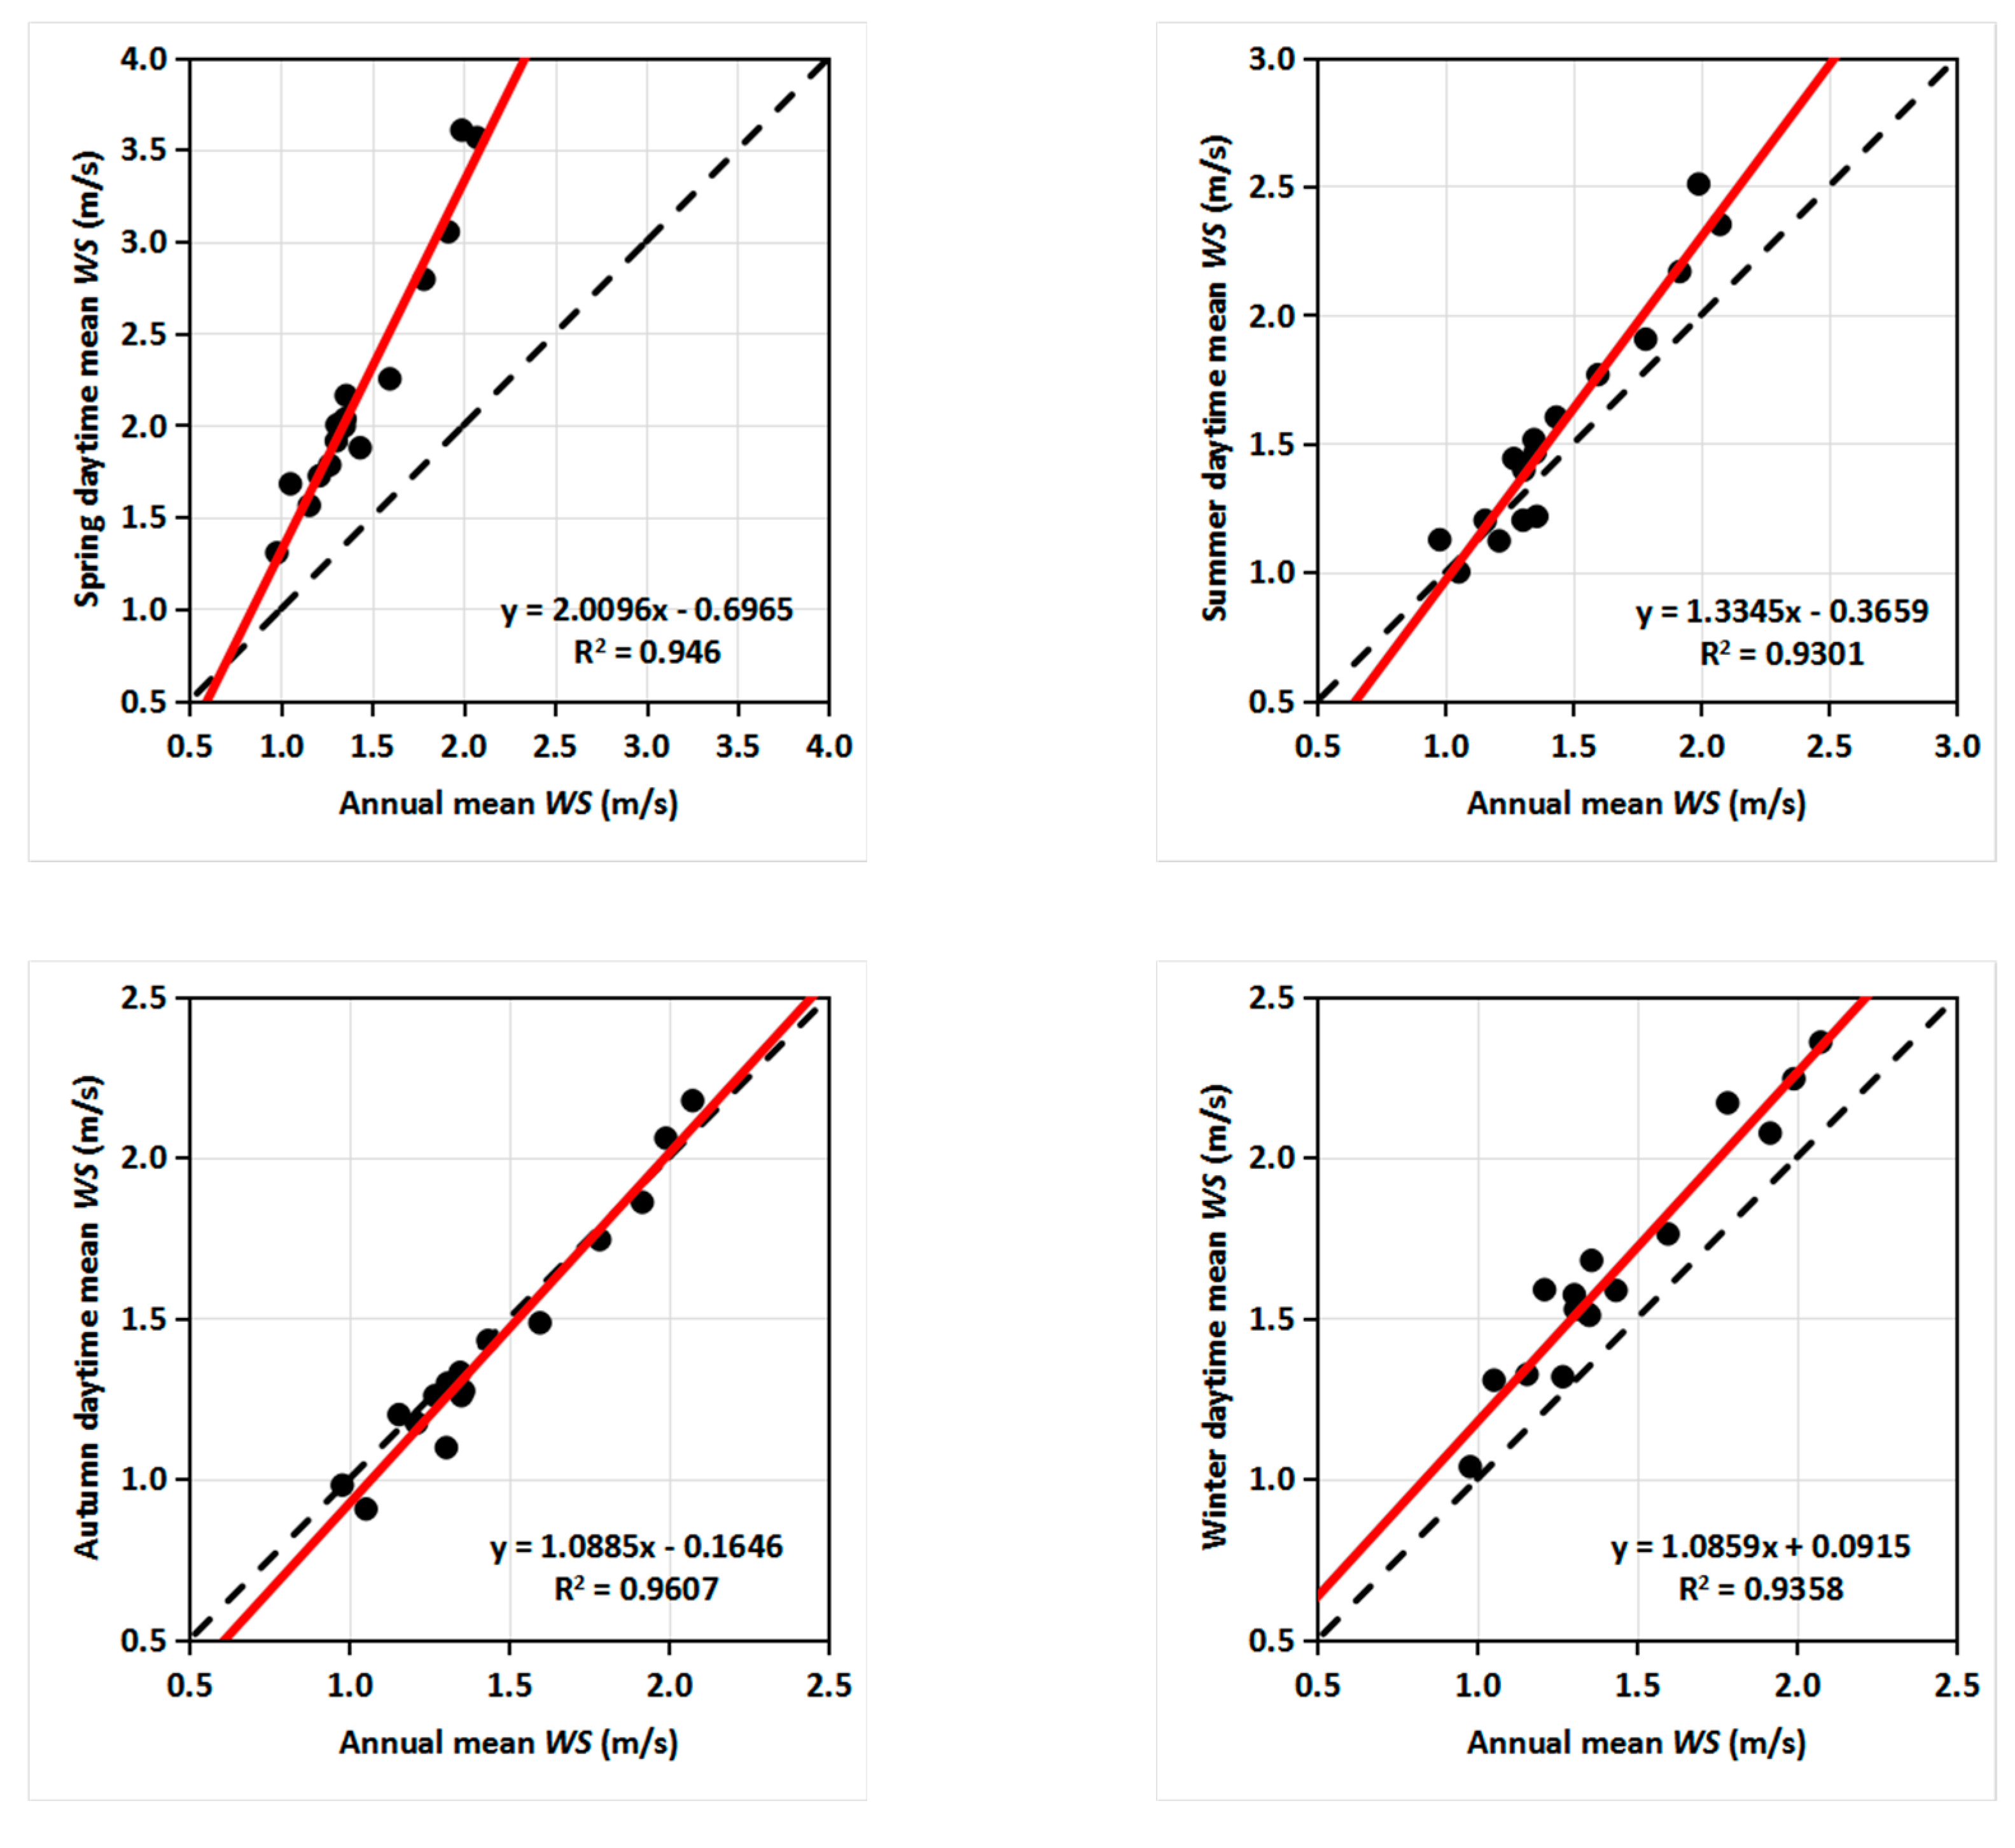
Figure 4 exhibits seasonal mean wind speed and LCZ ventilation performance sequence through the spatial correlation coefficient (η, or R2) (also refer to Table S3). First, the fitted line of spring wind speed (Figure 4) was above the reference line (1:1, annual wind speed), indicating the spring wind speed was higher than the annual scenario. The autumn wind speed was much lower, and summer and winter wind speeds were similar to the annual wind speed. This result indicates the seasonal variation in LCZ ventilation performance.
Nevertheless, LCZ ventilation performance sequences in four seasons were generally consistent with annual LCZ ventilation performance sequence, with the R2 of 0.97, 0.92, 0.94 and 0.90. However, the value of the spatial correlation coefficient did not equal to 1.0, indicating the change of LCZ ventilation performance sequence at specific LCZ types. In particular, the inconsistency between open spaces around specific zones (e.g., No.6, LCZ-2,E) and seasonal approaching wind direction is a critical cause, as the weather station may be in the frontal or backward areas according to wind direction alternation. Moreover, vegetation canopy varies with seasonal alternation, especially for zones with dense trees (No.7, LCZ-5), resulting in the seasonal change in wind speed.
4.3.3. Diurnal and Nocturnal LCZ Ventilation Performance and Sequence
Figure 5 and Figure 6 present the diurnal and nocturnal mean wind speed and LCZ ventilation performance sequence in four seasons, respectively (also refer to Tables S4 and S5). The fitted line of spring diurnal wind speed was above the reference line (1:1, annual wind speed), indicating the stronger spring wind environment in Shenyang. The winter diurnal wind was also stronger than annual scenario, the summer diurnal wind was similar to the annual scenario and the autumn diurnal wind was weaker than the annual scenario. This result indicates the seasonal variation in diurnal LCZ ventilation performance.
However, the results also indicate that diurnal LCZ ventilation performance sequences in four seasons (Figure 5) were generally consistent with the annual LCZ ventilation performance sequence, with the R2 of 0.95, 0.93, 0.96 and 0.94. This result further affirms the reliability of using the LCZ classification scheme to indicate diurnal local-scale urban ventilation performance. Nevertheless, there were some slight fluctuations as the spatial correlation coefficients did not equal to 1.0.
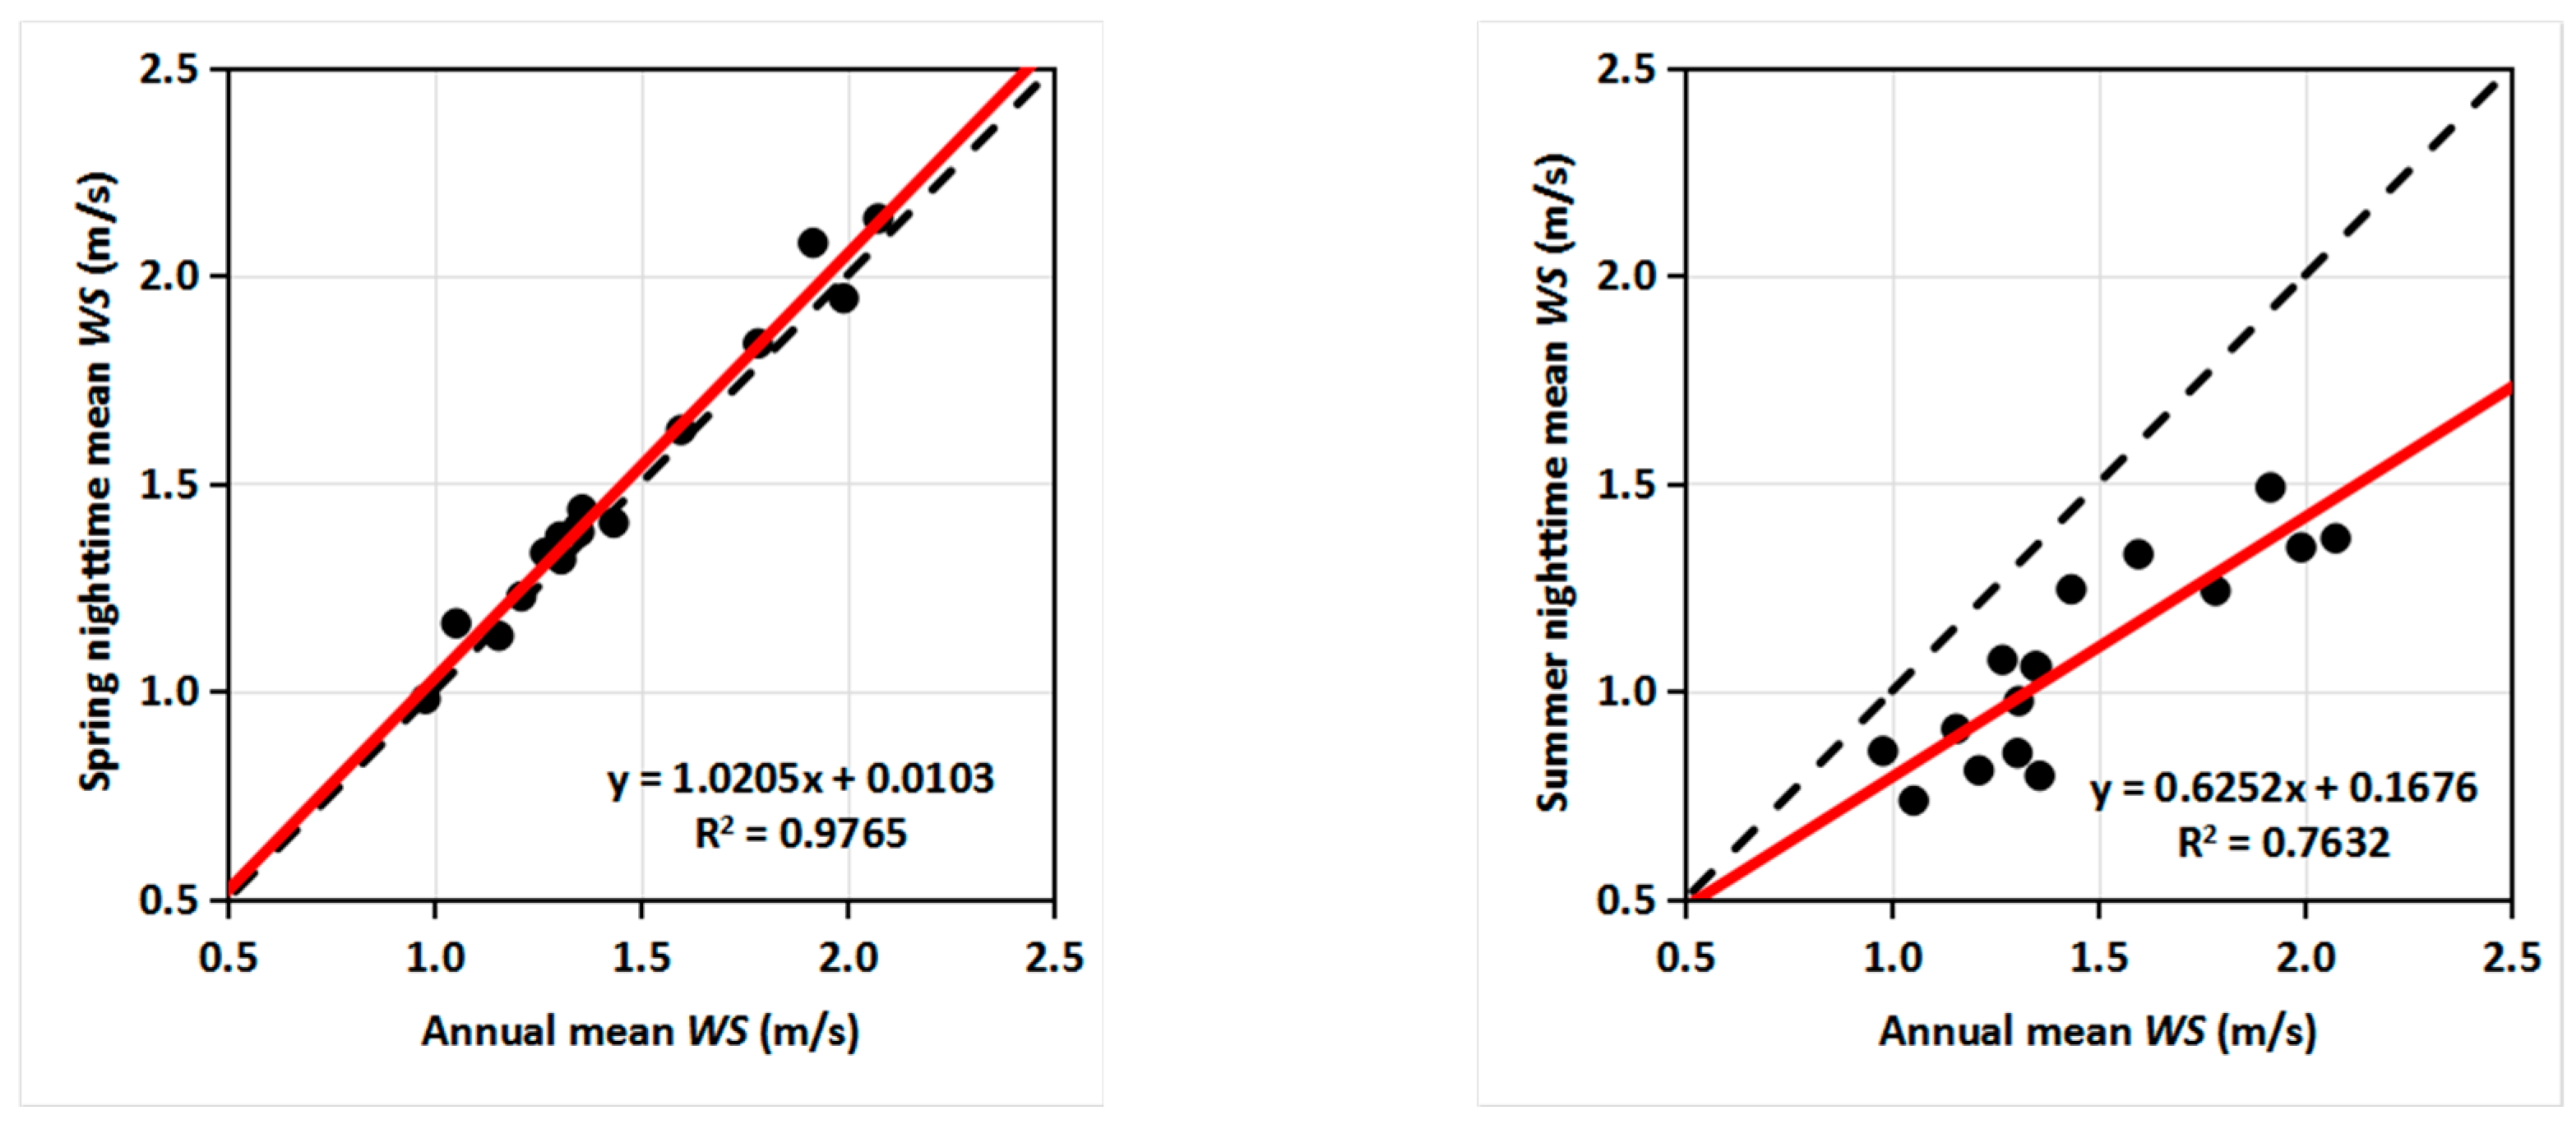
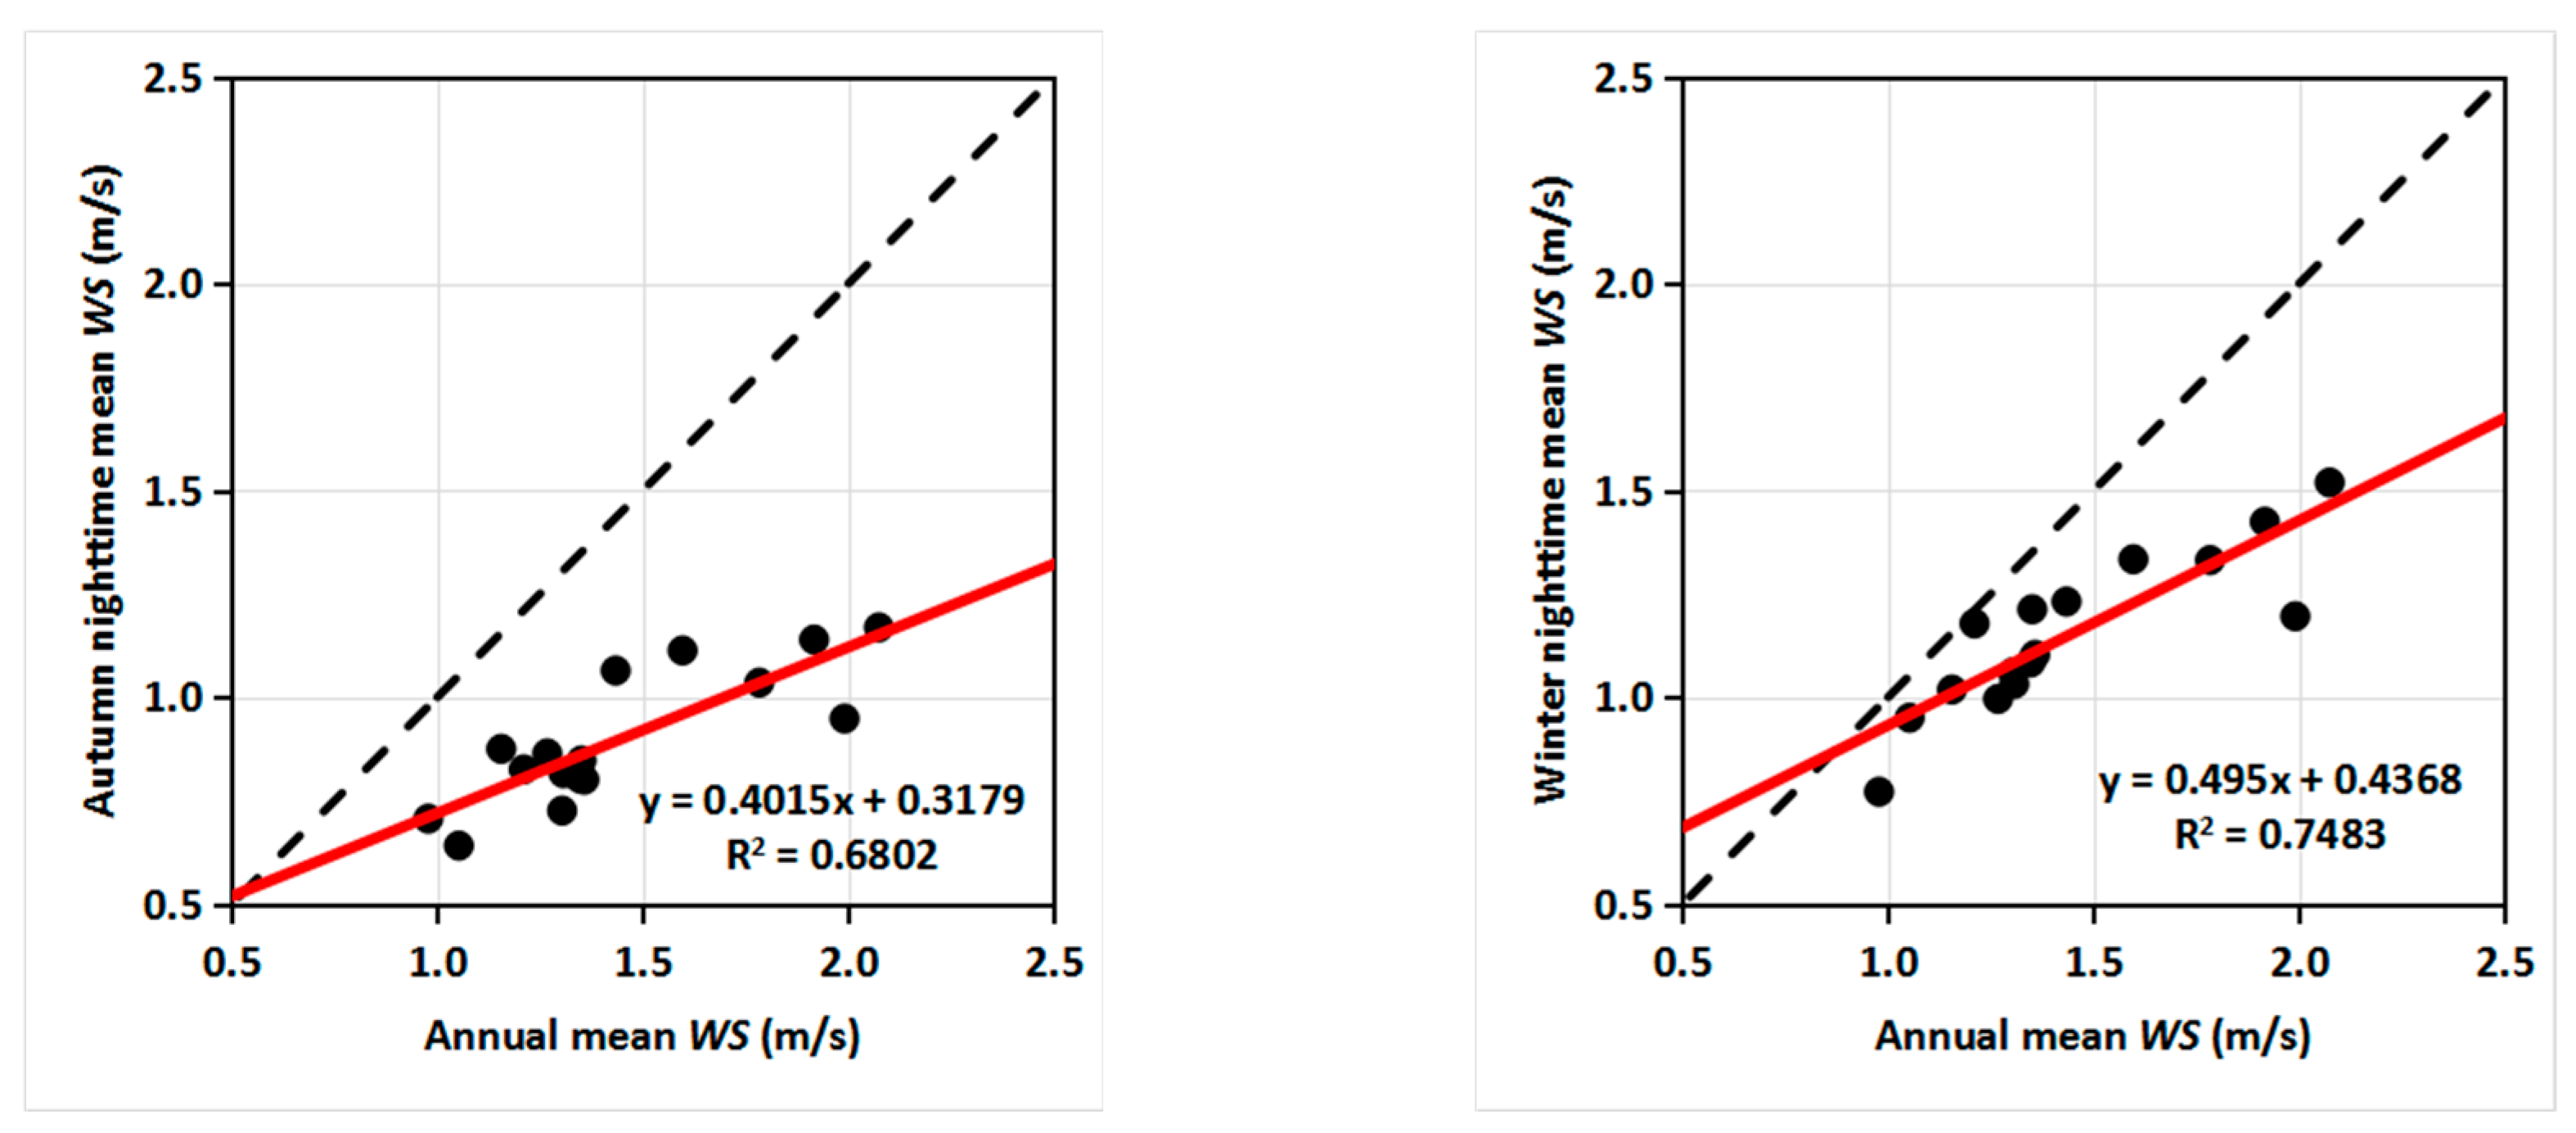
The fitted line of spring nocturnal wind speed roughly coincided with the reference line (1:1, annual wind speed), indicating the spring nocturnal wind was similar to the annual wind condition (Figure 6). However, the nocturnal wind speed in summer, autumn and winter was weaker than the annual wind condition in Shenyang. Moreover, the LCZ classification scheme could also indicate local-scale urban ventilation performance, especially in spring with the spatial correlation coefficient of 0.98. The capacity of LCZ classification scheme of indicating local-scale urban ventilation performance weakens, with the spatial correlation coefficient of 0.76, 0.68 and 0.75 in summer, autumn and winter, respectively.
4.3.4. LCZ Ventilation Performance and Sequence under Various Precipitation Conditions
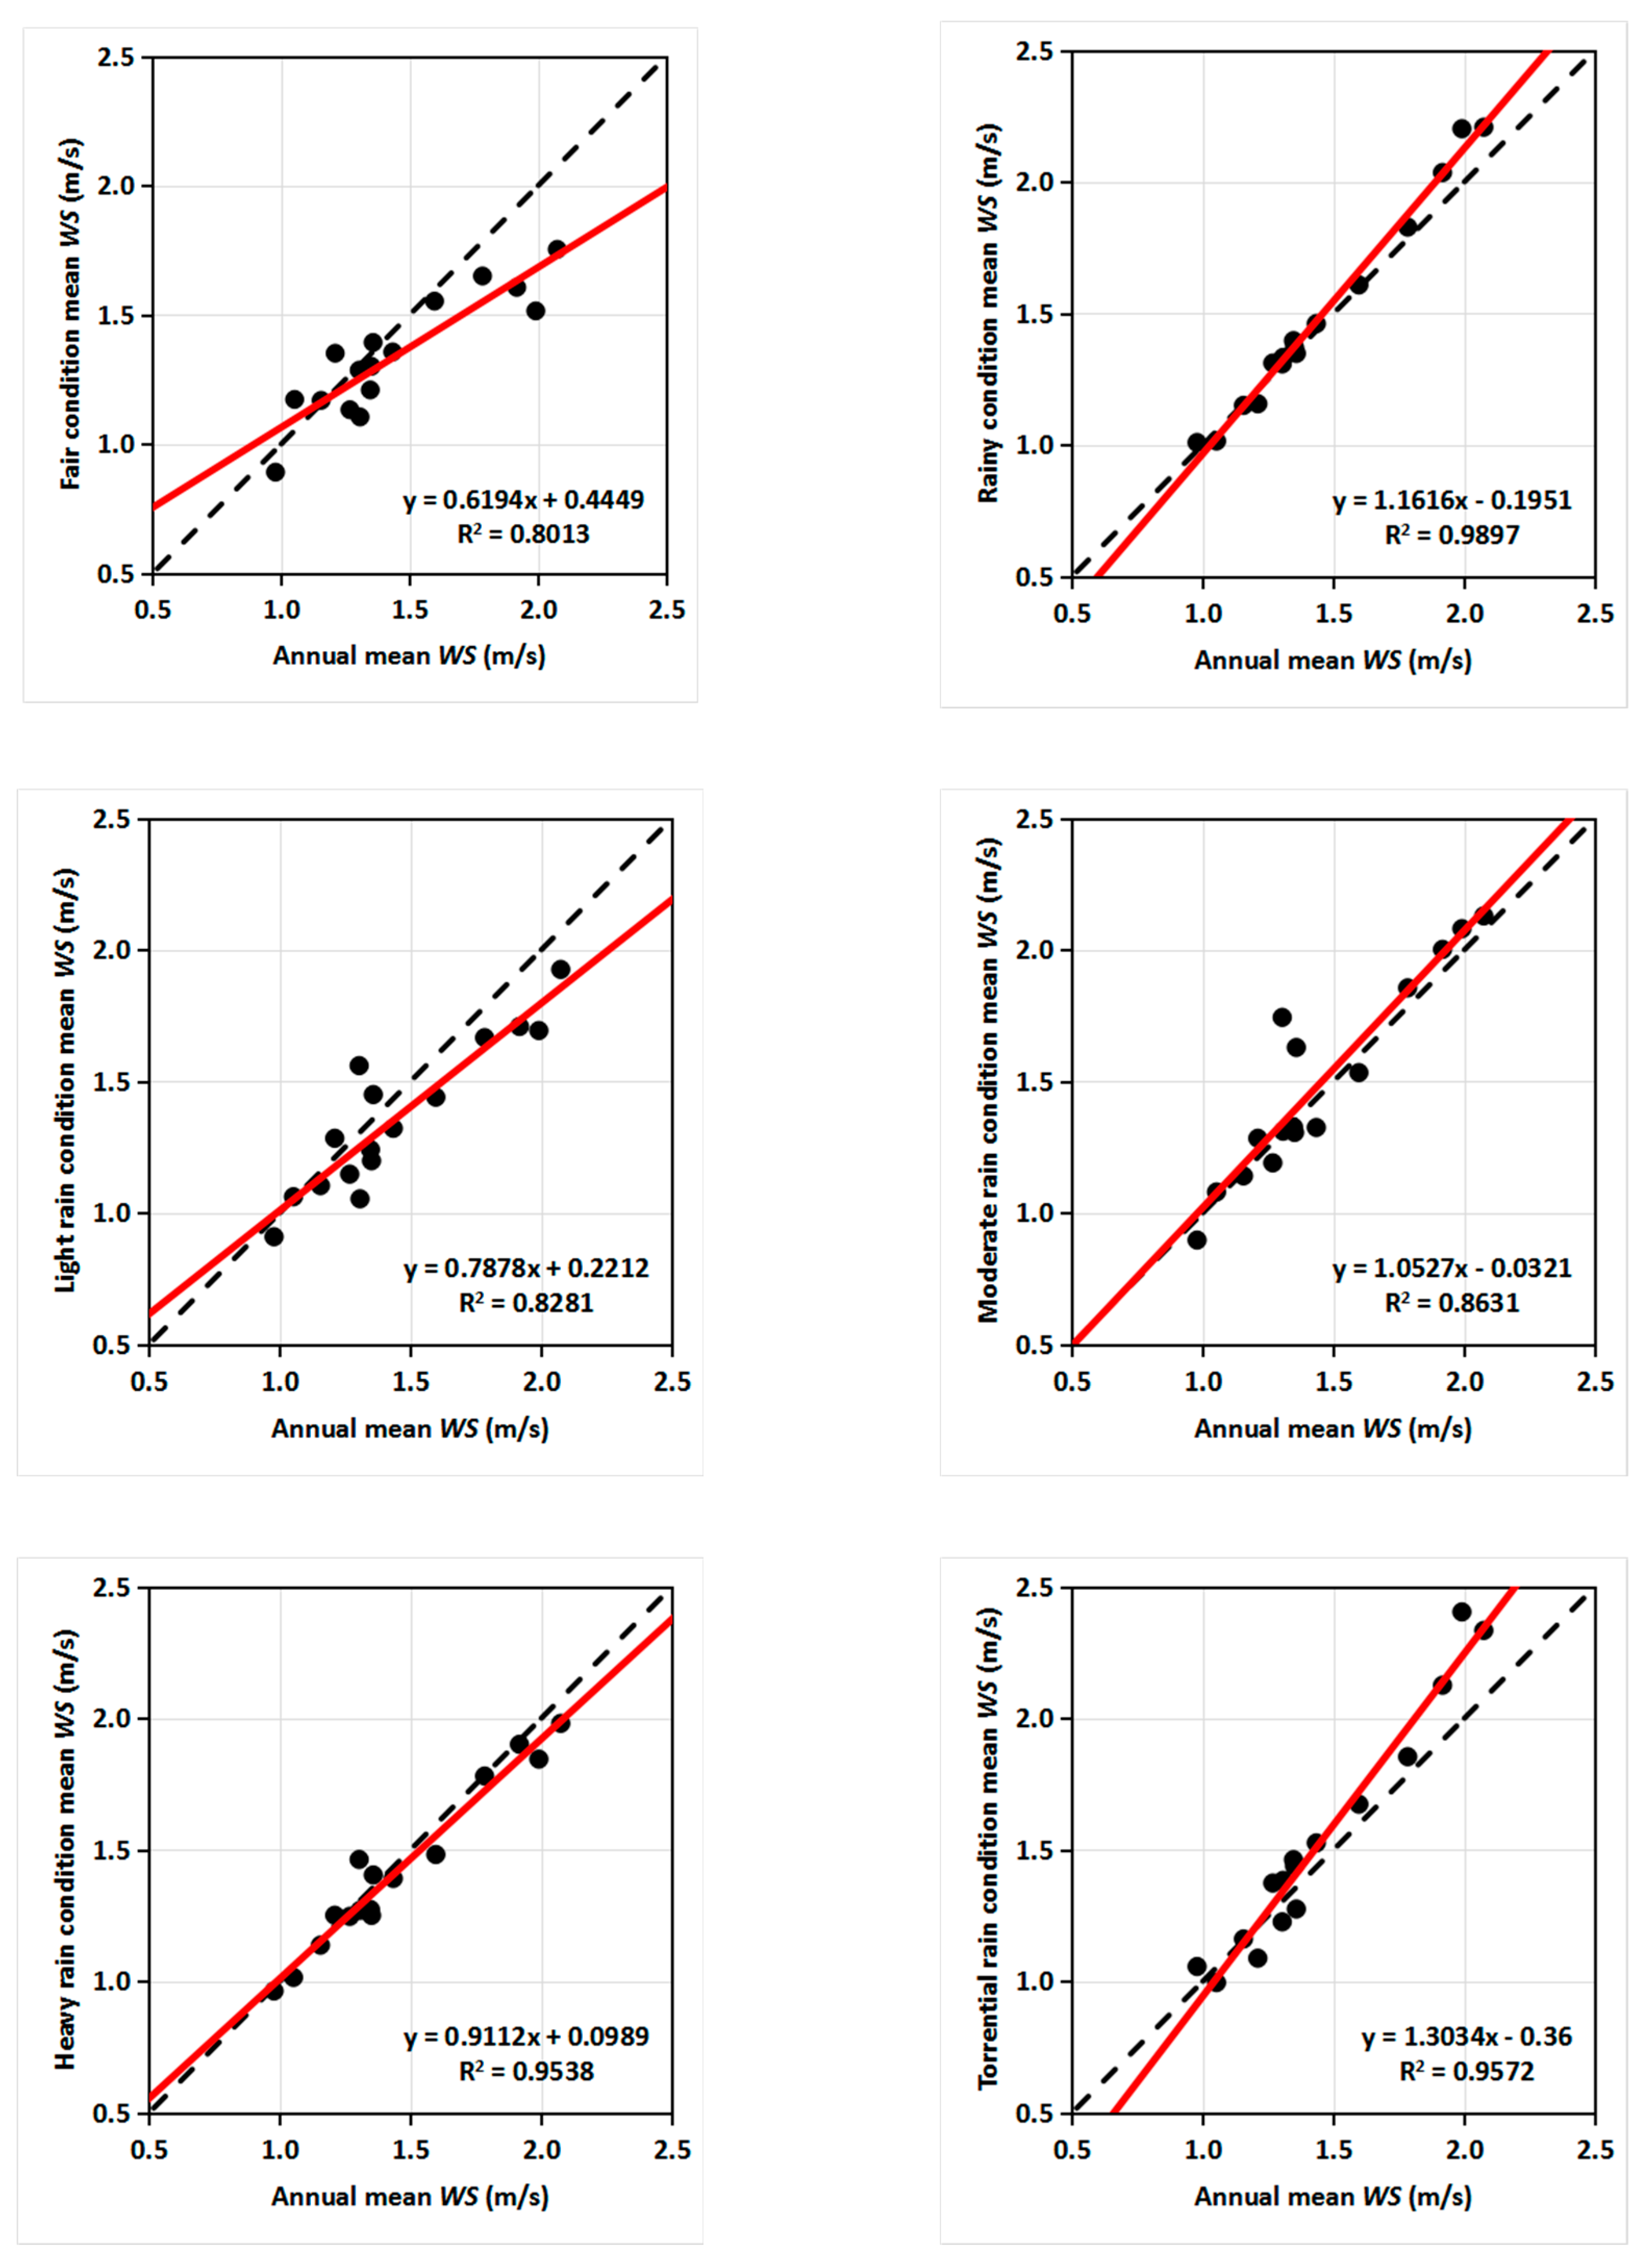
Figure 7 demonstrates mean wind speed and LCZ ventilation performance sequence under different precipitation conditions. First, the fitted line of wind speed under no precipitation condition was below the reference line (1:1, annual wind speed), indicating the wind under no precipitation condition was weaker. The wind under precipitation condition was stronger than the annual scenario. Moreover, LCZ classification scheme could also indicate local-scale urban ventilation performance, with the R2 of 0.99 and 0.80 under precipitation and no precipitation conditions, respectively. Moreover, under light, moderate, heavy and torrential rain conditions, mean wind speeds were generally similar to the annual wind speed, as fitted lines roughly coincided with the reference line (1:1, annual wind speed). Under these rain conditions, the LCZ classification scheme was also robust to indicate local-scale urban ventilation performance with the R2 of 0.83, 0.86, 0.95 and 0.96, respectively (Figure 7).
Overall, this section compared the ventilation performance of different local climate zones under the annual, seasonal, diurnal and nocturnal and different precipitation conditions. The annual mean wind speed consequence indicated that LCZ ventilation performance decreased following the order of open and sparse zone, open midrise, compact midrise, compact high-rise zones. The spatial correlation coefficients were calculated, where the coefficients generally did not equal to 1.0 because of the heterogeneity of real local climate zones. This result indicates that the LCZ ventilation performance varied with season, day and night and precipitation conditions. Nevertheless, the value of spatial correlation coefficients approached to 1.0, indicating the LCZ ventilation performance patterns under various scenarios were generally consistent with the annual LCZ ventilation performance pattern. Namely, LCZ ventilation performance could also indicate the decreasing trend from open and spare zones to compact midrise zones and then compact high-rise zones. Such results indicate the suitability of using the LCZ classification scheme to indicate local-scale urban ventilation performance.
Even though, the pattern of LCZ ventilation performance was not critically consistent with the precinct ventilation performance reported in [40,41,42], where the open midrise gridiron precinct ventilation zone had the best ventilation performance, followed by the open low-rise gridiron precinct ventilation zone and then the compact high-rise gridiron precinct ventilation zone. This might be due to the influence of the street structure or the influence of local fluctuations in the open midrise gridiron contexts [40]. Such results further indicate the necessity of analysing the impact of street structure on the local-scale ventilation performance, apart from the LCZ ventilation performance studies.
Moreover, in precinct ventilation performance studies [40,41,42], the ventilation performance was obtained through averaging wind speeds at 52 points, which provided a high-resolution wind distribution by catching all possible phenomena (e.g., corner effect, interference effect, blockage effect, wake effect) at different points. In comparison, in current LCZ ventilation performance study, one-point wind condition might be not representative enough to exhibit local-scale ventilation performance, as one-point method ignored all possible phenomena at other points. Therefore, it is essential to set more wind sensors to generate high-resolution wind distribution to further validate the suitability of LCZ classification scheme for local-scale ventilation performance indication.
5. Summary and Conclusions
This study analysed the local-scale urban ventilation performance in Shenyang, China through analysing the wind speed (e.g., mean wind speed, relative mean wind speed, spatial correlation coefficient) in 2018 at the 16 weather stations that were located in different local climate zones. Through the analysis, several key conclusions were obtained.
Shenyang weather station had an annual mean wind speed of 2.07 m/s, while the mean wind speed of Shenyang city was only 60% of the wind speed Shenyang weather station, about 1.44 m/s. Moreover, both mean wind speeds at Shenyang weather station and the 16 stations varied with seasons, day and night and precipitation conditions. The spring was the windiest season, where the mean wind speeds at Shenyang weather station and the 16 stations were 2.84 m/s and 1.85 m/s, respectively. However, autumn experienced the weakest wind condition, with the mean wind speeds at Shenyang weather station and the 16 stations of 1.63 m/s and 1.16 m/s, respectively. Moreover, the diurnal wind was much stronger than the nocturnal wind, across four seasons. The spring diurnal wind was the strongest, with the wind speeds of 3.56 m/s and 2.21 m/s at Shenyang weather station and the 16 stations, respectively. The autumn nocturnal wind was the weakest, with the wind speeds of 1.07 m/s and 0.90 m/s at Shenyang weather station and the 16 stations, respectively. In addition, the wind was under precipitation condition generally stronger than that under no precipitation condition. In particular, the wind under torrential rain condition was the strongest, with the mean wind speeds at Shenyang weather station and the 16 stations were 2.33 m/s and 1.52 m/s, respectively.
Wind speed at Shenyang weather station was consistently higher than that of Shenyang city (16 stations) across all scenarios this study presented (e.g., year, season, day and night, no precipitation and precipitation). This implies that the necessity of concerning refined and actual wind condition in cities and it is improper to only adopt wind recorded at the national meteorological station when conducting studies related to local-scale wind. An analysis of downtown ventilation performance based on RMWS of LCZ-1 and LCZ-2 stations indicated that the downtown ventilation performance was weaker than approaching wind background, with the annual RMWS value of 0.53. Downtown ventilation performance varied with seasons, day and night and precipitation. The downtown ventilation performance, according to the RMWS value, was much weaker, especially in the spring season and under diurnal scenarios. The downtown ventilation performance, in comparison, was much stronger in the winter season and under nocturnal scenarios. The spring diurnal RMWS was only 0.41, but the winter nocturnal RWMS reached 0.65. The downtown ventilation performance (0.65) under no precipitation conditions was better than that (0.49) under precipitation conditions. In addition, with an increase in rain level, downtown ventilation performance decreased.
LCZ ventilation performance was ranked according to mean wind speed. The results indicate that annual mean wind speed of each zone decreased gradually from the sparse and open low-rise zones to compact midrise zones. This finding affirms that the LCZ classification scheme can be adopted to indicate local-scale urban ventilation performance, although it was originally proposed to indicate surface temperature [14] and it did not consider the impact of street structure on the local-scale urban ventilation performance like precinct ventilation zone scheme [16]. Moreover, despite some changes in the order of the ventilation performance of specific zones, the spatial correlation coefficients under several scenarios (e.g., seasons, day and night, no precipitation and precipitation) ranged between 0.68 and 0.99, affirming the LCZ classification scheme was robust to indicate the local-scale urban ventilation performance.
Overall, this study offered an evidence-based analysis of local-scale urban ventilation performance in Shenyang, China. The study directly affirms that the LCZ classification scheme was effective in indicating local-scale urban ventilation performance, although it did not consider the street structures. This study also indicates actual ventilation performance in a city should be much weaker than the approaching wind information the national meteorological stations provide. Only using the wind information given by national meteorological stations to analyse ventilation performance in cities may overestimate the results.
Supplementary Materials
The following are available online at https://www.mdpi.com/2073-4433/11/8/776/s1, Table S1: The variables of different local climate zones in Shenyang, China; Table S2. Annual and Seasonal mean wind speed and standard deviations of 16 stations (m/s); Table S3. P-values of Mann-Whitney U-test of wind speeds between Station No.1 and other stations for a year and four seasons; Table S4. P-values of Mann-Whitney U-test of wind speeds between Station No.1 and other stations for daytime of four seasons. Table S5. P-values of Mann-Whitney U-test of wind speeds between Station No.1 and other stations for night-time of four seasons.
Author Contributions
Conceptualisation, B.-J.H. and L.S.; methodology, Z.Z., B.-J.H. and L.S.; software, Z.Z. and L.S.; validation, Z.Z. and L.S.; formal analysis, Z.Z., B.-J.H. and L.S.; investigation, Z.Z., L.S. and B.-J.H.; resources, Z.Z., L.S., H.W. and L.L; data curation, L.S.; writing—original draft preparation, Z.Z., B.-J.H. and L.S.; writing—review and editing, Z.Z., B.-J.H., L.S., H.W. and L.L.; project administration, H.W. and L.L.; supplement materials, Z.Z., L.S., L.L. and H.W. All authors have read and agreed to the published version of the manuscript.
Funding
This research was funded by Key Program of Science Foundation of Liaoning Meteorological Office (grant number: 202010, 201904), Basic Scientific & Research Business Expenses for Scientific and Scientific Institutions for Central Public Welfare (Grant number: 2018SYIAEMS2). Program of Natural Science Foundation of Liaoning Province (2020-MS-350). Scientific research project of Shenyang Institute of Atmospheric Environment, China Meteorological Administration (Grant No.2020SYIAEJY12).
Conflicts of Interest
The authors declare no conflict of interest.
References
- IPCC. Summary for Policymakers of IPCC Special Report on Global Warming of 1.5 °C Approved by Governments. Intergovernmental Panel on Climate Change. Available online: https://www.ipcc.ch/2018/10/08/summary-for-policymakers-of-ipcc-special-report-on-global-warming-of-1-5c-approved-by-governments/ (accessed on 8 October 2018).
- Zhang, G.; He, B.-J.; Dewancker, B.J. The maintenance of prefabricated green roofs for preserving cooling performance: A field measurement in the subtropical city of Hangzhou, China. Sustain. Cities Soc. 2020, 61, 102314. [Google Scholar] [CrossRef]
- Kumar, P.; Saroj, D.P. Water–energy–pollution nexus for growing cities. Urban Clim. 2014, 10, 846–853. [Google Scholar] [CrossRef]
- Rosenzweig, C.; Solecki, W.D.; Romero-Lankao, P.; Mehrotra, S.; Dhakal, S.; Ibrahim, S.A. Climate Change and Cities: Second Assessment Report of the Urban Climate Change Research Network; Cambridge University Press: Cambridge, UK, 2018; pp. 27–60. [Google Scholar]
- Hammond, M.J.; Chen, A.S.; Djordjević, S.; Butler, D.; Mark, O. Urban flood impact assessment: A state-of-the-art review. Urban Water J. 2015, 12, 14–29. [Google Scholar] [CrossRef] [Green Version]
- He, B.-J.; Zhu, J.; Zhao, D.-X.; Gou, Z.-H.; Qi, J.-D.; Wang, J. Co-benefits approach: Opportunities for implementing sponge city and urban heat island mitigation. Land Use Policy 2019, 86, 147–157. [Google Scholar] [CrossRef]
- Anderson, G.B.; Bell, M.L. Heat waves in the United States: Mortality risk during heat waves and effect modification by heat wave characteristics in 43 US communities. Environ. Health Perspect. 2011, 119, 210–218. [Google Scholar] [CrossRef] [Green Version]
- United Nations Department. World Urbanization Prospects: The 2014 Revision; United Nations Department of Economics and Social Affairs, Population Division: New York, NY, USA, 2015.
- Raven, J.; Stone, B.; Mills, G.; Towers, J.; Katzschner, L.; Leone, M.; Gaborit, P.; Georgescu, M.; Hariri, M. Urban planning and urban design. In Climate Change and Cities: Second Assessment Report of the Urban Climate Change Research Network; Rosenzweig, C., Solecki, W., Romero-Lankao, P., Mehrotra, S., Dhakal, S., Ali Ibrahim, S., Eds.; Cambridge University Press: New York, NY, USA, 2018; pp. 139–172. [Google Scholar]
- Alves, A.; Gersonius, B.; Kapelan, Z.; Vojinovic, Z.; Sanchez, A. Assessing the Co-Benefits of green-blue-grey infrastructure for sustainable urban flood risk management. J. Environ. Manag. 2019, 239, 244–254. [Google Scholar] [CrossRef]
- Xu, Y.; Ren, C.; Ma, P.; Ho, J.; Wang, W.; Lau, K.K.L.; Lin, H.; Ng, E. Urban morphology detection and computation for urban climate research. Landsc. Urban Plan. 2017, 167, 212–224. [Google Scholar] [CrossRef]
- Yang, J.; Wang, Y.; Xiao, X.; Jin, C.; Xia, J.C.; Li, X. Spatial differentiation of urban wind and thermal environment in different grid sizes. Urban Clim. 2019, 28, 100458. [Google Scholar] [CrossRef]
- Oke, T.R.; Mills, G.; Christen, A.; Voogt, J.A. Urban Climates; Cambridge University Press: Cambridge, UK, 2017. [Google Scholar]
- Stewart, I.D.; Oke, T.R. Local climate zones for urban temperature studies. Bull. Am. Meteorol. Soc. 2012, 93, 1879–1900. [Google Scholar] [CrossRef]
- Adolphe, L. A simplified model of urban morphology: Application to an analysis of the environmental performance of cities. Environ. Plan. B Plan. Des. 2001, 28, 183–200. [Google Scholar] [CrossRef]
- He, B.-J.; Ding, L.; Prasad, D. Enhancing urban ventilation performance through the development of precinct ventilation zones: A case study based on the Greater Sydney. Aust. Sustain. Cities Soc. 2019, 47, 101472. [Google Scholar] [CrossRef]
- He, B.J.; Zhao, Z.Q.; Shen, L.D.; Wang, H.B.; Li, L.G. An approach to examining performances of cool/hot sources in mitigating/enhancing land surface temperature under different temperature backgrounds based on landsat 8 image. Sustain. Cities Soc. 2019, 44, 416–427. [Google Scholar] [CrossRef]
- Azhdari, A.; Soltani, A.; Alidadi, M. Urban morphology and landscape structure effect on land surface temperature: Evidence from Shiraz, a semi-arid city. Sustain. Cities Soc. 2018, 41, 853–864. [Google Scholar] [CrossRef]
- Ng, E.; Yuan, C.; Chen, L.; Ren, C.; Fung, J.C. Improving the wind environment in high-density cities by understanding urban morphology and surface roughness: A study in Hong Kong. Landsc. Urban Plan. 2011, 101, 59–74. [Google Scholar] [CrossRef]
- Peng, Y.; Gao, Z.; Buccolieri, R.; Ding, W. An Investigation of the Quantitative Correlation between Urban Morphology Parameters and Outdoor Ventilation Efficiency Indices. Atmosphere 2019, 10. [Google Scholar] [CrossRef] [Green Version]
- Yang, J.; Jin, S.; Xiao, X.; Jin, C.; Xia, J.C.; Li, X.; Wang, S. Local climate zone ventilation and urban land surface temperatures: Towards a performance-based and wind-sensitive planning proposal in megacities. Sustain. Cities Soc. 2019, 47, 101487. [Google Scholar] [CrossRef]
- He, B.-J. Potentials of meteorological characteristics and synoptic conditions to mitigate urban heat island effects. Urban Clim. 2018, 24, 26–33. [Google Scholar] [CrossRef]
- Zhao, D.-X.; He, B.-J. Effects of architectural shapes on surface wind pressure distribution: Case studies of oval-shaped tall buildings. J. Build. Eng. 2017, 12, 219–228. [Google Scholar] [CrossRef]
- Meng, F.-Q.; He, B.-J.; Zhu, J.; Zhao, D.-X.; Darko, A.; Zhao, Z.-Q. Sensitivity analysis of wind pressure coefficients on CAARC standard tall buildings in CFD simulations. J. Build. Eng. 2018, 16, 146–158. [Google Scholar] [CrossRef]
- Oke, T.R. Street design and urban canopy layer climate. Energy Build. 1988, 11, 103–113. [Google Scholar] [CrossRef]
- Ng, E. Designing for urban ventilation. In Designing High Density Cities-For Social and Environmental Sustainability; Earthscan Publications Ltd.: London, UK, 2010. [Google Scholar]
- Abd Razak, A.; Hagishima, A.; Ikegaya, N.; Tanimoto, J. Analysis of airflow over building arrays for assessment of urban wind environment. Build. Environ. 2013, 59, 56–65. [Google Scholar] [CrossRef]
- Xu, X.; Luo, F.; Wang, W.; Hong, T.; Fu, X. Performance-Based Evaluation of Courtyard Design in China’s Cold-Winter Hot-Summer Climate Regions. Sustainability 2018, 10. [Google Scholar] [CrossRef] [Green Version]
- Ying, X.; Wang, Y.; Li, W.; Liu, Z.; Ding, G. Group Layout Pattern and Outdoor Wind Environment of Enclosed Office Buildings in Hangzhou. Energies 2020, 13. [Google Scholar] [CrossRef] [Green Version]
- Kubota, T.; Miura, M.; Tominaga, Y.; Mochida, A. Wind tunnel tests on the relationship between building density and pedestrian-level wind velocity: Development of guidelines for realizing acceptable wind environment in residential neighborhoods. Build. Environ. 2008, 43, 1699–1708. [Google Scholar] [CrossRef]
- DeKay, M.; Brown, G. Sun, Wind, and Light: Architectural Design Strategies; John Wiley & Sons: Hoboken, NJ, USA, 2013. [Google Scholar]
- Wong, M.S.; Nichol, J.E.; To, P.H.; Wang, J. A simple method for designation of urban ventilation corridors and its application to urban heat island analysis. Build. Environ. 2010, 45, 1880–1889. [Google Scholar] [CrossRef]
- Qiao, Z.; Xu, X.; Wu, F.; Luo, W.; Wang, F.; Liu, L.; Sun, Z. Urban ventilation network model: A case study of the core zone of capital function in Beijing metropolitan area. J. Clean. Prod. 2017, 168, 526–535. [Google Scholar] [CrossRef]
- Coutts, A.; Harris, R. Urban Heat Island Report: ’A Multi-Scale Assessment of Urban Heating in Melbourne during an Extreme Heat Event and Policy Approaches for Adaptation. Published by VCCCAR, Melbourne, Australia, 2013. Available online: https://watersensitivecities.org.au/content/vcccar-report-multi-scale-assessment-urban-heating-melbourne-extreme-heat-event-policy-approaches-adaptation/ (accessed on 1 November 2012).
- Blocken, B.; Janssen, W.D.; van Hooff, T. CFD simulation for pedestrian wind comfort and wind safety in urban areas: General decision framework and case study for the Eindhoven University campus. Environ. Model. Softw. 2012, 30, 15–34. [Google Scholar] [CrossRef]
- Antoniou, N.; Montazeri, H.; Wigo, H.; Neophytou, M.K.A.; Blocken, B.; Sandberg, M. CFD and wind-tunnel analysis of outdoor ventilation in a real compact heterogeneous urban area: Evaluation using “air delay”. Build. Environ. 2017, 126, 355–372. [Google Scholar] [CrossRef]
- Priyadarsini, R.; Hien, W.N.; David, C.K.W. Microclimatic modeling of the urban thermal environment of Singapore to mitigate urban heat island. Sol. Energy 2008, 82, 727–745. [Google Scholar] [CrossRef]
- Rajagopalan, P.; Lim, K.C.; Jamei, E. Urban heat island and wind flow characteristics of a tropical city. Sol. Energy 2014, 107, 159–170. [Google Scholar] [CrossRef]
- Edussuriya, P.; Chan, A.; Ye, A. Urban morphology and air quality in dense residential environments in Hong Kong. Part I: District-level analysis. Atmos. Environ. 2011, 45, 4789–4803. [Google Scholar] [CrossRef]
- He, B.-J.; Ding, L.; Prasad, D. Relationships among local-scale urban morphology, urban ventilation, urban heat island and outdoor thermal comfort under sea breeze influence. Sustain. Cities Soc. 2020, 60, 102289. [Google Scholar] [CrossRef]
- He, B.-J.; Ding, L.; Prasad, D. Wind-sensitive urban planning and design: Precinct ventilation performance and its potential for local warming mitigation in an open midrise gridiron precinct. J. Build. Eng. 2020, 29, 101145. [Google Scholar] [CrossRef]
- He, B.-J.; Ding, L.; Prasad, D. Urban ventilation and its potential for local warming mitigation: A field experiment in an open low-rise gridiron precinct. Sustain. Cities Soc. 2020, 55, 102028. [Google Scholar] [CrossRef]
- Zhou, X.; Okaze, T.; Ren, C.; Cai, M.; Ishida, Y.; Watanabe, H.; Mochida, A. Evaluation of urban heat islands using local climate zones and the influence of sea-land breeze. Sustain. Cities Soc. 2020, 55, 102060. [Google Scholar] [CrossRef]
- Zhao, Z.-Q.; He, B.-J.; Li, L.-G.; Wang, H.-B.; Darko, A. Profile and concentric zonal analysis of relationships between land use/land cover and land surface temperature: Case study of Shenyang, China. Energy Build. 2017, 155, 282–295. [Google Scholar] [CrossRef]
- Xu, Z.; Yu, D.; Jing, L.; Xu, X. Air pollution and daily mortality in Shenyang, China. Arch. Environ. Health Int. J. 2000, 55, 115–120. [Google Scholar] [CrossRef]
- Ma, Y.; Chen, R.; Pan, G.; Xu, X.; Song, W.; Chen, B.; Kan, H. Fine particulate air pollution and daily mortality in Shenyang, China. Sci. Total. Environ. 2011, 409, 2473–2477. [Google Scholar] [CrossRef]
- Bryant, E.A. Local climate processes in the Illawarra. Wollongong Stud. Geogr. 1982, 11, 1–4. [Google Scholar]
- He, B.-J.; Ding, L.; Prasad, D. Outdoor thermal environment of an open space under sea breeze: A mobile experience in a coastal city of Sydney, Australia. Urban Clim. 2020, 31, 100567. [Google Scholar] [CrossRef]
- Yu, M.; Miao, S.; Li, Q. Synoptic analysis and urban signatures of a heavy rainfall on 7 August 2015 in Beijing. J. Geophys. Res. Atmos. 2017, 122, 65–78. [Google Scholar] [CrossRef]
- Yu, M.; Miao, S.; Zhang, H. Uncertainties in the impact of urbanization on heavy rainfall: Case study of a rainfall event in Beijing on 7 August 2015. J. Geophys. Res. Atmos. 2018, 123, 6005–6021. [Google Scholar] [CrossRef]
Figure 1.
Location of Liaoning province, Shenyang city and the Bohai Bay.

Figure 2.
Local climate zone (LCZ) types in Shenyang and the location of 16 case study area.

Figure 3.
Boxplot and mean wind speed (blue point-fold line) of the 16 stations.

Figure 4.
Seasonal mean wind speed at the 16 stations and local climate zone ventilation performance sequences.
Figure 4.
Seasonal mean wind speed at the 16 stations and local climate zone ventilation performance sequences.

Figure 5.
Diurnal mean wind speed at the 16 stations and the local climate zone ventilation performance sequences in four seasons.
Figure 5.
Diurnal mean wind speed at the 16 stations and the local climate zone ventilation performance sequences in four seasons.

Figure 6.
Nocturnal mean wind speed at the 16 stations and the local climate zone ventilation performance sequences in four seasons.
Figure 6.
Nocturnal mean wind speed at the 16 stations and the local climate zone ventilation performance sequences in four seasons.


Figure 7.
Mean wind speed at the 16 stations and local climate zone ventilation performance sequences under different precipitation conditions.
Figure 7.
Mean wind speed at the 16 stations and local climate zone ventilation performance sequences under different precipitation conditions.


Table 1.
A description of the LCZ types and images of case study areas.
| No. | LCZ (image) | Description | No. | LCZ (image) | Description |
|---|---|---|---|---|---|
| 1 | LCZ-9 Sparsely built  | A few low-rise (1–3 stories) buildings; Mixed species of deciduous trees, shrubs and grasslands; Permeable but with a 30-m asphalt-paved surface. | 2 | LCZ-5 Open midrise  | Large-scale stadium buildings and open midrise (3–9 stories) buildings; A few deciduous trees and shrubs along the street; Impervious surface. |
| 3 | LCZ-6 Open low-rise  | Open low-rise buildings (1–3 stories); Deciduous trees; Permeable agricultural surface. | 4 | LCZ-5 Open midrise  | Open midrise buildings (3–9 stories) and a large size stadium; Scattered grassland, low shrubs and deciduous trees; Impervious pavement. |
| 5 | LCZ-4, G Open high-rise, Water  | Open high-rise buildings (>9 stories); Scattered low shrubs and deciduous trees; A river; Impervious pavement. | 6 | LCZ-2, E Compact midrise, Bare rock or paved  | Dense midrise buildings (3–9 stories); Scattered low shrubs and deciduous trees; Impervious pavement. |
| 7 | LCZ-5 Open midrise  | Large stadium and open midrise building (3–9 stories); A few deciduous trees, low shrubs and open grassland; Impervious pavement. | 8 | LCZ-5 Open midrise  | Open midrise buildings (3–9 stories); Scattered low shrubs and deciduous trees; Impervious pavement. |
| 9 | LCZ-2, G Compact midrise Water  | Dense midrise buildings (3–9 stories); Scattered low shrubs and deciduous trees; Impervious pavement; A river with dense vegetation on the riverbank. | 10 | LCZ-4 Open high-rise  | Open high-rise buildings (>9 stories); Scattered low shrubs and deciduous trees; Impervious pavement. |
| 11 | LCZ-2 Compact midrise  | Dense midrise buildings (3–9 stories); Scattered low shrubs and deciduous trees; Impervious pavement. | 12 | LCZ-4 Open high-rise  | Open high-rise buildings (>9 stories); Scattered low shrubs and deciduous trees; Impervious pavement. |
| 13 | LCZ-2 Compact midrise  | Dense midrise buildings (3–9 stories) and a high-rise building (>9 stories); Scattered low shrubs and deciduous trees; Impervious pavement. | 14 | LCZ-2 Compact midrise  | Dense midrise buildings (3–9 stories); Scattered low shrubs and deciduous trees; Impervious pavement. |
| 15 | LCZ-1 Compact high-rise  | Dense high-rise buildings (>9 stories); Scattered low shrubs and deciduous trees; Impervious pavement. | 16 | LCZ-1 Compact high-rise  | Dense high-rise buildings (>9 stories); Scattered low shrubs and deciduous trees; Impervious pavement. |
Table 2.
Hours of light rain, moderate rain, heavy rain and torrential rain in 2018 at each station.
Table 2.
Hours of light rain, moderate rain, heavy rain and torrential rain in 2018 at each station.
| Local Climate Zone | Light Rain | Moderate Rain | Heavy Rain | Torrential Rain | ||
|---|---|---|---|---|---|---|
| Class | Name | |||||
| No.1 | LCZ-9 | Sparsely built | 220 | 54 | 4 | 2 |
| No.2 | LCZ-5 | Open midrise | 157 | 43 | 2 | 5 |
| No.3 | LCZ-6 | Open low-rise | 107 | 44 | 4 | 2 |
| No.4 | LCZ-5 | Open midrise | 192 | 37 | 6 | 2 |
| No.5 | LCZ-4, G | Open high-rise, Water | 202 | 43 | 10 | 4 |
| No.6 | LCZ-2, E | Compact midrise, Bare rock or paved | 118 | 32 | 2 | 1 |
| No.7 | LCZ-5 | Open midrise | 97 | 13 | 5 | 2 |
| No.8 | LCZ-5 | Open midrise | 158 | 31 | 8 | 5 |
| No.9 | LCZ-2, G | Compact midrise, Water | 96 | 26 | 4 | 6 |
| No.10 | LCZ-4 | Open high-rise | 198 | 51 | 7 | 2 |
| No.11 | LCZ-2 | Compact midrise | 114 | 24 | 6 | 4 |
| No.12 | LCZ-4 | Open midrise | 190 | 30 | 4 | 1 |
| No.13 | LCZ-2 | Compact midrise | 203 | 40 | 8 | 5 |
| No.14 | LCZ-2 | Compact midrise | 188 | 47 | 7 | 8 |
| No.15 | LCZ-1 | Compact high-rise | 171 | 44 | 9 | 5 |
| No.16 | LCZ-1 | Compact high-rise | 179 | 42 | 11 | 5 |
Table 3.
Annual and seasonal mean wind speed at Shenyang weather station and the 16 stations with standard deviations (2018).
Table 3.
Annual and seasonal mean wind speed at Shenyang weather station and the 16 stations with standard deviations (2018).
| Season | Mean Wind Speed (m/s) | |
|---|---|---|
| Shenyang Weather Station | Shenyang City (16 Stations) | |
| Spring | 2.84 ± 1.78 | 1.85 ± 0.51 |
| Summer | 1.94 ± 1.26 | 1.36 ± 0.36 |
| Autumn | 1.63 ± 1.20 | 1.16 ± 0.25 |
| Winter | 1.87 ± 1.25 | 1.37 ± 0.26 |
| Annual | 2.07 ± 1.47 | 1.44 ± 0.33 |
Table 4.
Diurnal and nocturnal mean wind speed at Shenyang weather station and the 16 stations (2018).
Table 4.
Diurnal and nocturnal mean wind speed at Shenyang weather station and the 16 stations (2018).
| Time | Seasons | Mean Wind Speed (m/s) | |
|---|---|---|---|
| Shenyang Weather Station | Shenyang City (16 Stations) | ||
| Diurnal | Spring | 3.56 ± 1.75 | 2.21 ± 0.69 |
| Summer | 2.35 ± 1.30 | 1.56 ± 0.46 | |
| Autumn | 2.18 ± 1.22 | 1.41 ± 0.37 | |
| Winter | 2.36 ± 1.52 | 1.66 ± 0.37 | |
| Nocturnal | Spring | 2.14 ± 1.38 | 1.48 ± 0.34 |
| Summer | 1.37 ± 0.87 | 1.07 ± 0.24 | |
| Autumn | 1.07 ± 0.86 | 0.90 ± 0.17 | |
| Winter | 1.52 ± 1.14 | 1.15 ± 0.19 | |
Table 5.
Mean wind speed at Shenyang weather station and the 16 stations with standard deviations under different precipitation conditions (2018).
Table 5.
Mean wind speed at Shenyang weather station and the 16 stations with standard deviations under different precipitation conditions (2018).
| Precipitation Conditions | Mean Wind Speed (m/s) | |
|---|---|---|
| Shenyang Weather Station | Shenyang City (16 Stations) | |
| No precipitation | 1.75 ± 1.47 | 1.34 ± 0.23 |
| Precipitation | 2.21 ± 1.15 | 1.48 ± 0.39 |
| Light | 1.92 ± 1.18 | 1.36 ± 0.29 |
| Moderate | 2.13 ± 1.03 | 1.49 ± 0.38 |
| Heavy | 1.98 ± 0.87 | 1.42 ± 0.31 |
| Torrential | 2.33 ± 0.99 | 1.52 ± 0.44 |
Table 6.
Variation in downtown ventilation performance (RMWS: relative mean wind speed) in Shenyang in 2018.
Table 6.
Variation in downtown ventilation performance (RMWS: relative mean wind speed) in Shenyang in 2018.
| Annual/Seasonal | RMWS | Day and Night | RMWS | Precipitation | RMWS |
|---|---|---|---|---|---|
| Year | 0.53 | Day (Spring) | 0.41 | No precipitation | 0.65 |
| Spring | 0.47 | Day (Summer) | 0.47 | Precipitation | 0.49 |
| Summer | 0.51 | Day (Autumn) | 0.47 | Light rain | 0.57 |
| Autumn | 0.57 | Day (Winter) | 0.56 | Moderate rain | 0.52 |
| Winter | 0.60 | Night (Spring) | 0.53 | Heavy rain | 0.55 |
| Night (Summer) | 0.61 | Torrential rain | 0.46 | ||
| Night (Autumn) | 0.65 | ||||
| Night (Winter) | 0.65 |
© 2020 by the authors. Licensee MDPI, Basel, Switzerland. This article is an open access article distributed under the terms and conditions of the Creative Commons Attribution (CC BY) license (http://creativecommons.org/licenses/by/4.0/).
Share and Cite
MDPI and ACS Style
Zhao, Z.; Shen, L.; Li, L.; Wang, H.; He, B.-J. Local Climate Zone Classification Scheme Can Also Indicate Local-Scale Urban Ventilation Performance: An Evidence-Based Study. Atmosphere 2020, 11, 776. https://doi.org/10.3390/atmos11080776
AMA Style
Zhao Z, Shen L, Li L, Wang H, He B-J. Local Climate Zone Classification Scheme Can Also Indicate Local-Scale Urban Ventilation Performance: An Evidence-Based Study. Atmosphere. 2020; 11(8):776. https://doi.org/10.3390/atmos11080776
Chicago/Turabian StyleZhao, Ziqi, Lidu Shen, Liguang Li, Hongbo Wang, and Bao-Jie He. 2020. "Local Climate Zone Classification Scheme Can Also Indicate Local-Scale Urban Ventilation Performance: An Evidence-Based Study" Atmosphere 11, no. 8: 776. https://doi.org/10.3390/atmos11080776
Note that from the first issue of 2016, this journal uses article numbers instead of page numbers. See further details here.