
Abstract
Feature selection becomes prominent, especially in the data sets with many variables and features. It will eliminate unimportant variables and improve the accuracy as well as the performance of classification. Random Forest has emerged as a quite useful algorithm that can handle the feature selection issue even with a higher number of variables. In this paper, we use three popular datasets with a higher number of variables (Bank Marketing, Car Evaluation Database, Human Activity Recognition Using Smartphones) to conduct the experiment. There are four main reasons why feature selection is essential. First, to simplify the model by reducing the number of parameters, next to decrease the training time, to reduce overfilling by enhancing generalization, and to avoid the curse of dimensionality. Besides, we evaluate and compare each accuracy and performance of the classification model, such as Random Forest (RF), Support Vector Machines (SVM), K-Nearest Neighbors (KNN), and Linear Discriminant Analysis (LDA). The highest accuracy of the model is the best classifier. Practically, this paper adopts Random Forest to select the important feature in classification. Our experiments clearly show the comparative study of the RF algorithm from different perspectives. Furthermore, we compare the result of the dataset with and without essential features selection by RF methods varImp(), Boruta, and Recursive Feature Elimination (RFE) to get the best percentage accuracy and kappa. Experimental results demonstrate that Random Forest achieves a better performance in all experiment groups.
Introduction
In machine learning problems, high dimensional data, especially in terms of many features, is increasingly these days [1]. Many researchers focus on the experiment to solve these problems. Besides, to extract important features from these high dimensional of variables and data. The statistical techniques were used to minimize noise and redundant data. Nevertheless, we do not use all the features to train a model. We may improve our model with the features correlated and non-redundant, so feature selection plays an important role.
Moreover, it not only supports in training our model faster but also lowers the complexity of the model, makes it easier to understand and improves the metric performance in accuracy, precision, or recall. There are four important reasons why feature selection is essential. First, spare the model to reduce the number of parameters. Next to decrease the training time, to reduce overfilling by enhancing generalization, and to avoid the curse of dimensionality. In the field of data processing and analysis, the dataset may be large of variables or attributes which determine the applicability and usability of the data [2]. Also, the challenge for classification is to pay attention to balance and imbalance data [3]. Another motivation is to get the best model with high predictions and small errors [4, 5].
The reduction of the original feature that set to a smaller one is preserving the relevant information while discarding the redundant one, and it is referred to feature selection (FS) [6, 7].To solve this issue, we have to use a smaller number of training samples. The use of feature selection and extraction techniques would be the highlight of this case. Feature selection methods are often used to increase the generalization potential of a classifier [8, 9]. In this paper, we compare the result of the dataset with and without important features selection by RF methods varImp(), Boruta, and RFE to get the best accuracy. In the heart of machine learning, it requires lots of data, features, and variables to make predictions and reach high accuracy. More than that, selecting the feature is more important than designing the prediction model. Furthermore, using the dataset without pre-processing will only make the prediction result worse.
Related to the previous research, [10] performs feature importance in classification models for colorectal cancer cases phenotype in Indonesia. Besides, these features as covariates in future genetic association studies of colorectal cancer [11] conduct feature importance on emotion classification and emotional speech synthesis. Also [12, 13], performs feature importance analysis for the industrial recommendation system with promising results. In this paper, we show how significant the features selection in Bank Marketing dataset, car evaluation dataset, and Human Activity Recognition using smartphones dataset.
The main contributions of this research summarize as follows. First, it analyses various features to find out which features are useful, particularly for the classification data analysis. These studies have been implemented with Random Forest. Some discussions are presented to get several concepts into the selection of the critical metric. Second, the system shows the comparison of the different machine learning models, such as RF, Support Vector Machine (SVM), K-Nearest Neighbor (KNN), and Linear Discriminant Analysis (LDA) based on the critical features. Different models will have various strengths in data classification that will affect the classification performance. Besides, we use multiple features selection methods, RF varImp(), Boruta, and RFE, to get the best accuracy. Further, we mainly review the features selection application, provide a description, analysis, and future research suggestions.
The remainder of the paper is organized as follows. “Material and method” section provides a review of the Materials and methods. “Results and discussion” section presents our results and discussion. Finally, conclusions and future research directions are indicated in “Conclusion and future work” section.
Material and method
Important features study
Variable importance analysis with RF has received a lot of attention from many researchers, but there remain some open issues that need a satisfactory answer. For instance, Andy Liaw and Matthew Wiener using RF for classification and regression problems, they use R language to solve the problem [14]. Other research combines RF and KNN on the HAR dataset using Caret [15]. Moreover, in [16] introduced RF methods to Diabetic retinopathy (DR) classification analyses. These research results suggest that RF methods could be a valuable tool to diagnose DR diagnosis and evaluate their progression. Hence, Grömping [17] compares the two approaches (linear model and random forest) and finds both striking similarities and differences, some of which can be explained whereas others remain a challenge. The investigation improves understanding of the nature of variable importance in RF. RF has been discussed as a robust learner in several domains [18, 19]. Feature selection aims at finding the most relevant features of a problem domain. It is beneficial in improving computational speed and prediction accuracy [20]. In [21], a comparative analysis using Human Activity Recognition (HAR) dataset based on machine learning methods with different characteristics is conducted to select the best classifier among the models. This study showed that the RF approach has high precision from each category and is considered the best classifier [22]. Further, the combination of RF, SVM (Support Vector Machine), and tune SVM regression to improve the model performance could be found in [23]. The experiment describes that the best features to improve model performance are essential [24]. The feature selection is handy for all disciplines, more instance in ecology, climate, health, and finance. However, Table 1 describes in detail the application of feature selection.
The evaluation of function in variable and feature importance is dependent by model use information, or the model does not use information. The advantage of using a model-based approach is more closely tied to the model performance and that it may be able to incorporate the correlation structure between the predictors into the importance calculation. In brief, the importance is calculated. Each predictor will have a separate variable of importance for each class. Next, all the important measurements are scaled to have a maximum value of 100, unless the scale argument of varImp()should be set to FALSE.
In this experiment, the model-specific metrics Random Forest from the R package were used. For each tree, the prediction accuracy on the portion of the data is registered. Then the same is finished after permuting each predictor variable. The difference between the two accuracies is then averaged over all trees, and normalized by the standard error. We use train()function the desired model using the caret package. Then, use the varImp()function to determine the feature importance by RF.
Recursive Feature Elimination (RFE) offers an accurate way to define the prominent variables before we input them into a machine learning algorithm. Guyon et al. [74] proposed RFE, which is applied to cancer classification by using SVM. RFE employs all features to build an SVM model. Next, it ranks the collaboration of each feature in the SVM model into a ranked feature list. RFE then finally eliminates the unrelated features that have a meaningless contribution to the SVM model. Moreover, RFE is a powerful algorithm for feature selection, which depends on the specific learning model [75, 76].
Boruta is a feature selection algorithm and feature ranking based on the RF algorithm. Boruta’s benefits are to decide the significance of a variable and to assist the statistical selection of important variables. Besides, we can manage the strictness of the algorithm by adjusting the p value that defaults to 0.01. maxRun is the number of times the algorithm is run. The higher the maxRun, the more selective we get in choosing the variables. The default value is 100. For the confirmation of feature selection, our experiment has followed the Boruta package in the R programming language [77]. This package is based on the wrapper, which builds around the RF classification algorithm, and works on the RF method to determine significant features. It tries to capture all the interesting and important features in each dataset that have an outcome variable. This algorithm performs a top-down approach for relevant features with the comparison on the set of original attributes.
Classifiers method
Random Forests (RF) consists of a combination of decision-trees. It improves the classification performance of a single tree classifier by combining the bootstrap aggregating method and randomization in the selection of data nodes during the construction of a decision tree [78]. A decision tree with M leaves divides the feature space into M regions Rm, 1 ≤ m ≤ M. For each tree, the prediction function f(x) is defined as:
where M is the number of regions in the feature space, Rm is a region appropriate to m; cm is a constant suitable to m:
The last classification conclusion is made from the majority vote of all trees.
K-Nearest Neighbor (KNN) [79, 80] works based on the assumption that the instances of each class are surrounded mostly by instances from the same class. Therefore, it is given a set of training instances in the feature space and a scalar k. A given unlabelled instance is classified by assigning the label, which is most frequent among the k training samples nearest to that instance. According to many different measures that are used for the distance between instances, the Euclidean distance is the most frequently worn for this purpose [81]. Some of the previous researches about KNN could be found in [82,83,84]. The type of distance metric used in this method is Euclidean distance described in the equation below:
Linear Discriminant Analysis (LDA) [85] usually used as a dimensionality decrease technique in the pre-processing step for classification and machine learning applications. The goal is to project a dataset into lower dimensional space with good separable class—to avoid over-fitting and to reduce computational costs. LDA is usually used to discover a linear combination of features or variables. The combination is beneficial for dimensionality reduction. LDA yields scattered classes from the fixed dataset. It is due to the distance between the training data in a class that is made shorter [86]. The purpose of LDA is maximizing the between-class measure while minimizing the within-class measure. Let Ci be the class containing the state binary vectors x corresponding to the ith activity class. Then the linear discriminant features are performed in the following way. It consists of solving the generalized eigenvalue problem:
With the between-class scatter matrix, SB and within-class scatter matrix \(S_{W}^{ - 1}\) are calculated [87]. The number of reduced variables will be at most N-1 because there only N points to estimate SB.
Support Vector Machines (SVM) is a machine learning algorithm. In recent years, there has been plenty of researches introduce SVM as a powerful method for classification. An overview can be found in [88,89,90,91] and can be used to regression [30, 92]. The other research describes that SVM uses a high dimension space to find a hyperplane in order to perform binary classification where the error rate is minimal [93, 94]. The problem with SVM is to separate the two classes with a function obtained from the available training data [36, 95, 96]. The aim is to produce classifiers that will work well on other problems. The input vectors are maximal to separate two regions that are the hyperplane function in SVM. SVM is not limited to separate two kinds of objects and that there are several alternatives to dividing lines that arrange the set of objects into two classes. This technique seeks to find an optimal classifier function that can separate two sets of data from two different categories. In this case, the separating function aimed is linear.
With \(f\left( x \right) = \varvec{w}^{T} \varvec{x} + b, \varvec{w},\varvec{x} \in \varvec{R}^{n}\) and b ∈ \(\varvec{R}\), w and b are the parameters for which value is sought. The best hyperplane is located in the middle between two sets of objects from two classes. Finding the best hyperplane is equivalent to maximizing the margin or distance between two sets of objects from two categories. Samples located along a hyperplane are called support vectors. In this technique, it is attempted to find the best classifier/hyperplane function among functions.
Classification and Regression Training (Caret) Package
The Caret package has several functions that arrange to streamline the model building and evaluation process. This package consists of 30 packages and contains functions to shorten the model training process for classification and complex regression problems. Moreover, Caret will execute packages as needed and assumes that they are installed. If a modelling package is missing, there is a prompt to install it. The package accommodates tools for data splitting, pre-processing, feature selection, model tuning using resampling, variable importance estimation, as well as other functionality [97, 98]. A classification tree algorithm is a nonparametric approach. This method is a one classification method that does not depend on certain assumptions and able to explore complex data structures with many variables. The data structure can be seen visually [99]. Moreover, the classification tree algorithm also enables it to interpret the results easily.
Random Forest is divided into two, regression trees and classification trees. When an RF is used for classification, it is more accurate to call it a classification tree. When it is used for regression, it is known as a regression tree. The classification tree in the response variable is categorical data, whereas, in the regression tree, the response variable is continuous data. Classification trees are rules for predicting the class of an object from the values of predictor variables. Trees are formed through repeated data sealing, in which the level and benefits of the predictor variables of each observation in the sample data are known. Each partition (split) data is expressed as a node in the tree formed.
Research workflow
Figure 1 describes the workflow of this research. The experiment consists of several steps. First, collecting the dataset from the University of California Irvine (UCI) machine learning repository. Further, this work uses three popular datasets (Bank Marketing, Car Evaluation Database, Human Activity Recognition Using Smartphones) to conduct the experiment. Second, our work applies features selection method RF, Boruta, and RFE to select essential features. The next is the comparison of different machine learning models such as RF, SVM, KNN, and LDA methods for classification analysis. The determination of an ideal subset of highlights from a list of capabilities is a combinatorial issue, which cannot be understood when the measurement is high without the association of specific suspicions or bargain that results in just problematic arrangements. Here our experiment utilizes a recursive methodology to move toward the issue. Different models will have different strengths in classification data analysis. We will compare four classifiers method with various features to select the best classifiers method based on the accuracy of each classifier. The whole work has been done in R [97, 98] a free software programming language that is specially developed for statistical computing and graphics.
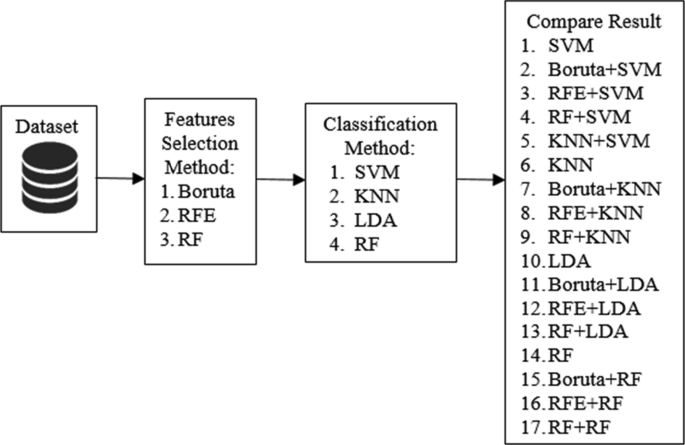
The workflow of this research
Model performance evaluation
The performance is evaluated based on the calculation of accuracy. Accuracy is how often the model trained is correct, which depicted by using the confusion matrix. A confusion matrix is the summary of prediction results on a classification problem [100]. A classification system is expected to be able to classify all data sets correctly, but the performance of a classification system is not entirely spared error. The form of error is in classifying new objects into a class (misclassification). The confusion matrix is a table recording the results of classification work.
The confusion matrix in Table 2 has the following four results [101]. True positive is a condition when the observations coming from positive classes are predicted to be positive. Then, False-negative is a condition when the actual observation comes from a positive but in positive negative predicted class. False-positive is a condition when the actual observation coming from negative classes but predicted to be positive. Lastly, True negative is a condition when observations from negative classes are predicted to be negative. The performance evaluation in classification can be justified by precision and recall. Recall/True Positive Rate can be defined as the level of accuracy of predictions in positive classes and the percentage of the number of predictions that are right on the positive observations. Moreover, accuracy is the percentage of overall predictions that are right on all observations in the data group. Apart from looking at the confusion matrix, the assessment of the goodness of a classifier’s prediction can be seen from the Receiver Operating Characteristic (ROC) [102, 103] and Area Under the Curve (AUC) curves [104].
Based on the contents of the confusion matrix, it can be seen the amount of data from each class is correctly predicted and classified incorrectly. Then calculate the accuracy and prediction error rates using the equation below: [105]
where: TP = True positive; FP = False positive; TN = True negative; FN = False negative.
Cohen’s Kappa evaluation is an evaluation method to determine the reliability or level of similarity in two or more variables. The equation from the Cohen’s Kappa evaluation can be written in Eq. (9) as follows:
With: k = kappa coefficient value,\(p_{0}\) = total main diagonal proportion of the observation frequency, \(p_{e}\) = total marginal proportion of the observation frequency. The value of the cohen’s kappa coefficient can be interpreted with the strength of agreement: First, poor ≤ 0.20; fair = 0.21–0.40; moderate = 0.41–0.60; good = 0.61–0.80; very good = 0.81–1.00.
Results and discussion
Dataset descriptions
This experiment uses three datasets publicly available from the UCI machine learning repository. Moreover, the three datasets belong to classification data that have different total instances and features. The description of each dataset could be found in Table 3.
Table 3 describes a dataset that belongs to classification data. In this experiment, we use the Bank marketing dataset published in 2012 with 45,211 instances and 17 features. Next, the car evaluation database in 1997 with 1728 instances and six features, and Human Activity Recognition Using Smartphones Dataset in 2012 with 10,299 instances and 561 features. The ability to mine intelligence from these data more generally, big data has become highly crucial for economic and scientific gains [106, 107]. Further, feature descriptions and explanations for each dataset could be seen in Tables 4, 5, 6, and 7.
The set of variables estimated from the 3-Axial signal in the X, Y, and Z can be seen in Table 6. Additional vectors obtained by averaging the signals in a signal window sample can be seen in Table 7.
Features selection by RF, Boruta, and RFE for Bank Marketing Dataset displayed in Figs. 2, 3, 4, and 5. First, in RF, the process of solving at each parent node is based on the goodness of split criterion, which is based on the function of impurity. The solving rule used is the towing criterion. The goodness of split is an evaluation of solving by s at node t. A split s in node t is divided into \(t_{R}\) with the proportion of the number of objects. Then, \(i\) function with \(t_{R}\) has probability \(P_{R}\) and with \(t_{L}\) has probability \(P_{L}\). In addition, \(P_{L}\) with the number of objects in \(t_{L}\) can be defined as \(P_{L}\)(decreasing impurity). It means that the solution is done to make two new vertices with a smaller (homogeneous) diversity when compared to the initial node (parent node). Solving the t node using split s will produce a new classification tree that has a tree impurity. This value is smaller than the tree impurity from the previous classification tree.

The important measure for each variable of Bank marketing Dataset using Random Forest

The important measure for each variable of Bank marketing Dataset using Recursive Features Elimination

The important measure for each variable of Bank marketing Dataset using Boruta

Feature selection and classification method combination for Bank Marketing Dataset a RF + RF, b RF + SVM and c RF + KNN
The breakdown criteria are based on the greatest value of the goodness of split [\(\varPhi \left( {s,t} \right)]\). Discrete attributes only have two branches for each node, so that every possible value for the node must be partitioned into two parts. Each combination forms a candidate splits an alternative that will be selected to compile partition initials on root nodes and other nodes based on the highest goodness of split values. Before performing the goodness of split in continuous attributes type, the attribute must find the threshold to calculate the goodness of split in attributes. Split-points are obtained by looking for the average value of 2 attribute values that have been sorted first. On a continuous type attribute, the case is labelled with an attribute value less than or equal to the threshold value (A ≤ v) and attribute, which has a more significant value than the threshold value (A > v).
Bank marketing datasets
This dataset uses seven predictors and two classes (No and Yes) with 36,170 samples. In Random Forest, re-sampling is used by using cross-validation ten folds, and the best accuracy is at mtry = 2. It means that we take two random variables from our data set and examine them for one tree. Therefore, from the next tree would be taken two more random variables, examine them, so on and so forth until it runs through the numbers that we specify and then return the average estimates for the best/most important variables and justify by kappa (0.3444818).
Figure 2 explains that seven variables are important to be used, including duration, balance, age, poutcomesucess, pdays, campaign, and housingyes. Then the variable will be used to form the model. Our research operates cross-validation to see the accuracy of each of these variables, which can be seen in Fig. 3 and perform the Boruta in Fig. 4.
Moreover, these experiments perform KNN, -tested with k = 5, 7, and 9, which resampling using cross-validation tenfold. It obtained k = 9 is best used with an accuracy value of 0.8841308 and kappa 0.2814066. Then do the same thing in SVM by comparing the C cost (0.25,0.50, and 1) obtained the best accuracy value at C = 1 with sigma 0.2547999 reach the accuracy 0.8993641 and kappa 0.355709. Finally, we perform LDA with tenfold cross-validation that obtained accuracy 0.898037, and kappa 0.4058678. These experimental results are fully explained in Tables 8 and 9.
Figure 5 displays the selection of 7 features based on RF + RF, RF + SVM, and RF + KNN. The KNN accuracy will increase when using neighbors values that are getting bigger. Then in the random selection of predictors, the best is the predictor with a large number. Furthermore, in RF + SVM, the best accuracy is to use a cost that is close to 1.
Car dataset
At the simulation stage of the Car Dataset in Random Forest, we apply 1384 samples, 4 predictors, and 4 classes (acc, good, unacc, vgood). Next, the resampling stage was mtry (2, 7, and 12). Besides, the best result is mtry = 7, with an accuracy of 0.9436328 and kappa 0.8784367. Moreover, In modeling with KNN, the optimal model is obtained by k = 5 with an accuracy of 0.7969389 and kappa 0.5683084. Furthermore, the SVM resampling cross-validation 10 fold and the tuning parameter “sigma” was held constantly at a value of 0.07348688, C = 0.5 reach the accuracy 0.8346161, and kappa 0.6319634. Lastly, LDA achieves accuracy = 0.8431124, and kappa = 0.6545901 are fully explained in Tables 10 and 11. Features selection by RF, Boruta, and RFE for Car Evaluation Dataset could be seen in Figs. 6, 7, and 8.

The important measure for each variable of the Car Evaluation dataset using Random Forest

The important measure for each variable of the Car Evaluation dataset using RecursiveFeatures Elimination

The important measure for each variable of the Car Evaluation dataset using Boruta
Figure 9 portrays the selection of 4 features based on RF + RF, RF + SVM, and RF + KNN. In this case, the greater choice of the attribute does not guarantee to reach high accuracy. This is proven by the final value used for the model RF + RF was mtry = 7. However, in RF + SVM tuning parameter, sigma was held constant at a value of 0.07348688. Accuracy was used to select the optimal model using the largest value. The final values used for the model were sigma = 0.07348688 and C = 0.5.

Feature selection and classification method combination for Car Evaluation Dataset a RF + RF, b RF + SVM and c RF + KNN
Human activity recognition using Smartphones dataset
In this session, we perform HAR dataset by Random Forest, KNN, SVM, and LDA by 5884 samples, six classes (Laying, Sitting, Walking, Walking Downstairs, Walking Upstairs). The best model in Random Forest selects the largest value mtry = 2 with accuracy = 0.9316768 and kappa = 0.9177446. Features selection by RF, Boruta, and RFE for Human Activity Recognition Using Smartphones Dataset could be seen in Figs. 10, 11, and 12. Random Forest restores a few proportions of variable significance. The most dependable measure depends on the diminishing of arrangement exactness when estimations of the variable in a hub of the tree are permuted haphazardly. To choose highlights, we iteratively fit irregular Random Forest, at every emphasis fabricating another iteration disposing of those factors with the littlest variable significance.

The important measure for each variable of Human Activity Recognition Using Smartphones Dataset using Random Forest

The important measure for each variable of Human Activity Recognition Using Smartphones Dataset using Recursive Features Elimination

The important measure for each variable of Human Activity Recognition Using Smartphones Dataset using Boruta
Figure 11 illustrates the Random Forest for creating a classification tree. This processing is recursive partitioning, which means the solving process is repeated for each child node as a result of previous solutions. This solving process will continue until there is no chance to do the next solution. The term partition means that the sample data owned is broken down into smaller parts or partitions.
Figure 12 describes the important measure for each variable of the HAR dataset. Boruta performed 99 iterations in 1.04146 h. In this process, 404 attributes confirmed important: V1, V10, V100, V101, V103, and 399 more, 58 attributes confirmed unimportant: V102, V107, V111, V128, V148 and 53 more, and 100 tentative attributes left: V104, V105, V110, V112, V115 and 95 more. This work employ varImp(fit.rf) function to generate important features by RF. Next, to select important features by RFE, our experiment uses RFE function with various parameters such as rfeControl(functions = rfFuncs, method = ”cv”, number = 10). Moreover, we use TentativeRoughFix(boruta_output) function to select significant features by Boruta. Besides, in KNN, we perform (k = 5,7,and9). The final value used for the model was k = 7 with accuracy = 0.9036328 and kappa = 0.8839572. SVM resampling results across tuning parameters (C = 0.25, 0.50 and 1). Tuning parameter ‘sigma’ was held constantly at a value of 1.194369, and accuracy was applied to select the optimal model using the largest value. The final values used for the model were sigma = 1.194369, C = 1 with accuracy = 0.8708287, and kappa = 0.8444160. Lastly, LDA resampling cross-validation10-fold reached the accuracy = 0.8303822 and kappa = 0.7955373. Tables 12 and 13 describe the full experiment result with Human Activity Recognition Using Smartphones Dataset.
Figure 13 represents the selection of 6 features on RF + RF, RF + SVM, and RF + KNN. Exactly similar to the car dataset, the best predictor is 2 in the HAR dataset, so the selection of many predictors does not guarantee high accuracy. The RF + SVM result is the selection of cost = 1, which will improve accuracy accordingly. Finally, for RF + KNN, the selection of the best neighbor appears to be 7.

Feature selection and classification method combination for Human Activity Recognition Using Smartphones Dataset a RF + RF, b RF + SVM and c RF + KNN
Evaluation performance and discussion
The contributions of the simulation paper are to see the different insights in each experimental data such as Bank Marketing dataset in Tables 8 and 9, car evaluation dataset in Tables 10, and 11 as well as human activity recognition using smartphones dataset in Tables 12 and 13. We perform 80% of training data and 20% testing data in each experiment. To compare the accuracy, this work is following metric=”Accuracy.”At the same time, we are comparing the accuracy from different classifiers method by following trainControl(method = ”cv”, number = 10), and different method parameter to do the experiment (method = ”lda”, method = ”knn”, method = ”svmRadial”, and method = ”rf”). The determination of the hyperplane function for classification in this study is done by optimizing margins.
Additionally, the problem is formulated into Quadratic Programming (QP) by completing an optimization function. Optimization function is simplified by transformation into the Lagrange function. This function creates a hyperplane that separates data according to every class. The calculation is intended to find the value of Lagrange Multiplier (α) and b value. The error values are obtained in each classification performance measurement with several pairs of parameter values (C parameters and kernel parameters). The values tried to determine which pair of parameter values is best in the classification of this study. The following is the error value obtained for each pair of amounts of the cost (C) parameter and kernel parameters that have been predetermined. Other than including determination methodology, in [107] additionally portrayed the best approach to error rates. Furthermore, in [108] investigate the use of random forest for classification of microarray data (including multi-class problems) and propose a new method of gene selection in classification problems based on random forest. To evaluate the expectation mistake error of all methods we use the bootstrap strategy as proposed by Efron and Tibshirani [109]. Their experiment shows that a particular bootstrap method substantially outperforms cross-validation in a catalogue of 24 simulation experiments. Besides providing point estimates, it also considers estimating the variability of an error rate estimate [110]. The bootstrap strategy utilizes a weighted normal of the re-substitution mistake (the blunder when a classifier is applied to the preparation information) and the mistake on tests is not used to prepare the indicator.
Tables 8, 10, and 12 describe the result of the classification accuracy of different classifiers with different features selection method Boruta, RFE, and RF. The result shows that the RF method has high accuracy in all experiment groups. According to Table 8, the RF method has a high accuracy of about 90.88% with all features (16 features) and 90.99% accuracy with 7 features. Moreover, in Table 10, the RF method leads to 93.31% accuracy with 6 features and 93.36% accuracy with 4 features. In regards to the next experiment result in Table 12, the RF method gained 98.57% accuracy with 561 features and 93.26% accuracy with only 6 features. In general, the trend of accuracy will decrease because of features limitation. We could get good accuracy if we select the important features by the feature’s selection method. Random Forest in data mining is prediction models that are applied to describe the forms of classification and regression models. Decision trees are utilized to identify the most likely strategies to achieve their goals. The use of the Random Forest is a widespread technique in data mining in addition to get high accuracy RF + RF. The favors of using decision trees as a classification tool include: (1) RF is easy to understand. (2) The RF can handle both nominal and continuous attributes. (3) The RF represents enough discrete classification values. (4) RF is included in nonparametric methods, so they do not require distribution assumptions.
Lately, the fame of big data exhibits some difficulties for the traditional feature selection task. Meanwhile, some unique characteristics of big data also bring about new possibilities for feature selection research [111]. The latest advances in feature selection are a combination of feature selection with deep learning especially the Convolutional Neural Networks (CNN) for classification tasks, such as applications in bioinformatics neurodegenerative disorders classification using the Principal Components Analysis (PCA) algorithm [112, 113], brain tumor segmentation [114] using three planar super pixel based statistical and textural features extraction. Next, remote sensing imagery classification using a fusion of CNN and RF [115], and software fault prediction [116] using enhanced binary moth flame optimization as a feature selection, and text classification based on independent feature space search [117].
Conclusions and future work
In this paper, we compare four classifiers method Random Forest (RF), Support Vector Machines (SVM), K-Nearest Neighbors (KNN), and Linear Discriminant Analysis (LDA). We combine those classifiers method with different features selection method RF, RFE, and Boruta to select the best classifiers method based on the accuracy of each classifier. Feature selection is essential for classification data analysis and proves in the experiment. Besides, Tables 8, 10, and 12 demonstrate that the RF method has high accuracy in all experiment groups.
Regarding the performance evaluation in our experiment, it is undoubtedly accurate that Random Forest it the best classifier. Furthermore, in all experiments with three different dataset method, varImp()by RF become the best features selection method compared to Boruta and RFE. Besides, RF methods are extremely useful and efficient in selecting the important features, so we should not use all the features in the dataset. Consequently, it will affect the processing time, it could give the best accuracy, and more features which are the higher dimension of data. Based on our evaluation result, our proposed model has a better result compare to other methods in each dataset. For instance, in Table 12, the RF method got 98.57% accuracy with 561 features and 93.26% accuracy with only 6 features.
In the future, we would like to set up our dataset or different data repositories and use a different method. At the same time, future research can try a QUEST. QUEST stands for Quick, Unbiased, and Efficient Statistical Tree. QUEST is one of the classification tree methods that produce two nodes per block. The variable that used as a node blocker is the variable with the smallest p value. The variable selected as a node blocker is utilized to define a block as a data split into two nodes. Also, future research can try the Gradient boosting, and the other boosted algorithm family can improve the predictive accuracy of the model. Some different boosting algorithms, such as XGBoost [45], AdaBoost [118], and Gentle Boost [119, 120] has its mathematical formula and varied. The concept of Gradient Boosting lies in its development which has expansion adds to the criterion fitting.
Availability of data and materials
The testing data sources come from three datasets publicly available from the UCI machine learning repository. The three datasets belong to classification data that have different total instances and features. There are Bank Marketing, Car Evaluation Database, and Human Activity Recognition Using Smartphones Dataset. The link of the websites are as follows.
1. https://archive.ics.uci.edu/ml/datasets/Bank+Marketing
2. https://archive.ics.uci.edu/ml/datasets/car+evaluation
3. https://archive.ics.uci.edu/ml/datasets/human+activity+recognition+using+smartphones
Abbreviations
- RF:
-
Random Forest
- SVM:
-
Support Vector Machines
- KNN:
-
K-Nearest Neighbors
- LDA:
-
Linear Discriminant Analysis
- RFE:
-
Recursive Feature Elimination
- QP:
-
Quadratic Programming
- UCI:
-
University of California Irvine
- Caret:
-
Classification and Regression Training
References
Wang XD, Chen RC, Yan F, et al. Fast adaptive K-means subspace clustering for high-dimensional data. IEEE Access. 2019;7:42639–51.
Jaiswal JK, Samikannu R. Application of random forest algorithm on feature subset selection and classification and regression. In: World Congress on Computing and Communication Technologies (WCCCT). IEEE, 2017, p. 65–8.
Chen RC. Using deep learning to predict user rating on imbalance classification data. IAENG Int J Comput Sci. 2019;46:109–17.
Caraka RE. Prediction of Euro 50 Using Back Propagation Neural Network (BPNN) and Genetic Algorithm (GA). Int J Eng Busin Manag. 2017;1:35–42.
García-Escudero LA, Gordaliza A, Matrán C, et al. A review of robust clustering methods. Adv Data Anal Classif. 2010;4:89–109.
Blum AL, Langley P. Selection of relevant features and examples in machine learning. Artif Intell. 2002;97:245–71.
Schmidtler, AR M, A NC. Data classification methods using machine learning techniques. US Patent Application 2012; 11: 691.
Chen XW, Wasikowski M. FAST: A roc-based feature selection metric for small samples and imbalanced data classification problems. In: Proceedings of the ACM SIGKDD International Conference on Knowledge Discovery and Data Mining. 2008, p. 124–32.
Segal MR. Machine Learning Benchmarks and Random Forest Regression. Biostatistics 2004; 1–14.
Cenggoro TW, Mahesworo B, Budiarto A, et al. Features importance in classification models for colorectal cancer cases phenotype in Indonesia. Procedia Comput Sci. 2019;157:313–20.
Tao J, Kang Y. Features importance analysis for emotional speech classification. Lecture Notes Comput Sci. 2005;3784:449–57.
Rodriguez-Galiano V, Sanchez-Castillo M, Chica-Olmo M, et al. Machine learning predictive models for mineral prospectivity: an evaluation of neural networks, random forest, regression trees and support vector machines. Ore Geol Rev. 2015;71:804–18.
Zhu F, Jiang M, Qiu Y, et al. RSLIME: an efficient feature importance analysis approach for industrial recommendation systems. In: 2019 International Joint Conference on Neural Networks (IJCNN) 2019; 1: 1–6.
Liaw A, Wiener M. Classification and Regression by randomForest. R News. 2002;2:18–22.
Kella BJ, HimaBindu K, Suryanarayana D. A comparative study of random forest & k – nearest neighbors on the har dataset using caret. Int J Innov Res Technol. 2017;3:6–9.
Casanova R, Saldana S, Chew EY, et al. Application of random forests methods to diabetic retinopathy classification analyses. PLoS ONE. 2014;9:1–8.
Grömping U. Variable importance assessment in regression: linear regression versus random forest. Am Stat. 2009;63:308–19.
Khoshgoftaar TM, Golawala M, Van Hulse J. An empirical study of learning from imbalanced data using random forest. In: Proceedings - International Conference on Tools with Artificial Intelligence, ICTAI. 2007, pp. 310–317.
Li Y, Xia J, Zhang S, et al. An efficient intrusion detection system based on support vector machines and gradually feature removal method. Expert Syst Appl. 2012;39:424–30.
Hsu HH, Hsieh CW, Da LuM. Hybrid feature selection by combining filters and wrappers. Expert Syst Appl. 2011;38:8144–50.
Dewi C, Chen R-C. Human Activity Recognition Based on Evolution of Features Selection and Random Forest. In: 2019 IEEE International Conference on Systems, Man and Cybernetics (SMC). 2019.
Wei W, Qiang Y, Zhang J. A bijection between lattice-valued filters and lattice-valued congruences in residuated lattices. Math Probl Eng. 2013;36:4218–29.
Wei W, Yang XL, Shen PY, et al. Holes detection in anisotropic sensornets: topological methods. Int J Distrib Sens Netw. 2012;8:9.
Dewi C, Chen R-C. Random forest and support vector machine on features selection for regression analysis. Int J Innov Comput Inform Control. 15.
Murray K, Conner MM. Methods to quantify variable importance: implications for the analysis of noisy ecological data. Ecology. 2009;90:348–55.
Warton DI, Blanchet FG, O’Hara RB, et al. So many variables: joint modeling in community ecology. Trends Ecol Evol. 2015;30:766–79.
Caraka RE, Chen RC, Lee Y, et al. Variational approximation multivariate generalized linear latent variable model in diversity termites. Sylwan. 2020;164:161–77.
Jeliazkov A, Mijatovic D, Chantepie S, et al. A global database for metacommunity ecology, integrating species, traits, environment and space. Sci Data. 2020;7:1–15.
Haidar A, Verma B. A novel approach for optimizing climate features and network parameters in rainfall forecasting. Soft Comput. 2018;22:8119–30.
Caraka RE, Bakar SA, Tahmid M, et al. Neurocomputing fundamental climate analysis. Telkomnika. 2019;17:1818–27.
Hu J, Ghamisi P, Zhu X. Feature Extraction and Selection of Sentinel-1 Dual-Pol Data for Global-Scale Local Climate Zone Classification. ISPRS Int J Geo-Inform. 2018. https://doi.org/10.3390/ijgi7090379.
Bechtel B, Daneke C. Classification of local climate zones based on multiple earth observation data. IEEE J Select Topics Appl Earth Observ Remote Sens. 2012. https://doi.org/10.1109/jstars.2012.2189873.
Torija AJ, Ruiz DP. A general procedure to generate models for urban environmental-noise pollution using feature selection and machine learning methods. Sci Total Environ. 2015;505:680–93.
Caraka RE, Chen RC, Toharudin T, et al. Prediction of Status Particulate Matter 25 Using State Markov Chain Stochastic Process and HYBRID VAR-NN-PSO. IEEE Access. 2019;7:161654–65.
De Vito S, Piga M, Martinotto L, et al. CO, NO2 and NOx urban pollution monitoring with on-field calibrated electronic nose by automatic bayesian regularization. Sens Actuat B. 2009;143:182–91.
Prastyo DD, Nabila FS, Suhartono, et al. VAR and GSTAR-based feature selection in support vector regression for multivariate spatio-temporal forecasting. In: Communications in Computer and Information Science. 2019, p. 46–57.
Bui DT, Tsangaratos P. Flash flood susceptibility modeling using an optimized fuzzy rule based feature selection technique and tree based ensemble methods. Sci Total Environ. 2019;6:1038–54.
Hosseini FS, Choubin B, Mosavi A, et al. Flash-flood hazard assessment using ensembles and Bayesian-based machine learning models: application of the simulated annealing feature selection method. Sci Total Environ. 2020;711:135161.
Micheletti N, Foresti L, Robert S, et al. Machine learning feature selection methods for landslide susceptibility mapping. Math Geosci. 2014;46:33–57.
Brett PTB, Guida R. Earthquake damage detection in urban areas using curvilinear features. IEEE Trans Geosci Remote Sens. 2013;51:4877–84.
Zhuang J, Ogata Y, Vere-Jones D. Analyzing earthquake clustering features by using stochastic reconstruction. J Geophys Res. 2004. https://doi.org/10.1029/2003jb002879.
Wieland M, Liu W, Yamazaki F. Learning change from synthetic aperture radar images: performance evaluation of a support vector machine to detect earthquake and tsunami-induced changes. Remote Sens. 2016;8:792.
Caraka RE, Nugroho NT, Tai SK, et al. Feature importance of the aortic anatomy on endovascular aneurysm repair (EVAR) using Boruta and Bayesian MCMC. Comm Math Biol Neurosci. 2020. https://doi.org/10.28919/cmbn/4584.
Kushan DS, Jönsson D, Demmer RT. A combined strategy of feature selection and machine learning to identify predictors of prediabetes. J Am Med Inform Assoc. 2020;27:394–406.
Caraka RE, Goldameir NE, et al. An end to end of scalable tree boosting system. Sylwan. 2020;165:1–11.
Garcia-Carretero R, Vigil-Medina L, Mora-Jimenez I, et al. Use of a K-nearest neighbors model to predict the development of type 2 diabetes within 2 years in an obese, hypertensive population. Med Biol Eng Comput. 2020; 1–12.
Magesh G, Swarnalatha P. Optimal feature selection through a cluster-based DT learning (CDTL) in heart disease prediction. Evol Intel. 2020. https://doi.org/10.1007/s12065-019-00336-0.
Kavitha R, Kannan E. An efficient framework for heart disease classification using feature extraction and feature selection technique in data mining. In: 1st International Conference on Emerging Trends in Engineering, Technology and Science, ICETETS 2016 - Proceedings. 2016. https://doi.org/10.1109/icetets.2016.7603000(Epub ahead of print 2016)
Shilaskar S, Ghatol A. Feature selection for medical diagnosis: evaluation for cardiovascular diseases. Expert Syst Appl. 2013;40:4146–53.
Sodhi P, Aggarwal P. Feature selection using SEER data for the survivability of ovarian cancer patients. In: Advances in computing and intelligent systems. 2019, p. 271–9.
García-Díaz P, Sánchez-Berriel I, Martínez-Rojas JA, et al. Unsupervised feature selection algorithm for multiclass cancer classification of gene expression RNA-Seq data. Genomics. 2020;112:1916–25.
Singh RK, Sivabalakrishnan M. Feature selection of gene expression data for cancer classification: a review. In: Procedia Computer Science. 2015, pp. 52–7.
Naftchali RE, Abadeh MS. A multi-layered incremental feature selection algorithm for adjuvant chemotherapy effectiveness/futileness assessment in non-small cell lung cancer. Biocybern Biomed Eng. 2017;37:477–88.
Fung G, Stoeckel J. SVM feature selection for classification of SPECT images of Alzheimer’s disease using spatial information. Knowl Inf Syst. 2007;11:243–58.
Sankhwar S, Gupta D, Ramya KC, et al. Improved grey wolf optimization-based feature subset selection with fuzzy neural classifier for financial crisis prediction. Soft Comput. 2020;24(1):101–10.
Wei W, Xia X, Wozniak M, et al. Multi-sink distributed power control algorithm for Cyber-physical-systems in coal mine tunnels. Comput Netw. 2019;161:210–9.
Sani NS, Rahman MA, Bakar AA, et al. Machine learning approach for Bottom 40 Percent Households (B40) poverty classification. Int J Adv Sci Eng Inform Technol. 2018. https://doi.org/10.18517/ijaseit.8.4-2.6829.
Njuguna C, McSharry P. Constructing spatiotemporal poverty indices from big data. J Busin Res. 2017;70:318–27.
Matos T, Macedo JA, Lettich F, et al. Leveraging feature selection to detect potential tax fraudsters. Expert Syst Appl. 2020;145:113–28.
Zhang H. Optimization of risk control in financial markets based on particle swarm optimization algorithm. J Comput Appl Math. 2020;368:112530.
Caraka RE, Chen RC, Toharudin T, et al. Ramadhan short-term electric load: a hybrid model of cycle spinning wavelet and group method data handling (CSW-GMDH). IAENG Int J Comput Sci. 2019;46:670–6.
Abedinia O, Amjady N, Zareipour H. A new feature selection technique for load and price forecast of electrical power systems. IEEE Trans Power Syst. 2017;32:62–74.
Caraka RE, Bakar SA. Evaluation Performance of Hybrid Localized Multi Kernel SVR (LMKSVR) in electrical load data using 4 different optimizations. J Eng Appl Sci. 2020;13(17):7440–9.
Sałat R, Osowski S, Siwek K. Principal Component Analysis (PCA) for feature selection at the diagnosis of electrical circuits. Przegląd Elektrotechniczny. 2003;79:667–70.
Lojowska A, Kurowicka D, Papaefthymiou G, et al. Stochastic modeling of power demand due to EVs using copula. In: IEEE Transactions on Power Systems. https://doi.org/10.1109/tpwrs.2012.2192139(Epub ahead of print 2012).
Jie S, Hui L, Hamido F, et al. Class-imbalanced dynamic financial distress prediction based on Adaboost-SVM ensemble combined with SMOTE and time weighting. Inform Fusion. 2020;54:128–44.
Caraka RE, Hafianti S, Hidayati S, et al. Identifying Indicators of Household Indebtedness by Provinces. In: The ninth research dive for development on household vulnerability 2019; 10–15.
Kaban PA, Kurniawan R, Caraka RE, et al. Biclustering method to capture the spatial pattern and to identify the causes of social vulnerability in Indonesia: a new recommendation for disaster mitigation policy. Procedia Computer Science. 2019;157:31–7.
Kurniawan R, Siagian TH, Yuniarto B, et al. Construction of social vulnerability index in Indonesia using partial least squares structural equation modeling. Int J Eng Technol. 2018;7:6131–6.
Ravisankar P, Ravi V, Raghava Rao G, et al. Detection of financial statement fraud and feature selection using data mining techniques. Decis Support Syst. 2011;50:491–500.
Derrig RA. Insurance Fraud. J Risk Insur. 2002;69:271–87.
Altinbas H, Biskin OT. Selecting macroeconomic influencers on stock markets by using feature selection algorithms. In: Procedia Economics and Finance. https://doi.org/10.1016/s2212-5671(15)01251-4(Epub ahead of print 2015).
Wei W, Xu Q, Wang L, et al. GI/Geom/1 queue based on communication model for mesh networks. Int J Commun Syst. 2014;27:3013–29.
Guyon I, Weston J, Barnhill S, et al. Gene selection for cancer classification using support vector machines. Mach Learn. 2002;46:389–422.
Chunkai Z, Ying Z, JianweI G, et al. Research on classification method of high-dimensional class imbalanced datasets based on SVM. Int J Mach Learn Cybern. 2018;10:1765–78.
Wei W, Zhou B, Połap D, et al. A regional adaptive variational PDE model for computed tomography image reconstruction. Pattern Recogn. 2019;92:64–81.
R Development Core Team R. R: A Language and Environment for Statistical Computing. 2011. https://doi.org/10.1007/978-3-540-74686-7(Epub ahead of print 2011).
Sain SR, Vapnik VN. The nature of statistical learning theory. Technometrics. 2006. https://doi.org/10.2307/1271324.
Altman NS. An introduction to kernel and nearest-neighbor nonparametric regression. Am Stat. 1992;46:175–85.
Cunningham P, Delany SJ. K-Nearest neighbour classifiers. Multiple Classifier Systems. 2007;34:1–17.
Bonyad M, Tieng Q, Reutens D. Optimization of distributions differences for classification. IEEE Trans Neural Netw Learn Syst. 2019;30:511–23.
Min-Ling Z, Zhi-Hua Z. A k-nearest neighbor based algorithm for multi-label classification. In: IEEE International Conference on Granular Computing. 2005, p. 718–21.
Peterson L. K-nearest neighbor. Scholarpedia; 4. https://doi.org/10.4249/scholarpedia.1883(Epub ahead of print 2009).
Hand DJ, Vinciotti V. Choosing k for two-class nearest neighbour classifiers with unbalanced classes. Pattern Recogn Lett. 2003;24:1555–62.
Tharwat A, Gaber T, Ibrahim A, et al. Linear discriminant analysis: a detailed tutorial. AI Commun. 2017. https://doi.org/10.3233/aic-170729.
Ferizal R, Wibirama S, Setiawan NA. Gender recognition using PCA and LDA with improve preprocessing and classification technique. In: Proceedings - 2017 7th International Annual Engineering Seminar, InAES 2017. 2017, p. 1–6.
Pardamean B, Budiarto A, Caraka RE. Bioinformatika dengan R Tingkat Lanjut. 1st ed. Yogyakarta: Teknosains; 2018.
Juárez I, Mira-McWilliams J, González C. Important variable assessment and electricity price forecasting based on regression tree models: classification and regression trees, Bagging and Random Forests. IET Gener Transm Distrib. 2015;9:1120–8.
Andrew AM. An Introduction to support vector machines and other kernel-based learning methods. Kybernetes. 2001. https://doi.org/10.1108/k.2001.30.1.103.6.
Durgesh, K. Srivastava BL. Data classification using support vector machine. J Theor Appl Inform Technol. 2010; 12: 1-7.
Salakhutdinov R, Hinton G. Learning a nonlinear embedding by preserving class neighbourhood structure. J Mach Learn Res. 2007, pp. 412–419.
Yasin H, Caraka RE, et al. Prediction of crude oil prices using support vector regression (SVR) with grid search—Cross validation algorithm. Global J Pure Appl Math. 2016;12:3009–20.
Caraka RE, Bakar SA, Pardamean B, et al. Hybrid support vector regression in electric load during national holiday season. In: ICITech. IEEE, 2018, pp. 1–6.
Chen RC, Hsieh CH. Web page classification based on a support vector machine using a weighted vote schema. Expert Syst Appl. 2006;31:427–35.
Ertekin S, Huang J, Bottou L, et al. Learning on the border: active learning in imbalanced data classification. In: International conference on information and knowledge management, proceedings. 2007, p. 127–36.
Wei W, Liu S, Li W, et al. Fractal intelligent privacy protection in online social network using attribute-based encryption schemes. IEEE Trans Comput Soc Syst. 2018;5:736–47.
Sharma A, Lee YD, Chung WY. High accuracy human activity monitoring using neural network. In: 3rd International Conference on Convergence and Hybrid Information Technology, ICCIT 2008. 2008, p. 430–35.
R Core Team. R software. R Foundation for Statistical Computing 2008; 739: 409.
Wei W, Su J, Song H, et al. CDMA-based anti-collision algorithm for EPC global C1 Gen2 systems. Telecommun Syst. 2018;67:63–71.
Caffo B. Developing Data Products in R. R Software 2015; 52.
Yang JY, Wang JS, Chen YP. Using acceleration measurements for activity recognition: an effective learning algorithm for constructing neural classifiers. Pattern Recogn Lett. 2008;29:2213–20.
Ting KM. Confusion Matrix. In: Encyclopedia of Machine Learning and Data Mining. 2017, p. 260.
Hernández-Orallo J. ROC curves for regression. Pattern Recogn. 2013;46:3395–411.
Sedgwick P. Receiver operating characteristic curves. BMJ (Online) 2013; 1–3.
Hanley JA, McNeil BJ. The meaning and use of the area under a receiver operating characteristic (ROC) curve. Radiology. 1982;143:29–32.
Mishra P, Mishra M, Somani AK. Applications of Hadoop Ecosystems Tools. In: NoSQL: Database for Storage and Retrieval of Data in Cloud. 2017, p. 173–90.
Mishra, Mayank PM, Somani AK. Understanding the data science behind business analytics. Big Data Analyt. 2017; 93–116.
Díaz-Uriarte R, Alvarez de Andrés S. Gene selection and classification of microarray data using random forest. BMC Bioinform 2006; 7: 1–13.
Efron B, Tibshirani R. Improvements on cross-validation: The.632+ bootstrap method. J Am Stat Assoc. 1997;42:548–60.
Wei W, Song H, Li W, et al. Gradient-driven parking navigation using a continuous information potential field based on wireless sensor network. Inform Sci. 2017. https://doi.org/10.1016/j.ins.2017.04.042.
Asim S, Muhammad H, Rehman SU, et al. A comparative study of feature selection approaches: 2016–2020. Int J Sci Eng Res. 2020;11:469–78.
Jollife IT, Cadima J. Principal component analysis: A review and recent developments. Philos Trans R Soc A. https://doi.org/10.1098/rsta.2015.0202(Epub ahead of print 2016).
Álvarez JD, Matias-Guiu JA, Cabrera-Martín MN, et al. An application of machine learning with feature selection to improve diagnosis and classification of neurodegenerative disorders. BMC Bioinform. https://doi.org/10.1186/s12859-019-3027-7(Epub ahead of print 2019).
Imtiaz T, Rifat S, Fattah SA, et al. Automated Brain Tumor Segmentation Based on Multi-Planar Superpixel Level Features Extracted from 3D MR Images. IEEE Access. https://doi.org/10.1109/access.2019.2961630(Epub ahead of print 2020).
Dong L, Xing L, Liu T, et al. Very high resolution remote sensing imagery classification using a fusion of random forest and deep learning technique-subtropical area for example. In: IEEE Journal of Selected Topics in Applied Earth Observations and Remote Sensing. https://doi.org/10.1109/jstars.2019.2953234(Epub ahead of print 2020).
Tumar I, Hassouneh Y, Turabieh H, et al. Enhanced binary moth flame optimization as a feature selection algorithm to predict software fault prediction. IEEE Access. https://doi.org/10.1109/access.2020.2964321(Epub ahead of print 2020).
Liu Y, Ju S, Wang J, et al. A new feature selection method for text classification based on independent feature space search. Hindawi Mathematical Problems in Engineering 2020; 1–14.
Schapire RE. Explaining adaboost. In: Empirical Inference: Festschrift in Honor of Vladimir N. Vapnik. 2013. https://doi.org/10.1007/978-3-642-41136-6_5(Epub ahead of print 2013).
Cabezas M, Oliver A, Valverde S, et al. BOOST: A supervised approach for multiple sclerosis lesion segmentation. Journal of Neuroscience Methods. https://doi.org/10.1016/j.jneumeth.2014.08.024(Epub ahead of print 2014).
Kubankova A, Kubanek D, Prinosil J. Digital modulation classification based on characteristic features and GentleBoost algorithm. In: 2011 34th International Conference on Telecommunications and Signal Processing, TSP 2011 - Proceedings. 2011. https://doi.org/10.1109/tsp.2011.6043692(Epub ahead of print 2011).
Acknowledgements
The authors would like to thank all the colleagues from Chaoyang University of Technology (Taiwan), Satya Wacana Christian University (Indonesia), Taichung Veterans General Hospital (Taiwan) and others that take part in this work.
Funding
This paper is supported by the Ministry of Science and Technology, Taiwan. The Nos are MOST-107-2221-E-324 -018 -MY2 and MOST-106-2218-E-324 -002, Taiwan. This paper also is partially supported by Taichung Veterans General Hospital.
Author information
Authors and Affiliations
Contributions
R-CC, do the supervision, and revise the manuscript. CD, lead the research, implement the system and write the paper. She also does data curation, data collection and algorithms’ testing. CD, lead the research, implement the system and write the paper. She also does data curation, data collection and algorithms’ testing. S-WH, do the revision paper, project administration, funding acquisition, and corresponding author. REC who proofing and validate the instrument, write and revise the manuscript. All authors read and approved the final manuscript.
Corresponding author
Ethics declarations
Competing interests
The authors declare that they have no competing interests.
Additional information
Publisher's Note
Springer Nature remains neutral with regard to jurisdictional claims in published maps and institutional affiliations.
Rights and permissions
Open Access This article is licensed under a Creative Commons Attribution 4.0 International License, which permits use, sharing, adaptation, distribution and reproduction in any medium or format, as long as you give appropriate credit to the original author(s) and the source, provide a link to the Creative Commons licence, and indicate if changes were made. The images or other third party material in this article are included in the article's Creative Commons licence, unless indicated otherwise in a credit line to the material. If material is not included in the article's Creative Commons licence and your intended use is not permitted by statutory regulation or exceeds the permitted use, you will need to obtain permission directly from the copyright holder. To view a copy of this licence, visit http://creativecommons.org/licenses/by/4.0/.
About this article

Cite this article
Chen, RC., Dewi, C., Huang, SW. et al. Selecting critical features for data classification based on machine learning methods. J Big Data 7, 52 (2020). https://doi.org/10.1186/s40537-020-00327-4
Received:
Accepted:
Published:
DOI: https://doi.org/10.1186/s40537-020-00327-4