Investigations of Feldspar-Quartz Raw Materials After Firing: Effect of Various Na2O/K2O Ratio and Synthetic Pigments Addition


1
Mineral and Energy Economy Research Institute of the Polish Academy of Sciences, J. Wybickiego 7A, 31-261 Kraków, Poland
2
Faculty of Materials Science and Ceramics, AGH University of Science and Technology, al. A. Mickiewicza 30, 30-059 Kraków, Poland
*
Author to whom correspondence should be addressed.
Minerals 2020, 10(7), 646; https://doi.org/10.3390/min10070646
Submission received: 10 July 2020
/
Revised: 20 July 2020
/
Accepted: 20 July 2020
/
Published: 21 July 2020
(This article belongs to the Section Crystallography and Physical Chemistry of Minerals & Nanominerals)
Abstract
:Different techniques (chemical analysis, X-ray diffraction, Mössbauer spectroscopy, UV-Vis-NIR spectrophotometry and chromaticity measurements) were used to study the color variation of feldspathic raw materials after firing at 1200 °C. Two varieties of feldspar-quartz grits (with Na2O or K2O prevalence) doped with synthetic pigments (hematite and rutile) were heat-treated in an oxidizing atmosphere. The results obtained indicate that the color of the ceramic body after firing may not only depend on the presence and analytical content of coloring elements (such as iron and titanium), but on their valence state and the chemical characteristics of the melt itself. The prevalence of larger alkali K+ ions over Na+ ions may cause the reduction of the coordination number of iron. This has a significant effect on the length of the Fe–O bond, which in turn influences the capacity for light absorption of a specific wavelength. The results of spectrophotometric measurements showed pronounced disparity between the raw materials and samples doped with coloring oxides. The introduction of synthetic pigments caused clear changes in the spectral dependence of the total absorbance. The absorbance increased in the whole measuring range, in particular in the visible part of the spectrum. Furthermore, a red-shift of the absorption bands towards longer wavelengths attributed to oxygen-metal charge transfer (OMCT) interactions between Fe3+ and O2− ions as well as to d-d transitions within Fe3+ ions was observed.
1. Introduction
Feldspars are the most common raw materials used as fluxes in the ceramics industry. Compared to other components of the ceramic body (e.g., ceramic clays and quartz), the low melting point of feldspars means that they form a vitreous phase contributing to the sintering of a given mixture of constituents in the course of firing. In Poland, the basic source of feldspathic raw materials (feldspar-quartz) are deposits located in Lower Silesia (SW Poland), in the marginal zone of the Strzegom-Sobótka leucogranite massif. These rocks developed as a result of metasomatic alteration of various types of granite in the contact zone of magma intrusion with surrounding rocks (gabbro, serpentinite and amphibolite) of the Carboniferous age [1]. Metasomatic transformation of the rocks was followed by enrichment of their mineral composition in feldspar minerals (plagioclases and microcline-type perthite).
The major domestic manufacturer of feldspar-quartz commodities is the Strzeblowskie Mineral Mines (SKSM) of Sobótka, operating four deposits of granitoids located in the NW part of the outer zone of the massif. The excavated raw material is characterized by considerable mineral and chemical differentiation and quite a high content of coloring oxides (0.2–0.7% Fe2O3 + TiO2 [2]). To obtain stable and repeatable parameters of commercial product with fixed chemical composition tailored to customer requirements, the raw material is selectively extracted from each deposit. Afterwards, it is examined for chemical composition at consecutive stages of processing (crushing, sieving, and blending). Another crucial parameter that needs to be controlled is the color after firing, as the main customer of these commodities is the domestic ceramic tile industry [3].
The aim of the present study was to assess the influence of chemical composition of the raw material (especially alkalis and coloring oxides) on the color of the sintered body. In addition, this study sought to identify mineral phases that occur as a result of heat treatment of two commercial grades of feldspar-quartz grits from SKSM, with special attention to iron- and titanium-bearing ones, as they are the most common chromophores. The research was also focused on interaction between iron and titanium ions in the course of firing. Appropriate control of the chemical composition of the raw materials used in the ceramics industry has fundamental significance for properties and aesthetic qualities of the final products.
2. Materials and Methods
The raw material from deposits located in the Sobótka region consists of well-characterized mineral components [4,5]. According to previous studies, the main minerals containing coloring elements are: chlorites, micas (biotite, muscovite and sericite), rutile, garnets, feldspars, monazite, zircon, xenotime, epidote (Fe-rich pistacite), magnetite, pyrite and Fe-Ti spinel (titanomagnetite). The basic constituent of the raw materials after firing is the amorphous phase, resulting from thermal decomposition of feldspars and partly quartz, accompanied by single quartz grains and other minerals characterized by high melting temperatures, such as zircon, Fe-Ti spinel, xenotime and monazite [5,6].
The subject of the current research was feldspar-quartz commodities provided by the Strzeblowskie Mineral Mines of Sobótka. The samples represented two commercial grades of feldspathic grits of different moduli K2O:Na2O, i.e., with the prevalence of potassium or sodium particles in the chemical composition (K2O:Na2O = 1.8 or 0.6, respectively, Table 2).
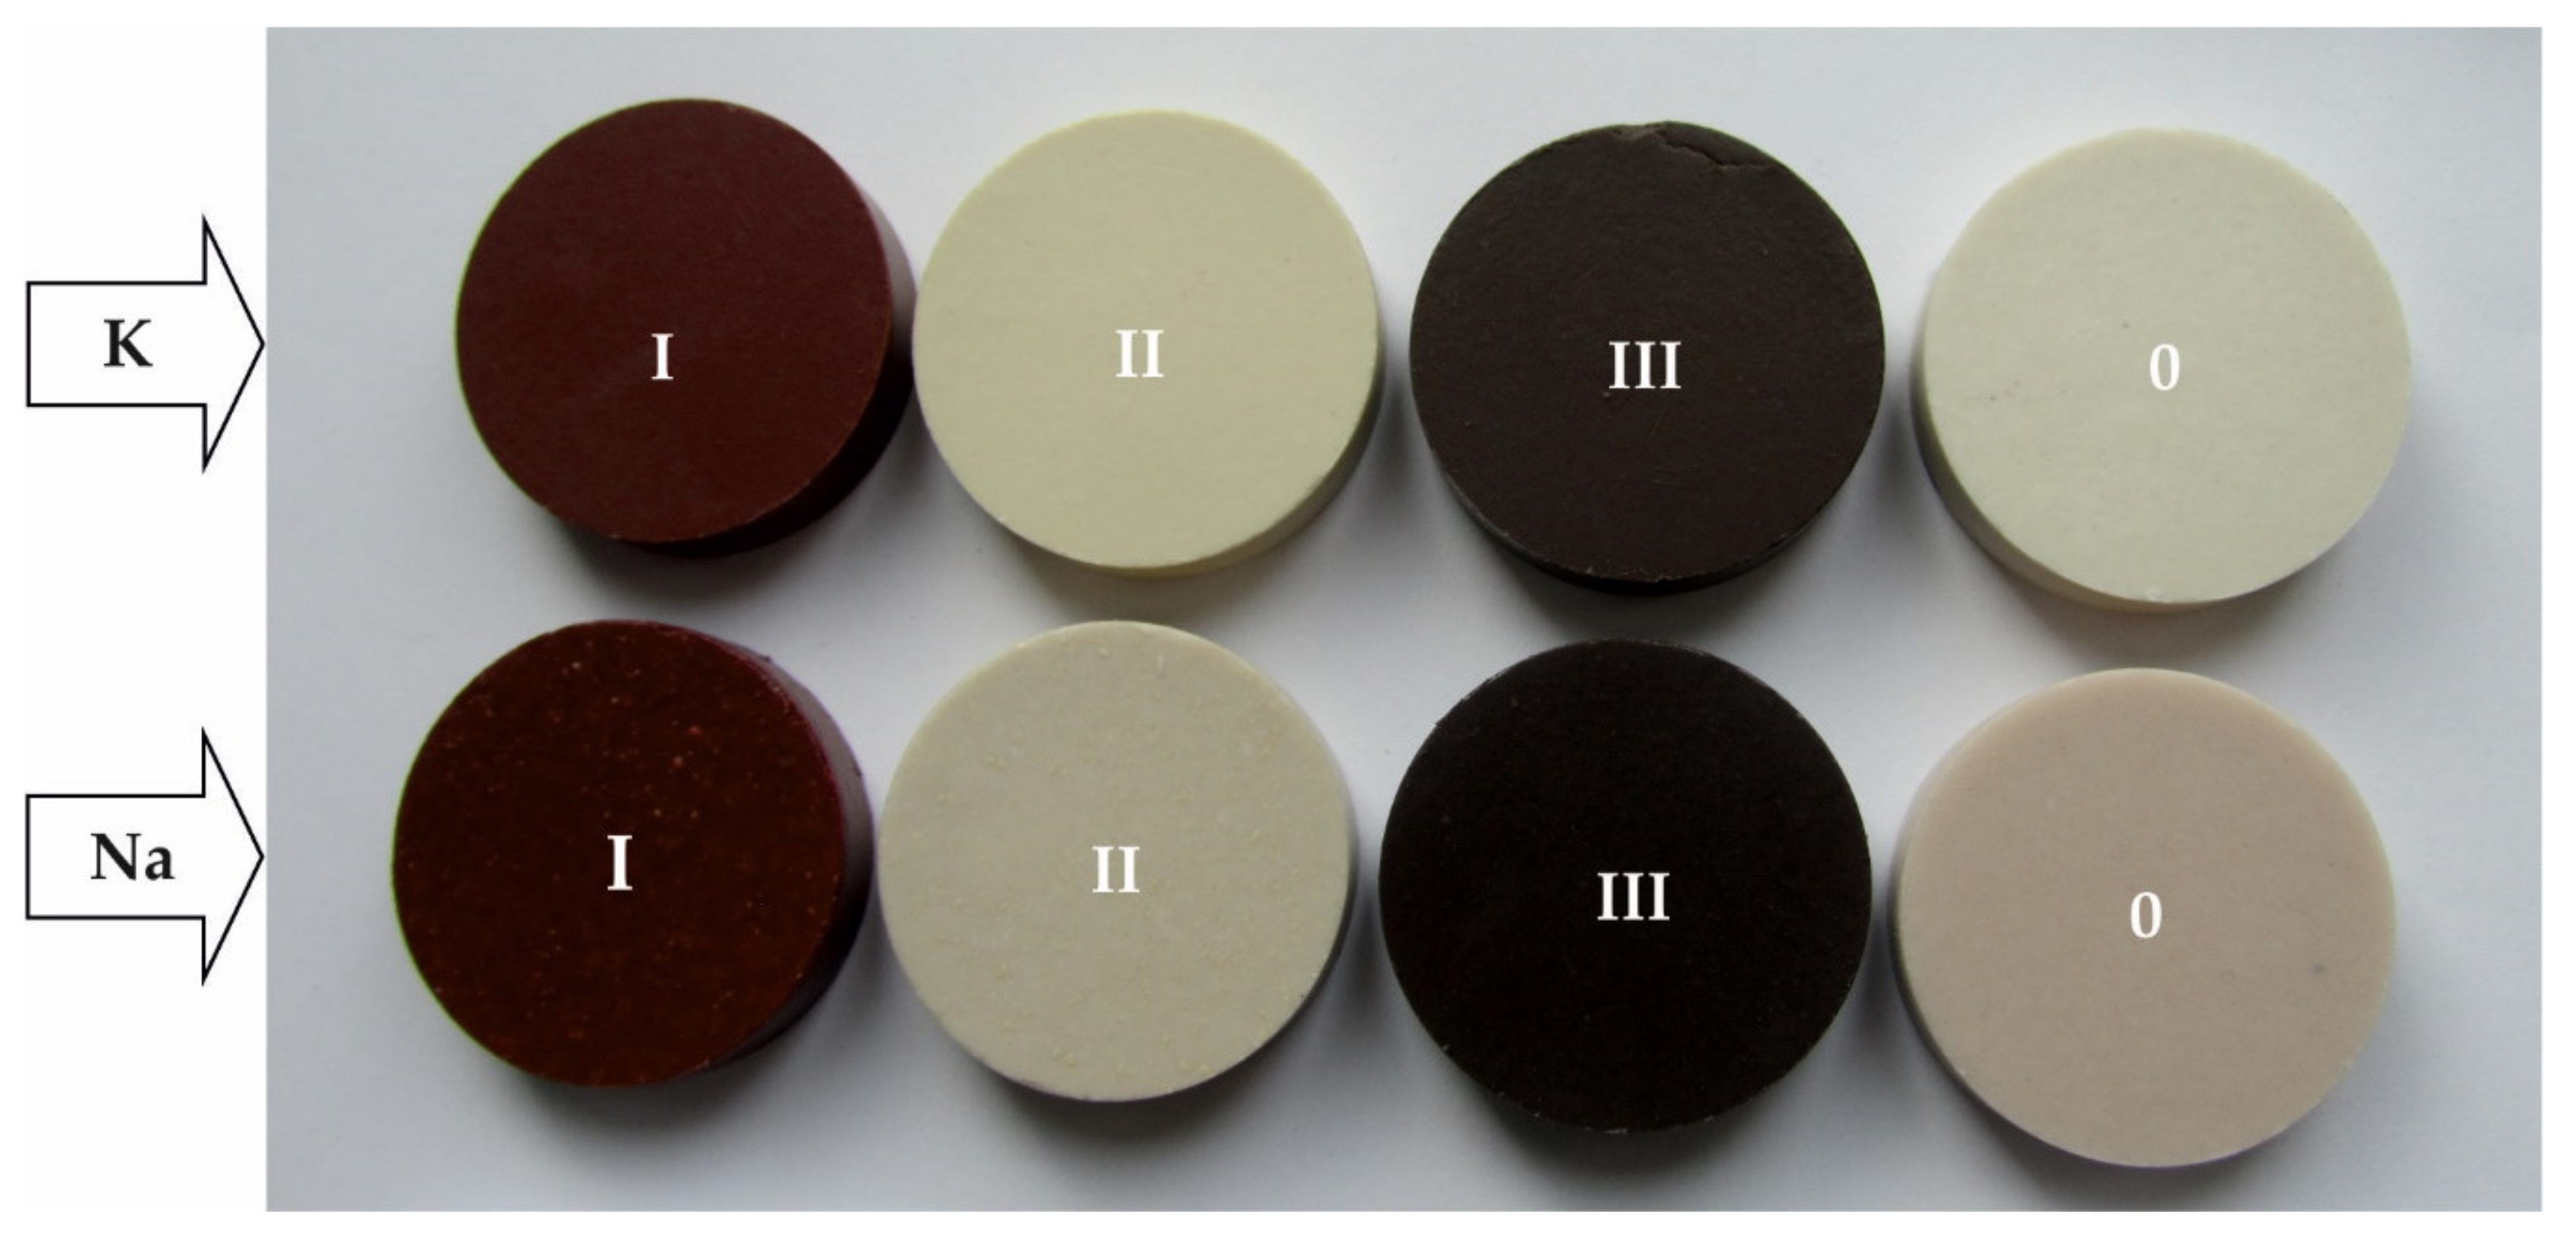
From each type of the raw material there were four samples prepared: the starting/basic ones (marked 0, Figure 1), and three others doped with controlled quantities of Fe2O3—hematite—and TiO2—rutile (designated as I, II and III), as indicated in Table 1. Thorough homogenization of the basic material with coloring oxides was obtained by dry milling in a planetary ball mill for around 40 min. The pigments used in the experiment were synthetic ferric red TP-303 (Nofar) of 99.2% Fe2O3 purity and titanium white Tytanpol ®R-001 of 99.1% TiO2 purity.
The chemical compositions of the studied materials were quantified by the wavelength dispersive X-ray fluorescence method (WDXRF) on a Bruker AXS (Karlsruhe, Germany) S8 TIGER spectrometer with a 3 kW Rh anode X-ray tube. The spectrometer is equipped with a Bruker’s Quant-Express software allowing for standardless analysis of elemental composition of the samples. Quant-Express comprises a customized calibration prepared by Bruker using the feldspar-quartz rock of interest and selected certified reference materials. The accuracy of the measurements was determined by the instrument supplier (Table 2). After grinding (d90 = 53.3 μm) and mixing with a few drops of distilled water, the 20 g portions of the material were pressed into pellets of ca. 40.4 mm diameter and maximum 10 mm thickness in a stainless-steel matrix of a Herzog TP 20 P hydraulic press with a pressure of 100 kN. The pellets were fired for 51 min in an oxidizing atmosphere in an electric furnace (Nabertherm LS 25/13). The maximum temperature 1200 °C was reached in 22 min (starting from room temperature) with a ramp rate of 54.5 °C/min. After 6 min holding time at 1200 °C the samples were quickly cooled down to 95 °C at a rate of 48.04 °C/min (for 23 min) in a furnace with integrated fans, then removed to air-cool to room temperature. These conditions (temperature and time) are usually adopted in the current fast-firing technology of ceramic tile production. After cooling, the samples were examined by X-ray diffraction, Mössbauer spectroscopy, UV-Vis-NIR spectrophotometry and chromaticity analysis.
The mineral phases were identified by X-ray powder diffraction (XRD). The data were collected by a Rigaku MiniFlex 600 X-ray diffractometer (Neu-Isenburg, Tokyo, Japan) with the curved crystal graphite-monochromatized CuKα radiation, operating with a voltage of 40 kV and an emission current of 15 mA. XRD patterns were recorded in the angular range 3–75° 2Θ with a step size of 0.05°, counting time 1 s per step. The examinations were performed for feldspar-quartz samples of both types, before and after firing.
The Mössbauer spectra were collected using the RENON MsAa-3 spectrometer equipped with LND detector with Kr filter and laser interferometer He-Ne at room temperature [7]. A commercial 57Co (RH) isotope was used as a source of radiation. All spectra shifts were reported versus the total shift in α-Fe. The obtained spectra were processed by the MOSGRAF-2009 software. There were four samples analyzed: two samples of sodium feldspar-quartz doped with one and two coloring oxides (I Na and III Na) and two corresponding samples of potassium feldspar-quartz (I K and III K).
The optical properties of selected samples after firing were analyzed based on the spectral dependence of the absorbance (A). The spectra were recorded in a broad wavelength range (λ) of 220 to 2200 nm with a Jasco V-670 UV-VIS-NIR double-beam spectrophotometer equipped with a dedicated 150-mm integrating sphere to perform the measurements of the total absorbance. The measured parameter was the reflectance (scale 0–100%), which was converted into the absorbance and analyzed. Such a calculation was feasible because the samples thickness was incomparably greater than the wavelength of the light used (10 mm vs. 220–2200 nm). The integrating sphere was coated with barium sulfate and the spectra were referenced against white standard—Spectralon. The applied speed was 200 nm/min with a step of 0.5 nm.
A portable Konica Minolta CM-2300d spectrophotometer was used to determine the chromatic coordinates of fired samples. The Konica Minolta CM-2300d instrument of spherical type with horizontal alignment, is suitable for complex color analysis in the visible wavelength range (400–700 nm). Color coordinates L*, a* and b* values of the specimens were obtained in CIE 1976 (Commission Internationale de l’Éclairage) space, where L* refers to darkness-brightness (0–100), a* to the red (a* > 0) or green (a* < 0), and b* to yellow (b* > 0) or blue (b* < 0).
3. Results
3.1. Chemical Composition
Table 2 lists the chemical composition of the studied samples. The difference in K2O, Na2O and Al2O3 content between samples of sodium and potassium influences the amount of amorphous phase during firing. Furthermore, the basic potassium sample (0 K) contains slightly less Fe2O3 and TiO2, which are the main color contributors, as compared to its sodium counterpart (0 Na).
3.2. The XRD Analyses
The X-ray diffraction analyses of the studied samples only provided information on the main mineral phases because many of the peaks corresponding to minor phases coincided with major ones. The predominant crystalline phases of the raw (unfired) sample of sodium feldspar-quartz (marked Na raw) were: albite (d—4.02, 3.78, 3.67, 3.19 and 2.93 Å) and β-quartz (d—4.29, 3.35, 1.82 and 1.54 Å), as well as—albeit less numerous—microcline (d—4.26, 3.84, 3.48, 3.28 and 3.24 Å) (Figure 2). In addition, some faint reflections of illite (d—10.0, 4.46, 3.36 and 2.86 Å) and kaolinite (d—7.05, 4.48, 3.58, 3.85 and 2.55 Å) were also registered. The diffraction pattern of the sample after firing (0 Na) evidenced the presence of a characteristic amorphous hump within the 2Θ 15–40° range associated with the existence of the glassy phase, as well as remnants of quartz and albite that were not completely melted. Some small peaks indicating the secondary mullite (probably) precipitation were also registered (d—5.37, 3.43, 3.37 and 1.46 Å). Sodium-rich variety samples doped with synthetic pigments (I Na and III Na) gave weak hematite peaks (d—2.69, 2.51, 1.68 and 1.46 Å) and a much larger hump of an amorphous phase, which arose mainly at the expense of albite. The thermal decomposition of albite may be attributed to a high iron oxide content. It is well known that in silicate melts iron may occur in both oxidation states, as Fe2+ and Fe3+ ions [8,9], of which Fe2+ acts as a network modifier (flux) and thereby lowers the melting point and viscosity [10,11].
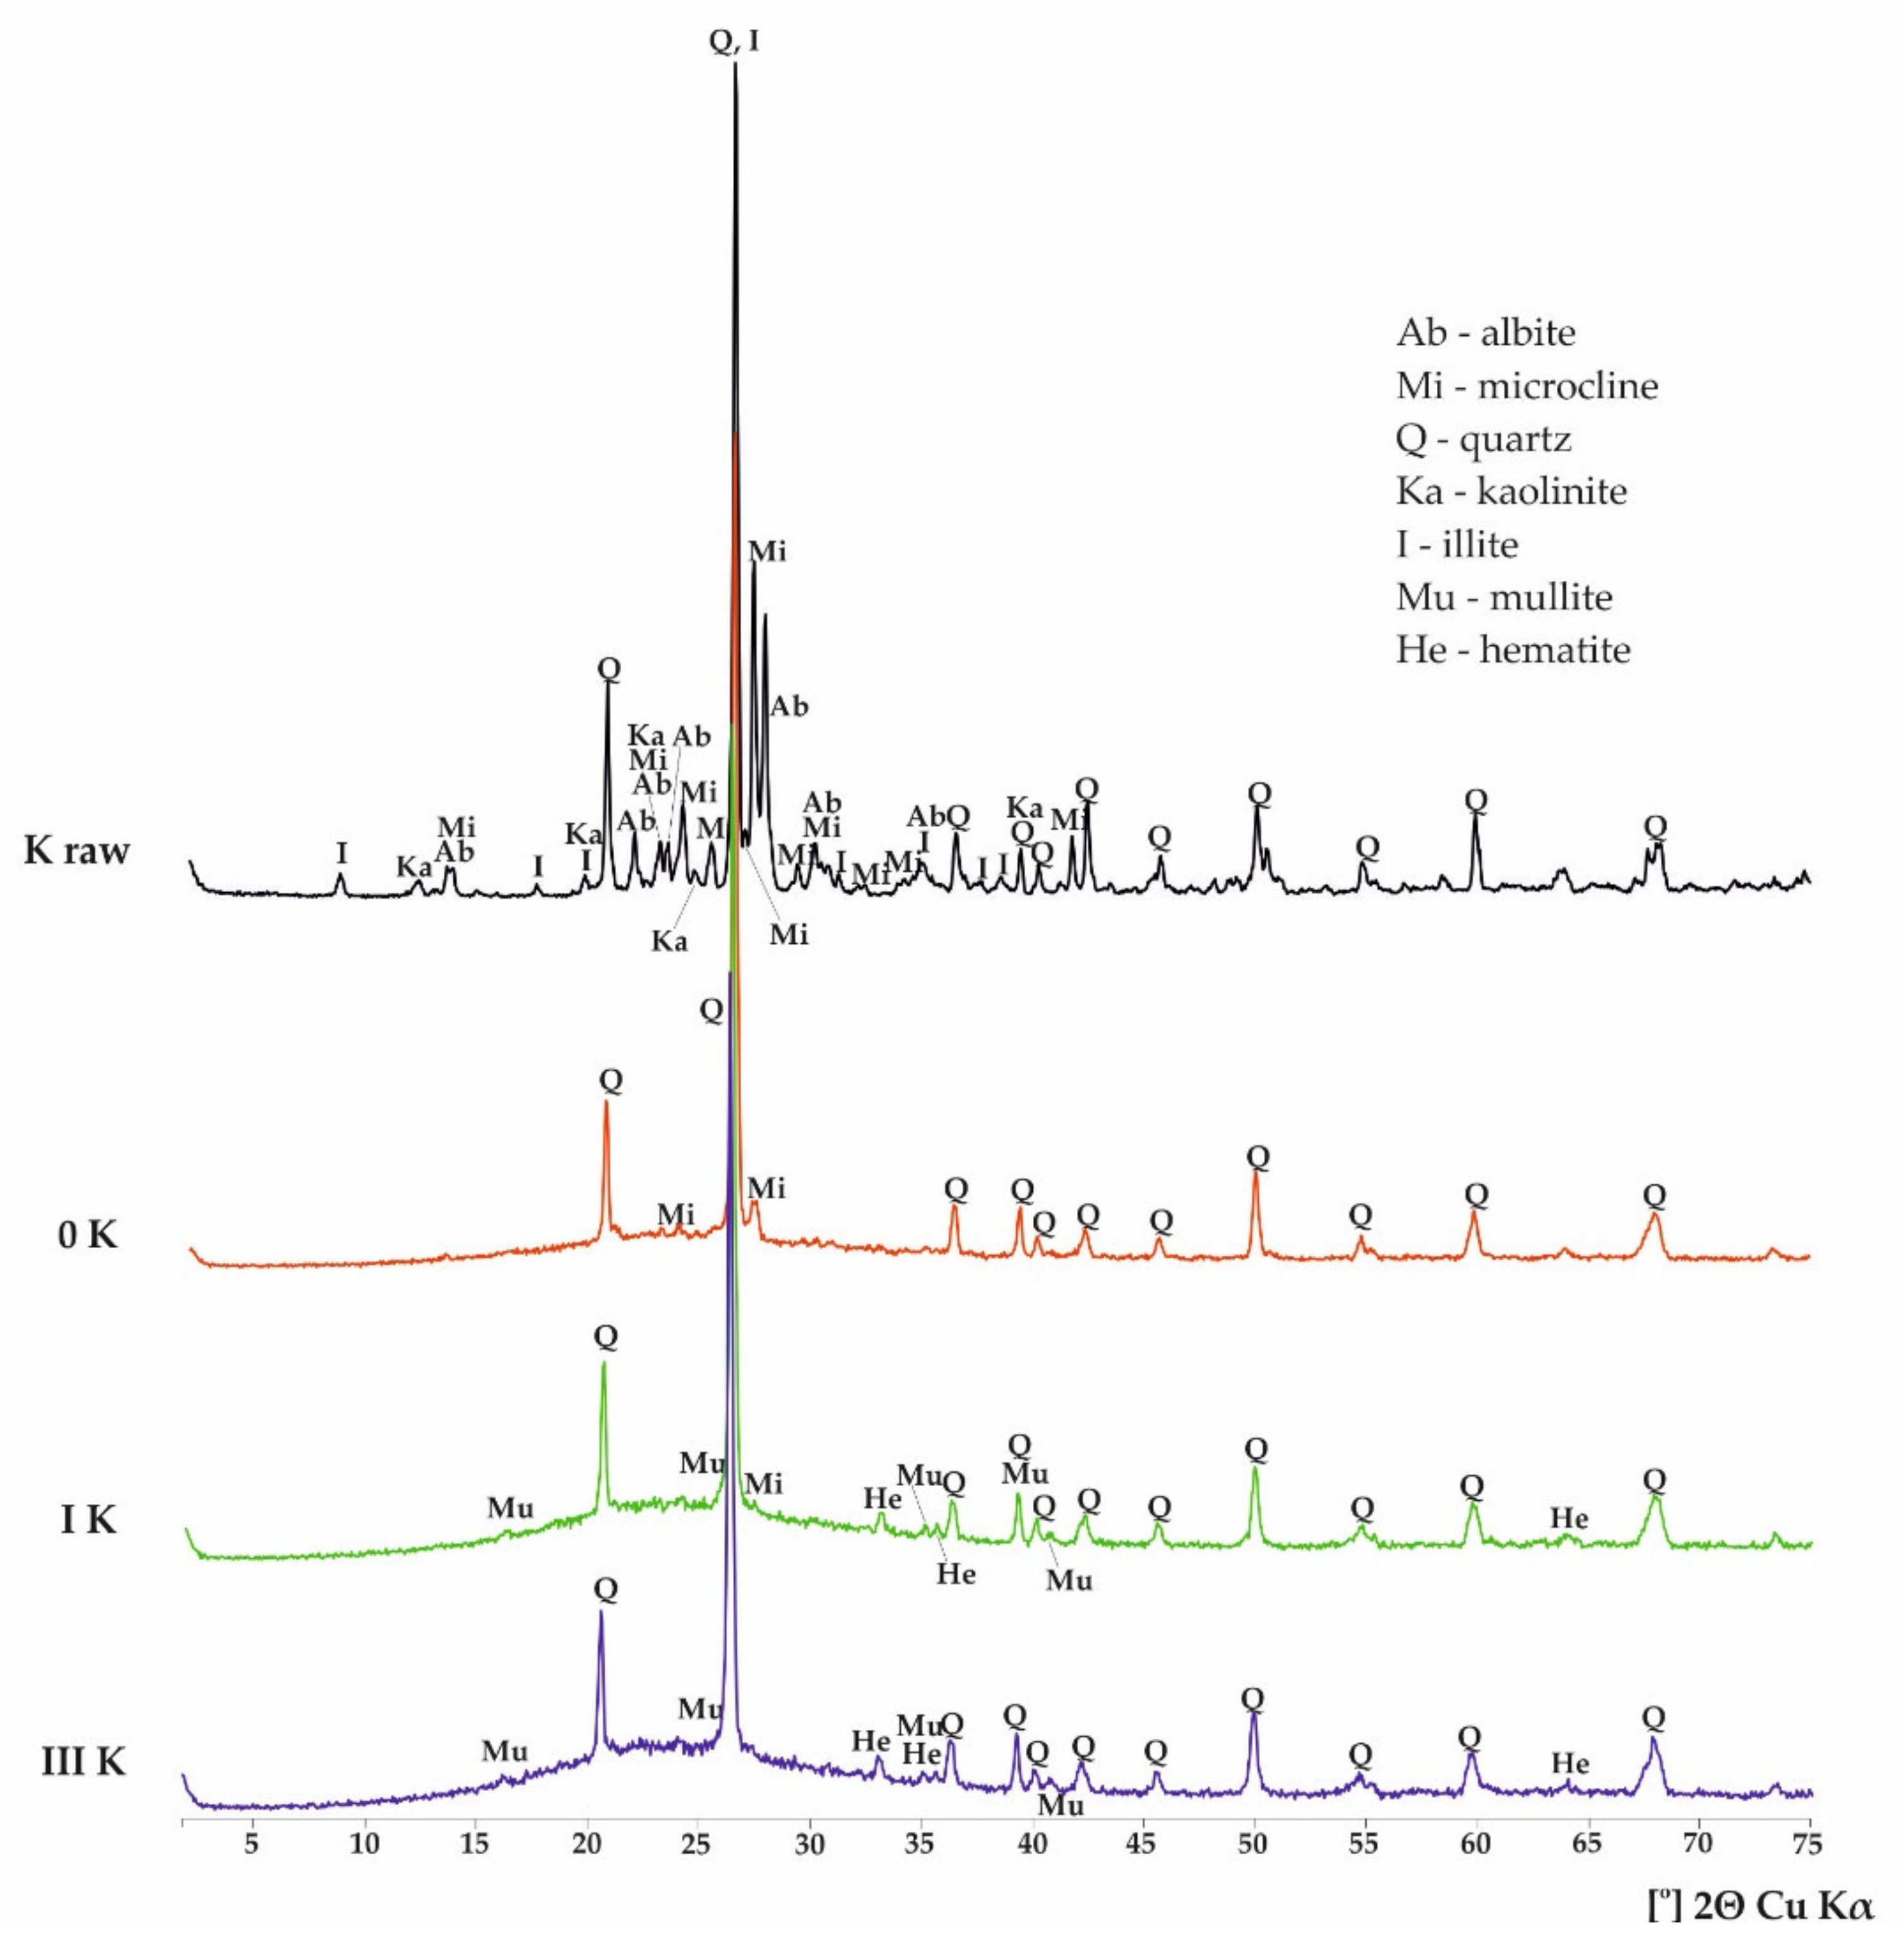
According to the XRD analysis of the unfired sample of the potassium variety raw material (K raw) its main mineral phases are: β-quartz (d—4.26, 3.34, 2.46, 1.82 and 1.54 Å) and microcline (d—4.20, 3.83, 3.30, 3.24, 3.02 and 2.96 Å) (Figure 3). Some smaller reflections of albite (d—4.03, 3.83, 3.77, 3.66, 3.19, 2.95 and 2.56 Å), accompanied by illite (d—10.05, 4.48, 3.35, 2.86 and 2.57 Å) and kaolinite (d—7.20, 4.48, 3.85, 3.58 and 2.56 Å) were also registered. The X-ray pattern of the sample after firing (0 K) shows some amorphous phase formation (but in much smaller amounts than with the sodium variety sample) and the disappearance of the majority of peaks (especially of illite, kaolinite and albite), except for reflections of quartz and some microcline, the intensity of which weakened markedly. The relatively smaller amorphous phase hump may be a result of the higher melting temperature of potassium feldspar and the smaller alkali content in comparison with sodium samples (8.01% and 8.97% K2O + Na2O, respectively). Pure albite Na[AlSi3O8] melts congruently at 1118 ± 3 °C, while potassium feldspar K[AlSi3O8] melts incongruently at 1150 ± 20 °C, forming the liquid phase containing leucite and silica [12,13]. The latter is characterized by much higher viscosity than the liquid phase arising in the course of heat treatment of sodium feldspars [14]. Thus, at high temperatures, the glassy phase forms slower and in smaller quantities.
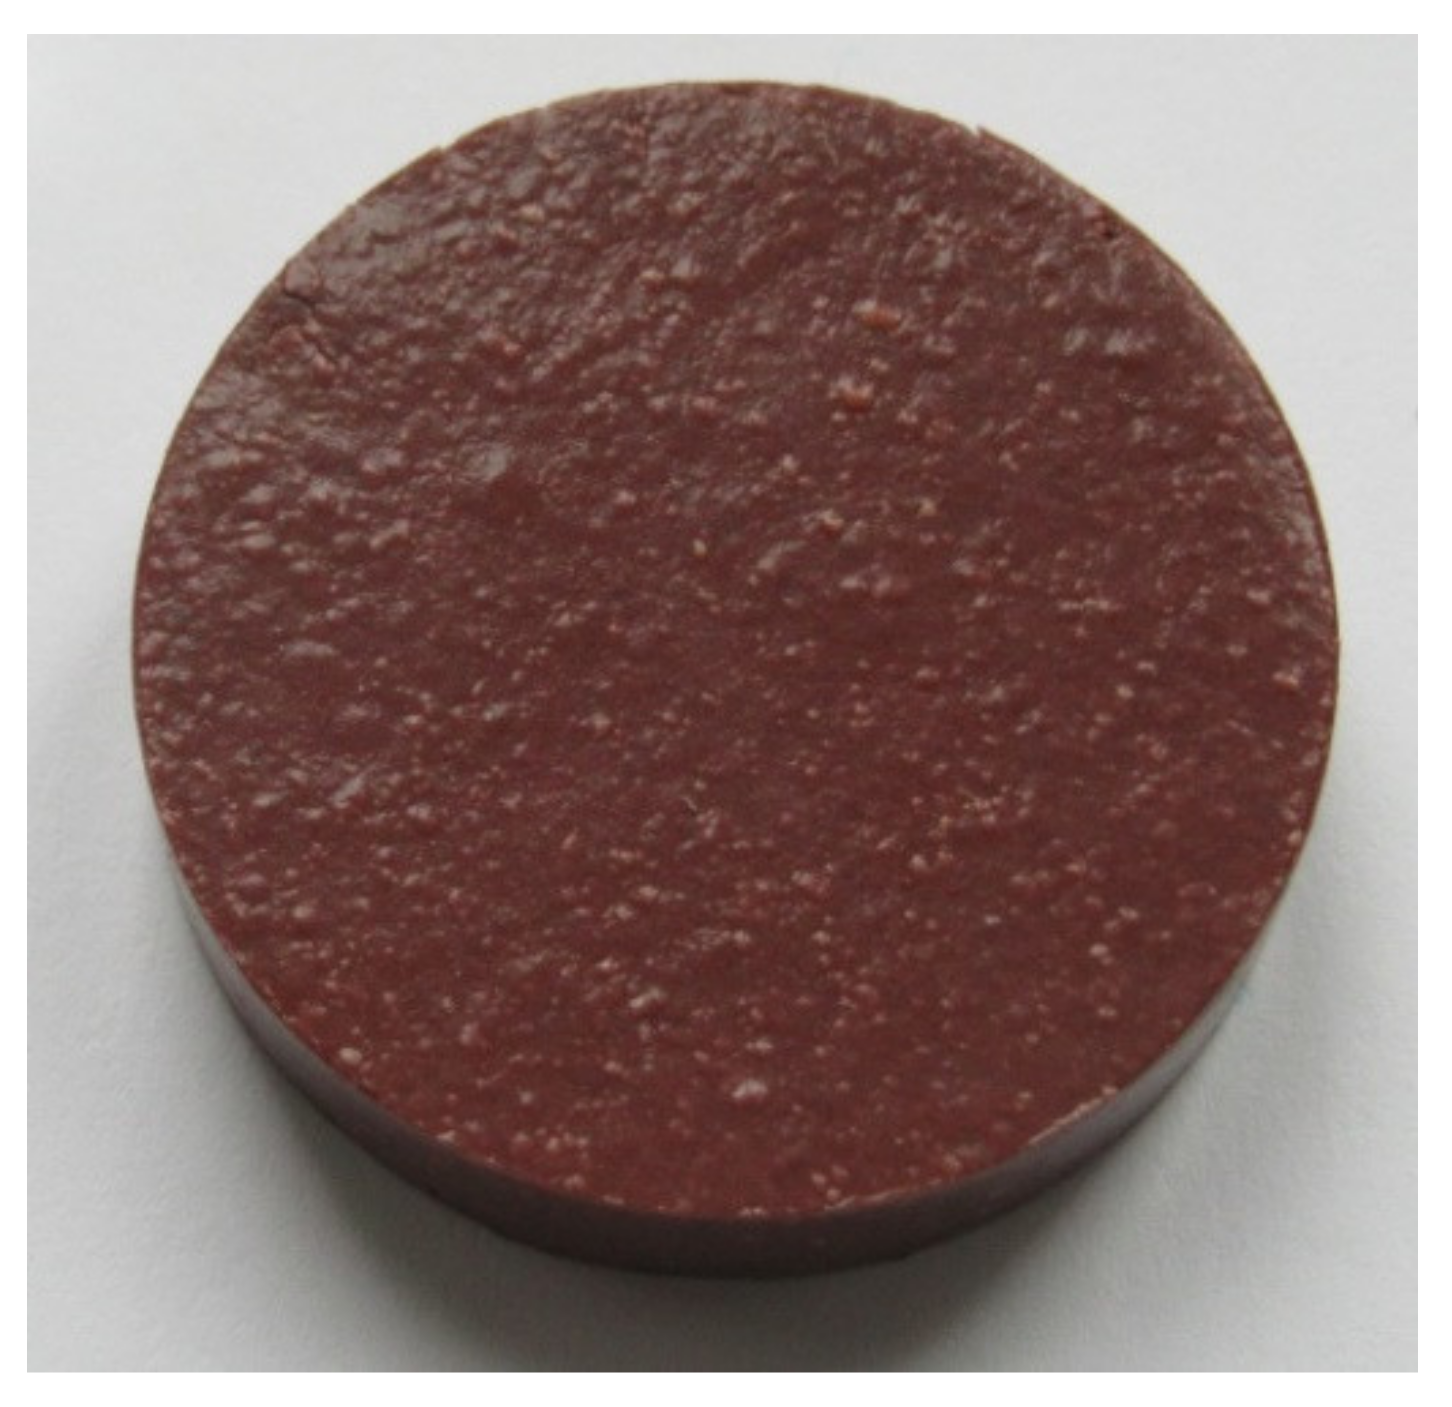
The addition of coloring oxides (I K and III K samples) resulted in the decay of microcline reflections and the appearance of small peaks of mullite (d—5.37, 3.40, 3.39 and 2.29 Å) and of hematite (d—2.69, 2.51, 2.20 and 1.68 Å, albeit of lower intensity than in the X-ray pattern of corresponding sodium samples), as well as raised hump of amorphous phase. The reasons for these differences were similar to the sodium-type material (divalent iron acting as a flux); however, the amount of amorphous phase was notably lower. The peaks of mullite are weaker in the X-ray diffraction pattern of the potassium samples after firing due to the fact that their thermal decomposition takes place at higher temperatures than alkaline feldspars rich in Na2O. When it comes to sodium feldspars, they turn into the liquid phase faster and secondary mullite crystalizes earlier and more easily. Melting at lower temperature resulted in numerous bubbles that appeared on the surface of the I Na sample (Figure 4), while the surface of the I K pellet was almost free of such irregularities. The peaks of rutile or other titanium phases were not identified. This was probably due to their concentration below the detection limit of the XRD method.
3.3. Mössbauer Spectroscopy
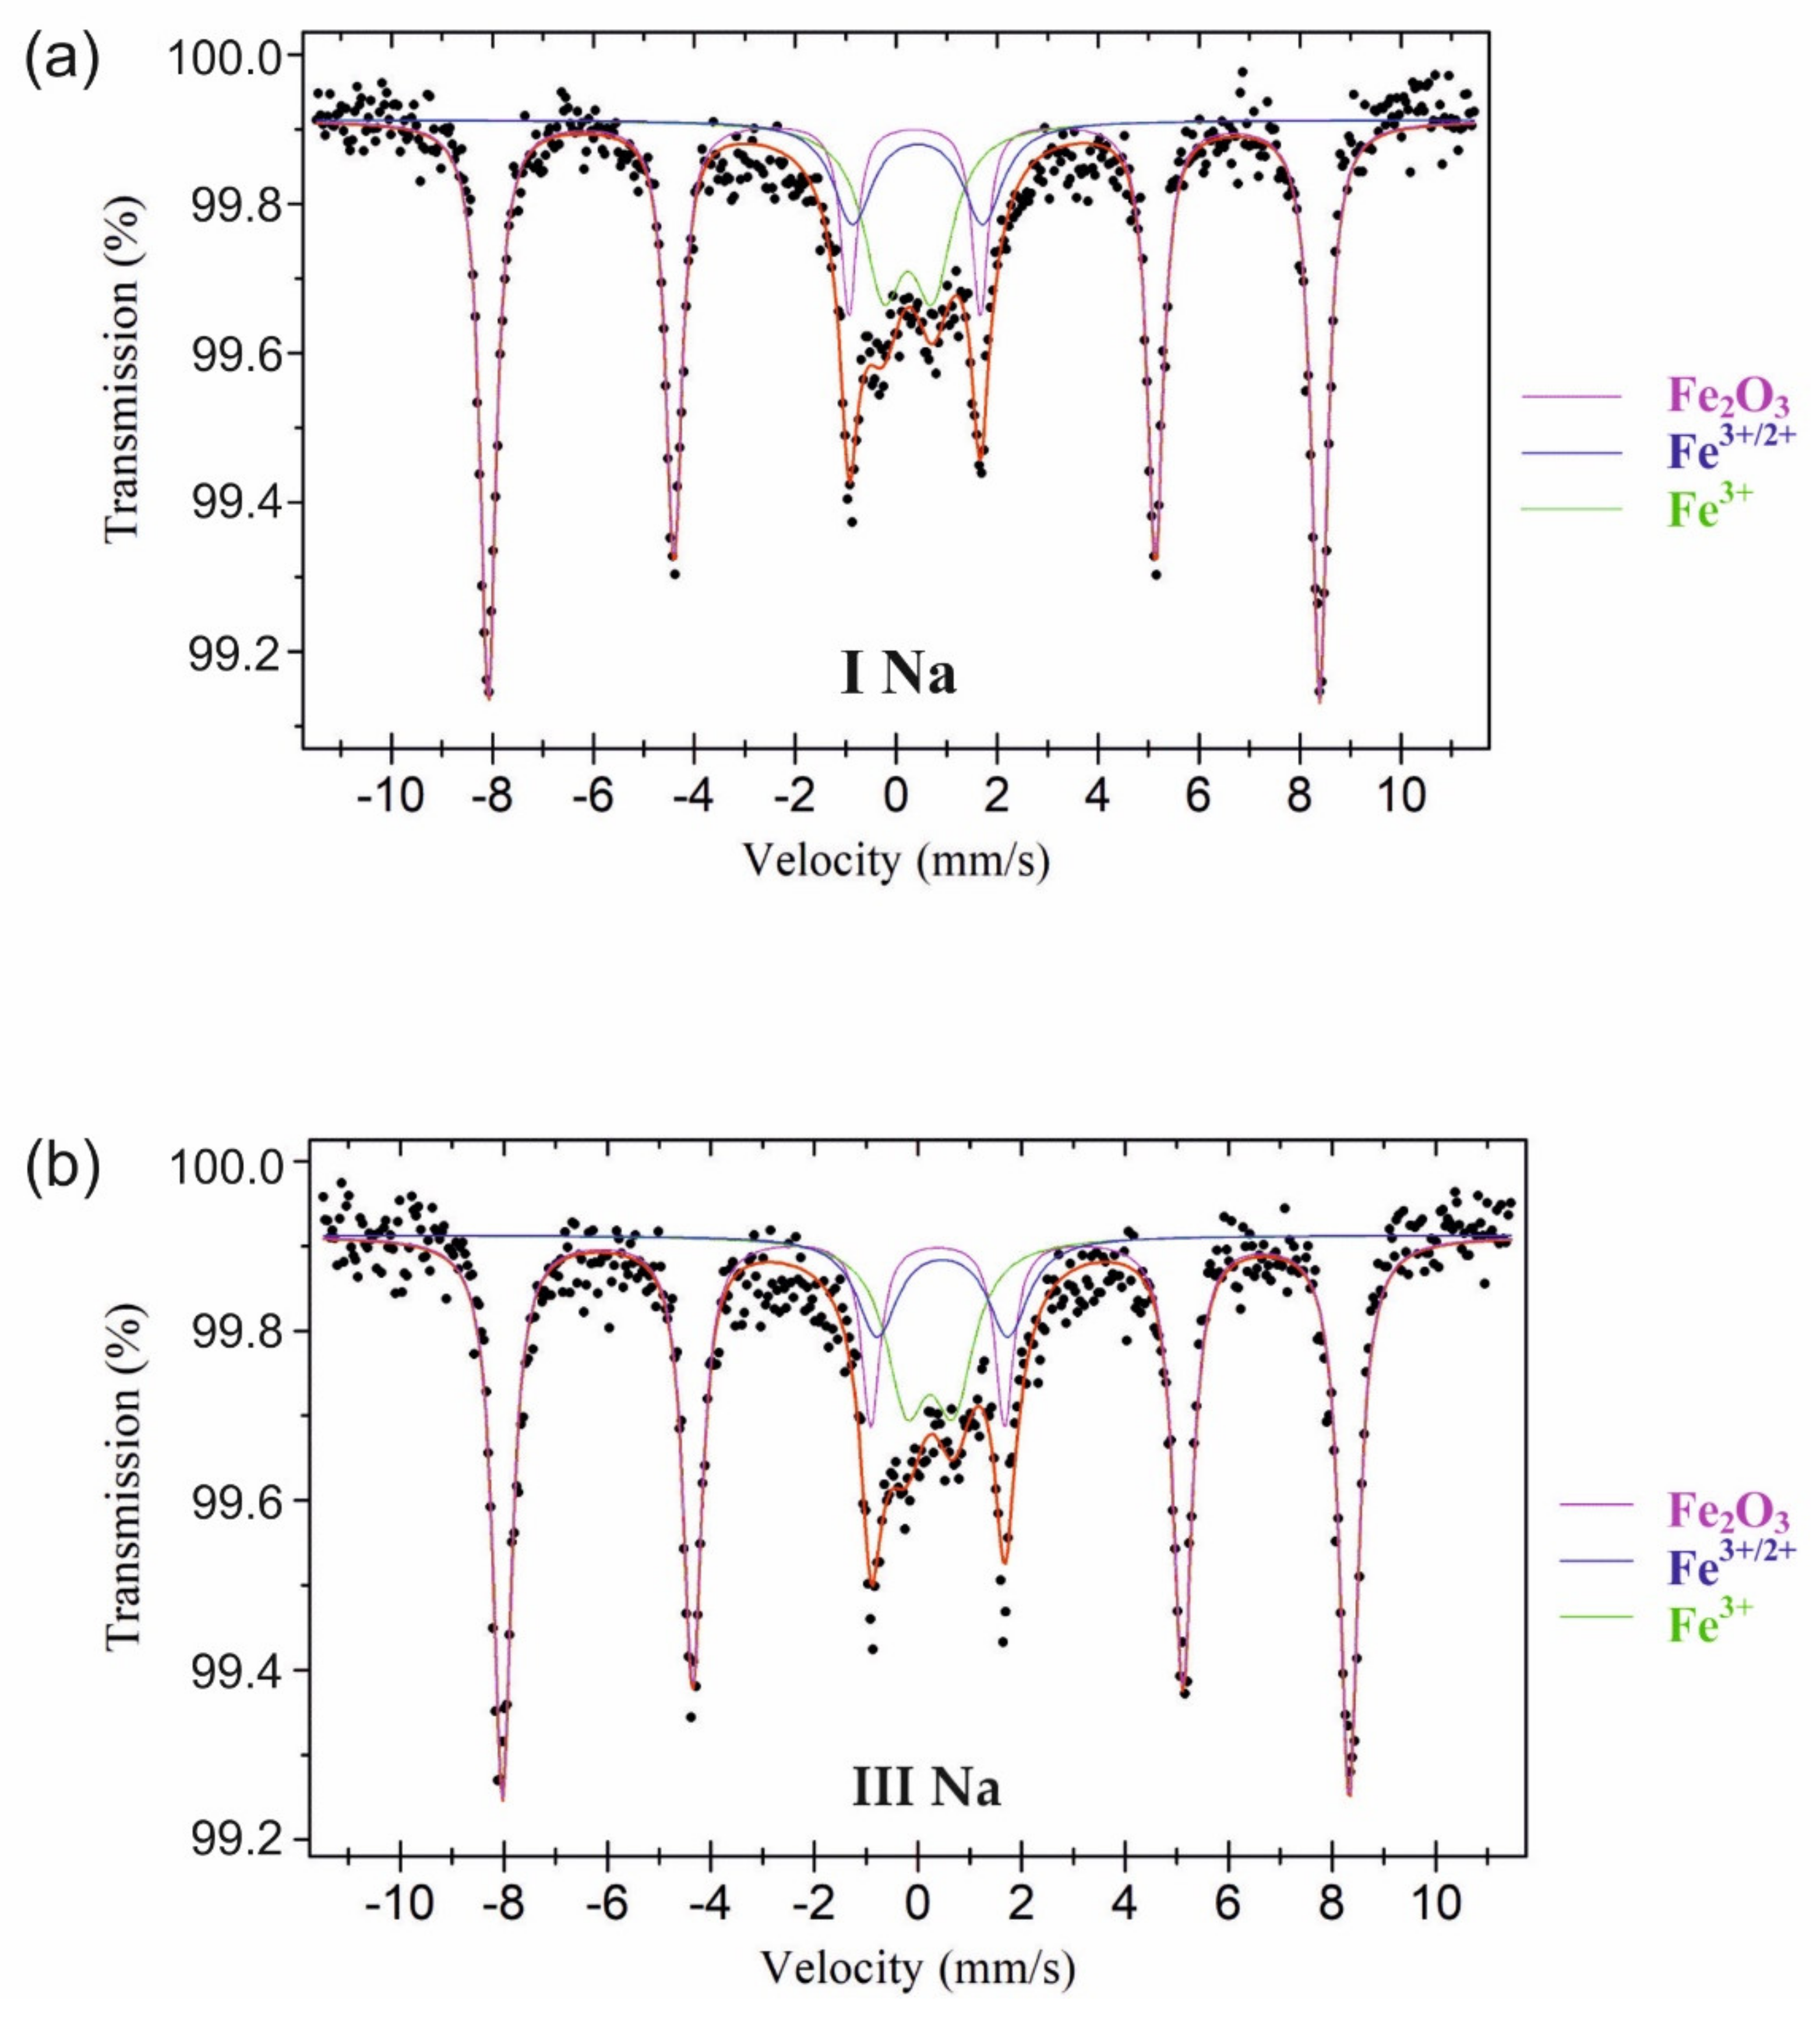
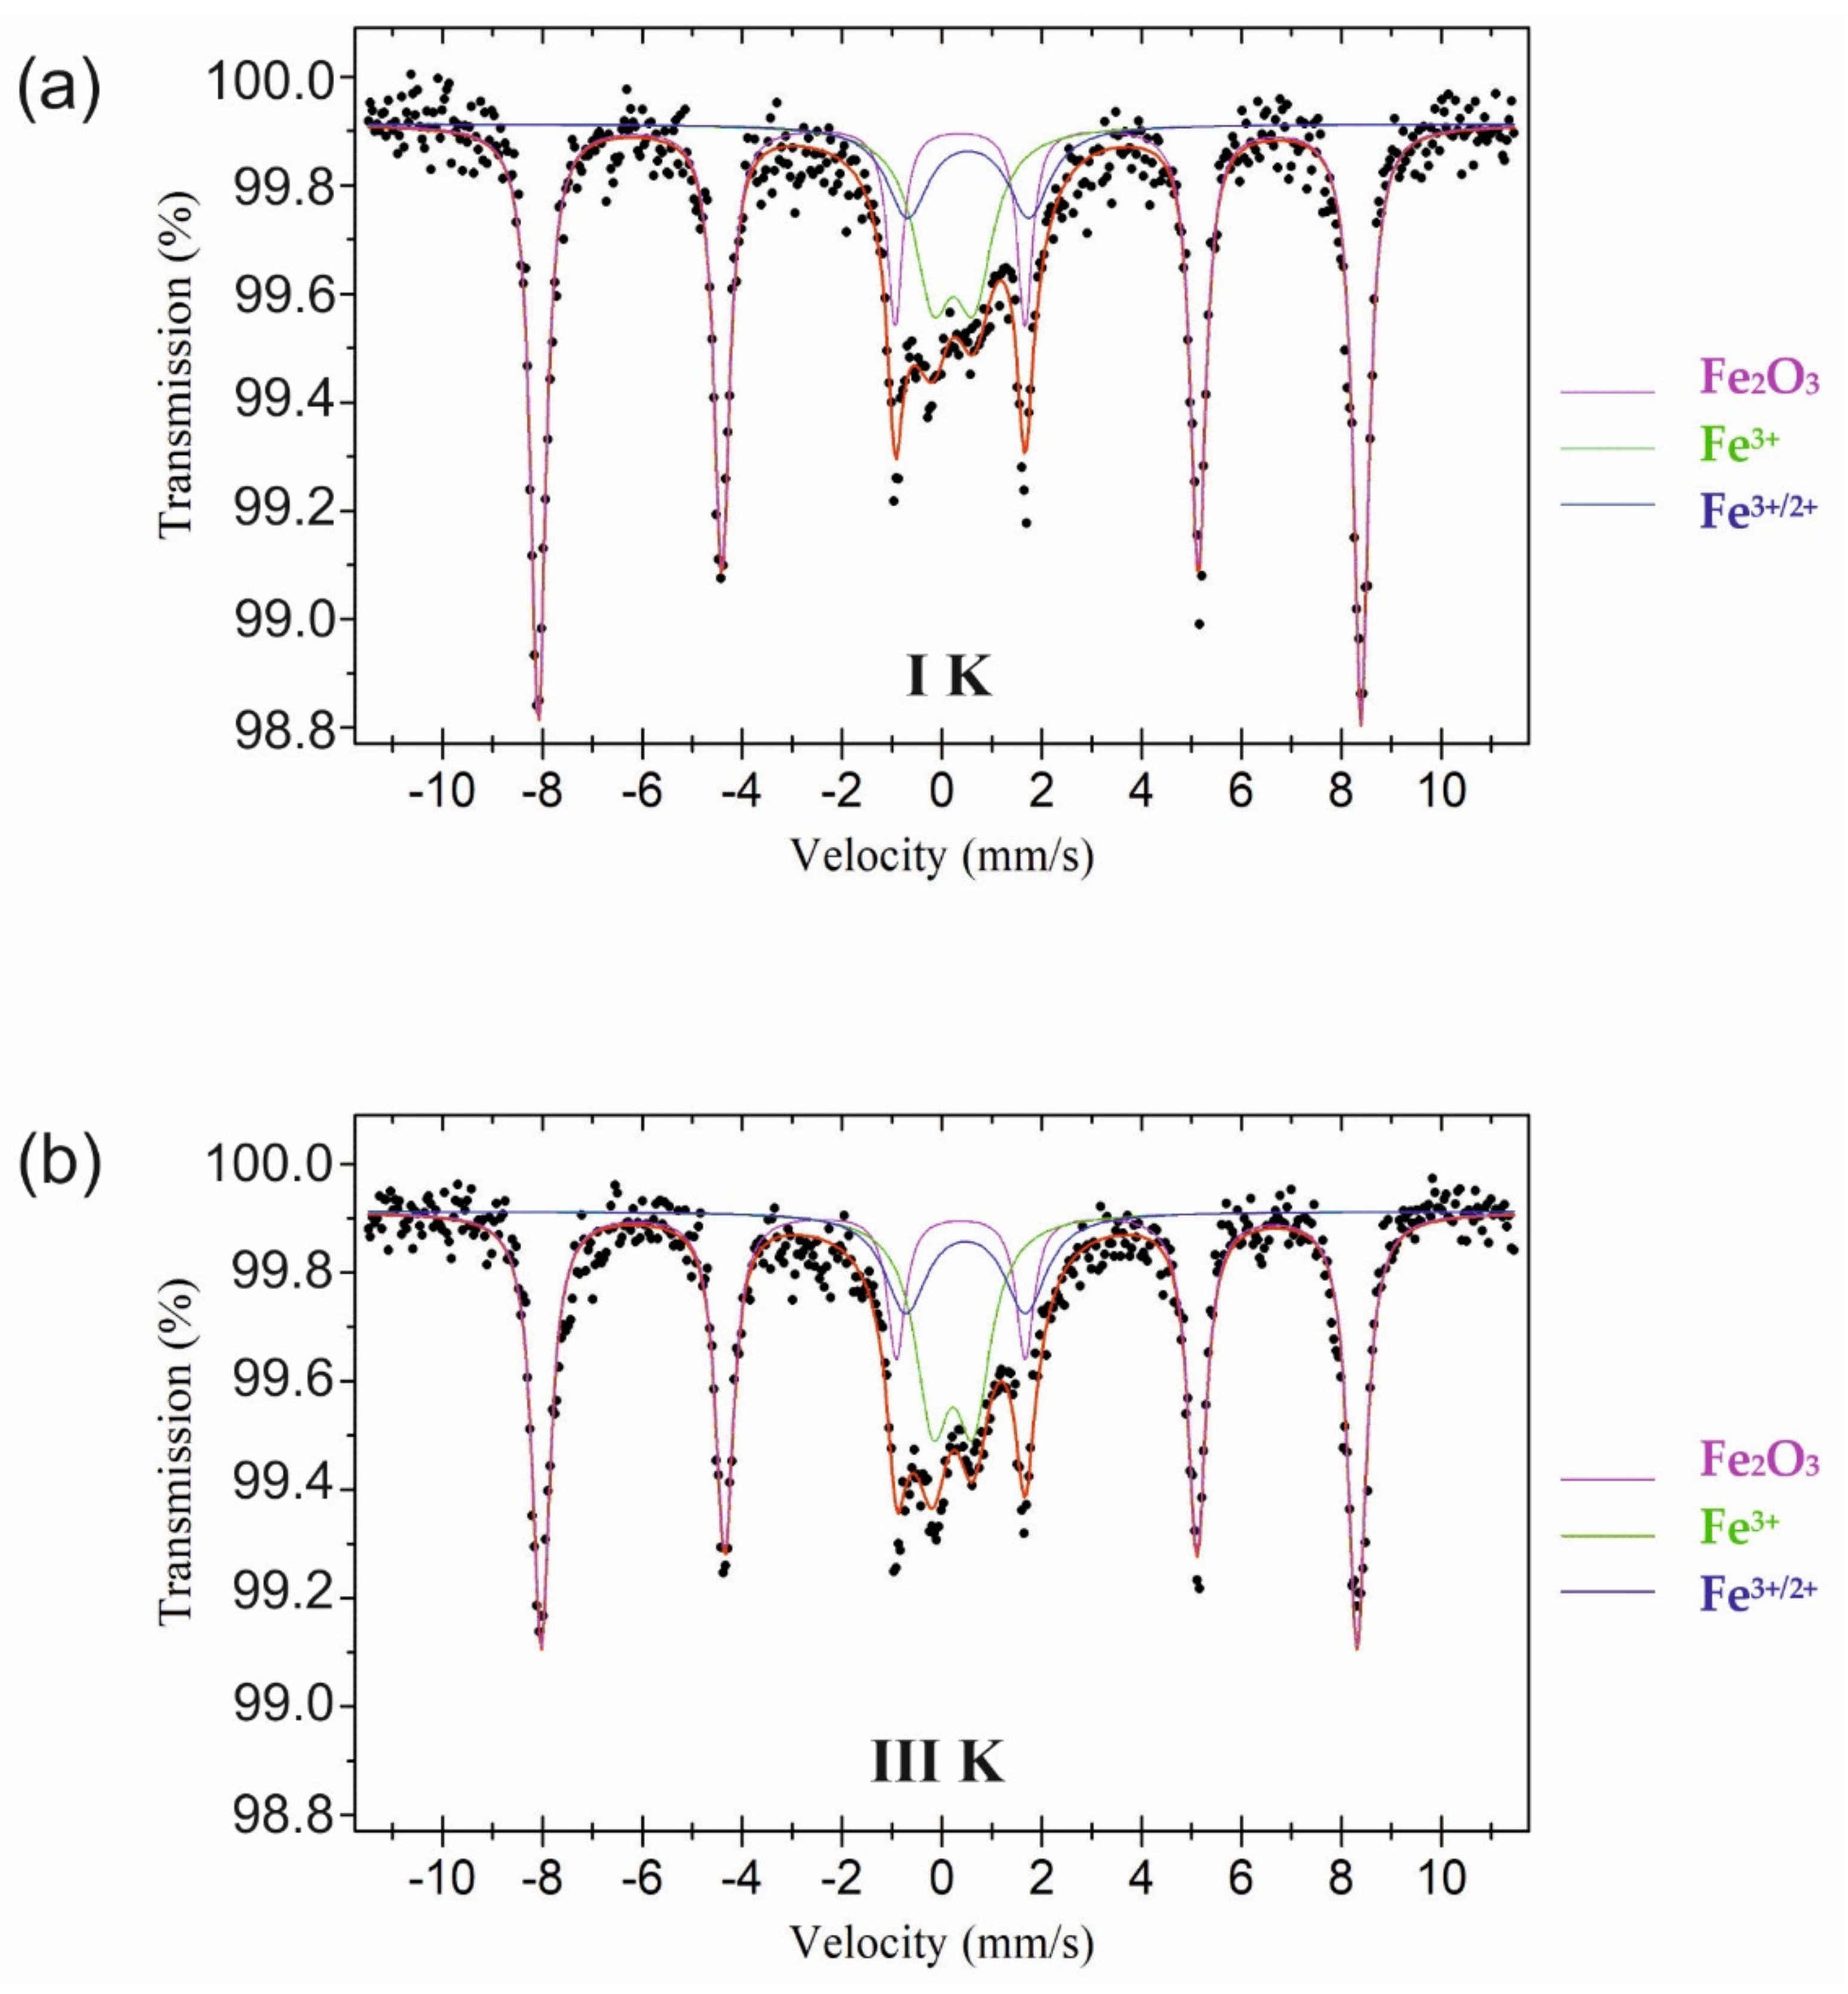
The Mössbauer spectra of both feldspar-quartz varieties doped with synthetic pigments were fitted with three components: one sextet of Fe2O3 and two doublets of Fe3+ and of Fe3+/2+, respectively. The sextet of well crystalized hematite with characteristic hyperfine parameters, i.e., isomer shift IS (0.37 mm/s), quadrupole splitting QS (−0.21 and −0.23 mm/s) and magnetic field B (around 51 T), accounts for around 2/3 (60–68%) of the spectra area (Table 3, Figure 5 and Figure 6). Undeniably, this should be linked to the added synthetic hematite, and possibly to iron ions released from the lattice of other minerals at elevated temperatures that form fine iron oxide particles dispersed in the aluminosilicate matrix [15,16,17,18].
The isomer shift of doublets of Fe3+ ions, i.e., IS = 0.33–0.34 (Table 3), is typical for iron oxide compounds [17,18]. However, according to some references, the iron phases present in the raw material can decompose in the course of firing and then iron can be partly or completely diluted in the liquid aluminosilicate phase (at the atomic level) with no separated iron oxide phase [15,18,19] or may be incorporated into the lattice of mullite, substituting for Al3+ [20].
Other components of the analyzed Mössbauer spectra, i.e., doublets of Fe3+/2+ are characterized by a quadrupole splitting of about 2.39–2.57 mm/s typical for Fe2+ (around 2.5 mm/s) and by an isomer shift of about 0.54–0.63 mm/s assigned to Fe3+ in octahedral site (CN = 6). The values of IS are generally in accordance with data in the literature, i.e., 0.35–0.55 mm/s [21] or 0.28–0.50 mm/s [17]. Their relative content ranged from 13% to 16% (Table 3). The presence of Fe3+/2+ may be a result of the reduction of some Fe3+ ions to Fe2+ due to their substitution by Ti4+, following the charge compensation rule [22], as well as of the equilibrium of the Fe3+/Fe2+ with the atmospheric partial pressure of oxygen (pO2) [23]. The quadrupole splitting value, which gives the information about local symmetry disorders in the crystal lattice, is much higher for Fe3+/2+ (2.39–2.57 mm/s) than that for Fe3+ (0.81–0.98 mm/s). This can be linked to possible interactions between Ti and Fe cations (the higher QS, the lower symmetry of the electric charge distribution). Another possible explanation of Fe3+/2+ presence is in line with the observations of Bingham et al. [24], according to which the clusters of Fe2+–Fe3+ cations can occur in the melts rich in Fe2O3. Clustering may include Fe2+–O–Fe3+ and Fe3+–O–Fe3+ interactions.
The contributions (percentages) of the 57Fe Mössbauer spectral components described above were designated as the area contributions of the corresponding sub-spectra to the whole cross-section of the spectrum. It should be kept in mind that area contributions of the Mössbauer signals discussed here do not necessarily reflect the actual concentrations of the different iron states. Different bond properties of the iron atoms in their lattice positions lead to different Mössbauer-Lamb factors (MLF), which give rise to different intensities of the Mössbauer signals. In this study, the area contributions of the Mössbauer spectral components are shown and discussed without correction for the possible different values of the MLF, but in fact the MLF for considered materials should have quite similar values and the effects of differential MLF could lead to errors of about 15% for the Fe3+/Fe2+ ratio [25,26].
The relative shares of various forms of iron in the spectra of I K as compared to III K sample, differ from each other: hematite in I K sample is 66% while in III K it is 60% (Table 3). This appears to be related to the presence of TiO2 and possibly to the potassium nature of the aluminosilicate melt (it is worth noting that the spectra of I Na and III Na samples are almost identical). However, based on the results of Mössbauer spectroscopy measurements, neither the titanium role nor titanium and iron interaction in the case of samples marked III of both varieties of raw materials, can be elucidated.
3.4. UV-Vis-NIR Absorbance Spectra
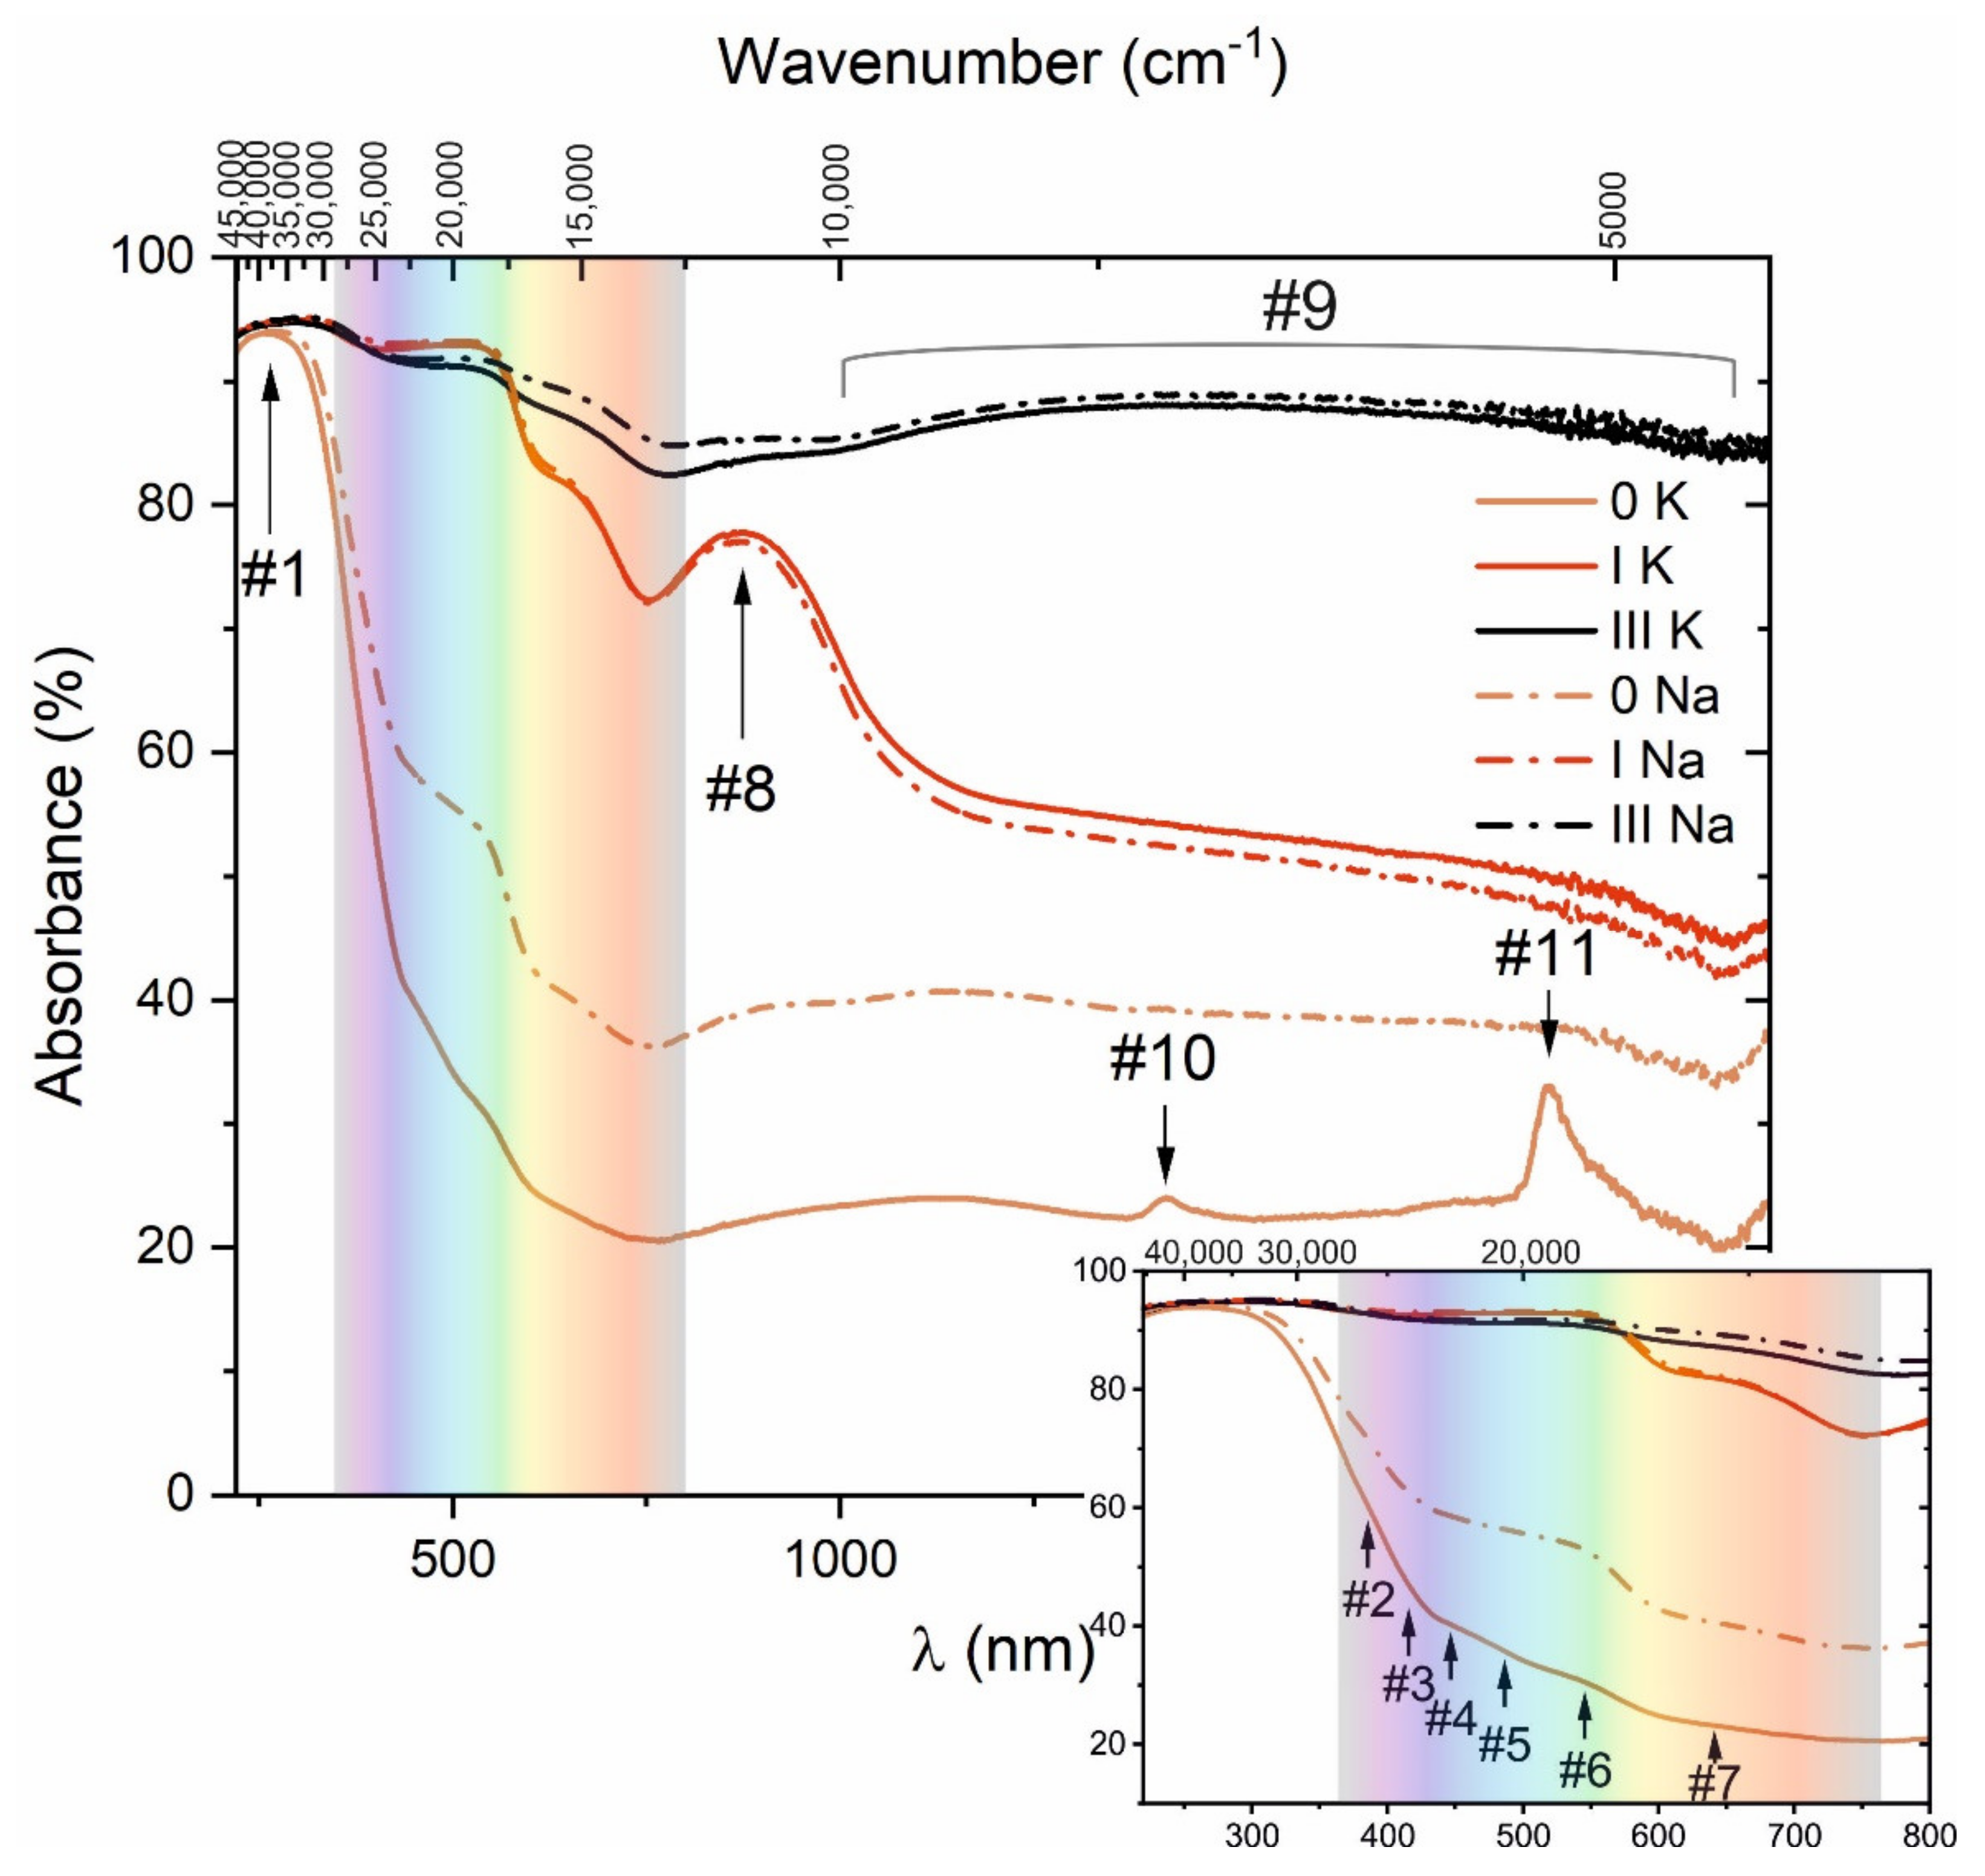
Spectral dependence of the total absorbance in the wavelength range from 220 to 2200 nm measured for selected feldspar-quartz samples after firing is presented in Figure 7. The spectral line shapes of both examined raw material varieties (0 Na, 0 K) are typical for these types of feldspar [27,28]. The presence of a small amount of Fe2O3 in the raw materials (0.30–0.36%) gives a clear manifestation in their optical spectra. In the UV region, a distinct absorption band centered at 262 nm (marked #1) can be observed. It may be assigned to ligand-to-metal charge transfer transitions taking place between O2− and Fe3+ ions (OMCT) probably in an octahedral FeO6 cluster [20,29]. The visible region of the absorbance spectra shows a series of small bands that can be ascribed to d-d transitions within Fe3+ ions. They appear at: 384 (#2), 413 (#3), 448 (#4), 487 (#5), 545 (#6), and 642 nm (#7). These bands may be attributable to Fe3+ ions in tetrahedral (#2–#4) and octahedral (#5, #6) coordination [30,31]. Some authors [20] ascribe the absorption band at around 448 nm (#4) to d-d transitions of octahedrally coordinated Fe3+. It is worth noting that the aforementioned bands are present in both the potassium and sodium feldspar variety spectrum; however, they are more pronounced in the latter one (0 Na). A weak absorption band at around 860 nm (#8) can be assigned to hematite α-Fe2O3 [20,29]. Additionally, between 1000 and 2150 nm a broad band (#9) of weak absorption is observed. Such a band in the near IR may be assigned to the presence of Fe2+ ions [20]. The bandwidth can be, according to the literature [32,33,34], reasonably explained. First and foremost, two bands may overlap, one at around 1100 nm indicating the presence of Fe2+ ions in an octahedral sites and another at around 2000 nm corresponding to tetrahedrally coordinated Fe2+ ions. The reason for overlapping is probably Jahn-Teller distortion of the octahedrally coordinated iron ions. An additional two bands can be distinguished in the absorption spectra of the examined samples, the first centered at 1420 nm (#10) and the second at 1915 nm (#11). They are much more pronounced in the spectrum of K-type feldspar. According to the literature, these bands may originate from the combination of vibration modes of molecular water occurring in alkali feldspars and quartz in the form of microscopic or sub-microscopic fluid inclusions [34,35]. However, to verify this assumption, the additional investigations would be required. Disparity in absorbance spectra of sodium and potassium feldspar may be attributed to the difference in their chemical properties. The chemical surrounding is affected by atomic properties, especially by ionic radius (K+—1.38 Å, Na+—1.02 Å) and electro-negativity (Pauling scale: K+—0.82, Na+—0.93).
The shape of the absorbance spectra registered for feldspar-quartz samples doped with Fe2O3 synthetic pigment (I Na, I K) is generally similar to these of the basic samples (0 Na, 0 K). Some differences, however, are manifested. First of all, strong absorption band #1 in the UV region is broadened and shifted toward longer wavelengths, up to 390 nm in the visible region. An observed feature can be directly correlated with increased content of Fe3+ ions [20]. The red-shift of bands may indicate ligand-to-metal charge transfer transitions occurring between O2− and Fe3+ ions as well as the successful incorporation of some Fe3+ ions into the lattice of other phases, e.g., mullite as isomorphic substitution for Al3+ [20]. The latter assignment seems plausible because the presence of crystalline mullite was evidenced by XRD analysis. As a result, the observed strong absorption may, in fact, be a composite of the mentioned phenomena. Moreover, the intense absorption appeared at around 550 nm. This may be attributed to the simultaneous excitation (magnetic interaction) of adjacent Fe3+ cations in the hematite lattice [29]. Above 570 nm the absorbance is much higher than that of undoped materials. The band at 860 nm (#8), assigned to α-Fe2O3 (hematite), is significantly stronger than that registered for the raw materials (0 Na, 0 K). Furthermore, a slight shift of the absorption bands arising from Fe3+ d-d transitions towards longer wavelengths is also observed. It can be noted that the bands of I K and I Na samples are quite similar and, except for obvious differences in absorbance intensity, resemble the spectrum of undoped sodium sample. Changes in the electronic structure due to increased amount of iron (Pauling electro-negativity of iron is 1.83) eliminate differences caused by distinct chemical properties of sodium and potassium [27,36].
Simultaneous addition of Fe2O3 and TiO2 (III Na, III K) results in further broadening of the strong absorption range (with intensity exceeding 82%) between 220 and 2200 nm. Even though Fe3+ bands are less pronounced, their further red-shift in the visible region may be observed. The absorption band at 860 nm (well-defined in the spectra of I K and I Na samples) is much weaker and hardly detectable. Such an effect in combination with the presence of Fe3+-related bands could result from incorporation of Fe3+ ions into the lattice of other phases, including TiO2 and mullite. It should also be noted that the broad spectral band in the near IR assigned to Fe2+ ions is more distinct than that observed in other spectra.
3.5. Chromaticity Analysis
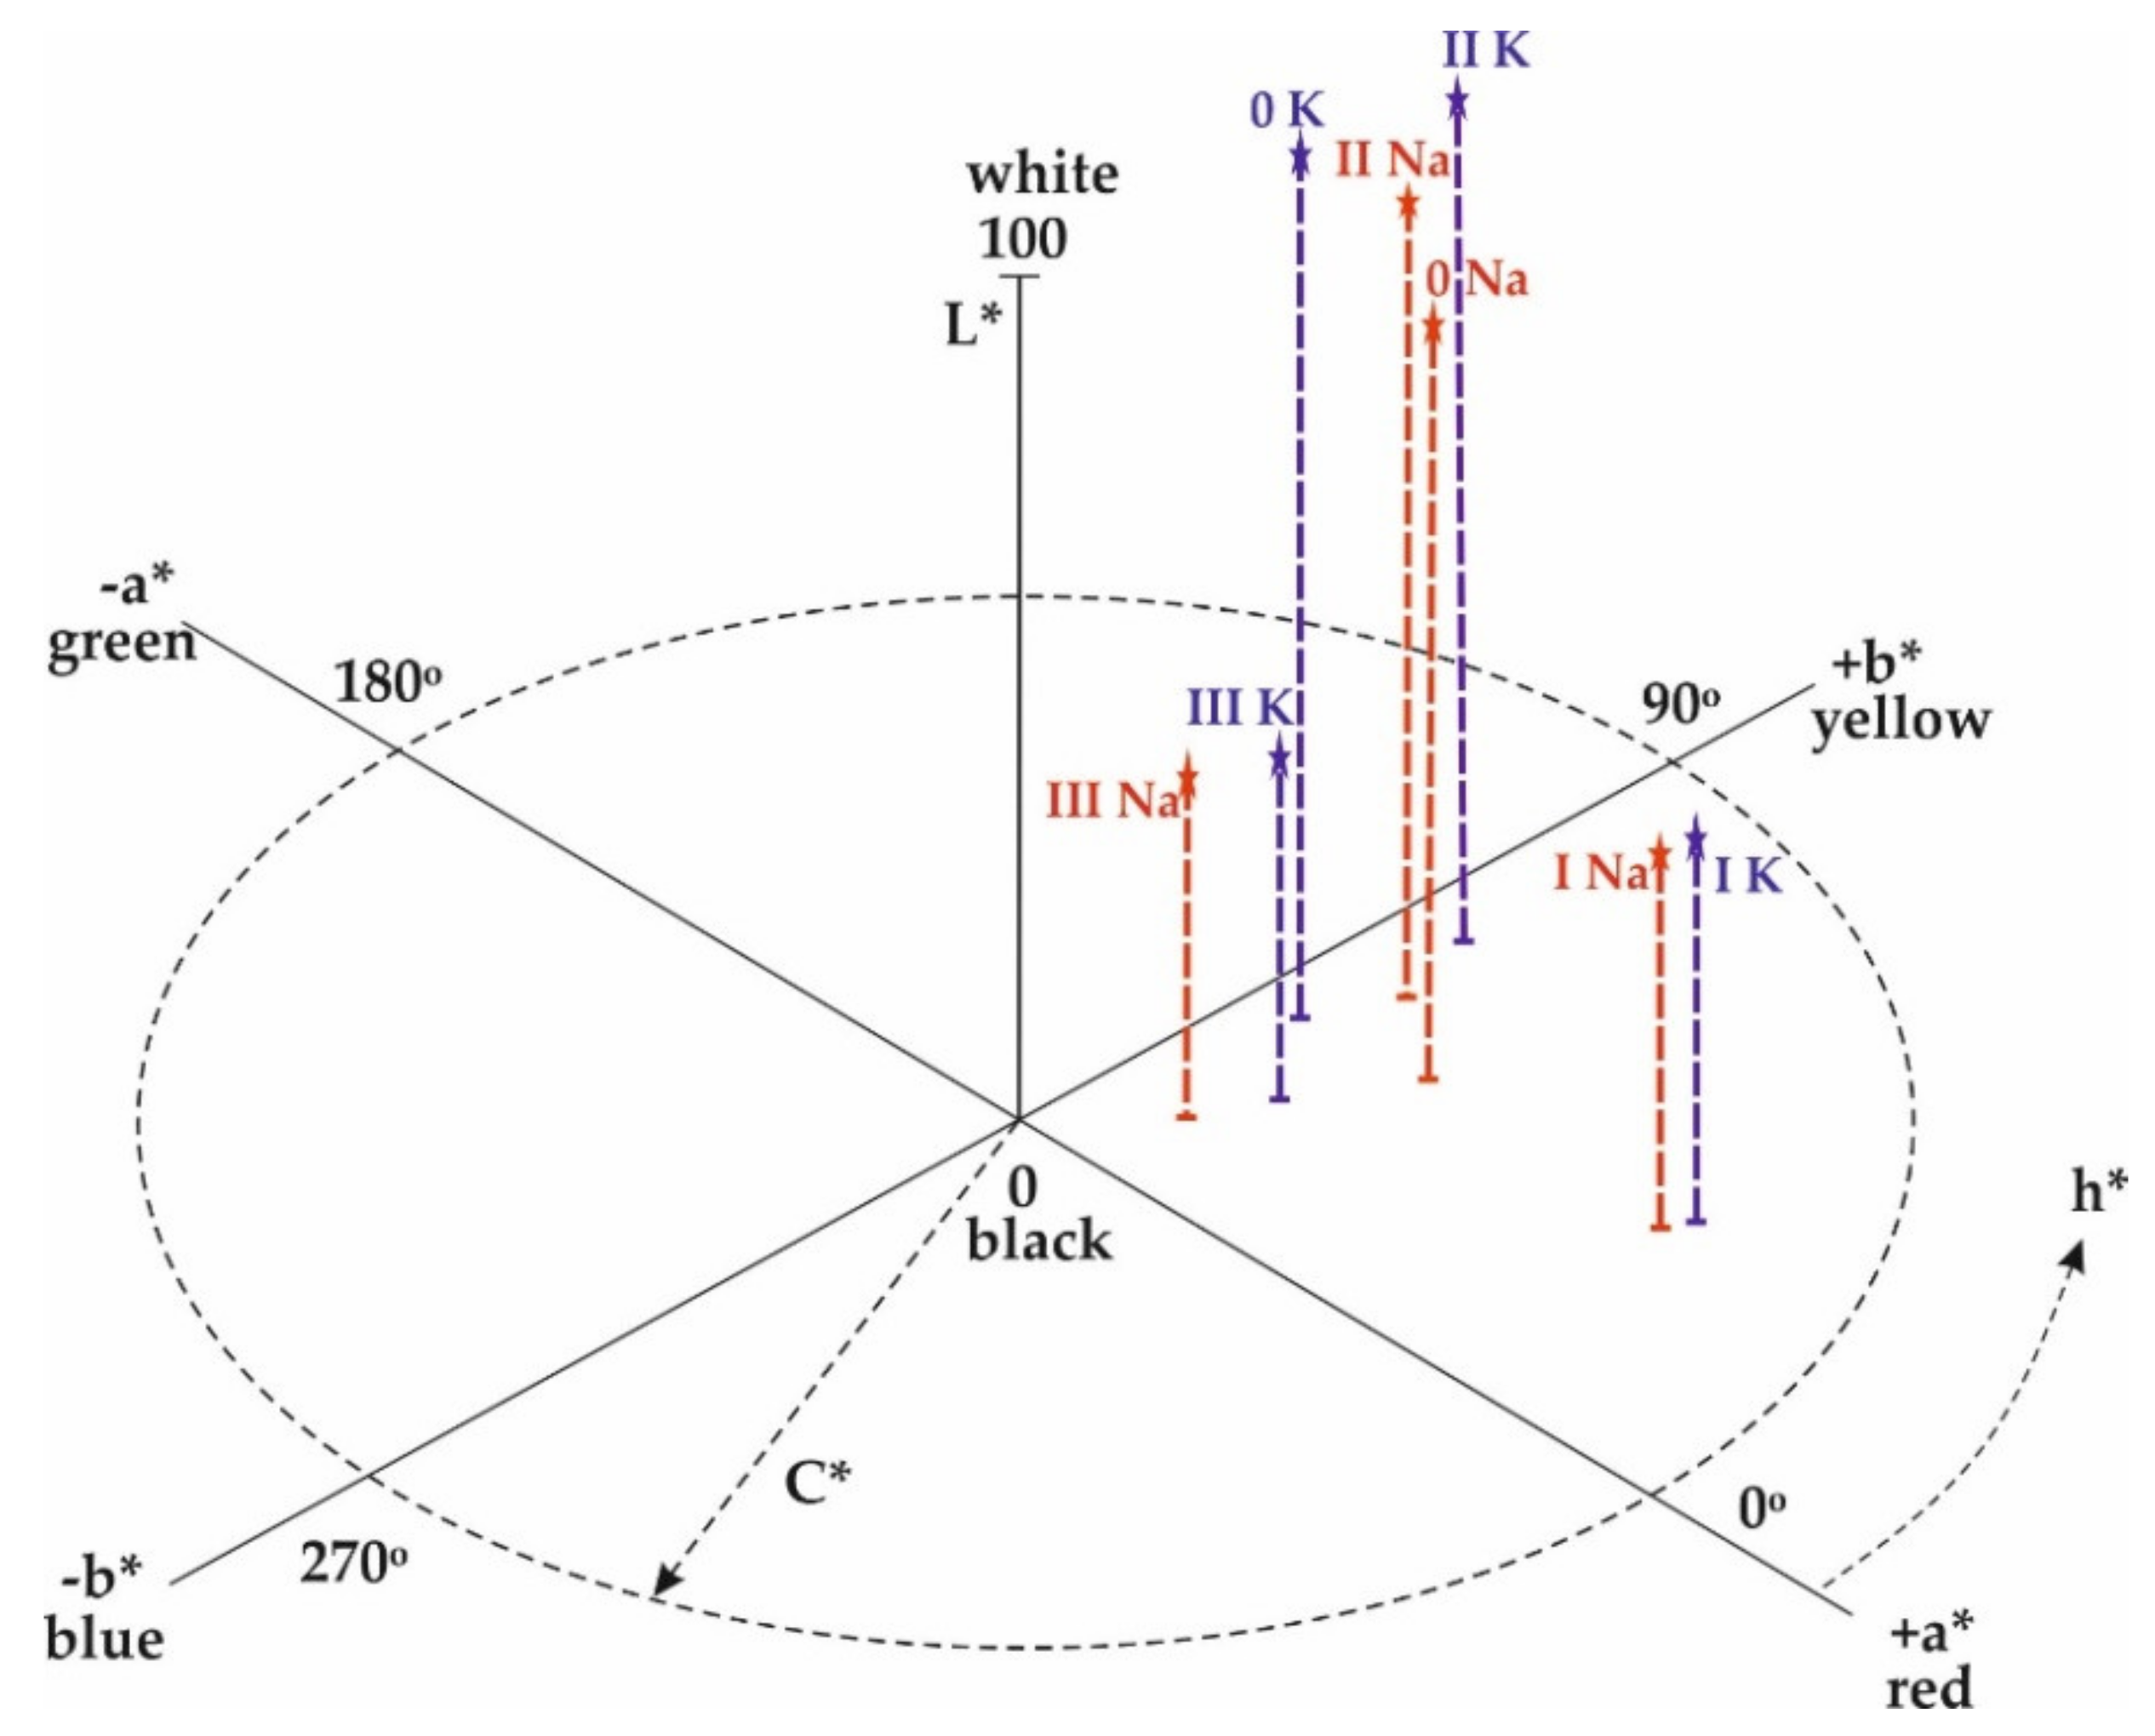
To quantify the color of the studied samples and to examine its variation with the iron and titanium content, the CIE (1976) colorimetric system was used (Table 4 and Figure 8). After firing of the potassium-type raw material, the color is brighter compared to that of the sodium type (which is confirmed by the L* coordinate values of 87.71% and 75.86%, respectively). This results from the difference in light absorption in the visible region between both varieties of the studied material, especially in the range of ca. 400–550 nm (Figure 7). The absorption registered for the sodium sample (0 Na) is more intense than that of its potassium counterpart (0 K). The lower the absorption, the more light is reflected from the surface of the sample and the brighter color is perceived. As a consequence, the observed color of 0 Na sample is pale pink, with the corresponding a* value (6.05) much higher than that of 0 K sample (1.67), which is light grey in color (Figure 1, Table 4).
Mixing with Fe2O3 resulted in decreased brightness L* (to 37.76% and 36.59%, respectively) and hue (h*) of both raw material varieties (Table 4), the change in their coloration was influenced by the hematite added as well as by the breakdown of iron-containing minerals at elevated temperatures with the formation of particles of hematite and Fe3+ ions dispersed in the aluminosilicate phase [37,38,39,40]. This resulted in strong absorption in the visible region up to 570 nm accompanied by a tint change to dark brown (probably due to d-d electronic transitions in Fe3+ ions coupled with Fe3+–Fe3+ pair excitation in hematite).
Mixing the studied materials with two synthetic oxides (Fe2O3 and TiO2) caused further significant darkening of their color in relation to samples marked I (doped with Fe2O3 only). This was manifested by reduction of brightness L* (to 37.61% and 35.74%, respectively) that resulted from further broadening of the strong absorption range from the visible into the IR part of the spectrum. The addition of TiO2 caused a distinct change in color of the samples to almost black probably owing to the incorporation of iron ions to the structure of the synthetic rutile and the following charge transfer between Fe and Ti.
4. Discussion
The colors of the fired samples of both raw material varieties doped with two synthetic pigments turned to darker hues than those with the addition of Fe2O3 only. This points to an influence of TiO2. Commercial titanium white is considered to be one of the best white pigments, since pure TiO2 does not absorb visible light. However, it has been reported that when some iron is present in the structure of TiO2, a charge transfer between Fe2+ and Ti4+ ions may occur [41,42,43]. This can contribute to the optical absorption in the UV and visible range resulting in the change in the coloration of examined samples [31,42,43,44]. Moreover, there are many colors that are caused by the much weaker electronic transitions between d (or f) orbital energy levels of single transition metal ions, such as Fe [43,45]. These transitions may be strongly intensified by magnetic coupling of adjacent Fe3+ cations in the crystal structure of iron phases [29].
Additionally, the presence of iron ions as impurity in raw materials can also contribute to the optical absorption in the UV and visible range due to O–Fe charge transfer (OMCT) [31,42,44]. There is evidence indicating that increasing the iron content causes an increase in the intensity of OMCT bands in the ultraviolet, hence shifting the UV edge towards smaller energies in the visible region [23,24]. This feature was clearly visible especially in the optical spectra of the examined samples doped with synthetic hematite.
On the other hand, the investigations performed by Shi et al. [46] demonstrated that a high content of Fe2O3 and TiO2 in the raw material encourages the formation of a metastable pseudobrookite phase (Fe3+,Fe2+)2(Ti,Fe3+)O5 coexisting with rutile in the course of the firing. This is in accordance with a ternary phase diagram TiO2, FeO, Fe2O3 [47]. In theory, pseudobrookite should disintegrate during cooling, but in the course of short thermal treatment with relatively low kinetics of this transformation, some remnants of the mentioned phase may remain in the fired material [46,48]. Pseudobrookite can form a solid-state solution with ferropseudobrookite (Mg2+,Fe2+,Al3+,Fe3+)Ti4+2O5 [49,50]. The resulting coexistence of Fe2+ and Fe3+ in the same structure, may presumably lead to the increase in optical absorption and thus to the change in color. However, these phases have not been detected in the examined samples by XRD analysis, and therefore this hypothesis cannot be confirmed.
Numerous researchers have found that Fe can substitute Ti in the high-temperature melt due to the close ionic radii and valence states of these ions [46,51,52]. According to Kim et al. [53], Ti4+ enhances the stability of Fe3+ relative to Fe2+ in the glassy phase. This is in accordance with the previous work conducted on the redox equilibria of Fe- and Ti-bearing silica glasses, showing the structural instability of the Fe2+–O–Ti4+ network [54].
Other reasons for color differences between raw materials of the same or similar coloring oxide contents but of distinct chemical character (sodium or potassium), may be their different behavior during the firing process. The raw material with a higher sodium content forms the liquid phase at lower temperatures than its potassium counterpart. This favors faster phase-to-phase interactions and transition from the crystalline to the liquid state. This may be coupled with releasing iron ions from the lattice of other minerals, which form hematite particles that cause permanent coloring of the material after firing [18]. At high temperatures, some Fe3+ ions may be accepted by structures of newly formed mullite at the isomorphic position. Fe3+ ions can substitute Al3+ ions due to the similar ionic radii of these elements, i.e., Fe3+ = 0.55 or 0.59 Å depending on CN, and Al3+ = 0.54 Å [18,55].
Furthermore, many investigations have demonstrated a different influence of alkalis, such as K and Na, on iron coordination in various types of silica glasses [23,41,42,43,44,56,57,58]. It has been stated that the presence of larger alkali metal cations (e.g., K+) facilitates lower metal-oxygen coordination numbers for different transition metal ions, such as Fe3+ (ionic radius of K+ is 1.38 Å, while the ionic radius of Na+ is 1.02 Å). The valence and coordination of the iron ion have a major effect on the Fe–O bond strength (interionic distance). It was found that replacing K2O by Na2O in the silica glasses containing Fe3+ ions resulted in the change of average iron coordination from 4 to 5, while the reversed action caused a marked reduction of CN and the accompanying Fe–O distance. Li et al. [59] revealed that alterations in bond strength between the coloring ions (Fe3+) and the surrounding ligands (O2−) can cause various ligand field splitting energies of Fe-3d levels (for iron present as Fe3+ with distorted octahedral geometry) and therefore contribute to different light absorption in the visible light spectrum. Color difference between the fired bodies containing various alkalis (with K2O or Na2O prevalence) is clearly visible in the absorption spectra of the studied samples, especially 0 Na and 0 K (undoped with synthetic pigments).
5. Conclusions
The investigations presented here showed that the color of the ceramic body after firing may depend not only on the presence and analytical content of coloring elements (such as iron and titanium), but on their valence state and coordination that induce specific optical transitions as well as on the chemical characteristics of the melt itself (e.g., the prevalence of potassium or sodium ions). This was confirmed using spectroscopic methods and chromaticity measurements.
According to Mössbauer and UV-Vis-NIR analyses, iron is present in the studied samples as hematite α-Fe2O3, Fe3+, Fe2+ and Fe3+/2+ ions (detected by Mössbauer method as Fe cations in oxidation states intermediate between Fe2+ and Fe3+). Analysis of optical properties of the raw materials reveal absorption bands resulting from ligand-to-metal charge transfer transitions between oxygen (O2−) and iron (Fe3+) (OMCT) which occur in the UV and stretch into the visible region, especially after doping the examined samples with synthetic pigments. In the visible domain the spectra show a series of absorption bands resulted from d-d electronic transitions within Fe3+ ions occupying tetrahedral and/or octahedral coordination. The absorption bands in the near IR region confirm the presence of Fe2O3 (hematite) as well as octahedrally coordinated Fe2+ ions. Doping with Fe2O3 pigment resulted in widening of absorption range in the visible region associated with increased content of Fe3+ ions as well as in appearance of the strong and well-defined bands assigned to hematite. These optical features indicate that the majority of synthetic pigment remained unaffected in the course of heat treatment. Simultaneous incorporation of Fe2O3 and TiO2 leads to subsequent broadening of the strong absorption range in the visible and near-IR regions. Weak absorption band attributed to α-Fe2O3 in combination with confirmed presence of Fe3+ ions may suggest successful doping of iron into TiO2.
The prevalence of larger alkali cations in the melt (K exceeding Na), is likely to cause a reduction of the coordination number of iron, which has a fundamental effect on the Fe–O bond length. This in turn influences the capacity for light absorption in the visible region. In the case of the sodium-rich variety (0 Na), the absorption (resulting from d-d transitions within Fe3+ ions) is much stronger than that recorded for its potassium counterpart (0 K). The addition of synthetic hematite caused an increase in the intensity of OMCT bands registered in the ultraviolet (due to O–Fe charge transfer transitions), hence shifting the UV edge towards the visible region. Furthermore, with increasing Fe concentration, more of the iron ions may occur in adjacent sites, and this probably manifested itself as strong absorption in the visible domain, owing to possible transitions resulting from simultaneous excitation of magnetically coupled Fe3+ cations in the hematite lattice. Furthermore, a slight shift of the absorption bands arising from Fe3+ d-d transitions towards longer wavelengths was observed. As a consequence, the perceived color of both feldspar-quartz varieties changed into dark brown. Doping with both synthetic pigments (Fe2O3 and TiO2) caused intense absorption (absorbance > 82%) in the whole range of visible light resulting in further darkening of the examined materials which color turned almost black. This could result from charge transfer between Fe and Ti, which has an absorption centered in the near-UV region tailing into the visible and the blue end of the spectrum. However, more complex relationships between Fe and other structural components are possible.
It can be concluded that skillful control of the chemical composition of feldspar-quartz raw materials and precise determination of the redox state of iron can help to obtain ceramic bodies of a required color, notwithstanding the content of coloring oxides in the raw material used.
Author Contributions
Conceptualization, methodology, validation, E.L.; writing—original draft preparation, E.L., A.T.-Z.; investigation, E.L., A.T.-Z.; resources, E.L.; funding acquisition, E.L. All authors have read and agreed to the published version of the manuscript.
Funding
This research was funded by the Strzeblowskie Mineral Mines of Sobótka, while the publication of the article was financially supported by the Mineral and Energy Economy Research Institute of the Polish Academy of Sciences in Kraków, Poland.
Acknowledgments
The authors acknowledge with thanks the Strzeblowskie Mineral Mines of Sobótka for providing raw materials for investigations. The authors wish also to sincerely thank Cecylia Dziubak from the Institute of Ceramics and Building Materials of Warsaw for preparing blends of raw materials with synthetic pigments used in the experiments as well as Artur Błachowski from the Institute of Physics, Pedagogical University of Kraków for helpful discussion. Critical reading of the manuscript and constructive remarks of two anonymous reviewers are also highly appreciated.
Conflicts of Interest
The authors declare no conflict of interest. The funders had no role in the design of the study; in the collection, analyses, or interpretation of data; in the writing of the manuscript, or in the decision to publish the results.
References
- Majerowicz, A. On the petrology of the granite massif of Strzegom-Sobótka. Geol. Sudet. 1972, 6, 83–90. [Google Scholar]
- Lewicka, E. The studies of granitoids from the Sobótka region in light of theories of the origin of colour in minerals. Gosp. Sur. Min.—Miner. Res. Manag. 2016, 32, 55–69. [Google Scholar] [CrossRef] [Green Version]
- Lewicka, E. Rational use of selected mining by-products in the ceramic industry in Poland. Gosp. Sur. Min.—Miner. Res. Manag. 2020, 36, 59–76. [Google Scholar] [CrossRef]
- Lewicka, E. Barwa po wypaleniu a skład mineralny kopalin skaleniowych z rejonu Sobótki. Gosp. Sur. Min.—Miner. Res. Manag. 2013, 29, 35–51. [Google Scholar] [CrossRef]
- Lewicka, E. Origin of colour after firing of feldspar-quartz raw material from the Sobótka region (Lower Silesia, SW Poland). In Proceedings of the Mineral Engineering Conference MEC2016, Świeradów-Zdrój, Poland, 25–28 September 2016; Volume 8. Article number 01022. [Google Scholar] [CrossRef] [Green Version]
- Lewicka, E. Phase transitions of ferruginous minerals in the course of thermal processing of feldspar-quartz raw materials from the Sobótka region (Lower Silesia). Gosp. Sur. Min.—Miner. Res. Manag. 2017, 33, 93–110. [Google Scholar] [CrossRef] [Green Version]
- Górnicki, R.; Błachowski, A.; Ruebenbauer, K. Mössbauer Spectrometer MsAa-3. Nukleonika 2007, 52 (Suppl. 1), S7. [Google Scholar]
- Mysen, B.O.; Virgo, D. Redox equilibria, structure, and properties of Fe-bearing aluminosilicate melts: Relationships among temperature, composition, and oxygen fugacity in the system Na2O-Al2O3-SiO2-Fe-O. Am. Mineral. 1989, 74, 58–76. [Google Scholar]
- Uchino, T.; Nakaguchi, K.; Nagashima, Y.; Kondo, T. Prediction of optical properties of commercial soda-lime-silicate glasses containing iron. J. Non-Cryst. Solids 2000, 261, 72–78. [Google Scholar] [CrossRef]
- Britt, J. All about iron. Ceram. Mon. 2011, March 2011, 14–15. [Google Scholar]
- Wilke, M. Fe in magma—An overview. Ann. Geophys. 2005, 48, 609–617. [Google Scholar]
- Ehlers, E.G. The Interpretation of Geological Phase Diagrams; W.H. Freeman & Co.: San Francisco, CA, USA, 1972; 280p. [Google Scholar]
- Levin, E.M.; Robbins, C.R.; McMurdie, H.F. Phase Diagrams for Ceramists, 3rd ed.; The American Ceramic Society: Columbus, OH, USA, 1974; p. 526. [Google Scholar]
- Stabile, P.; Webb, S.; Knipping, J.K.; Behrens, H.; Paris, E.; Giuli, G. Viscosity of pantelleritic and alkali-silicate melts: Effect of Fe redox state and Na/(Na+K) ratio. Chem. Geol. 2016, 442, 73–82. [Google Scholar] [CrossRef]
- Stevens, J.G.; Khansanov, A.M.; Miller, J.W.; Pollak, H.; Li, Z. Mössbauer Mineral Handbook; Mössbauer Effect Data Center: Asheville, NC, USA, 2005; p. 636. [Google Scholar]
- Andji, J.Y.Y.; Abba Toure, A.; Kra, G.; Jumas, J.C.; Yvon, J.; Blanchart, P. Iron role on mechanical properties of ceramics with clays from Ivory Coast. Ceram. Int. 2009, 35, 571–577. [Google Scholar] [CrossRef]
- Menil, F. Systematic trends of the 57Fe Mössbauer isomer shifts in (FeOn) and (FeFn) polyhedra. Evidence of a new correlation between the isomer shift and the inductive effect of the competing bond T-X (→ Fe) (where X is O or F and T any element with a formal positive charge). J. Non-Cryst. Solids 1985, 46, 763. [Google Scholar]
- Hanzlicek, T.; Niznansky, D.; Dedecek, J.; Steinerova, M.; Straka, P.; Triskova, J. Discoloration of fired kaolinitic clays (study of Fe3+ coordination by Mössbauer and UV-ViS-NIR spectroscopy). J. Am. Ceram. Soc. 2007, 9, 2843–2848. [Google Scholar] [CrossRef]
- Soro, N.; Aldon, L.; Olivier-Fourcade, J.; Jumas, J.C.; Laval, J.P.; Blanchart, P. Role of iron in mullite formation from kaolins by Mössbauer spectroscopy and Rietveld refinement. J. Am. Ceram. Soc. 2003, 86, 129–134. [Google Scholar] [CrossRef]
- Djemai, A.; Calas, G.; Muller, J.P. Role of structural Fe(III) and iron oxide nanoparticles in mullite coloration. J. Am. Ceram. Soc. 2001, 84, 1627–1631. [Google Scholar] [CrossRef]
- Dyar, M.D. A review of Mössbauer data on inorganic glasses: The effects of composition on iron valence and coordination. Am. Mineral. 1985, 70, 304–316. [Google Scholar]
- Sorescu, M.; Xu, T.; Wise, A.; Diaz-Michelena, M.; McHenry, M.E. Studies on structural, magnetic and thermal properties of xFe2TiO4-(1-x)Fe3O4 (0 ≤ x ≤ 1) pseudo-binary system. J. Magn. Magn. Mater. 2012, 324, 1453–1462. [Google Scholar] [CrossRef]
- Bingham, P.A.; Hannant, O.M.; Reeves-McLaren, N.; Stennett, M.C.; Hand, R.J. Selective behaviour of dilute Fe3+ ions in silicate glasses: An Fe K-edge EXAFS and XANES studies. J. Non-Cryst. Solids 2014, 387, 47–56. [Google Scholar] [CrossRef]
- Bingham, P.A.; Parker, J.M.; Searle, T.; Williams, J.M.; Fyles, K. Redox and clustering of iron in silicate glasses. J. Non-Cryst. Solids 1999, 253, 203–209. [Google Scholar] [CrossRef]
- De Grave, E.; Van Alboom, A. Evaluation of ferrous and ferric Mössbauer fractions. Phys. Chem. Miner. 1991, 18, 337–342. [Google Scholar] [CrossRef]
- Eeckhout, S.G.; De Grave, E. Evaluation of ferrous and ferric Mössbauer fractions. Part II. Phys. Chem. Miner. 2003, 30, 142–146. [Google Scholar] [CrossRef]
- Halmurat, D.; Yusufu, T.; Wang, Q.-L.; He, J.; Sidike, A. Rare earth ion Tb3+ doped natural sodium feldspar (NaAlSi3O8). Luminescent properties and energy transfer. Sci. Rep. 2019, 9, 14637. [Google Scholar] [CrossRef] [Green Version]
- Jeong, Y.; Yu, J.; Koh, S.-M.; Heo, C.-H.; Lee, J. Spectral characteristics of minerals associated with skarn deposits: A case study of Weondong skarn deposit South Korea. Geosci. J. 2016, 20, 167–182. [Google Scholar] [CrossRef]
- Sherman, D.M.; Waite, T.D. Electronic spectra of Fe3+ oxides and oxide hydroxides in the near IR to near UV. Am. Mineral. 1985, 70, 1262–1269. [Google Scholar]
- Chassé, M.; Lelong, G.; Nijnatten, P.; Schoofs, I.; Wolf, J.; Galoisy, L.; Calas, G. Optical Absorption Microspectroscopy (μ-OAS) Based on Schwarzschild-Type Cassegrain Optics. Appl. Spectr. 2015, 69, 457–463. [Google Scholar] [CrossRef] [Green Version]
- Glebov, L.B.; Boulos, E.N. Absorption of iron and water in the Na2O-CaO-MgO-SiO2 glasses. II. Selection of intrinsic, ferric, and ferrous spectra in the visible and UV regions. J. Non-Cryst. Solids 1998, 242, 49–62. [Google Scholar] [CrossRef]
- Bates, T. Ligand field theory and absorption spectra of transition-metal ions in glasses. In Modern Aspects of the Vitreous State; Mackenzie, J.D., Ed.; Butterworths: London, UK, 1962; Volume 2, pp. 195–254. [Google Scholar]
- Duffy, J.A. Bonding, Energy Levels, & Bands; Longman Group: London, UK, 1990. [Google Scholar]
- Smith, J.V.; Brown, W.L. Feldspar Minerals. Crystal Structures, Physical, Chemical, and Microtextural Properties, 2nd ed.; Springer-Verlag: Berlin Heidelberg, Germany, 1988; Volume 1. [Google Scholar] [CrossRef]
- Johnson, E.A.; Rossmann, G.R. The concentration and speciation of hydrogen in feldspars using FTIR and 1H MAS NMR spectroscopy. Am. Mineral. 2003, 88, 901–911. [Google Scholar] [CrossRef]
- Ahemen, I.; Dejene, F.B. Luminescence and energy transfer mechanism in Eu3+/Tb3+-co-doped ZrO2 nanocrystal rods. J. Nanopart. Res. 2017, 19, 6. [Google Scholar] [CrossRef]
- Torrent, J.; Barron, V. Diffuse reflectance spectroscopy of iron oxides. Encycl. Surf. Colloid Sci. 2002, 1, 1438–1446. [Google Scholar]
- Nodari, L.; Marcuz, E.; Maritan, L.; Mazzoli, C.; Russo, U. Hematite nucleation and growth in the firing of carbonate-rich clay for pottery production. J. Eur. Ceram. Soc. 2007, 27, 4665–4673. [Google Scholar] [CrossRef]
- Opuchovic, O.; Kareiva, A. Historical hematite pigment: Synthesis by an aqueous sol-gel method, characterization and application of the colouration of ceramic glazes. Ceram. Int. 2015, 41, 4504–4513. [Google Scholar] [CrossRef]
- De Bonis, A.; Cultrone, G.; Grifa, C.; Langella, A.; Leone, A.P.; Mercurio, M.; Morra, V. Different shades of red: The complexity of mineralogical and physio-chemical factors influencing the colour of ceramics. Ceram. Int. 2017, 43, 8065–8074. [Google Scholar] [CrossRef]
- Chandrasekhar, S.; Ramaswamy, S. Influence of mineral impurities on the properties of kaolin and its thermally treated products. Appl. Clay Sci. 2002, 21, 133–142. [Google Scholar] [CrossRef]
- Chavoutier, M.; Caurant, D.; Majérus, O.; Boulesteix, R.; Loiseau, P.; Jousseaume, C.; Brunet, E.; Lecomte, E. Effect of TiO2 content on the crystallization and the color of (ZrO2,TiO2)-doped Li2O–Al2O3–SiO2 glasses. J. Non-Cryst. Solids 2014, 384, 15–24. [Google Scholar] [CrossRef]
- Burns, R.G. Intervalence transitions in mixed-valence minerals of iron and titanium. Ann. Rev. Earth Sci. 1981, 9, 345–383. [Google Scholar] [CrossRef]
- Bingham, P.A.; Parker, J.M.; Searle, T.; Smith, I. Local structure and medium range ordering of tetrahedrally coordinated Fe3+ ions in alkali-alkaline earth-silica glasses. J. Non-Cryst. Solids 2007, 353, 2479–2494. [Google Scholar] [CrossRef]
- Möncke, D.; Papageorgiou, M.; Winterstein-Beckmann, A.; Zacharias, N. Roman glasses coloured by dissolved transition metal ions: Redox-reactions, optical spectroscopy and ligand field theory. J. Arch. Sci. 2014, 46, 23–36. [Google Scholar] [CrossRef]
- Shi, P.; Wang, F.; Wang, Y.; Zhu, J.; Zhang, B.; Fang, Y. Coloring and translucency mechanism of Five dynasty celadon body from Yaozhou kiln. Ceram. Int. 2017, 43, 11616–11622. [Google Scholar] [CrossRef]
- Taylor, W. System FeO-Fe2O3-TiO2. J. Am. Ceram. Soc. 1963, 46, 276–279. [Google Scholar] [CrossRef]
- Dondi, M.; Matteuci, F.; Cruciani, G.; Gasparotto, G.; Tobaldi, D.M. Pseudobrookite ceramic pigments: Crystal structural, optical and technological properties. Solid State Sci. 2007, 9, 362–369. [Google Scholar] [CrossRef] [Green Version]
- Miyake, A.; Hokada, T. First find of ferropseudobrookite in quartz from Napier Complex, East Antarctica. Eur. J. Mineral. 2013, 25, 33–38. [Google Scholar] [CrossRef]
- Guo, W.Q.; Malus, S.; Ryan, D.H.; Altounian, Z. Crystal structure and cation distribution in the FeTi2O5-Fe2TiO5 solid solution series. J. Phys. Condens. Mater. 1999, 11, 6337–6346. [Google Scholar] [CrossRef]
- Lobacheva, O.; Yiu, Y.M.; Chen, N.; Sham, T.K.; Goncharova, I.V. Changes in local surface structure and Sr depletion in Fe-implemented SrTiO3 (001). Appl. Surf. Sci. 2016, 393, 74–81. [Google Scholar] [CrossRef]
- Bilovol, V.; Ferrari, S.; Derewnicka, D.; Saccone, F.D. XANES and XPS study of electronic structure of Ti-enriched Nd-Fe-B ribbons. Mater. Chem. Phys. 2014, 146, 269–276. [Google Scholar] [CrossRef]
- Kim, J.Y.; No, H.; Jeon, A.Y.; Kim, U.; Pee, J.H.; Cho, W.S.; Kim, K.J.; Kim, C.M.; Kim, C.S. Mössbauer spectroscopic and chromaticity analysis on colorative mechanism of celadon glaze. Ceram. Int. 2011, 37, 3389–3395. [Google Scholar] [CrossRef]
- Alberto, H.V.; Gil, J.M.; Ayres DeCampos, N.; Mysen, B.O. Redox equilibria of iron in Ti-bearing calcium silicate quenched glasses. J. Non-Cryst. Solids 1992, 151, 39–50. [Google Scholar] [CrossRef]
- Handke, M. Krystalochemia Krzemianów (Chemistry of Silicate Crystals); UWN-D: Kraków, Poland, 2008. [Google Scholar]
- Brown, G.E., Jr.; Farges, F.; Calas, G. X-ray scattering and X-ray spectroscopy studies of silicate melts. In Structure, Dynamics and Properties of Silicate Melts, Reviews in Mineralogy and Geochemistry; Stebbins, J.F., McMillan, P.F., Dingwell, D.B., Eds.; Mineralogical Society of America: Washington, D.C., USA, 1995; Volume 32, pp. 317–410. [Google Scholar]
- Farges, F.; Lefrère, Y.; Rossan, S.; Berthereau, A.; Calas, G.; Brown, G.E., Jr. The effect of redox state on the local structural environment of iron in silicate glasses: A molecular dynamics, combined XAFS spectroscopy, and bond valence study. J. Non-Cryst. Solids 2004, 344, 176–188. [Google Scholar] [CrossRef]
- Wilke, M.; Farges, F.; Partzsch, G.M.; Schmidt, C.; Behrens, H. Speciation of Fe in silicate glasses and melts by in-situ XANES spectroscopy. Am. Mineral. 2007, 92, 44–56. [Google Scholar] [CrossRef]
- Li, Y.; Zhang, B.; Cheng, H.; Zheng, J. Revealing the coloration mechanism in the earliest Chinese celadon glaze. J. Eur. Ceram. Soc. 2019, 39, 1675–1682. [Google Scholar] [CrossRef]
Figure 1.
Color after firing of the studied samples: potassium (K) and sodium (Na) types doped with synthetic pigments (marked I-III) plus that of the basic samples (marked 0).
Figure 1.
Color after firing of the studied samples: potassium (K) and sodium (Na) types doped with synthetic pigments (marked I-III) plus that of the basic samples (marked 0).

Figure 2.
XRD patterns of sodium feldspar-quartz samples in a raw state/unfired (Na raw), as well as the samples after firing: without synthetic pigments addition (0 Na), as well as doped with 1.5% Fe2O3 (I Na), and with 1.5% Fe2O3 + 0.5% TiO2 (III Na).
Figure 2.
XRD patterns of sodium feldspar-quartz samples in a raw state/unfired (Na raw), as well as the samples after firing: without synthetic pigments addition (0 Na), as well as doped with 1.5% Fe2O3 (I Na), and with 1.5% Fe2O3 + 0.5% TiO2 (III Na).

Figure 3.
XRD patterns of potassium feldspar-quartz samples in a raw state/unfired (K raw) and the samples after firing: without synthetic pigments addition (0 K), as well as doped with 1.5% Fe2O3 (I K), and with 1.5% Fe2O3 + 0.5% TiO2 (III K).
Figure 3.
XRD patterns of potassium feldspar-quartz samples in a raw state/unfired (K raw) and the samples after firing: without synthetic pigments addition (0 K), as well as doped with 1.5% Fe2O3 (I K), and with 1.5% Fe2O3 + 0.5% TiO2 (III K).

Figure 4.
Sodium feldspar-quartz sample doped with 1.5% Fe2O3 (I Na) after firing, whose surface is covered with numerous bubbles.
Figure 4.
Sodium feldspar-quartz sample doped with 1.5% Fe2O3 (I Na) after firing, whose surface is covered with numerous bubbles.

Figure 5.
Room temperature Mössbauer spectra of the sodium-rich samples heat-treated at 1200 °C. (a) I Na doped with Fe2O3, (b) III Na doped with Fe2O3 + TiO2.
Figure 5.
Room temperature Mössbauer spectra of the sodium-rich samples heat-treated at 1200 °C. (a) I Na doped with Fe2O3, (b) III Na doped with Fe2O3 + TiO2.

Figure 6.
Room temperature Mössbauer spectra of the potassium-rich samples heat-treated at 1200 °C. (a) I K doped with Fe2O3, (b) III K doped with Fe2O3 + TiO2.
Figure 6.
Room temperature Mössbauer spectra of the potassium-rich samples heat-treated at 1200 °C. (a) I K doped with Fe2O3, (b) III K doped with Fe2O3 + TiO2.

Figure 7.
Optical absorbance spectra of selected samples after firing: undoped (0 K, 0 Na), doped with Fe2O3 (I K, I Na), and doped with both Fe2O3 and TiO2 (III K, III Na).
Figure 7.
Optical absorbance spectra of selected samples after firing: undoped (0 K, 0 Na), doped with Fe2O3 (I K, I Na), and doped with both Fe2O3 and TiO2 (III K, III Na).

Figure 8.
Color parameters of the studied samples in CIE space: K—potassium feldspar-quartz samples, Na—sodium feldspar-quartz samples, 0—basic samples, I—samples doped with 1.5% Fe2O3, II—samples doped with 0.5% TiO2, III—samples doped with 1.5% Fe2O3 + 0.5% TiO2.
Figure 8.
Color parameters of the studied samples in CIE space: K—potassium feldspar-quartz samples, Na—sodium feldspar-quartz samples, 0—basic samples, I—samples doped with 1.5% Fe2O3, II—samples doped with 0.5% TiO2, III—samples doped with 1.5% Fe2O3 + 0.5% TiO2.


Table 1.
The percentages of synthetic pigments added to basic samples of feldspar-quartz raw materials (wt. %).
Table 1.
The percentages of synthetic pigments added to basic samples of feldspar-quartz raw materials (wt. %).
| Sample | Fe2O3 | TiO2 |
|---|---|---|
| I | 1.5 | - |
| II | - | 0.5 |
| III | 1.5 | 0.5 |
Table 2.
Analyzed weight % composition of the studied feldspar-quartz raw materials.
| Sample | SiO2 | Al2O3 | Fe2O3 | TiO2 | Na2O | K2O | CaO | MgO | LoI |
|---|---|---|---|---|---|---|---|---|---|
| Max. deviation | ±2.0 | ±0.150 | ±0.010 | ±0.005 | ±1.0 | ±0.30 | ±0.30 | ±0.05 | n.d. |
| Potassium-rich samples | |||||||||
| 0 K | 75.90 | 13.93 | 0.30 | 0.053 | 2.87 | 5.14 | 0.20 | 0.16 | 1.19 |
| I K | 73.18 | 14.46 | 1.77 | 0.055 | 2.96 | 5.23 | 0.22 | 0.16 | 1.62 |
| II K | 73.56 | 14.79 | 0.34 | 0.566 | 3.05 | 5.33 | 0.22 | 0.17 | 1.59 |
| III K | 72.46 | 14.51 | 1.85 | 0.545 | 3.00 | 5.27 | 0.21 | 0.16 | 1.69 |
| Sodium-rich samples | |||||||||
| 0 Na | 73.78 | 15.20 | 0.36 | 0.096 | 5.48 | 3.49 | 0.38 | 0.13 | 0.98 |
| I Na | 71.90 | 15.23 | 1.77 | 0.042 | 5.38 | 3.56 | 0.38 | 0.14 | 1.24 |
| II Na | 72.57 | 15.40 | 0.29 | 0.537 | 5.48 | 3.58 | 0.38 | 0.13 | 1.23 |
| III Na | 71.80 | 14.97 | 1.75 | 0.536 | 5.31 | 3.50 | 0.38 | 0.13 | 1.27 |
n.d.—not determined.
Table 3.
The results of Mössbauer spectroscopy studies.
| Sample | Phase | A (%) | IS (mm/s) | QS (mm/s) | B (T) | Г (mm/s) |
|---|---|---|---|---|---|---|
| I Na | Fe2O3 | 65 ± 2 | 0.37 | −0.21 | 51.1 | 0.28 |
| Fe3+/2+ | 14 ± 1 | 0.54 | 2.57 | – | 0.90 | |
| Fe3+ | 21 ± 1 | 0.34 | 0.98 | – | 0.90 | |
| III Na | Fe2O3 | 68 ± 2 | 0.37 | −0.23 | 50.7 | 0.33 |
| Fe3+/2+ | 13 ± 1 | 0.58 | 2.53 | – | 0.90 | |
| Fe3+ | 19 ± 1 | 0.34 | 0.91 | – | 0.90 | |
| I K | Fe2O3 | 66 ± 2 | 0.37 | −0.21 | 51.1 | 0.26 |
| Fe3+/2+ | 13 ± 2 | 0.63 | 2.43 | – | 0.93 | |
| Fe3+ | 21 ± 2 | 0.34 | 0.82 | – | 0.82 | |
| III K | Fe2O3 | 60 ± 2 | 0.37 | −0.23 | 50.7 | 0.33 |
| Fe3+/2+ | 16 ± 2 | 0.58 | 2.39 | – | 0.74 | |
| Fe3+ | 24 ± 2 | 0.33 | 0.81 | – | 0.90 |
A—relative contribution of the given iron site (sub-spectrum), IS—isomer (total) shift versus α-Fe, QS—quadrupole splitting, B—magnetic hyperfine field, Г—absorber line-width.
Table 4.
Color parameters of the studied samples of different modulus K2O:Na2O after firing.
| Sample | Color Parameters of the Samples After Firing | |||||
|---|---|---|---|---|---|---|
| L*(%) | a* | b* | C* | h* | ∆E | |
| Potassium-rich variety | ||||||
| 0 K | 87.71 | 1.67 | 9.25 | 9.40 | 79.43 | |
| I K | 37.76 | 16.63 | 10.01 | 19.41 | 31.03 | 47.13 |
| II K | 84.56 | 2.01 | 15.04 | 15.17 | 82.39 | 5.66 |
| III K | 37.61 | 5.25 | 4.92 | 7.19 | 43.16 | 44.96 |
| Sodium-rich variety | ||||||
| 0 Na | 75.86 | 6.05 | 9.68 | 11.42 | 57.99 | |
| I Na | 36.59 | 15.91 | 9.34 | 18.45 | 30.41 | 46.14 |
| II Na | 79.45 | 2.80 | 11.78 | 12.11 | 76.64 | 3.88 |
| III Na | 35.74 | 3.71 | 2.56 | 4.51 | 34.63 | 44.97 |
L*—brightness; a*—red (a > 0); b*—yellow (b > 0); C* = (a2 + b2)1/2—chroma/saturation of color; h* = arc tg (b/a)—hue; ∆E = √(∆L2 + ∆a2 + ∆b2)—total difference of color in relation to basic sample.
© 2020 by the authors. Licensee MDPI, Basel, Switzerland. This article is an open access article distributed under the terms and conditions of the Creative Commons Attribution (CC BY) license (http://creativecommons.org/licenses/by/4.0/).
Share and Cite
MDPI and ACS Style
Lewicka, E.; Trenczek-Zajac, A. Investigations of Feldspar-Quartz Raw Materials After Firing: Effect of Various Na2O/K2O Ratio and Synthetic Pigments Addition. Minerals 2020, 10, 646. https://doi.org/10.3390/min10070646
AMA Style
Lewicka E, Trenczek-Zajac A. Investigations of Feldspar-Quartz Raw Materials After Firing: Effect of Various Na2O/K2O Ratio and Synthetic Pigments Addition. Minerals. 2020; 10(7):646. https://doi.org/10.3390/min10070646
Chicago/Turabian StyleLewicka, Ewa, and Anita Trenczek-Zajac. 2020. "Investigations of Feldspar-Quartz Raw Materials After Firing: Effect of Various Na2O/K2O Ratio and Synthetic Pigments Addition" Minerals 10, no. 7: 646. https://doi.org/10.3390/min10070646
Note that from the first issue of 2016, this journal uses article numbers instead of page numbers. See further details here.