Article

Prediction of Thermal Barrier Coatings Microstructural Features Based on Support Vector Machine Optimized by Cuckoo Search Algorithm

1
Key Lab of Safety Science of Pressurized System, Ministry of Education, School of Mechanical and Power Engineering, East China University of Science and Technology, Shanghai 200237, China
2
Department of Quality and Safety Engineering, China Jiliang University, Hangzhou 310018, China
*
Author to whom correspondence should be addressed.
Coatings 2020, 10(7), 704; https://doi.org/10.3390/coatings10070704
Submission received: 27 June 2020 / Revised: 15 July 2020 / Accepted: 17 July 2020 / Published: 21 July 2020

Abstract

:
Microstructural features have a vital effect on the comprehensive performance of thermal barrier coatings (TBCs) and highly depend on the thermal spray processing parameters. Herein, a novel hybrid machine-learning method was proposed to predict the microstructural features of TBCs using thermal spray processing parameters based on a support vector machine method optimized by the cuckoo search algorithm (CS-SVM). In this work, atmospheric-plasma-sprayed (APS) TBCs samples with multifarious microstructural features were acquired by modifying the spray powder size, spray distance, and spray power during thermal spray processing. The processing parameters were used as the inputs for the CS-SVM model. Then, the porosity, the pore-to-crack ratio, the maximum Feret’s diameter, the aspect ratio, and the circularity were counted and treated as the targets for the CS-SVM model. After optimization and training procedure of the CS-SVM model, the predicted results were compared to the results of experimental data, as a result, the squared correlation coefficient (R2) of CS-SVM model showed that the prediction accuracy reached by over 95%, and the root mean square error (RMSE), mean absolute error (MAE), and mean absolute percentage error (MAPE) were less than 0.1, which also verified the reliability of the CS-SVM model. Finally, this study proposed a novel and efficient microstructural feature prediction that could be potentially employed to improve the performance of TBCs in service.

1. Introduction

Thermal barrier coatings (TBCs) provide thermal insulation to the hot sections of the gas turbine or aero engines under severe operation conditions, thereby improving the gas turbine or aero engine performance and efficiency. A foremost TBC system classically consists of four layers: the brittle ceramic top coating (TC), metallic bond coating (BC), thermally grown oxide (TGO), and superalloy substrate [1,2]. Among these four layers, the TC determines the strength, heat conductivity, fracture toughness, wear resistance, and thermal expansion rate of TBCs, most of these physical indicators, which are correlated with lifetime and comprehensive properties of TBCs, mainly depend on the microstructure features of TC [3,4,5,6,7]. Yttria partially stabilized zirconia (YSZ) is generally chosen as an attractive material for TC, owing to its superior mechanical and thermophysical properties [2,4]. Thermal spray includes a set of processes for coating manufacturing in which finely divided YSZ material is deposited under semimolten or molten conditions. Plasma-spraying and electron beam–physical vapor deposition are generally chosen as the deposition techniques, atmospheric plasma-spraying (APS) TBCs is usually chosen to reduce thermal conductivity to a greater degree, owing to its superior lamellar and porous structures, and APS process has been regarded as one of the most efficient techniques for depositing high-performance coatings at low cost and high efficiency. Moreover, the coating performances are highly dependent on the process parameters of the APS process. Particle size, spray distance, and spray power were regarded as the most important APS process parameters affecting the melting indexes of in-flight particles [8,9,10,11,12].
Considering the complexity of actual spray preparation process parameters, experimentally, the orthogonal design method is the most commonly used solution to determine the optimal process parameters, and is the most widely used method to estimate the impact of thermal spraying process parameters on the APS coatings performance, because the test sample size has been streamlined in advance. However, various process parameters will all affect the quality of the coating, so in most cases orthogonal design method merely distinguishes the primary and secondary factors, but cannot get the best process parameters, the actual guidance of the method is limited [13,14]. In modeling terms, numerical modeling and simulation have also been widely used to simulate and control the spraying process. Nevertheless, owing to the intricate multiphysical coupling phenomenon of the thermal spray process, numerical simulation is difficult to effectively model the actual spraying behavior [15,16,17].
Over the past few decades, several modeling and experimental methods for coating characterization have been presented, compared to the conventional coating properties prediction methods, a variety of artificial intelligence techniques have been a focus area of research, owing to their own unique modeling superiorities and predictive performance (i.e., simple implementation, easy to understand and implement, fast speed, low storage resource, low generalization error rate, low computational overhead, easy to interpret results) [18,19,20]. Nevertheless, the traditional multiple linear regression method is more suitable for the analysis of linear data [21]; the artificial neural network (ANN) method has the defects of “overfitting” and overlength learning time, and is easy to fall into local minima [20,22]; the time series analysis method has complicated model and low prediction accuracy [23]; the gray theory method has high requirements on data [24]. Indeed, there is not a single machine-learning algorithm that can integrate all the advantages as mentioned above, and has its own shortcomings, so how to choose the appropriate prediction method is particularly important.
Generally, it is difficult to obtain sufficient thermal spraying process parameters and coating data sets during actual modeling, because the process is time-consuming and difficult. Therefore, for modeling with fewer data sets, to obtain the coatings required in actual engineering service, hence, a method for quantitative analysis, prediction, and optimization of coatings microstructural features is essential. The support vector machine (SVM) algorithm is according to limited sample information and seeks the best concession between model complexity and learning capacity to obtain the best generalization ability, compared to the methods mentioned above, the support vector machine regression (SVR) algorithm is preferable to settle the problems of small samples, nonlinear data, and refraining from falling into local minima [20,25,26,27]. However, the generalization capabilities and learning performance of the SVR algorithm mainly depend on the model system parameters, the common parameter searching methods are as follows: the grid search (GS) method; the genetic algorithm (GA); and the particle swarm optimization (PSO) algorithm. The GS method needs to perform exhaustive verification and searches one by one within a given range, which is very time-consuming, and the obtained parameters are generally not the optimal parameters, and the regression performance of the model cannot be guaranteed. GA and PSO algorithms have high efficiency, but they are prone to fall into local extreme values [28,29,30,31]. The proposed basis of this natural heuristic algorithm cuckoo search (CS) algorithm is based on the behavior of the biological habits, and the CS algorithm is a very novel algorithm of late years. Its advantages are fewer parameters, stronger global search capability, and more excellent search path. It is suitable for a multiobjective solution [32,33,34]. Based on this, this work proposes a prediction method of APS thermal barrier coating microstructural features using processing parameters based on the support vector machine optimized by the CS algorithm.

2. Experimental Procedures and Modeling Methods

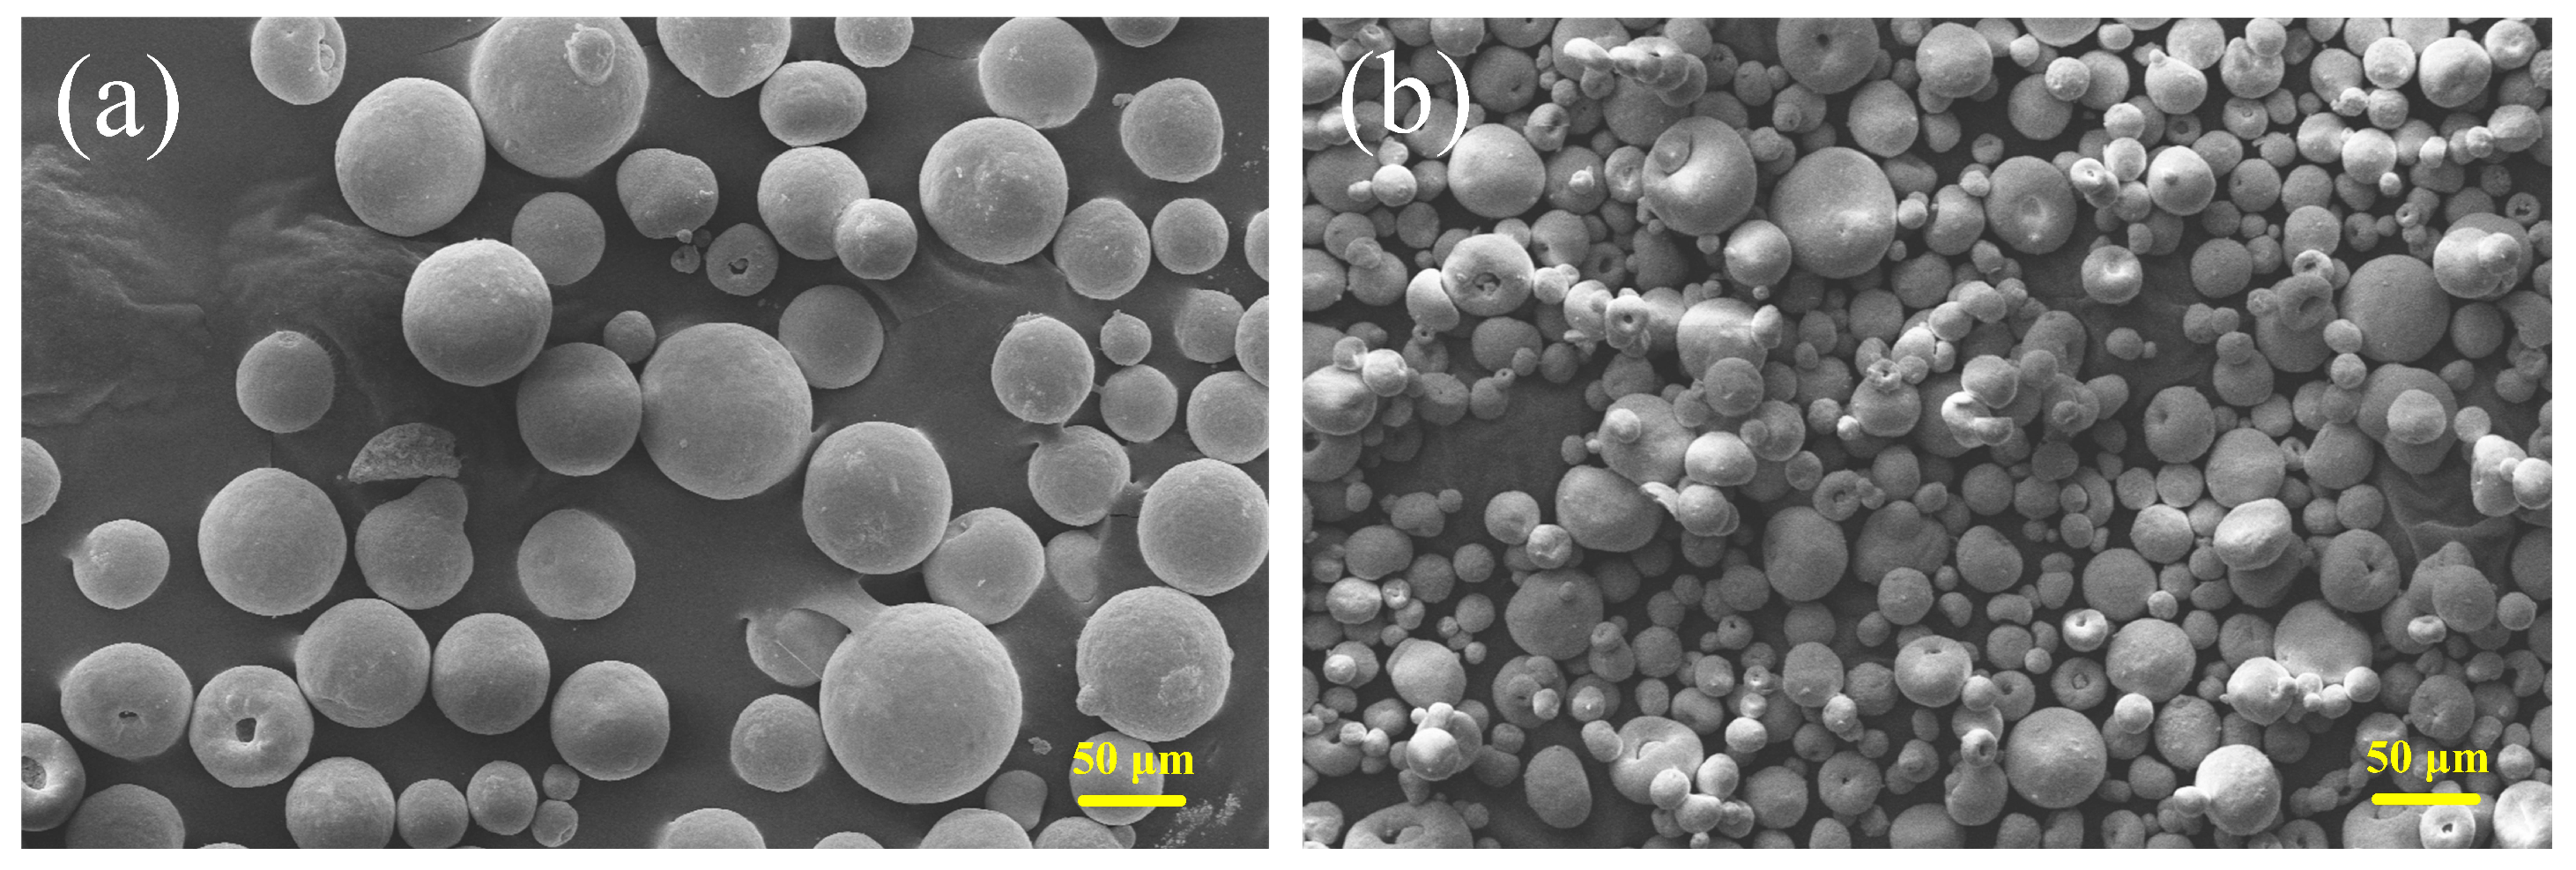
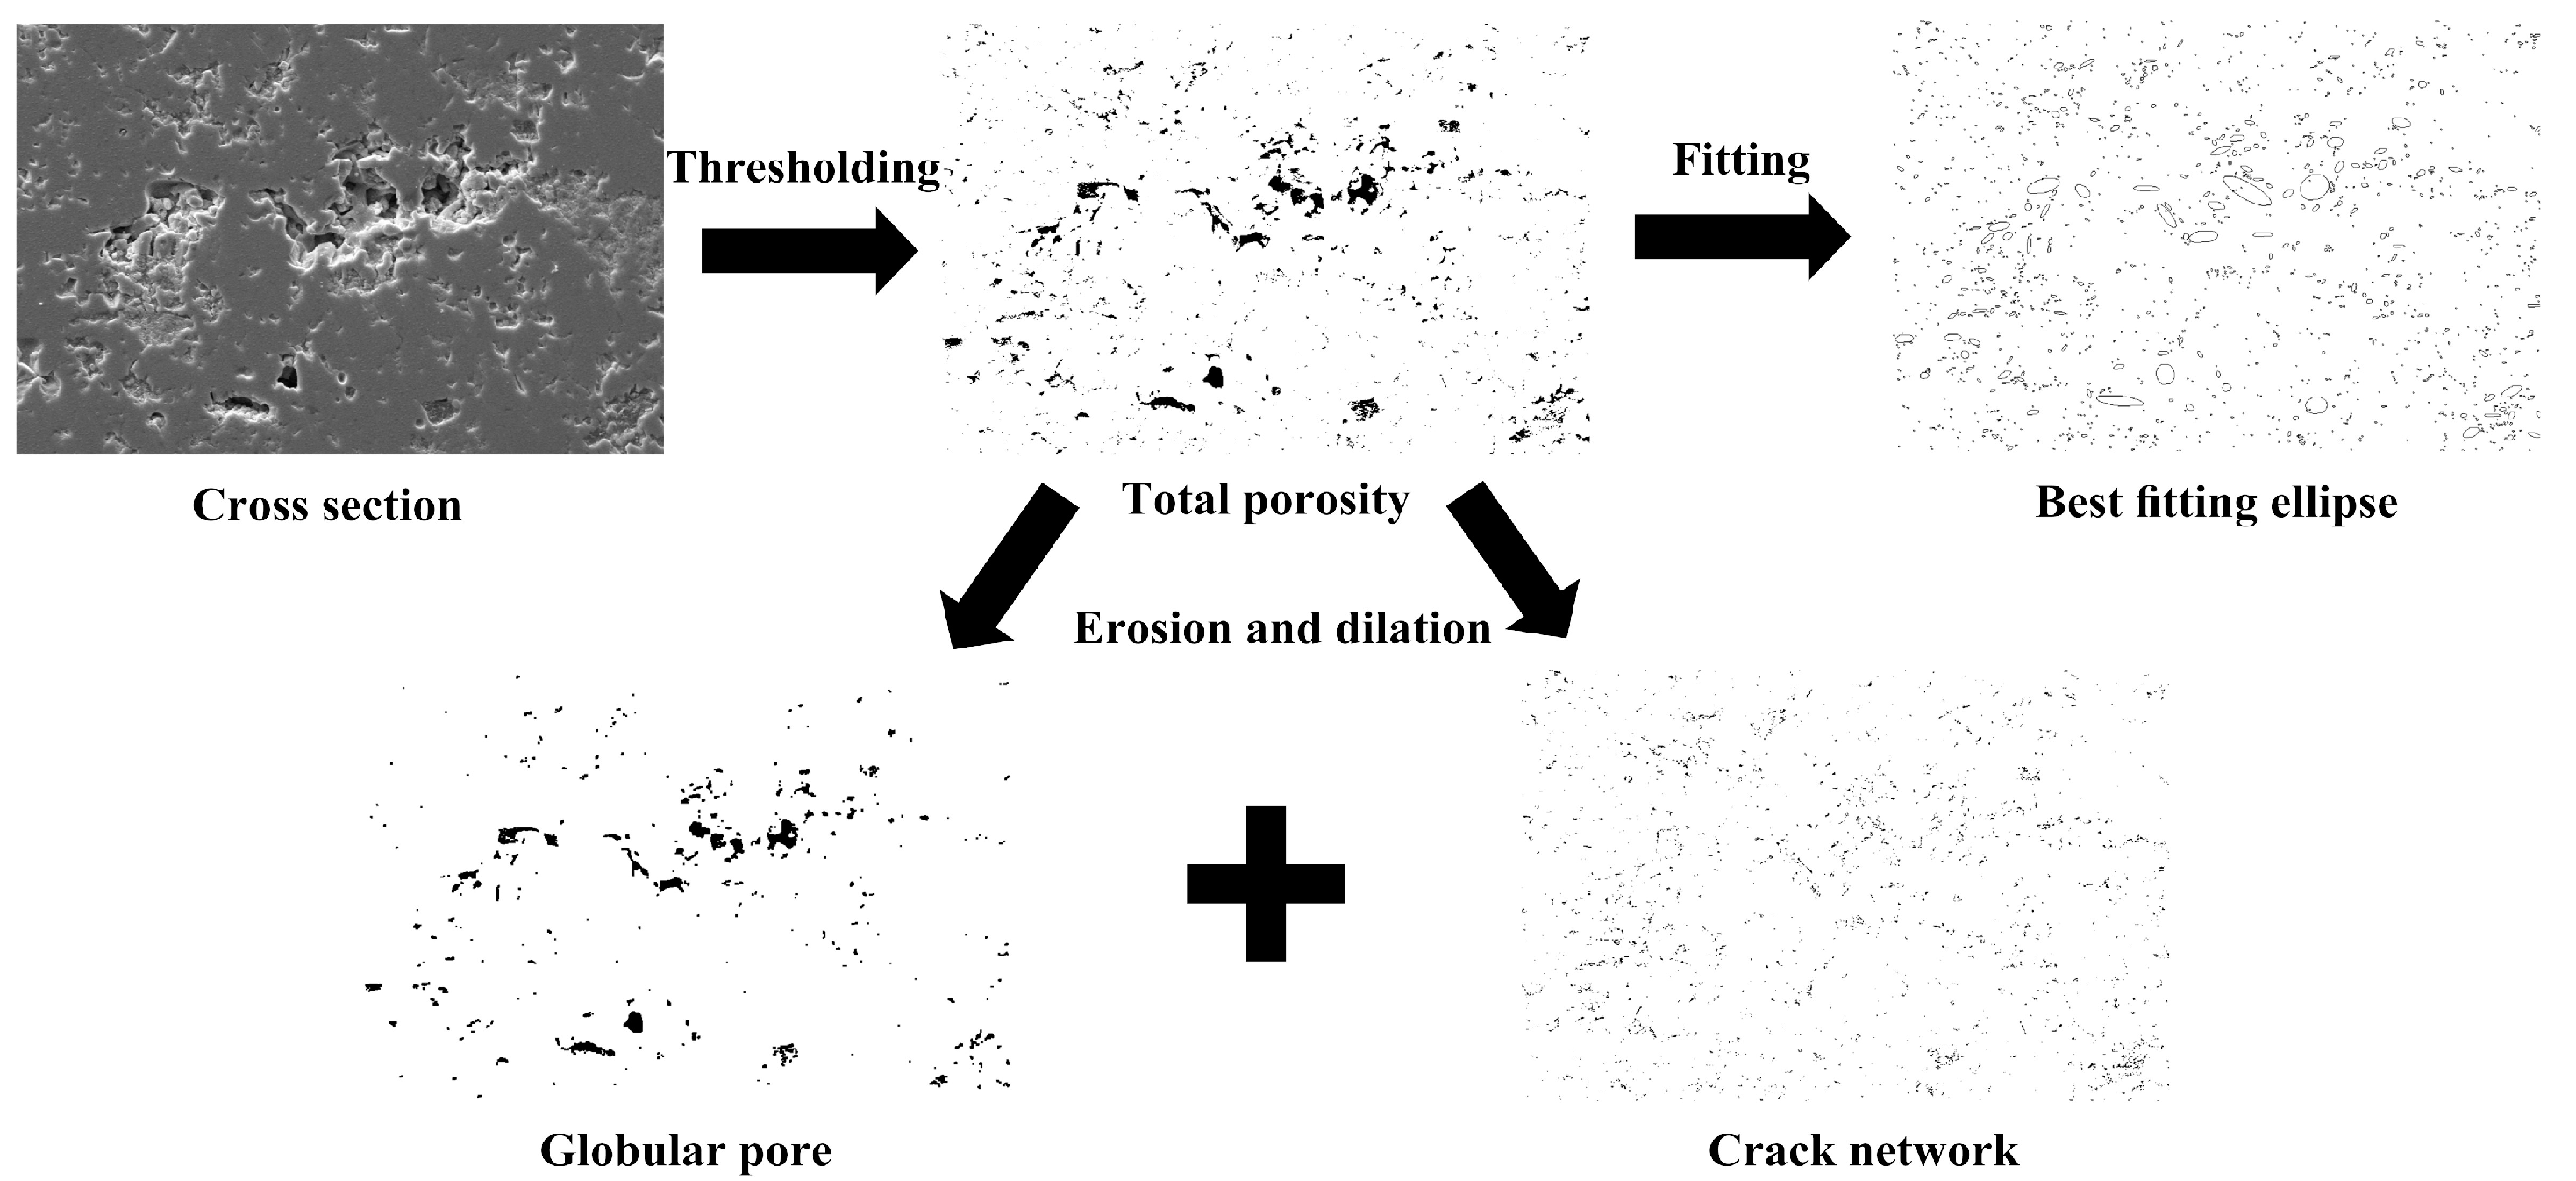
2.1. Coatings Fabrication and Microstructural Features Characterization

In this work, as shown in Figure 1, to acquire the tested samples and the calibration samples with multifarious microstructural features, the ZrO2 8 wt.% Y2O3 (8YSZ) powders (Beijing Sunspraying Technology Co., Ltd., Beijing, China) were received with two batches of the nominal particle size distribution of 40–96 µm and 15–55 µm, 24, 30, 33, and 36 kW were chosen as the spray power during TBCs samples preparation, respectively; the spray distance was chosen from 70 to 120 mm. Disk-shaped, grit-blasted, carbon steel substrate plates (Ø 25.4 × 3.1 mm2) were used as the substrates [3].
The APS spray experiments were carried out with a commercial APS system (APS-2000, Beijing Aeronautical Manufacturing Technology Research Institute, Beijing, China). A manipulator (Asea Brown Boveri Ltd., Zurich, Switzerland) was employed to fix the gun at a velocity of 15 cm/s. The argon and hydrogen were chosen as the principal plasma gas and ancillary gas, respectively, and the pressure of argon and hydrogen was maintained at 0.4 and 0.25 MPa, respectively. Argon was also employed as the powder feed gas at a flow rate of 10 L/min. The APS spray process parameters are listed in Table 1.
The inlaid TBCs samples were polished with 240#, 400#, 600#, 800#, 1000#, and 1200# water sandpaper, and began to be water milled at 800# sandpaper. After the sample is polished, polish it with a diamond abrasive paste with a particle size of 1.5 μm on the polishing machine. The direction of the scratch in the sample is perpendicular to the direction of rotation of the polishing cloth. Until all the wear marks disappear, the polishing time should not be too long to prevent it from excessive polishing. Finally, the polished sample surface was cleaned with alcohol and dried with an electric hair dryer to obtain the final metallographic sample. Microstructure features observations were made using a scanning electron microscope (SEM, ZEISS EVO MA15, Carl Zeiss SMT Ltd., Oberkochen, Germany). Image analyses were performed using the ImageJ software (vl.46, National Institutes of Health, Bethesda, MD, USA). The binary conversion was used to split image to extract the microstructural features, plentiful isolation of pores of various types jumbled together, as shown in Figure 2, the YSZ matrix (white region) and pore network (black region) represented the one-threshold level and zero-threshold level, severally. To distinguish and count the spherical pore and crack network, an opening operation was implemented to remove and add pixels from the edges of objects, successively. It should be noted that this so-called crack network is a collection of linear porosity. Hence, in the preprocessing phase, the image was processed by using morphological operations, and the background noises were removed from the image by the morphological operating [35,36]. To further do statistical analysis of the microstructure features, porosity ω, pore-to-crack ratio k, maximum Feret’s diameter Df, aspect ratio AR, and circularity Cr, which were considered to reflect the morphology of micropores more comprehensively, were chosen to perform statistical analysis, we obtained the average value as the modeling output according to the frequency weighting of the respective microstructural feature distribution, and 5 different discontiguous SEM images were counted for each processing parameter to ensure the reliability of the statistical results. The definitions of these chosen microstructural features are listed in Table 2, and the schematic illustration of these chosen microstructural features could be found in [35,36].

2.2. Methodological Background and Model Construction

2.2.1. Support Vector Machine

SVM is a novel machine-learning method based on the statistical learning theory proposed by Vapnik in 1995 [37]. It can effectively solve subsistent problems and has become intelligent technology. The research hotspot in the field has been widely used in various domains, such as status assessment, pattern recognition, failure diagnosis, and so on. SVM is continuously developed from the linear time-sharing optimal classification hyperplane and the idea of modeling is aimed to find the support vector to establish the optimal classification hyperplane. Mathematically, it can be reducible to a quadratic optimal solving problem. This algorithm has many advantages, for example, the structural risk is optimal, and it has good generalization ability for learning small sample data to prevent the overfitting problem. The support vector machine algorithm is based on the assumption that the geometric interval is maximized, and the data is assumed to be linearly separable. In fact, in most cases, it is linearly inseparable, so the basic type of support vector machine adds a slack variable. According to the given training data set (X,Y), an SVM recognizer could be established, which can be expressed as follows [20,38]:
Y ( X ) = ω T · φ ( X ) + b + ϑ
where Y ( X ) is the predictable outcome; the symbol T represents the transpose processing of the matrix; ϑ is the noise, which is defined by the error tolerance ζ ; φ ( X ) is the kernel function; ω and b are the regression function parameter, respectively, could be calculated via the principle of error function minimization as follows:
min [ 1 2 ω T ω + c ( j = 1 N ε θ   + j = 1 N ε θ * ) ]
subject to
{ ζ ε θ * Y ( X ) ω T · ϕ ( X ) b ζ + ε θ ε θ * 0 , ε θ 0 , θ = 1 , 2 , , i
where c is the regularization parameter representing the penalty loss; if the data examples are outside of them ζ , then the slack variables ε θ * and ε θ will be existent; i is the sample size.
Previous studies have shown that the commonly used kernel functions of SVM include linear inner product kernel function, polynomial kernel function, and radial basis function (RBF). When there is a lack of a priori knowledge, the RBF has fewer parameters and better performance, which are better than other kernel functions [39,40,41]. Therefore, this study selects the Gaussian version of RBF as the kernel function of the SVM and CS methods were applied to optimize SVM parameters to acquire the optimum prediction results.

2.2.2. Cuckoo Search Algorithm

The cuckoo search algorithm is a meta-heuristic algorithm developed by Xin-she Yang and Suash Deb in 2009. The algorithm was developed based on the parasitic reproduction strategy possessed by the cuckoo population itself [33,42]. CS algorithm uses egg nests on behalf of the solutions. In the oversimplified case, there is one egg per nest, and the cuckoo’s egg signifies a new solution. The aim is to adopt new and latently better solutions instead of suboptimal solutions. To simulate the cuckoo bird’s nesting behavior, the CS algorithm sets three rules as follows [43,44]:
Firstly, at a time the cuckoo just lays one egg, and uses it on behalf of a solution to the problem, and stochastically puts the eggs in a bird’s nest for hatching.
Secondly, in these nests, some of them have high-quality eggs, which is a good solution to the problem, and these nests will be reserved for the next generation.
Thirdly, the total number of bird nests is invariable. The probability that the owner finds that the egg is an exotic egg is P a ( P a [ 0 , 1 ] ) .
The search path of the CS algorithm is extraordinary in comparison to the ordinary algorithm. The algorithm uses the Levy flight search method with strong randomness. Suppose the position of the ith nest of the tth bird’s nest is x i ( t ) , and the machine search path is L ( λ ) , then the update formula of the cuckoo’s path and position for finding the bird’s nest can be expressed as follows:
x i ( t + 1 ) = x i ( t ) + α L ( λ ) ,     i = 1 , 2 , 3 , , n
where α is the step control amount. After the position is substituted, a number r of [0,1] is stochastically generated. If r > Pa, the nest position x i ( t + 1 ) is changed, otherwise it keeps constant. Finally, the group of nest positions y i ( t + 1 ) with the best-retained effect is still recorded as x i ( t + 1 ) .
In the CS algorithm, the step size is random and short of adaptivity, which could not ensure rapid convergence. To solve the problem between the global optimization ability and accuracy, based on the CS algorithm, on the basis of the search results of various stages, the step size is adaptively adjusted dynamically. The adaptive step adjustment strategy from the optimal bird’s nest position can be expressed as follows:
step i = step min + ( step max step min ) d i
d i = n i n best d max
where step max and step min are the maximum and minimum step size, respectively; n best is the best state of the current nest position; n i is the ith nest position; d max is the maximum distance between the optimal position and other nests.

2.2.3. SVM Parameter Optimization Based on CS

  • The SVM parameters determine the learning and generalization ability of the SVM model. Two crucial and decisive RBF parameters are C and σ , respectively. The former determines the balance between the complexity of the SVM model and empirical error, the latter determines the complexity of the sample data distribution. Hence, in this study, MATLAB software (R2017a, MathWorks. Inc) is used for modeling implementation, the CS algorithm is applied to optimize the SVM model parameters C and σ as follows [34]: Gather the training set samples, and preprocess the training set samples to acquire SVM learning samples. As a matter of experience, set the value range of SVM parameters C and σ , the minimum step step min and the maximum step step max of the CS algorithm, and the number of iterations N [34].
  • Set the probability Pa = 0.25 and the number of nests n = 20 from the beginning, stochastically generate the position p i ( 0 ) = [ x 1 ( 0 ) , x 2 ( 0 ) , , x n ( 0 ) ] T of the n nests, each nest corresponds to a set of parameters ( C , σ ) , calculate the fitness evaluation function of each set of nest positions corresponding to the training set, and find the optimum nest position x b ( 0 ) and fitness evaluation function F max at present.
  • Keep the position x b ( 0 ) of the optimal nest of the previous generation, calculate the Levy flight step length according to Equations (5) and (6), use the Levy flight to update the positions of other nests to acquire a new set of nest positions, and calculate their fitness evaluation function F.
  • According to the fitness evaluation function F, the position of the new bird’s nest is compared with the position Pi−1 of the previous generation bird’s nest, and the poorer bird’s nest position is replaced with a better bird’s nest position to acquire a new set of bird’s nest position p t = [ x 1 ( t ) , x 2 ( t ) , x n ( t ) ] T .
  • Use random number r to compare with P a , keep the bird’s nest with the smaller probability of being found in Pt, update the bird’s nest with the higher probability of discovery, calculate the fitness evaluation function of the new nest, and make comparison with the fitness evaluation function of the position Pt, and replace the bad position with a better bird’s nest position to get a set of the latest and better bird’s nest position Pt.
  • Find the optimal nest position b in Step (5), determine whether the fitness evaluation function F is up to the standard. If it is up to the standard, the search is stopped, and output the global best fitness evaluation function F and its optimal nest t; if it is not up to the mustard, return back to Step (3) to continue the optimization.
  • Set the SVM parameters according to the optimal parameters ( C , σ ) corresponding to the optimal bird’s nest position x b ( t ) .

2.2.4. Model Performance Indicators

In this work, the APS process parameters of 12 samples (80%) were used as the training sets to set up the cuckoo search–support vector machine (CS-SVM) model, and the remaining APS process parameters (20%, 3 samples) were used as the validation and prediction sets, when modeling the validation and prediction sets, a random method is used to create these data sets. The accuracy and reliability of the proposed CS-SVM model were evaluated using four parameters objectively, including: squared correlation coefficient (R2), root mean square error (RMSE), mean absolute error (MAE), and mean absolute percentage error (MAPE). Their definitions are as follows:
R 2 = [ i = 1 n ( Y ^ i Y ^ ¯ ) ( Y i Y ¯ ) i = 1 n ( Y ^ i Y ^ ¯ ) 2 i = 1 n ( Y i Y ¯ ) 2 ] 2
RMSE = i = 1 n ( Y i Y ^ i ) 2 / n
MAE = i = 1 n | Y i Y ^ i | / n
MAPE = i = 1 n | Y i Y ^ i | Y i / n
where n is the number of samples for modeling, Y i is the real value of TC microstructural features, Y ^ i is the predicted value of TC microstructural features obtained by the CS-SVM model.

3. Results and Discussion

3.1. Microstructure Features

Generally, APS coatings are layered structures formed by the accumulation of countless flattened completely melted particles, partially melted particles, pores, oxides, inclusions, and other complex components. As a vital structural defect, pores have an important impact on the performance and service life of the coatings. Therefore, it is necessary to quantitatively and accurately characterize the microstructural features, and then establish the relationship among the microstructural features, the process parameters, and the service performance of the coatings [7,35].
As displayed in Table 3, different processing parameters will lead to the change of melting indexes of inflight particles during the preparation, these 15 samples have different microstructure features [45,46]. For the distribution of the porosity of APS coatings, the porosity mainly varies from 8.99% to 23.01%, the processing parameters of particle size of 40–96 μm, spray distance of 120 mm, and spray power of 36 kW contributes to the largest porosity of 23.01%, larger values of porosities mainly occur with relatively coarse particle (40–96 μm) and long spray distance (120 mm). For the distribution of the pore-to-crack ratio of APS coatings, the pore-to-crack ratio mainly varies from 0.3480 to 0.5902, the processing parameters of particle size of 15–55 μm, spray distance of 120 mm, and spray power of 36 kW contributes to the highest pore-to-crack ratio of 0.5902, larger values of the pore-to-crack ratios mainly occur with relatively fine particle (15–55 μm). For the distribution of the Maximum Feret’s diameter of APS coatings, the maximum Feret’s diameter mainly varies from 1.2949 to 3.0536 μm, the processing parameters of particle size of 40–96 μm, spray distance of 120 mm, and spray power of 36 kW contributes to the greatest maximum Feret’s diameter of 3.0536 μm, larger values of maximum Feret’s diameters mainly occur with relatively coarse particle (40–96 μm) and long spray distance (120 mm). For the distribution of the aspect ratio of APS coatings, the aspect ratio mainly varies from 1.6312 to 1.8350, the processing parameters of particle size of 40–96 μm, spray distance of 120 mm, and spray power of 36 kW contributes to the highest aspect ratio of 1.8350, larger values of aspect ratios mainly occur with relatively coarse particle (40–96 μm) and long spray distance (120 mm). For the distribution of the circularity of APS coatings, the circularity mainly varies from 0.7322 to 0.8591, the processing parameters of particle size of 15–55 μm, spray distance of 70 mm, and spray power of 36 kW contributes to the largest circularity of 0.8591, larger values of circularity mainly occur with relatively fine particle (15–55 μm, maximum Feret’s diameter).
Based on the above analysis, it seems that the particle size has a greater impact on the microstructure features, nevertheless, there are no obvious relationships among the porosity, the pore-to-crack ratio, the maximum Feret’s diameter, the aspect ratio, and the circularity. Hence, we need to analyze the range of the three factors (A, B, and C) at each level to determine the order of each factor influence on the characteristics of each microstructural feature, so as to further reveal the influence of various process parameters on the microstructural features qualitatively. The specific implementation method of range analysis is to average the microstructure features at each level corresponding to each process factor (A, B, and C), and then to calculate the difference between the maximum and minimum values of these averages at each level. The difference is the range of this process factor, and then the ranges of different process factors are compared and sorted in order from largest to smallest. It is regarded as the ranking of the influence of different factors on the microstructure features. As displayed in Table 4, for the variations of porosity and aspect ratio, the influence of spray distance is the greatest of the three factors; for the variations of the pore-to-crack ratio and circularity, the influence of spray power is the greatest of the three factors; for the variation of maximum Feret’s diameter, the influence of particle size is the greatest of the three factors. Beyond that, it is still very difficult to determine the relationship between the APS processing parameters and the microstructure features quantitatively using the curve fitting method, hence, a CS-SVM model is built to predict the microstructural features in this study.

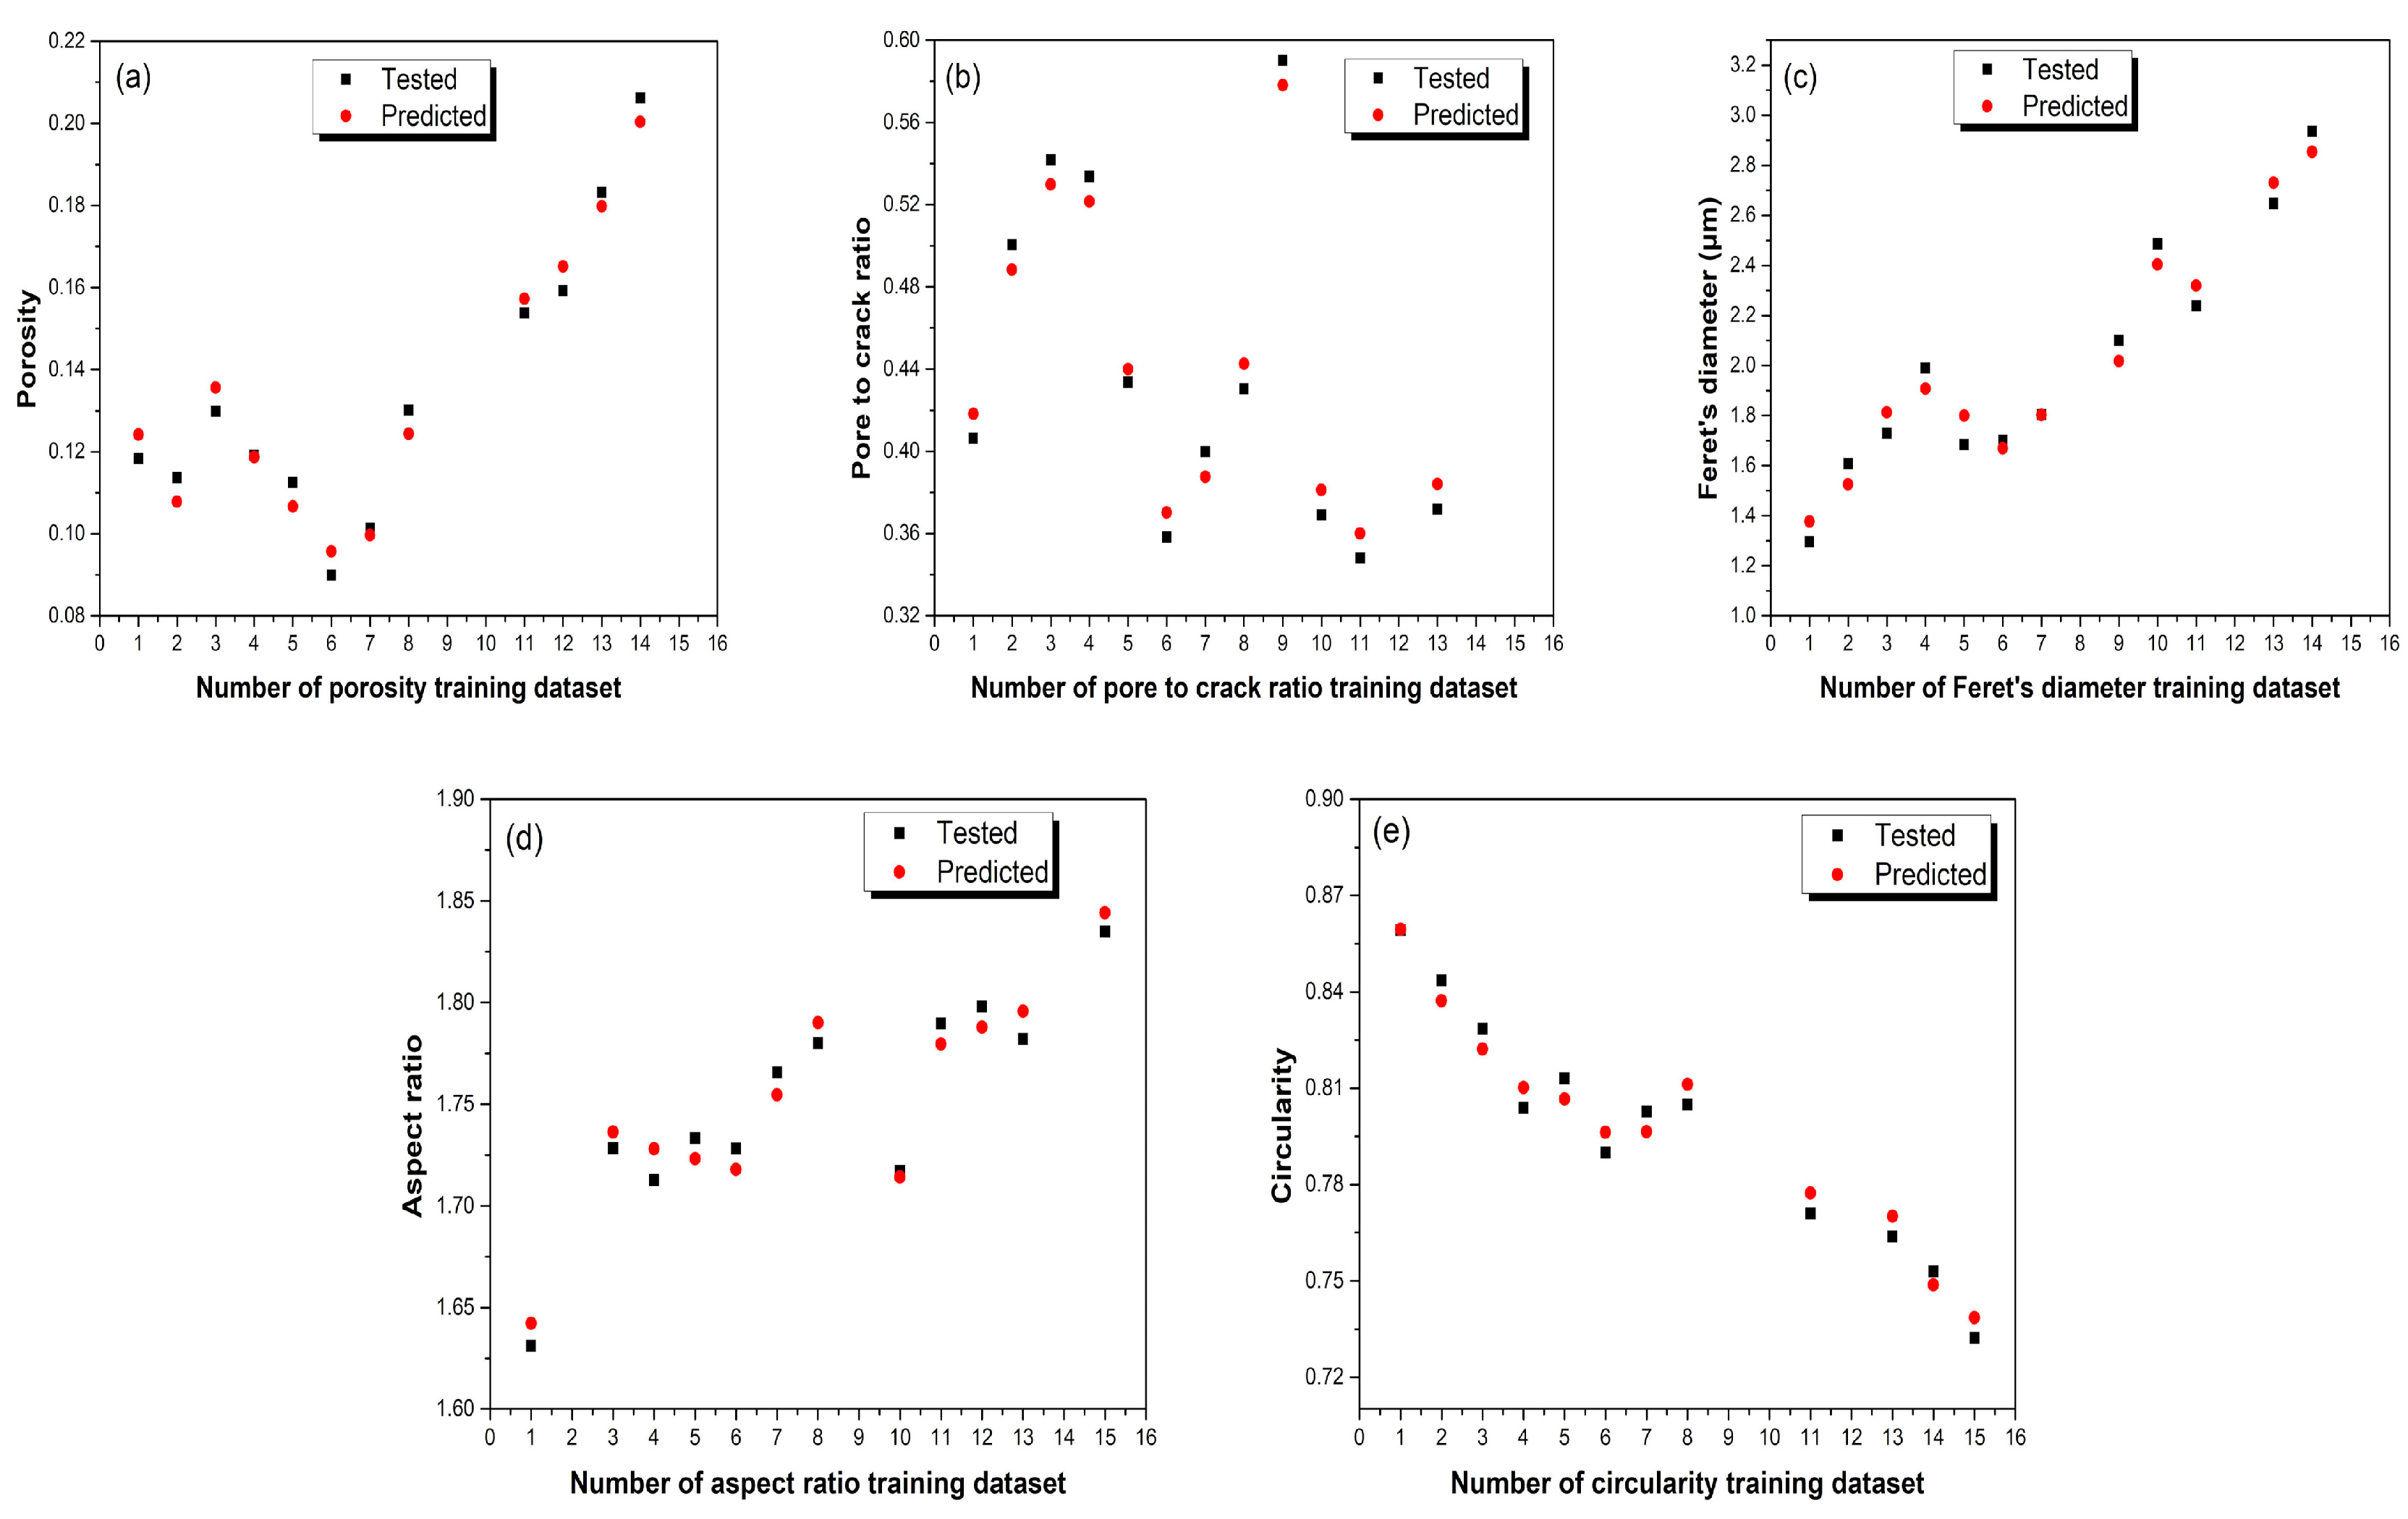
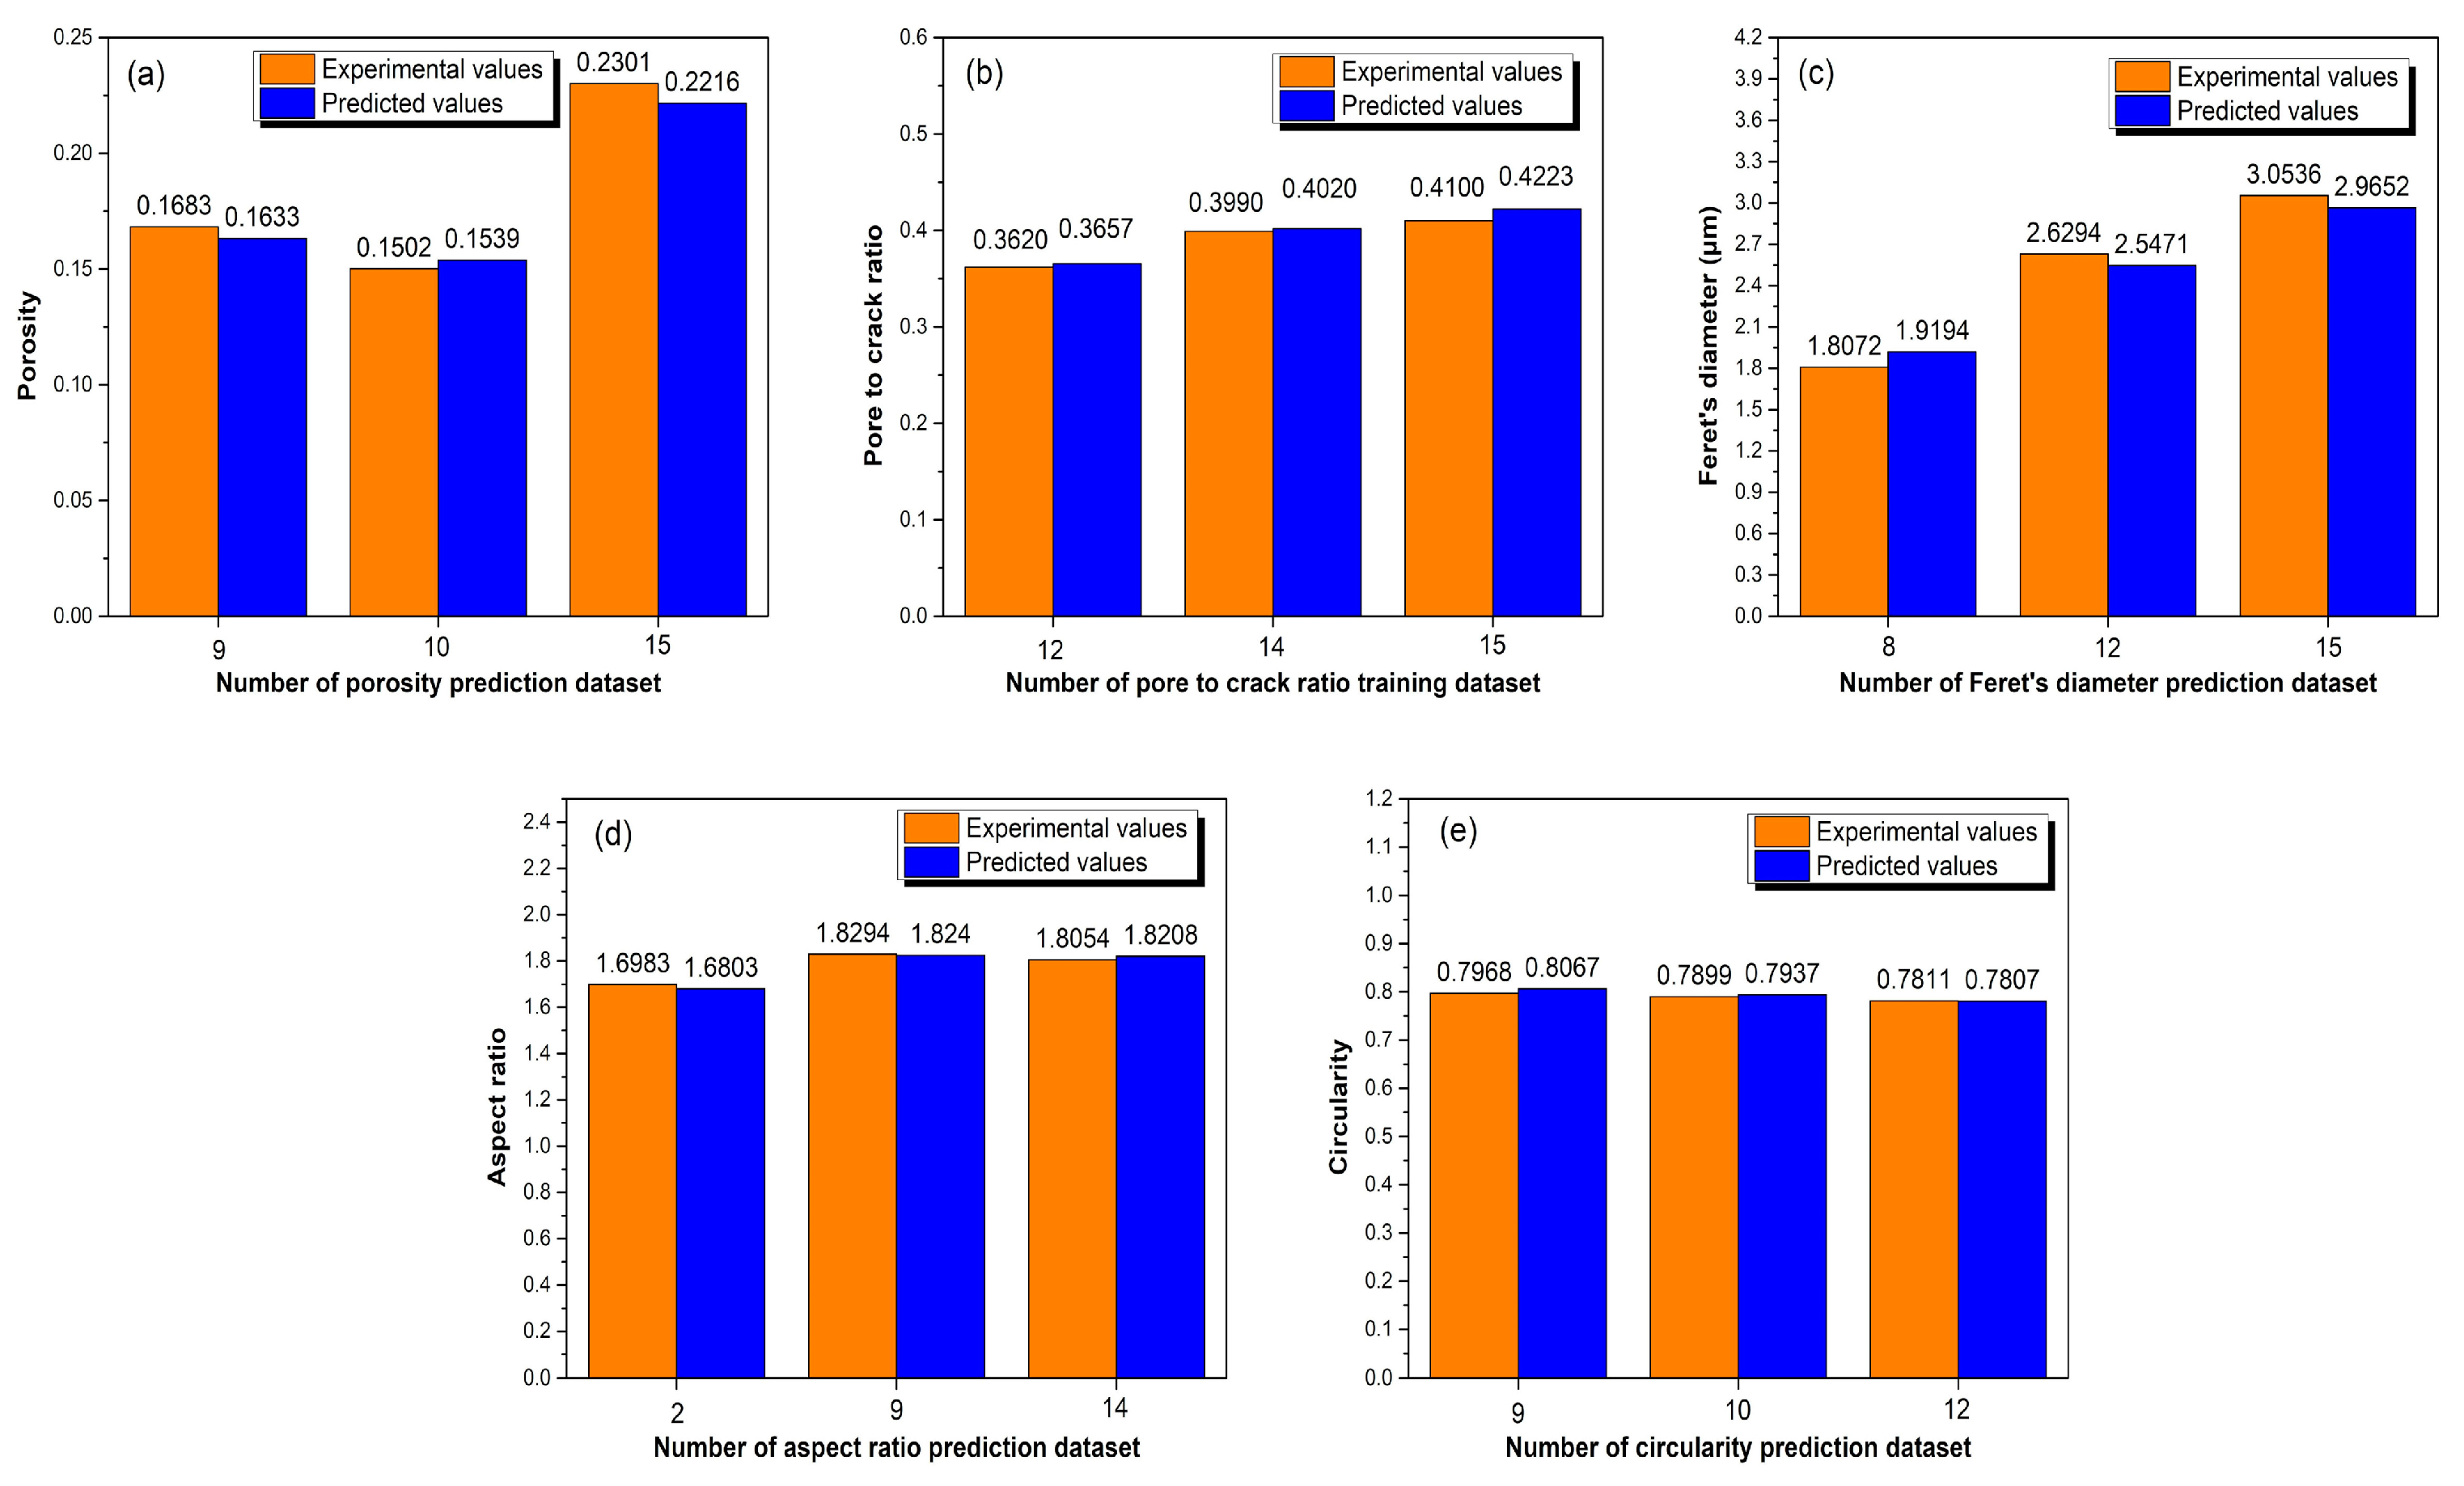
3.2. Analysis of the Training and Prediction Process of CS-SVM Model

As shown in Figure 3, the comparison results of the testing data and prediction data obtained by the CS-SVM model were given, where the black and red symbols stand for the tested and predicted values of microstructure features of 12 random samples, respectively, and these comparison results were in good consistency.
To compare the prediction results of the microstructural features of the 12 random training samples, accuracy and reliability of the CS-SVM training model were shown in Table 5, it can be seen clearly that the R2 of CS-SVM training model on all these microstructural features reached by over 95%, and all these error performance indices (RMSE, MAE, MAPE) had low values, all these indicators meant that the CS-SVM training model obtained by 12 random samples had high accuracy and reliability in microstructural features prediction.
To verify the prediction accuracy and reliability of our proposed CS-SVM model, the remaining three samples were used to check the performance of CS-SVM model, as shown in Figure 4, the orange and blue symbols stand for the experimental and predicted values of microstructure features of three remaining random samples, respectively, these comparison results were in also good agreement.
In the same way, to compare the prediction results of the microstructural features of the three remaining random samples, accuracy and reliability of the CS-SVM training model were shown in Table 6, it can be seen clearly that the R2 of CS-SVM training model on all these microstructural features also reached by over 95%, and all these error performance indices (RMSE, MAE, MAPE) also had low values, all these indicators meant that the CS-SVM training model obtained by 12 random samples had high accuracy and reliability in microstructural features prediction. It indicated that the CS-SVM model was very accurate in predicting all the microstructure features of APS coatings, even though some microstructure features changed slightly when the processing parameters changed significantly, so the CS-SVM model could meet the requirements in microstructure feature prediction.

4. Conclusions

In this work, APS TBCs was deposited with various powder sizes at different spray distances and power to acquire samples with various microstructural features, including porosity ω , pore-to-crack ratio k, maximum Feret’s diameter Df, aspect ratio AR, circularity Cr, owing to the variation of melting indices during the preparation process. An SVM model had been optimized by the CS algorithm, employed to build regression models, and trained to predict the coating microstructural features using the APS processing parameters. Fifteen samples were conducted to set up the data set for the training and prediction of the CS-SVM model. Five CS-SVM models with high R2 values (>95%) and low error values (<0.1), in terms of five kinds of microstructure features prediction, were achieved by 12 random samples. The accuracy and reliability of the CS-SVM models have been further verified by the remaining three random samples test sets, where the R2 values also reached by over 95% and error values were less than 0.1. Undoubtedly, these indicators proved that the proposed novel CS-SVM model in this work is very suitable for small sample regression prediction and its performance could meet the accuracy needed in actual microstructure features prediction. Additionally, this novel hybrid machine-learning method will potentially be extensively employed to establish the relationship among the process parameters, microstructure features, and service performance, and to monitor and ensure the integrity and safety of TBCs.

Author Contributions

Data curation, D.Y.; funding acquisition, W.W.; investigation, D.Y., W.W., Z.X., H.Z., and Y.L.; methodology, D.Y., W.W., C.Y., and H.Z.; project administration, W.W.; resources, W.W.; software, D.Y., Z.X., and C.Y.; supervision, D.Y. and W.W.; validation, Z.X.; writing—original draft, D.Y.; writing—review and editing, W.W. All authors have read and agreed to the published version of the manuscript.

Funding

This research was funded by the National Natural Science Foundation of China (No. 51775189) and Science and Technology Commission of Shanghai Municipality Project (No. 16DZ2260604).

Conflicts of Interest

The authors declare no conflict of interest.

References

  1. Clarke, D.R.; Levi, C.G. Materials design for the next generation thermal barrier coatings. Annu. Rev. Mater. Sci. 2003, 33, 383–417. [Google Scholar] [CrossRef]
  2. Padture, N.P.; Gell, M.; Jordan, E.H. Thermal barrier coatings for gas-turbine engine applications. Science 2002, 296, 280–284. [Google Scholar] [CrossRef] [PubMed]
  3. Ye, D.; Wang, W.; Huang, J.; Lu, X.; Zhou, H. Nondestructive interface morphology characterization of thermal barrier coatings using terahertz time-domain spectroscopy. Coatings 2019, 9, 89. [Google Scholar] [CrossRef] [Green Version]
  4. Clarke, D.R.; Phillpot, S.R. Thermal barrier coating materials. Mater. Today 2005, 8, 22–29. [Google Scholar] [CrossRef]
  5. Gizynski, M.; Chen, X.; Dusautoy, N.; Araki, H.; Kuroda, S.; Watanabe, M.; Pakiela, Z. Comparative study of the failure mechanism of atmospheric and suspension plasma sprayed thermal barrier coatings. Surf. Coat. Technol. 2019, 370, 163–176. [Google Scholar] [CrossRef]
  6. Pia, G.; Casnedi, L.; Sanna, U. Porosity and pore size distribution influence on thermal conductivity of Yttria-stabilized zirconia: Experimental findings and model predictions. Ceram. Int. 2016, 42, 8. [Google Scholar] [CrossRef]
  7. Huang, Y.; Hu, N.; Zeng, Y.; Song, X.; Lin, C.; Liu, Z.; Zhang, J. Effect of different types of pores on thermal conductivity of YSZ thermal barrier coatings. Coatings 2019, 9, 138. [Google Scholar] [CrossRef] [Green Version]
  8. Cernuschi, F.; Bison, P.G.; Marinetti, S.S.; Scardi, P. Thermophysical, mechanical and microstructural characterization of aged free-standing plasma-sprayed zirconia coatings. Acta Mater. 2008, 56, 4477–4488. [Google Scholar] [CrossRef]
  9. Curry, N.; Markocsan, N.; Li, X.H.; Tricoire, A.; Dorfman, M. Next generation thermal barrier coatings for the gas turbine industry. J. Therm. Spray Technol. 2011, 20, 108–115. [Google Scholar] [CrossRef]
  10. Paul, S. Assessing coating reliability through pore architecture evaluation. J. Therm. Spray Technol. 2010, 19, 779–786. [Google Scholar] [CrossRef]
  11. Fauchais, P.; Vardelle, M.; Goutier, S. Latest researches advances of plasma spraying: From splat to coating formation. J. Therm. Spray Technol. 2016, 25, 1534–1553. [Google Scholar] [CrossRef]
  12. Mutter, M.; Mauer, G.; Mücke, R.; Guillon, O.; Vaßen, R. Correlation of splat morphologies with porosity and residual stress in plasma-sprayed YSZ coatings. Surf. Coat. Technol. 2017, 318, 157–169. [Google Scholar] [CrossRef]
  13. Kumar, D.; Pandey, K.N. Optimization of the process parameters in generic thermal barrier coatings using the Taguchi method and grey relational analysis. Proc. Inst. Mech. Eng. Part L J. Mater. Des. Appl. 2015, 231, 600–610. [Google Scholar] [CrossRef]
  14. Praveen, A.S.; Sarangan, J.; Suresh, S.; Channabasappa, B.H. Optimization and erosion wear response of NiCrSiB/WC–Co HVOF coating using Taguchi method. Ceram. Int. 2016, 42, 1094–1104. [Google Scholar] [CrossRef]
  15. Zhang, B.C.; Chen, K.; Baddour, N.; Patnaik, P.C. Failure and life evaluation of EB-PVD thermal barrier coatings using temperature-process-dependent model parameters. Corros. Sci. 2019, 156, 1–9. [Google Scholar] [CrossRef]
  16. Li, M.; Christofides, P.D. Modeling and control of High-Velocity Oxygen-Fuel (HVOF) thermal spray: A tutorial review. J. Therm. Spray Technol. 2009, 18, 753–768. [Google Scholar] [CrossRef] [Green Version]
  17. Ranjbar-Far, M.; Absi, J.; Mariaux, G. Finite element modeling of the different failure mechanisms of a plasma sprayed thermal barrier coatings system. J. Therm. Spray Technol. 2012, 21, 1234–1244. [Google Scholar] [CrossRef]
  18. Liu, Z.; Zhu, D.; Lee, K.; Kim, A.S.; Raju, L.; Cai, W. Compounding meta-atoms into metamolecules with hybrid artificial intelligence techniques. Adv. Mater. 2019, 1904790. [Google Scholar] [CrossRef] [Green Version]
  19. Liu, M.; Yu, Z.; Zhang, Y.; Wu, H.; Liao, H.; Deng, S. Prediction and analysis of high velocity oxy fuel (HVOF) sprayed coating using artificial neural network. Surf. Coat. Technol. 2019, 378, 124988. [Google Scholar] [CrossRef]
  20. Ye, D.; Wang, W.; Zhou, H.; Fang, H.; Huang, J.; Li, Y.; Gong, H.; Li, Z. Characterization of thermal barrier coatings microstructural features using terahertz spectroscopy. Surf. Coat. Technol. 2020, 394, 125836. [Google Scholar] [CrossRef]
  21. Kutner, M.H.; Nachtsheim, C.J.; Neter, J.; Li, W. Applied Linear Statistical Models; McGraw-Hill Irwin: Boston, MA, USA, 2005. [Google Scholar]
  22. Chen, M. Matlab Neural Network Principle and Example Solution; Tsinghua University Press: Beijing, China, 2013. [Google Scholar]
  23. Gao, Y.; Pan, J.; Ji, G.; Gao, F. A time-series modeling method based on the boosting gradient-descent theory. Sci. China Technol. Sci. 2011, 54, 1325. [Google Scholar] [CrossRef]
  24. Wang, K.C. The Grey-Based Artificial Intelligence Modeling of Thermal Error for Machine Tools. J. Grey Syst. 2010, 22, 353–366. [Google Scholar]
  25. Kim, S.; Yu, Z.; Kil, R.M.; Lee, M. Deep learning of support vector machines with class probability output networks. Neural Netw. 2015, 64, 19–28. [Google Scholar] [CrossRef] [PubMed]
  26. Ge, H.; Jiang, Y.; Xu, Z.; Lian, F.; Zhang, Y.; Xia, S. Identification of wheat quality using THz spectrum. Opt. Express 2014, 22, 12533–12544. [Google Scholar] [CrossRef]
  27. Peng, Y.; Shi, C.; Xu, M.; Kou, T.; Wu, X.; Song, B.; Ma, H.; Guo, S.; Liu, L.; Zhu, Y. Qualitative and quantitative identification of components in mixture by Terahertz spectroscopy. IEEE Trans. Terahertz Sci. Technol. 2018, 8, 696–701. [Google Scholar] [CrossRef]
  28. Suganyadevi, M.V.; Babulal, C.K. Support Vector Regression Model for the prediction of Loadability Margin of a Power System. Appl. Soft Comput. 2014, 24, 304–315. [Google Scholar] [CrossRef]
  29. Li, X.Z.; Kong, J.M. Application of GA–SVM method with parameter optimization for landslide development prediction. Nat. Hazards Earth Syst. Sci. 2014, 14, 525–533. [Google Scholar] [CrossRef] [Green Version]
  30. Bessedik, S.A.; Hadi, H. Prediction of flashover voltage of insulators using least squares support vector machine with particle swarm optimisation. Electr. Power Syst. Res. 2013, 104, 87–92. [Google Scholar] [CrossRef]
  31. Cheng, J.; Fang, J.; Wu, W.; Li, J. Temperature drift modeling and compensation of RLG based on PSO tuning SVM. Measurement 2014, 55, 246–254. [Google Scholar] [CrossRef]
  32. Barthelemy, P.; Bertolotti, J.; Wiersma, D.A. Lévy flight for light. Nature 2008, 453, 495–498. [Google Scholar] [CrossRef]
  33. Yang, X.S.; Deb, S. Cuckoo search via levy flights. arXiv 2010, arXiv:1003.1594. Available online: https://arxiv.org/abs/1003.1594 (accessed on 23 July 2020).
  34. Jiang, M.; Luo, J.; Jiang, D.; Xiong, J.; Song, H.; Shen, J. A Cuckoo Search-Support Vector Machine Model for Predicting Dynamic Measurement Errors of Sensors. IEEE Access 2016, 4, 5030–5037. [Google Scholar] [CrossRef]
  35. Sobhanverdi, R.; Akbari, A. Porosity and microstructural features of plasma sprayed Yttria stabilized zirconia thermal barrier coatings. Ceram. Int. 2015, 41, 14517–14528. [Google Scholar] [CrossRef]
  36. Ghai, R.S.; Chen, K.; Baddour, N. Modelling thermal conductivity of porous thermal barrier coatings. Coatings 2019, 9, 101. [Google Scholar] [CrossRef] [Green Version]
  37. Vapnik, V.N. The Nature of Statistical Learning Theory; Springer: Berlin, Germany, 2000. [Google Scholar]
  38. Cristianini, N.; Shawe-Taylor, J. An Introduction to Support Vector Machines and Other Kernel-Based Learning Methods; Cambridge University Press: Cambridge, UK, 2000; pp. 93–124. [Google Scholar]
  39. Smola, A.J.; Scholkopf, B. A tutorial on support vector regression. Stat. Comput. 2004, 14, 199–222. [Google Scholar] [CrossRef] [Green Version]
  40. Arunnehru, J.; Kalaiselvi Geetha, M. Difference intensity distance group pattern for recognizing actions in video using Support Vector Machines. Pattern Recognit. Image Anal. 2016, 26, 688–696. [Google Scholar] [CrossRef]
  41. Özorhan, M.O.; Toroslu, İ.H.; Şehitoğlu, O.T. A strength-biased prediction model for forecasting exchange rates using support vector machines and genetic algorithms. Soft Comput. 2017, 21, 6653–6671. [Google Scholar] [CrossRef]
  42. Yang, X.S.; Deb, S. Cuckoo search via lévy flights. In Proceedings of the 2009 World Congress on Nature & Biologically Inspired Computing (NaBIC), Coimbatore, India, 9–11 December 2009; pp. 210–214. [Google Scholar]
  43. Yang, X.S.; Deb, S. Multiobjective cuckoo search for design optimization. Comput. Oper. Res. 2013, 40, 1616–1624. [Google Scholar] [CrossRef]
  44. Long, W.; Liang, X.; Huang, Y.; Chen, Y. An effective hybrid cuckoo search algorithm for constrained global optimization. Neural. Comput. Appl. 2014, 25, 911–926. [Google Scholar] [CrossRef]
  45. Bai, Y.; Zhao, L.; Qu, Y.; Fu, Q.; Wang, Y.; Liu, K.; Tang, J.; Li, B.; Han, Z. Particle in-flight behavior and its influence on the microstructure and properties of supersonic-atmospheric-plasma-sprayed nanostructured thermal barrier coatings. J. Alloys Compd. 2015, 644, 873–882. [Google Scholar] [CrossRef]
  46. Liu, K.; Tang, J.; Bai, Y.; Yang, Q.; Wang, Y.; Kang, Y.; Zhao, L.; Zhang, P.; Han, Z. Particle in-flight behavior and its influence on the microstructure and mechanical property of plasma sprayed La2Ce2O7 thermal barrier coatings. Mater. Sci. Eng. A 2015, 625, 177–185. [Google Scholar] [CrossRef]
Figure 1. Particle sizes of the two batches 8YSZ powders. (a) 40–96 μm; (b) 15–55 μm.
Coatings 10 00704 g001
Figure 2. Implementation of thresholding and opening operation for microstructural features extraction.
Coatings 10 00704 g002
Figure 3. The testing results and the prediction results of the microstructural features of the CS-SVM training model. (a) Porosity; (b) pore-to-crack ratio; (c) maximum Feret’s diameter; (d) aspect ratio; (e) circularity.
Coatings 10 00704 g003
Figure 4. The testing results and the prediction results of the microstructural features of the CS-SVM prediction model. (a) Porosity; (b) pore-to-crack ratio; (c) maximum Feret’s diameter; (d) aspect ratio; (e) circularity.
Coatings 10 00704 g004
Table 1. The atmospheric-plasma-sprayed (APS) process parameters for deposition of the 8 wt.% yttria partially stabilized zirconia (YSZ) ceramic top coatings.
APS ParametersOptional Indicators
Particle size (μm)40–96, 15–55
Spray distance L (mm)70, 80, 90, 100, 110, and 120
Spray power (kW)24, 30, 33, and 36
Powder feed rate (L/min)10
gun speed (cm/s)15
Table 2. Definitions of various microstructure features.
Microstructure FeatureDefinitionSymbol
PorosityThe volume percent of poreω
Pore-to-crack ratioThe ratio of the globular pore area to crack network areak
Maximum Feret’s diameterMaximum distance between two points on the boundaryDf
CircularityA/p2 (A is the pore area and p is the pore perimeter)Cr
Aspect ratioRatio of the longest diameter to shortest diameter (best fitting ellipse)AR
Table 3. Database for the training, validation, and test of the cuckoo search–support vector machine (CS-SVM) model.
No.APS Process ParametersMicrostructural Features (Average Value)
Particle Size (μm)Spray Distance (mm)Spray Power (kW)PorosityPore-to-Crack RatioMaximum Feret’s Diameter (μm)Aspect
Ratio
Circularity
115–55703611.83% ± 1.04%0.4062 ± 0.02221.2949 ± 0.21601.6312 ± 0.05190.8591 ± 0.0231
215–55803611.37% ± 1.63%0.5005 ± 0.04791.6076 ± 0.38021.6983 ± 0.05170.8436 ± 0.0130
315–55902412.98% ± 1.98%0.5419 ± 0.02781.7304 ± 0.18421.7283 ± 0.01360.8286 ± 0.0115
415–55903011.91% ± 1.02%0.5337 ± 0.03461.9900 ± 0.17231.7126 ± 0.01550.8039 ± 0.0052
515–55903311.25% ± 1.65%0.4336 ± 0.05171.6842 ± 0.31431.7333 ± 0.0431 0.8130 ± 0.0048
615–5590368.99% ± 0.96%0.3582 ± 0.03871.7011 ± 0.05911.7281 ± 0.0297 0.7899 ± 0.0134
715–551003610.14% ± 1.92%0.3998 ± 0.03011.8026 ± 0.12411.7658 ± 0.0295 0.8028 ± 0.0078
815–551103613.02% ± 1.44%0.4305 ± 0.01471.8072 ± 0.14071.7800 ± 0.0131 0.8049 ± 0.0049
915–551203616.83% ± 2.05%0.5902 ± 0.02712.0997 ± 0.22451.8294 ± 0.0384 0.7968 ± 0.0083
1040–96703615.02% ± 1.77%0.3690 ± 0.05712.4856 ± 0.13371.7172 ± 0.0271 0.7899 ± 0.0163
1140–96803615.38% ± 1.56%0.3480 ± 0.01942.2385 ± 0.15801.7898 ± 0.0167 0.7710 ± 0.0254
1240–96903615.93% ± 1.85%0.3620 ± 0.02012.6294 ± 0.20811.7981 ± 0.0635 0.7811 ± 0.0169
1340–961003618.31% ± 2.23%0.3720 ± 0.02882.6478 ± 0.23351.7821 ± 0.0215 0.7638 ± 0.0140
1440–961103620.62% ± 1.79%0.3990 ± 0.03022.9361 ± 0.35421.8054 ± 0.0457 0.7529 ± 0.0234
1540–961203623.01% ± 2.42%0.4100 ± 0.02563.0536 ± 0.28611.8350 ± 0.0529 0.7322 ± 0.0134
Table 4. Range analysis of three factors at each level.
Range AnalysisParticle Size (Factor A)Spray Distance (Factor B) Spray Power (Factor C) Influence Rank
Porosity0.0601 0.0771 0.0379 B > A > C
Pore-to-crack ratio0.0894 0.1142 0.1298 C > B > A
Maximum Feret’s diameter0.9188 0.6865 0.5078 A > B > C
Aspect ratio0.0538 0.1580 0.0508 B > A > C
Circularity0.0506 0.0600 0.7907 C > B > A
Table 5. The prediction performance of the 12 remaining random samples obtained by the CS-SVM model.
Training ResultsR2RMSEMAEMAPE
Porosity0.9773 0.0050 0.0046 0.0360
Pore-to-crack ratio0.9900 0.0118 0.0117 0.0273
Maximum Feret’s diameter (μm)0.97090.0794 0.07390.0382
Aspect ratio0.9569 0.0106 0.0102 0.0058
Circularity0.9759 0.0059 0.0057 0.0072
Table 6. The prediction performance of the 3 remaining random samples obtained by the CS-SVM model.
Prediction ResultsR2RMSEMAEMAPE
Porosity0.9922 0.0061 0.0057 0.0303
Pore-to-crack ratio0.9798 0.0076 0.0063 0.0159
Maximum Feret’s diameter (μm)0.9955 0.0954 0.09430.0408
Aspect ratio0.9767 0.0140 0.0130 0.0074
Circularity0.9953 0.0061 0.0047 0.0059

