The State of Trace Elements (In, Cu, Ag) in Sphalerite Studied by X-Ray Absorption Spectroscopy of Synthetic Minerals

 , and
, and
Abstract
:1. Introduction
2. Materials and Methods
2.1. Synthesis
2.2. Analytical Methods
2.3. X-Ray Absorption Spectroscopy (XAS) Measurements
2.4. XANES Spectra Analysis
2.5. EXAFS Spectra Fitting
2.6. DFT Calculations
3. Results
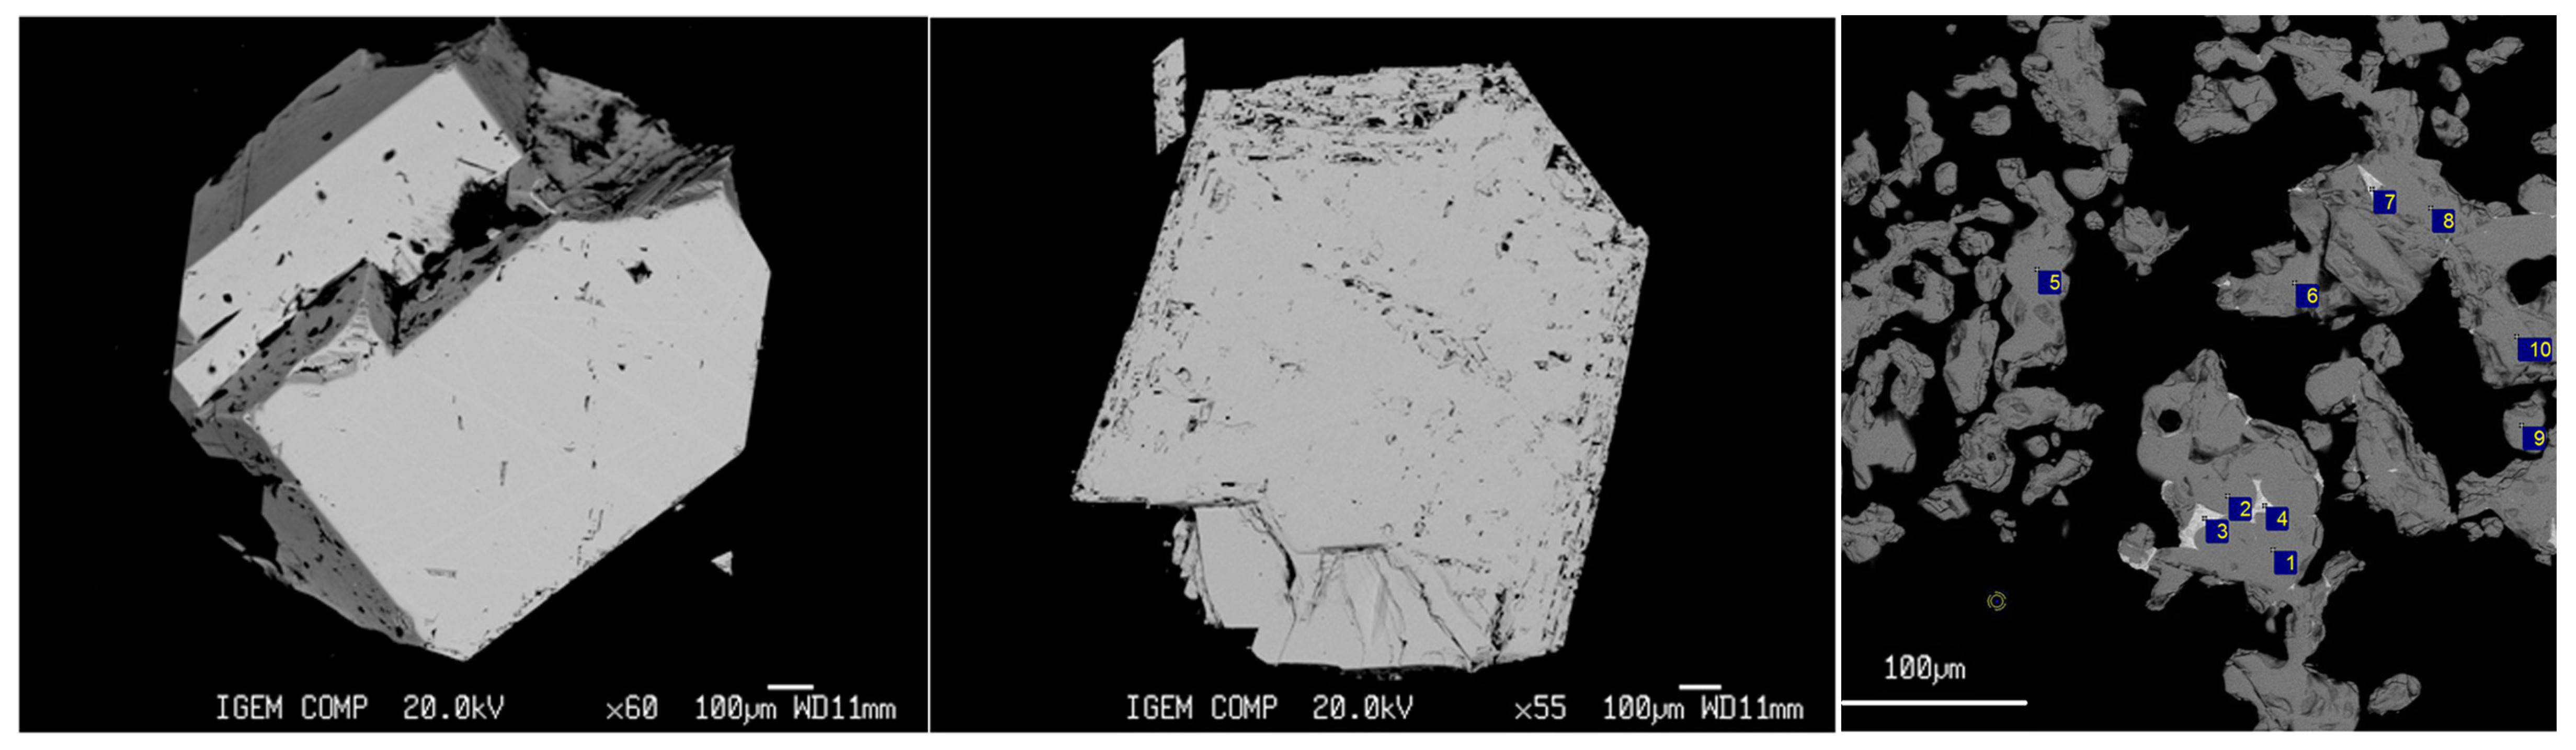
3.1. Phase and Chemical Composition of Samples
3.2. XANES Spectra Analysis
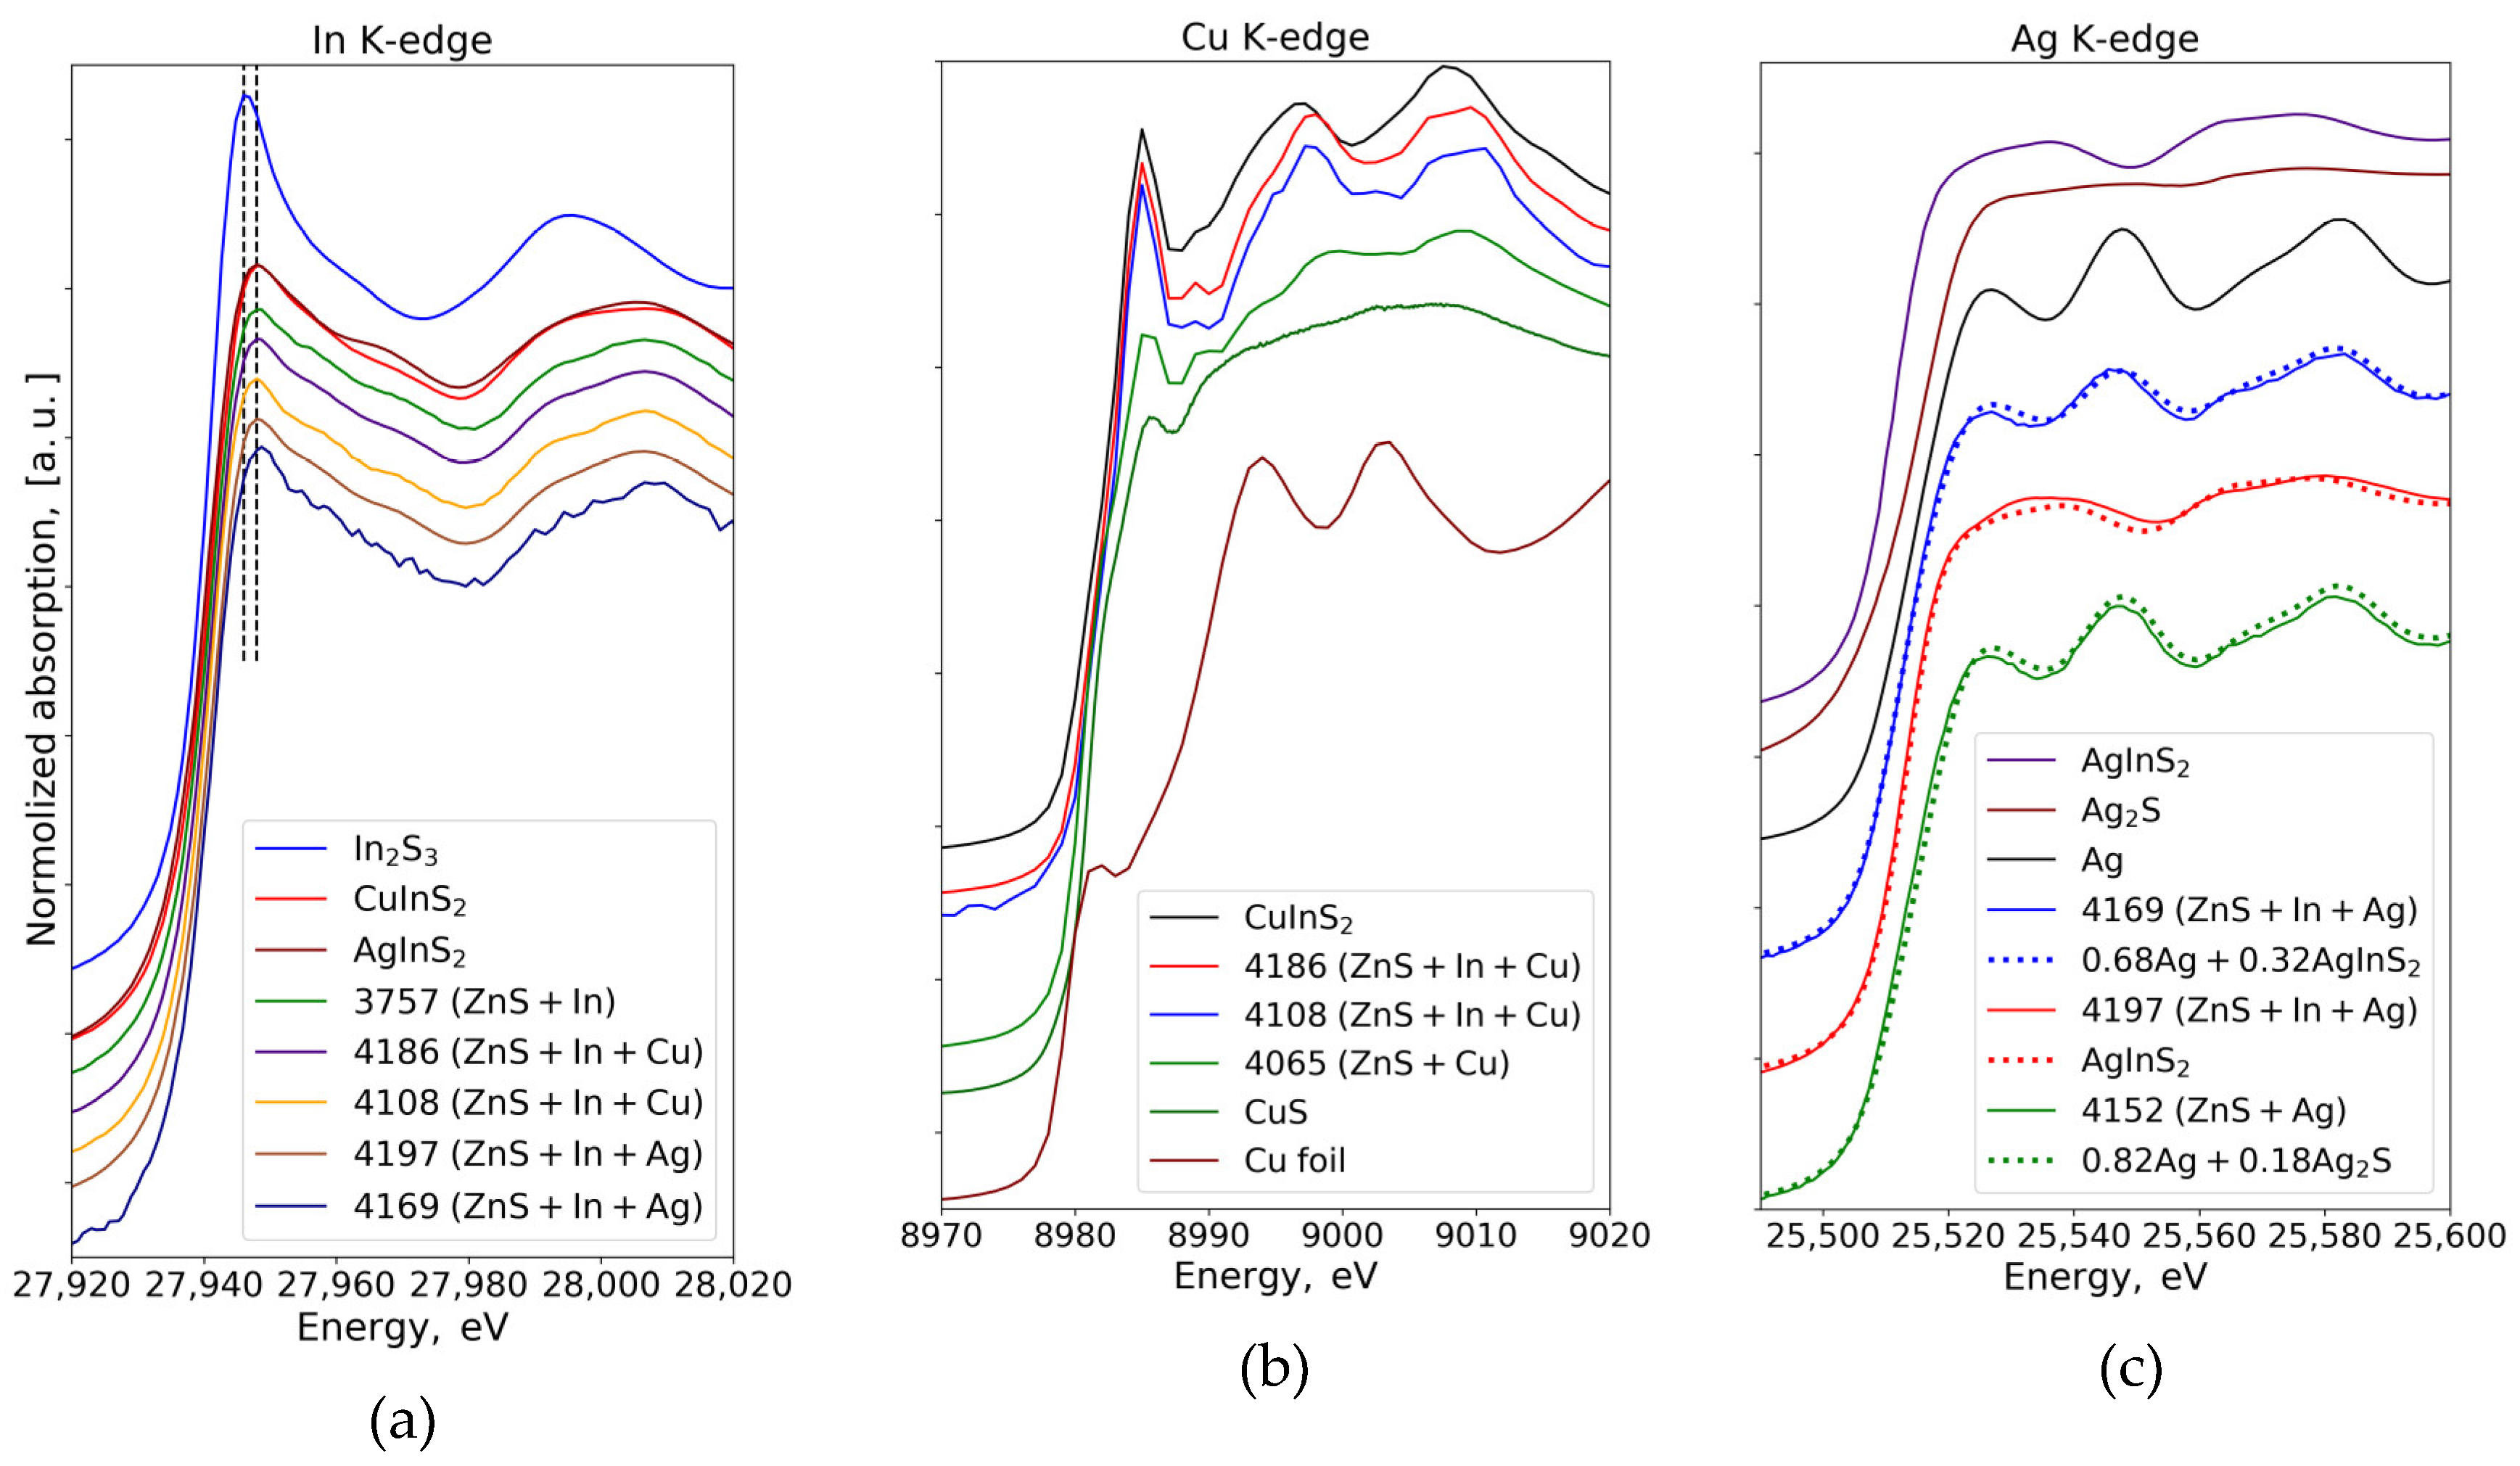
3.2.1. In K-Edge
3.2.2. Cu K-Edge
3.2.3. Ag K-Edge
3.3. EXAFS Analysis
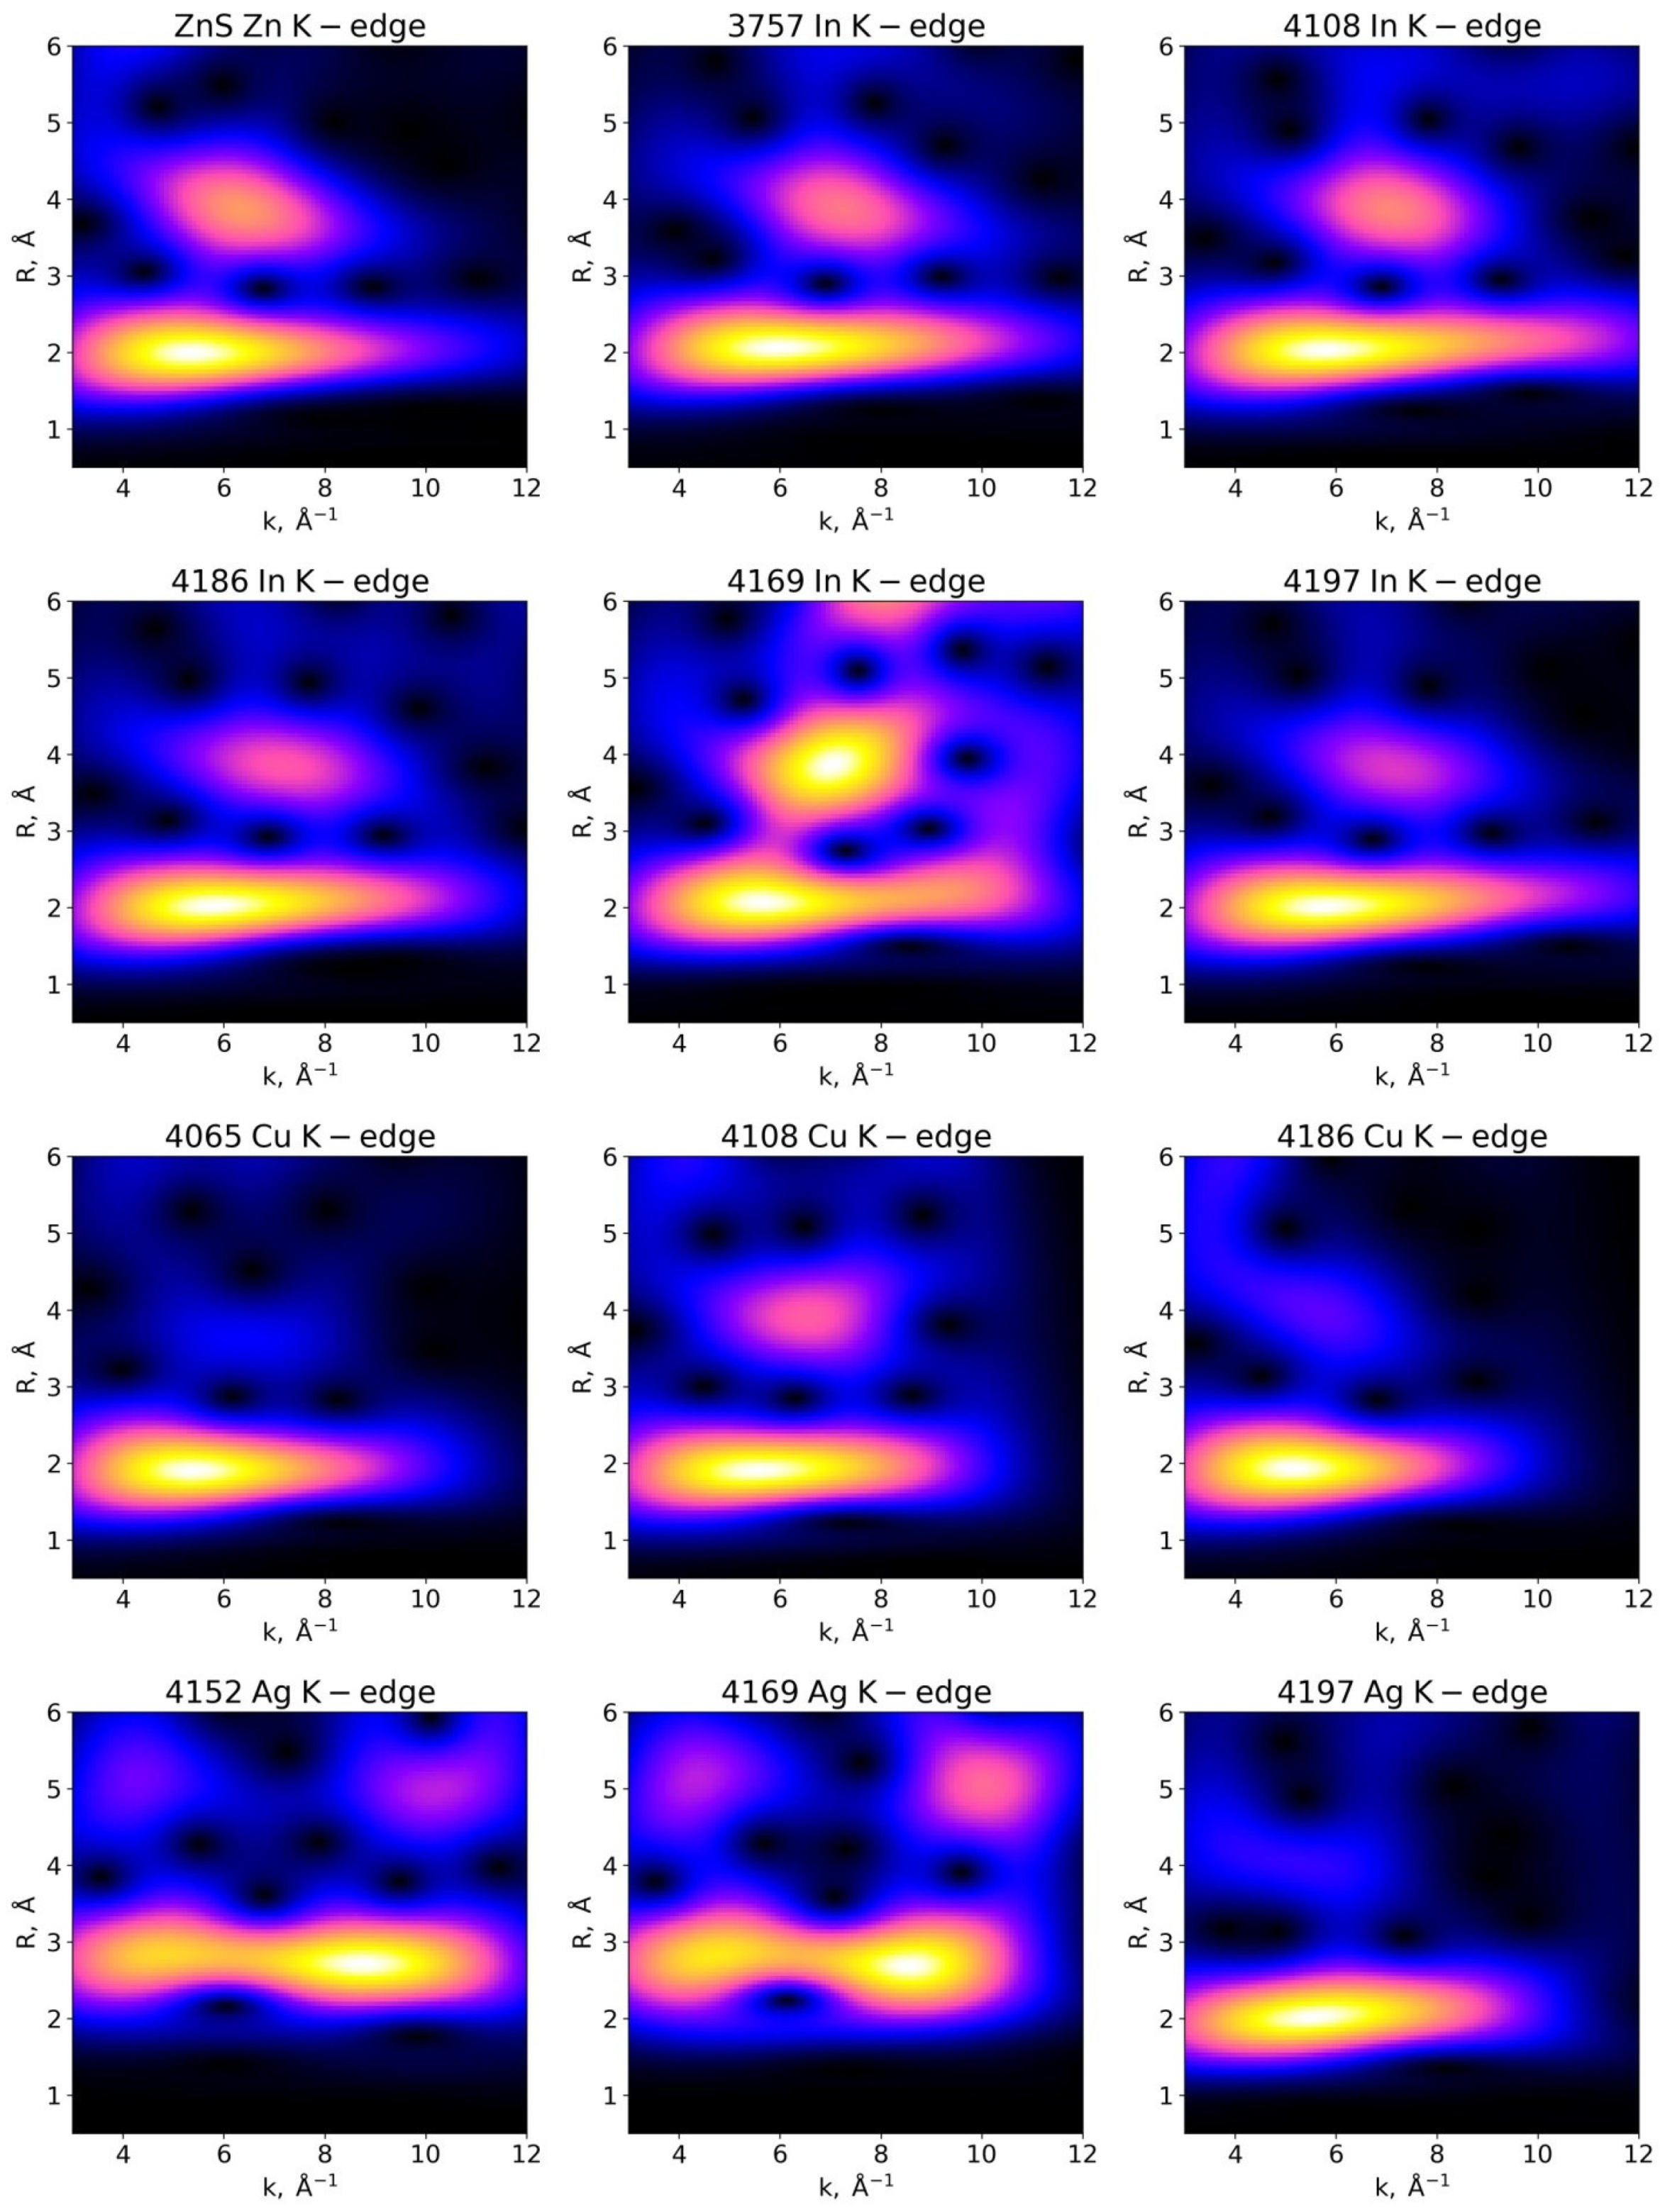
3.3.1. Examination of Wavelet Transforms (WTs)
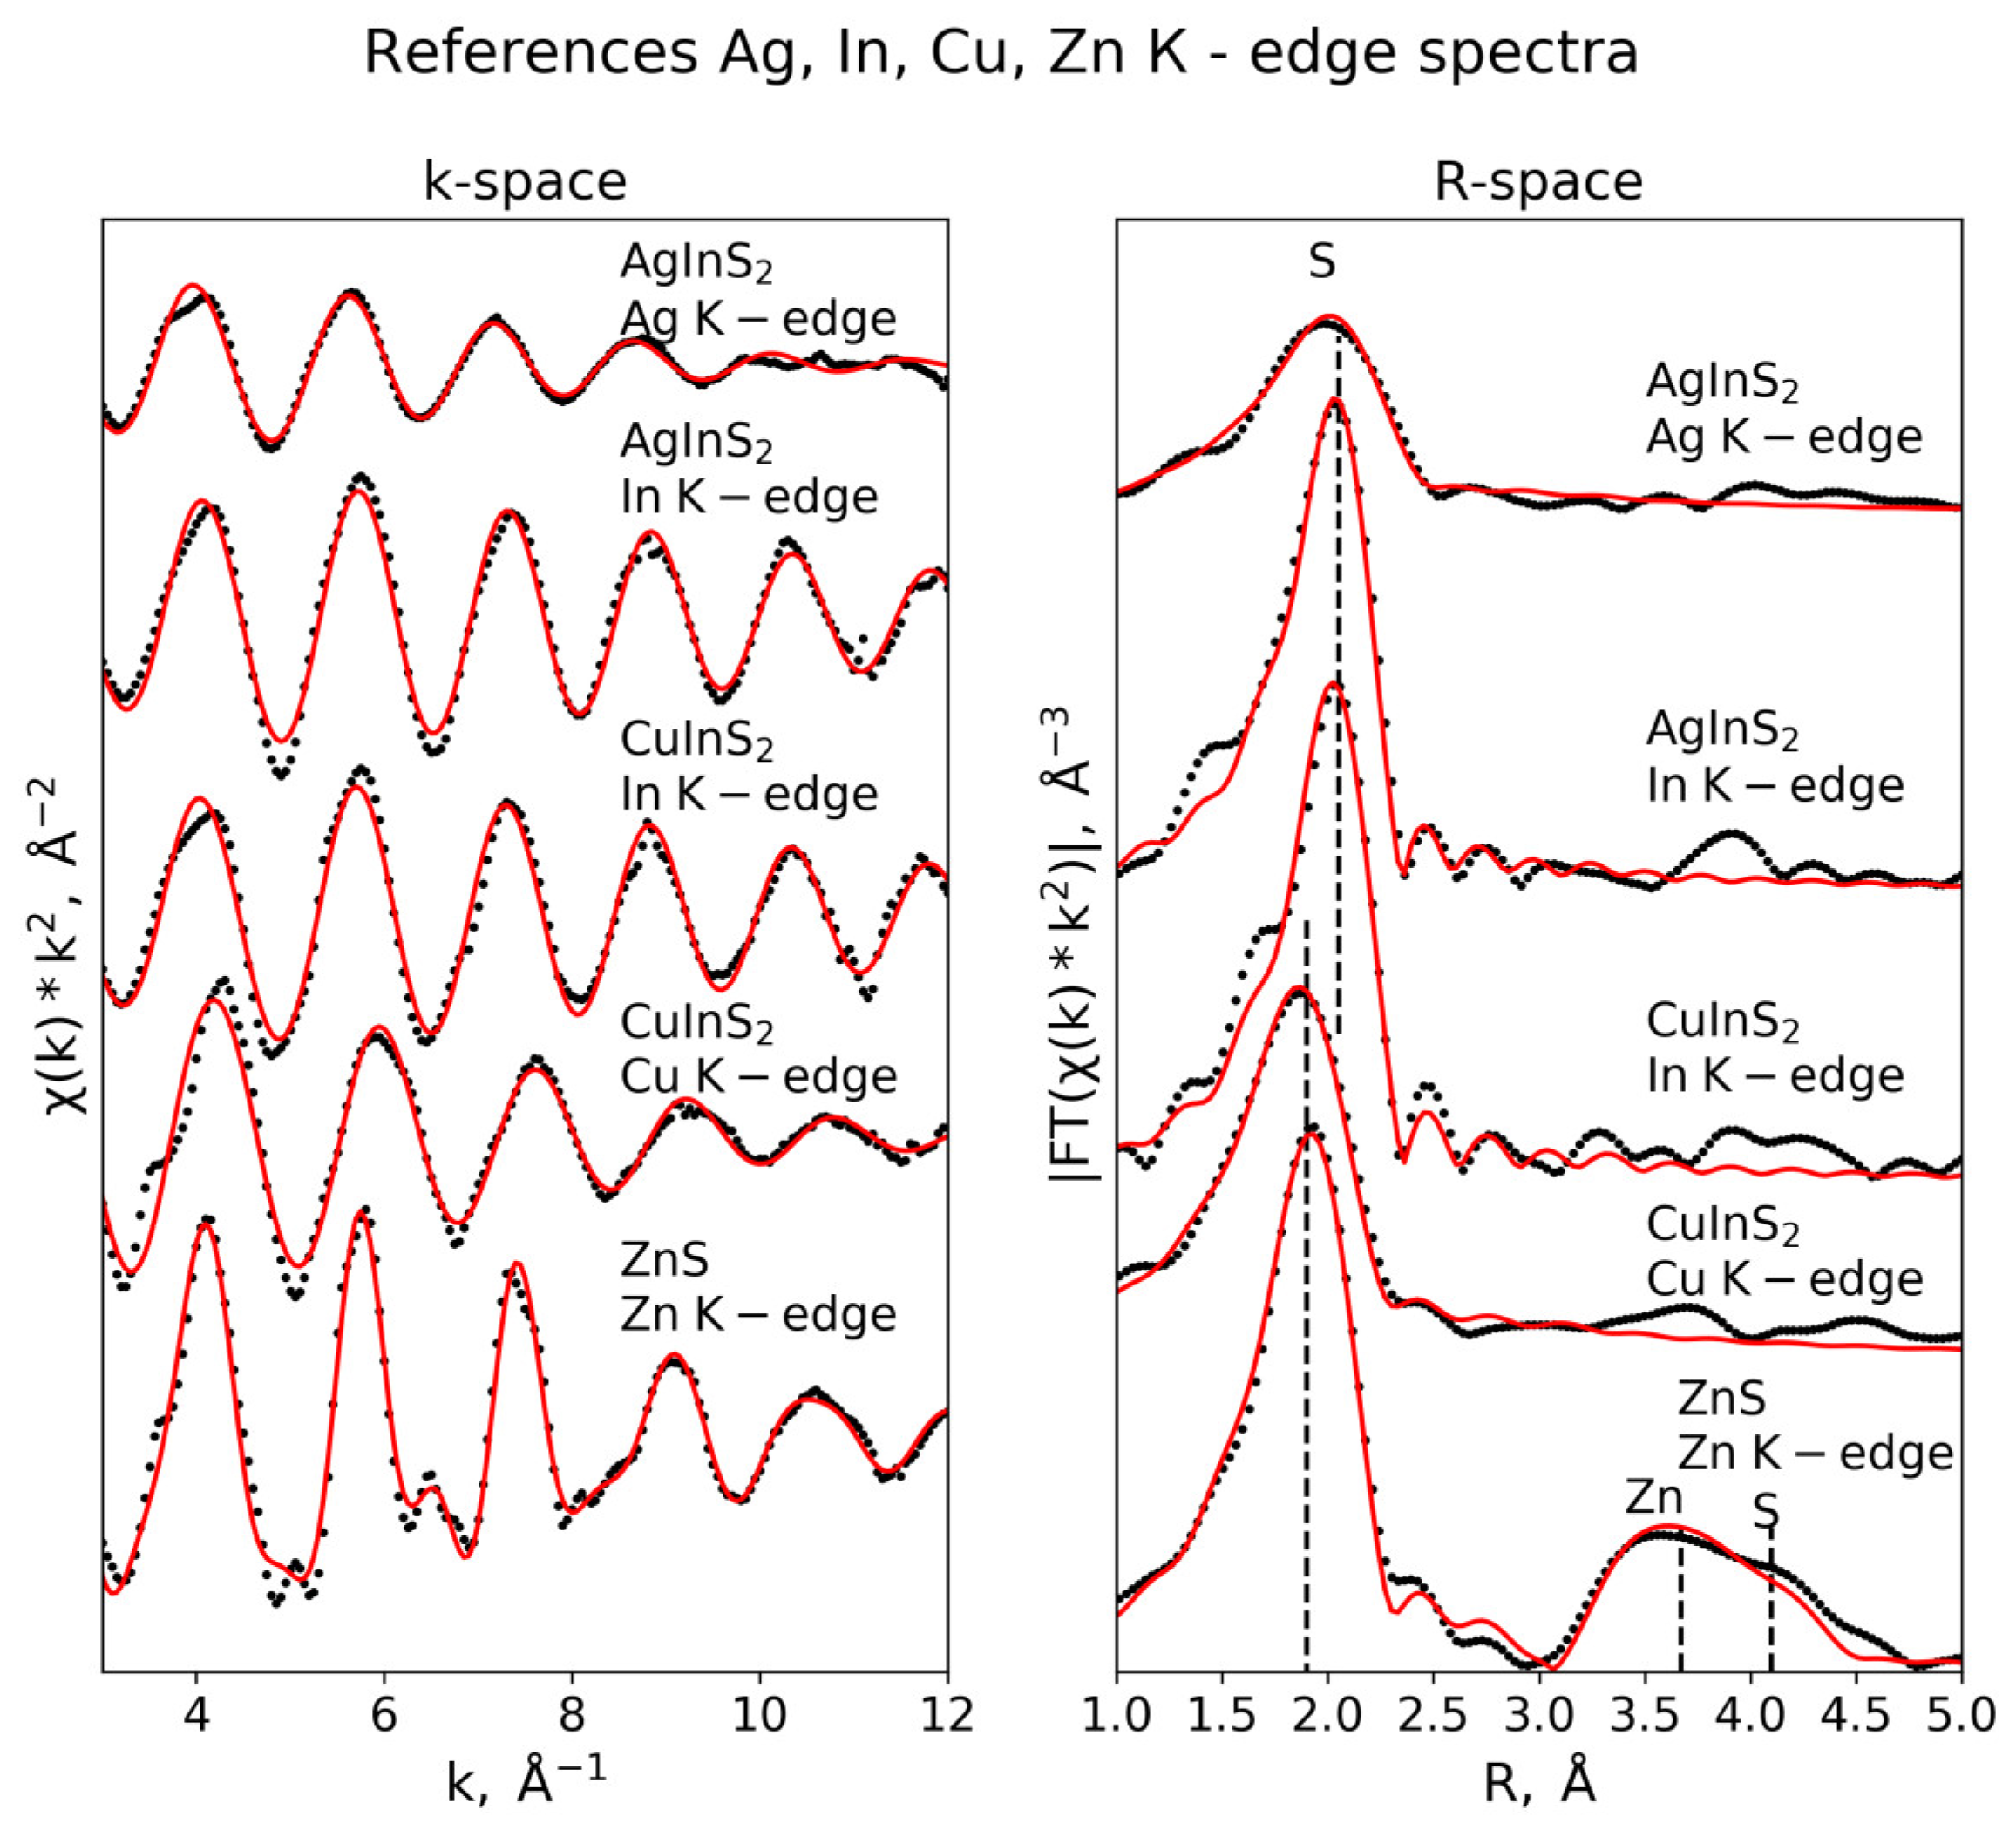
3.3.2. Reference Substances
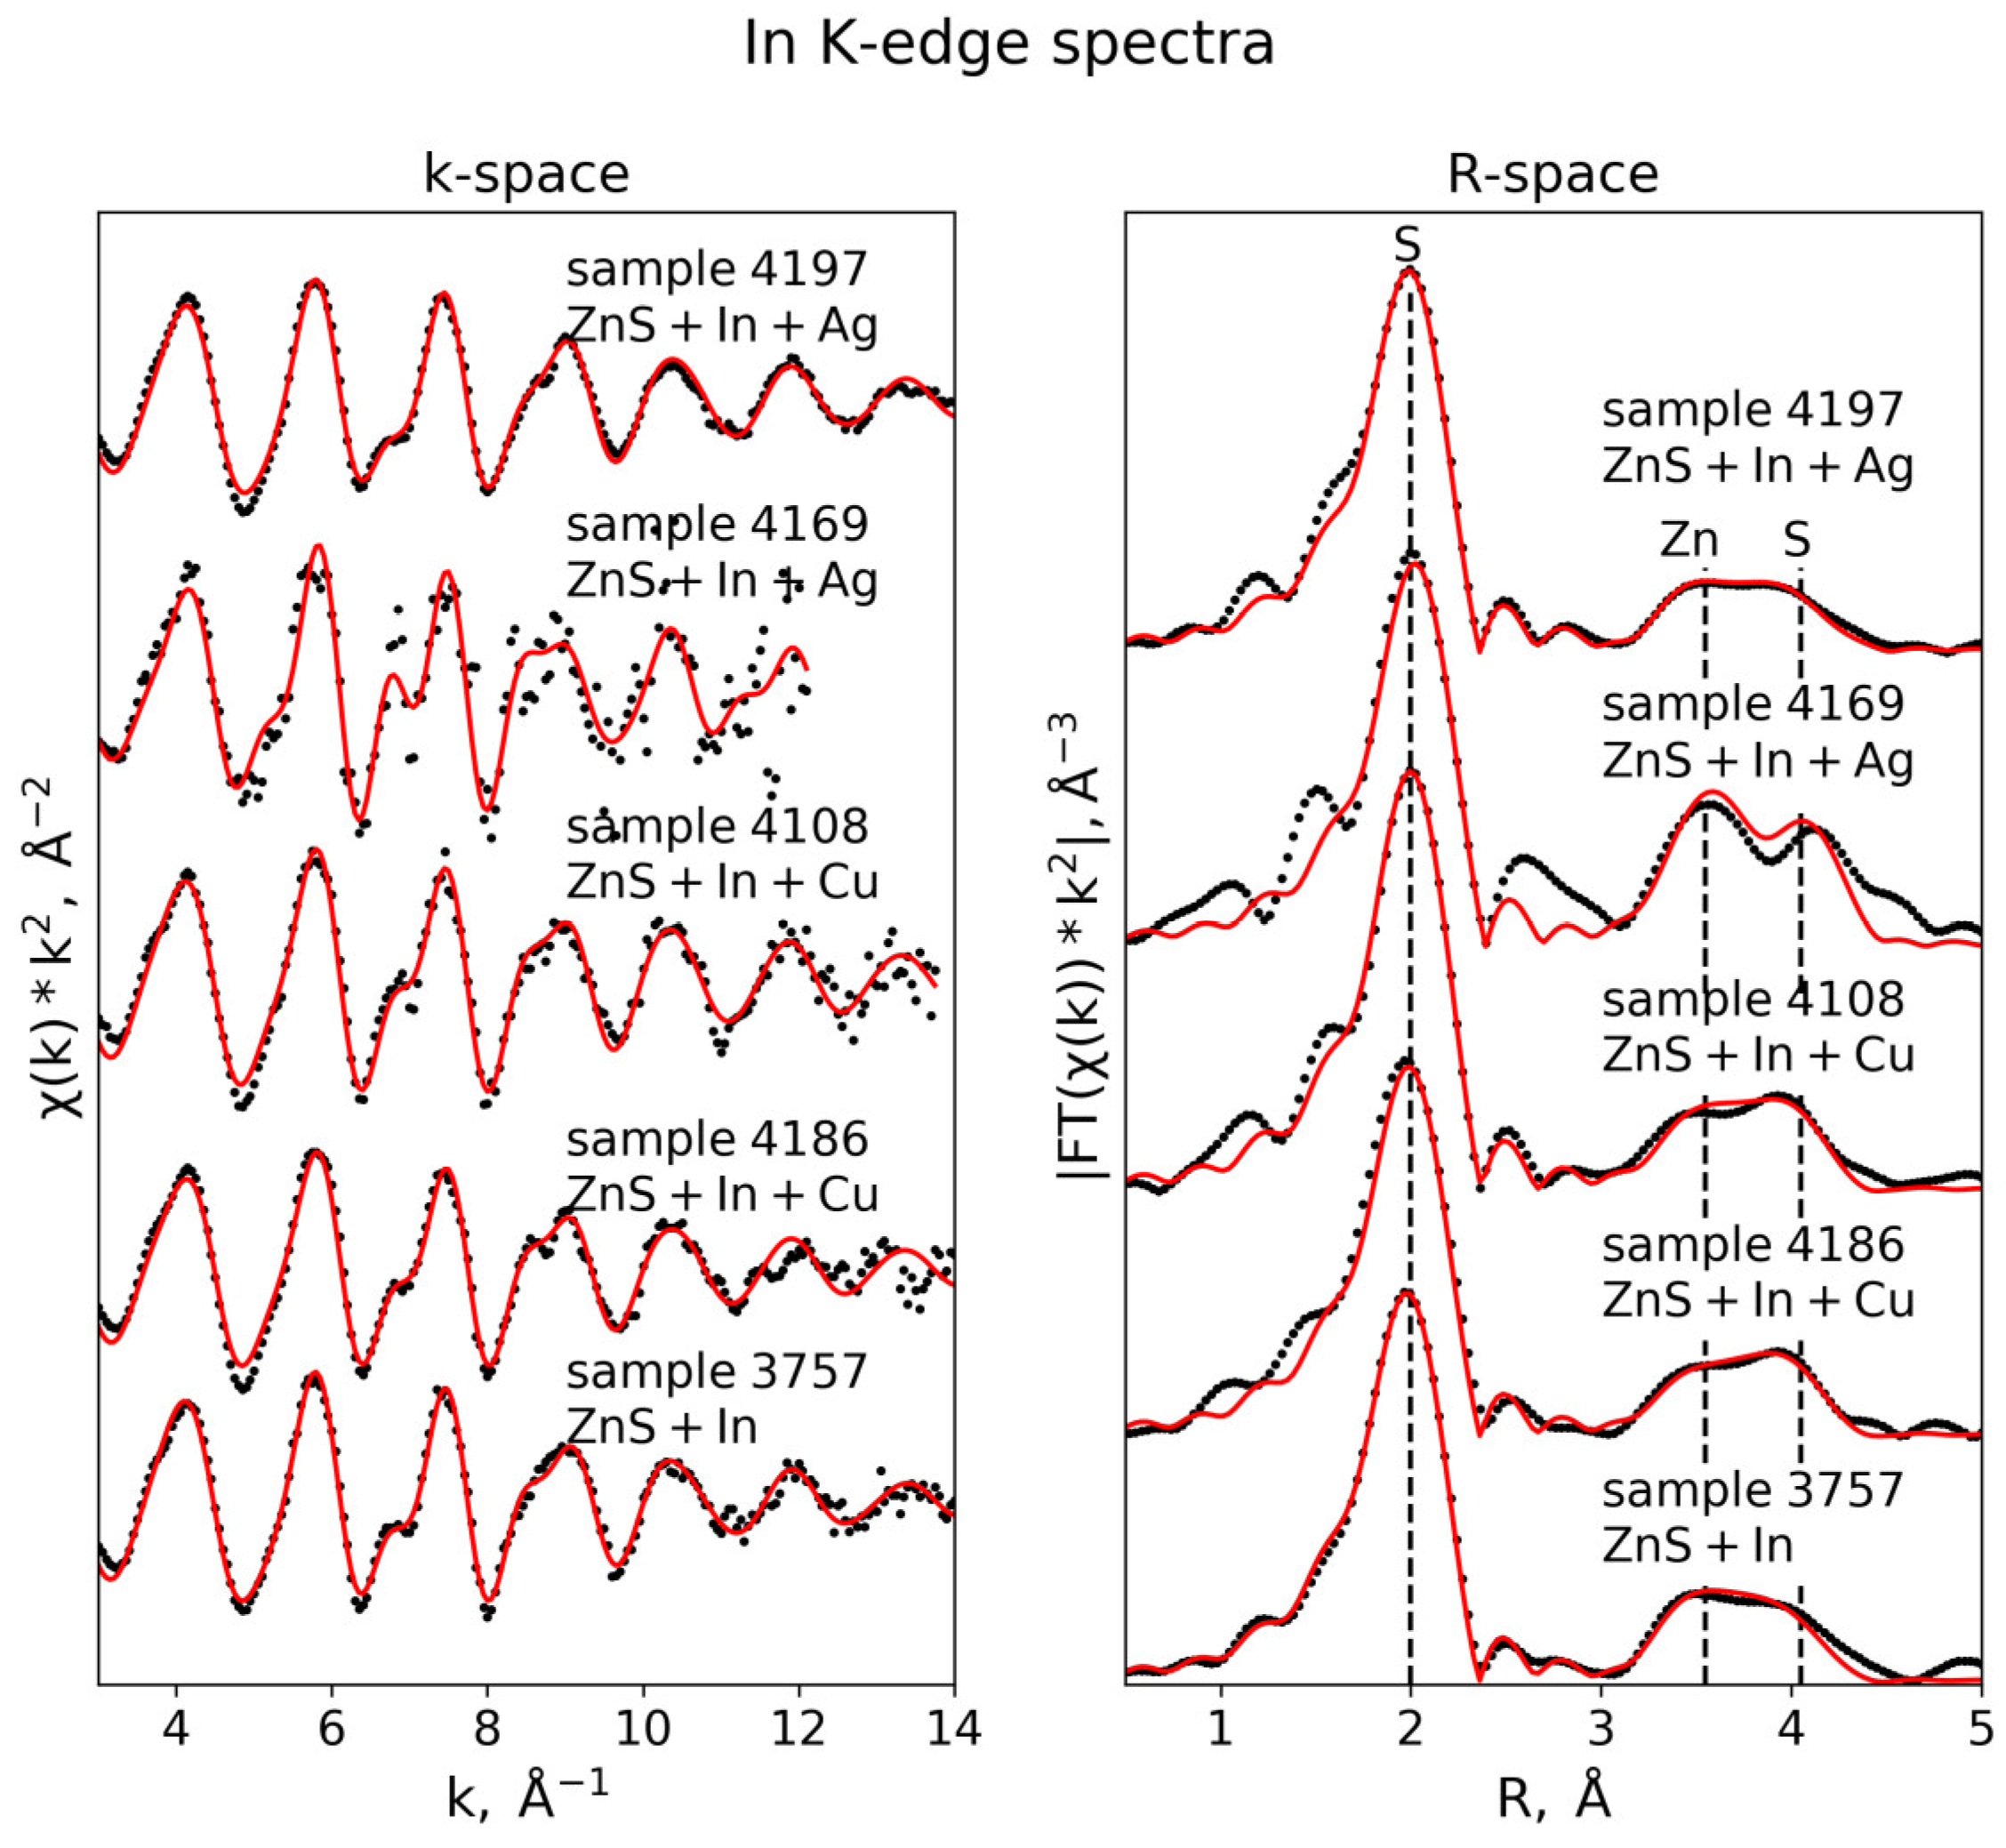
3.3.3. In K-Edge
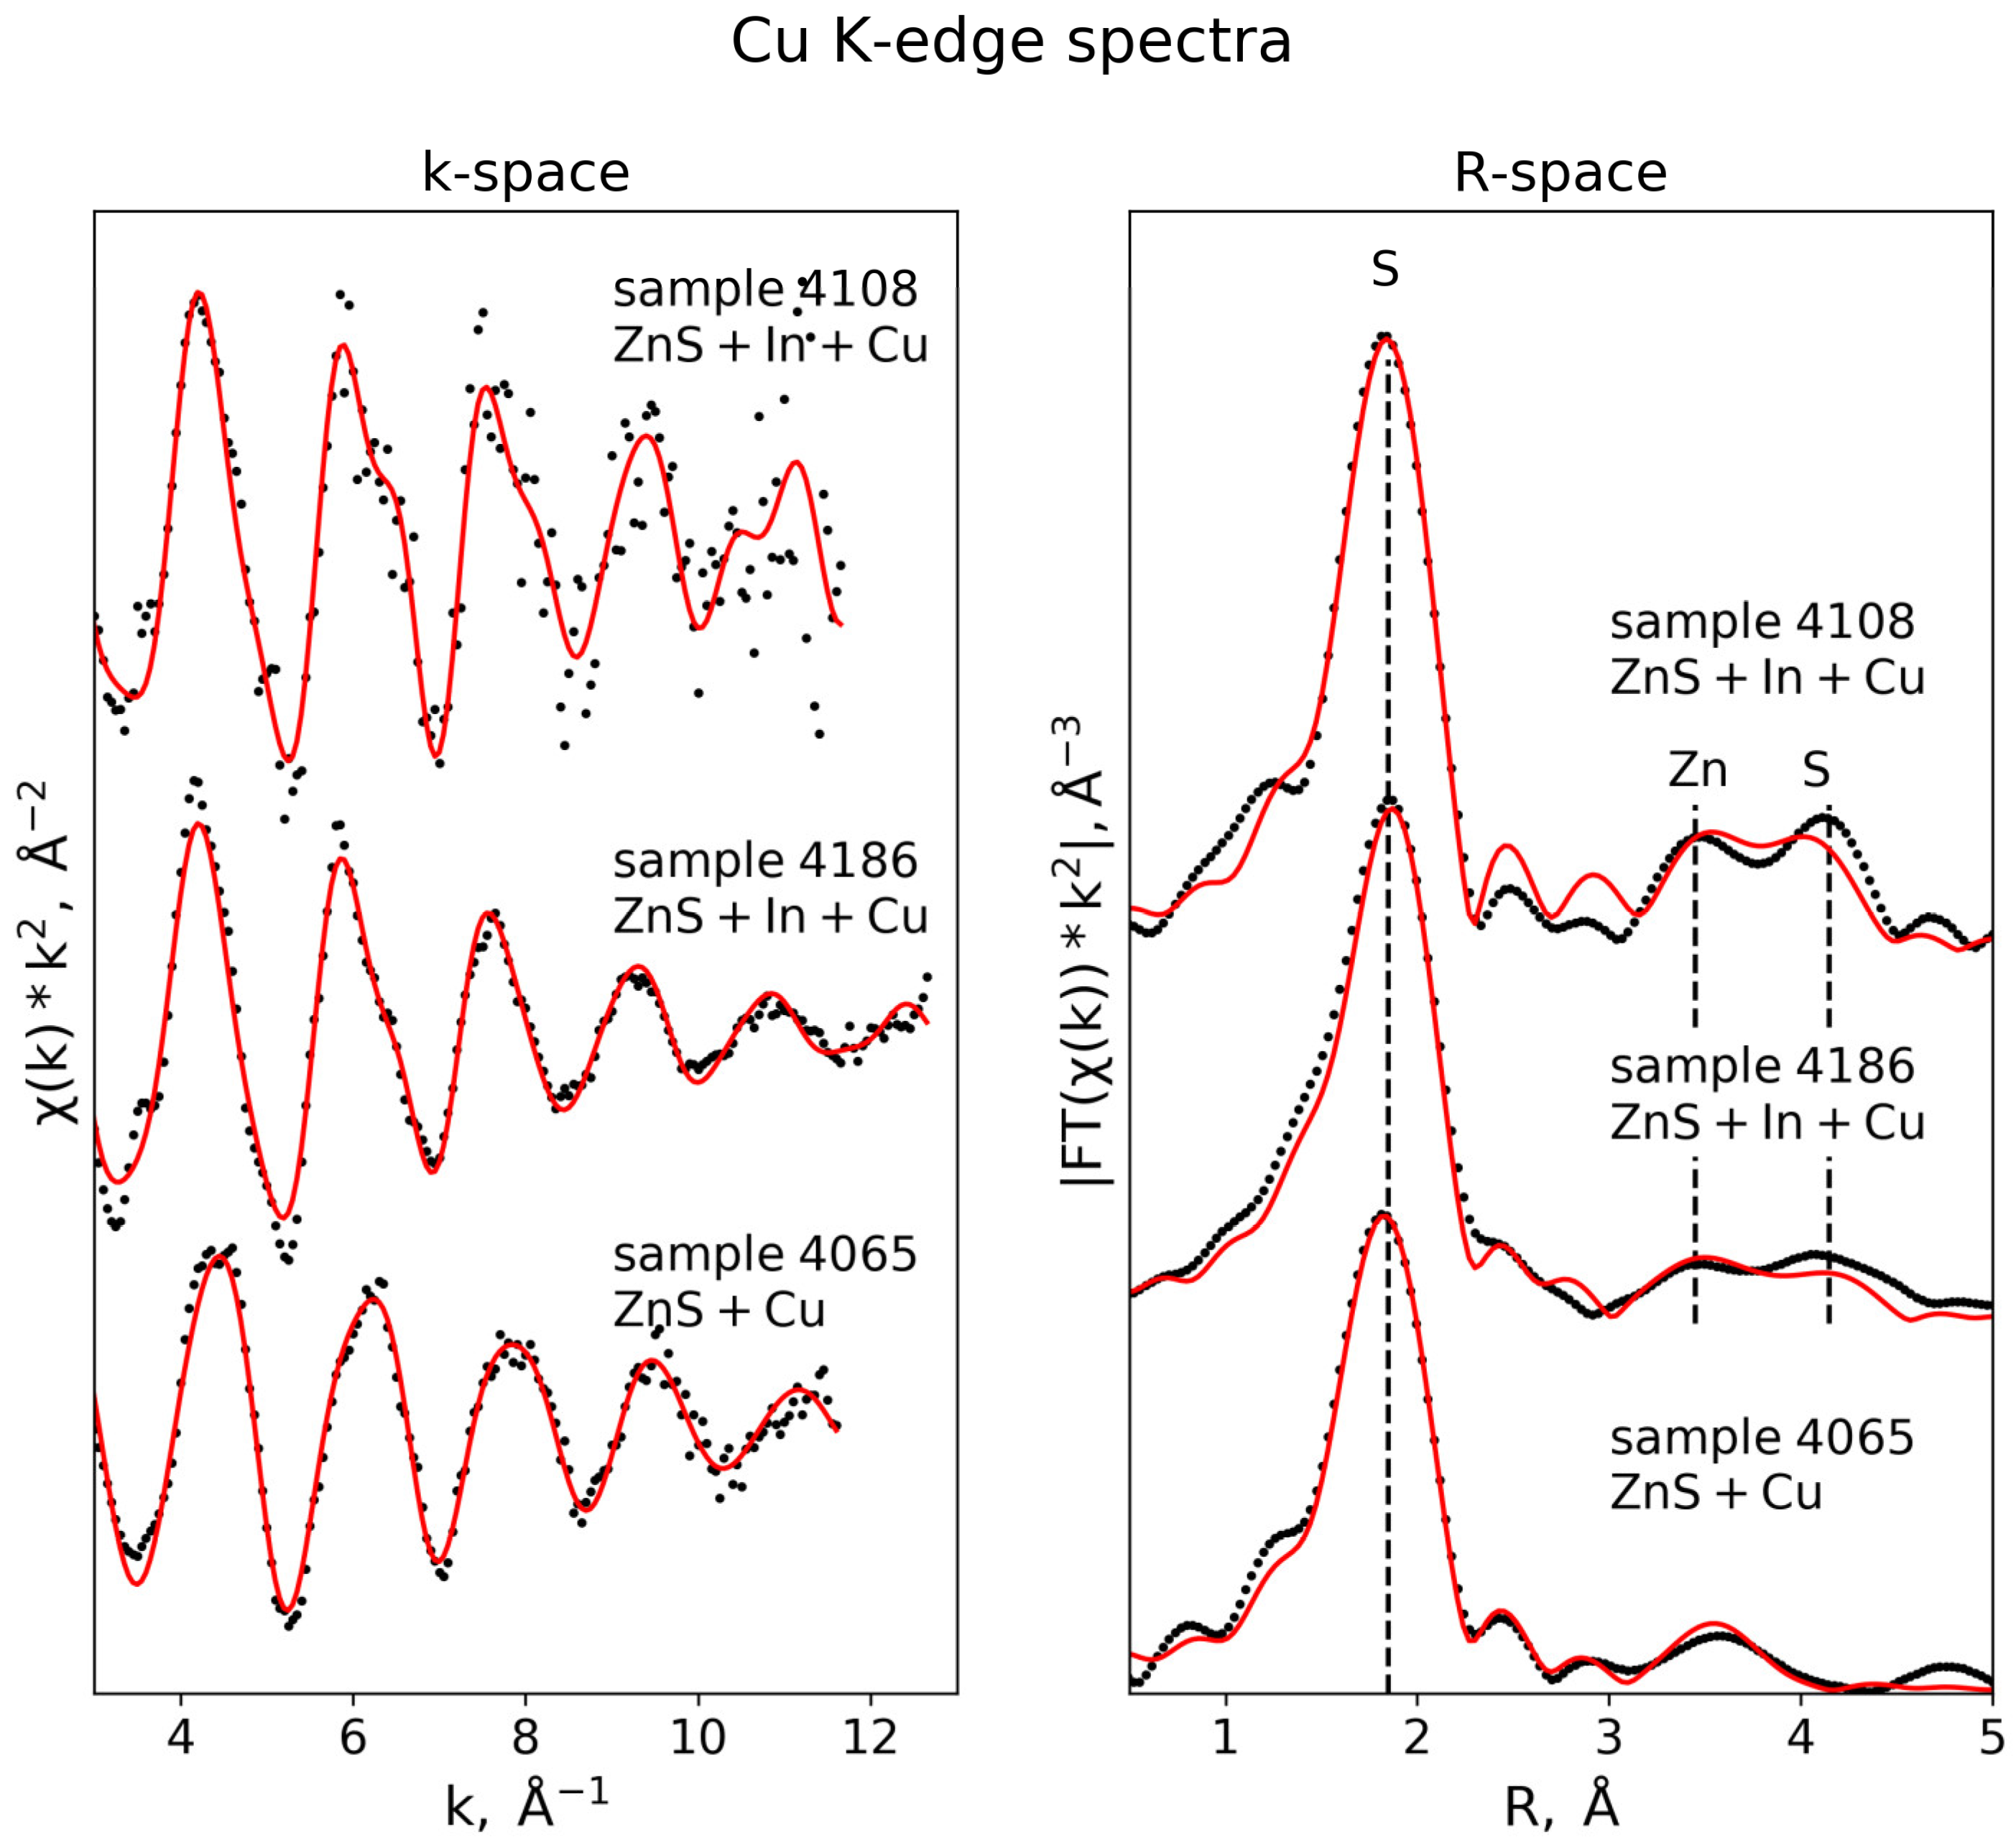
3.3.4. Cu K-Edge
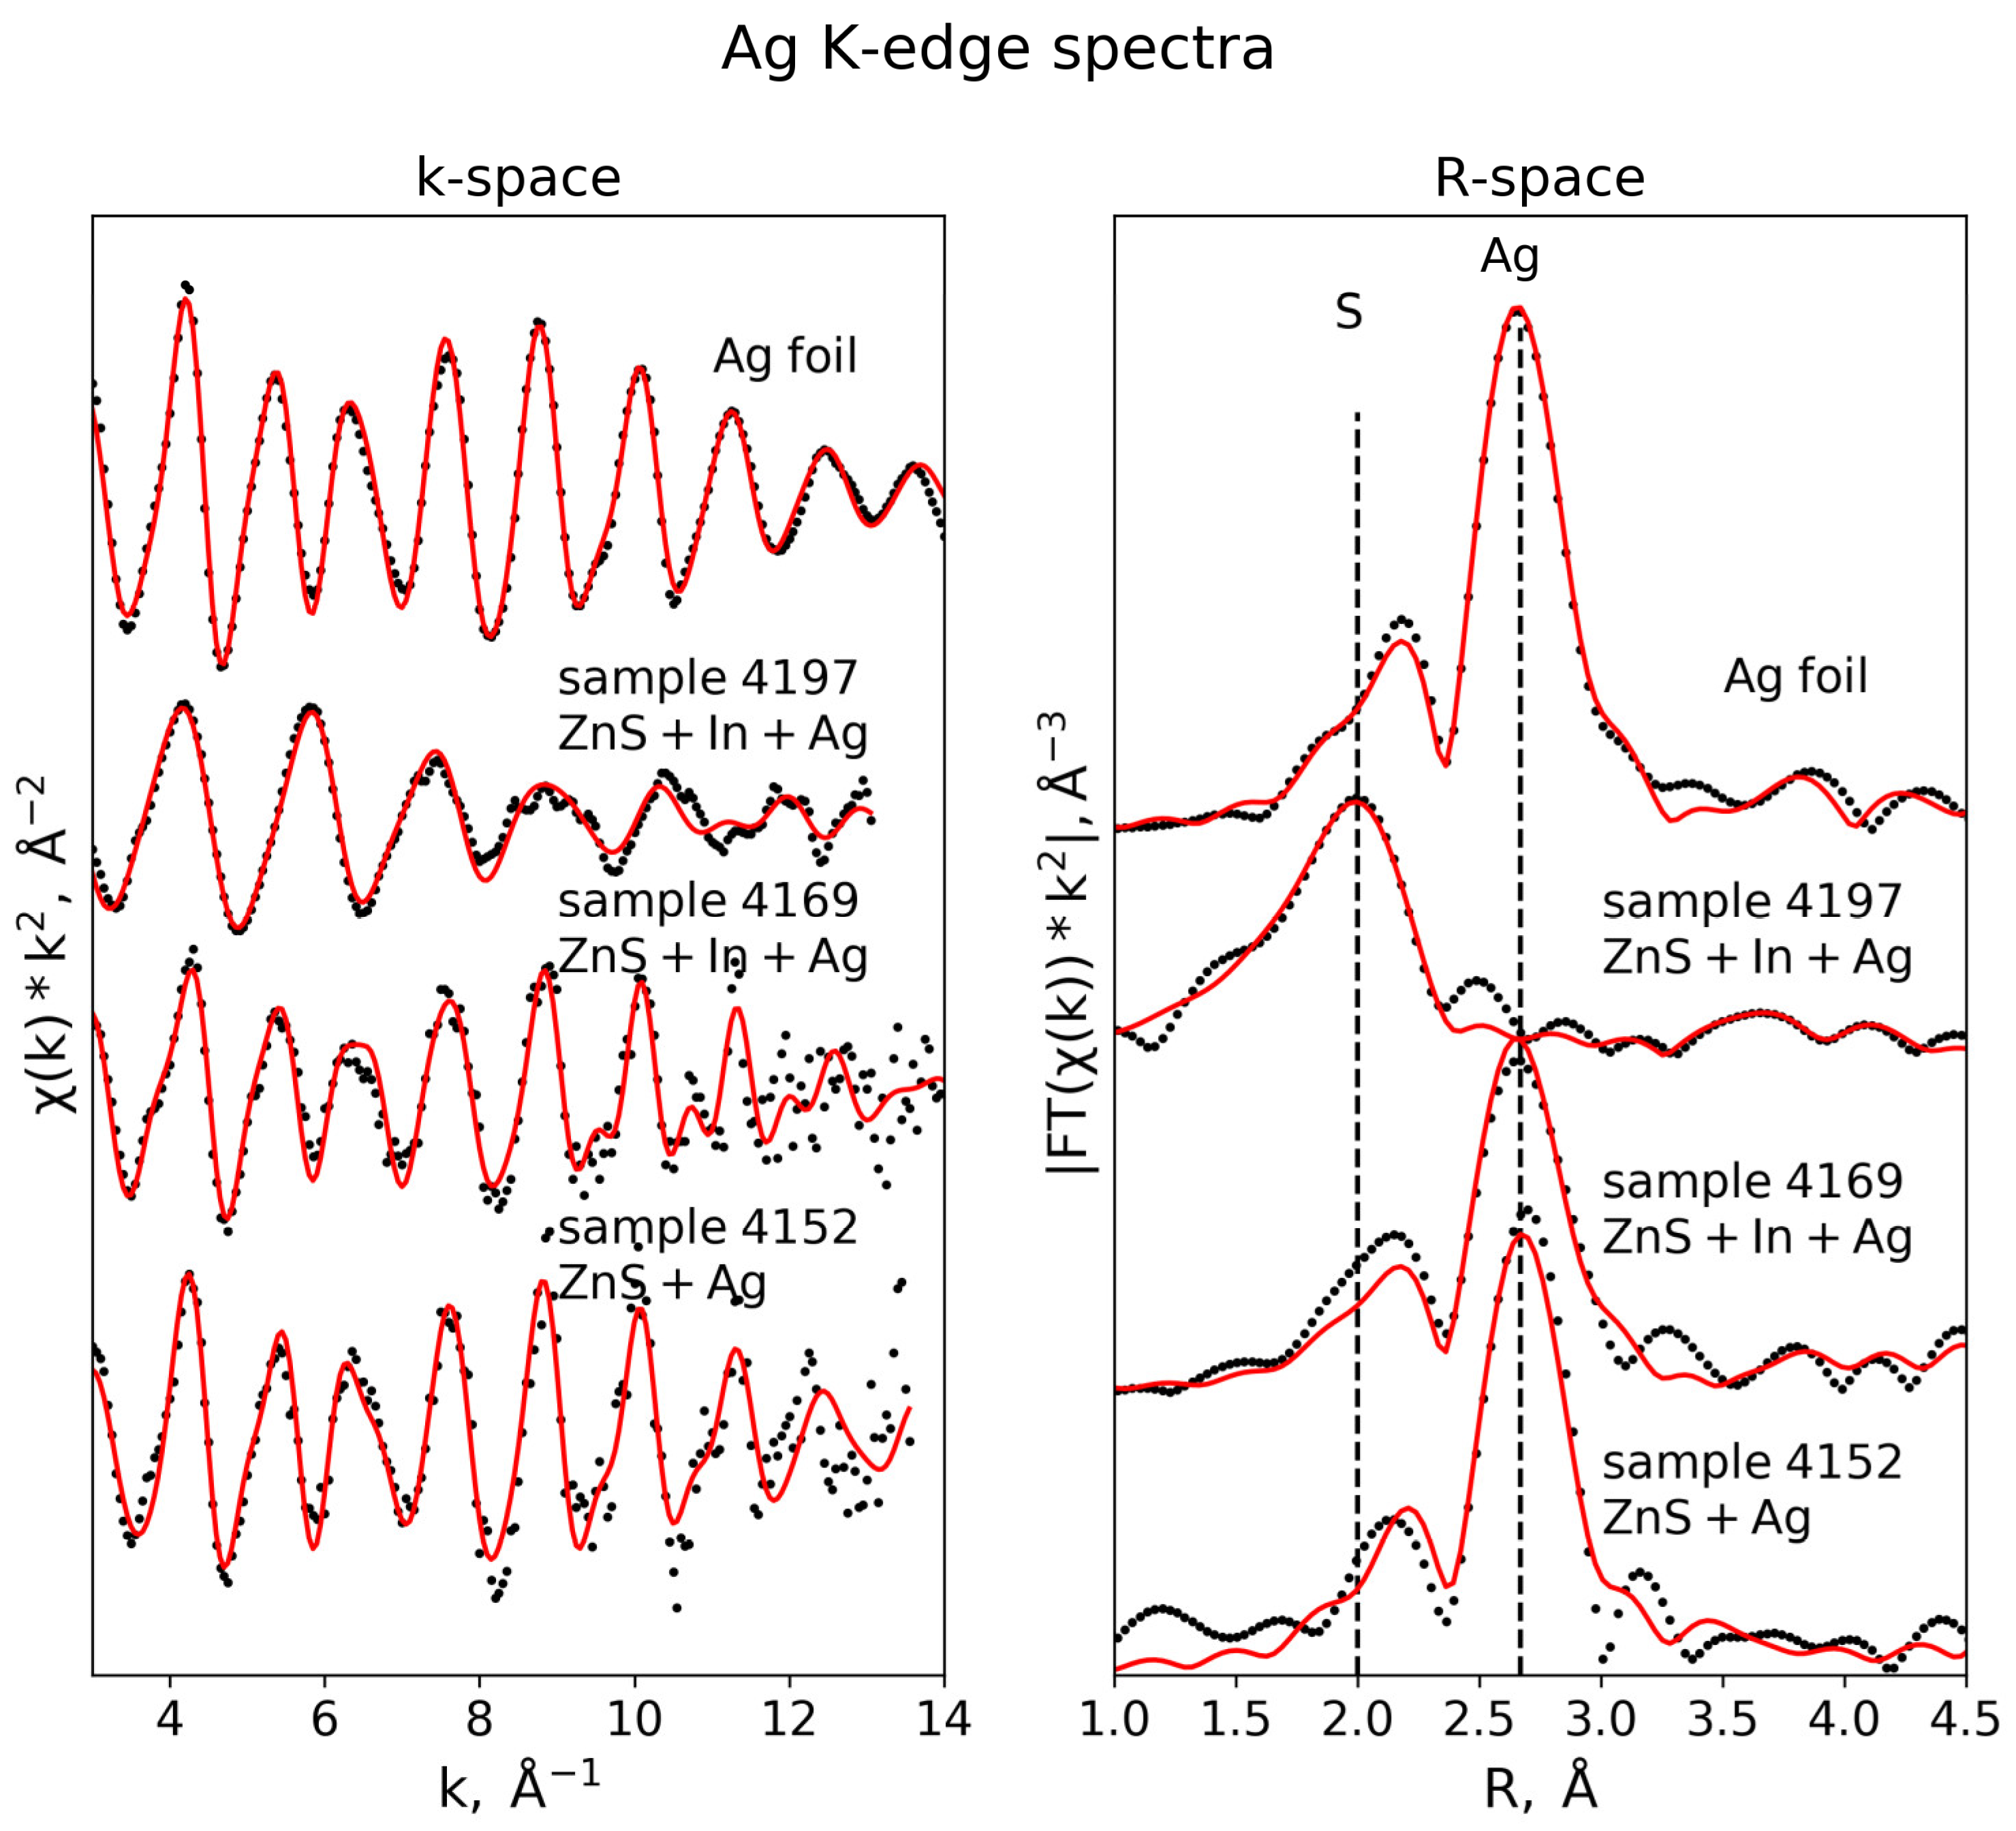
3.3.5. Ag K-Edge
4. Implications
Supplementary Materials
Author Contributions
Funding
Acknowledgments
Conflicts of Interest
References
- Filimonova, O.N.; Trigub, A.L.; Tonkacheev, D.E.; Nickolsky, M.S.; Kvashnina, K.O.; Chareev, D.A.; Chaplygin, I.V.; Kovalchuk, E.V.; Lafuerza, S.; Tagirov, B.R. Substitution mechanisms in In-, Au-, and Cu-bearing sphalerites studied by X-ray absorption spectroscopy of synthetic compounds and natural minerals. Mineral. Mag. 2019, 83, 435–451. [Google Scholar] [CrossRef]
- Chaplygin, I.V.; Mozgova, N.N.; Mokhov, A.V.; Koporulina, E.V.; Bernhardt, H.J.; Bryzgalov, I.A. Minerals of the system ZnS-CdS from fumaroles of the Kudriavy volcano, Iturup Island, Kuriles, Russia. Can. Mineral. 2007, 45, 709–722. [Google Scholar] [CrossRef]
- Cook, N.J.; Ciobanu, C.L.; Pring, A.; Skinner, W.; Shimizu, M.; Danyushevsky, L.; Saini-Eidukat, B.; Melcher, F. Trace and minor elements in sphalerite: A LA-ICPMS study. Geochim. Cosmochim. Acta 2009, 73, 4761–4791. [Google Scholar] [CrossRef]
- Schorr, S.; Tovar, M.; Stuesser, N.; Sheptyakov, D.; Geandier, G. Where the atoms are: Cation disorder and anion displacement in DIIXVI-AIBIIIXVI2 semiconductors. Phys. B Condens. Matter 2006, 385–386, 571–573. [Google Scholar] [CrossRef]
- Schorr, S.; Wagner, G. Structure and phase relations of the Zn2x(CuIn) 1-xS2 solid solution series. J. Alloys Compd. 2005, 396, 202–207. [Google Scholar] [CrossRef]
- Xu, J.; Cook, N.J.; Ciobanu, C.L.; Li, X.; Kontonikas-Charos, A.; Gilbert, S.; Lv, Y. Indium distribution in sphalerite from sulfide–oxide–silicate skarn assemblages: A case study of the Dulong Zn–Sn–In deposit, Southwest China. Miner. Depos. 2020. [Google Scholar] [CrossRef]
- Chareev, D.A.; Volkova, O.S.; Geringer, N.V.; Koshelev, A.V.; Nekrasov, A.N.; Osadchii, V.O.; Osadchii, E.G.; Filimonova, O.N. Synthesis of chalcogenide and pnictide crystals in salt melts using a steady-state temperature gradient. Crystallogr. Rep. 2016, 61, 682–691. [Google Scholar] [CrossRef]
- Chareev, D.A. General principles of the synthesis of chalcogenides and pnictides in salt melts using a steady-state temperature gradient. Crystallogr. Rep. 2016, 61, 506–511. [Google Scholar] [CrossRef]
- Kullerud, G. Experimental Techniques in Dry Sulfide Research. In Research Techniques for High Pressure and High Temperature; Springer: Berlin/Heidelberg, Germany, 1971; pp. 289–315. [Google Scholar]
- Chareev, D.A.; Osadchii, V.O.; Shiryaev, A.A.; Nekrasov, A.N.; Koshelev, A.V.; Osadchii, E.G. Single-crystal Fe-bearing sphalerite: Synthesis, lattice parameter, thermal expansion coefficient and microhardness. Phys. Chem. Miner. 2017, 44, 287–296. [Google Scholar] [CrossRef]
- Wilson, S.A.; Ridley, W.I.; Koenig, A.E. Development of sulfide calibration standards for the laser ablation inductively-coupled plasma mass spectrometry technique. J. Anal. At. Spectrom. 2002, 17, 406–409. [Google Scholar] [CrossRef]
- Galoisy, L.; Calas, G.; Arrio, M. High-resolution XANES spectra of iron in minerals and glasses: Structural information from the pre-edge region. Chem. Geol. 2001, 174, 307–319. [Google Scholar] [CrossRef]
- Ravel, B.; Newville, M. ATHENA, ARTEMIS, HEPHAESTUS: Data analysis for X-ray absorption spectroscopy using IFEFFIT. J. Synchrotron Radiat. 2005, 12, 537–541. [Google Scholar] [CrossRef] [PubMed] [Green Version]
- Marini, C.; Rovira, A.M.D.; Ramanan, N.; Olszewski, W.; Joseph, B.; Simonelli, L. Combined micro X-ray absorption and fluorescence spectroscopy to map phases of complex systems: The case of sphalerite. Sci. Rep. 2019, 9, 1–8. [Google Scholar] [CrossRef] [Green Version]
- Zabinsky, S.I.; Rehr, J.J.; Ankudinov, A.; Albers, R.C.; Eller, M.J. Multiple Scattering Calculations of X-ray Absorption Spectra. Phys. Rev. B 1995, 52, 2995–3009. [Google Scholar] [CrossRef] [PubMed]
- Trigub, A.L.; Tagirov, B.R.; Kvashnina, K.O.; Chareev, D.A.; Nickolsky, M.S.; Shiryaev, A.A.; Baranova, N.N.; Kovalchuk, E.V.; Mokhov, A.V. X-ray spectroscopy study of the chemical state of “invisible” Au in synthetic minerals in the Fe-As-S system. Am. Mineral. 2017, 102, 1057–1065. [Google Scholar] [CrossRef]
- Tagirov, B.R.; Trigub, A.L.; Kvashnina, K.O.; Shiryaev, A.A.; Chareev, D.A.; Nickolsky, M.S.; Abramova, V.D.; Kovalchuk, E.V. Covellite CuS as a matrix for “invisible” gold: X-ray spectroscopic study of the chemical state of Cu and Au in synthetic minerals. Geochim. Cosmochim. Acta 2016, 191, 58–69. [Google Scholar] [CrossRef]
- Giannozzi, P.; Baroni, S.; Bonini, N.; Calandra, M.; Car, R.; Cavazzoni, C.; Ceresoli, D.; Chiarotti, G.L.; Cococcioni, M.; Dabo, I.; et al. QUANTUM ESPRESSO: A modular and open-source software project for quantum simulations of materials. J. Phys. Condens. Matter 2009, 21, 395502. [Google Scholar] [CrossRef]
- Blöchl, P.E. Projector augmented-wave method. Phys. Rev. B 1994, 50, 17953–17979. [Google Scholar] [CrossRef] [Green Version]
- Joubert, D. From ultrasoft pseudopotentials to the projector augmented-wave method. Phys. Rev. B 1999, 59, 1758–1775. [Google Scholar] [CrossRef]
- Tonkacheev, D.E.; Chareev, D.A.; Abramova, V.D.; Kovalchuk, E.V.; Vikentyev, I.V.; Tagirov, B.R. The substitution mechanism of Au in In-, Fe- and In-Fe-bearing synthetic crystals of sphalerite, based on the data from EPMA and LA-ICP-MS study. Litosfera 2019, 148–161. [Google Scholar] [CrossRef]
- Jamieson, J.C.; Demarest, H.H. A note on the compression of cubic ZnS. J. Phys. Chem. Solids 1980, 41, 963–964. [Google Scholar] [CrossRef]
- Abrahams, S.C.; Bernstein, J.L. Piezoelectric nonlinear optic CuGaS2 and CuInS2 crystal structure: Sublattice distortion in AiBIIIC 2VI and AIIBIVC2v type chalcopyrites. J. Chem. Phys. 1973, 59, 5415–5422. [Google Scholar] [CrossRef]
- Delgado, G.; Mora, A.J.; Pineda, C.; Tinoco, T. Simultaneous Rietveld refinement of three phases in the Ag-In-S semiconducting system from X-ray powder diffraction. Mater. Res. Bull. 2001, 36, 2507–2517. [Google Scholar] [CrossRef]
- Timoshenko, J.; Kuzmin, A. Wavelet data analysis of EXAFS spectra. Comput. Phys. Commun. 2009, 180, 920–925. [Google Scholar] [CrossRef]
- Funke, H.; Scheinost, A.C.; Chukalina, M. Wavelet analysis of extended x-ray absorption fine structure data. Phys. Rev. B 2005, 71, 094110. [Google Scholar] [CrossRef]
- Stephan, C.; Schorr, S.; Tovar, M.; Schock, H.W. Comprehensive insights into point defect and defect cluster formation in CuInSe2. Appl. Phys. Lett. 2011, 98, 091906. [Google Scholar] [CrossRef] [Green Version]
- Car, B.; Medling, S.; Corrado, C.; Bridges, F.; Zhang, J.Z. Probing the local structure of dilute Cu dopants in fluorescent ZnS nanocrystals using EXAFS. Nanoscale 2011, 3, 4182–4189. [Google Scholar] [CrossRef]
- Shannon, R.D. Revised effective ionic radii and systematic studies of interatomic distances in halides and chalcogenides. Acta Crystallogr. Sect. A 1976, 32, 751–767. [Google Scholar] [CrossRef]


| Sample No. | Dopant | Starting Materials, mol.% of Dopant | Starting Materials, wt.% of Dopant | Phase Composition (SEM, XRD) | EPMA, wt.% d | LA-ICP-MS, ppm d | |||||
|---|---|---|---|---|---|---|---|---|---|---|---|
| Zn | S | Cu | Ag | In | Cu | Ag | |||||
| 3757 a | In | 0.30 mol.% In2S3 | 0.70 wt.% In | ZnS | - | - | - | - | - | ||
| 4108 b | Cu + In | 0.07 mol.%Cu2S 0.04 mol.% In2S3 | 0.10 wt.%Cu 0.09 wt.% In | ZnS | 66.26 ± 0.52 | 32.84 ± 0.23 | bdl | - | 0.12 ± 0.02 | 890 ± 3 0 | - |
| 4186 c | 2.21 mol.% Cu2S .21 mol.% In2S3 | 2.71 wt.% Cu 4.90 wt.% In | ZnS | - | - | - | - | - | - | - | |
| 4065 a | Cu | 0.60 mol.% Cu2S | 0.78 wt.% Cu | ZnS | 66.24 ± 0.40 | 32.86 ± 0.50 | 0.28 ± 0.05 | - | - | 2380 ± 90 | - |
| 4197 c | Ag + In | 2.5 mol.% Ag2S 2.5 mol.% In2S3 | 5.04 wt.% Ag 5.37 wt.% In | ZnS + Ag2S | 58.37 ± 2.28 | 31.95 ± 1.04 | - | 4.74 ± 0.82 | 5.15 ± 0.46 | - | - |
| 4169 a | 0.05 mol.% Ag2S 0.04mol.% In2S3 | 0.11 wt.% Ag 0.09 wt.%In | ZnS | 68.22 ± 1.68 | 33.94 ± 0.92 | - | 0.01 ± 0.06 | 0.07 ± 0.08 | - | 180 ± 7 | |
| 4152 a | Ag | 0.40 mol.% Ag2S | 0.90 wt.% Ag | ZnS | 66.49 ± 0.50 | 33.40 ± 0.72 | - | 0.08 ± 0.08 | - | - | 23 ± 1 |
| Formula | Mineral | Space Group | Central Cation | 1st CS (Å) | 2nd CS (Å) | 3rd CS (Å) |
|---|---|---|---|---|---|---|
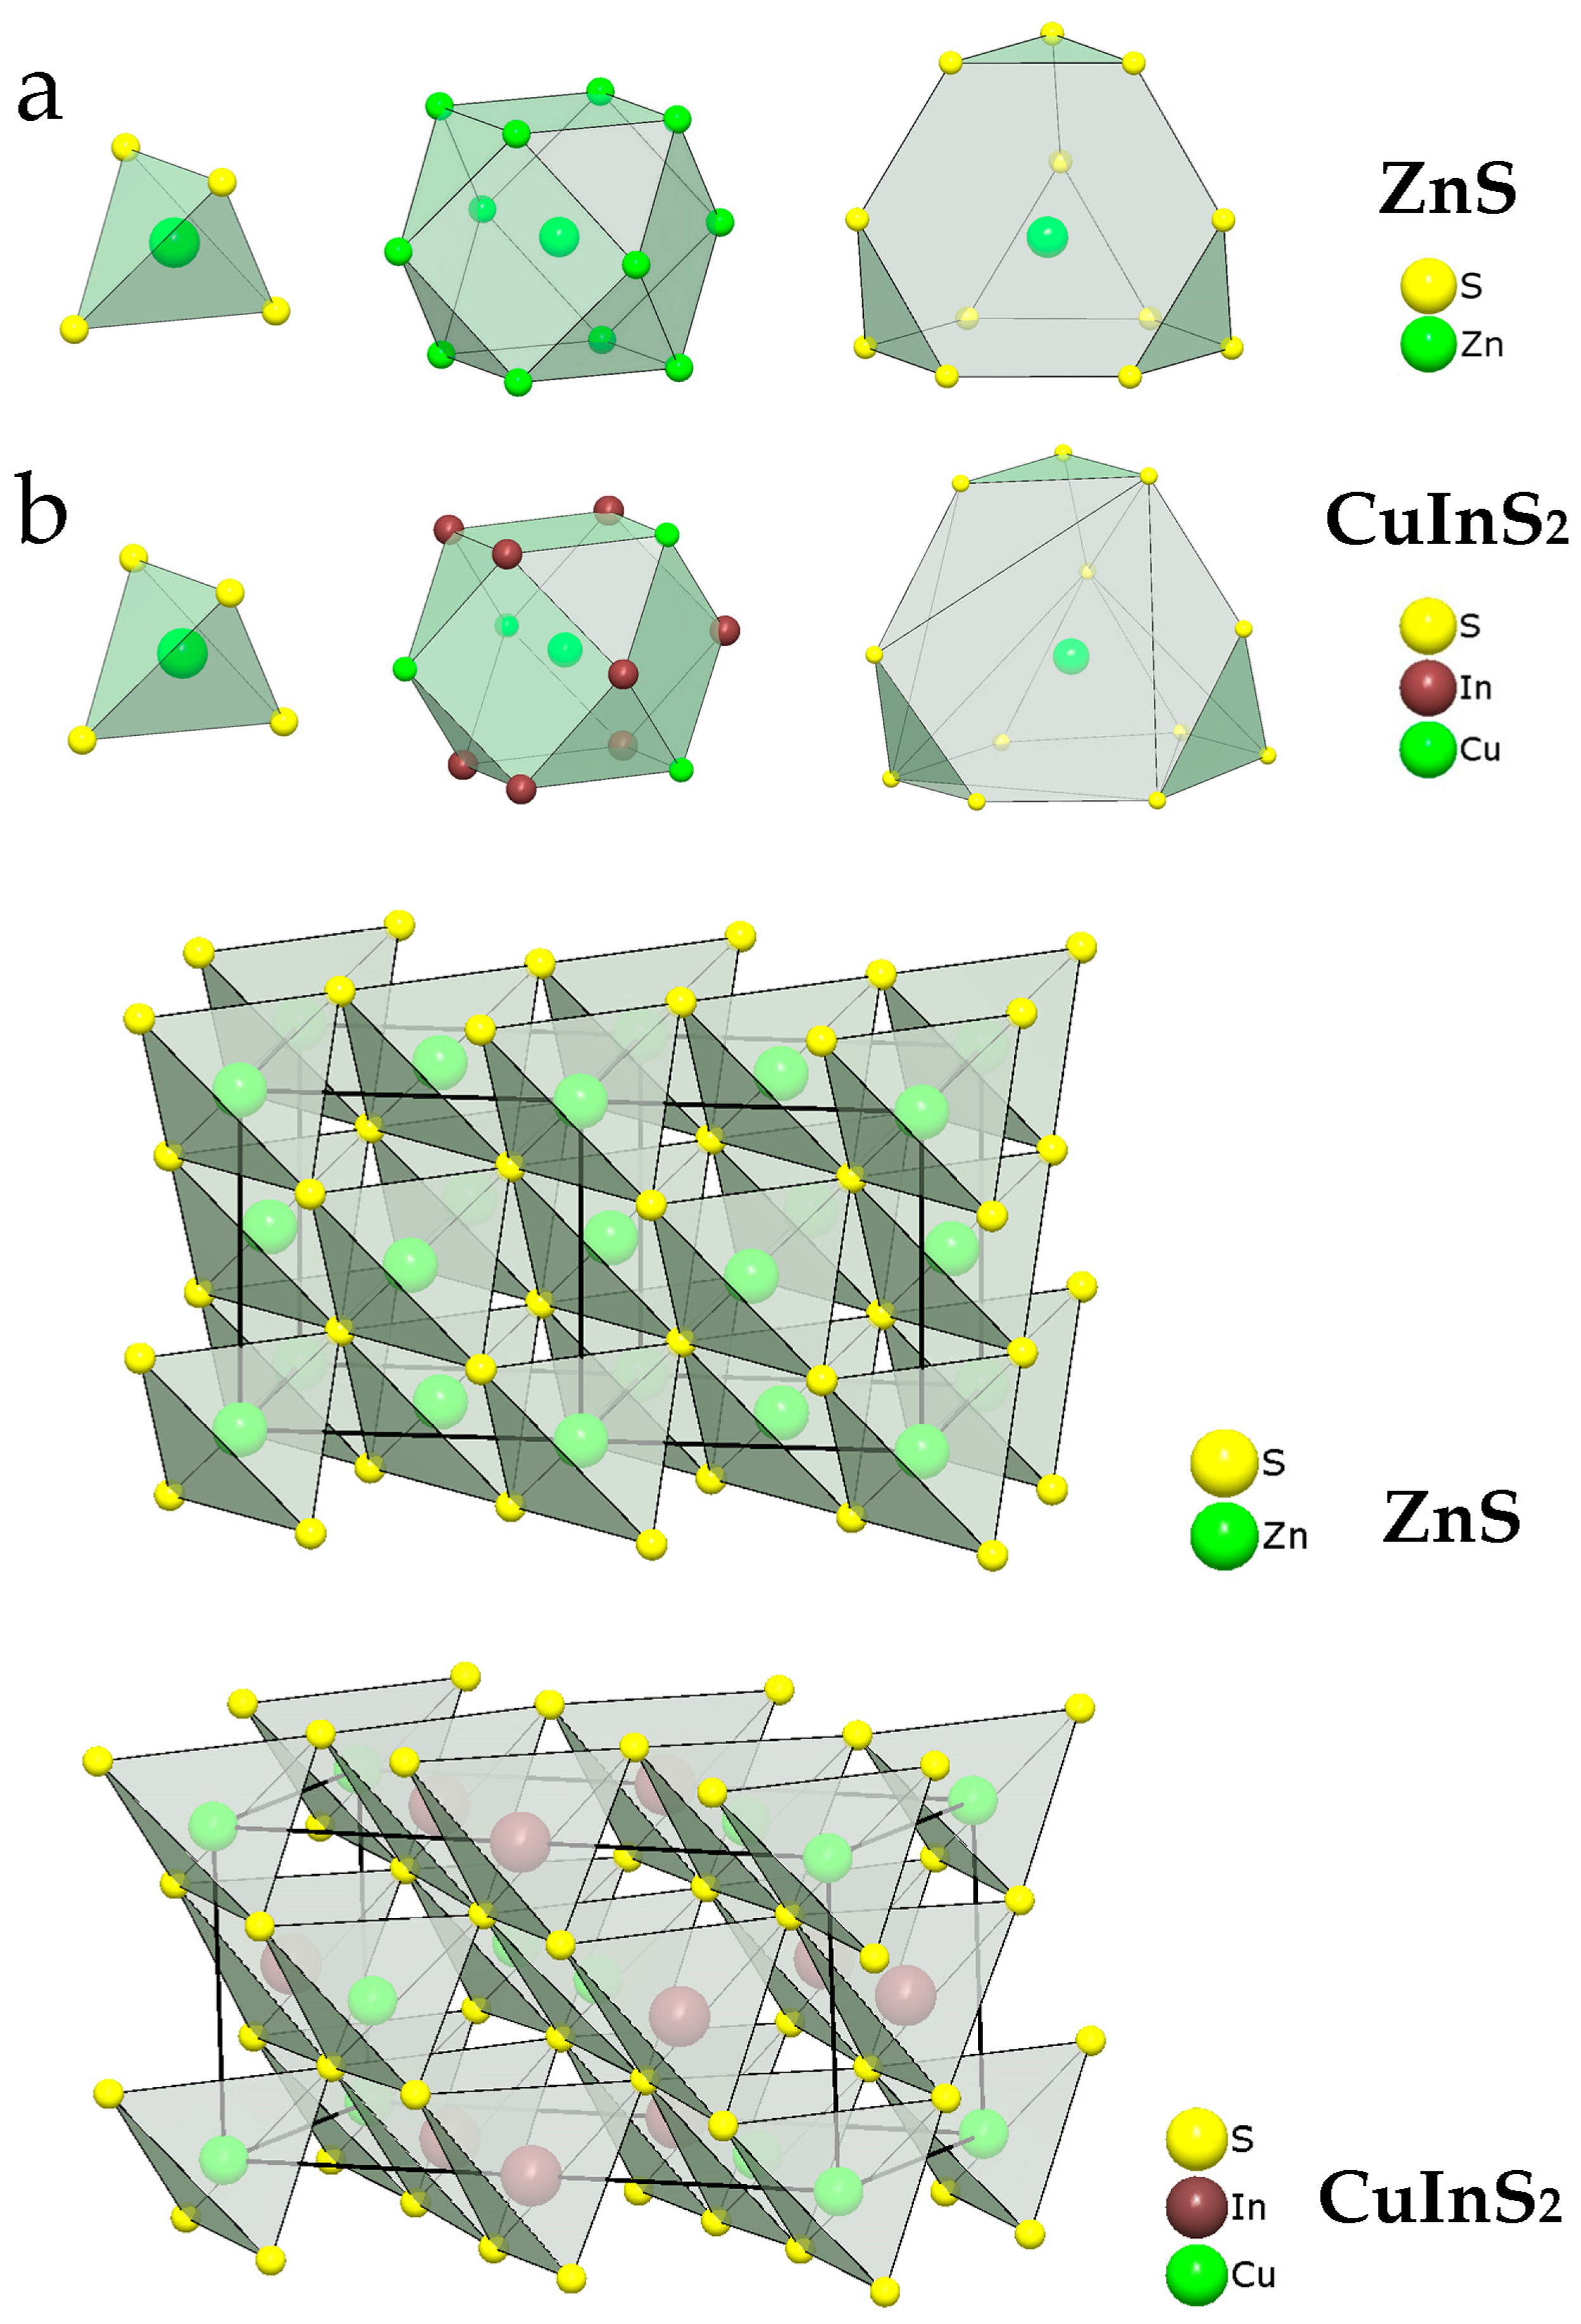
| ZnS a | Sphalerite | F-43m | Zn | 4S: 2.3427 | 12Zn: 3.8256 | 12S: 4.4859 |
| CuInS2 b | Roquesite | I-42d | Cu | 4S: 2.3287 | 4In: 3.9039 4In: 3.9204 4Cu: 3.9204 | 4S: 4.5457 4S: 4.6477 4S: 4.6929 |
| AgInS2 c | Laforetite | I-42d | Ag | 4S: 2.5543 | 4Ag: 4.0587 4In: 4.0587 4In: 4.1550 | 4S: 4.6608 4S: 4.7772 4S: 4.8773 |
| Atomic Shell | Experimental Data | ||||
|---|---|---|---|---|---|
| N a,b | R, Å | σ2, Å2 | E0, eV | R-Factor | |
| References | |||||
| Pure sphalerite ZnS, Zn K-edge (k-range = 3–14 Å−1, R-range = 1.3–4.5 Å) | |||||
| S | 4 | 2.34 ± 0.01 | 0.005 ± 0.001 | 0.3 ± 1.3 | 0.014 |
| Zn | 12 | 3.85 ± 0.03 | 0.017 ± 0.002 | ||
| S | 12 | 4.46 ± 0.04 | 0.015 ± 0.004 | ||
| CuInS2, In K-edge (k-range = 3–14 Å−1, R-range = 1.3–2.5 Å) | |||||
| S | 4 | 2.47 ± 0.01 | 0.0026 ± 0.0005 | 5.7 ± 1.34 | 0.010 |
| CuInS2, Cu K-edge (k-range=3–12 Å−1, R-range = 1.2–2.2 Å) | |||||
| S | 4 | 2.31 ± 0.01 | 0.008 ± 0.001 | 4.6 ± 1.2 | 0.003 |
| AgInS2, In K-edge (k-range = 3–14 Å−1, R-range = 1.3–2.5 Å) | |||||
| S | 4 | 2.47 ± 0.006 | 0.0029 ± 0.0004 | 6.5 ± 1.02 | 0.012 |
| AgInS2, Ag K-edge (k-range = 3–14 Å−1, R-range = 1.3–2.5 Å) | |||||
| S | 4 | 2.54 ± 0.01 | 0.011 ± 0.0007 | 3.5 ± 1.2 | 0.009 |
| In K-edge (S02 = 0.95) | |||||
| Sample 4108 (k-range = 3–13 Å−1, R-range = 1.3–4.5 Å) | |||||
| S | 4 | 2.46 ± 0.01 | 0.003 ± 0.0002 | 6.3 ± 0.8 | 0.010 |
| Zn | 12 | 3.91 ± 0.02 | 0.015 ± 0.001 | ||
| S | 12 | 4.49 ± 0.02 | 0.011 ± 0.002 | ||
| Sample 4186 (k-range = 3–12 Å−1, R-range = 1.3–4.5 Å) | |||||
| S | 4 | 2.46 ± 0.01 | 0.004 ± 0.0004 | 5.8 ± 0.9 | 0.017 |
| Zn | 12 | 3.91 ± 0.02 | 0.016 ± 0.002 | ||
| S | 12 | 4.47 ± 0.02 | 0.012 ± 0.003 | ||
| Sample 3757 (k-range = 3–13 Å−1, R-range = 1.3–4.5 Å) | |||||
| S | 4 | 2.45 ± 0.01 | 0.004 ± 0.0004 | 5.4 ± 0.8 | 0.036 |
| Zn | 12 | 3.91 ± 0.01 | 0.014 ± 0.0002 | ||
| S | 12 | 4.48 ± 0.03 | 0.014 ± 0.004 | ||
| Sample 4169 (k-range = 3–13 Å−1, R-range = 1.3–4.5 Å) | |||||
| S | 4 | 2.49 ± 0.01 | 0.004 ± 0.001 | 7.9 ± 1.5 | 0.050 |
| Zn | 12 | 3.90 ± 0.02 | 0.011 ± 0.002 | ||
| S | 12 | 4.54 ± 0.03 | 0.006 ± 0.002 | ||
| Sample 4197 (k-range = 3–13 Å−1, R-range = 1.3–4.5 Å) | |||||
| S | 4 | 2.45 ± 0.003 | 0.004 ± 0.0002 | 6.4 ± 0.5 | 0.007 |
| Zn | 12 | 3.93 ± 0.01 | 0.016 ± 0.001 | ||
| S | 12 | 4.50 ± 0.02 | 0.016 ± 0.002 | ||
| Cu K-edge (S02 = 0.75) | |||||
| Sample 4186 (k-range = 3–12 Å−1, R-range = 1.3–4.5 Å) | |||||
| S | 4 | 2.31 ± 0.01 | 0.006 ± 0.001 | 2.2 ± 1.1 | 0.018 |
| Zn | 5.4 ± 1.9 | 3.76 ± 0.02 | 0.011 ± 0.002 | ||
| Zn | 6.6 ± 1.9 | 3.92 ± 0.04 | 0.011 ± 0.002 | ||
| S | 5.9 ± 2.2 | 4.31 ± 0.02 | 0.009 ± 0.004 | ||
| S | 6.1 ± 2.2 | 4.52 ± 0.02 | 0.009 ± 0.004 | ||
| Sample 4108 (k-range = 3–11 Å−1, R-range = 1.3–4.5 Å) | |||||
| S | 4 | 2.30 ± 0.01 | 0.005 ± 0.0006 | 1.7 ± 1.3 | 0.01 |
| Zn | 6.4 ± 0.9 | 3.81 ± 0.02 | 0.007 ± 0.003 | ||
| Zn | 5.6 ± 0.9 | 4.01 ± 0.04 | 0.007 ± 0.003 | ||
| S | 12 ± 1.4 | 4.44 ± 0.02 | 0.011 ± 0.002 | ||
| Sample 4065 (k-range = 3–12 Å−1, R-range = 1.2–4.5 Å) | |||||
| Cu_1 (D3h, trianglular geometry) | 4.2 ± 1.1 | 0.01 | |||
| S | 0.8 ± 0.2 | 2.16 ± 0.02 | 0.001 ± 0.002 | ||
| S | 2 | 3.63 ± 0.02 | 0.004 ± 0.003 | ||
| Cu_2 (Td, tetrahedral geometry) | |||||
| S | 1.8 ± 0.2 | 2.28 ± 0.02 | 0.003 ± 0.002 | ||
| S | 0.6 | 2.31 ± 0.02 | 0.003 | ||
| Cu | 2 | 3.10 ± 0.03 | 0.014 ± 0.004 | ||
| S | 2 | 3.45 ± 0.02 | 0.004 ± 0.003 | ||
| Ag K-edge (S02 = 0.95) | |||||
| Ag foil (k-range = 3–13 Å−1, R-range = 1.3–5.0 Å) | |||||
| Ag | 12 | 2.86 ± 0.01 | 0.009 ± 0.001 | −0.3 ± 0.3 | 0.01 |
| Ag | 6 | 4.02 ± 0.01 | 0.012 ± 0.001 | ||
| Ag | 24 | 4.99 ± 0.01 | 0.014 ± 0.003 | ||
| Sample 4152 (k-range = 3–13.5 Å−1, R-range = 1.3–5.0 Å) | |||||
| Ag | 9.4 ± 1.1 | 2.87±0.01 | 0.008 ± 0.001 | 2.0 ± 0.8 | 0.02 |
| Ag | 6 | 3.95±0.07 | 0.015 ± 0.006 | ||
| Ag | 24 | 5.00±0.02 | 0.013 ± 0.003 | ||
| Sample 4169 (k-range = 3–14 Å−1, R-range = 1.3–5.0 Å) | |||||
| Ag | 8.6 ± 0.9 | 2.85 ± 0.01 | 0.009 ± 0.001 | 0.4 ± 0.6 | 0.02 |
| Ag | 6 | 3.98 ± 0.04 | 0.018 ± 0.007 | ||
| Ag | 24 | 4.91 ± 0.04 | 0.017 ± 0.007 | ||
| Sample 4197 (k-range = 3–14 Å−1, R-range = 1.3–4.5 Å) | |||||
| S | 4 | 2.46 ± 0.01 | 0.008 ± 0.001 | 5.4±1.6 | 0.04 |
| Zn | 5.9 ± 2.9 | 3.81 ± 0.12 | 0.020 ± 0.006 | ||
| Zn | 6.1 ± 2.9 | 4.00 ± 0.23 | |||
| S | 12 | 4.48 ± 0.07 | 0.025 ± 0.01 | ||
© 2020 by the authors. Licensee MDPI, Basel, Switzerland. This article is an open access article distributed under the terms and conditions of the Creative Commons Attribution (CC BY) license (http://creativecommons.org/licenses/by/4.0/).
Share and Cite
Trofimov, N.D.; Trigub, A.L.; Tagirov, B.R.; Filimonova, O.N.; Evstigneeva, P.V.; Chareev, D.A.; Kvashnina, K.O.; Nickolsky, M.S. The State of Trace Elements (In, Cu, Ag) in Sphalerite Studied by X-Ray Absorption Spectroscopy of Synthetic Minerals. Minerals 2020, 10, 640. https://doi.org/10.3390/min10070640
Trofimov ND, Trigub AL, Tagirov BR, Filimonova ON, Evstigneeva PV, Chareev DA, Kvashnina KO, Nickolsky MS. The State of Trace Elements (In, Cu, Ag) in Sphalerite Studied by X-Ray Absorption Spectroscopy of Synthetic Minerals. Minerals. 2020; 10(7):640. https://doi.org/10.3390/min10070640
Chicago/Turabian StyleTrofimov, Nikolay D., Alexander L. Trigub, Boris R. Tagirov, Olga N. Filimonova, Polina V. Evstigneeva, Dmitriy A. Chareev, Kristina O. Kvashnina, and Maximilian S. Nickolsky. 2020. "The State of Trace Elements (In, Cu, Ag) in Sphalerite Studied by X-Ray Absorption Spectroscopy of Synthetic Minerals" Minerals 10, no. 7: 640. https://doi.org/10.3390/min10070640