Article

Gap Analysis for DNA Barcode Reference Libraries for Aquatic Macroinvertebrate Species in the Apulia Region (Southeast of Italy)

1
Department of Biological and Environmental Sciences and Technologies, University of Salento, via Monteroni 165, 73100 Lecce, Italy
2
Research Centre for Fisheries and Aquaculture of Acquatina di Frigole, DiSTeBA, University of Salento, 73100 Lecce, Italy
*
Author to whom correspondence should be addressed.
J. Mar. Sci. Eng. 2020, 8(7), 538; https://doi.org/10.3390/jmse8070538
Submission received: 6 July 2020 / Revised: 15 July 2020 / Accepted: 17 July 2020 / Published: 20 July 2020

Abstract

:
The use of molecular tools (DNA barcoding and metabarcoding) for the identification of species and ecosystem biomonitoring is a promising innovative approach. The effectiveness of these tools is, however, highly dependent on the reliability and coverage of the DNA sequence reference libraries and it also depends on the identification of primer sets that work on the broadest range of taxa. In this study, a gap analysis of available DNA barcodes in the international libraries was conducted using the aquatic macroinvertebrate species checklist of the Apulia region in the southeast of Italy. Our analyses show that 42% of the 1546 examined species do not have representative DNA barcodes in the reference libraries, indicating the importance of working toward their completeness and addressing this effort toward specific taxonomic groups. We also analyzed the DNA barcode reference libraries for the primer set used to barcode species. Only for 52% of the examined barcoded species were the primers reported, indicating the importance of uploading this information in the databases for a more effective DNA barcode implementation effort and extensive use of the metabarcoding method. In this paper, a new combination of primers has revealed its experimental effectiveness at least on the species belonging to the three most represented taxa in the aquatic ecosystems of the Apulia region, highlighting the opportunity to develop combinations of primers useful at the regional level and the importance of studying DNA barcode gaps at the local/regional level. The DNA barcode coverage also varies among different taxonomic groups and aquatic ecosystem types in which a large number of species are rare. We tested the application of the DNA barcoding single species to a lagoon ecosystem (the lagoon named “Acquatina di Frigole” in the Apulia region) and we sampled two macroinvertebrate species lacking DNA barcodes from “Aquatina di Frigole” NATURA 2000 Site IT9150003, Fabulina fabula and Tritia nitida, generated two new CO1 barcodes and added them to a DNA barcode reference library.

1. Introduction

It is widely recognized that biodiversity in the world is in danger, with obvious decreases each year. Anthropogenic influences are causing unprecedented changes to the rate of biodiversity loss and, consequently, on ecosystem function [1]. The monitoring of biodiversity, as well as the analysis of occurrence and abundance of target taxonomic groups, is essential for evaluating the health of ecosystems and environmental change in marine coastal waters, transitional waters and freshwaters [2,3,4,5]. However, there is a lack of information regarding the biodiversity of the planet, due to monitoring difficulties. The conservation of biodiversity relies on the monitoring of species and populations in an effort to obtain distribution patterns and population size estimates [6].
Until now, the identification of species has been done with traditional visual methods, based on dichotomous keys. Morphological surveys are very important for biodiversity monitoring but present some disadvantages [7]. For instance, morphological identification keys are typically based on recognizable adult features, and often do not enable identification of larval forms or early developmental stages. The detection of larval stages has many advantages, like monitoring the establishment or spread of invasive populations and identification of larvae of economically important, sensitive or tolerant species, leading to an estimation of the habitat quality. Knowledge of basic life history attributes and life stage-specific habitat use is critical, for example, for the protection of endangered species [8,9]. For many taxa, morphological identifications are possible only at limited taxonomic resolution, in some cases restricted to the genus, family or ‘morphospecies’ level [10]. For example, the chironomids, important macroinvertebrates of freshwater communities, are often treated at the family level of Chironomidae in ecological studies or bioassessments given the difficulty in identifying specimens at lower taxonomic levels of the genus or species [11]. Moreover, there are difficulties in the identification of cryptic and rare species, as well as endangered ones. In recent years, there has been a scientific effort to support morphological identification with genetic tools to address misidentification and inaccurate assessment [12].
A very promising approach is the use of DNA barcoding and metabarcoding for the identification of species and biodiversity assessment, combined with high-throughput DNA sequencing [13]. In DNA barcoding, an individual sequence is taken and compared with entries in reference libraries in order to match the organism to the species [14,15]. DNA metabarcoding can simultaneously identify many species, hence limiting the time and cost of biodiversity estimation [15,16]. Metabarcoding can detect taxa that traditional approaches fail to find. In the metabarcoding technique, the DNA is extracted from a sample containing DNA from more than one organism/species and then individual sequences are compared with entries in reference libraries [17,18]. Another very innovative method is the environmental DNA (eDNA) that is applied to identify the source of the DNA extracted from environmental samples such as water or sediment [19].
Freshwater ecosystems are of great importance, are fragile, and face many anthropogenic pressures and activities. Aquatic macroinvertebrates are used as bioindicators, as they are very useful for assessing ecosystem health and present high species diversity. Moreover, they are common and are sensitive to anthropogenic and natural disturbances [20]. Their identification is difficult and the accuracy of such identification is highly dependent on the researcher’s experience and it is time consuming [21].
There is a worldwide effort to enact legislation with the purpose of promoting ecological quality assessment of aquatic ecosystems [2]. In Europe, there are two main directives focusing on the conservation and protection of marine, transitional and coastal waters. These directives are: (i) the Water Framework Directive (WFD, 2000/60/EC) for transitional and coastal waters, and (ii) the Marine Strategy Framework Directive (MSFD, 2008/56/EC) for marine waters. The MSFD aims to achieve or maintain ‘good environmental status’ (GEns), while the WFD aims to achieve ‘good ecological status’ (GEcs) [22,23].
The current principal limitation in the use of DNA metabarcoding for species identification is incomplete DNA barcode databases. The two big public and most commonly used barcode databases are GenBank, which is maintained by the National Center for Biotechnology Information (NCBI), and the Barcode of Life Data System (BOLD System) [14,24,25]. Both databases provide a global list of species with several data elements. Laboratory teams and universities from all over the world can enter the databases and insert new species barcodes. For animals, the most commonly used barcode region is the mitochondrial cytochrome oxidase I gene (CO1). Information about the organisms inserted in the libraries includes the species name, the sequences of gene targets such as CO1 or rDNA and the PCR primers used for amplification.
In a barcoder’s perfect world, all species on Earth would be identifiable based on their DNA barcodes [26]. However, the current condition of the databases is characterized as incomplete. This leads to a chain of consequences regarding the use of DNA barcoding and metabarcoding for biomonitoring. It is essential to work on the completeness of the reference libraries, expecting that this would lead to more efficient and effortless species identification and biodiversity assessment. The success of the DNA metabarcoding method is also based on the efficiency of the primer sets on the largest number of taxa [27].
In this project, using the Apulia Regional Environmental Protection Agency (ARPA, Puglia, 2011) reference checklist of benthic macroinvertebrates of the aquatic ecosystems of the Apulia region (southeast of Italy) [28], we evaluated the extent of the gap in DNA barcodes in the reference libraries and identified which and how many species, belonging to 440 families, do not have their DNA barcode uploaded in the libraries. These data allow us to direct scientific efforts towards specific taxonomic groups in order to complete the DNA barcode databases. Using a lagoon pilot site from the Apulia region (Aquatina di Frigole, NATURA 2000 Site IT9150003), we tested the application of single species DNA barcoding to a lagoon ecosystem and for two macroinvertebrate species lacking DNA barcode sequences, Fabulina fabula Gmelin, 1791, and Tritia nitida Jeffreys, 1867, we uploaded their CO1 DNA barcode sequence in the public reference library of the BOLD System.

2. Materials and Methods

2.1. Macroinvertebrates Database and Gap-Analysis

For this study, the species checklist of the Apulia Regional Environmental Protection Agency (ARPA-Puglia) published in 2011 [28] was acquired, consisting of macroinvertebrate species from the most significant aquatic ecosystems of the Apulia region in southeast Italy. The research was accomplished in accordance with the Water Framework Directive (European Commission, Directive 2000/60/EC–WFD). Species names were verified using both the European platform named EU-NOMEN (http://www.eu-nomen.eu) and the worldwide platform named WORMS (http://www.marinespecies.org).
The DNA barcode libraries BOLD Systems (http://www.boldsystems.org) [14] and GenBank were examined in June 2020 in order to verify which macroinvertebrate species previously identified were associated with a DNA barcode. Fifteen phyla and 440 families were analyzed, establishing which of the species contained in these phyla and families have a DNA barcode in BOLD Systems or in GenBank. The percentage of each phylum and family with and without barcode in the reference libraries was calculated.

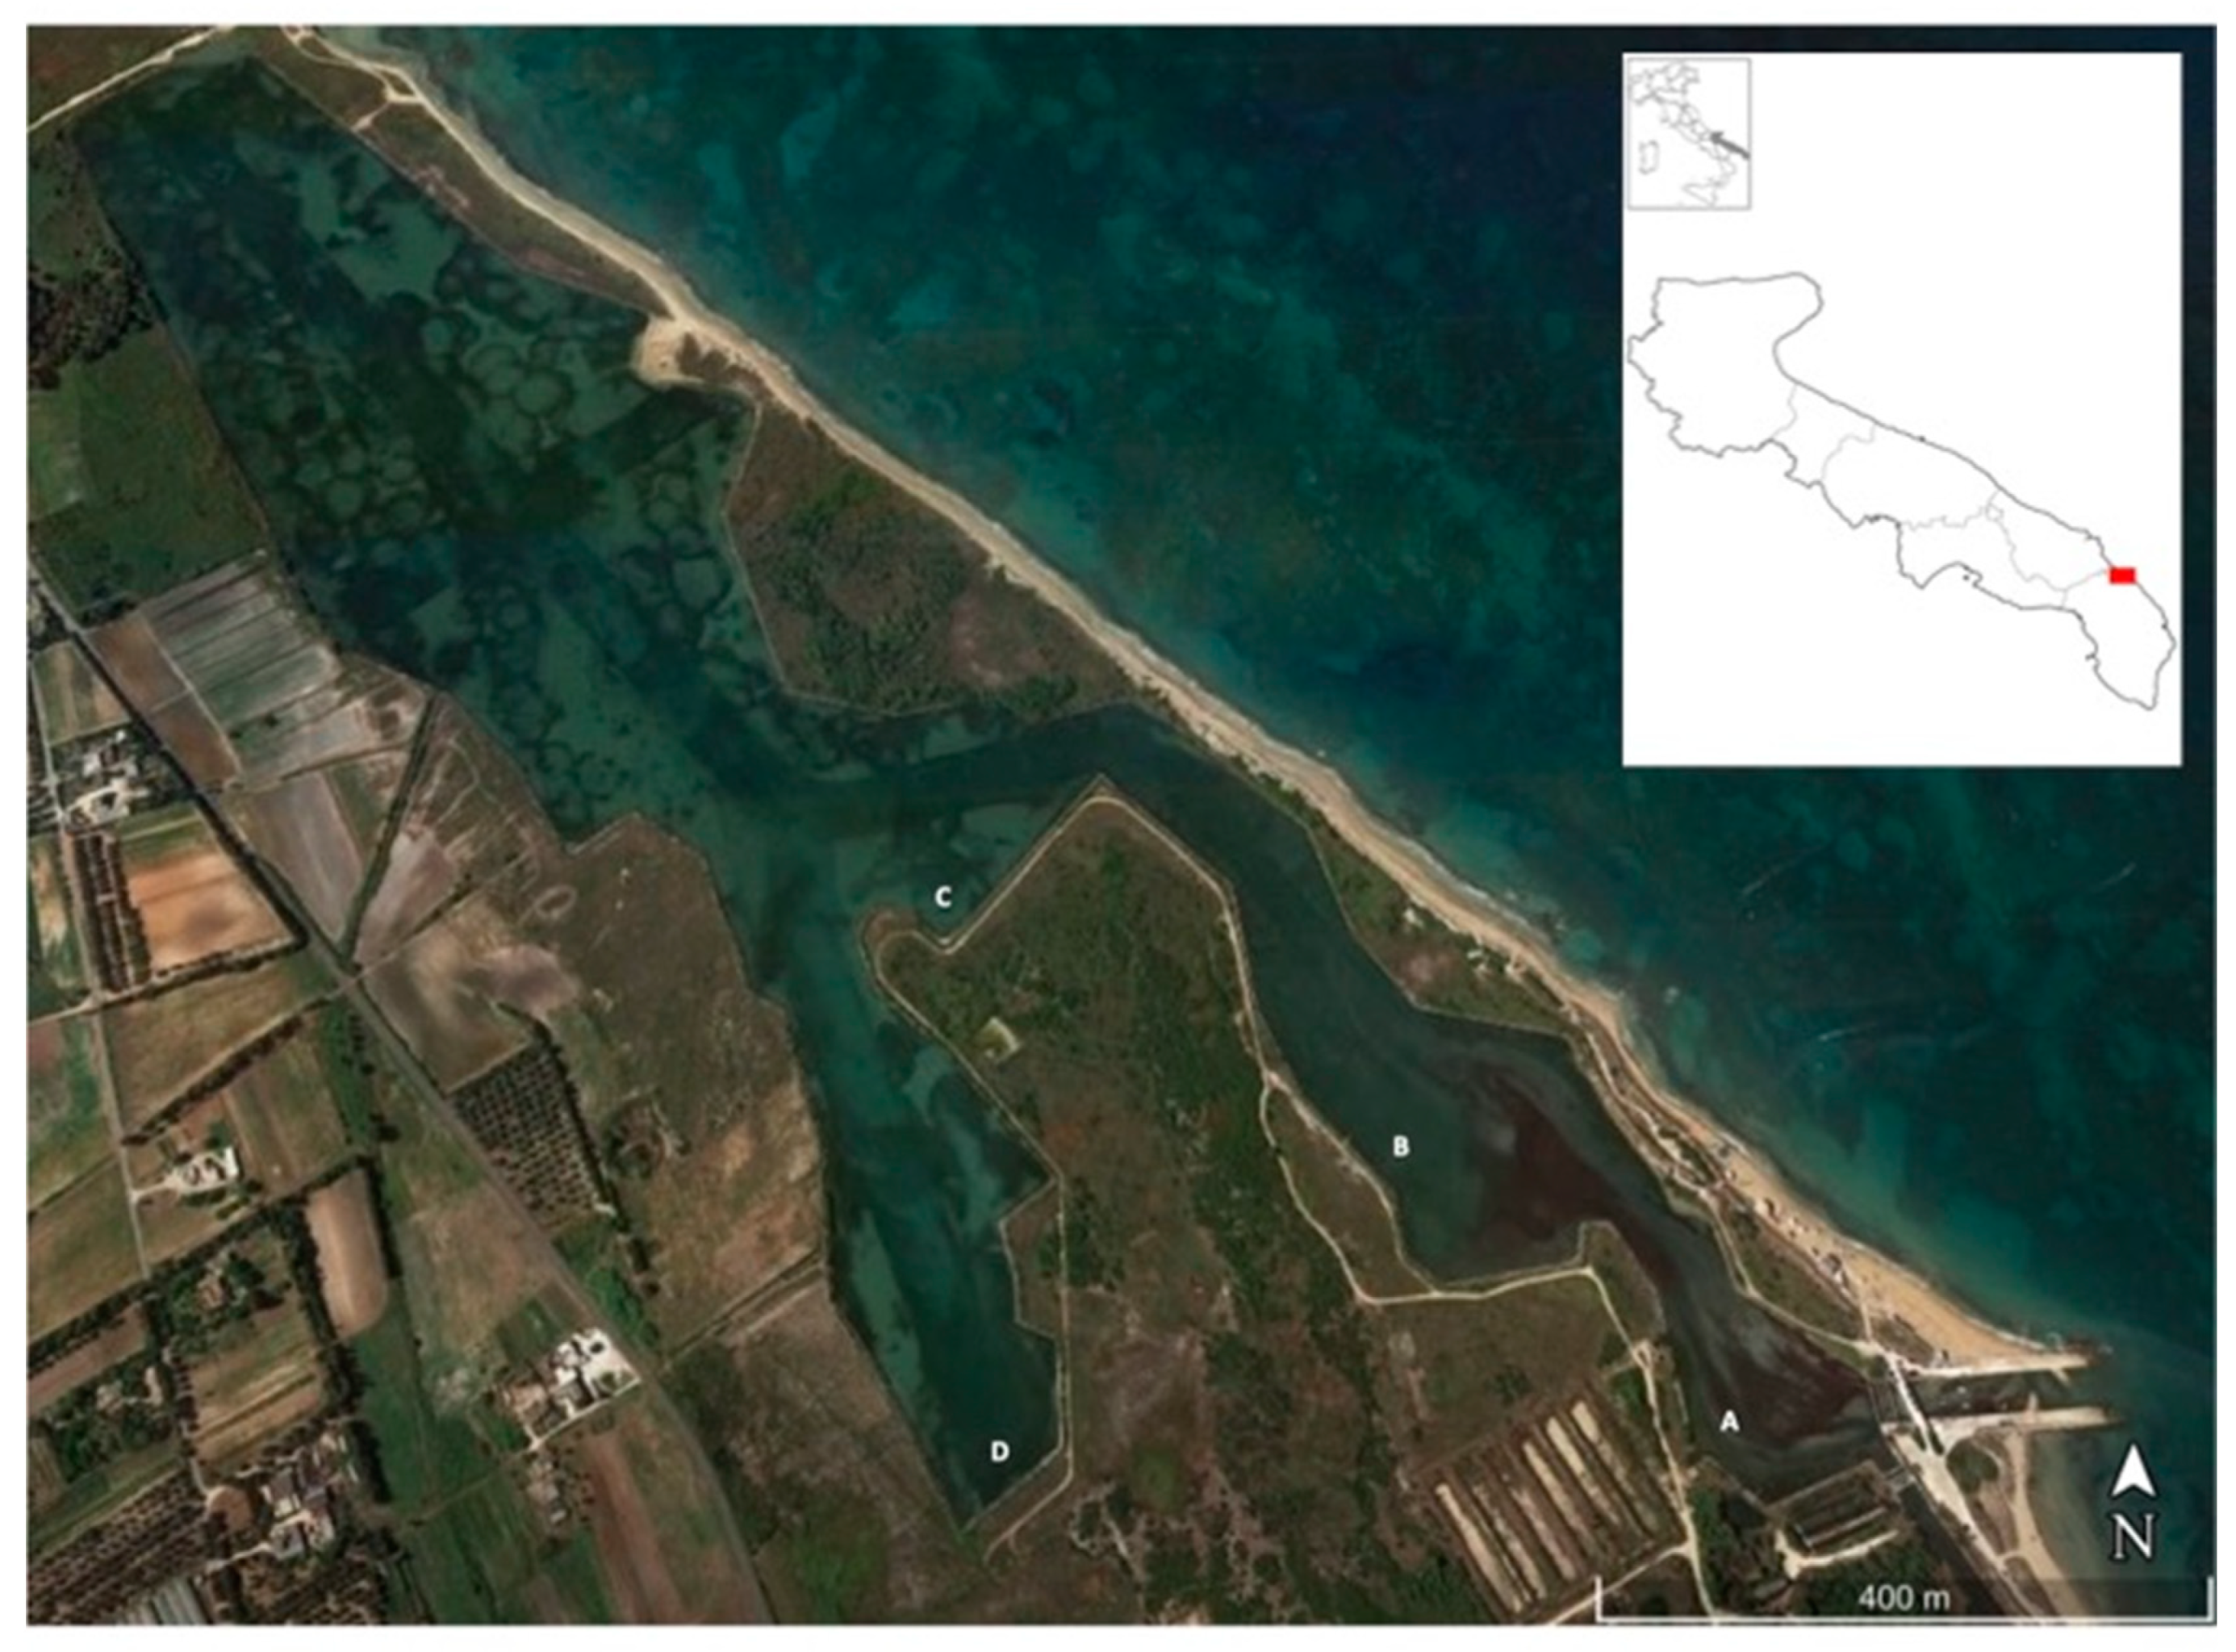
2.2. Field Sampling of Macroinvertebrates

We performed sampling in a lagoon pilot site within the NATURA 2000 Site IT9150003 “Aquatina di Frigole” located on the Adriatic Sea coastline of the Salento peninsula, about 13 km northeast of the town of Lecce (Apulia, Italy). The lagoon is about 43 hectares. Aquatina di Frigole is a Site of Community Importance (SCI) and Special Area of Conservation (SAC) under the Habitat Directive 92/43/EEC “Aquatina di Frigole” (IT9150003), within which habitats worthy of protection have been identified. This NATURA 2000 site also covers marine and terrestrial habitats. Some of these, included in Annex I of the Directive 92/43/EEC, have been given “priority” status, such as 1120* Posidonia beds (Posidonion oceanicae), 1150* Coastal lagoons and 2250* Coastal dunes with Juniperus spp. In addition, the variety of environments and habitats in the entire protected area support numerous nesting and migratory birds. The lagoon constitutes a nursery environment for the juvenile stages of many fish species due to the wide availability of nutrients and food resources. Furthermore, the lagoon hosts different species of crustaceans and mollusks. Among these, the endemic Mediterranean bivalve Pinna nobilis is included in Annex IV of The Habitats Directive and is listed as an endangered species in the International Union for Conservation of Nature (IUCN) Red List [29,30].
Sampling in the “Aquatina di Frigole” lagoon involved four strategic sites (named A, B, C and D) arranged along the salinity gradient. Three experiments were carried out for each site, corresponding to three sampling replicates for site A: A1, A2, A3, site B: B1, B2, B3 and site C: C1, C2, C3; for site D: D1, D2, D3. Their geo-locations are shown in Figure 1.
For sampling macroinvertebrates, we used a Reineck box-corer covering a surface of 17 × 17 cm [2]. Afterwards, the samples collected were screened using a 1-mm square mesh sieve to eliminate interstitial water, fine sediments and debris. Thereafter, the samples were frozen and kept for a few days at a temperature of −20 °C.
In the laboratory, the samples were further cleaned and the debris removed until the sampled animals were isolated (sorting phase) and stored in 70% ethanol at a temperature of 4 °C. Finally, through the use of stereomicroscopes, the animals were morphologically identified to the lowest possible taxonomic level (e.g., species) with the help of dichotomous keys (identification phase) [31,32,33,34,35,36,37,38]. In particular, Fabulina fabula presents a sculpture of fine oblique grooves crossing the concentric stripes, a white color and dimensions between 8 and 24 mm; for Tritia nitida, although this species displays a wide range of variation, brackish water specimens are usually smaller than others, are glossier and almost always have stronger axial ribs and dimensions from 20 to 30 mm.

2.3. Single Species DNA-Barcoding

Genomic DNA was extracted from approximately 200 mg of fresh tissue taken from the whole sample (excluding shell) preserved in 70% ethanol.
The samples, each collected in a sterile 2-mL tube, were treated with 700 μL of TNES lysis buffer (Tris 1M, NaCl 5M, EDTA 0.5M, SDS 0.5% pH 7.5) and 12 μL of proteinase K 20 mg/mL and homogenized using a 35,000 rpm power homogenizer. The tubes were incubated in a thermal bath at 65 °C for 3 h, vortexing them every 30 min until complete lysis. The DNA extraction process was completed with DNeasy PowerSoil kit (Qiagen) according to the manufacturer’s protocol.
The amplification of a fragment of approximately 350 bp of the mitochondrial gene CO1 was performed using the primers mCOIF 5′GGWACWGGWTGAACWGTWTAYCCYCC3′ and dgHCO-2198 5’TAAACTTCAGGGTGACCAAARAAYCA3′ [39]. The reaction was performed in a volume of 50 μL composed of: 5 μL of 10× reaction buffer, 1 μL of MgCl2 (50 mM), 1 μL of dNTP mix (10 mM), 1 μL of each primer (10 mM); ~15 ng DNA, 0.5 μL of Life Technologies Platinum Taq (5 U/μL) and sterile water to 50 μL. The amplification program included the following phases: denaturation (95 °C for 30”), annealing (45 °C for 30”), extension (72 °C for 30”) repeated for 30 cycles, preceded by an initial denaturation at 95 °C for 5 min, and followed by a final polymerization at 72 °C for 5 min.
All PCR products were purified with a PureLink PCR purification kit (Invitrogen, Carlsbad, CA, USA) and Sanger sequenced.

3. Results

3.1. Gap Analysis of the Barcoded Species in the Reference Libraries

In order to investigate the degree of completeness of the barcode sequence databases for the purpose of future use in the assessment of environmental quality, we used the list of macroinvertebrate species of the ARPA, Puglia. This list comprised 1565 macroinvertebrate species/taxa; we analyzed 1546 species that we could categorize into 15 phyla and 440 families. We searched the databases of BOLD Systems and NCBI GenBank for the presence or absence of CO1 barcode sequences for these species, as reported in Table 1 and Supplementary Table S1. A DNA barcode was available for 58% of the listed species. The phyla with the highest numbers of species present in the regional list were Mollusca, Anellida and Arthropoda with 438, 423 and 383 species, respectively, and the numbers of species without barcodes for these phyla were 174, 196 and 135, respectively. The phyla with the larger gaps in the reference libraries were Nematoda, Entoprocta and Porifera (Table 1).
At the family level, there were families completely lacking DNA barcodes in the reference libraries, and also families with existing DNA barcode for all species; this trend is common to all the phyla (Supplementary Table S1). Some phyla, such as Nematoda, presented a large number of families with a single species and most of them were barcoded. Among the most represented phyla, Mollusca presented 30% of families with a gap in the reference libraries greater than 50%, while Anellida and Arthropoda presented 50% of families with a gap in the reference libraries greater than 50%, also because for Anellida the families are represented by a greater number of species.
The success of the metabarcoding method is, at the same time, closely linked to the availability of an efficient primer pair for the taxa represented in the ecosystem under consideration. We wanted to investigate the information relative to the primers used to obtain the DNA barcodes present in the databases. Only for 52% of the examined barcoded species were the primers used reported in the databases. Among these, the primer combinations dgLCO-1490/dgHCO-2198 and LCO-1490/HCO-2198 [39] were overall 45%. Specifically, Mollusca were barcoded with LCO-1490/HCO-2198 at a percentage of 37%, Annelida were barcoded with dgLCO-1490/dgHCO-2198 at a percentage of 50% and Arthropoda with dgLCO-1490/dgHCO-2198 and LCO-1490/HCO-2198 at a percentage of 40% (Supplementary Table S2).

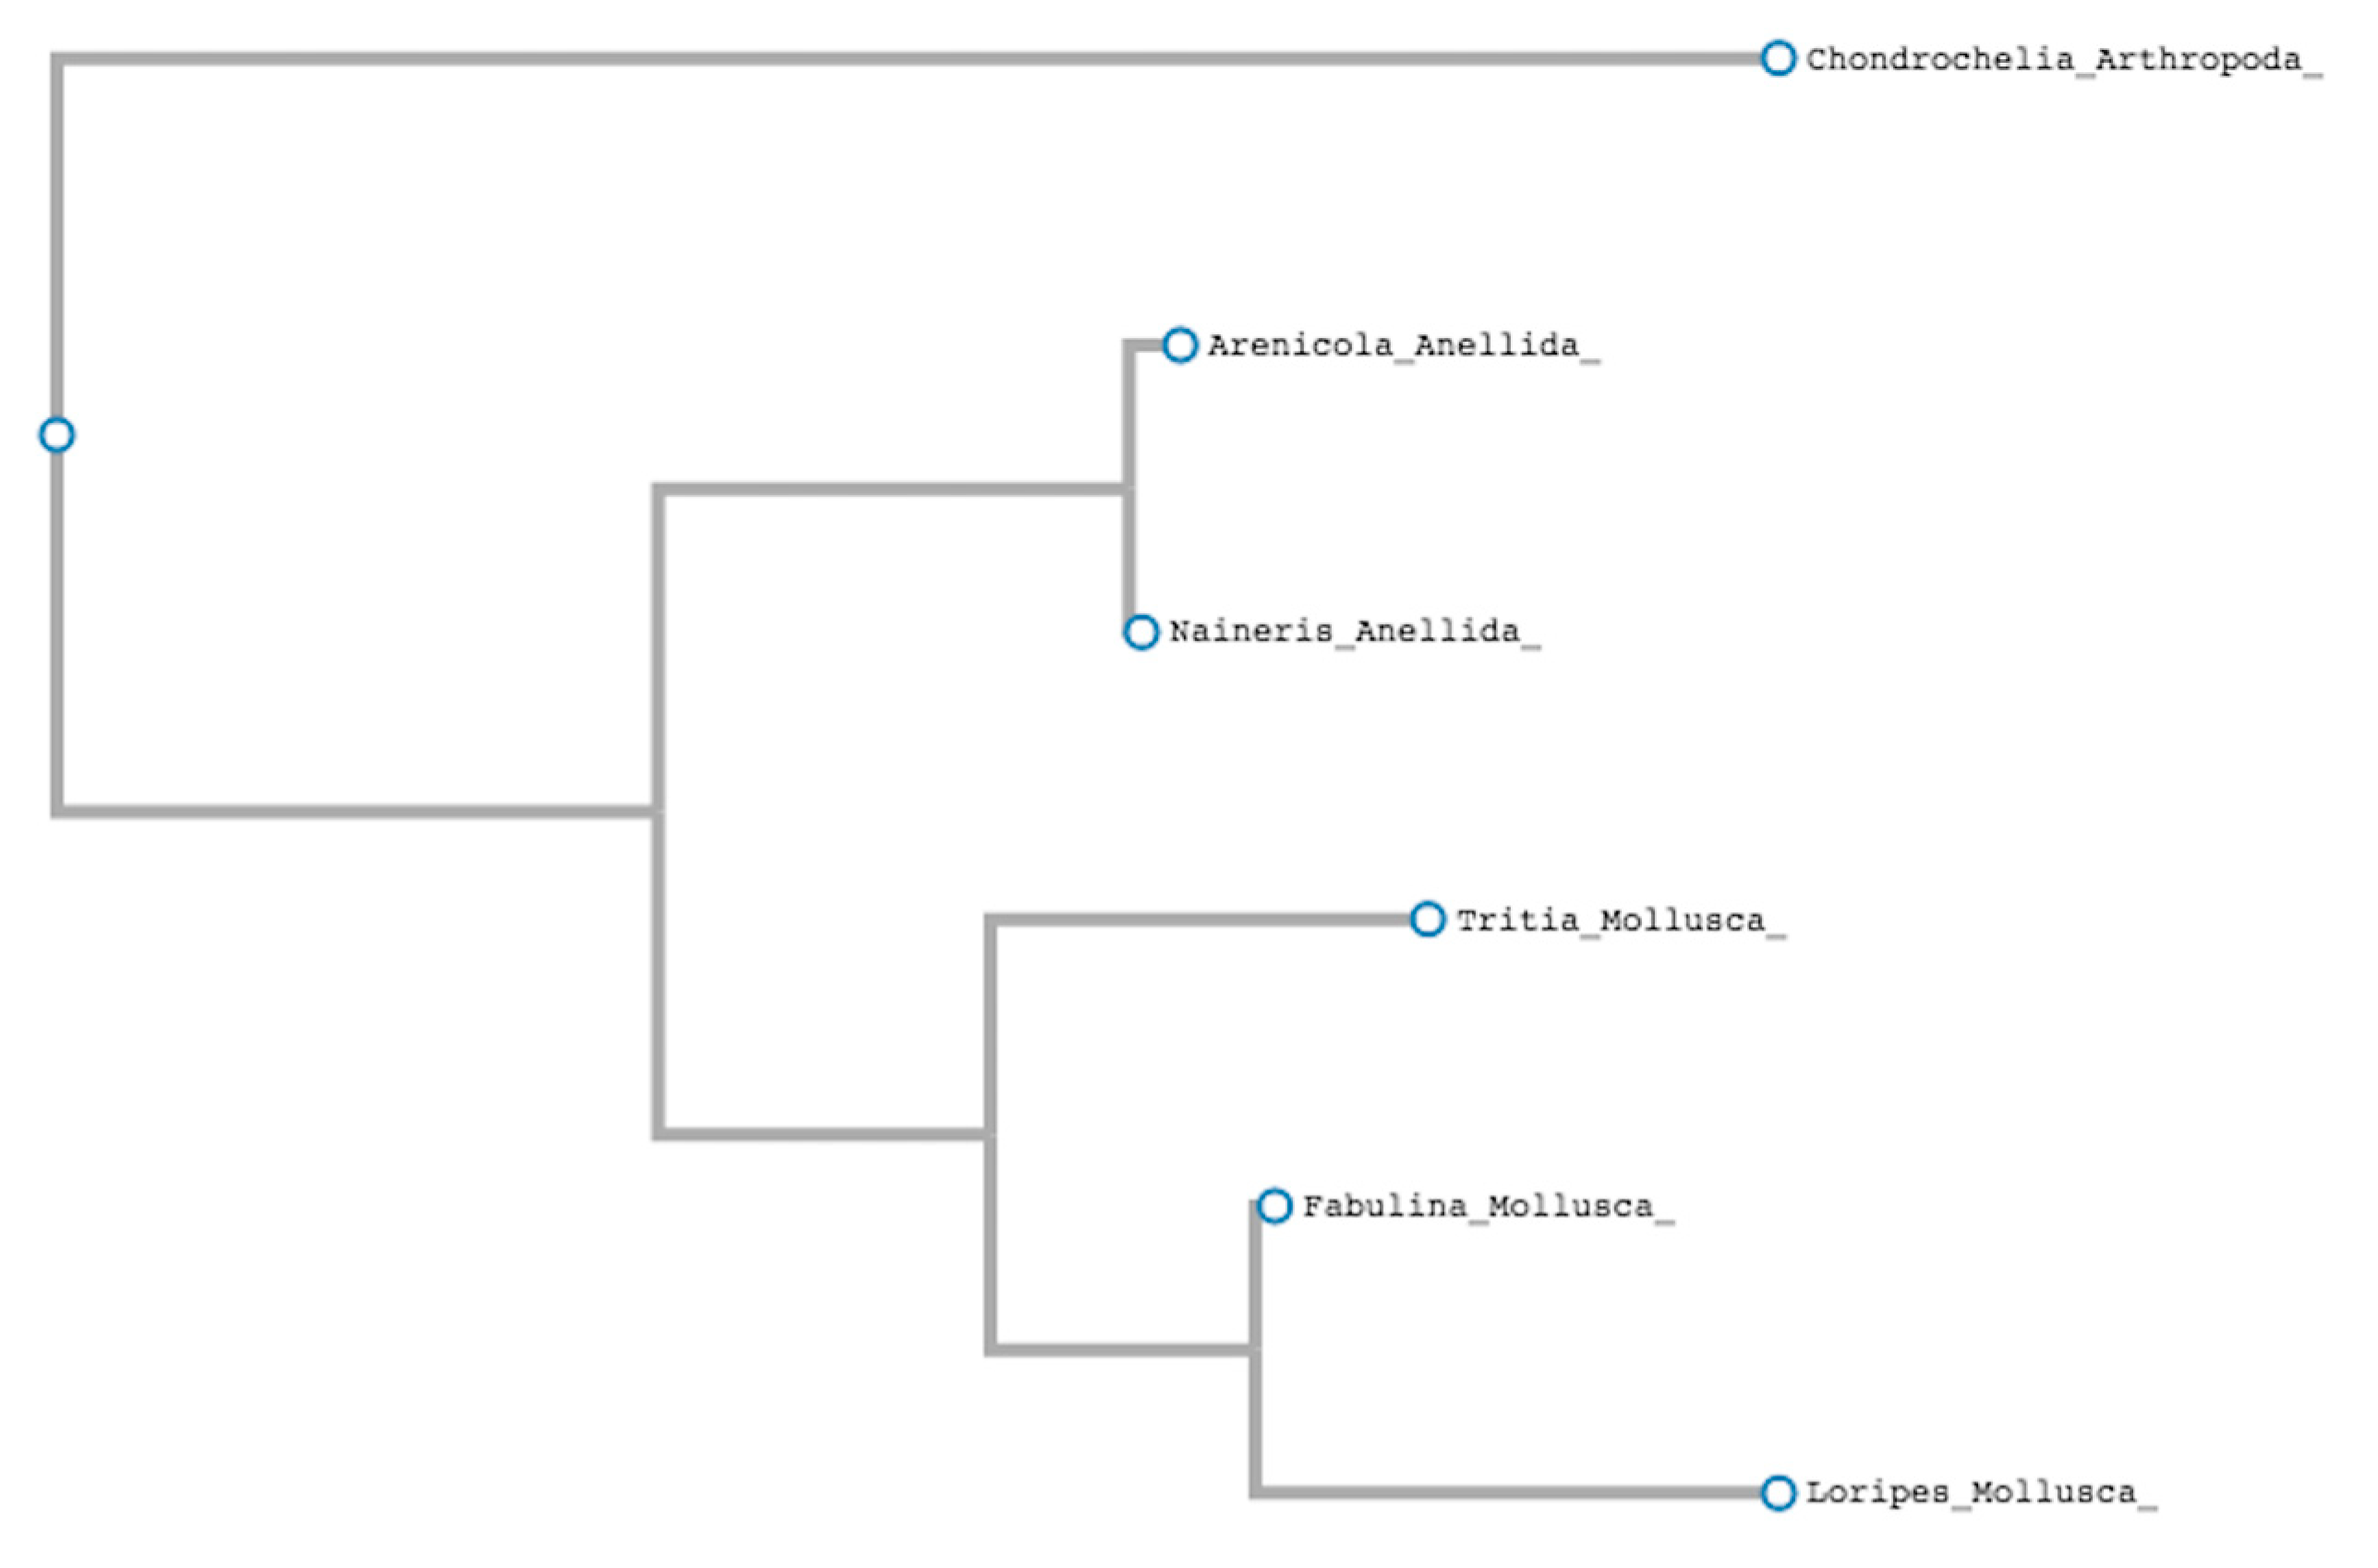
3.2. Application of Single Species DNA Barcoding to a Lagoon Ecosystem and First Identification of the DNA Barcode Sequence in Two Macroinvertabrate Species

Many examples of DNA barcoding and metabarcoding projects, using benthic macroinvertabrates, have been performed in marine ecosystems [16], while the use of these innovative methods for lagoon ecosystems, which are richer in humic substances than other aquatic environments, remains under explored. In order to test single-species DNA barcoding, we used, as a pilot site, a lagoon in the Apulia region, the “Aquatina di Frigole” lagoon. A standard sampling (4 × 2 sampling sites) was performed and we collected 32 species which were identified by the morphological approach (Supplementary Table S3). Among them, five species were without a DNA barcode in the reference libraries: Tritia nitida, Fabulina fabula, Ampithoe ferox, Cerithium vulgatum and Microdeutopus gryllotalpa. For two of them, Tritia nitida and Fabulina fabula, we extracted DNA and amplified a fragment of the CO1 gene. The sequences were uploaded in the BOLD Systems database with ID TWA001-19 for Tritia nitida and TWC001-20 for Fabulina fabula.
For the amplification, we tested a new combination of primers, the mCOIF/dgHCO-2198 primer pair, which worked under our conditions with DNA of various species. This primer set and the amplicon may prove useful for future DNA metabarcoding analyses. We obtained the amplification of DNA and sequenced the amplicons from Naineris laevigata (Anellida Polychaete), Loripes orbiculatus (Mollusca Bivalvia), Arenicola marina (Anellida Polychaete), Condrochelia savignyi (Arthropoda Crustacea), Fabulina fabula (Mollusca bivalvia), Tritia nitida (Mollusca Gastropoda). The primer pair mCOIF/dgHCO-2198 worked with the phyla with the highest number of species present in the Apulia regional list (Anellida, Mollusca, Arthropoda), which were separated in the phylogenetic analysis of the sequences we obtained (Figure 2).

3.3. The Identification of Species for Macroinvertabrates Early Developmental Stages

Sampling at the Aquatina lagoon allowed us to collect 290 larvae of the genus Chironomus. The morphological approach does not allow for identification at the species level. We extracted genomic DNA from pools of 15 Chironomus larvae and amplified and sequenced a CO1 gene fragment. The analysis of the sequences and the alignment with sequences present in GenBank allowed us to identify the species of the larvae, in particular the species Chironomus salinarius, as confirmed from the results of the nucleotide multi-alignment of two CO1 amplicon sequences from Chironomus larvae genomic DNA and the entry sequence MN454846 of Chironomous salinarius CO1 from NCBI GenBank (Supplementary Figure S1).
This experiment confirms the potential role of DNA barcoding in the identification of species starting from larval or early developmental stages of individuals.

4. Discussion

Although the advantages of the DNA barcoding and metabarcoding approaches are well defined [40,41], it is necessary to consider some current limitations that need to be improved. At first, the process of DNA barcoding and metabarcoding for species identification is dependent on the completeness of the reference libraries. Moreover, it also relies on the availability of primer set that cover the amplification of all the species present in the studied environment. With the aim of addressing these problems, local/regional studies are important for analyzing the gaps in the databases relative to the species of the area and to set useful combinations of primers to cover the specific richness in species of different area. At the same time, the identification of the gaps in the reference databases has a more generic relevance because it directs the efforts of the scientific community to complete the databases for specific taxonomic groups.
In this study, we performed a gap analysis using the list of macroinvertebrate species of all aquatic ecosystems of the Apulia region in southeast Italy. Macroinvertebrate communities have been frequently used as environmental, ecological, and biodiversity indicators in the monitoring of aquatic ecosystems and in supporting assessments of the ecological status of bodies of water according to EU Directives and national legislation (D.M. 260/10). In fact, benthic macroinvertebrates possess many of the hallmark traits of good bioindicators: poor mobility, high number of species and functional groups, long life cycles and their important role in aquatic trophic networks [2,3,4,5]. Moreover, any natural or anthropogenic perturbation causes a change in the structure and composition of their communities [42,43,44,45,46].
Our analysis revealed that, for the Apulia Regional Environmental Protection Agency checklist of aquatic macroinvertebrates, the global gap in DNA barcodes in the BOLD Systems and GenBank is 42.3%. This analysis underlines the importance of increasing the barcoded species to enable the effective use of the DNA metabarcoding approach in regional biomonitoring programs.
Macroinvertebrate species have been used in DNA barcoding and metabarcoding studies from marine ecosystems and streams [16,47]. The lagoon ecosystems are currently underrepresented in these studies. These lagoons are peculiar because they are richer in humic substances than other aquatic environments and the presence of humic substances is known to inhibit PCR amplification reactions. In this study, we applied single-species DNA barcoding to a lagoon ecosystem using the Aquatina lagoon as a pilot site, highlighting the applicability of the method for successful new barcoding applications. This study, however, had a limiting factor in the amount of DNA related to the number of individuals sampled. Future studies will be centered on DNA metabarcoding applications for the pools of lagoon macroinvertebrate species collected.

5. Conclusions

This study highlighted the importance of analyzing, at the regional level, the DNA barcode gaps in the reference libraries for the future application of DNA barcoding and metabarcoding methods in regional biomonitoring assessments. In fact, it is of great importance that we prioritize the most widely represented groups of species lacking DNA barcodes. At the same time, the combination of primers used in this study is efficient for species belonging to the three most represented phyla, and opens the door for future experimental and in silico studies for the wide use of this combination in the regional context.
Finally, it is important to underline that molecular methods can find applications in lagoon ecosystems which, due to their intrinsic characteristics, require particular attention and future investigations in relation to DNA metabarcoding applications.

Supplementary Materials

The following are available online at https://www.mdpi.com/2077-1312/8/7/538/s1, Figure S1: Results of the nucleotide multi-alignment of two CO1 amplicon sequences from Chironomus larvae genomic DNA and the entry sequence MN454846 of Chironomous salinarius CO1 from NCBI GenBank, Table S1: Number of species with and without DNA barcodes for each family listed in decreasing order of the gap, Table S2: Number of barcoded species with reported primers and percentage of the LCO-1490/HCO-2198 and dgLCO-1490/dgHCO-2198 use, Table S3: List of species collected in the Acquatina lagoon reporting the presence or absence of DNA barcodes in the reference libraries.

Author Contributions

Conceptualization, M.P. and V.S.; methodology, M.P., V.S.; software, G.M.; formal analysis, V.S., E.T., G.M, S.S. and S.D.; investigation, S.D., G.M, S.S. and E.T.; data curation, V.S., E.T., G.M, S.S. and S.D.; writing—original draft preparation, M.P., V.S., E.T.; writing—review and editing M.P., V.S., E.T., G.M, S.D. and S:S.; supervision, M.P. and V.S:.; project administration, M.P.; funding acquisition, M.P. and V.S. All authors have read and agreed to the published version of the manuscript.

Funding

This research was funded by the European Community (Interreg ADRION Programme 2014–2020), ImPrEco project N.450 awarded to M. Pinna, by the Italian Ministry of University and Research, Funding of Basic Research Activities (FFABR) 2017 awarded to M. Pinna and V. Specchia and the APC was funding by FFABR 2017 awarded to V. Specchia.

Acknowledgments

We thank the chair and the members of the EU COST action DNAqua-Net CA15219 for helpful discussions during meetings and workshops.

Conflicts of Interest

The authors declare no conflict of interest.

References

  1. Cardinale, B.J.; Duffy, J.E.; Gonzalez, A.; Hooper, D.U.; Perrings, C.; Venail, P.; Narwani, A.; Mace, G.M.; Tilman, D.; Wardle, D.A.; et al. Biodiversity loss and its impact on humanity. Nature 2012, 486, 59–67. [Google Scholar] [CrossRef] [PubMed]
  2. Pinna, M.; Janzen, S.; Franco, A.; Specchia, V.; Marini, G. Role of habitats and sampling techniques on macroinvertebrate descriptors and ecological indicators: An experiment in a protected Mediterranean lagoon. Ecol. Indic. 2017, 83, 495–503. [Google Scholar] [CrossRef]
  3. Dauer, D.M. Biological criteria environmental health and estuarine macrobenthic community structure. Mar. Pollut. Bull. 1993, 26, 249–257. [Google Scholar] [CrossRef]
  4. Pinna, M.; Marini, G.; Rosati, I.; Neto, J.M.; Patrício, J.; Marques, J.C.; Basset, A. The usefulness of large body-size macroinvertebrates in the rapid ecological assessment of Mediterranean lagoons. Ecol. Indic. 2013, 29, 48–61. [Google Scholar] [CrossRef]
  5. Pinna, M.; Marini, G.; Mancinelli, G.; Basset, A. Influence of sampling effort on ecological descriptors and indicators in perturbed and unperturbed conditions: A study case using benthic macroinvertebrates in Mediterranean. Ecol. Indic. 2014, 37, 27–39. [Google Scholar] [CrossRef]
  6. Thomsen, P.F.; Willerslev, E. Environmental DNA—An emerging tool in conservation for monitoring past and present biodiversity. Biol. Conserv. 2015, 183, 4–18. [Google Scholar] [CrossRef]
  7. Baird, D.J.; Hajibabaei, M. Biomonitoring 2.0: A new paradigm in ecosystem assessment made possible by next-generation DNA sequencing. Mol. Ecol. 2012, 21, 2039–2044. [Google Scholar] [CrossRef]
  8. Besansky, N.J.; Severson, D.W.; Ferdig, M.T. DNA barcoding of parasites and invertebrate disease vectors: What you don’t know can hurt you. Trends Parasitol. 2003, 19, 545–546. [Google Scholar] [CrossRef]
  9. Buckwalter, J.; Angermeier, P.L.; Argentina, J.; Wolf, S.; Floyd, S.; Hallerman, E.M. Drift of larval darters (Family Percidae) in the upper Roanoke River basin, USA, characterized using phenotypic and DNA barcoding markers. Fishes 2019, 4, 59. [Google Scholar] [CrossRef] [Green Version]
  10. Caesar, R.M.; Sörensson, M.; Cognato, A.I. Integrating DNA data and traditional taxonomy to streamline biodiversity assessment: An example from edaphic beetles in the Klamath ecoregion, California, USA. Divers. Distrib. 2006, 12, 483–489. [Google Scholar] [CrossRef]
  11. Beermann, A.J.; Zizka, V.M.; Elbrecht, V.; Baranov, V.; Leese, F. DNA metabarcoding reveals the complex and hidden responses of chironomids to multiple stressors. Environ. Sci. Eur. 2018, 30, 26. [Google Scholar] [CrossRef] [Green Version]
  12. Lobo, J.; Shokralla, S.; Costa, M.H.; Hajibabaei, M.; Costa, F.O. DNA metabarcoding for high-throughput monitoring of estuarine macrobenthic communities. Sci. Rep. 2017, 7, 1–13. [Google Scholar] [CrossRef] [PubMed] [Green Version]
  13. Blaxter, M.L. The promise of a DNA taxonomy. Philos. Trans. R. Soc. B 2004, 359, 669–679. [Google Scholar] [CrossRef] [PubMed] [Green Version]
  14. Ratnasingham, S.; Hebert, P.D. BOLD: The Barcode of Life Data System. Mol. Ecol. Notes 2007, 7, 355–364. Available online: http://www.barcodinglife.org (accessed on 16 June 2020). [CrossRef] [PubMed] [Green Version]
  15. Taberlet, P.; Coissac, E.; Pompanon, F.; Brochmann, C.; Willerslev, E. Towards next-generation biodiversity assessment using DNA metabarcoding. Mol. Ecol. 2012, 21, 2045–2050. [Google Scholar] [CrossRef]
  16. Aylagas, E.; Borja, Á.; Irigoien, X.; Rodríguez-Ezpeleta, N. Benchmarking DNA metabarcoding for biodiversity-based monitoring and assessment. Front. Mar. Sci. 2016, 3, 96. [Google Scholar] [CrossRef] [Green Version]
  17. Deiner, K.; Bik, H.M.; Mächler, E.; Seymour, M.; Lacoursière-Roussel, A.; Altermatt, F.; Creer, S.; Bista, I.; Lodge, D.M.; de Vere, N.; et al. Environmental DNA metabarcoding: Transforming how we survey animal and plant communities. Mol. Ecol. 2017, 26, 5872–5895. [Google Scholar] [CrossRef]
  18. Ji, Y.; Ashton, L.; Pedley, S.M.; Edwards, D.P.; Tang, Y.; Nakamura, A.; Kitching, R.; Dolman, P.M.; Woodcock, P.; Edwards, F.A.; et al. Reliable, verifiable and efficient monitoring of biodiversity via metabarcoding. Ecol. Lett. 2013, 16, 1245–1257. [Google Scholar] [CrossRef]
  19. Rees, H.C.; Maddison, B.C.; Middleditch, D.J.; Patmore, J.R.M.; Gough, K.C. The detection of aquatic animal species using environmental DNA – a review of eDNA as a survey tool in ecology. J. Appl. Ecol. 2014, 51, 1450–1459. [Google Scholar] [CrossRef]
  20. Carew, M.E.; Pettigrove, V.J.; Metzeling, L.; Hoffmann, A.A. Environmental monitoring using next generation sequencing: Rapid identification of macroinvertebrate bioindicator species. Front. Zool. 2013, 10, 45. [Google Scholar] [CrossRef] [Green Version]
  21. Sweeney, B.W.; Battle, J.M.; Jackson, J.K.; Dapkey, T. Can DNA barcodes of stream macroinvertebrates improve descriptions of community structure and water quality? J. North. Am. Benthol. Soc. 2011, 30, 195–216. [Google Scholar] [CrossRef]
  22. Borja, A.; Miles, A.; Occhipinti-Ambrogi, A.; Berg, T. Current status of macroinvertebrate methods used for assessing the quality of European marine waters: Implementing the Water Framework Directive. Hydrobiologia 2009, 633, 181–196. [Google Scholar] [CrossRef]
  23. Borja, A.; Elliott, M.; Andersen, J.H.; Cardoso, A.C.; Carstensen, J.; Ferreira, J.G.; Heiskanen, A.; Marques, J.C.; Neto, J.M.; Teixeira, H.; et al. Good environmental status of marine ecosystems: What is it and how do we know when we have attained it? Mar. Pollut. Bull. 2013, 76, 16–27. [Google Scholar] [CrossRef] [PubMed] [Green Version]
  24. Leese, F.; Altermatt, F.; Bouchez, A.; Ekrem, T.; Hering, D.; Meissner, K.; Mergen, P.; Pawlowski, J.; Piggott, J.; Rimet, F.; et al. DNAqua-Net: Developing new genetic tools for bioassessment and monitoring of aquatic ecosystems in Europe. Res. Ideas Outcomes 2016, 2, e11321. [Google Scholar] [CrossRef] [Green Version]
  25. Macher, J.N.; Macher, T.H.; Leese, F. Combining NCBI and BOLD databases for OTU assignment in metabarcoding and metagenomic data: The BOLD_NCBI _Merger. PeerJ 2017, 5, e3133v1. [Google Scholar]
  26. Weigand, H.; Beermann, A.J.; Čiampor, F.; Costa, F.O.; Csabai, Z.; Duarte, S.; Geigerg, M.F.; Grabowski, M.; Rimet, F.; Rulik, B.; et al. DNA barcode reference libraries for the monitoring of aquatic biota in Europe: Gap-analysis and recommendations for future work. Sci. Total Environ. 2019, 678, 499–524. [Google Scholar] [CrossRef]
  27. Elbrecht, V.; Leese, F. Validation and development of COI metabarcoding primers for freshwater macroinvertebrate bioassessment. Front. Environ. Sci. 2017, 5, 11. [Google Scholar]
  28. Agenzia Regionale per la Protezione dell’Ambiente della Puglia, ARPA-Puglia. Monitoraggio di sorveglianza, Relazione finale 2010–2011; ARPA-Puglia: Bari, Italy, 2011. [Google Scholar]
  29. Marrocco, V.; Zangaro, F.; Sicuro, A.; Pinna, M. A scaling down mapping of Pinna nobilis (Linnaeus, 1758) through the combination of scientific literature, NATURA 2000, grey literature and citizen science data. Nat. Conserv. 2018, 33, 21. [Google Scholar] [CrossRef]
  30. Marrocco, V.; Sicuro, A.; Zangaro, F.; Pinna, M. First record of the protected species Pinna nobilis (Linnaeus, 1758) in the Aquatina Lagoon (NATURA 2000 site IT9150003, South-East Italian coastline). Nat. Conserv. 2019, 28, 51. [Google Scholar] [CrossRef]
  31. Bellan-Santini, D.; Karaman, G.; Krapp-Schickel, G.; Ledoyer, M.; Ruffo, S. The amphipoda of the mediterranean. Part 1: Gammaridea (acanthonotozomatidae to gammaridae). In Mémoires de l’Institut Océanographique, Monaco, 13; Institut Océanographique: Monaco, Monaco, 1982; p. 364. ISBN 2-7260-0160-2. [Google Scholar]
  32. Bellan-Santini, D.; Karaman, G.; Krapp-Schickel, G.; Ledoyer, M.; Ruffo, S. The amphipoda of the mediterranean. Part 2: Gammaridea (haustoriidae to lysianassidae). In Mémoires de l’Institut Océanographique, Monaco, 13; Institut Océanographique: Monaco, Monaco, 1989; p. 576. ISBN 2-7260-0160-2. [Google Scholar]
  33. Bellan-Santini, D.; Karaman, G.; Krapp-Schickel, G.; Ledoyer, M.; Ruffo, S. The amphipoda of the mediterranean. Part 3: Gammaridea (melphidippidae to talitridae), ingolfiellidea, caprellidea. In Mémoires de l’Institut océanographique, Monaco, 13; Institut Océanographique: Monaco, Monaco, 1993; p. 813. ISBN 2-7260-0160-2. [Google Scholar]
  34. Campaioli, S.; Ghetto, P.F.; Mineli, A.; Ruffo, S. Manuale Per il Riconoscimento del Macroinvertebrati Delle Acque Dolci Italiane; Provincia Autonoma di Trento: Trento, Italia, 1999; Volume I and Volume II, p. 484. (In Italian) [Google Scholar]
  35. Campani, E. La cerniera dei Bivalvi per scopi diagnostici: Un esempio. In Proceedings of the Atti del Secondo Convegno Malacologico Pontino, Sabaudia, Italy, 20 September 2008. [Google Scholar]
  36. POLiKEY. Version 2. Available online: http://www.environment.gov.au/biodiversity/abrs/online-resources/polikey/index.html (accessed on 12 June 2019).
  37. Karamagn, S. Anfipodi delle acque dolci italiane. In Fauna d’Italia, XXXI; Calderini: Bologna, Italy, 1993; p. 333. [Google Scholar]
  38. Sansoni, G. Atlante Per il Riconoscimento dei Macroinvertebrati Bentonici dei Corsi d’acqua Italiani; Provincia Autonoma di Trento: Trento, Italy, 1988; p. 191. (In Italian) [Google Scholar]
  39. Sconfinetti, R. Chiave di riconoscimento visuale dei più comuni peracaridi (Crustacea, Peracarida) lagunari italiani. Studi Trent. Sci. Nat. Acta Biol. 2004, 81, 79–89. [Google Scholar]
  40. Leray, M.; Yang, J.Y.; Meyer, C.P.; Mills, S.C.; Agudelo, N.; Ranwez, V.; Bohem, J.T.; Machida, R.J. A new versatile primer set targeting a short fragment of the mitochondrial COI region for metabarcoding metazoan diversity: Application for characterizing coral reef fish gut contents. Front. Zool. 2013, 10, 34. [Google Scholar] [CrossRef] [PubMed] [Green Version]
  41. Pawlowski, J.; Kelly-Quinn, M.; Altermatt, F.; Apothéloz-Perret-Gentil, L.; Beja, P.; Boggero, A.; Borja, A.; Bouchez, A.; Cordier, T.; Domaizon, I.; et al. The future of biotic indices in the ecogenomic era: Integrating (e)DNA metabarcoding in biological assessment of aquatic ecosystems. Sci. Total Environ. 2018, 637–638, 1295–1310. [Google Scholar] [CrossRef] [PubMed]
  42. Hering, D.; Borja, A.; Jones, J.I.; Pont, D.; Boets, P.; Bouchez, A.; Bruce, K.; Drakare, S.; Hänfling, B.; Kahlert, M.; et al. Implementation options for DNA-based identification into ecological status assessment under the European Water Framework Directive. Water Res. 2018, 138, 192–205. [Google Scholar] [CrossRef] [PubMed]
  43. Di Sabatino, A.; Cristiano, G.; Pinna, M.; Lombardo, P.; Miccoli, F.P.; Marini, G.; Vignini, P.; Cicolani, B. Structure, functional organization and biological traits of macroinvertebrate assemblages from leaf-bags and benthic samples in a third-order stream of Central Apennines (Italy). Ecol. Indic. 2014, 46, 84–91. [Google Scholar] [CrossRef]
  44. Basset, A.; Barbone, E.; Rosati, I.; Vignes, F.; Breber, P.; Specchiulli, A.; D’Adamo, R.; Renzi, M.; Focardi, S.; Ungaro, N.; et al. Resistance and resilience of ecosystem descriptors and properties to dystrophic events: A study case in a Mediterranean lagoon. Transit. Waters Bull. 2013, 7, 1–22. [Google Scholar]
  45. Barbone, E.; Rosati, I.; Pinna, M.; Basset, A. Taxonomic and dimensional structure of benthic macroinvertebrate guilds in the Margherita di Savoia Salt Pans (Italy). Transit. Waters Bull. 2007, 1, 21–31. [Google Scholar]
  46. Ponti, M.; Vadrucci, M.R.; Orfanidis, S.; Pinna, M. Biotic indices for ecological status of transitional water ecosystems. Transit. Waters Bull. 2009, 3, 32–90. [Google Scholar]
  47. Elbrecht, V.; Vamos, E.E.; Meissner, K.; Ariviita, J.; Leese, F. Assessing strengths and weaknesses of DNA metabarcoding-based macroinvertebrate identification for routine stream monitoring. Methods Ecol. Evol. 2017, 8, 1265–1275. [Google Scholar] [CrossRef] [Green Version]
Figure 1. Map of sampling sites (A, B, C, D) in the Acquatina di Frigole lagoon (Apulia region, southeast Italy).
Jmse 08 00538 g001
Figure 2. Phylogenetic tree using CO1 barcode sequences from Naineris laevigata, Loripes orbiculatus, Arenicola marina, Chondrochelia savignyi, Fabulina fabula and Tritia nitida.
Jmse 08 00538 g002
Table 1. Number of species present in the regional list and number of species without barcode for each phylum.
PhylumNumber of SpeciesNumber of Species without BarcodePercentage of the Gap
Mollusca43817439.7
Annelida42319646.3
Arthropoda38313535.2
Bryozoa874754.0
Echinodermata562239.3
Cnidaria542342.6
Porifera372156.7
Chordata24312.5
Nematoda9666.7
Platyhelminthes7342.8
Sipuncula7342.8
Entoprocta5360
Nemertea300
Phoronida300
Hemichordata100

