Article

Modeling Major Rural Land-Use Changes Using the GIS-Based Cellular Automata Metronamica Model: The Case of Andalusia (Southern Spain)

by
Rafael M. Navarro Cerrillo
1,
Guillermo Palacios Rodríguez
1,*,
Inmaculada Clavero Rumbao
1,
Miguel Ángel Lara
1,
Francisco Javier Bonet
2 and
Francisco-Javier Mesas-Carrascosa
3
1
Department of Forestry Engineering, Laboratory of Silviculture, Dendrochronology and Climate Change, DendrodatLab-ERSAF, Instituto Interuniversitario de Investigación del Sistema Tierra de Andalucía (IISTA), University of Cordoba, Campus de Rabanales, Crta.IV, km. 396, E-14071 Córdoba, Spain
2
Department of Ecology, University of Cordoba, Campus de Rabanales, Crta.IV, km. 396, E-14071 Córdoba, Spain
3
Department of Graphic Engineering and Geomatics, University of Cordoba, Campus de Rabanales, Crta.IV, km. 396, E-14071 Córdoba, Spain
*
Author to whom correspondence should be addressed.
ISPRS Int. J. Geo-Inf. 2020, 9(7), 458; https://doi.org/10.3390/ijgi9070458
Submission received: 19 June 2020 / Revised: 16 July 2020 / Accepted: 17 July 2020 / Published: 20 July 2020
(This article belongs to the Special Issue Geo-Informatics in Resource Management)

Abstract

:
The effective and efficient planning of rural land-use changes and their impact on the environment is critical for land-use managers. Many land-use growth models have been proposed for forecasting growth patterns in the last few years. In this work; a cellular automata (CA)-based land-use model (Metronamica) was tested to simulate (1999–2007) and predict (2007–2035) land-use dynamics and land-use changes in Andalucía (Spain). The model was calibrated using temporal changes in land-use covers and was evaluated by the Kappa index. GIS-based maps were generated to study major rural land-use changes (agriculture and forests). The change matrix for 1999–2007 showed an overall area change of 674971 ha. The dominant land uses in 2007 were shrubs (30.7%), woody crops on dry land (17.3%), and herbaceous crops on dry land (12.7%). The comparison between the reference and the simulated land-use maps of 2007 showed a Kappa index of 0.91. The land-cover map for the projected PRELUDE scenarios provided the land-cover characteristics of 2035 in Andalusia; developed within the Metronamica model scenarios (Great Escape; Evolved Society; Clustered Network; Lettuce Surprise U; and Big Crisis). The greatest differences were found between Great Escape and Clustered Network and Lettuce Surprise U. The observed trend (1999–2007–2035) showed the greatest similarity with the Big Crisis scenario. Land-use projections facilitate the understanding of the future dynamics of land-use change in rural areas; and hence the development of more appropriate plans and policies

Graphical Abstract

1. Introduction

Continuous land-use changes, both urban and rural, are caused mainly by anthropogenic activities [1]. The use of tools, such as models of land-use change, supports the analysis of the causes and consequences of such changes in order to understand the functioning of the land-use system and to support land-use planning and policy [2]. Over the past century, changes in demographic development, urbanization, and industrialization have constantly induced land use and land cover (LULC) changes in many regions around the world, producing new biophysical and socio-economic conditions [3]. Therefore, LULC changes are associated with socioeconomic factors, changes in industrial development, agricultural production conversion [4,5], immigration [6,7], protected area status [8], and climate change [9]. As a result of these drivers, the current land-use patterns are a consequence of a historical series of previous and incremental land-use changes, which makes the present land-use pattern highly path-dependent [10]. Many researchers have focused on understanding the factors that lead to these transitions [11,12]. However, more research is needed to explain land-use changes at different spatial and temporal scales [13].
Policy and decision makers demand land-use change scenarios to enable them to develop sustainable strategies that anticipate future trends [14]. Over recent decades, abundant research has been conducted on the spatial modeling of land use, based on the improved accessibility of spatial information, increased computational capacities, and the demand for more accurate planning tools for decision support [15,16,17,18]. Several spatially explicit approaches for modeling land use have been proposed [19,20]. Among them, cellular automata (CA) models are have been frequently used for modeling land-use change due to their ability to simulate dynamic spatial processes [21,22], creating complex patterns [23]. CA models include integrated CA models such as the Research Institute for Knowledge Systems (RIKS) model [24], fuzzy CA model [25], artificial neural networks CA model [26], and multi-CA model [27]. More recently, CA land-use models have been generalized to support land-use planning and policy analysis [22,28] as well as to predict future changes and the impacts of economic, development, and climate-change scenarios [29].
The CA models of land-use dynamics are generated by a set of cell states, neighborhoods, and transition rules and time [30]. The cell state can be made to represent any attribute of the rural or urban environment (e.g., land use, population density, land cover, terrain factors, or road networks) [22,31] and has been used in many land-use change studies oriented to policy and land-use decision support [14,32,33]. Metronamica is a spatial decision support system (SDSS), based on the constrained cellular automata (CCA) model [24,34], increasingly used to assist the simulation of the spatial implications of future land-use scenarios. This approach is very useful in long-term planning decisions. Metronamica has been used by public administrations and researchers for the simulation of rural areas dynamics, including agricultural and forest uses, under different change scenarios [35,36,37,38,39]. The susceptibility cartography obtained from this analysis is a useful tool in natural and rural planning.
Andalucía is the second largest region in Spain and has a population of over 8.5 million inhabitants. During the last two decades, it has experienced rapid economic growth, focused on urban development, tourism, and agriculture. In this context, planning of the rural environment faces many challenges in the balancing of current and future land use with sustainability and limiting environmental problems. In this study, Metronamica [34] was applied to model future trends of land-use changes in Andalusia for the period 2010–2035. There were three specific objectives: (i) to describe the major rural land-use changes at a regional scale between 1999 and 2007, (ii) to test the Metronamica land-use model, and (iii) to simulate future land-use patterns in the Prospective Environmental Analysis of Land Use Development in Europe (PRELUDE) scenarios. This study tests the applicability of this model at a regional scale regarding its ability to generate realistic results about land-use changes and to support policy makers.

2. Materials and Methods

2.1. Study Area

Andalusia is in the south of the Iberian Peninsula, in south-western Europe and extends over 87,600 km2 (Figure 1). It includes three major mountain ranges running in an east to west direction, Sierra Morena and the Baetic System, consisting of the Subbaetic and Penibaetic Mountains, separated by the Intrabaetic Basin, while Lower Andalusia is in the Baetic Depression of the valley of the river Guadalquivir. A Mediterranean climate, with two rainfall peaks in spring and autumn and a dry season during summer, is the most frequent. The average annual precipitation is in the range of 300 to 2000 mm, and the mean annual temperature is 17°C, with maximum temperatures averaging above 36°C in summer. Topographic variations mean the climate ranges from arid (including the driest zone of the European Mediterranean) to humid. The dominant rural land uses are extensive and intensive agriculture, including non-irrigated and irrigated crops, olive orchards, and greenhouse horticulture. During the second half of the 20th century and more recent decades, progressive land abandonment has led to a significant increase in extensive rangeland and wood landscapes (e.g., shrubs and forests). Most of the natural vegetation is Mediterranean forests, mainly evergreen trees, such as Holm and cork oaks and pines, with large areas covered by Mediterranean shrub land. According to the data released by the National Statistics Institute of Spain, in Andalusia the population increased by approximately 750,000 inhabitants during the period 1999–2007, mainly due to the concentration of the rural population in some areas.

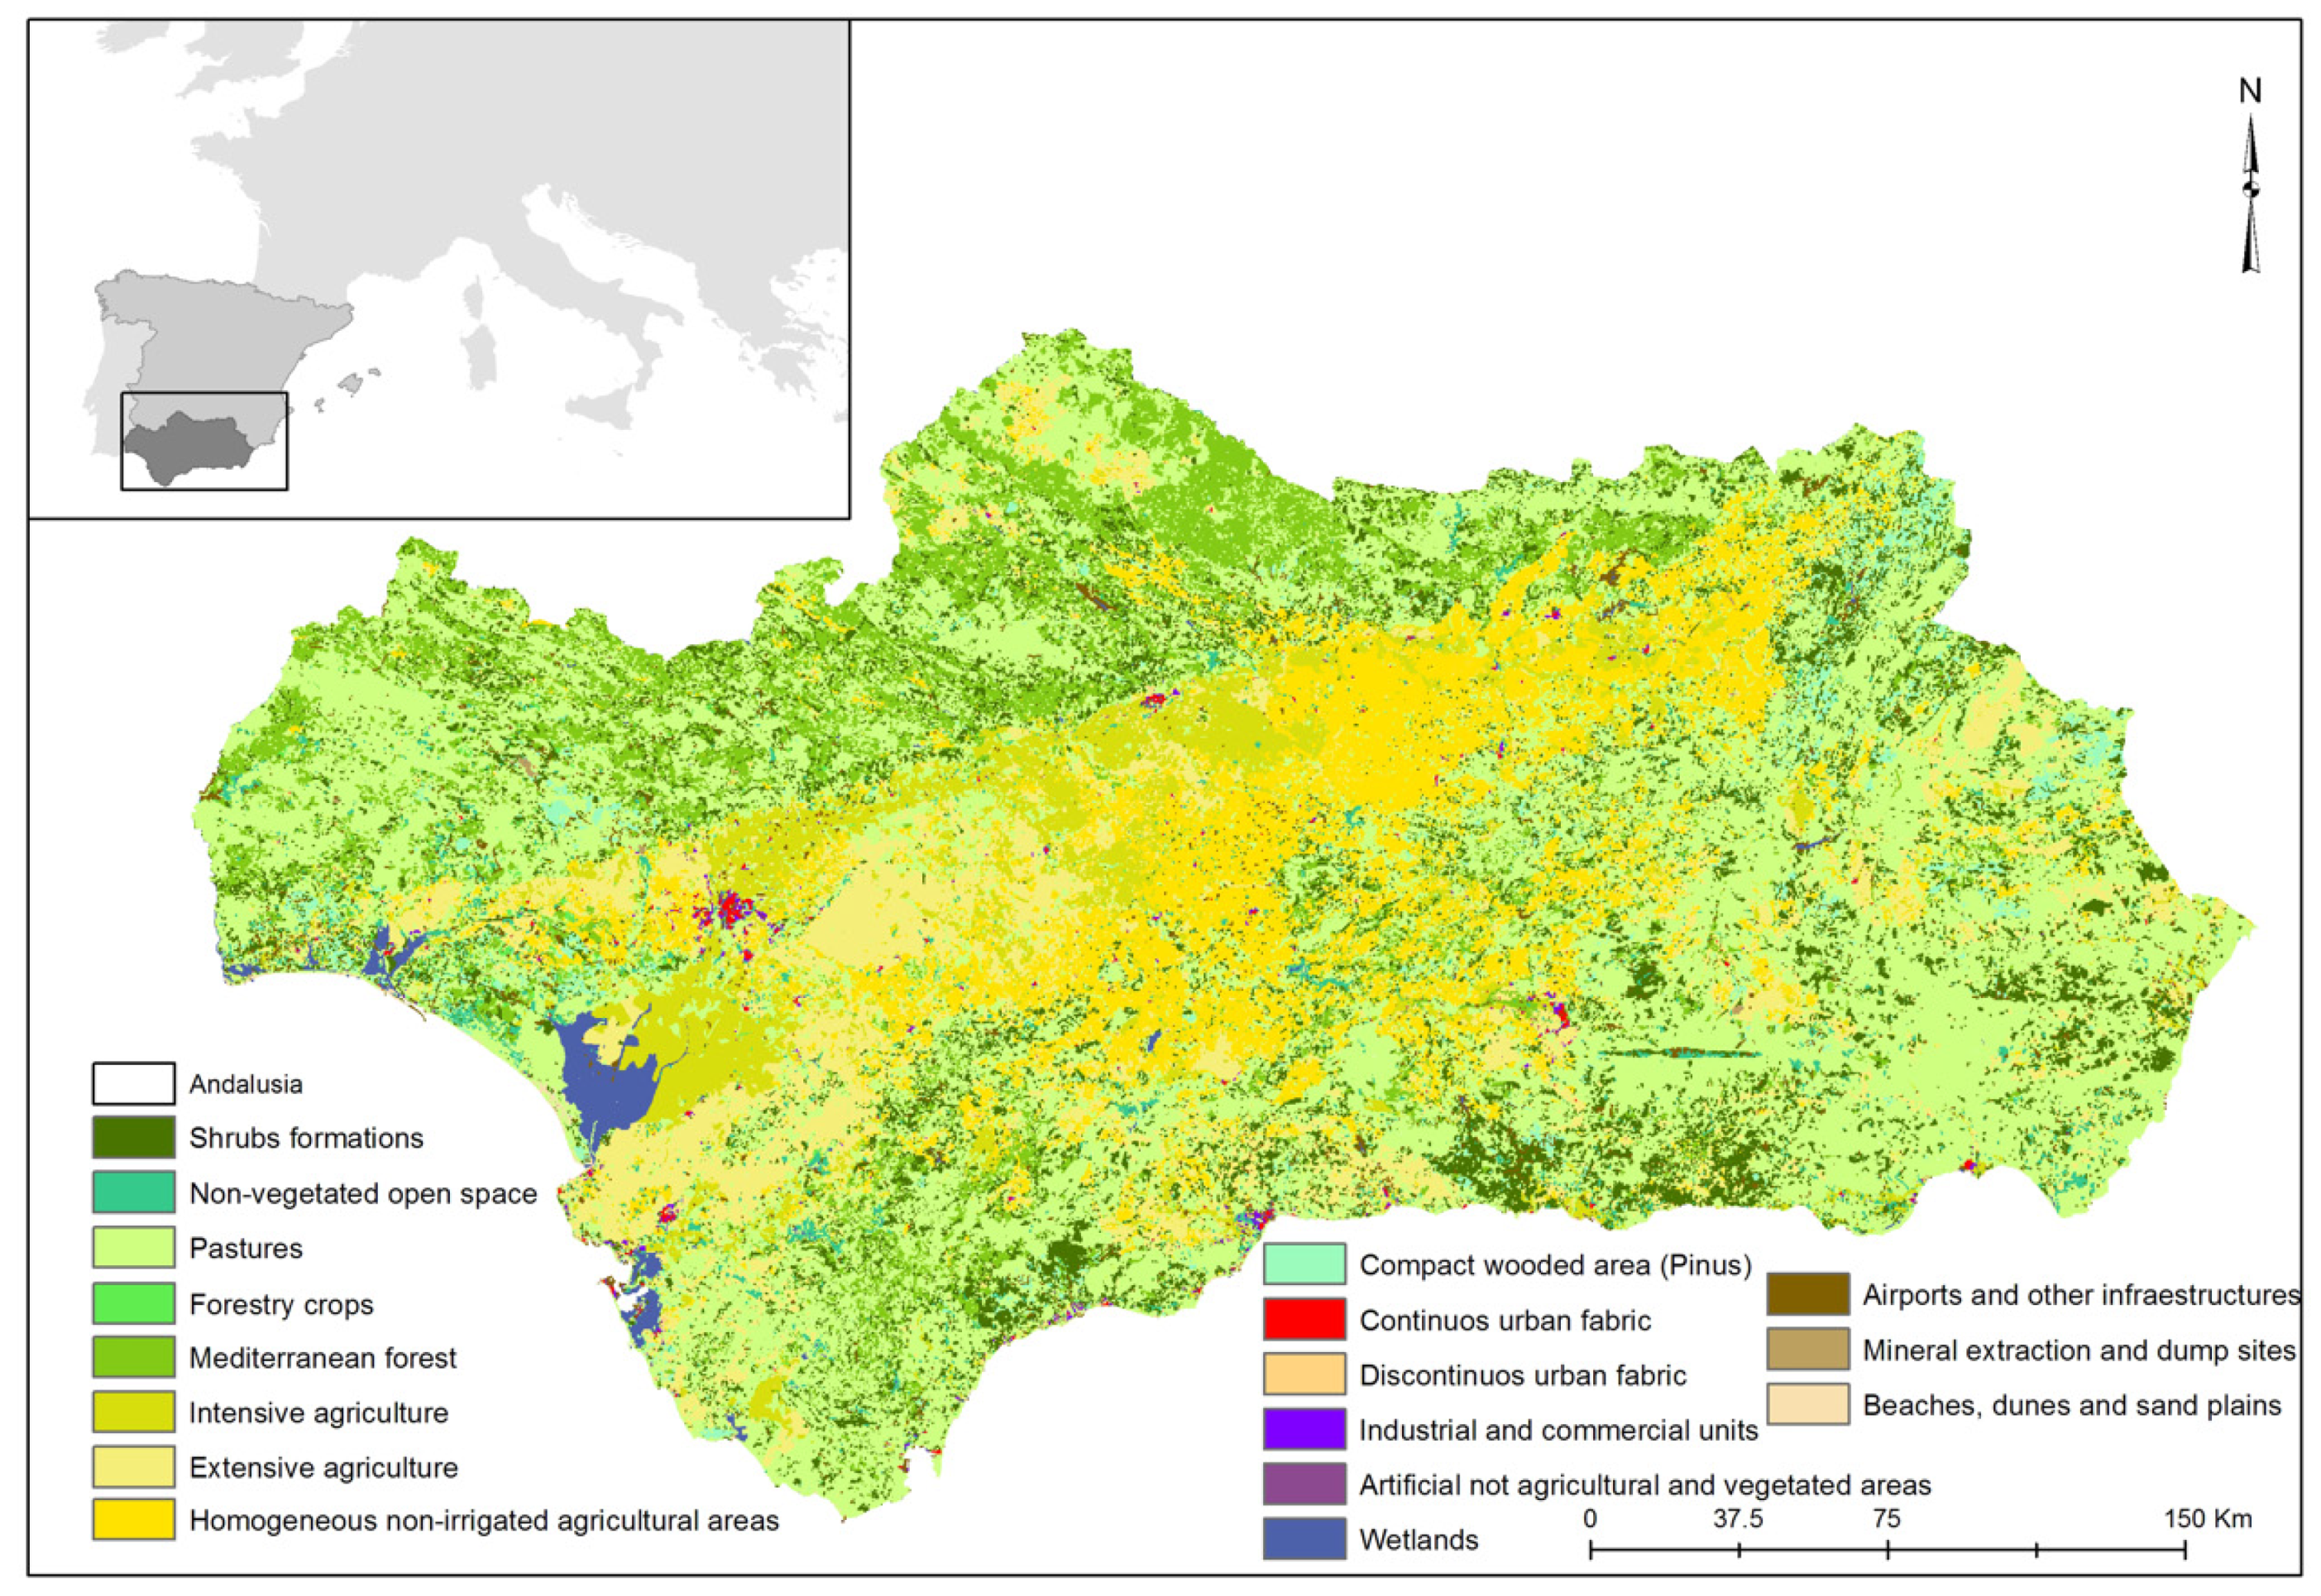
2.2. Land-Use Data Sets

Land-use data were obtained from CORINE Land Cover (CLC) for the years 1999 to 2007 (henceforward CLC1999, CLC2007), from the Andalusia Regional Government (http://www.juntadeandalucia.es/medioambiente/site/rediam). Although the problems related to the thematic accuracy and reliability of the CORINE Land Cover datasets are known (e.g., [40]), the CLC for 1999–2007 can be regarded as generally of high quality because of the correction applied by the Andalusia Regional Government. For the study area investigated here, raster data layers were represented on a grid with a 100-m spatial resolution, which was appropriate for use at a regional scale. The classification procedure resulted in 17 LULC classes, listed in Table S1 (Supplementary Material), which were grouped in vacant land uses (e.g., land-use changes as a consequence of the dynamic of other land uses; e.g., shrub cover), functional uses (land uses with a high change trend; e.g., urban use), and features uses (land uses with a low change trend; e.g., bare soils).

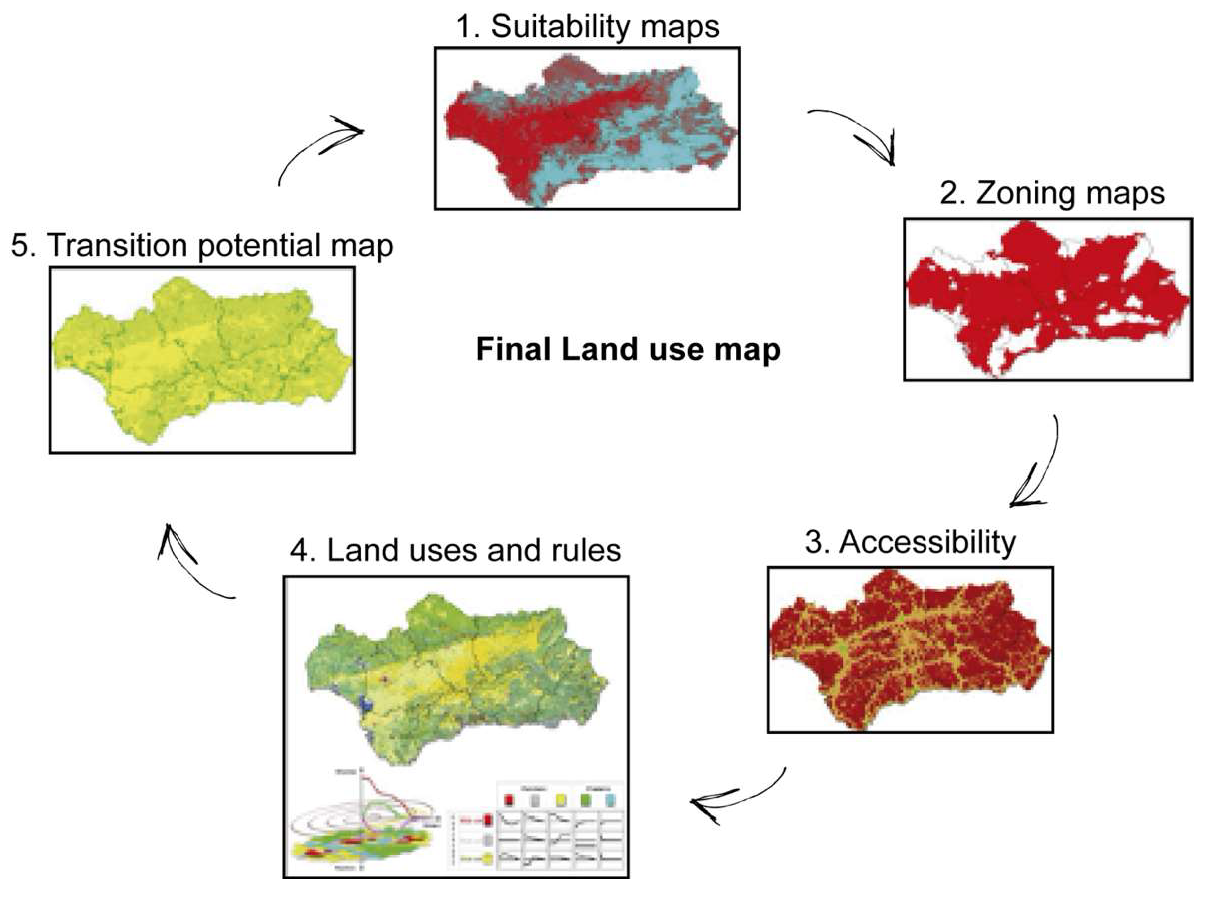
2.3. Methodological Framework

The methodological framework for the application of the Metronamica model implies two main processes: calibration and simulation (Figure 2). The calibration was designed to identify the key elements of the CA model based on the change in the dynamic behavior of a given land-use cell as a response to the changes observed between 1999 and 2007: its current suitability (step 1), zoning (step 2), and accessibility parameters (step 3) were calculated. The influence of the three key components and the land-use rules (step 4) generates a transition potential (step 5), which determines whether, in a particular year, the cell will shift to a different land use or will persist in its current state. Finally, the future scenarios were created with updated suitability parameters according to the PRELUDE scenarios. Further details on Metronamica and the different elements of the calibration process are available in the Metronamica model documentation [34].

2.4. Changes in Land-Luse Calibration

Four groups of factors driving changes in land use at the regional level were selected (Figure 2 and Table S2 Supplementary Material) [34]: (i) the physical suitability of land uses, based on physical or geographical determinants (e.g., elevation, slope, soil quality, and climatic variables), (ii) zoning or institutional suitability model constraints on the allocation of land uses that reflect current and future decision making (e.g., transformation of agricultural land to forest uses), (iii) accessibility as an expression of the strength of the influence of transport networks (e.g., roads and rail networks) and other infrastructure, and (iv) land-use interactions in the area, represented by the neighborhood potential land-use dynamics. Physical suitability and zoning maps were generated using the Metronamica Overlay Tool, and included (i) average annual temperature, average maximum and minimum temperature and annual precipitation, at a resolution of 100 m, obtained from the environmental repository of Andalusia (http://www.juntadeandalucia.es/medioambiente/site/rediam) and (ii) a digital elevation model (1998, 20 m resolution; 2006, 5 m resolution) [41]. All drivers were resampled at a resolution of 100 m × 100 m and re-projected according to the coordinate reference system UTM zone 30 European Datum 1950. Land-use change was simulated for this period, using time steps of one year. The local land-use model for Andalusia included 15 land-use classes, of which nine were dynamically modeled and then grouped in three rural dominant uses: extensive and intensive agriculture and natural vegetation (Figure 1, Table S1 Supplementary Material). The remaining classes represented non-modeled classes (e.g., water bodies, infrastructures, dump sites, and beaches) and we assumed that they would remain unchanged during the simulation period.
For the calibration, based on the four driver groups, the model advanced through a series of stages representing time steps to simulate the transition potential for each cell and the land use based on the Metronamica land-use model. The land-use model was calibrated to simulate land-use changes in Andalusia between 1999 and 2007. The neighborhood rules to establish the transition potential were defined using a multiple linear regression analysis of the available spatial-temporal land-use data for Andalusia (1999–2007). The transition potential reflects the pressures exerted on each land use and constitutes the information needed for modeling land-use changes. The three key components of the model described above collectively determine the land transition rules.
Visual comparison was used to assess if the simulated land-use patterns were realistic and if the locations of simulated land-use changes coincided with those of observed land-use changes. To rigorously test the model calibration, the predictive accuracy of the calibrated land-use model was assessed by means of the Kappa index [35]. The Kappa index expresses the agreement (a value of 1 indicates a maximum level of agreement among land-use types, and values close to 0 indicate a near random spatial arrangement) between the final year modeled (2007) and the data from CLC2007. Under conditions of statistical significance, a Kappa value of 1 indicates a maximum level of clustering of a land-use type, while values close to 0 indicate a near random spatial arrangement and a value of −1 indicates a maximum level of dispersion. The Kappa test was implemented with the Map Comparison Kit (MCK) [42].

2.5. PRELUDE Scenarios

After completing the calibration, Metronamica was used to simultaneously model future potential land-cover changes associated with the PRELUDE scenarios [43]. We selected the PRELUDE scenarios which are based on those developed by the European Union [44] for analysis of the environmental implications of different scenarios for the future of Europe. They represent five global socio-economic development pathways: Great Escape (Andalusia of Contrasts) shows the highest population and economic growth, Evolved Society (Andalusia of Harmony) is characterized by a strong increase in extensive agriculture, Clustered Network (Andalusia of Structure) expects high growth in the European population combined with the impact of climate change, increasing the demand for land for agriculture, Lettuce Surprise U (Andalusia of Innovation) features high technological innovation, leading to economic growth and internal migration, and Big Crisis (Andalusia of Cohesion), in which economic and planning intervention increase (Table 1; Figure S1 Supplementary Material).
Subsequently, the four global-change models were calibrated to create the rural land-use system in the initial year of the simulation. The parameters included in the four global-change models were mainly those for climatic and socio-economic generation development, but also those related to social preferences. These parameters were derived from climatic-change models for Andalucía [45], and from other studies related to rural land uses and socio-economic variables (Table S2 Supplementary Material). These were fixed and not calibrated further. The other settings used to calibrate the Metronamica model (neighborhood rules, accessibility settings, suitability data, and zoning restrictions) were left untouched. In this phase, the initial land-use map (CLC2007) was the input into the model to simulate the global-change scenario for the reference time interval (2007–2035). Finally, an assessment was then made of the scenario-based land-cover changes to be introduced using the Metronamica model interface to create a visual representation of rural land uses in 2035 under each scenario.

2.6. Comparison of the Land-Use and Global-Change Interaction Models

The results of the four global-change models (for the year 2035) were assessed by visual comparison of the models among themselves, as well as with the results from the reference land-use map (CLC2007). A change matrix was used to compare the land-use pattern and measure the similarity among the simulated land-use patterns [46]. The Kappa index, implemented with the MCK [42], was also used to quantify the mismatch between simulated land-use maps [35].

3. Results

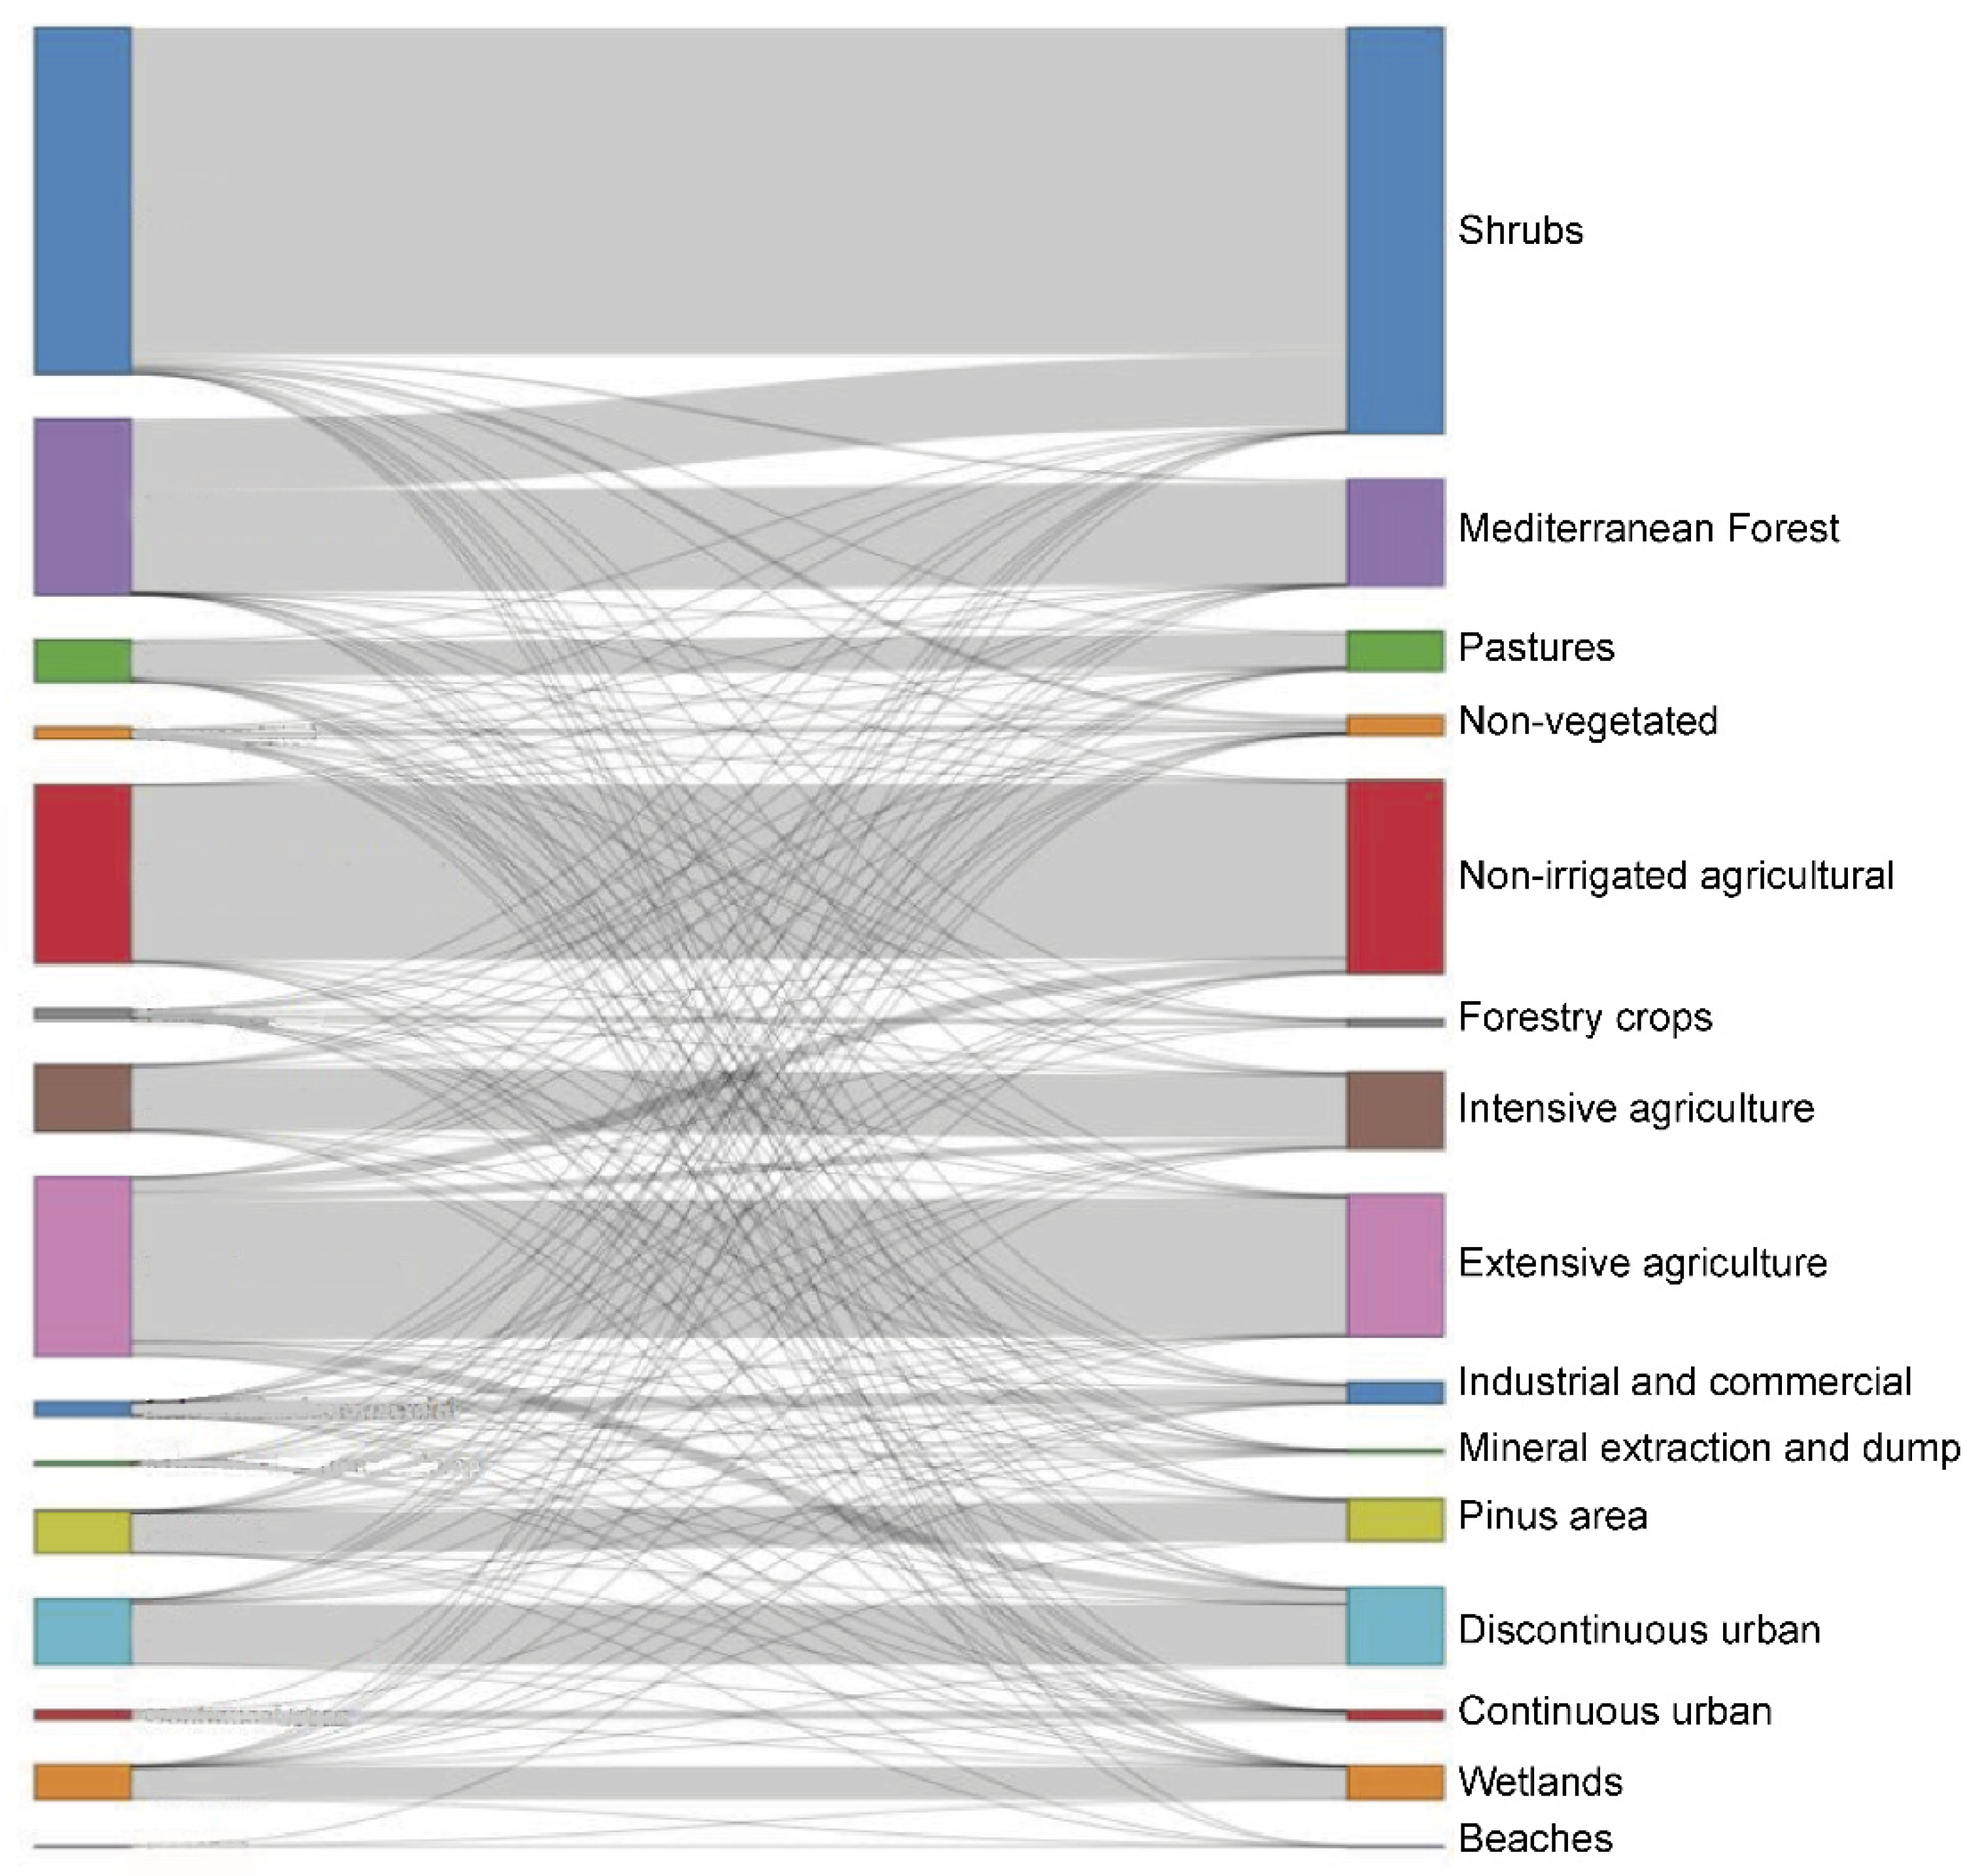
3.1. Recent Changes in Land Cover across Andalusia

Using the Metronamica interface, a change matrix between 1999 and 2007 was obtained that displayed data for the observed changes in rural land cover across the region for the period 1999 to 2007 (Figure 3, Table S3 Supplementary Material). This information provides a valuable insight into how Andalusian land uses have evolved over recent years. The overall area in which land use changed was 674,971 ha, representing 8.7% of the total area in 2007. In 1999, the three land uses that occupied the largest area were shrubs (31.1%), woody crops on dry land (16.1%), and herbaceous crops on dry land (16%). Similarly, the land uses that occupied the largest area in 2007 were shrubs (30.7%), woody crops on dry land (17.3%), and herbaceous crops on dry land (12.7%). However, the largest change in land cover was for non-irrigated tree crops, which decreased by 3.8%. The most important changes were due to the transition from Mediterranean forest to shrubs and from agricultural to urban and industrial areas, together with the increase in non-irrigated agricultural areas, mainly derived from changes in the extensive agriculture areas (Figure 3). As a general view, the aggregated land-use changes between 1999 and 2007 (Table 2) indicate that the principal land-use change occurred in areas of natural vegetation.

3.2. Metronamica Projection of Land Cover Across Andalusia between 1999 and 2007

A projection of the land uses in 2007 was obtained by applying the Metronamica algorithm across the region. The comparison of the reference and the simulated land-use map of 2007 showed a Kappa index of 0.91. These results show that the model was valid and, therefore, it could be used to perform the simulations under the different hypotheses established in the scenarios.
The land-cover map for the projected PRELUDE scenarios is displayed in Figure 4. Table 3 provides the land-cover characteristics of 2035 in Andalusia developed within the Metronamica model scenarios.
For the Great Escape (Andalusia of Contrast) scenario, among the potential rural land uses over the period 2007–2035, the clearest change is the increase in intensive agriculture (Figure 4b) at the expense of extensive agriculture (Figure 4a), mainly in the most productive areas (Guadalquivir Valley and western areas). In addition, a spatial reduction in extensive agriculture is observed in the central-eastern mountains of Andalusia (Sierra Morena, Córdoba, and Sevilla), mainly due to the increase in intensive agriculture. In addition, there is a slight reduction in shrub cover, while the semi-natural areas remain almost unchanged. In 2035, the change in shrub cover (Figure 4c) is more apparent in eastern Andalusia (Jaén, Almería, and Granada), mainly due to the transformation of those areas for intensive agriculture. The impact of climate change is not very severe in this scenario.
In the Evolved Society (Andalusia of Harmony) scenario, the extensive (Figure 4d) and intensive (Figure 4e) agricultural areas increase because of the reduction in shrub cover, with a shift, in particular, to extensive agricultural uses. Self-sufficiency and climate change mark the changes in land use in this scenario. The decline in shrub cover is a result of “extensification”, with a loss of semi-natural areas, and the resulting grasslands become very important and valued by the people. In addition, there is a “migration” of extensive agriculture to the mountainous areas (Sierra Morena, Sierra Nevada, Subbéticas, etc.), creating a mix of agriculture, grasslands, and semi-natural areas.
Projecting the trends forward to 2035, the Clustered Network (Andalusia of Structure) scenario (Figure 4c) shows a reduction in all agricultural sectors, including extensive and intensive uses, with a high increase in shrub cover. Population growth and climate change mark the change in the discontinuous rural fabric attracted to the more productive areas. There is a less marked increase in extensive and intensive agricultural uses, coupled with an increase in semi-natural areas around the entire region. The impact of climate change is very severe in this scenario.
In the Lettuce Surprise U (Andalusia of Innovation) scenario (Figure 4j,k), intensive and extensive agriculture both decrease because of their abandonment and subsequent cover by shrubs, moving to forest uses. In this scenario, a social and technological transformation leads the change in the discontinuous rural fabric, marked by the reduction in agriculture uses. The decline in extensive agriculture is a consequence of abandonment and changes in the use of semi-natural areas. The major changes in this scenario affect rural areas on the periphery of cities (Guadalquivir Valley).
Finally, in the Big Crisis (Andalusia of Cohesion) scenario, extensive (Figure 4m) and intensive (Figure 4n) agricultural areas increase significantly due to the development of small-scale intensive–extensive agriculture matrixes for self-sufficiency. This produces a mix of extensive and intensive agriculture and semi-natural areas, giving rise to a very diverse landscape. Political intervention marks the change in rural areas, with a better balance among land uses. The loss of shrub area is compensated by an increase in extensive agriculture. The value of the landscape is very important and valued by the people, so in this scenario the integration between extensive agriculture and semi-natural areas is less important. The impact of climate change is not very severe in this scenario. There is migration from cities to rural areas, with the development of a mix of agricultural and semi-natural areas.
Table 4 provides the Kappa indexes for the rural land cover of the five scenarios at the end of the period. It shows that the greatest differences are between Great Escape and both Clustered Network and Lettuce Surprise U. Although in all three scenarios, large areas of shrubs remain, a severe decrease in agricultural uses can be seen in the Lettuce Surprise U scenario, and yet, in the Clustered Network scenario, the shrub area is greater in the year 2035.
Comparing the observed trend (1999–2007–2035) with the rest of the scenarios in the year 2035, the greatest similarity was found with the Big Crisis scenario (Kappa index of 0.87, Table 4). This can be explained by the fact that the agricultural uses, both extensive and intensive, are more balanced in these scenarios, yielding the great similarity with the initial situation.

4. Discussion

In this study, Metronamica was applied in the modeling of the rural land-use changes and trends in Andalusia, to forecast the pattern for the period 2007–2035. There is clear extensification and intensification of agricultural areas over time according to the different PRELUDE scenarios. The projection of these trends forward to 2035 will help policy makers and land-use managers to plan Andalusian landscapes in the near future.

4.1. Land-Use Changes in Andalusia between 1999 and 2007

In Europe, ecosystems and landscape dynamics are modified by land-use changes, in particular in rural areas. The impact of agricultural scenarios has yet to be analyzed in detail in southern Europe. In terms of rural land uses, in Andalusia, the period 1999 to 2007 was characterized by a decline in agriculture, pasture, and forestry uses, reflecting both a continuation of the reduction in the extensive agricultural sector and the competition from intensive agriculture faced by the lands of lower agricultural potential. A significant amount of this expansion appears to have occurred on land in mountainous agricultural areas (with complex cultivation patterns and sparsely vegetated areas). The growth in these two land uses also occurred at the expense of other types of agricultural use, including non-irrigated crop land. The changes in rural land uses have been mainly due to the concentration of the rural population in some areas and migration to urban areas [47]. Thus, according to the data released by the National Statistics Institute of Spain, in Andalusia the population increased by approximately 750,000 inhabitants during the period 1999–2007. This increase in urban land use is also a consequence of the massive constructions built along the coastline of Andalusia [48]. In this regard, the growth of tourism led to the increase in the development of infrastructures. Therefore, there is a connection between the transport network and the economic development of the region, both being a main cause of landscape transformation [49].
Agricultural activities constitute an important part of the Andalusian economy. Therefore, the decrease in agricultural areas in the period 1999–2007 may be due to the abandonment of traditional land uses in marginal areas [50] and the policies that promote agricultural intensification [51]. This decrease in these areas is also an immediate consequence of changes in land uses: for example, from herbaceous crops to grassland or from dense wooded formations of eucalyptus to scrubland interspersed with grassland, among others. The transformations also occur as a result of the change from scattered scrub with grass or rock to irrigated woody crops (in particular, citrus) or from grassland to arable crops. Approximately 38,000 hectares of natural areas were lost from 1999 to 2007, but the area occupied by forests generally does not show significant variations, since its stability is covered by the Andalusian government’s environmental protection policies.
The areas occupied by shrubs and agricultural uses have altered. These changes are clearly seen in the rural land-cover changes during the studied period and the land-use agenda did not seem to strongly influence the planning and policy making in rural areas. However, agricultural and forest cover changes have significant implications in a context of global change given the role that green space plays in adaptation to climate change impacts [52,53].
The generation of scenarios based on parameterized models improves the capacities for adaptation [54]. CA models have been used in several studies in Europe, showing their ability for conceptual and practical land use change studies (see, for example, [55,56]). In this work, we implemented the land-use changes and scenarios in the cell-based Metronamica model which has already been applied in Europe at regional and national scales (see for example, [57,58]). The model parameterization was done with two reference land-use maps, one for 1999 and one for 2007. According to the Kappa value (0.91), the model results indicate very high overall agreement between the observed and simulated maps, not only in quantity but also in the ability to distinguish spatial land-use patterns.

4.2. PRELUDE Land-Use Scenarios in Andalusia 2007–2035

Once the calibrated model had been satisfactorily validated, land-use maps covering Andalusia were produced, considering the effects of regional driving forces, for five PRELUDE scenarios for 2035 [43,44]. We generated five probability maps by combining the transition probability maps for the global change scenarios tested.
The Great Escape (Andalusia of contrast) scenario shows the highest population and economic growth. An expansion of agricultural land uses, in particular of intensive agricultural areas, directly reflects this situation. This increase is mostly located in the areas close to the most productive land and large urban areas (Guadalquivir Valley), whereas the shrub areas show less reduction than in the other scenarios. The growth of intensive rural uses (intensive and extensive agriculture) is mainly concentrated around already existing productive agricultural land (perimetric areas of the Guadalquivir Valley), while there is a widespread increase in shrubs in mountain areas.
Characterized by high levels of self-sufficiency and climate-change impacts, the Evolved Society (Andalusia of Harmony) scenario shows a strong increase in extensive agriculture. Indeed, a high proportion of the shrub area becomes covered by grasses and extensive livestock areas. In this scenario, measures oriented to global mitigation and adaptation to cut greenhouse gas emissions are implemented. This would partially explain conversion-naturalization in countryside areas, bringing potential adaptation benefits related to the promotion of “green” land uses. The indirect benefits include increases in organic agriculture and the provision of ecosystems services [59].
The Clustered Network (Andalusia of Structure) scenario expects high growth in the European population combined with the impact of climate change, increasing the demand for land for agriculture. Furthermore, over the period 2007–2035, a process of proportional growth of both extensive and intensive agricultural land was detected. As a result, this situation, which could be considered a positive scenario for agricultural uses, could have negative implications for other “natural” land uses such as shrubs.
The Lettuce Surprise U (Andalusia of Innovation) scenario features high technological innovation, leading to economic growth and internal migration. This is reflected by a loss of agricultural areas. In this scenario, more land is converted into urban land, providing technological opportunities and population mobility. Of the rural land uses, the shrub area shows a moderate decline.
Big Crisis (Andalusia of Cohesion) is a scenario in which economic and planning intervention increase. Unlike the others, it may be described as ‘business as usual’. However, there is a greater emphasis on land-use planning to orient decisions and actions linked to optimized land-use changes and development. It is characterized by more progressive changes and the avoidance of intense development; consequently, rural uses are more balanced. In land-use terms, this is related to decisions on increases in extensive agriculture to reduce greenhouse gas emissions, and to conservation measures for traditional landscapes (e.g., “cultural” landscapes) more adapted to climate change and able to provide extensive ecosystem service functions. Although some shrub areas increase, the general trend is towards a reduction in this land cover, especially in moderately marginal areas. This reflects the land-uses policy followed in the Big Crisis scenario, and the promotion of agricultural activities closer to transport networks.
The scenarios were compared based on the principal land-use changes, to give an overview of the landscape trends. Strong similarity was observed between the Big Crisis scenario and the trend scenario. Therefore, the agricultural intensification was strongly supported; consequently, areas of extensive agriculture tend to decline, mainly in areas with productive (e.g., climatic and topographic) restrictions for agriculture. The combination of land abandonment and the focus on planning means that both scenarios showed a very high percentage of “naturalization” processes.
The use of prediction models of land use changes, such those used in this study, help policy makers meet their needs for current knowledge of spatial locations and magnitude of likely land use changes under different socio-economic and environmental scenarios to select more appropriate decisions and the consequences in the short and long term [60].

5. Conclusions

This study shows the usefulness of Metronamica land-use model to assess future trends of land-use changes in Andalusia (south Spain). Our results allow us to identify the major rural land-use changes at a regional scale and demonstrate the validity of Metronamica to evaluate these processes in other regions on a global scale. In our study, the main limitation was related to the simulation period (8 years between 1999 and 2007), which allowed the model to be calibrated and validated. However, since land use data for the CLC2018-Andalusía are available, it could have been used to confirm the trends of the projections obtained in the different scenarios for 2035. This extra phase would reinforce the interactions between observed land-use classes and projections for different plausible scenarios (e.g., PRELUDE), facilitating the transferability of results to other regions and situations. The use of the PRELUDE scenarios makes the work particularly interesting for the countries of the European Union. It would allow for comparing the situation on a regional or national scale and generate realistic results regarding land-use changes and to support European policies related to future land uses. Based on our results, further research may be developed such as the interaction between complex land-use changes with environmental services or further insights into the capacity of Metronamica for simulating land use including a more diverse landscapes (e.g., “Mediterranean cultural landscapes).

Supplementary Materials

The following are available online at https://www.mdpi.com/2220-9964/9/7/458/s1, Table S1: Land-uses legends reclassified and used in the Metronamica model, Table S2: Drivers of the land-use model at the local level. For agriculture, suitability is calculated on a yearly basis in the physical suitability model based on climate-change scenarios and local characteristics, Table S3: Change matrix 1999–2007, Figure S1: Main driving forces of the PRELUDE scenarios [42].

Author Contributions

Conceptualization, Rafael M. Navarro Cerrillo and Inmaculada Clavero Rumbao; Methodology, Rafael M. Navarro Cerrillo, Inmaculada Clavero Rumbao, and Guillermo Palacios Rodríguez; Formal Analysis, Inmaculada Clavero Rumbao, Rafael M. Navarro Cerrillo, and Francisco-Javier Mesas-Carrascosa; Investigation, Rafael M. Navarro Cerrillo, Inmaculada Clavero Rumbao, Guillermo Palacios Rodríguez, Miguel Ángel Lara, and Francisco Javier Bonet; Writing—Original Draft Preparation, Rafael M. Navarro Cerrillo, Guillermo Palacios Rodríguez, and Francisco Javier Bonet; Writing—Review & Editing, Rafael M. Navarro Cerrillo, Guillermo Palacios Rodríguez, Francisco Javier Bonet and Francisco-Javier Mesas-Carrascosa. All authors have read and agreed on the published version of the manuscript.

Funding

This research was funded by the Junta de Andalucía, through the Project “Generación de escenarios futuros ambientales para Andalucía en el contexto de cambio global” (Consejería de Medio Ambiente-EGMASA), and by the European Union, through the ECOPOTENTIAL project (Grant Agreement No. 641762) and the Ministerio de Ciencia e Innovación through the ESPECTRAMED (CGL2017-86161-R) projects.

Acknowledgments

The authors thank the Andalusia Department of Agriculture and Environment, which provided access to and background information on the field site (in particular, the REDIAM authorities, J.M. Moreira, F. Cáceres, F. Gímenez de Azcarate, and J.J. Guerrero-Álvarez). We thank our financial supporters: the Junta de Andalucía-Consejería de Medio Ambiente and the European Union’s Horizon 2020 ECOPOTENTIAL project (grant agreement No. 641762). We also thank David Walker, for the linguistic revision of the manuscript. We acknowledge the institutional support of the University of Cordoba-IISTA and Campus de Excelencia CEIA3.

Conflicts of Interest

The authors declare no conflict of interest.

References

  1. Parker, D.C.; Hessl, A.; Davis, S.C. Complexity, land-use modeling, and the human dimension: Fundamental challenges for mapping unknown outcome spaces. Geoforum 2008, 39, 789–804. [Google Scholar] [CrossRef]
  2. Verburg, P.H.; Schot, P.P.; Dijst, M.J.; Veldkamp, A. Land use change modelling: current practice and research priorities. GeoJournal 2004, 61, 309–324. [Google Scholar] [CrossRef]
  3. Bajocco, S.; De Angelis, A.; Perini, L.; Ferrara, A.; Salvati, L. The Impact of Land Use/Land Cover Changes on Land Degradation Dynamics: A Mediterranean Case Study. Environ. Manag. 2012, 49, 980–989. [Google Scholar] [CrossRef] [PubMed]
  4. Perz, S.G.; Skole, D.L. Secondary Forest Expansion in the Brazilian Amazon and the Refinement of Forest Transition Theory. Soc. Nat. Resour. 2003, 16, 277–294. [Google Scholar] [CrossRef]
  5. Rudel, T.K.; Defries, R.; Asner, G.P.; Laurance, W.F. Changing Drivers of Deforestation and New Opportunities for Conservation. Conserv. Biol. 2009, 23, 1396–1405. [Google Scholar] [CrossRef] [PubMed]
  6. Deng, J.S.; Wang, K.; Hong, Y.; Qi, J.G. Spatio-temporal dynamics and evolution of land use change and landscape pattern in response to rapid urbanization. Landsc. Urban Plan. 2009, 92, 187–198. [Google Scholar] [CrossRef]
  7. Wu, Q.; Li, H.; Wang, R.; Paulussen, J.; He, Y.; Wang, M.; Wang, B.; Wang, Z. Monitoring and predicting land use change in Beijing using remote sensing and GIS. Landsc. Urban Plan. 2006, 78, 322–333. [Google Scholar] [CrossRef]
  8. Ellis, E.A.; Porter-Bolland, L. Is community-based forest management more effective than protected areas?: A comparison of land use/land cover change in two neighboring study areas of the Central Yucatan Peninsula, Mexico. For. Ecol. Manage. 2008, 256, 1971–1983. [Google Scholar] [CrossRef]
  9. Pielke, R.A., Sr.; Pitman, A.; Niyogi, D.; Mahmood, R.; McAlpine, C.; Hossain, F.; Goldewijk, K.K.; Nair, U.; Betts, R.; Fall, S.; et al. Land use/land cover changes and climate: modeling analysis and observational evidence. WIREs Clim. Chang. 2011, 2, 828–850. [Google Scholar]
  10. Brown, D.G.; Johnson, K.M.; Loveland, T.R.; Theobald, D.M. Rural land-use trends in the conterminous united states, 1950–2000. Ecol. Appl. 2005, 15, 1851–1863. [Google Scholar] [CrossRef] [Green Version]
  11. Lambin, E.F.; Meyfroidt, P. Land use transitions: Socio-ecological feedback versus socio-economic change. Land Use Policy 2010, 27, 108–118. [Google Scholar] [CrossRef]
  12. Hurtt, G.C.; Chini, L.P.; Frolking, S.; Betts, R.A.; Feddema, J.; Fischer, G.; Fisk, J.P.; Hibbard, K.; Houghton, R.A.; Janetos, A.; et al. Harmonization of land-use scenarios for the period 1500–2100: 600 years of global gridded annual land-use transitions, wood harvest, and resulting secondary lands. Clim. Chang. 2011, 109, 117. [Google Scholar] [CrossRef] [Green Version]
  13. Rudel, T.K.; Coomes, O.T.; Moran, E.; Achard, F.; Angelsen, A.; Xu, J.; Lambin, E. Forest transitions: towards a global understanding of land use change. Glob. Environ. Chang. 2005, 15, 23–31. [Google Scholar] [CrossRef]
  14. Bryan, B.A.; Nolan, M.; McKellar, L.; Connor, J.D.; Newth, D.; Harwood, T.; King, D.; Navarro, J.; Cai, Y.; Gao, L.; et al. Land-use and sustainability under intersecting global change and domestic policy scenarios: Trajectories for Australia to 2050. Glob. Environ. Chang. 2016, 38, 130–152. [Google Scholar] [CrossRef] [Green Version]
  15. Wang, F.; Hasbani, J.-G.; Wang, X.; Marceau, D.J. Identifying dominant factors for the calibration of a land-use cellular automata model using Rough Set Theory. Comput. Environ. Urban Syst. 2011, 35, 116–125. [Google Scholar] [CrossRef]
  16. Pradhan, B. Use of GIS-based fuzzy logic relations and its cross application to produce landslide susceptibility maps in three test areas in Malaysia. Environ. Earth Sci. 2011, 63, 329–349. [Google Scholar] [CrossRef]
  17. Bathrellos, G.D.; Gaki-Papanastassiou, K.; Skilodimou, H.D.; Papanastassiou, D.; Chousianitis, K.G. Potential suitability for urban planning and industry development using natural hazard maps and geological–geomorphological parameters. Environ. Earth Sci. 2012, 66, 537–548. [Google Scholar] [CrossRef]
  18. Thill, J.-C. Spatial Multicriteria Decision Making and Analysis. A Geographic Information Sciences Approach; Ashgate: London, UK, 2019. [Google Scholar]
  19. Ren, Y.; Lü, Y.; Comber, A.; Fu, B.; Harris, P.; Wu, L. Spatially explicit simulation of land use/land cover changes: Current coverage and future prospects. Earth-Sci. Rev. 2019, 190, 398–415. [Google Scholar] [CrossRef]
  20. Noszczyk, T. A review of approaches to land use changes modeling. Hum. Ecol. Risk Assess. 2019, 25, 1377–1405. [Google Scholar] [CrossRef]
  21. Barredo, J.I.; Demicheli, L.; Lavalle, C.; Kasanko, M.; McCormick, N. Modelling Future Urban Scenarios in Developing Countries: An Application Case Study in Lagos, Nigeria. Environ. Plan. B Plan. Des. 2004, 31, 65–84. [Google Scholar] [CrossRef] [Green Version]
  22. Aburas, M.M.; Ho, Y.M.; Ramli, M.F.; Ash’aari, Z.H. The simulation and prediction of spatio-temporal urban growth trends using cellular automata models: A review. Int. J. Appl. Earth Obs. Geoinf. 2016, 52, 380–389. [Google Scholar] [CrossRef]
  23. Batty, M. Agents, Cells, and Cities: New Representational Models for Simulating Multiscale Urban Dynamics. Environ. Plan. A Econ. Sp. 2005, 37, 1373–1394. [Google Scholar] [CrossRef] [Green Version]
  24. White, R.; Engelen, G. High-resolution integrated modelling of the spatial dynamics of urban and regional systems. Comput. Environ. Urban Syst. 2000, 24, 383–400. [Google Scholar] [CrossRef] [Green Version]
  25. Wu, F. A linguistic cellular automata simulation approach for sustainable land development in a fast growing region. Comput. Environ. Urban Syst. 1996, 20, 367–387. [Google Scholar] [CrossRef]
  26. Li, X.; Yeh, A.G.-O. Neural-network-based cellular automata for simulating multiple land use changes using GIS. Int. J. Geogr. Inf. Sci. 2002, 16, 323–343. [Google Scholar] [CrossRef]
  27. Cechini, A.; Rinaldi, E. Building Urban Models with Multi Cellular Automata. In Proceedings of the 6th International Conference: Computers in Urban Planning & Urban Management, Venice, Italy, 8–11 September 1999. [Google Scholar]
  28. Omrani, H.; Tayyebi, A.; Pijanowski, B. Integrating the multi-label land-use concept and cellular automata with the artificial neural network-based Land Transformation Model: an integrated ML-CA-LTM modeling framework. GISci. Remote Sens. 2017, 54, 283–304. [Google Scholar] [CrossRef] [Green Version]
  29. Rimal, B.; Zhang, L.; Keshtkar, H.; Haack, B.N.; Rijal, S.; Zhang, P. Land use/land cover dynamics and modeling of urban land expansion by the integration of cellular automata and markov chain. ISPRS Int. J. Geo-Inf. 2018, 7, 154. [Google Scholar] [CrossRef] [Green Version]
  30. Santé, I.; García, A.M.; Miranda, D.; Crecente, R. Cellular automata models for the simulation of real-world urban processes: A review and analysis. Landsc. Urban Plan. 2010, 96, 108–122. [Google Scholar] [CrossRef]
  31. Al-shalabi, M.; Billa, L.; Pradhan, B.; Mansor, S.; Al-Sharif, A.A.A. Modelling urban growth evolution and land-use changes using GIS based cellular automata and SLEUTH models: the case of Sana’a metropolitan city, Yemen. Environ. Earth Sci. 2013, 70, 425–437. [Google Scholar] [CrossRef]
  32. van Delden, H.; Luja, P.; Engelen, G. Integration of multi-scale dynamic spatial models of socio-economic and physical processes for river basin management. Environ. Model. Softw. 2007, 22, 223–238. [Google Scholar] [CrossRef] [Green Version]
  33. Verburg, P.H.; Kok, K.; Pontius, R.G.; Veldkamp, A. Modeling Land-Use and Land-Cover Change. In Land-Use and Land-Cover Change; Series, G.C.-T.I., Ed.; Springer Berlin, Heidelberg: Berlin, Germany, 2006; ISBN 978-3-540-32201-6. [Google Scholar]
  34. Research Institute for Knowledge Systems (RIKS BV). Metronamica—Documentation; Research Institute for Knowledge Systems (RIKS BV): Maastricht, The Netherlands, 2011. [Google Scholar]
  35. van Vliet, J.; Bregt, A.K.; Hagen-Zanker, A. Revisiting Kappa to account for change in the accuracy assessment of land-use change models. Ecol. Modell. 2011, 222, 1367–1375. [Google Scholar] [CrossRef]
  36. Kok, K.; van Delden, H. Combining Two Approaches of Integrated Scenario Development to Combat Desertification in the Guadalentín Watershed, Spain. Environ. Plan. B Plan. Des. 2009, 36, 49–66. [Google Scholar] [CrossRef]
  37. Allen, J.; Lu, K. Modeling and Prediction of Future Urban Growth in the Charleston Region of South Carolina. Conserv. Ecol. 2003, 8, 2. [Google Scholar] [CrossRef] [Green Version]
  38. Xu, X.; Du, Z.; Zhang, H. Integrating the system dynamic and cellular automata models to predict land use and land cover change. Int. J. Appl. Earth Obs. Geoinf. 2016, 52, 568–579. [Google Scholar] [CrossRef]
  39. Weynants, M.; Montanarella, L.; Tóth, G.; Arnoldussen, A.; Anaya Romero, M.; Bilas, G.; Borresen, T.; Cornelis, W.; Daroussin, J.; Da Conceiçao Gonçalves, M.; et al. European Hydropedological Data Inventory (EU-HYDI); Publications Office of the European Union: Ispra, Italy, 2013. [Google Scholar]
  40. Catalá Mateo, R.; Bosque Sendra, J.; Plata Rocha, W. Análisis de posibles errores en la base de datos Corine Land Cover (1990–2000) en la Comunidad de Madrid. Estud. Geogr. 2008, 69, 264. [Google Scholar]
  41. Red de Información Ambiental de Andalucía. Available online: http://www.juntadeandalucia.es/medioambiente/site/rediam (accessed on 14 June 2020).
  42. Research Institute for Knowledge Systems (RIKS BV). MCK Reader: Methods of Map Comparison Kit; Research Institute for Knowledge Systems (RIKS BV): Maastricht, The Netherlands, 2011. [Google Scholar]
  43. Van Delden, H.; Engelen, G.; Uljee, I.; Hagen, A.; Van der Meulen, M.; Vanhout, R. Prelude Quantification and Spatial Modelling of Land Use/Land Cover Changes; Research Institute for Knowledge Systems (RIKS BV): Maastricht, The Netherlands, 2005. [Google Scholar]
  44. Hoogeveen, Y.; Volkery, A.; Henrichs, T.; Ribeiro, T. Land Use Scenarios for Europe–Modelling at the European Scale; European Environment Agency: Copenhagen, Denmark, 2005. [Google Scholar]
  45. Consejería de Medio Ambiente y Ordenación del Territorio. El clima de Andalucía en el siglo XXI. Escenarios locales de cambio climático de Andalucía. Available online: http://aeclim.org/wp-content/uploads/2016/01/Climate-Change-in-Andalusia-Libro-completo.pdf (accessed on 19 July 2020).
  46. Li, X.; Chen, Y.; Liu, X.; Li, D.; He, J. Concepts, methodologies, and tools of an integrated geographical simulation and optimization system. Int. J. Geogr. Inf. Sci. 2011, 25, 633–655. [Google Scholar] [CrossRef] [Green Version]
  47. Bindereif, L.; Rentschler, T.; Bartelheim, M.; Bonilla, M.D.-Z.; Gries, P.; Schmidt, K.; Scholten, T. Analysis and mapping of spatio-temporal land use dynamics in Andalusia, Spain using the Google Earth Engine cloud computing platform and the Landsat archive. In Proceedings of the Geophysical Research Abstracts, Vienna, Austria, 7–12 April 2019; Volume 21. [Google Scholar]
  48. Molina, R.; Anfuso, G.; Manno, G.; Gracia Prieto, F.J. The Mediterranean Coast of Andalusia (Spain): Medium-Term Evolution and Impacts of Coastal Structures. Sustainability 2019, 11, 3539. [Google Scholar] [CrossRef] [Green Version]
  49. Rokicki, B.; Stępniak, M. Major transport infrastructure investment and regional economic development—An accessibility-based approach. J. Transp. Geogr. 2018, 72, 36–49. [Google Scholar] [CrossRef]
  50. Romero-Díaz, A.; Ruiz-Sinoga, J.D.; Robledano-Aymerich, F.; Brevik, E.C.; Cerdà, A. Ecosystem responses to land abandonment in Western Mediterranean Mountains. CATENA 2017, 149, 824–835. [Google Scholar] [CrossRef] [Green Version]
  51. Muñoz, M.P.M. Sustainable Agriculture and Resource use under Climate Change: A Multi-scale and Cross-sectoral Approach with a Focus on Andalusia (Spain); Universidad Politécnica de Madrid: Madrid, Spain, 2019. [Google Scholar]
  52. Gill, S.E.; Handley, J.F.; Ennos, A.R.; Pauleit, S. Adapting cities for climate change: the role of the green infrastructure. Built Environ. 2007, 33, 115–133. [Google Scholar] [CrossRef] [Green Version]
  53. Dunford, R.W.; Smith, A.C.; Harrison, P.A.; Hanganu, D. Ecosystem service provision in a changing Europe: adapting to the impacts of combined climate and socio-economic change. Landsc. Ecol. 2015, 30, 443–461. [Google Scholar] [CrossRef] [Green Version]
  54. Jeong, J.S. Design of spatial PGIS-MCDA-based land assessment planning for identifying sustainable land-use adaptation priorities for climate change impacts. Agric. Syst. 2018, 167, 61–71. [Google Scholar] [CrossRef]
  55. Gounaridis, D.; Chorianopoulos, I.; Symeonakis, E.; Koukoulas, S. A Random Forest-Cellular Automata modelling approach to explore future land use/cover change in Attica (Greece), under different socio-economic realities and scales. Sci. Total Environ. 2019, 646, 320–335. [Google Scholar] [CrossRef] [PubMed]
  56. Gomes, E.; Abrantes, P.; Banos, A.; Rocha, J. Modelling future land use scenarios based on farmers’ intentions and a cellular automata approach. Land Use Policy 2019, 85, 142–154. [Google Scholar] [CrossRef]
  57. Van Delden, H.; Vanhout, R. Territorial Scenarios and Visions for Europe. Available online: http://bsr-espon.infeurope.lu/export/sites/default/Documents/Projects/AppliedResearch/ET2050/FR/ET2050_FR-03_Volume_5_-_Land-use_Trends_and_Scenarios.pdf (accessed on 19 July 2020).
  58. Van Delden, H.; Stuczynski, T.; Ciaian, P.; Paracchini, M.; Hurkens, J.; Lopatka, A.; Shi, Y. Integrated assessment of agricultural policies with dynamic land use change modelling. Ecol. Modell. 2010, 18, 2153–2166. [Google Scholar] [CrossRef]
  59. Locatelli, B.; Lavorel, S.; Sloan, S.; Tappeiner, U.; Geneletti, D. Characteristic trajectories of ecosystem services in mountains. Front. Ecol. Environ. 2017, 15, 150–159. [Google Scholar] [CrossRef]
  60. Holman, I.; Brown, C.; Janes, V.; Sandars, D. Can we be certain about future land use change in Europe? A multi-scenario, integrated-assessment analysis. Agric. Syst. 2017, 151, 126–135. [Google Scholar] [CrossRef]
Figure 1. Distribution of the most representative rural land uses in Andalusia region (Southern Spain) in 2007.
Ijgi 09 00458 g001
Figure 2. Metronamica system diagram of the land use-based model implemented for Andalusia (see text for explanation).
Ijgi 09 00458 g002
Figure 3. Transition matrix of major land-use categories in Andalusia (southern Spain) for different rural land-cover classes, between 1999 and 2007.
Ijgi 09 00458 g003
Figure 4. Simulated land-use change between 2007 and 2035 in Andalusia under the PRELUDE scenarios (ar) (Great Escape—Andalusia of Contrasts, Evolved Society—Andalusia of Harmony, Clustered Network—Andalusia of Structure, Lettuce Surprise U—Andalusia of Innovation, and Big Crisis—Andalusia of Cohesion). Letters in parentheses express the combination of the scenarios and the main rural land uses
Ijgi 09 00458 g004
Table 1. Influence of the driving forces of the PRELUDE scenarios [32]. The “+” symbol indicates that this force increases, “–“ indicates that this force decreases, and “o” indicates that this force has no effect. The presence of two “+” indicates that this force has more influence (see also Figure S2 Supplementary Material).
Driving ForcesE1
Great Escape
E2
Evolved Society
E3
Clustered Networks
E4
Lettuce Surprise
E5
Big Crisis
Policy intervention-++-++
Population growth+++++++
Internal migration++++++
Social equity--+Ooo
Economic growth+++++++
Self-sufficiencyo++O+o
Technological growth++++++
Climate change+++++o+
Renewable energy+o+++o
Table 2. Transition matrix of major land-use categories (ha) in Andalusia (southern Spain) for different rural land-cover classes, between 1999 and 2007.
Land Uses 2007
Land Uses 1999Urban AreasNatural AreasAgricultural LandOverall
Urban areas191,987.162401.622151.35196,540.13
Natural areas29,782.974,528,079.7665,945.054,623,807.77
Agricultural land42,452.2555,480.423,842,557.863,940,490.53
Overall264,222.384,585,961.803,910,654.268,760,838.44
Table 3. Predicted distributions (ha) of major land uses in Andalusia for the forecasted year (2035) (PRELUDE scenarios) (see Figure 4).
2035
E1—Great Escape—Andalusia of contrasts
Shrubs formations2,326,599
Intensive agriculture513,781
Extensive agriculture517,443
E2—Evolved Society—Andalusia of harmony
Shrubs formations797,311
Intensive agriculture308,168
Extensive agriculture1,497,530
E3—Clustered Networks— Andalusia of structure
Shrubs formations2,546,337
Intensive agriculture347,399
Extensive agriculture634,098
E4—Lettuce Surprise U— Andalusia of innovation
Shrubs formations1,805,649
Intensive agriculture129,956
Extensive agriculture522,375
E5— Big Crisis— Andalusia of cohesion
Shrubs formations992,330
Intensive agriculture575,298
Extensive agriculture819,297
Table 4. Kappa index for the land-use model in the various scenarios in 2035. The values vary between 0 and 1, where 0 is totally different and 1 is identical.
SCENARIOSGreat EscapeEvolved SocietyClustered NetworkLettuce Surprise UBig Crisis
Great Escape 0.500.780.790.62
Evolved Society 0.480.590.73
Clustered Network 0.690.57
Lettuce Surprise U 0.69
Big Crisis
Trend0.600.690.560.690.87

