Article

High-Resolution Solar Climate Atlas for Greece under Climate Change Using the Weather Research and Forecasting (WRF) Model

by
Theodoros Katopodis
*,
Iason Markantonis
,
Nadia Politi
,
Diamando Vlachogiannis
and
Athanasios Sfetsos
Environmental Research Laboratory, NCSR “Demokritos”, 15341 Agia Paraskevi, Greece
*
Author to whom correspondence should be addressed.
Atmosphere 2020, 11(7), 761; https://doi.org/10.3390/atmos11070761
Submission received: 6 June 2020 / Revised: 3 July 2020 / Accepted: 16 July 2020 / Published: 18 July 2020
(This article belongs to the Special Issue Climate Modeling for Renewable Energy Resource Assessment)

Abstract

:
In the context of climate change and growing energy demand, solar technologies are considered promising solutions to mitigate Greenhouse Gas (GHG) emissions and support sustainable adaptation. In Greece, solar power is the second major renewable energy, constituting an increasingly important component of the future low-carbon energy portfolio. In this work, we propose the use of a high-resolution regional climate model (Weather Research and Forecasting model, WRF) to generate a solar climate atlas for the near-term climatological future under the Representative Concentration Pathway (RCPs) 4.5 and 8.5 scenarios. The model is set up with a 5 × 5 km2 spatial resolution, forced by the ERA-INTERIM for the historic (1980–2004) period and by the EC-EARTH General Circulation Models (GCM) for the future (2020–2044). Results reaffirm the high quality of solar energy potential in Greece and highlight the ability of the WRF model to produce a highly reliable future climate solar atlas. Projected changes between the annual historic and future RCPs scenarios indicate changes of the annual Global Horizontal Irradiance (GHI) in the range of ±5.0%. Seasonal analysis of the GHI values indicates percentage changes in the range of ±12% for both scenarios, with winter exhibiting the highest seasonal increases in the order of 10%, and autumn the largest decreases. Clear-sky fraction fclear projects increases in the range of ±4.0% in eastern and north continental Greece in the future, while most of the Greek marine areas might expect above 220 clear-sky days per year.

Graphical Abstract

1. Introduction

The usage of solar energy applications in Greece has increased significantly during the last decade, providing both heat energy and electricity, meeting the demands for more efficient and more affordable production of solar technologies. Globally, the cumulative capacities for solar thermal and photovoltaics (PV) installations were around 480 and 506 GW, respectively, by the end of 2018 [1]. Between the top 10 countries who share their electricity production from solar energy in 2018, Greece holds the 9th place for the added capacity of solar water heating collectors and the 2nd place for solar PV, with a percentage of 8.2%, while the renewable power target for solar PV installed capacity has been set at 2.0 GW, by the end of 2030 [1].
With respect to the country’s commitments for climate change mitigation and to implement European (EU) policy actions to decrease Greenhouse Gas (GHG) emissions, the upward trend of solar technologies installations is anticipated to further strengthen. In order to support coherent planning for the more efficient and effective development of solar technologies accounting for their entire lifespan of about 25–30 years [2,3], the accessibility and susceptibility of solar resources to climate change is required [4]. The climate change impacts on solar and PV technologies have already been emphasized in many studies [5,6,7], which already assured that climate change might have meaningful impacts on the solar resources, despite the fact that the level of those effects depend on how climate projections would vary across regions [8]. Therefore, and under a risk-informed approach, long-term decisions on solar energy policies should also be based on assessment of resources under future climate considering its frequently nonstationary characteristics.
The projected changes in solar radiation over the United States (US), linked to increased GHG emissions, have been studied by [9] with the use of a regional climate model and it was estimated that mean seasonal daily Global Horizontal Irradiation (GHI) may decrease down to 20% by the end of the 2040s. Also, [10] studied the impacts of climate changes on PV and Concentrated Solar Power (CSP) systems with the use of two climate change models, concluding that overall solar power is expected to increase a few percentage points in Europe. Moreover, [8] quantified the impacts of climate change on PV future performance, stating that the efficiency of PV systems will change as a result of the new GHI and temperature values in Australia. Finally, [11] developed a new solar atlas in India, using satellite-derived models and measurements.
The latest EU research on solar radiation under the climate change context contains the efforts of [12], who developed the PVGIS solar radiation database for the EU, and of [13], who have built a new solar radiation database to assess the PV performance in the EU and Africa. Moreover, [14] studied the UK solar energy for historical and future periods, from 30 years of gridded observations of the Met Office, and found an overall mean increase of the United Kingdom (UK) solar power as a result of climate change.
In Greece, [15] studied the long-term series of surface solar radiation from Athens, showing small changes, which could be associated partially to cloudiness and mainly to aerosol load variations. Furthermore, [16] studied the historic climatology of GHI and Direct Normal Irradiance (DNI) (2002–2012), attributing changes of DNI to the decreasing aerosol optical depth in Greece, indicating also that it is important to assess how solar energy, along with cloud cover characteristics, will change together with future climate changes. Finally, [17] studied projections of GHI from five Regional climate models (RCMs) for historical and future periods and found minor increases (2.0–3.0 W/m2 by 2011–2050 and 5.0 W/m2 by 2061–2100).
This paper aims to establish very high-resolution solar climate maps for Greece accounting for the impacts of climate change, assessing both annual and seasonal characteristics, using a high-resolution climate modeling approach. The solar climate atlas is produced using the Advanced Weather Research and Forecasting numerical model (WRF-ARW), forced by ERA-INTERIM for the historic period (1980–2004) and EC-EARTH for the historic and future (2020–2044) period at a scale of 5 × 5 km2 [18,19]. The medium stabilization Intergovernmental Panel on Climate Change (IPCC) scenario Representative Concentration Pathway (RCP) 4.5 and the high-end scenario (RCP 8.5) are selected for this analysis. Initially, the Weather Research and Forecasting (WRF) model simulation for the historic period is thoroughly validated against observational data from the European Climate Assessment (ECA) dataset [20,21], regarding the accuracy of representing the GHI climatology. Then, the differences between the historic and future periods are estimated, accounting for annual and seasonal assessments. The developed high-fidelity and high-resolution solar climate atlas will provide national policymakers and stakeholders with a valuable tool to capture the influence of climate change and better understand project-related uncertainties in the long-term decision-making process.

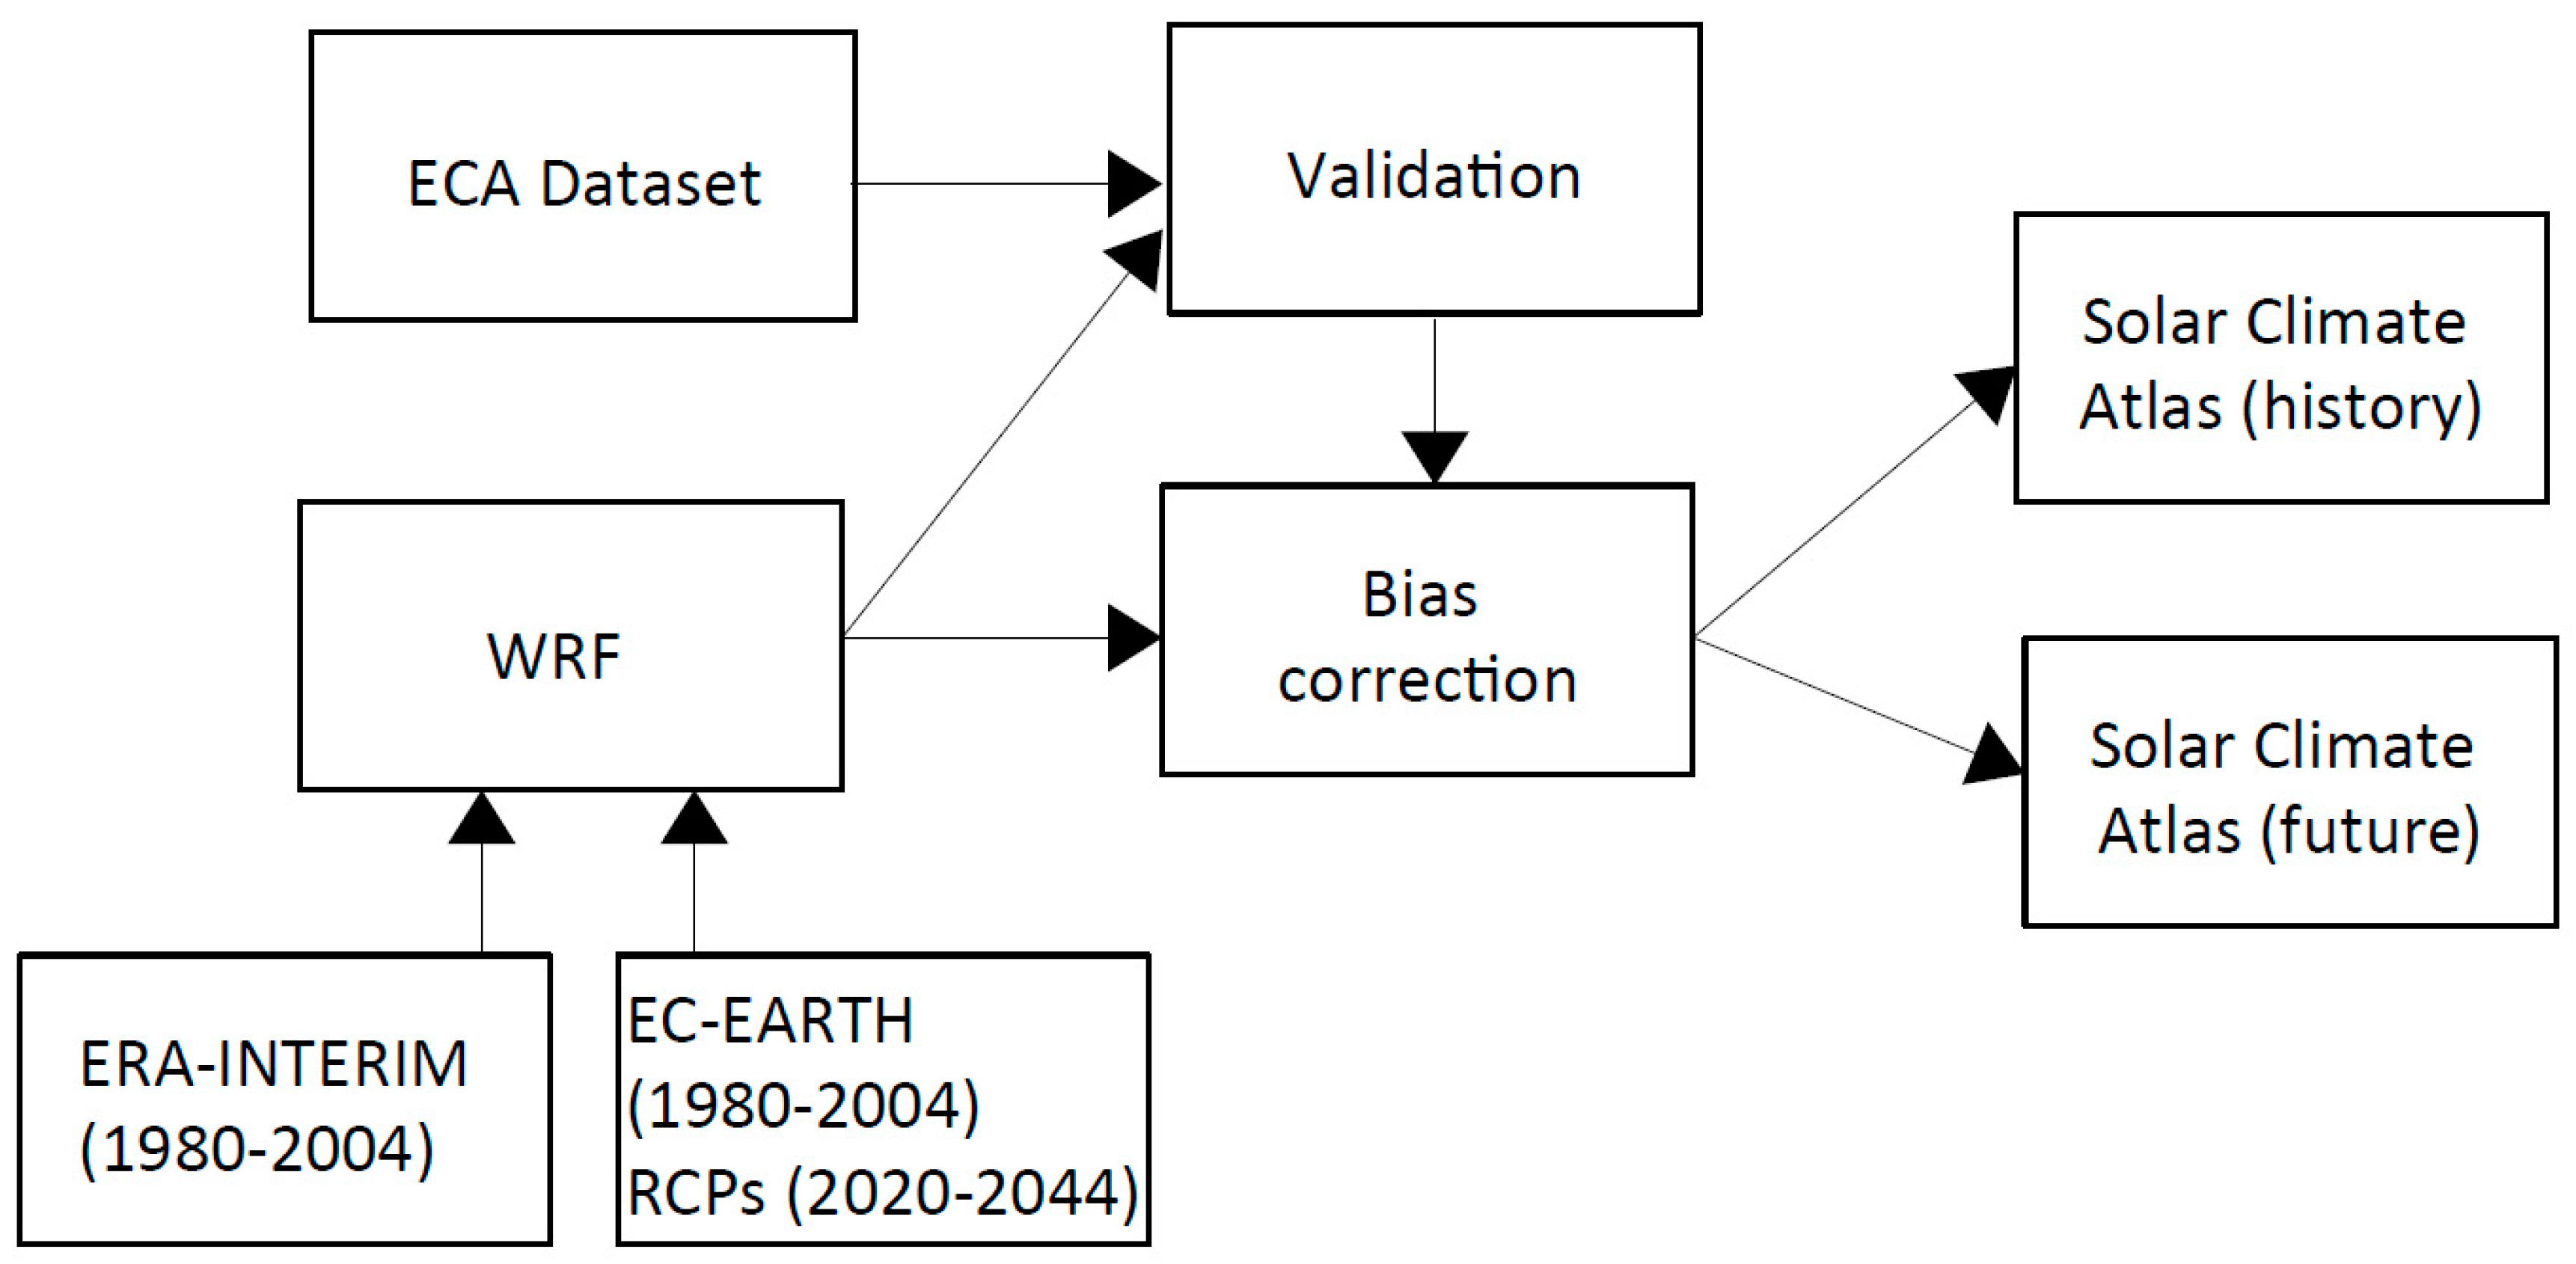
2. Data and Methodology

Figure 1 presents the overall methodology of the development of the high-resolution solar climate atlas for Greece under climate change, using the WRF model that is based on extensive validation against the ECA dataset and bias correction of historic simulations and future projections. The solar resource assessment of the historic climatology period is performed using both measured and simulated solar irradiance data. As there are not sufficient weather stations to provide historical solar irradiance measurements in Greece, the use of high-resolution regional climate simulations to generate consistent estimations in future climate, at the seasonal to 25-year time periods, is of high priority [14].

2.1. Data Sources

The solar climate atlas is established using the Advanced Weather Research and Forecasting numerical model (v3.6.1) [22], forced by ERA-INTERIM [23] for the historic period (1980–2004) and EC-EARTH General Circulation Models (GCM) developed by the European Centre for Medium-Range Weather Forecasts (ECMWF) [24], for the same historic and future (2020–2044) periods, dynamically downscaled to the region of Greece at a scale of 5 × 5 km2 [18,19]. EC-Earth is an Earth System Model (ESM) closely aligned with the ECMWF seasonal forecasting system, hence benefiting from its continuous updates. The model is widely used in a range of international climate modeling and service research projects. EC-Earth has been designed to cover all timescales (from subseasonal to long-term) and includes components that introduce more complexity into the system such as land-use changes and interactive vegetation in the simulations [24]. WRF was set up with two nested grids (Figure 2): the outer domain, which is centered in the Mediterranean basin and has been configured using a mesh size of 265 × 200 grid cells with 20 km horizontal resolution (d01–EU), and the internal domain, which uses 185 × 185 grid cells of 5 km horizontal grid spacing covering the area of Greece (d02–GR). This setup has used 40 levels in the vertical dimension, arranged according to terrain-following hydrostatic pressure vertical coordinates, and one-way nesting has been applied, to avoid possible noise during feedback from the inner domain to the coarse domain. The last four days of the previous month were regarded as model spin-up for the following month, so the model was reinitialized every month [19]. According to [19], the ERA-INTERIM reanalysis dataset was used to provide initial and boundary conditions. The lateral boundary conditions and the sea surface temperature were both updated every 6 h, from ERA-INTERIM. Seven simulations were run using spectral nudging above the planetary boundary layer (PBL) and only over the coarse domain. The model physics configuration and extensive validation for temperatures and precipitation are presented in [18].
Climate simulations with the WRF model are performed for two periods (a) from 1980 to 2004, used for model validation purposes, and (b) 2020–2044, for the two RCPs (4.5 W/m2 and 8.5 W/m2), which is linked to the projected lifespan of modern solar systems [3].

2.2. Derived Solar Climatology Parameters

In our study, data of the GHI, from the ECA dataset [21], which has been provided by the Hellenic National Meteorological Service (HNMS), were used to validate the high-resolution climatology simulations generated by WRF. The following section introduces the main outputs from the WRF regional climate simulations. WRF model output data (GHI and fclear) were obtained at a frequency of 6 h intervals and then transformed into GHI climatology annual and seasonal values of winter (DJF), spring (MAM), summer (JJA), and autumn (SON).

2.2.1. Mean Daily Global Horizontal and Direct Normal Irradiation

The amount of radiation on a terrestrial surface at a given site, for a given time, depends on the orientation and slope of the surface. A flat surface receives the global radiation, which is the sum of DNI and Diffuse Horizontal Irradiation (DHI), while θ z is the zolar zenith angle, between the sun’s rays and the vertical (0 ≤ θ z ≤ 90).
GHI = DNI cos θ z + DHI ,
GHI is the amount of direct and diffuse irradiance absorbed on a horizontal plane and is reference irradiance for the assessment of climatic zones and a critical component for estimating the radiation on a tilted surface. Despite the fact that DNI is a key factor for energy yield calculation and performance assessment of CSP, concentrator solar photovoltaic (CPV) technologies, and tilted or sun-tracking photovoltaic modules, for the purposes of this study, the GHI has been preferred, as it is the most crucial factor for energy yield calculation and performance assessment of flat-plate photovoltaic (PV) technologies [25]. Average GHI (W/m2) was obtained at 6 h intervals and then transformed into mean annual and seasonal values of the 25-year time period.

2.2.2. Sunshine Duration

Sunshine duration can be calculated using the following equation:
T = 2 15 cos 1 ( tan φ tan δ ) ,
where Τ is the sunshine duration in hours, φ is the latitude in degrees, and δ is the declination of the sun in degrees. The declination of the sun (δ) is given by Equation (3), where n is the day of the year.
δ = 23.45 sin [ 360 284 + n 365 ]

2.2.3. Annual GHI Estimation (kWh/m2)

As first, the assessment of the WRF model tended to heavily overestimate the mean GHI (W/m2) values over the main parts Greece when compared to the ECA dataset, due to the fact that the WRF model provides GHI data (W/m2) at 6 h intervals, thus it was preferred to transform the GHI from 6 h intervals (W/m2) to continuous distribution per hours of daytime. The maxGHI value per day was then calculated through the sin 1 ( t ) , where t corresponds to the 12:00 pm at each grid point.
GHI = MaxGHI sin ( t 2 ) ,
where t 2 corresponds to the time of the day and takes values from the range 0 < π/2 < π. Thus, the mean daily, annual, and seasonal solar GHI (kWh/m2) was calculated, with the use of the mean daily GHI (W/m2) and the sunshine duration (hours), for all the grid points of the Greek domain.

2.2.4. Clear-Sky Days and fclear

In general, clear-sky models estimate the terrestrial solar radiation under a cloudless sky, as a function of the solar elevation angle, site altitude, aerosol concentration, water vapor, and various atmospheric conditions. Apparently, the solar downward radiation is mostly affected by cloudy conditions. Clouds significantly decrease the incoming solar irradiance reaching the panels’ surface, causing losses in the overall energy production. Indeed, clouds are able (i) to block a portion of the solar irradiance, decreasing mostly the direct radiation on the surface level [26]; (ii) to enhance the diffusive irradiation that arrives to the ground; and (iii) to regulate the global temperature and to contribute to global warming by capturing the long-wave radiation [17].
In this study, the clear-sky days were calculated at 6 h intervals from the WRF model output, through the difference of the total insolation for the actual cloud cover (GHI) and the clear-sky total insolation for when there were no clouds present (GHIcs). Also, the fraction of time for which no significant clouds blocked the sun (fclear) was calculated using Suehrcke’s Equation [27]. Following the methodological approach of [14], fclear is found by:
f clear = ( K Kclear ) 2 = ( GHI GHIcs ) 2 ,
where K is the mean clearness index and Kclear is the mean clear-sky clearness index.

3. WRF Solar Climatology Performance Validation

The implemented regional climate model WRF forced by the ERA-INTERIM performance was systematically assessed via a reliable evaluation procedure with the use of historical observations. The “nearest neighbor” method to the position of the monitoring stations was chosen. Section 3.1 describes the comparison against the available ECA dataset [21], from as many Greek meteorological stations as possible, of the same temporal period each time. Moreover, a qualitative comparison of GHI (kWh/m2) with the annual climatological solar energy map for Greece for GHI values (kWh/m2) of the period of 2002–2012, from the work of [16], was performed (Section 3.2). Also, discussion and comments were introduced, related to the qualitative comparison of WRF model results with the 35-year climatology simulations of the Solargis solar atlas published by the World Bank Group [28], funded by the Energy Sector Management Assistance Program (ESMAP), and with the 15-year climatology of the mean monthly GHI solar energy map of Greece, from the European Organization for the Exploitation of Meteorological Satellites (EUMETSAT) Satellite Application Facility on Climate Monitoring (CM SAF), at a spatial resolution of about 5 km.

3.1. ECA Dataset

Although Greece has a long history of routine meteorological observations mainly provided by the HNMS, the publications of high-quality data are not always available, as a matter of several issues (data policy, etc.). European Climate Assessment (ECA) concentrates its efforts on the implementation of holistic analysis methodologies to daily measurements datasets. Greece is one of the 34 countries who joined in the ECA project providing data from 10 stations. From them, those of Trikala, N. Filadelfeia, and Tymbakion have been excluded, as they had extensive gaps in their datasets [21]. Meanwhile, ECA has already applied a uniform comparison of the ECA dataset with existing gridded datasets, showing correlation coefficients greater than 0.8, which strengthens the ECA validity and confidence.
Under the purpose of this study, the climatology solar irradiance (W/m2) of the high-resolution WRF climate simulation over Greece has been compared to the available climatology dataset of the ECA project [20] using the following statistical measures, presented in Table 1: (i) correlation coefficient (r), Equation (6); (ii) mean bias, Equation (7); (iii) mean absolute percentage error (MAPE), Equation (8); and (iv) the root mean square error (RMSE), Equation (9).
r = i = 1 N   ( s i   s ¯ ) ( m i   m ¯ ) i = 1 N   ( s i   s ¯ ) 2 i = 1 N   ( m i   m ¯ ) 2 ,
Mean   Bias = i = 1 N   ( s i m i ) N ,
MAPE = 1 N i = 1 N [ | s i m i m i | ] × 100 ,
RMSE = i = 1 N ( s i   m i ) 2 N ,
where s i and s ¯ represent the model simulations and mean monthly model simulated values, respectively, m i and m ¯ are the measurements (observations) and mean monthly measurements, respectively, and N the total number of data points.
The evaluation of simulated mean surface GHI values (black line) against ECA observations (grey line) provided by the HNMS network to ECA yields that the stations of Arta, Aliartos, Argos, and Thessaloniki indicate the greatest correlation factors. Also in the locations of Athens, Aliartos, Andravida, and Sikiwna, model biases are within 40–45 W/m2 (Table 1). MAPE is below 25% for the location of Athens, while the lowest RMSE values have been noticed for the locations of Athens and Aliartos. However, as Table 1 demonstrates, during the statistical comparison between WRF climatology and ECA dataset, the error analysis results yielded that the WRF model (black line) tended to overestimate constantly the GHI values of the ECA dataset (grey line), presenting a systematic bias error against observed values, with average values of the order of 57 W/m2 for the whole dataset, resulting in the need for bias adjustment. Hence, the use of bias correction was applied in order to adjust the WRF model output according to the existing climate regime, which is necessary for the production of valuable outcomes in climate applications [29,30]. Thus, the bias in mean monthly model values is corrected by subtracting the value of 57 W/m2, which is the difference between modeled and observed mean monthly GHI values of the time period; see Table 1.
The WRF direct output is bias-corrected according to the methodology proposed in [31]. Τhe use of bias correction improved the performance of the WRF datasets to reasonably represent the GHI climatology data (Figure 3), except for the Athens observational dataset, which shows the greatest overall agreement among the two datasets, with the highest bias error, MAPE, and RMSE values in comparison to the other stations. Apparently, the improved simulated mean GHI values (black dashed line) against ECA observations show MAPE of the range of 9.0–16.5% and RMSE from 12 to 27 W/m2, while the greatest overall agreement between the observations and the corrected simulated datasets was found for the stations of Andravida (1980–1989), Aliartos (1980–1990), and Sikiwna (1980–1990).

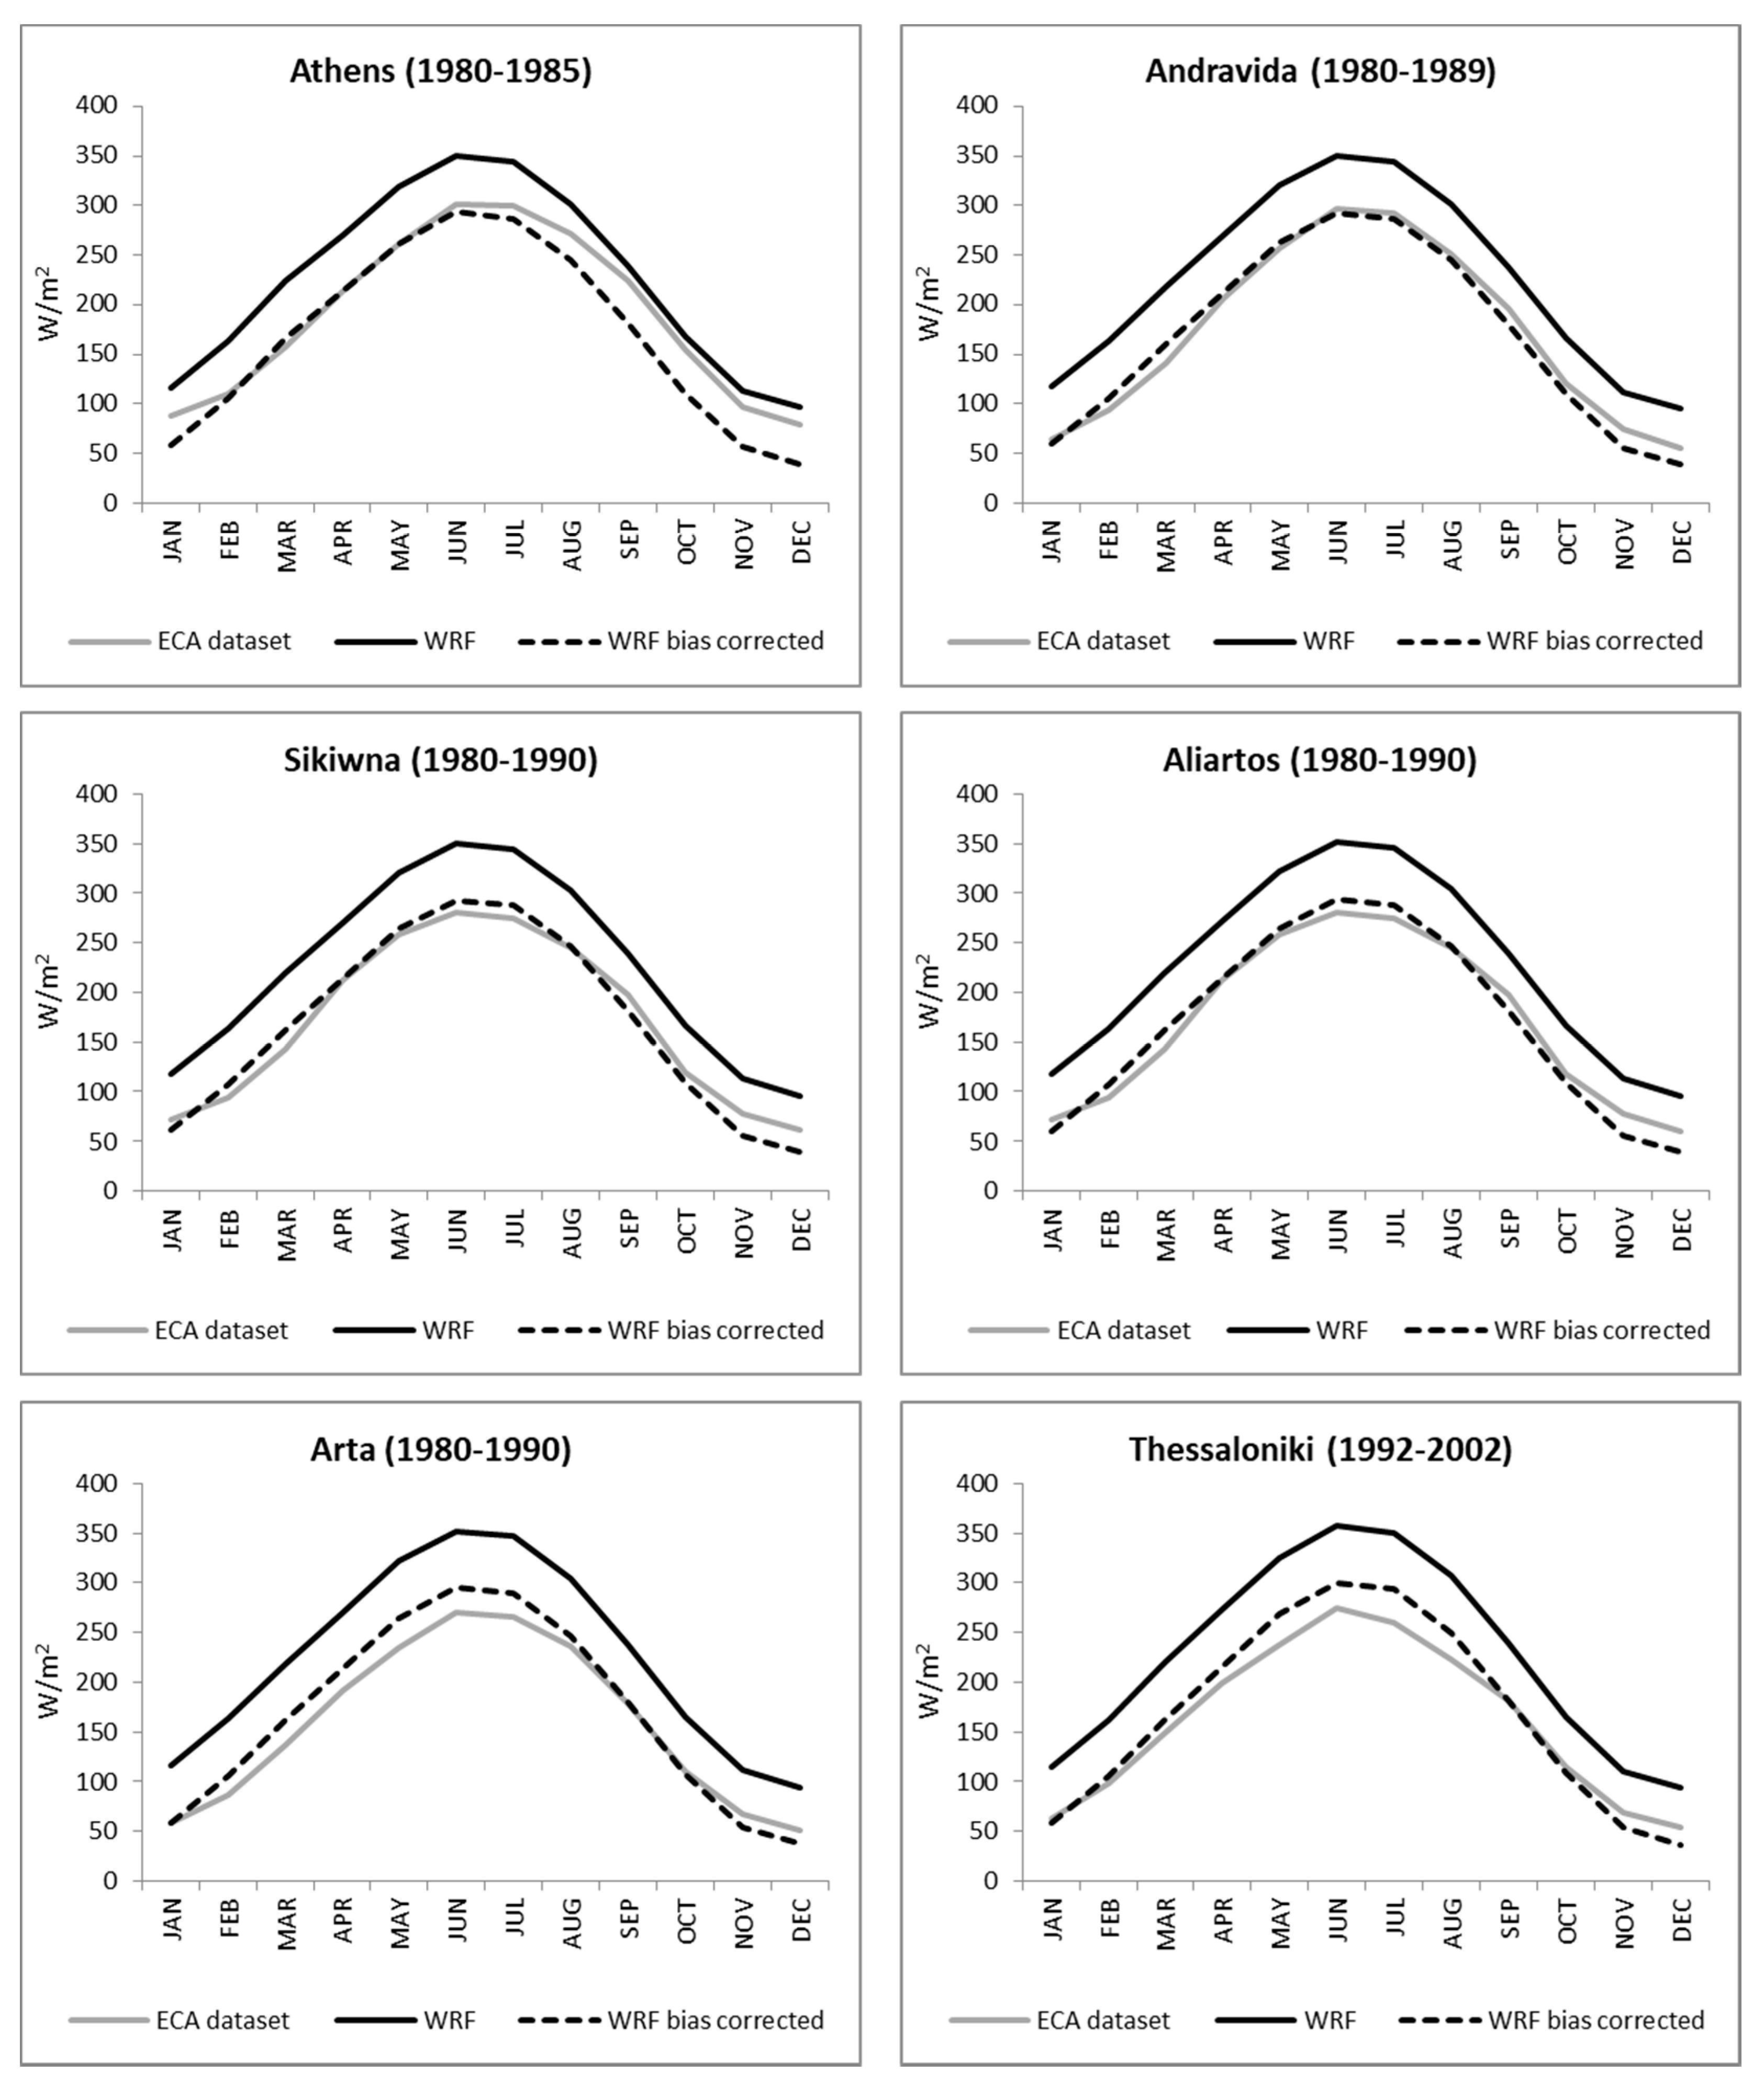
3.2. Qualitative Comparison

The skill of the WRF to simulate the GHI in Greece was further compared to the annual climatological solar energy map for Greece for GHI values (kWh/m2) of the period of 2002–2012, of the work of [16], who studied the challenges in solar energy resource and forecasting in Greece. The analysis in Figure 4 shows that WRF simulations produce a mean climatology that is very close to the [16] solar GHI map, which has also been validated to the maps provided by SOLARGIS (www.solargis.com) for the period of 1994–2013, and found differences in the order of 25 kWh/m2. WRF values of the GHI concerning the period of 1994–2004 (kWh/m2) show an excellent agreement compared to the long-term average GHI dataset of the annual climatological solar energy map of the period of 2002–2012, with the observed differences, while the spatial variability and the geographical distribution are consistent.
Also, the WRF GHI solar map was further compared to the mean solar resource map of Greece, which was released previously with Global Solar Atlas and published by the World Bank Group [28], funded by ESMAP and prepared by SOLARGIS over a 35-year period (1994–2018), showing that model simulations produce a mean climatology that is very close to the mean SOLARGIS generated climate. Results also indicate the close relationship of the WRF model simulations (W/m2) to the 15-year climatology of the mean monthly GHI solar energy map of Greece from the EUMETSAT’s CM SAF at a spatial resolution of about 5 × 5 km2 [32]. These qualitative comparisons provided evidence of the robustness of the WRF model for simulating the climate conditions during the recent period (1980–2004) in Greece and further confidence and reliance on the future scenario simulations.

4. Reconstructing a Very High-Resolution Solar Climate Atlas for Greece

Mean annual and daily GHI values, along with mean seasonal annual and daily GHI values, were calculated from WRF simulations of the present climate and are shown together with the differences between future and historical climate scenarios, based on 25-year mean values. Also, the clear-sky days are presented through the difference of the total insolation for the actual cloud cover (GHI) and the clear-sky total insolation for when there were no clouds present (GHIcs).

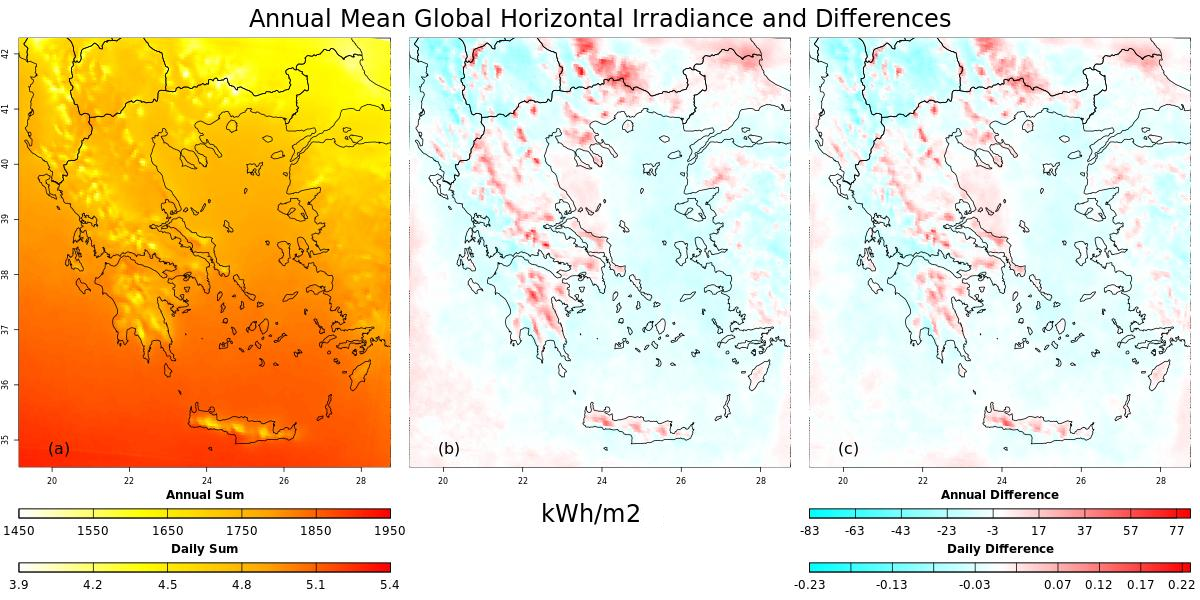
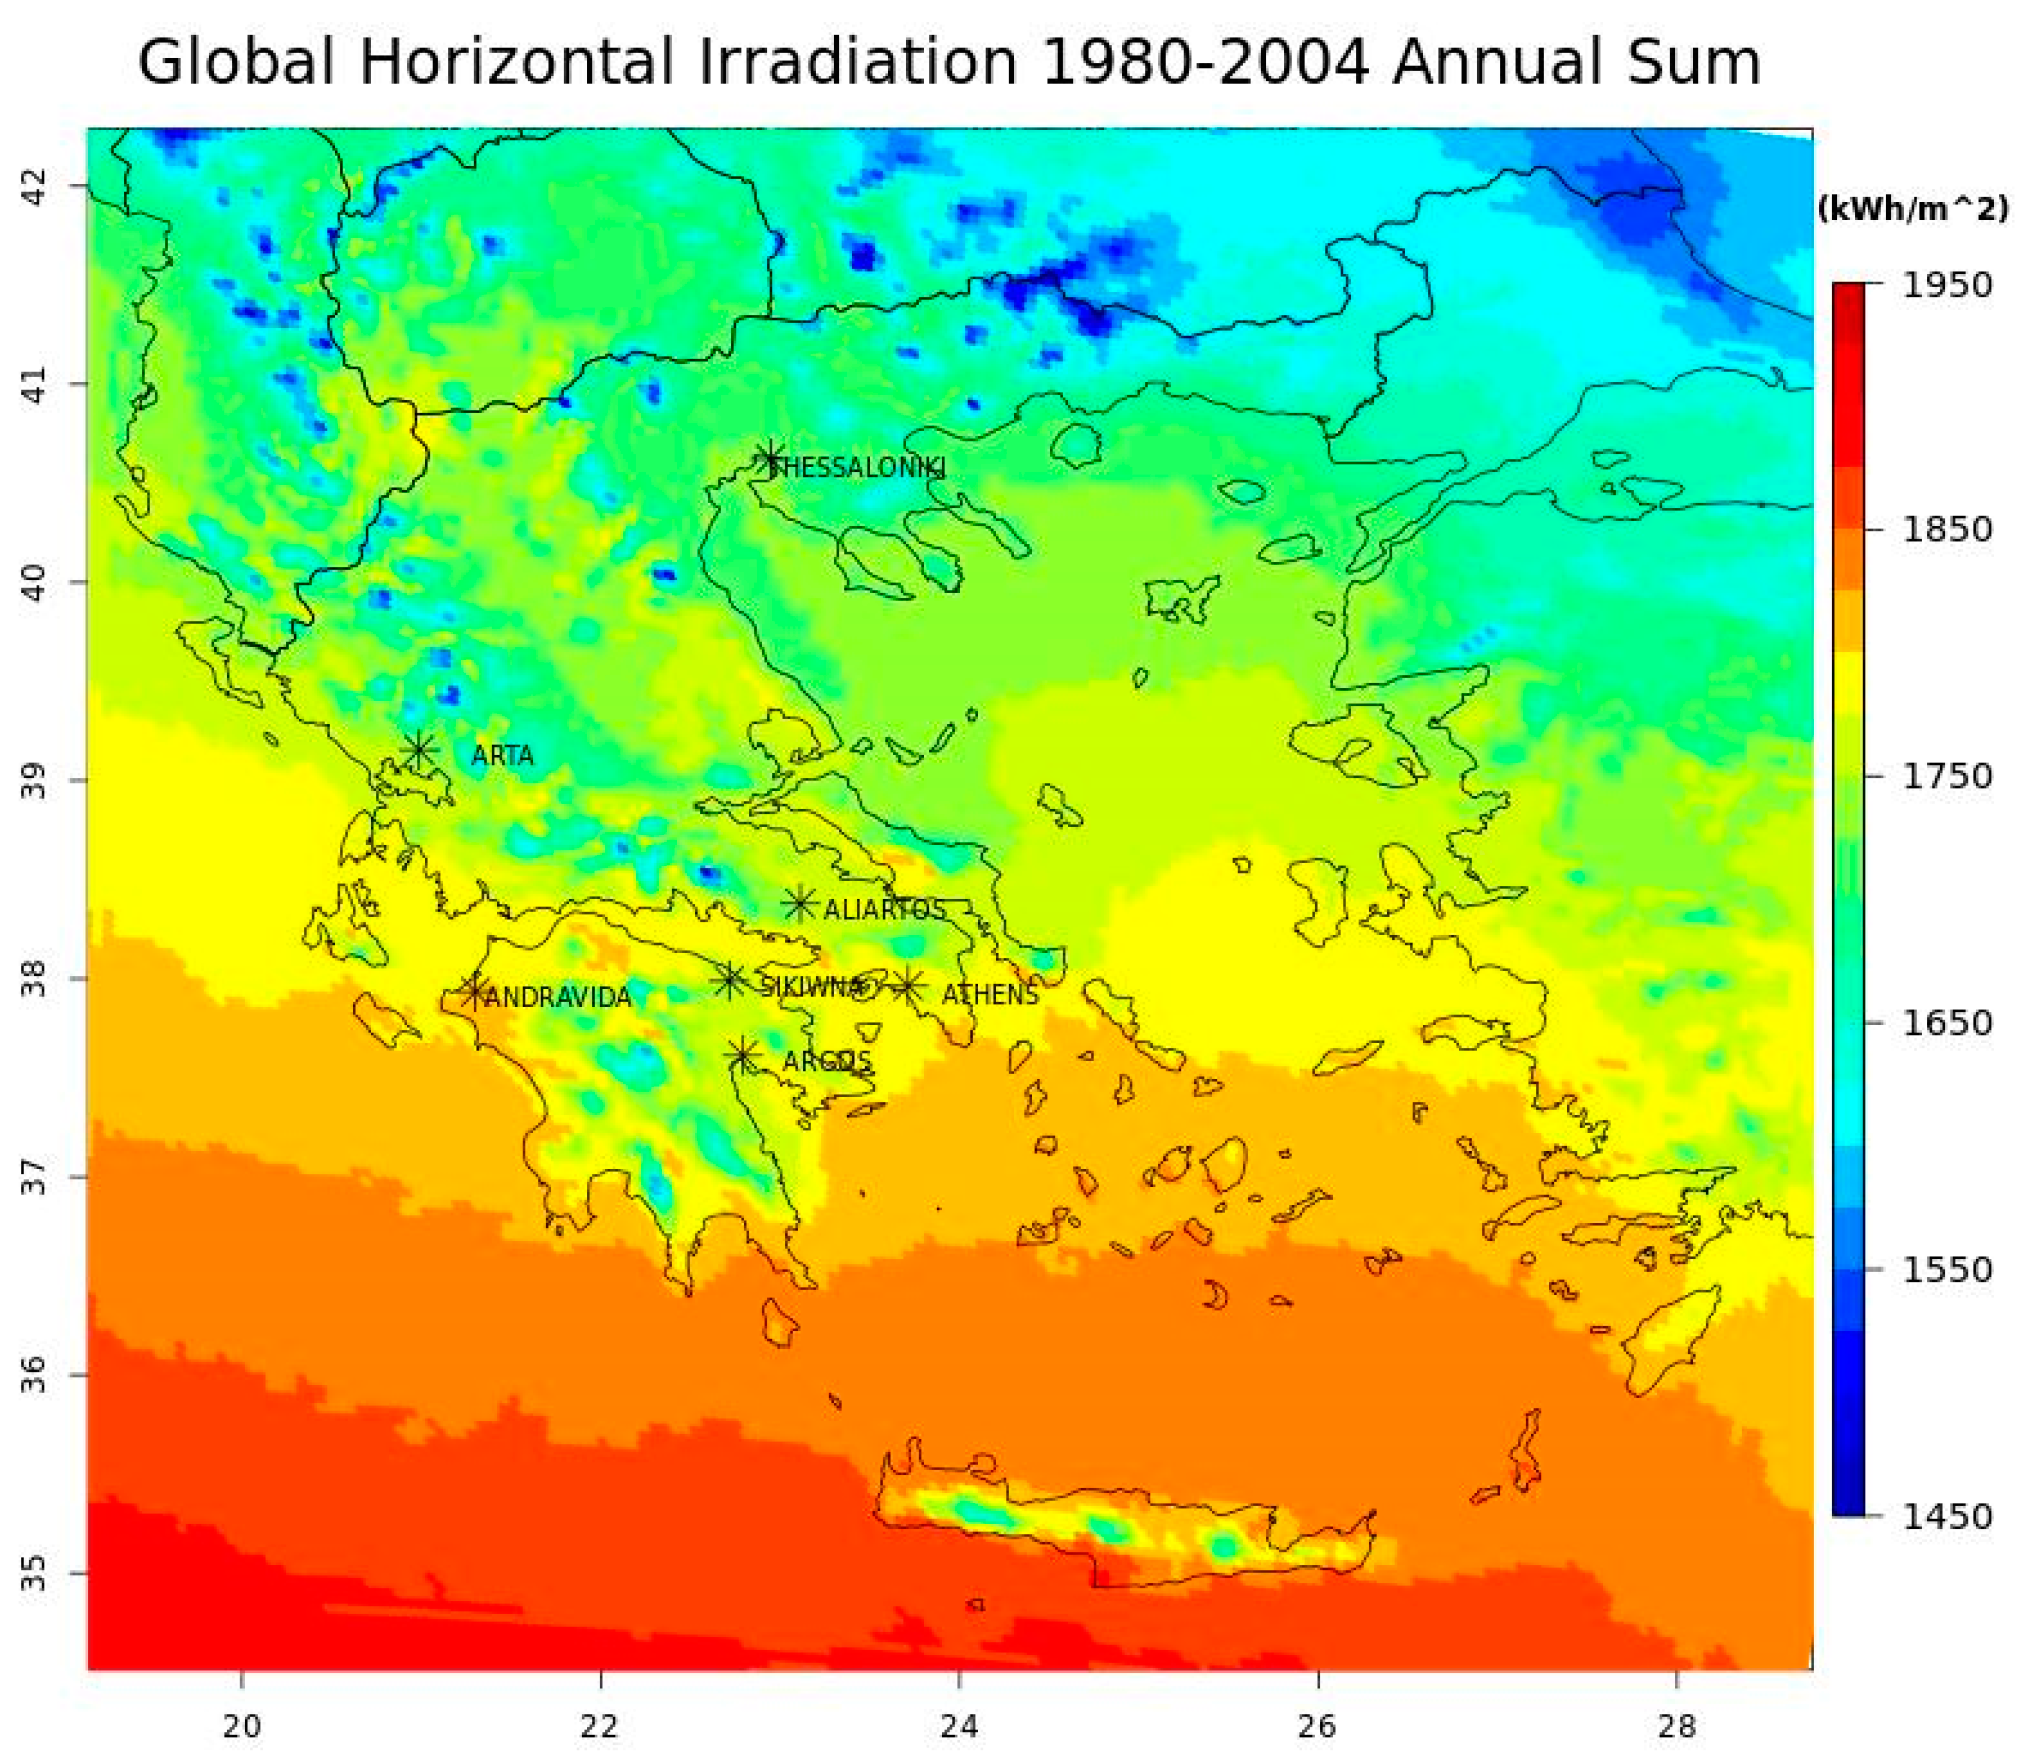
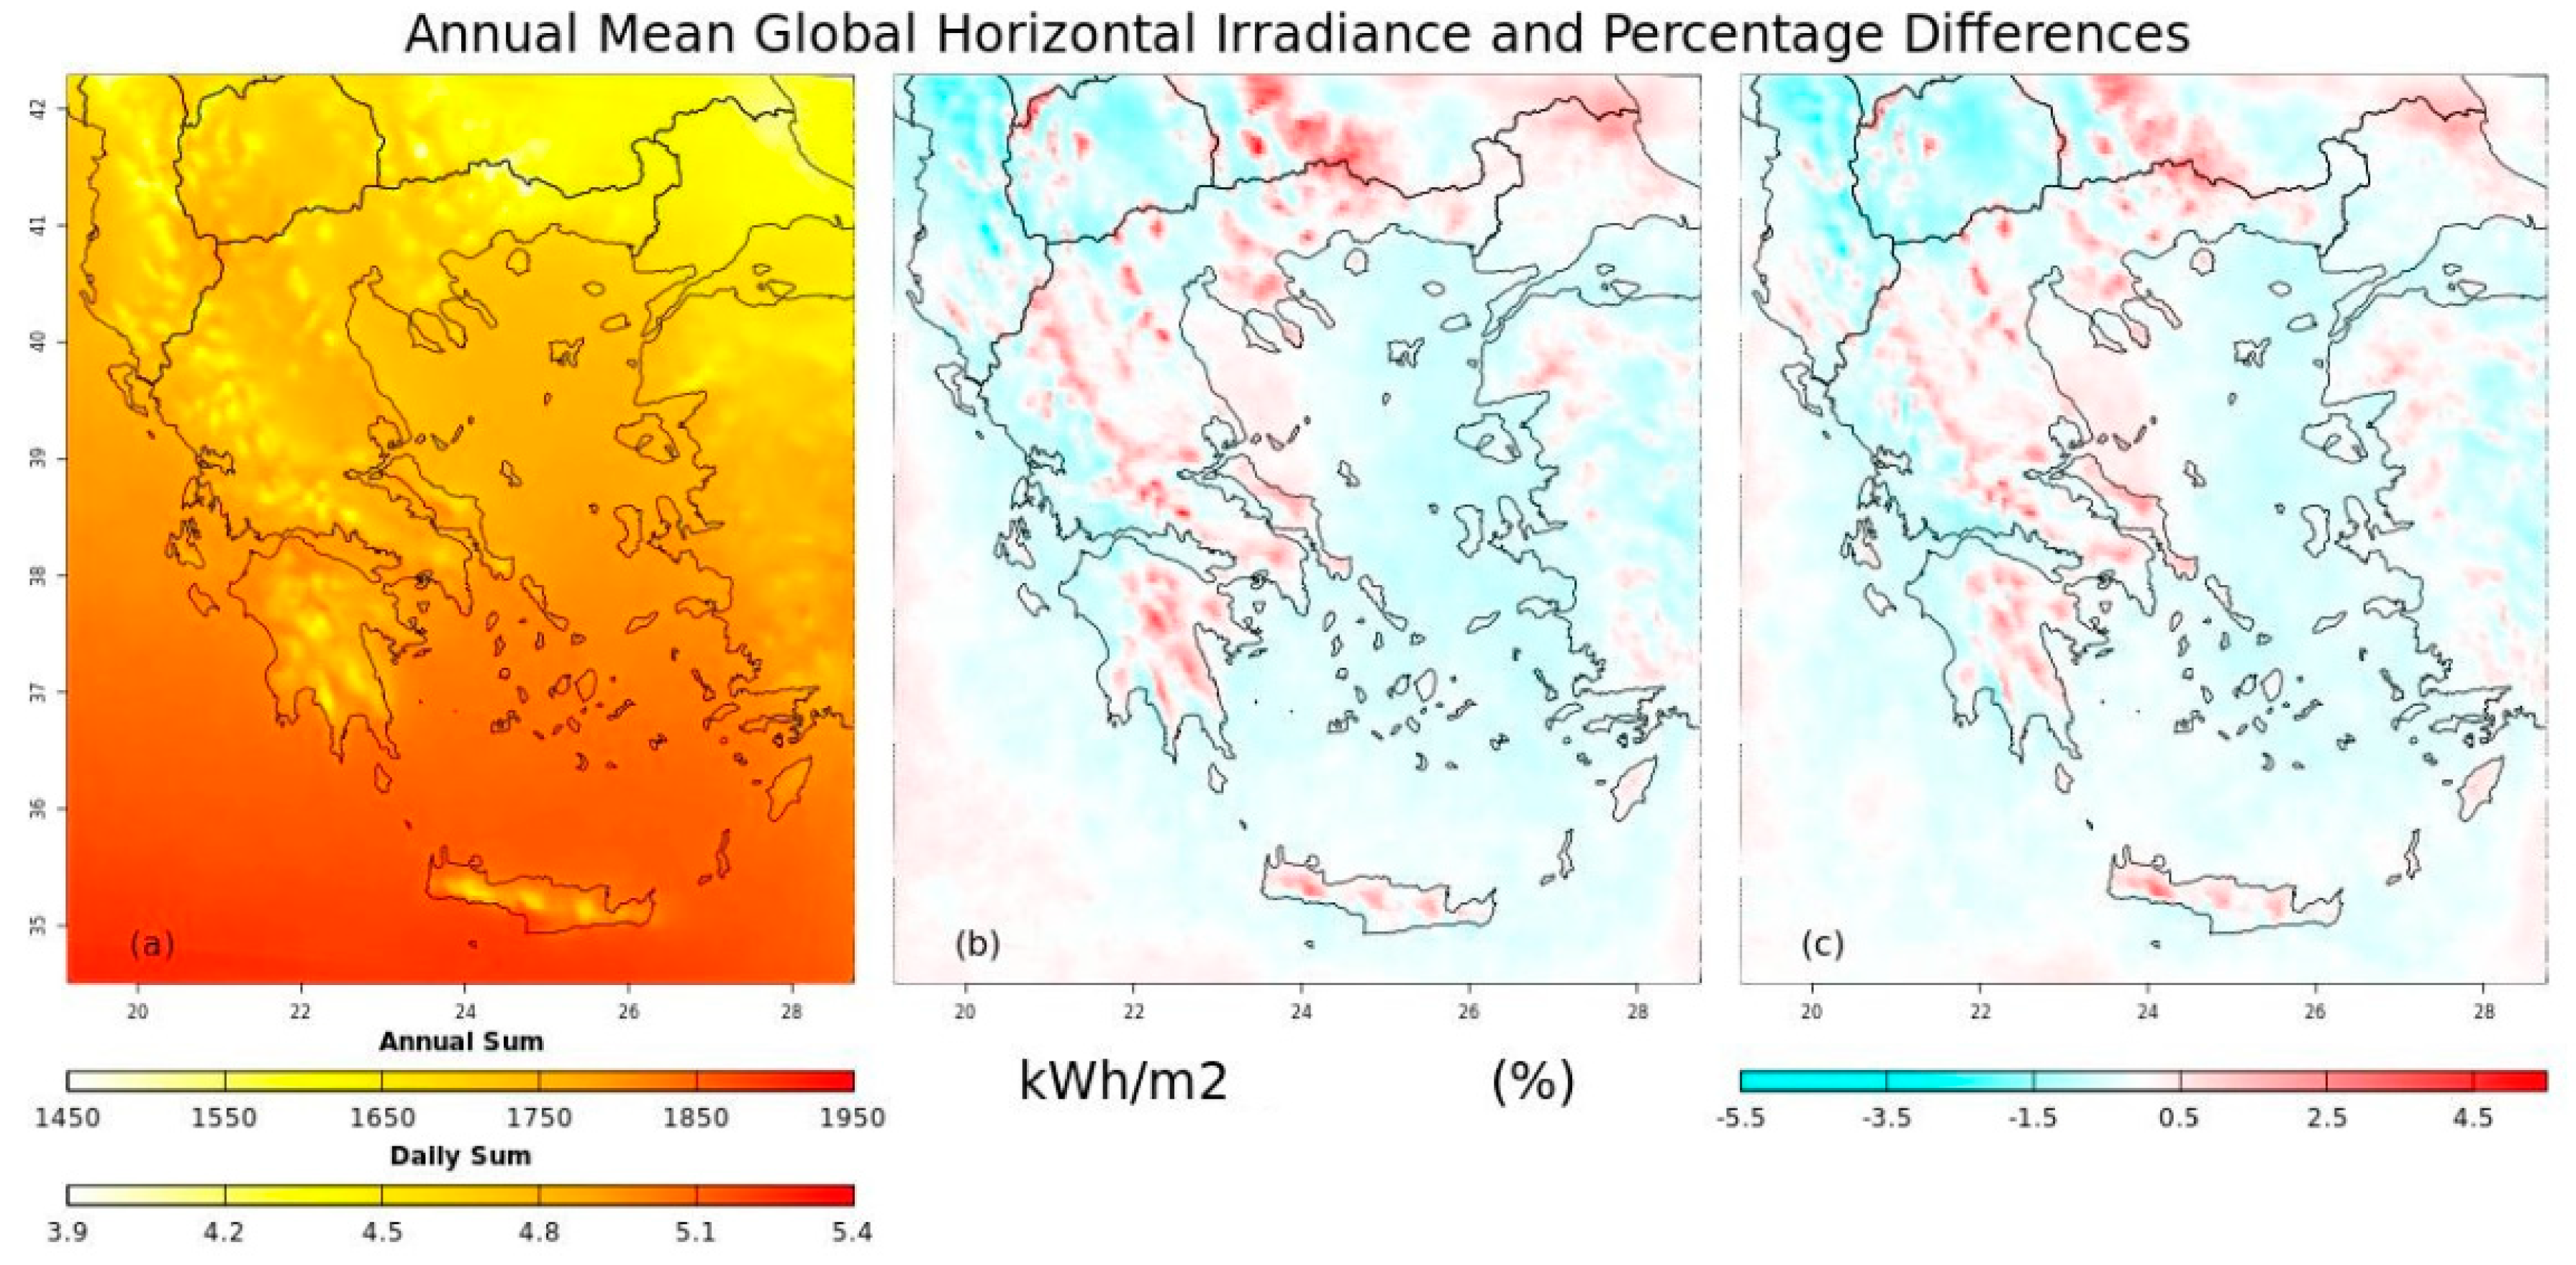
4.1. Mean Annual GHI Analysis

The computed mean annual and daily GHI for the historical period 1980–2004, using the WRF regional climate simulations at surface level, with the adjusted bias (already discussed in Section 3.1), for the Greek domain and the projected differences in the mean daily and annual sum GHI between the future (RCPs 4.5/8.5) and historical scenarios are depicted in Figure 5. In general, the geographical pattern and the different climatic zones beyond the Greek domain justify the variances among continental Greece and marine regions or coastlines at the same latitude [33].
The WRF model for the historical period (1980–2004) presented spatial distribution of the GHI and demonstrated significant agreement with similar works [15,16,17,34], with values above 1650 kWh/m2 in the broader area of central and northern Greece and GHI above 1800 kWh/m2 in the broader area of the southern marine Greek parts of the Ionian and Aegean Sea, which correspond to 4.5 and to 5.1 kWh/m2 daily GHI values, respectively. Over the southern and southeastern parts of the Aegean and Libyan Sea, the WRF model under the historical period shows values above 1850 kWh/m2. However, lack of adequate average solar potential was found at the locations of the highest altitudes, commonly observed at the mountain ridges, with values in the range of 1500 kWh/m2, which correspond to mean daily GHI values of 4.0 kWh/m2 (Figure 5).
On average, analysis of the mean annual GHI variations showed values of similar magnitude and pattern between the two future scenarios. The WRF model near-term climatology changes compared to mean historic climatology are found to be in the range of −100 to 100 kWh/m2 for both examined RCPs scenarios, which is translated to a percentage range of ±5.0%. The mean GHI values, both in future scenarios, are projected to decrease in the most marine regions of the Aegean and Ionian Seas, as well as in specific locations of the western continental parts of Greece, by the same level of magnitude (from 1.0 to 3.5%). However, both future scenarios anticipated greater increases in higher altitude locations. The most noticeable percentage increases of the GHI from 2.0 to 4.5% have been projected in the Pindus mountain range, Mount Olympus, the mountains of Crete, and so forth, where they have already been found with poor to fair quality of GHI.

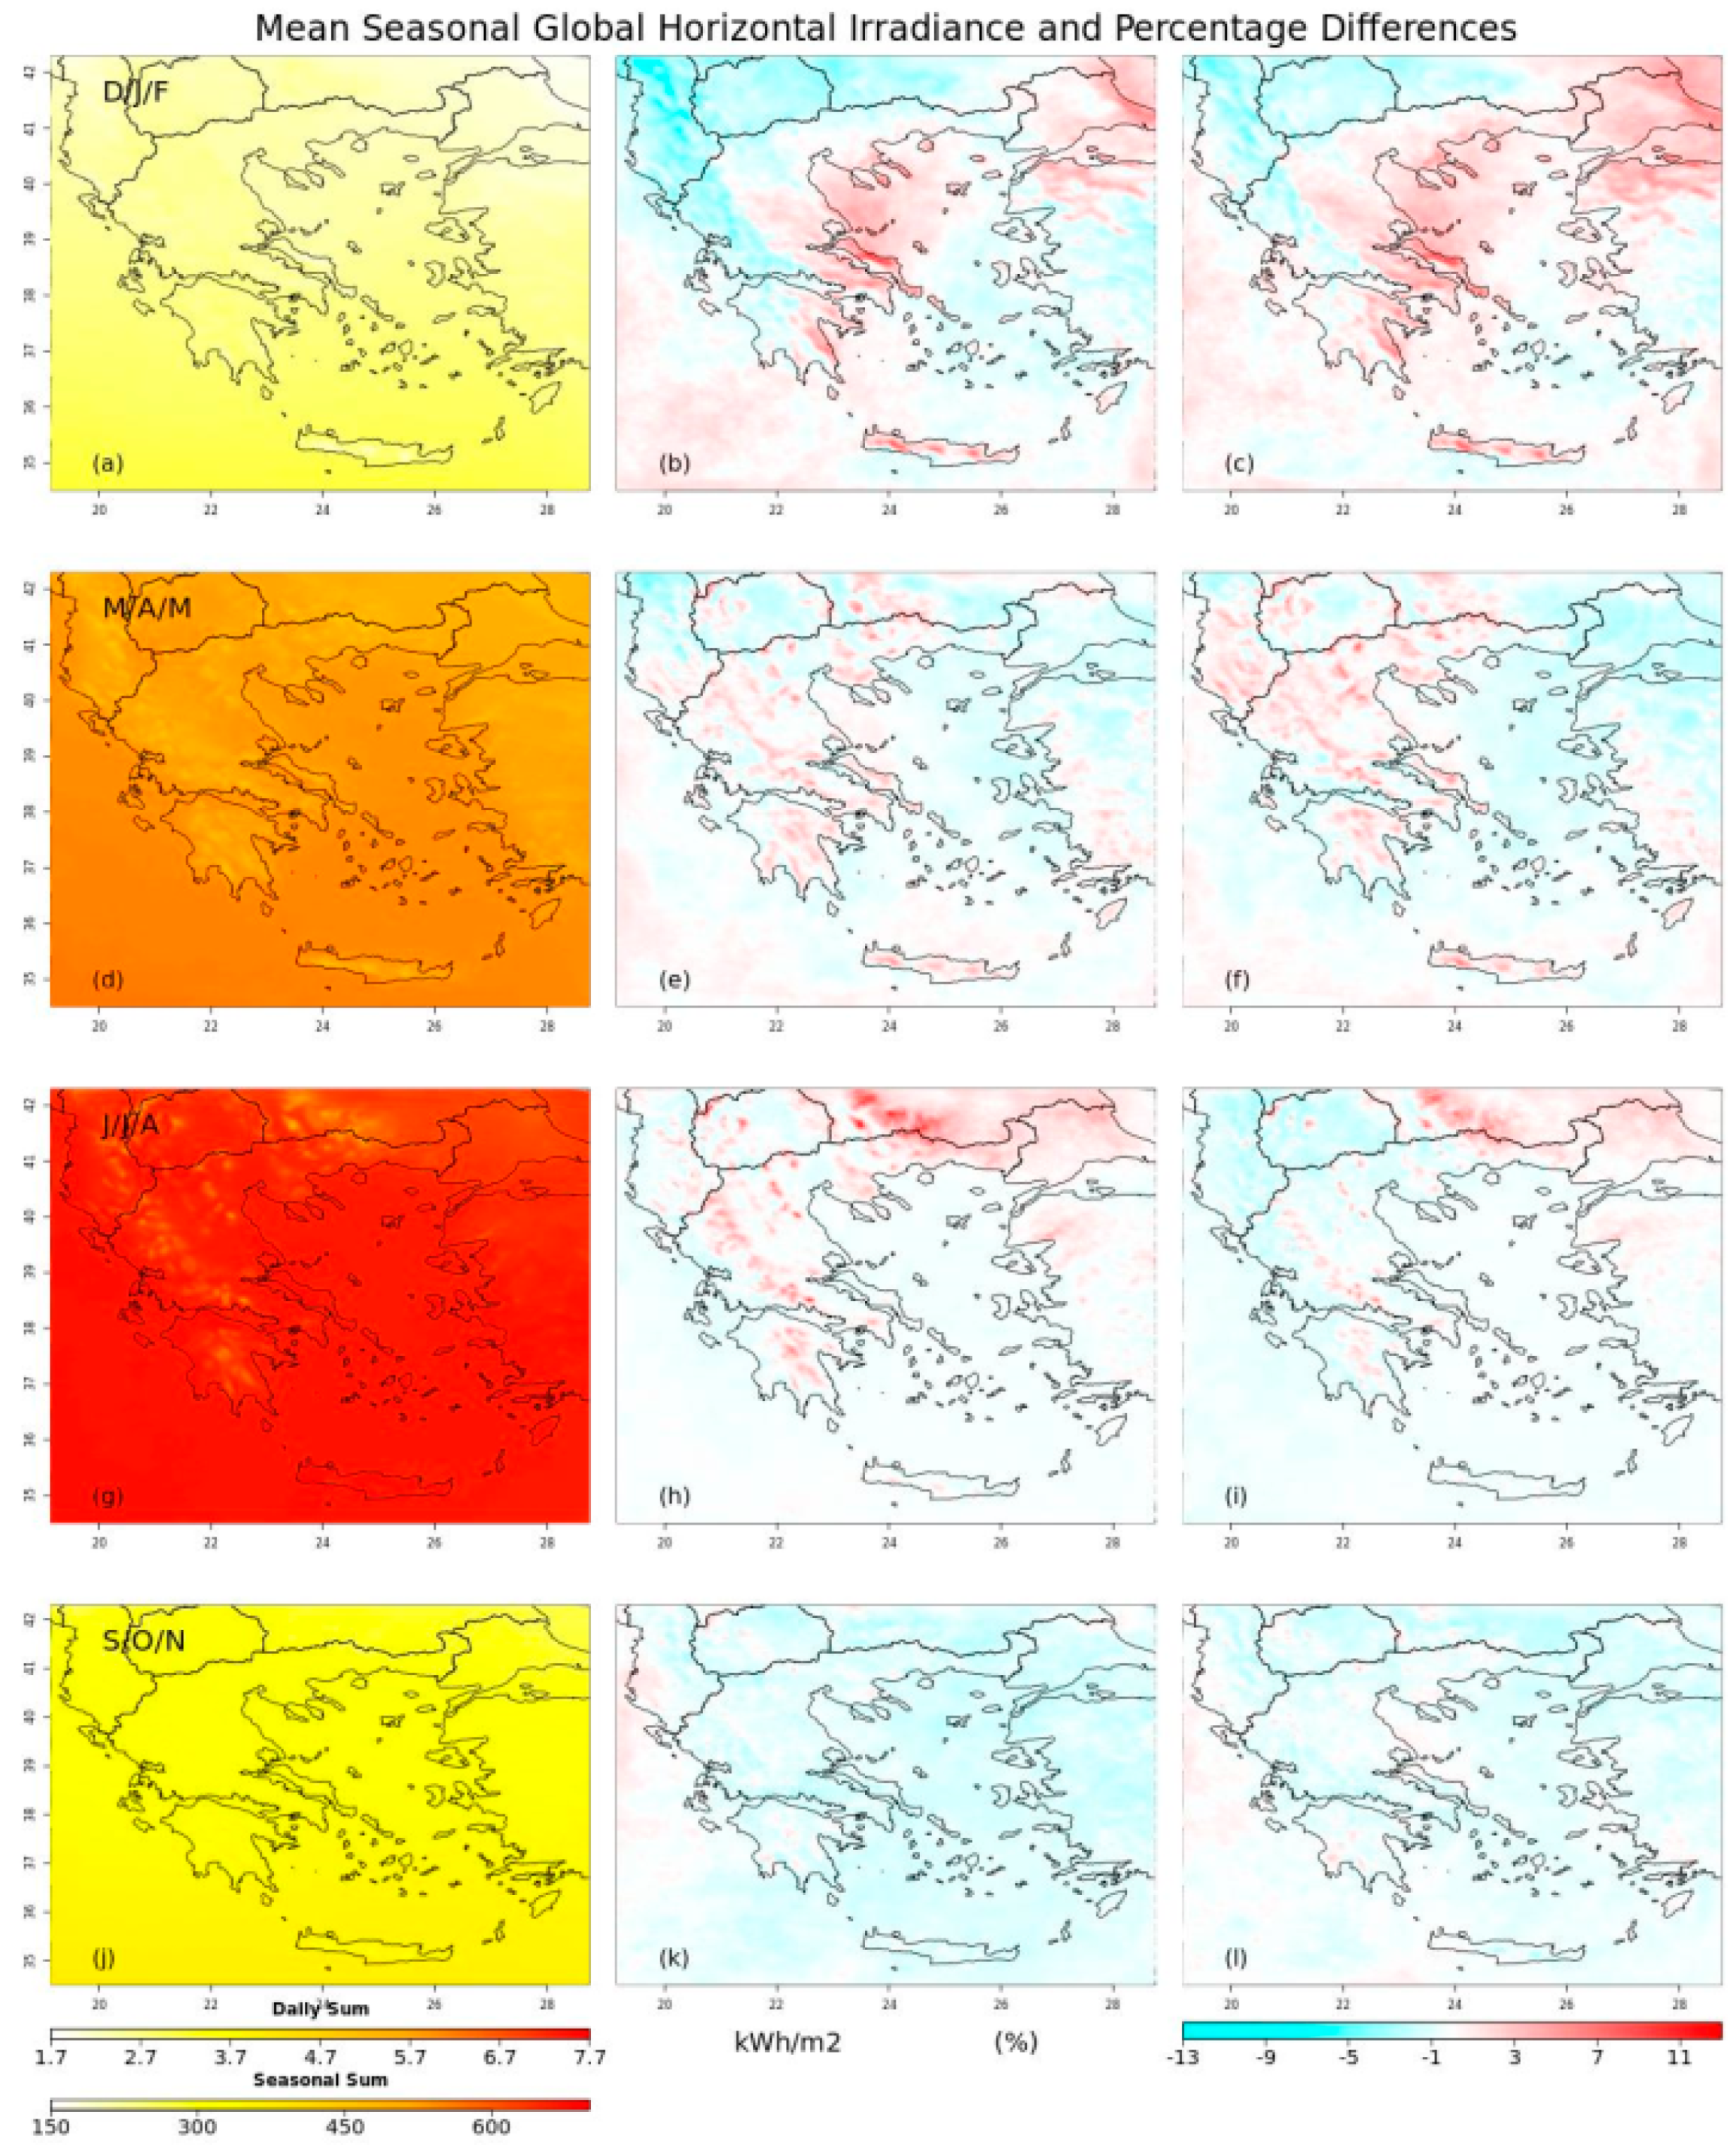
4.2. Mean Seasonal GHI Analysis

During the evaluation of the GHI seasonality in Greece, a general increase is anticipated from winter (DJF) to spring (MAM) and then to summer (JJA), as a result of the increased length of the day. Apparently, an increase of sunshine ratios from winter to summer happens as the time length of days increases and the percentage variability of sunshine also grows [33]. The smallest values of GHI hours take place in the winter months, where the cyclonic (depressions) and frontal activity increase their magnitude and frequency [33]. On average, spring (MAM) and summer are meaningfully the seasons with the greater mean seasonal GHI sum, compared to those of winter and autumn.
Regarding the seasonal analysis of the mean seasonal daily GHI, as presented in Figure 6, the most intense solar radiation is expected to occur during summer with daily GHI values to be around 6.0–7.5 kWh/m2 and immediately after the spring season (4.5–6.0 KWh/m2), which are translated to 550–700 kWh/m2 and to 400–550 kWh/m2 of seasonal GHI, respectively. On the contrary, the mean seasonal daily GHI is considerably less in autumn, with daily GHI values of the order of 2.7–4.0 kWh/m2, as well as in winter, with values in the range of 1.7–2.7 kWh/m2, which correspond to 200–350 kWh/m2 and to 150–250 kWh/m2 of seasonal GHI, respectively (Figure 6).
Comparing now the calculated differences in the mean seasonal GHI averaged over the 25 years, between the historical (1980–2004) and the future period (2020–2044), the projected changes were in the range of −13% to +12% (Figure 6).
During winter months (DJF), WRF projects for both scenarios (RCPs 4.5 and 8.5) increases in the mean seasonal GHI values for the eastern Greek mainland and in the northwestern Aegean Sea, as well as in Euboea and Crete, which might go up to 11%. However, partial increases in the mean seasonal GHI values are expected to occur further under RCP 8.5.
Throughout the spring months (MAM), a similar pattern of the seasonal mean GHI changes is anticipated in most parts of the Greek domain during the two future scenarios. In fact, slight increases are anticipated in most regions of the Greek domain, except for the marine areas in the Aegean and Ionian Sea, where minor decreases are projected.
During the summer months (JJA), both scenarios estimated increases in higher altitude locations (Pindus mountain range, Mount Olympus, etc.) and northeastern Greece, while those increases are anticipated to be higher during the RCP 4.5 scenario (7.0–10%). For the period of autumn (SON), both scenarios estimated slight decreases in the mean seasonal daily and annual GHI down to −5.0% in most parts of the Greek domain.

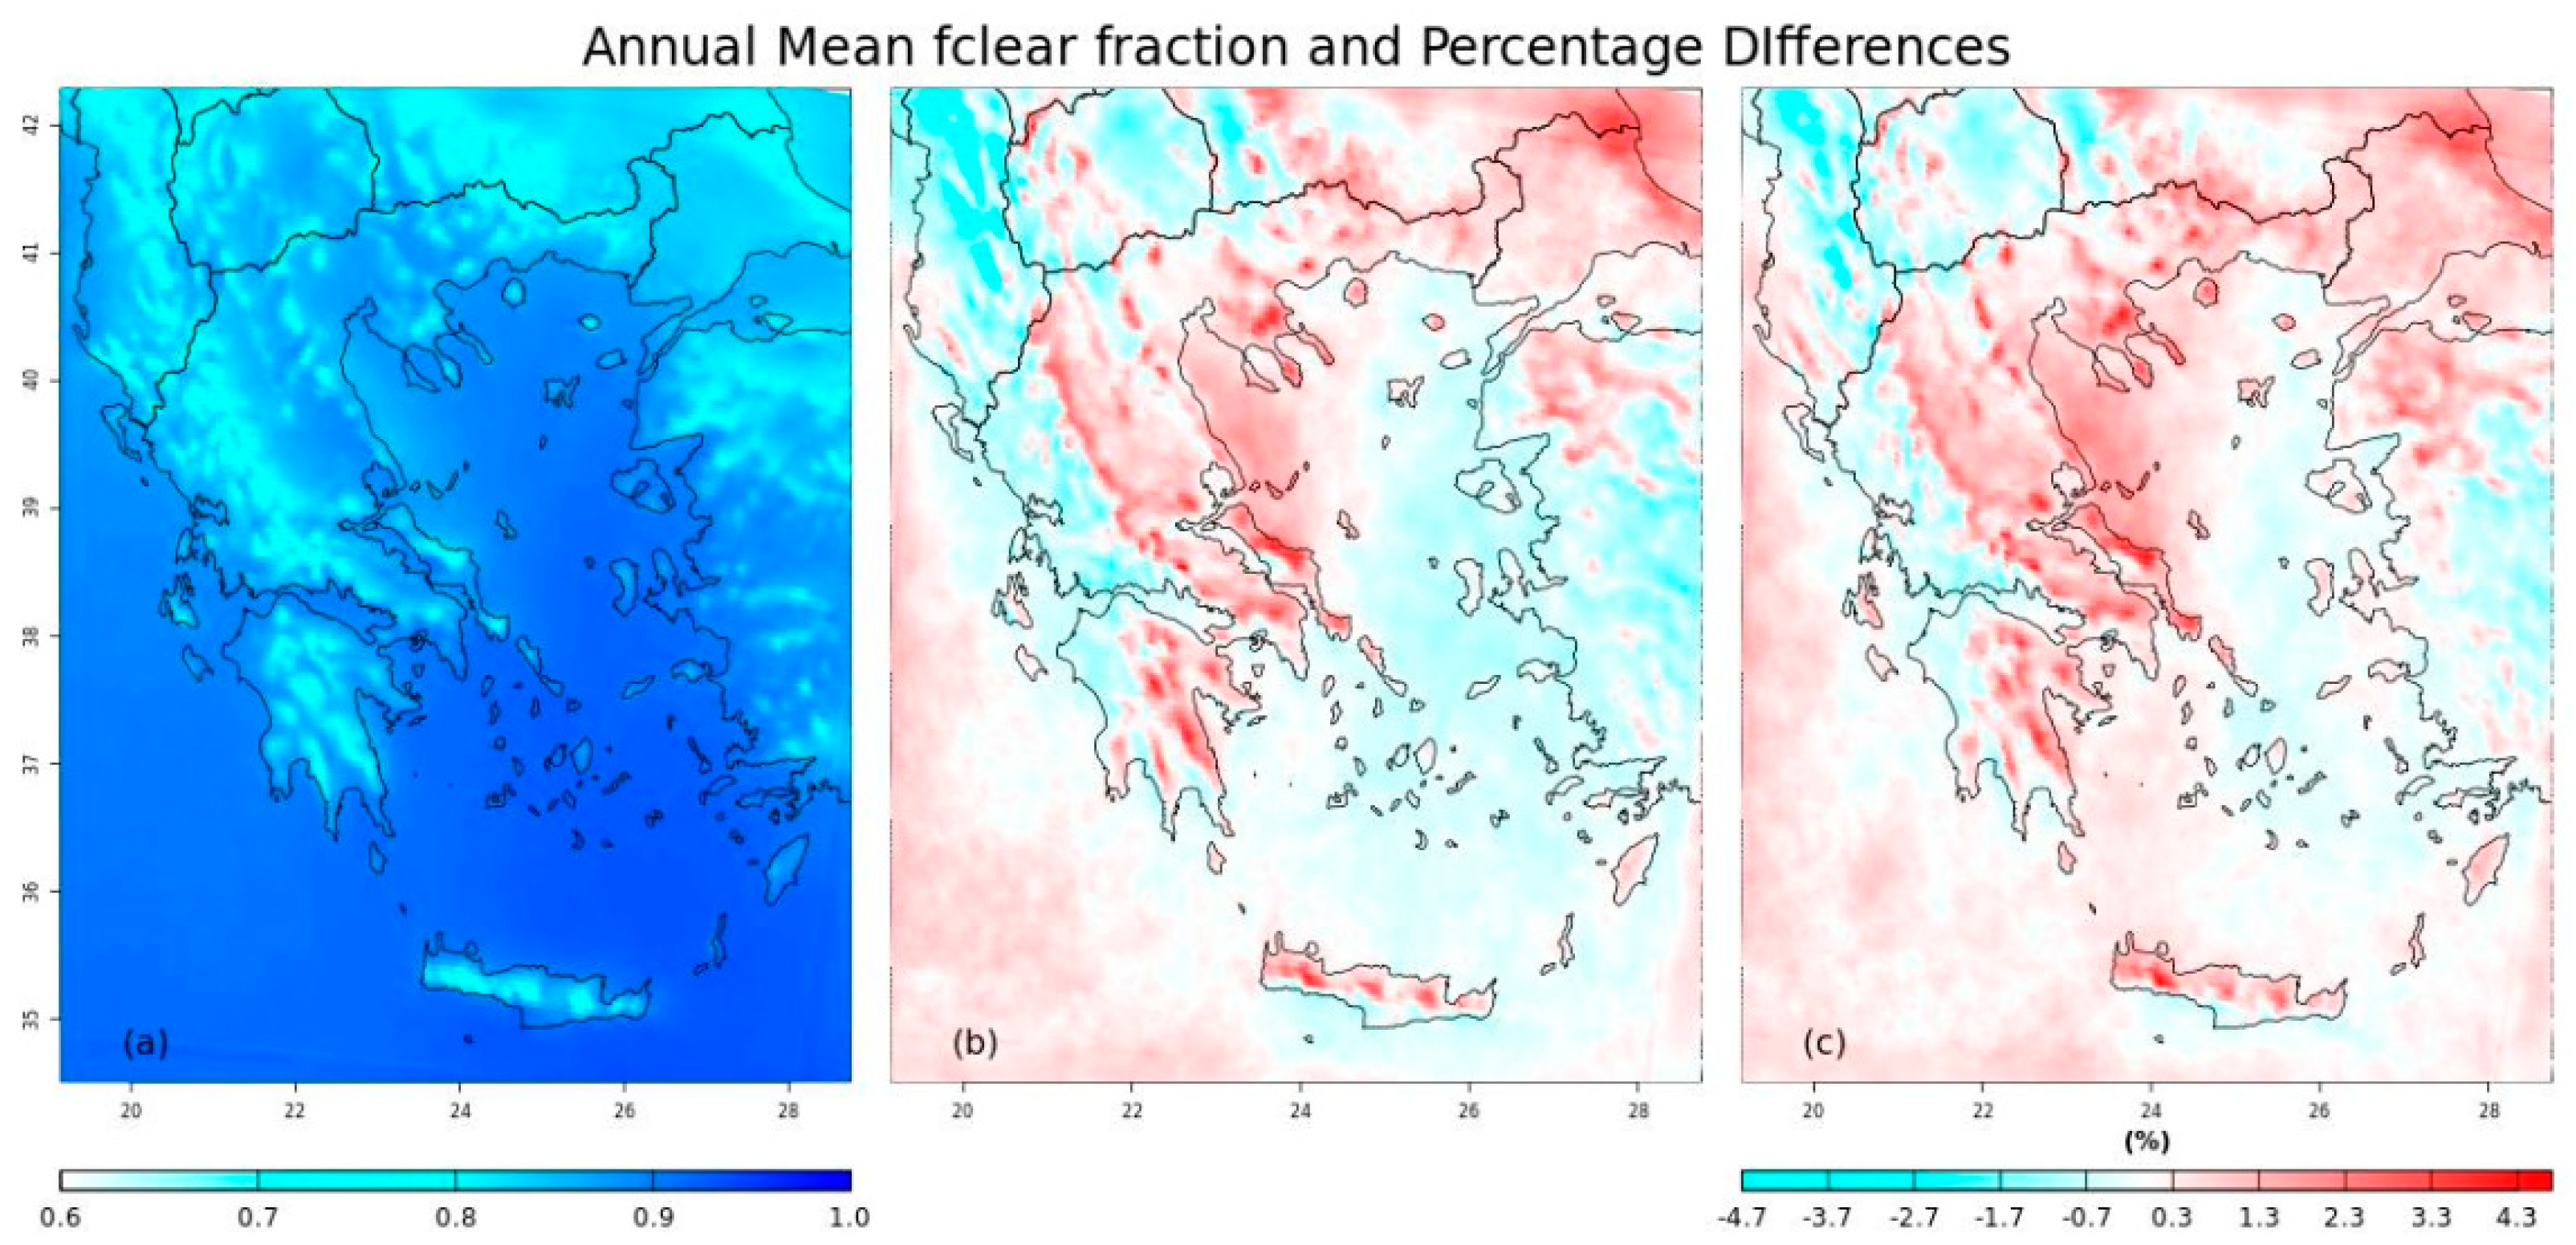
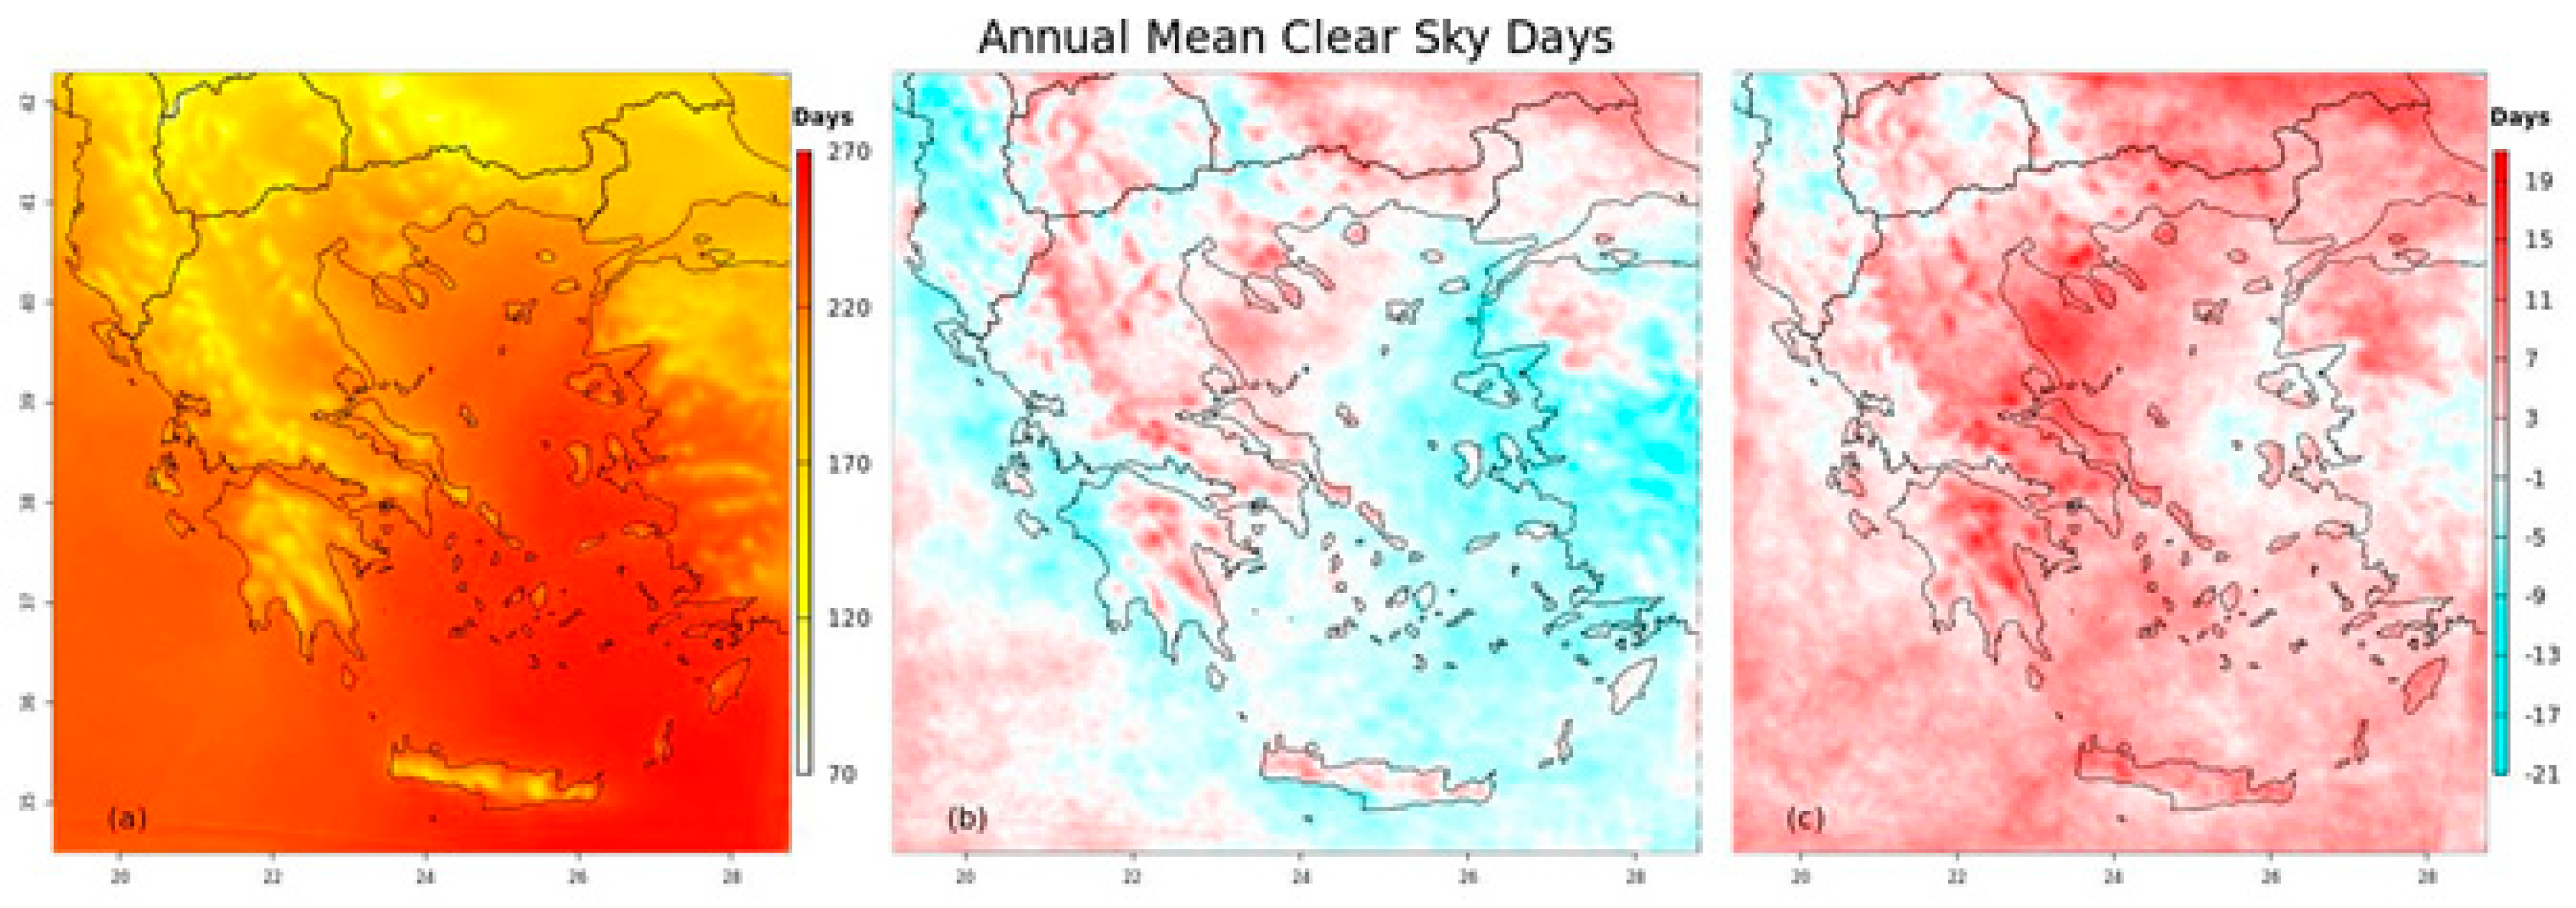
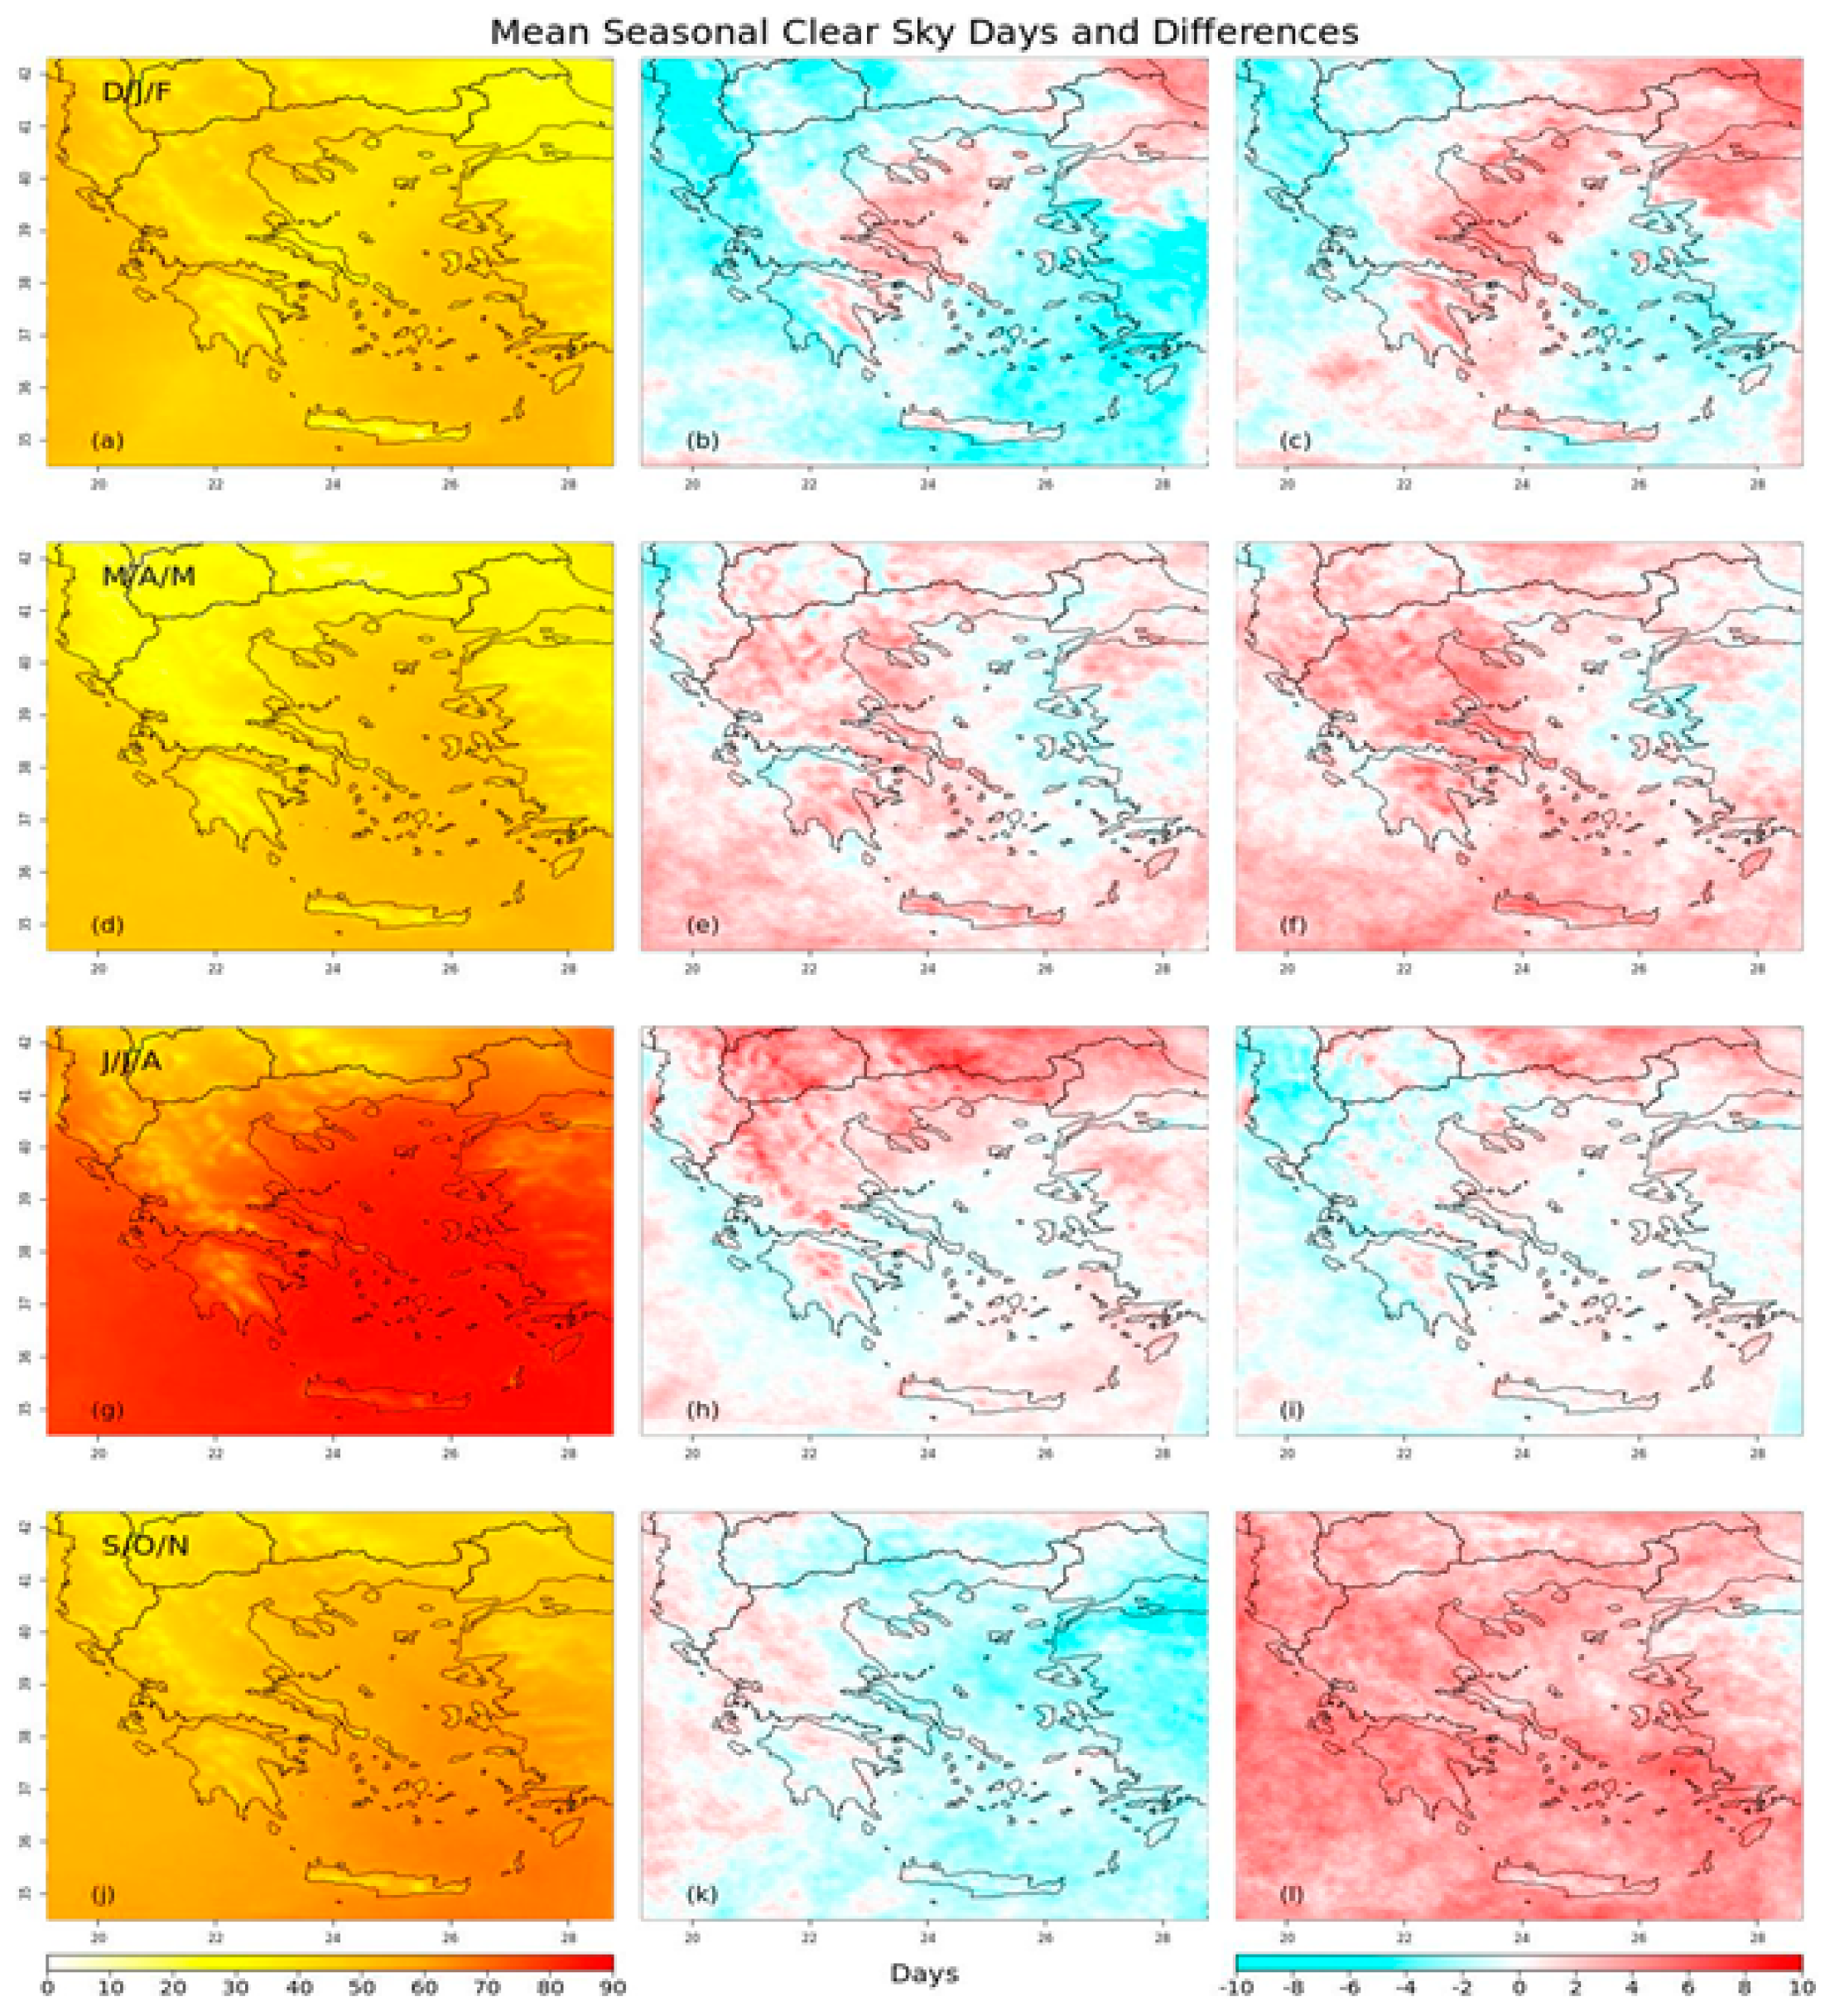
4.3. Clear-Sky Fraction- fclear -and Number of Clear-Sky Days

Aerosols and clouds are the key components in the atmosphere that reflect, transmit, or trap solar radiation and play a key role in the understanding of climate change. According to [16], in cloudy conditions, the high temporal and spatial fluctuation of cloudiness is the prime cause for the assessment of solar radiation. Also, changes in cloud coverage affect the diurnal temperature (DTR) variation, especially the maximum temperature during summer months and the minimum temperatures throughout winter, as [35] stated. However, cloud cover is a factor that cannot be smoothly simulated in climate models, as it provides a high level of uncertainty in the climate change predictions [36].
Under the prospect of this study, the mean annual fclear for the historical period 1980–2004, along with the anticipated differences between the future (RCPs 4.5/8.5) and historical scenarios, are presented in Figure 7. The WRF model for the historical period (1980–2004), as presented in Figure 7a, indicates lower mean fclear values in the high-altitude places by the order of 0.6–0.7, while marine and coastline locations show values above 0.85. As fclear is equivalent to the sunshine fraction, future changes between RCPs 4.5 and 8.5 are estimated to be in the range of ±4.5%, with the most increases up to 4.0% found in eastern and north continental Greece, as well in Euboea, Sporades, Rhodes, and Crete, while decreases down to 3.0% are projected in the western Greek mainland and in the Aegean Sea.
The mean annual and the seasonal clear-sky days for the historical period 1980–2004 for the Greek domain, along with the anticipated differences between the future (RCPs 4.5/8.5) and historical scenarios, are presented in Figure 8 and Figure 9. The WRF model for the historical period (1980–2004), as presented in Figure 8a, shows clear-sky days in the range of 120–220 per year in the Greek mainland, exceeding locally the 230 days of clear sky in coastlines, while the lowest number of clear-sky days has been observed in higher altitude locations (Pindus mountain range, Mount Olympus, etc.). The maximum number of days with cloudless sky have been detected in the marine areas of the Aegean Sea (240–270 days per year), followed by the Ionian Sea with 220–240 days per year. Results are in agreement with the climate atlas of Greece [37] provided by HNMS and with [33], which shows that the sunshine duration in most coastline and marine areas of Greece ranges above 50 and 60%, which corresponds to clear-sky days above 170 and 210 days and 2800 and 3000 h of sunshine, respectively.
On average, the differences in annual mean clear-sky days between the historic climatology are found to be in the range of ±20 days, which corresponds to percentage changes of about ±5.0% for both examined RCPs scenarios (Figure 8), which are consistent with the percentage differences in the annual mean fclear fraction (Figure 7). Overall, both scenarios indicated slight increases in the clear-sky days per year for most parts of continental Greece, except for western Greece, where decreases were found under the RCP 4.5. Results are in agreement with those of [17], who found that over western Greece, lower cloud coverage is expected, despite the fact that RCM cannot efficiently project the cloud cover conditions [38].
Further analysis of the changes between RCP 4.5 and historical scenarios indicates that increases in the mean annual clear-sky days up to 15 days are estimated for the locations of central and eastern Greek mainland and Crete, while on the other hand, decreases are likely to occur in most marine regions of the Ionian and Aegean Sea, as well as in some parts of western Peloponnese and central Macedonia. Moreover, the results revealed that anticipated increases in the mean annual clear-sky days of the order of 19 days might occur over most parts of the Greek domain under the future RCP 8.5 scenario, with Peloponnese, Boeotia, Euboea, and Thessaloniki the locations with the highest anticipated increases in the clear-sky days per year (Figure 8).
The historical scenario (1980–2004) throughout the seasonal analysis of the mean clear-sky days showed values of similar levels, from 40 to 70 days per season, for the winter and autumn months (Figure 9). During the spring months, the mean seasonal clear-sky days across continental Greece were found to be the lowest (20–50 days per season) in comparison to other seasons, while on the contrary, clear-sky days in the Greek mainland were estimated to be in the range of 50–85 days for the duration of the summer season.
Comparing now the calculated differences in the mean seasonal clear-sky days averaged over the 25 years, between the historical (1980–2004) and the future period (2020–2044), the anticipated changes were in the range of ±10 days per season (Figure 9). During the winter months (DJF), WRF projected decreases in the clear-sky days in most areas of the Greek domain under the RCP 4.5 scenario, by the order of 6 to 8 days, while increases up to 8 days will probably occur in the locations of eastern Greece (Peloponnese, Attica, Euboea, Boeotia, Sporades, and Crete). RCP 8.5 predicted increases (up to 9 days) in the clear-sky days in further parts of the eastern Greek mainland. WRF simulations also projected slight increases in the clear-sky days in the spring months (MAM) in most regions of the Greek domain, for both future scenarios (RCP 4.5 up to 5 days per season), while those days are estimated to increase spatially in magnitude and spatial level under RCP 8.5 (up to 8 days per season). During the summer months (JJA), RCP 4.5 projected a higher increase in the clear-sky days in most locations of north and northeastern continental Greece (up to 8 days), as well as in Cyclades and Crete, in comparison to the RCP 8.5 scenario. However, an opposite pattern is anticipated during the autumn months over most regions of the Greek domain among the two future scenarios, while increases (up to 8 days per season) are likely to occur under RCP 8.5, in contrast to the slight decreases in the clear-sky days under the RCP 4.5 scenario.

5. Discussion and Conclusions

This study focused on the evaluation of the anticipated changes in mean daily, annual, and seasonal GHI and in the development of a high-resolution solar climate atlas for Greece under climate change, with the use of a very high-resolution—5 × 5 km2—regional climate model. Thus, a new solar atlas was produced, which can provide useful information to the country’s climate change adaptation policy, stakeholders’ long-term planning, and RET community activities under the growing demand for more efficient solar technologies. This work was a first step towards obtaining a high-resolution solar climate atlas in Greece, with some limitations due to the limited number of formally available observational data.
The analysis was conducted for the historical period 1980–2004 and the future period 2020–2044, under the RCPs 4.5 and 8.5 emissions scenarios that represent intermediate and worst-case scenarios, respectively. In general, the geographical pattern and the different climatic zones beyond the Greek domain justify the variances across continental Greece and marine areas or coastlines at the same latitude. In Greece, noteworthy changes have already been indicated across continental country, coastal, or marine regions, even located in similar latitudes, affecting the cloud temporal and spatial variability, as a matter of the different topographical characteristics and of the diverse climate pattern over the Greek domain [16]. The WRF model for the historical period (1980–2004) presented spatial distribution of the GHI and demonstrated significant agreement with similar works [15,16,17,34], with values above 1600 kWh/m2 in the broader area of central and northern Greece, and above 1800 kWh/m2 in the broader area of the southern marine Greek parts of the Ionian and Aegean Sea. However, lack of adequate average solar potential was calculated at the locations of the highest altitudes, commonly found at the mountain ridges.
On average, analysis of the mean annual GHI variations showed values of similar magnitude and pattern between the two future scenarios, while differences among future and historical scenarios were found to be in the range of ±100 kWh/m2, which is translated to a percentage range of ±5.5%. Moreover, seasonal analysis indicated increases in the mean seasonal GHI values for the eastern Greek mainland and in the northwestern Aegean Sea, as well as in Euboea and Crete, which were up to 11% for both scenarios (RCPs 4.5 and 8.5). Slight decreases in the mean seasonal daily and annual GHI down to −5.0%, under the future scenarios, were projected for most parts of the Greek domain.
As the impact of clouds decrease the GHI and thus the energy generation of a solar system, the fclear and the mean annual and the seasonal clear-sky days have been studied, indicating that the differences in annual mean clear-sky days between the historic and future climatology could be in the range of ±4.5 and ±5.0%, respectively. This finding helps to anticipate mainly increases in the fraction of time, with no significant clouds blocking the sun in the eastern and northeastern parts of the Greek mainland under both future scenarios. In addition, increases in clear-sky days under RCP 8.5 and decreases for the western parts of Greece under RCP 4.5 were found, which are in agreement with the results of [17].
Concluding, the study indicates that GHI might be affected from climate change in the future. The annual changes were found to be small and in the order of ±5.0%, while the seasonal changes were shown to be in the range of ±10%. As the PV and solar systems’ cumulative capacities are increased further and further across Greece, future research should additionally focus on the climate effects of the projected changes in GHI and temperature in the efficiency of a broad number of PV and solar systems. To meet the growing demand in solar energy applications, the installation of more accurate monitoring systems could help to validate more efficiently the future projection changes obtained with models.

Author Contributions

Conceptualization, A.S.; data curation, T.K.; formal analysis I.M.; investigation, T.K.; methodology, T.K. and A.S.; resources, N.P.; validation, T.K. and N.P.; software and visualization, I.M.; supervision, D.V.; writing-original draft, T.K.; writing-review and editing, D.V. and A.S. All authors have read and agreed to the published version of the manuscript.

Funding

This research received no external funding.

Acknowledgments

This work was supported by computational time granted from the Greek Research & Technology Network (GRNET) in the National HPC facility—ARIS—under projects ID HRCOG (pr004020) and HRPOG (pr006028).

Conflicts of Interest

The authors declare no conflict of interest.

References

  1. REN21. Renewables 2019—Global Status Report; REN21 Secretariat: Paris, France, 2019. [Google Scholar]
  2. Chowdhury, M.S.; Rahman, K.S.; Chowdhury, T.; Nuthammachot, N.; Techato, K.; Akhtaruzzaman, M.; Tiong, S.K.; Sopian, K.; Amin, N. An overview of solar photovoltaic panels’ end-of-life material recycling. Energy Strategy Rev. 2020, 27, 100431. [Google Scholar] [CrossRef]
  3. Huang, W.-H.; Shin, W.J.; Wang, L.; Sun, W.-C.; Tao, M. Strategy and technology to recycle wafer-silicon solar modules. Sol. Energy 2017, 144, 22–31. [Google Scholar] [CrossRef] [Green Version]
  4. Schaeffer, R.; Szklo, A.S.; Pereira de Lucena, A.F.; Moreira Cesar Borba, B.S.; Pinheiro Pupo Nogueira, L.; Pereira Fleming, F.; Troccoli, A.; Harrison, M.; Sadeck Boulahya, M. Energy sector vulnerability to climate change: A review. Energy 2012, 38, 1–12. [Google Scholar] [CrossRef]
  5. Liu, D.L.; Scott, B.J. Estimation of solar radiation in Australia from rainfall and temperature observations. Agric. For. Meteorol. 2001, 106, 41–59. [Google Scholar] [CrossRef]
  6. Martín, L.; Zarzalejo, L.F.; Polo, J.; Navarro, A.; Marchante, R.; Cony, M. Prediction of global solar irradiance based on time series analysis: Application to solar thermal power plants energy production planning. Sol. Energy 2010, 84, 1772–1781. [Google Scholar] [CrossRef]
  7. Mathiesen, P.; Kleissl, J. Evaluation of numerical weather prediction for intra-day solar forecasting in the continental United States. Sol. Energy 2011, 85, 967–977. [Google Scholar] [CrossRef] [Green Version]
  8. Ma, W.W.; Rasul, M.G.; Liu, G.; Li, M.; Tan, X.H. Climate change impacts on techno-economic performance of roof PV solar system in Australia. Renew. Energy 2016, 88, 430–438. [Google Scholar] [CrossRef]
  9. Pan, Z.; Segal, M.; Arritt, R.W.; Takle, E.S. On the potential change in solar radiation over the US due to increases of atmospheric greenhouse gases. Renew. Energy 2004, 29, 1923–1928. [Google Scholar] [CrossRef]
  10. Crook, J.A.; Jones, L.A.; Forster, P.M.; Crook, R. Climate change impacts on future photovoltaic and concentrated solar power energy output. Energy Environ. Sci. 2011, 4, 3101. [Google Scholar] [CrossRef]
  11. Müller, J.; Mitra, I.; Mieslinger, T.; Meyer, R.; Chhatbar, K.; Gomathinayagam, S.; Giridhar, G. Towards building solar in India—A combined mapping and monitoring approach for creating a new solar atlas. Energy Sustain. Dev. 2017, 40, 31–40. [Google Scholar] [CrossRef]
  12. Šúri, M.; Huld, T.A.; Dunlop, E.D.; Ossenbrink, H.A. Potential of solar electricity generation in the European Union member states and candidate countries. Sol. Energy 2007, 81, 1295–1305. [Google Scholar] [CrossRef]
  13. Huld, T.; Müller, R.; Gambardella, A. A new solar radiation database for estimating PV performance in Europe and Africa. Sol. Energy 2012, 86, 1803–1815. [Google Scholar] [CrossRef]
  14. Burnett, D.; Barbour, E.; Harrison, G.P. The UK solar energy resource and the impact of climate change. Renew. Energy 2014, 71, 333–343. [Google Scholar] [CrossRef] [Green Version]
  15. Kazadzis, S.; Founda, D.; Psiloglou, B.E.; Kambezidis, H.; Mihalopoulos, N.; Sanchez-Lorenzo, A.; Meleti, C.; Raptis, P.I.; Pierros, F.; Nabat, P. Long-term series and trends in surface solar radiation in Athens, Greece. Atmos. Chem. Phys. 2018, 18, 2395–2411. [Google Scholar] [CrossRef] [Green Version]
  16. Kazantzidis, A.; Nikitidou, E.; Salamalikis, V.; Tzoumanikas, P.; Zagouras, A. New challenges in solar energy resource and forecasting in Greece. Int. J. Sustain. Energy 2018, 37, 428–435. [Google Scholar] [CrossRef]
  17. Panagea, I.S.; Tsanis, I.K.; Koutroulis, A.G.; Grillakis, M.G. Climate Change Impact on Photovoltaic Energy Output: The Case of Greece. Adv. Meteorol. 2014, 2014, 1–11. [Google Scholar] [CrossRef]
  18. Politi, N.; Sfetsos, A.; Vlachogiannis, D.; Nastos, P.T.; Karozis, S. A Sensitivity Study of High-Resolution Climate Simulations for Greece. Climate 2020, 8, 44. [Google Scholar] [CrossRef] [Green Version]
  19. Politi, N.; Nastos, P.T.; Sfetsos, A.; Vlachogiannis, D.; Dalezios, N.R. Evaluation of the AWR-WRF model configuration at high resolution over the domain of Greece. Atmos. Res. 2018, 208, 229–245. [Google Scholar] [CrossRef]
  20. ECA&D Daily Data. Available online: https://www.ecad.eu/dailydata/index.php (accessed on 5 February 2020).
  21. Klein Tank, A.M.G.; Wijngaard, J.B.; Können, G.P.; Böhm, R.; Demarée, G.; Gocheva, A.; Mileta, M.; Pashiardis, S.; Hejkrlik, L.; Kern-Hansen, C.; et al. Daily dataset of 20th-century surface air temperature and precipitation series for the European Climate Assessment: EUROPEAN TEMPERATURE AND PRECIPITATION SERIES. Int. J. Climatol. 2002, 22, 1441–1453. [Google Scholar] [CrossRef]
  22. Skamarock, W.C.; Klemp, J.B.; Dudhia, J.; Gill, D.O.; Barker, D.M.; Duda, M.G.; Huang, X.-Y.; Wang, W.; Powers, J.G. A Description of the Advanced Research WRF; National Center for Atmospheric Research: Boulder, CO, USA, 2008. [Google Scholar]
  23. Dee, D.P.; Uppala, S.M.; Simmons, A.J.; Berrisford, P.; Poli, P.; Kobayashi, S.; Andrae, U.; Balmaseda, M.A.; Balsamo, G.; Bauer, P.; et al. The ERA-Interim reanalysis: Configuration and performance of the data assimilation system. Q. J. R. Meteorol. Soc. 2011, 137, 553–597. [Google Scholar] [CrossRef]
  24. Doblas-Reyes, F.J.; Navarro, J.C.; Batté, L.; Volpi, D.; Acosta, M.; Bellprat, O.; Bilbao, R.; Castrillo, M.; Fučkar, N.; Guemas, V.; et al. Using EC-Earth for climate prediction research. ECMWF Newsl. 2018. [Google Scholar] [CrossRef]
  25. SolarGIS. Solar Data behind the Maps. Available online: https://solargis.com/maps-and-gis-data/tech-specs (accessed on 15 April 2020).
  26. Dai, A.; Trenberth, K.E.; Karl, T.R. Effects of Clouds, Soil Moisture, Precipitation, and Water Vapor on Diurnal Temperature Range. J. Clim. 1999, 12, 23. [Google Scholar] [CrossRef]
  27. Suehrcke, H. On the relationship between duration of sunshine and solar radiation on the earth’s surface: Ångström’s equation revisited. Sol. Energy 2000, 68, 417–425. [Google Scholar] [CrossRef]
  28. The World Bank. Source: Global Solar Atlas 2.0-Solar Resource Data: Solargis; The World Bank: Washington, DC, USA, 2020; Available online: https://solargis.com/maps-and-gis-data/download/greece (accessed on 6 February 2020).
  29. Arima, Y.; Ooka, R.; Kikumoto, H. Bias correction method for solar radiation based on quantile mapping to provide weather data for building energy simulations. J. Environ. Eng. Trans. AIJ 2016, 81, 1047–1054. [Google Scholar] [CrossRef] [Green Version]
  30. Frank, C.W.; Wahl, S.; Keller, J.D.; Pospichal, B.; Hense, A.; Crewell, S. Bias correction of a novel European reanalysis data set for solar energy applications. Sol. Energy 2018, 164, 12–24. [Google Scholar] [CrossRef]
  31. Diagne, M.; David, M.; Boland, J.; Schmutz, N.; Lauret, P. Post-processing of solar irradiance forecasts from WRF model at Reunion Island. Sol. Energy 2014, 105, 99–108. [Google Scholar] [CrossRef]
  32. GEO-CRADLE Project. The Solar Atlas of Greece (1999–2013). Available online: http://datahub.geocradle.eu/solar/ (accessed on 7 February 2020).
  33. Matzarakis, A.P.; Katsoulis, V.D. Sunshine duration hours over the Greek region. Theor. Appl. Climatol. 2006, 83, 107–120. [Google Scholar] [CrossRef]
  34. Martinopoulos, G.; Tsalikis, G. Diffusion and adoption of solar energy conversion systems—The case of Greece. Energy 2018, 144, 800–807. [Google Scholar] [CrossRef]
  35. Haylock, M.R.; Hofstra, N.; Klein Tank, A.M.G.; Klok, E.J.; Jones, P.D.; New, M. A European daily high-resolution gridded data set of surface temperature and precipitation for 1950–2006. J. Geophys. Res. 2008, 113, D20119. [Google Scholar] [CrossRef] [Green Version]
  36. Trenberth, K.E.; Fasullo, J.T. Global warming due to increasing absorbed solar radiation: Global warming by solar radiation. Geophys. Res. Lett. 2009, 36. [Google Scholar] [CrossRef] [Green Version]
  37. HNMS Climate Atlas of Greece (1971–2000). Available online: http://climatlas.hnms.gr/sdi/ (accessed on 25 February 2020).
  38. Jacob, D.; Petersen, J.; Eggert, B.; Alias, A.; Christensen, O.B.; Bouwer, L.M.; Braun, A.; Colette, A.; Déqué, M.; Georgievski, G.; et al. EURO-CORDEX: New high-resolution climate change projections for European impact research. Reg. Environ. Chang. 2014, 14, 563–578. [Google Scholar] [CrossRef]
Figure 1. Flow process of the implemented methodology for the high-resolution solar climate atlas under climate change.
Atmosphere 11 00761 g001
Figure 2. Weather Research and Forecasting (WRF) model domains: d01-EU coarse domain with 20 km, and the innermost d02-GR domain covering Greece (5 km).
Atmosphere 11 00761 g002
Figure 3. Comparison chart of monthly Global Horizontal Irradiation (GHI) (W/m2) climatology for the selected stations.
Atmosphere 11 00761 g003
Figure 4. Mean annual GHI values calculated from WRF simulations under the historical scenario (1980–2004), and the locations of the selected meteorological stations, during the process of the qualitative comparison.
Atmosphere 11 00761 g004
Figure 5. Mean annual GHI values at historic period (a) and percentage differences with (b) Representative Concentration Pathway (RCP) 4.5 and (c) RCP8.5 scenarios.
Atmosphere 11 00761 g005
Figure 6. Mean seasonal GHI daily and annual sum (a,d,g,f) at historical period and comparison with (b,e,h,k) RCP 4.5 and (c,f,i,l) RCP 8.5 scenarios.
Atmosphere 11 00761 g006
Figure 7. Mean annual fclear variable of (a) historical period and changes with (b) RCP 4.5 and (c) RCP 8.5 scenarios.
Atmosphere 11 00761 g007
Figure 8. Mean annual clear-sky days of (a) historical period and changes with (b) RCP 4.5 and (c) RCP 8.5 scenarios.
Atmosphere 11 00761 g008
Figure 9. Mean seasonal clear-sky days of (a,d,g,f) historical period and numerical change to (b,e,h,k) RCP 4.5 and (c,f,i,l) RCP 8.5 scenarios.
Atmosphere 11 00761 g009
Table 1. Statistical comparison between Weather Research and Forecasting (WRF) climatology, European Climate Assessment (ECA) dataset, and the corrected (*) with the average bias WRF dataset.
LocationsLATLONTime Period of Valid MeasurementsCORBIAS (W/m2)MAPE (%)RMSE (W/m2)COR *BIAS * (W/m2)MAPE * (%)RMSE * (W/m2)
WRF direct outputWRF bias corrected output
Athens37.5823.43(1980–1985)0.9837.4222.4041.720.98−19.7216.5127.00
Arta39.1021.00(1980–1990)0.9967.6453.7069.240.9910.5111.3918.14
Aliartos38.2323.06(1980–1990)0.9956.4540.7358.130.99−0.6811.2713.90
Sikiwna37.5922.44(1980–1990)0.9955.7439.9457.490.99−1.3911.4414.13
Andravida37.5521.17(1980–1989)0.9953.7842.0355.040.99−3.359.9212.17
Argos37.3622.47(1983–1990)0.9962.7441.9966.210.995.6015.2521.91
Thessaloniki40.3822.58(1992–2002)1.0066.1648.5568.291.009.0311.5519.17

