Post-Earthquake Recovery Phase Monitoring and Mapping Based on UAS Data

 , ,
, ,  ,
,  ,
,
Abstract
:1. Introduction
- The usability of UASs 4K video footage in accurately producing 2D and 3D information able to provide urban and rural landscape changes during the recovery phase of a catastrophic earthquake event.
- The automation of geoinformation processing aiming to detect and map the demolished buildings based on multitemporal 3D information (3D point cloud and DSM).
2. Materials and Methods
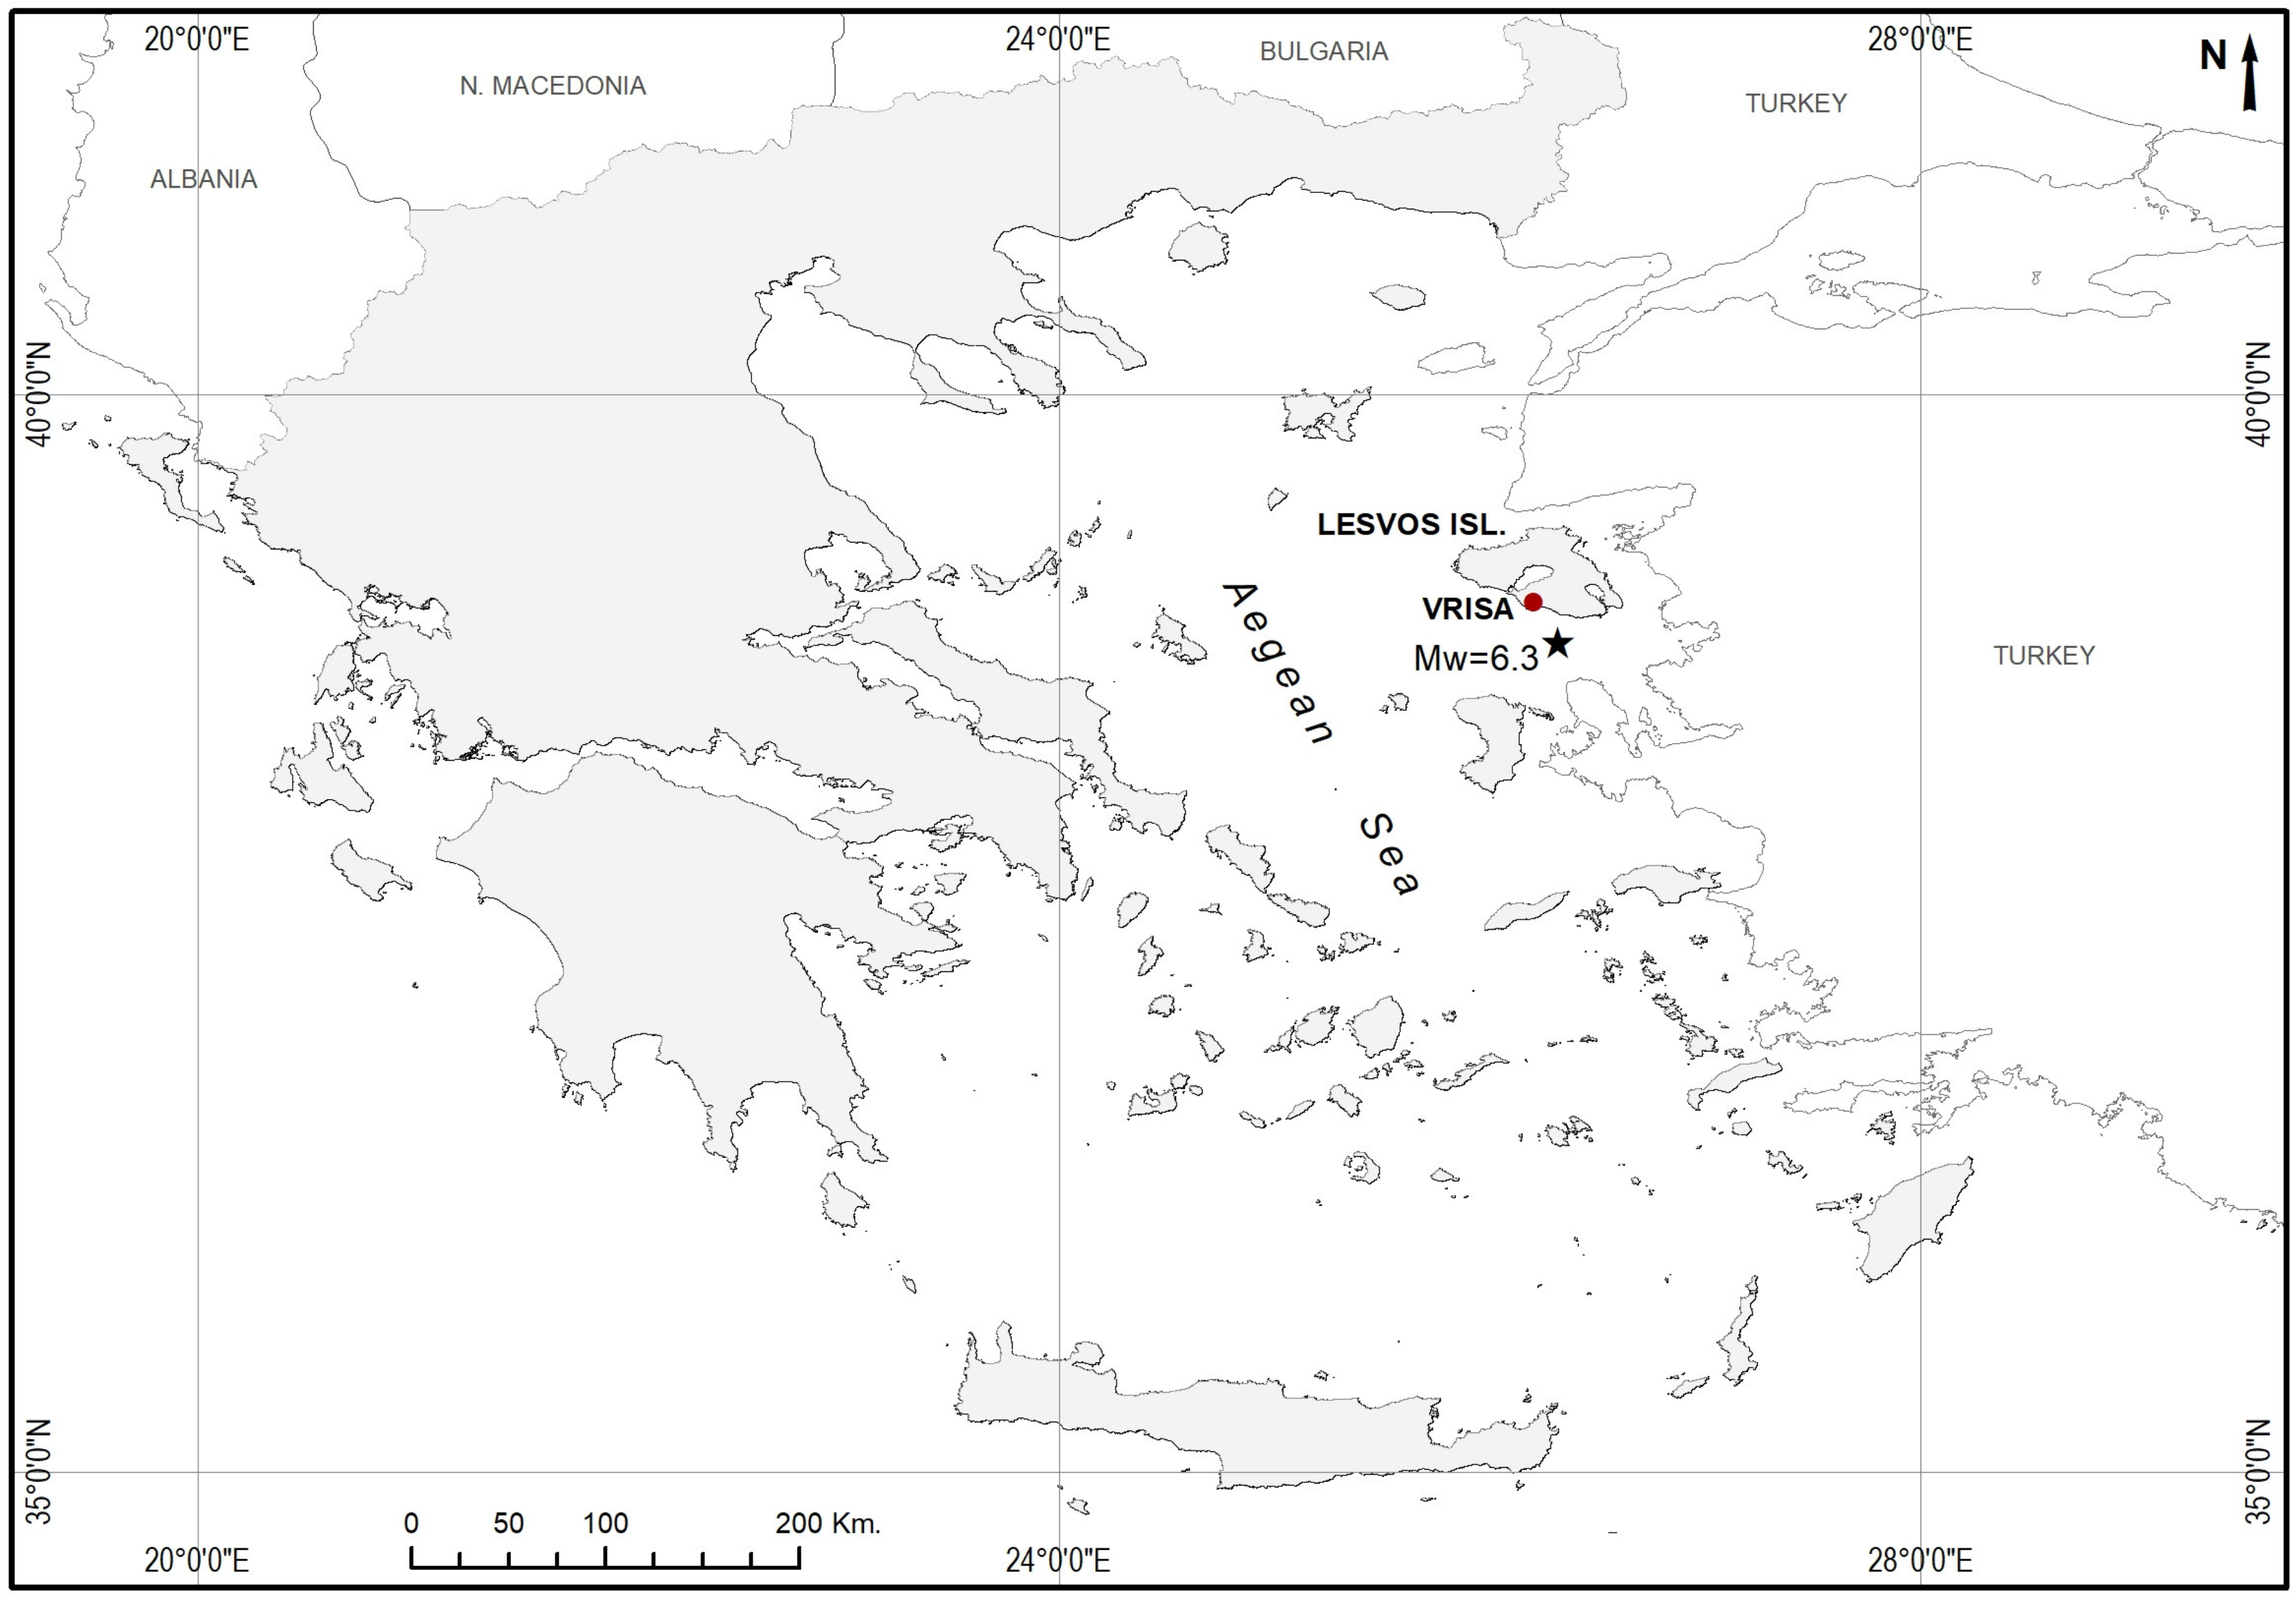
2.1. Study Area and Data Acquisition
- Flight height: Directly related to the GSD of the video frames. After several flights at different heights, ranging from 30 m to 100 m, it was decided that the height of 80m is the most suitable for the specific study and the GSD was calculated to be approximately 3 cm/pix.
- Flight speed: Directly affects the video quality as it introduces blurring on the video frames if it is too high and, on the other hand, it requires more time flight and battery energy if it is too slow. After several test flights, it was decided that the most efficient flight speed for acquiring video footage was 25 Km/h.
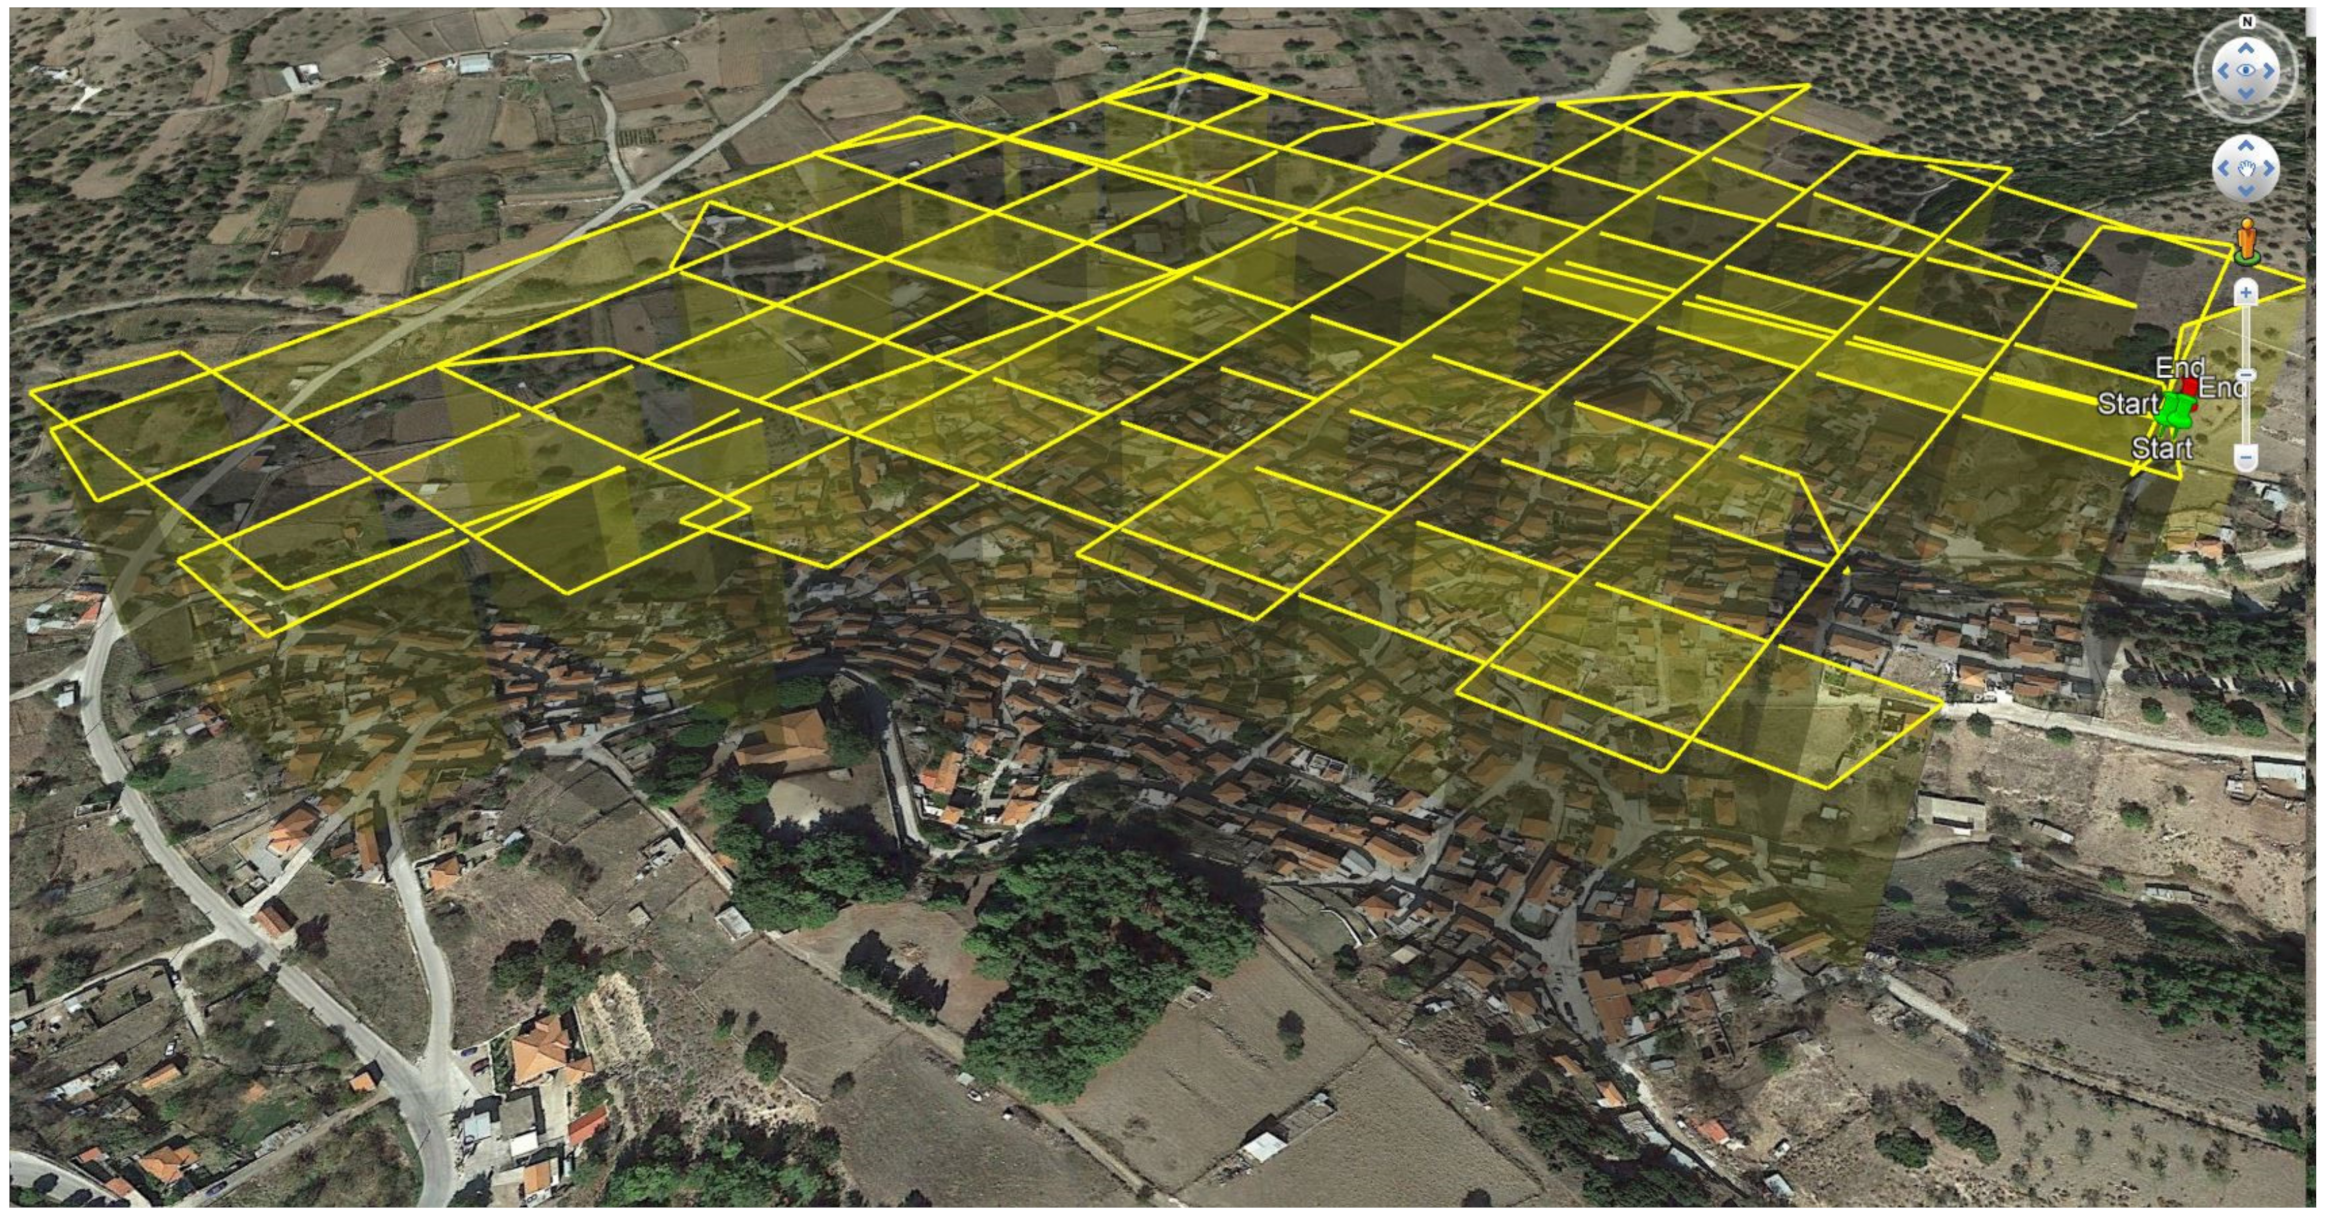
- Flight path: Directly affects the building appearance in the video footage and controls the side-overlapping of the deriving frames. These two parameters are crucial for the quality and density of the 3D point clouds, especially for points that represent the facades of the buildings. For reaching the specific research goals a flight plan was designed, using Litchi Mission hub software, taking into consideration the shape of the building blocks by following flight paths that are parallel to the streets and with a 50 m distance among them, providing 80% side overlapping, as shown in Figure 3.
2.2. Methodology
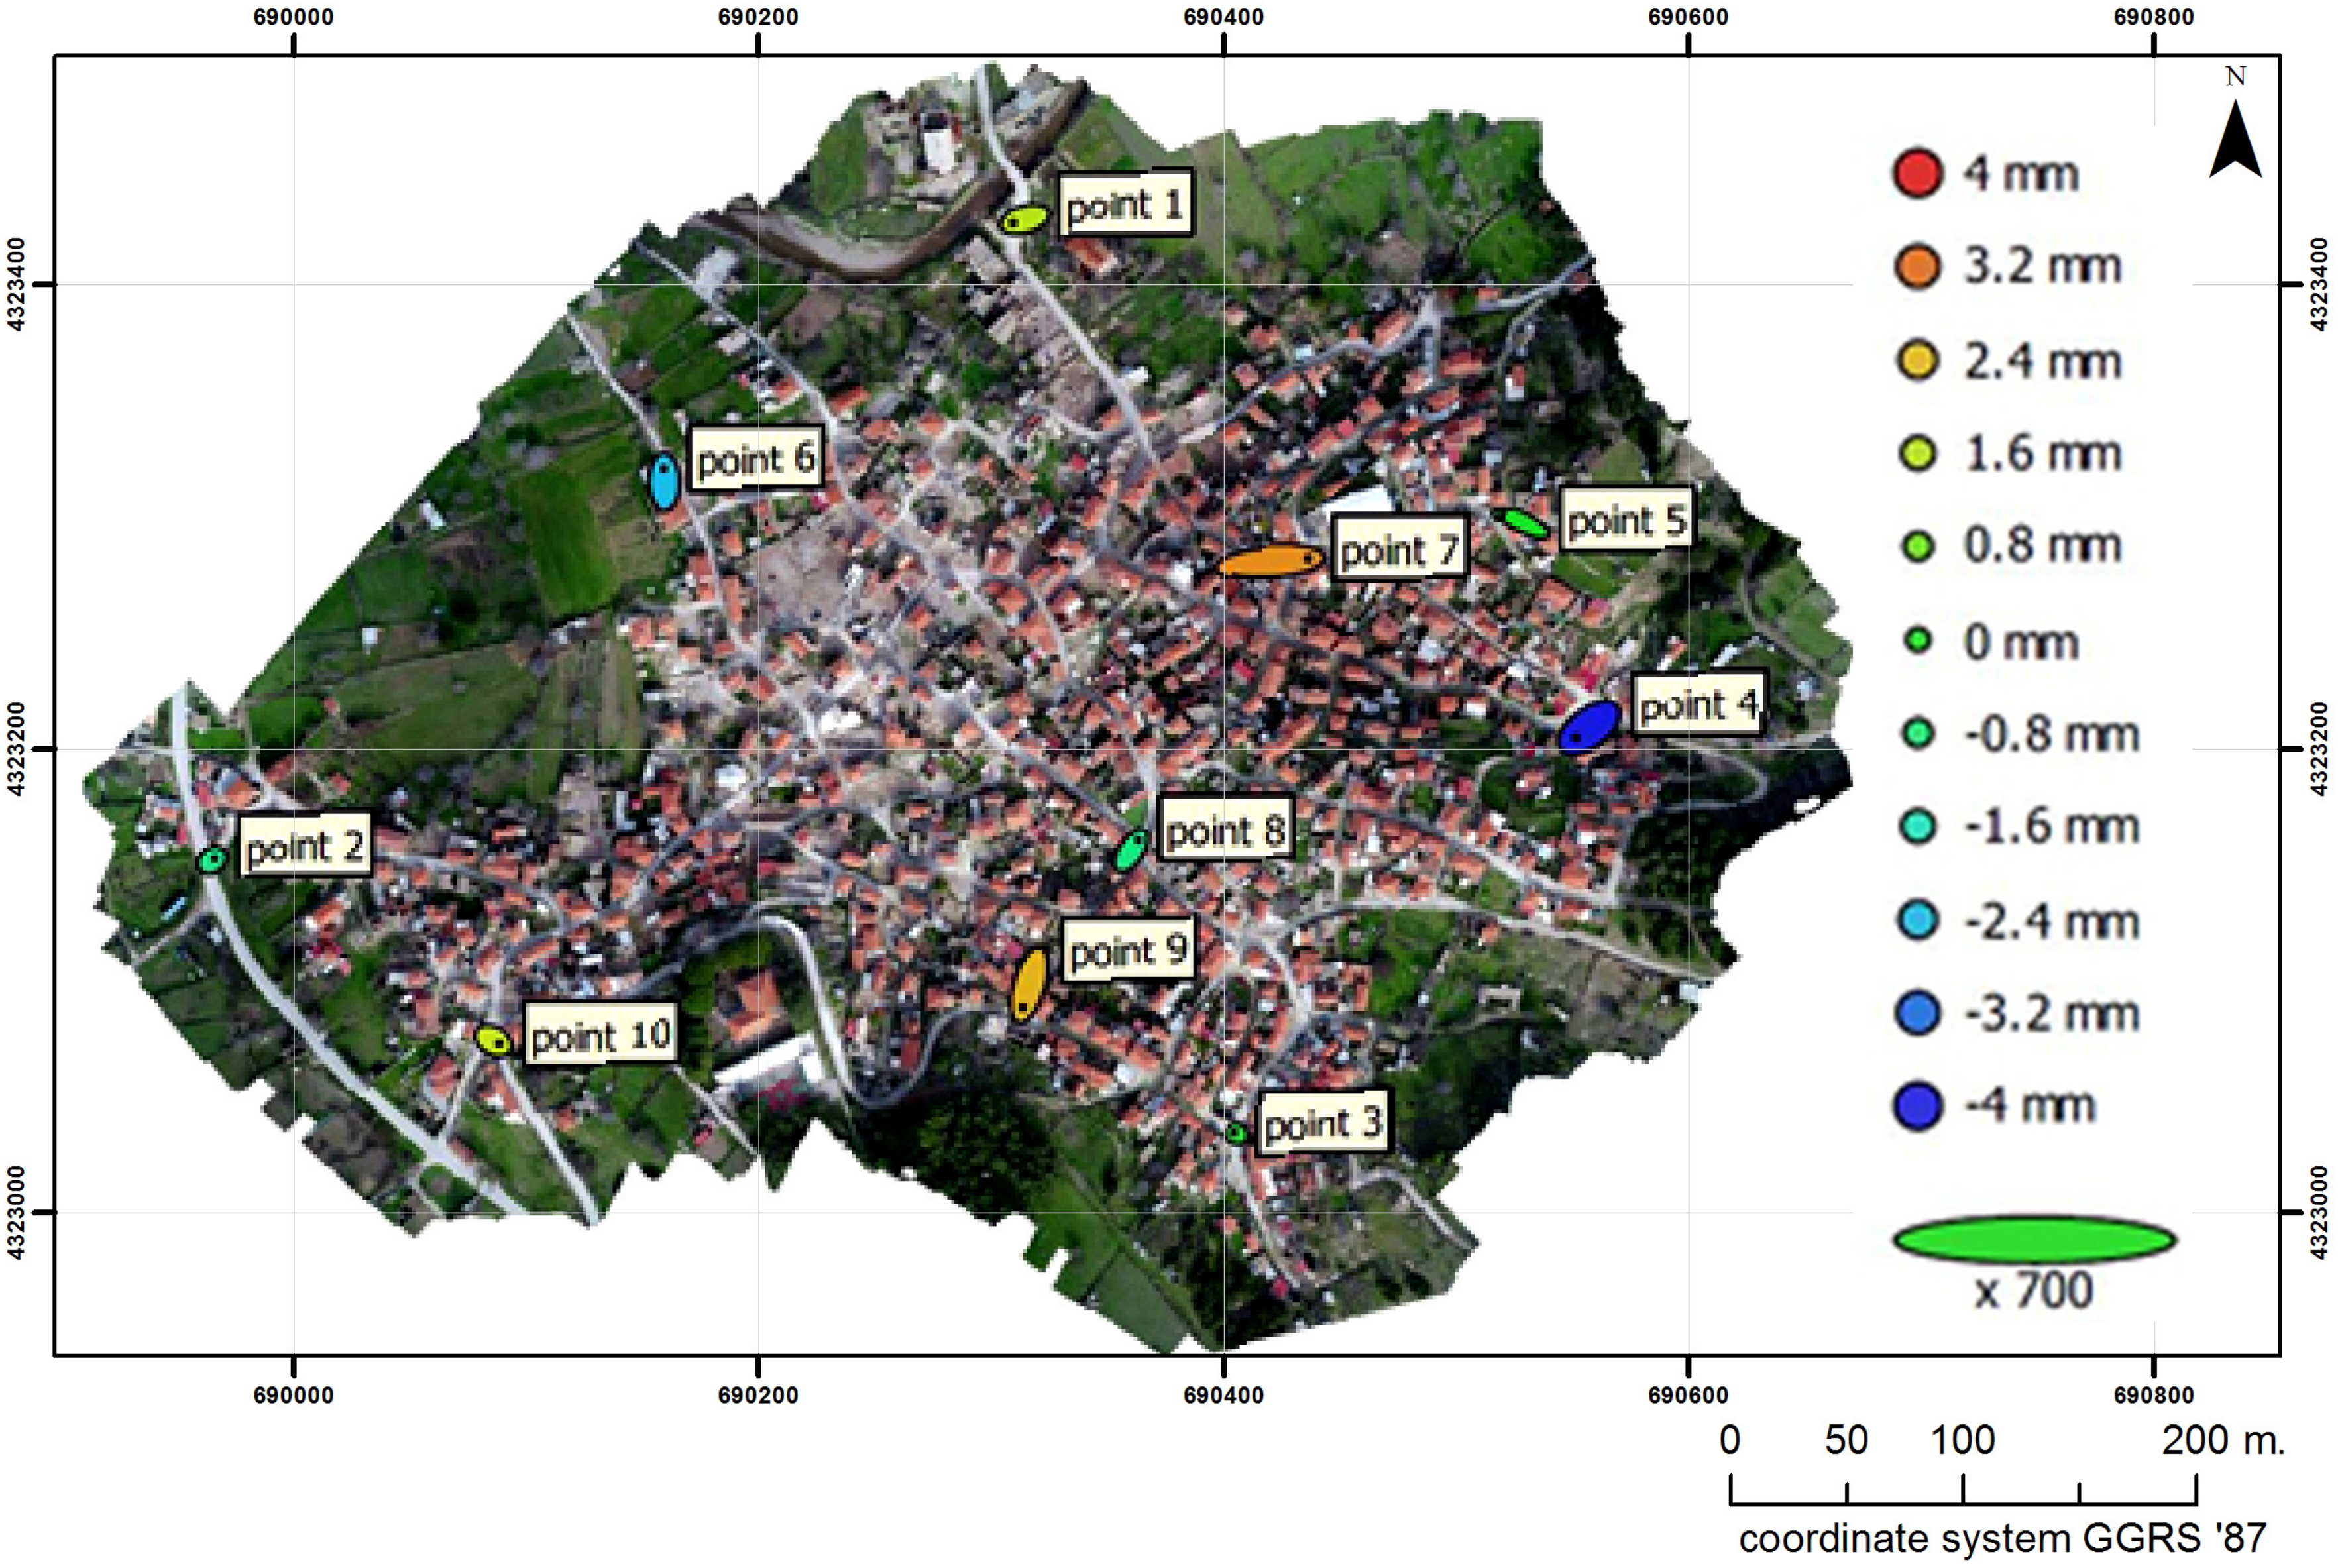
2.2.1. Geo-Registration
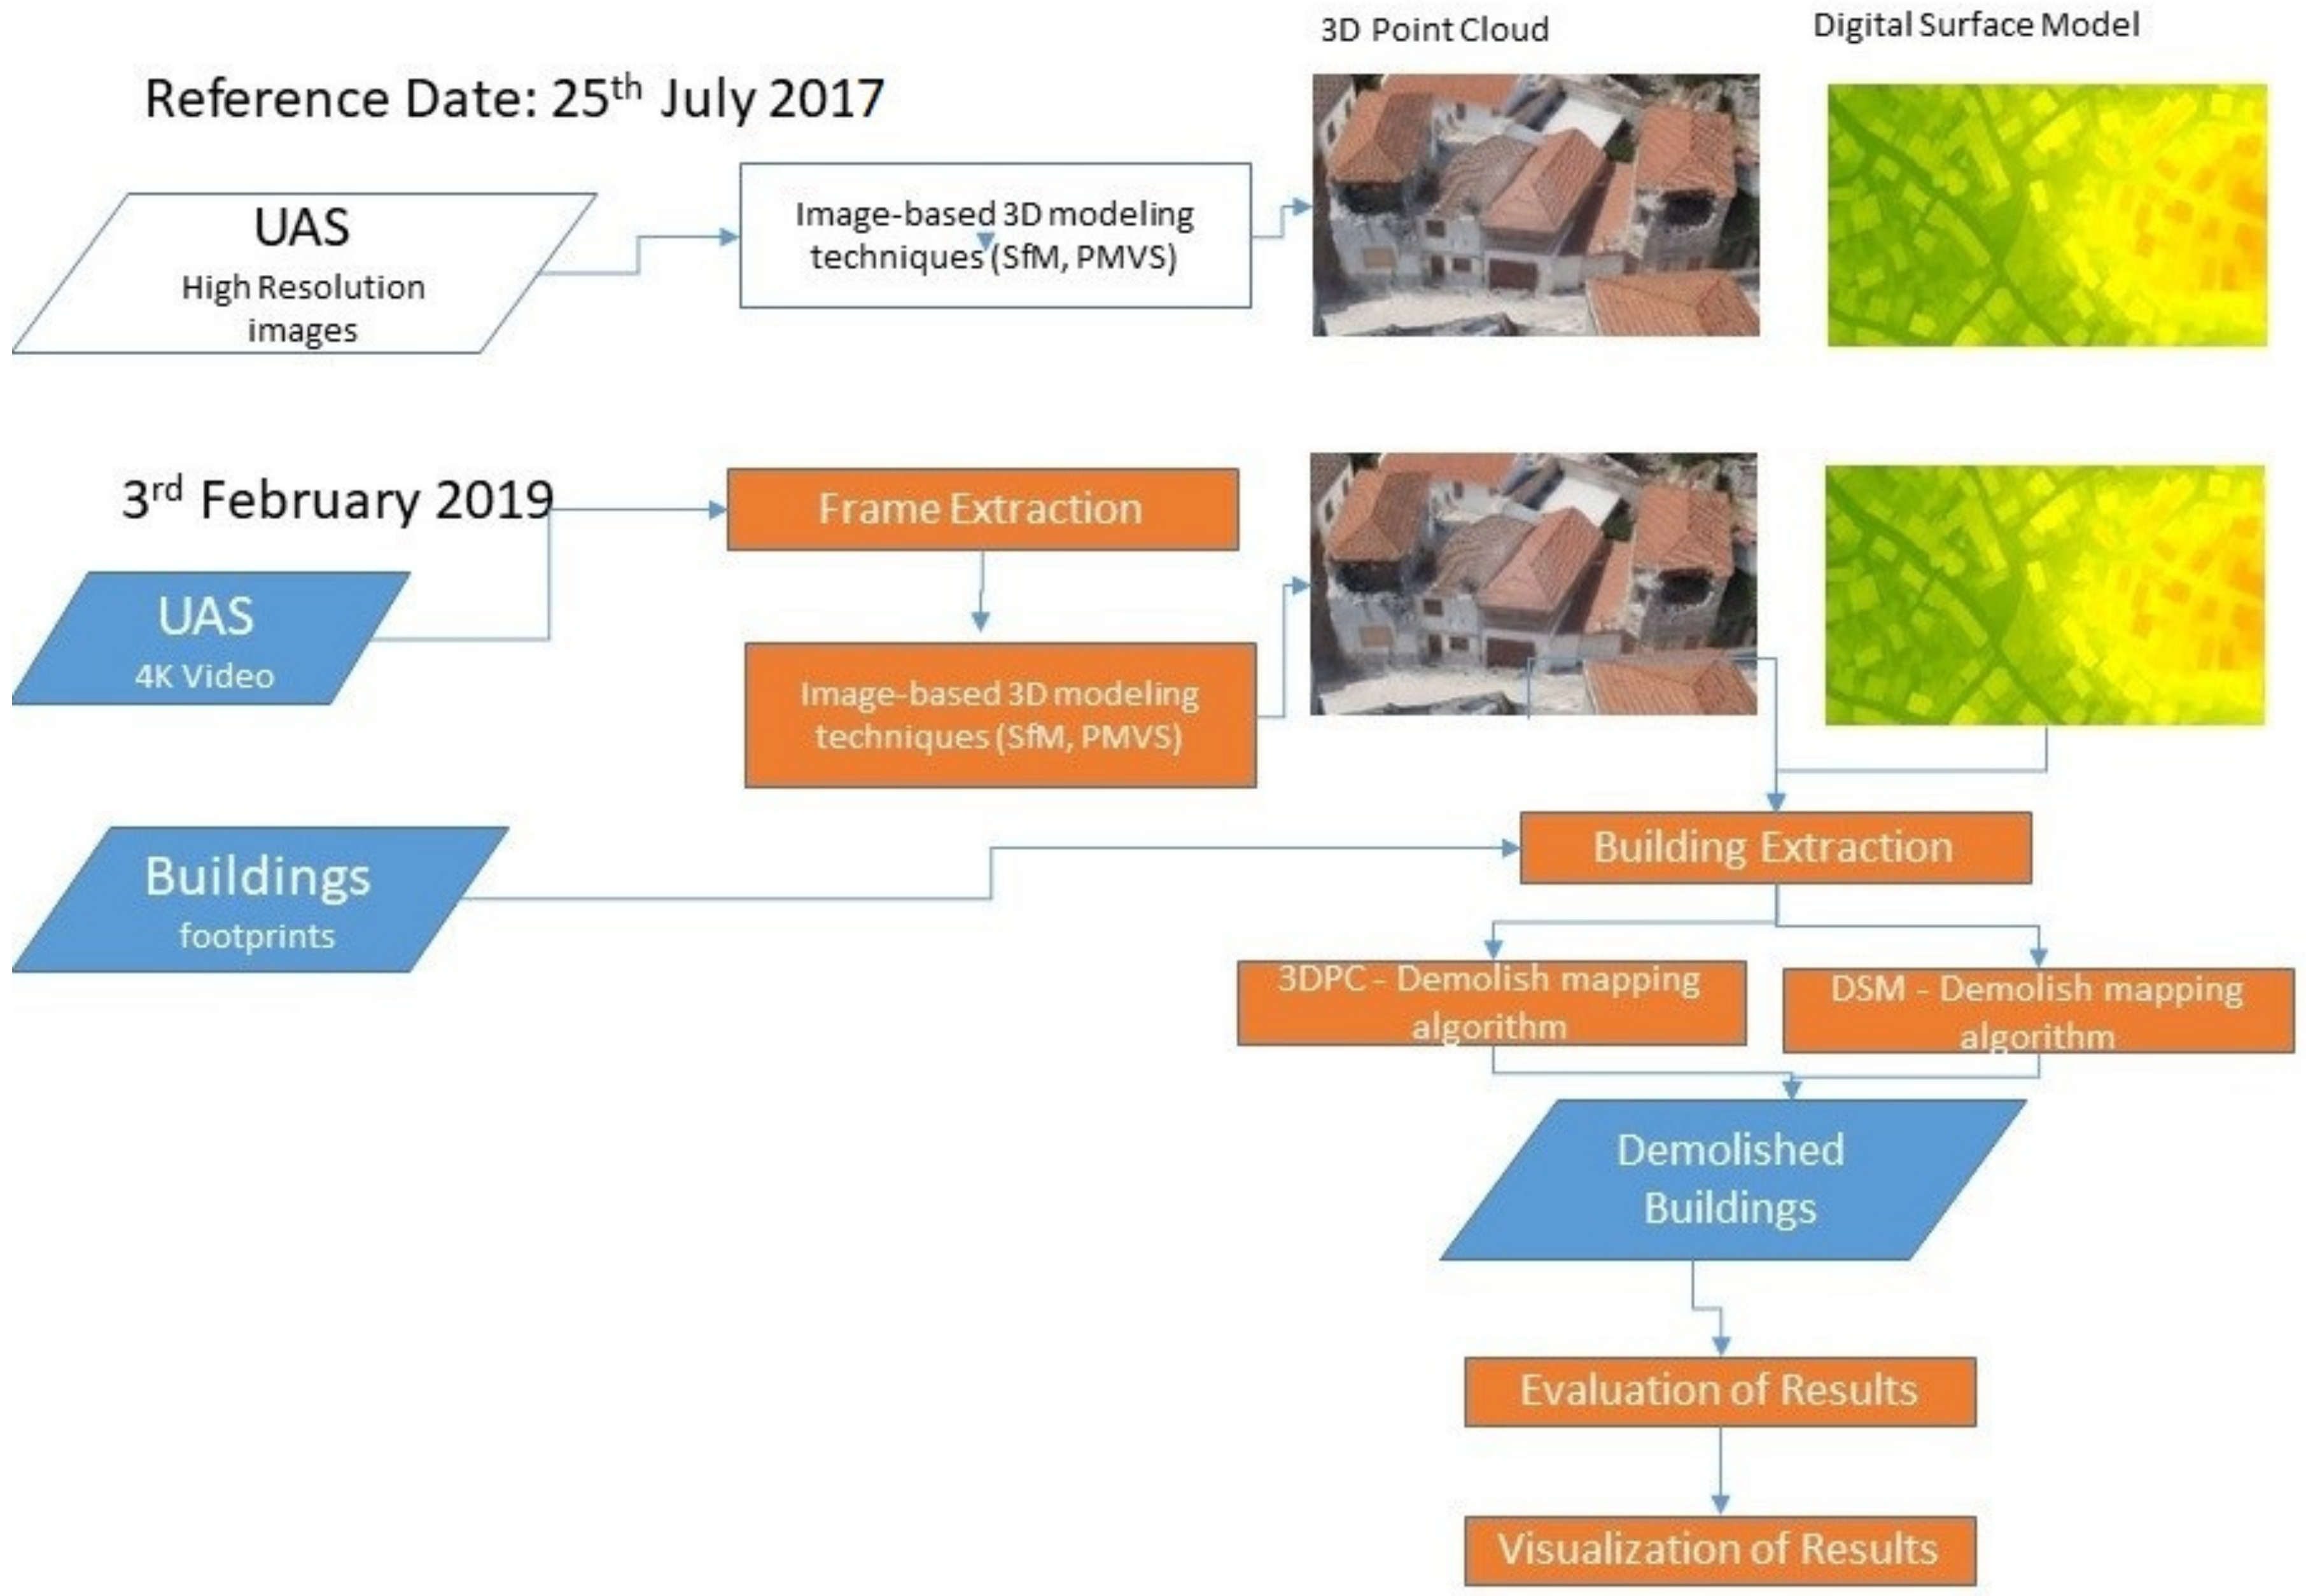
2.2.2. Video Footage Processing for 3D Modelling
- Video Frame Extraction—VFE is not a straightforward process since the frames that will be extracted should meet the prerequisites of further processing that leads to generating accurate 3D point clouds and digital surface models. For this reason, the wise frame selection (WFS) approach has been applied, which refers to an elaborated approach that reduces blur-motion effects and frame redundancy, with the aim of discarding the most redundant (i.e., more than 80% front overlap) and lowest-quality frames (i.e., an Image Quality Index (IQI) lower than 0.5 frames).
- The Structure from Motion (SfM) [40] and Multi View Stereo (MVS) [41] algorithms are the most popular approach in order to create 3D point clouds and digital surface models from a set of 2D images acquired by UAS. This approach has been extensively implemented in the last decade in 3D mapping in different scales and has been employed in some commercial and free software packages in different variations.
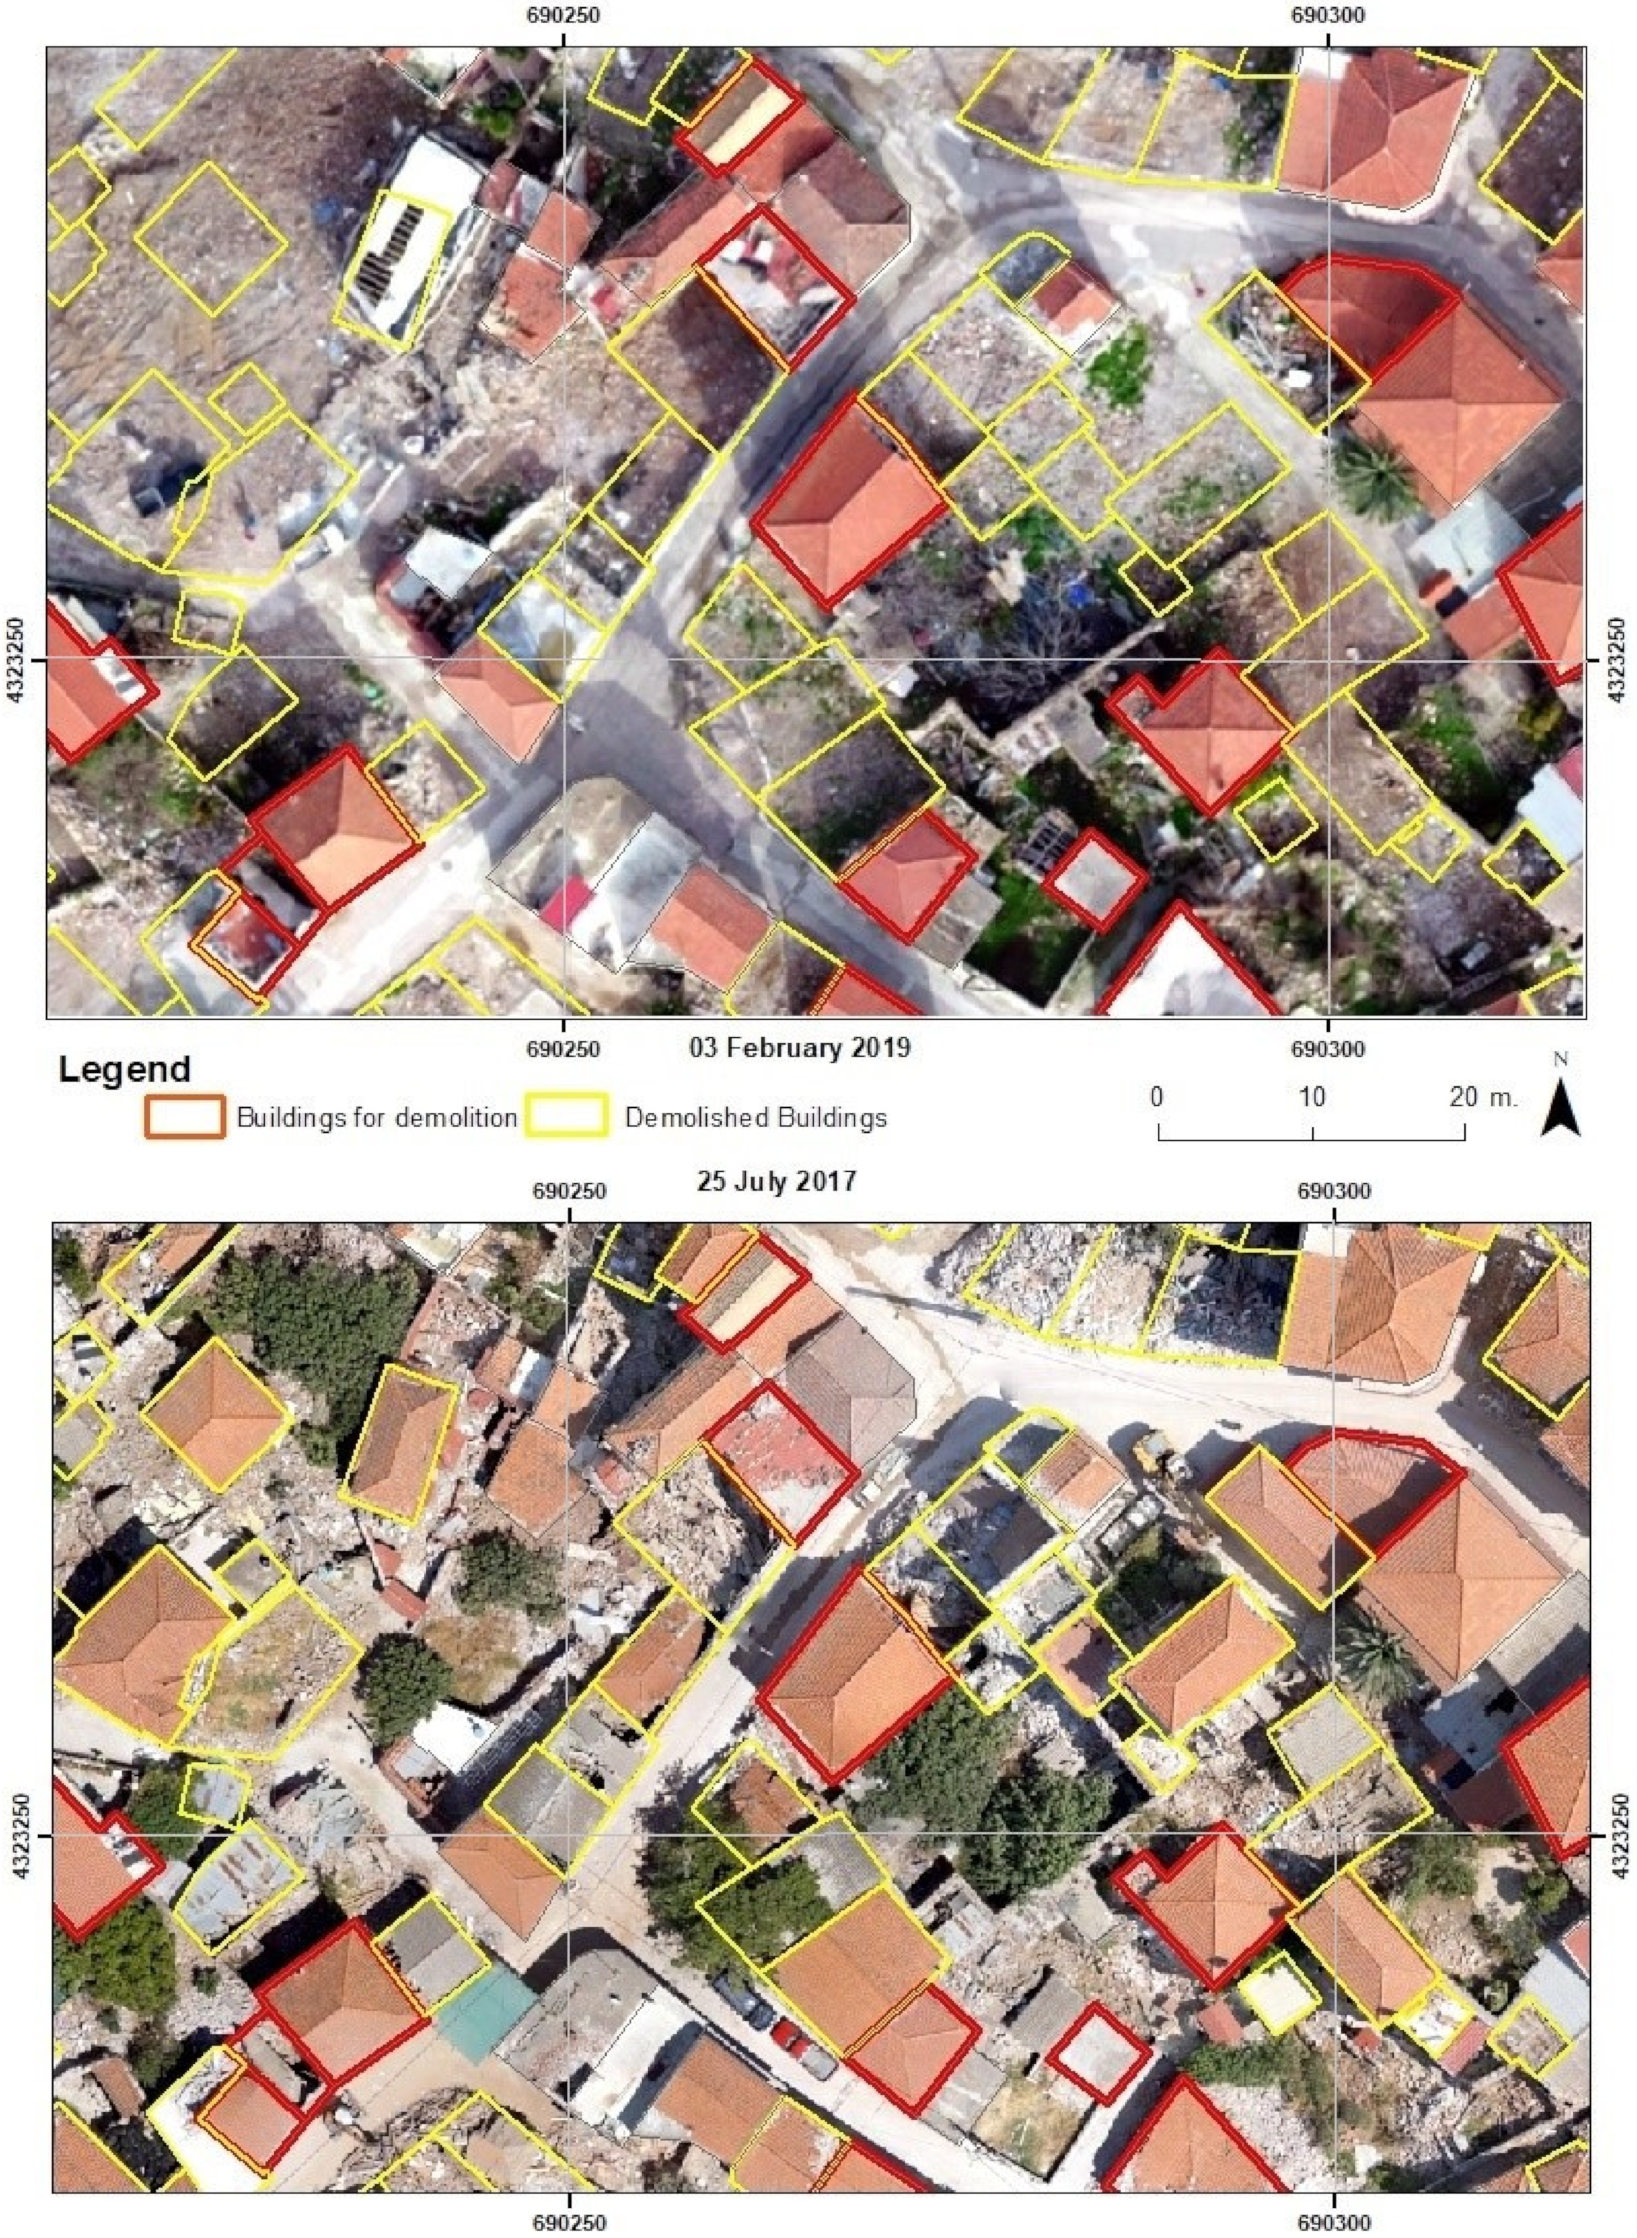
2.2.3. Mapping of Demolished Buildings
- Extract the 3D point clouds of each building from the 25th July 2017 and 3rd February 2019 datasets by using the building polygons derived by the photointerpretation of the 25th July 2017 ortho-photomap.
- Extract the DSM values of each building from the 25th July 2017 and 3rd February 2019 datasets by using the building polygons derived by the photointerpretation of the 25th July 2017 ortho-photomap.
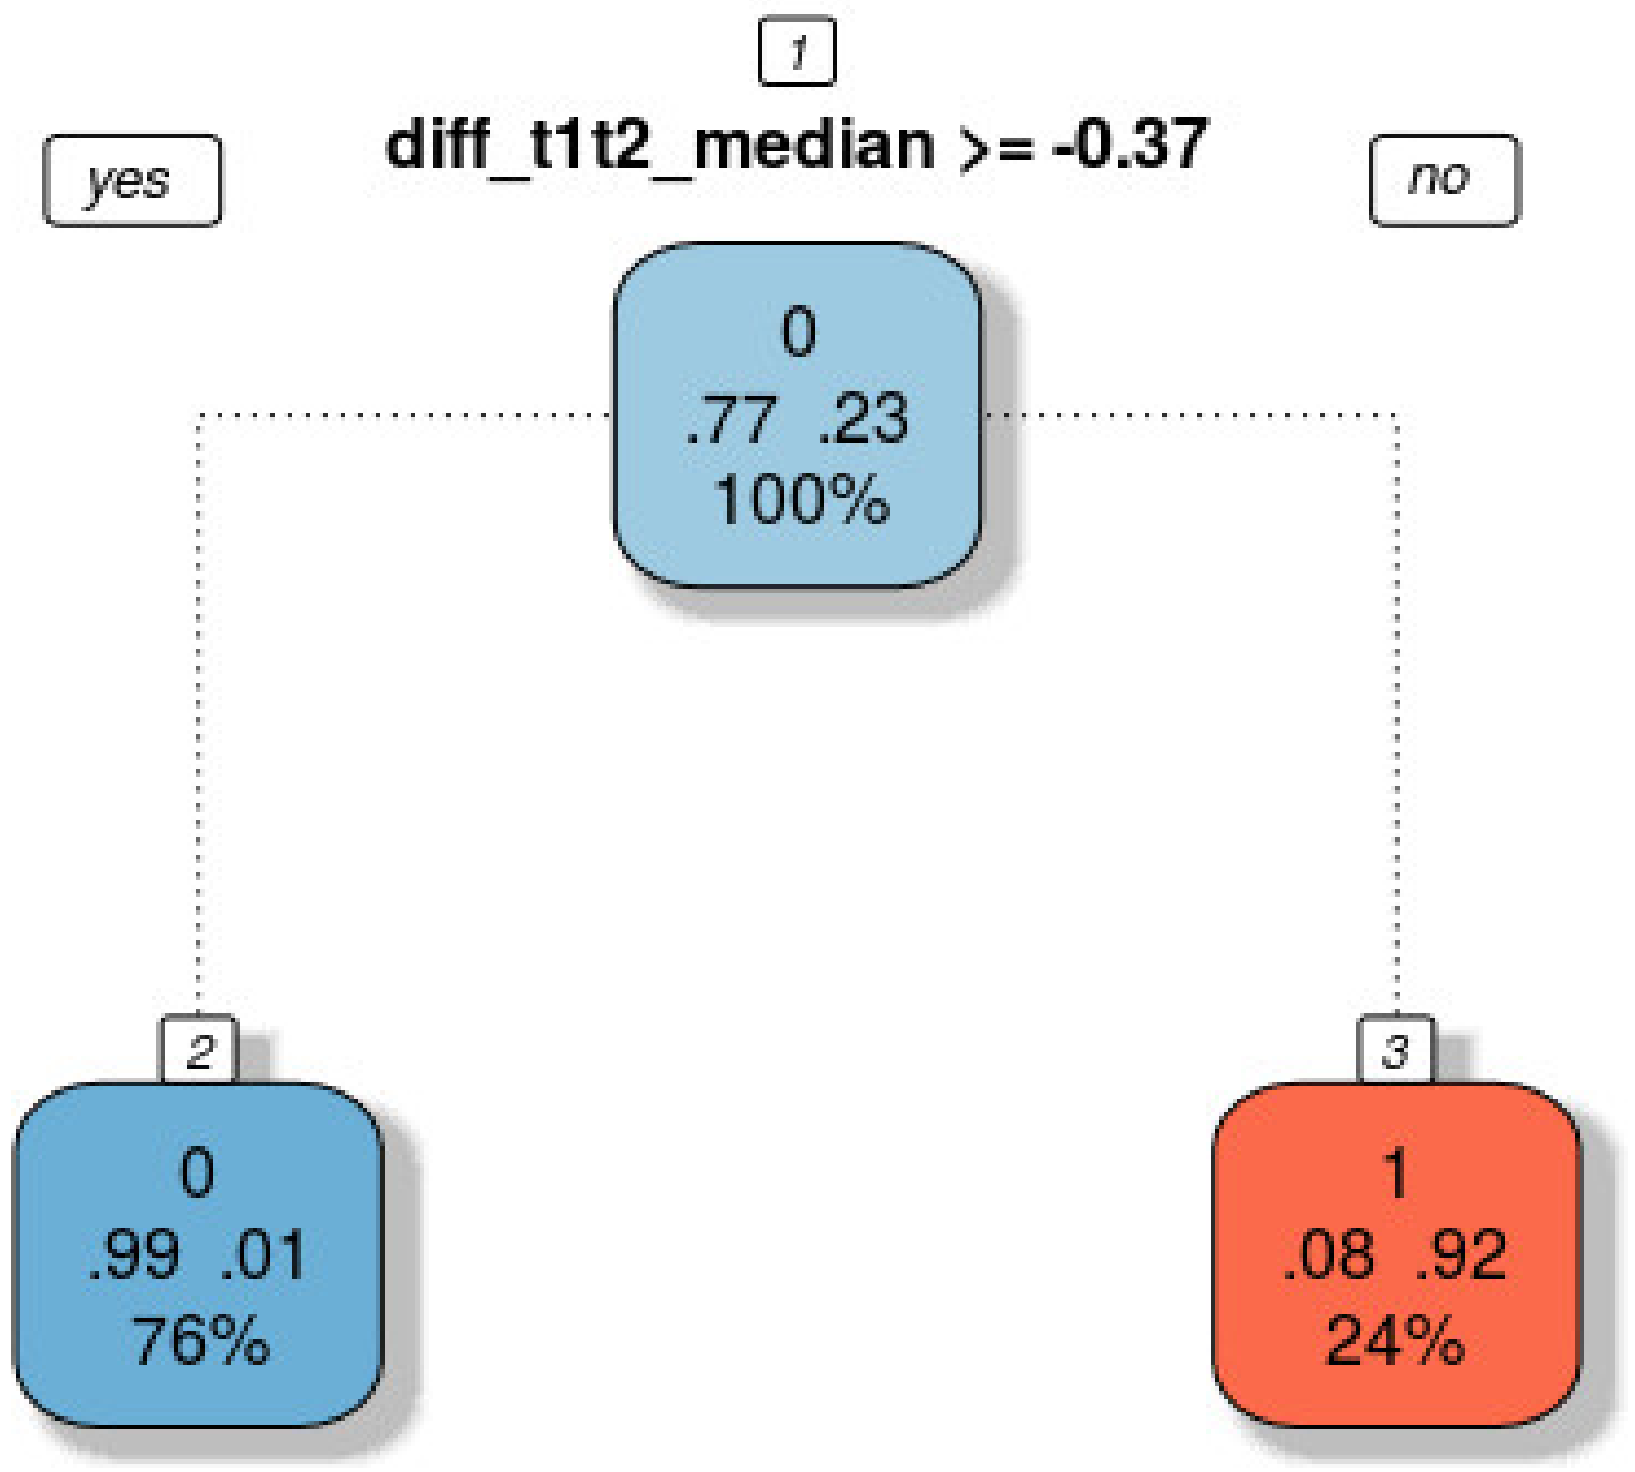
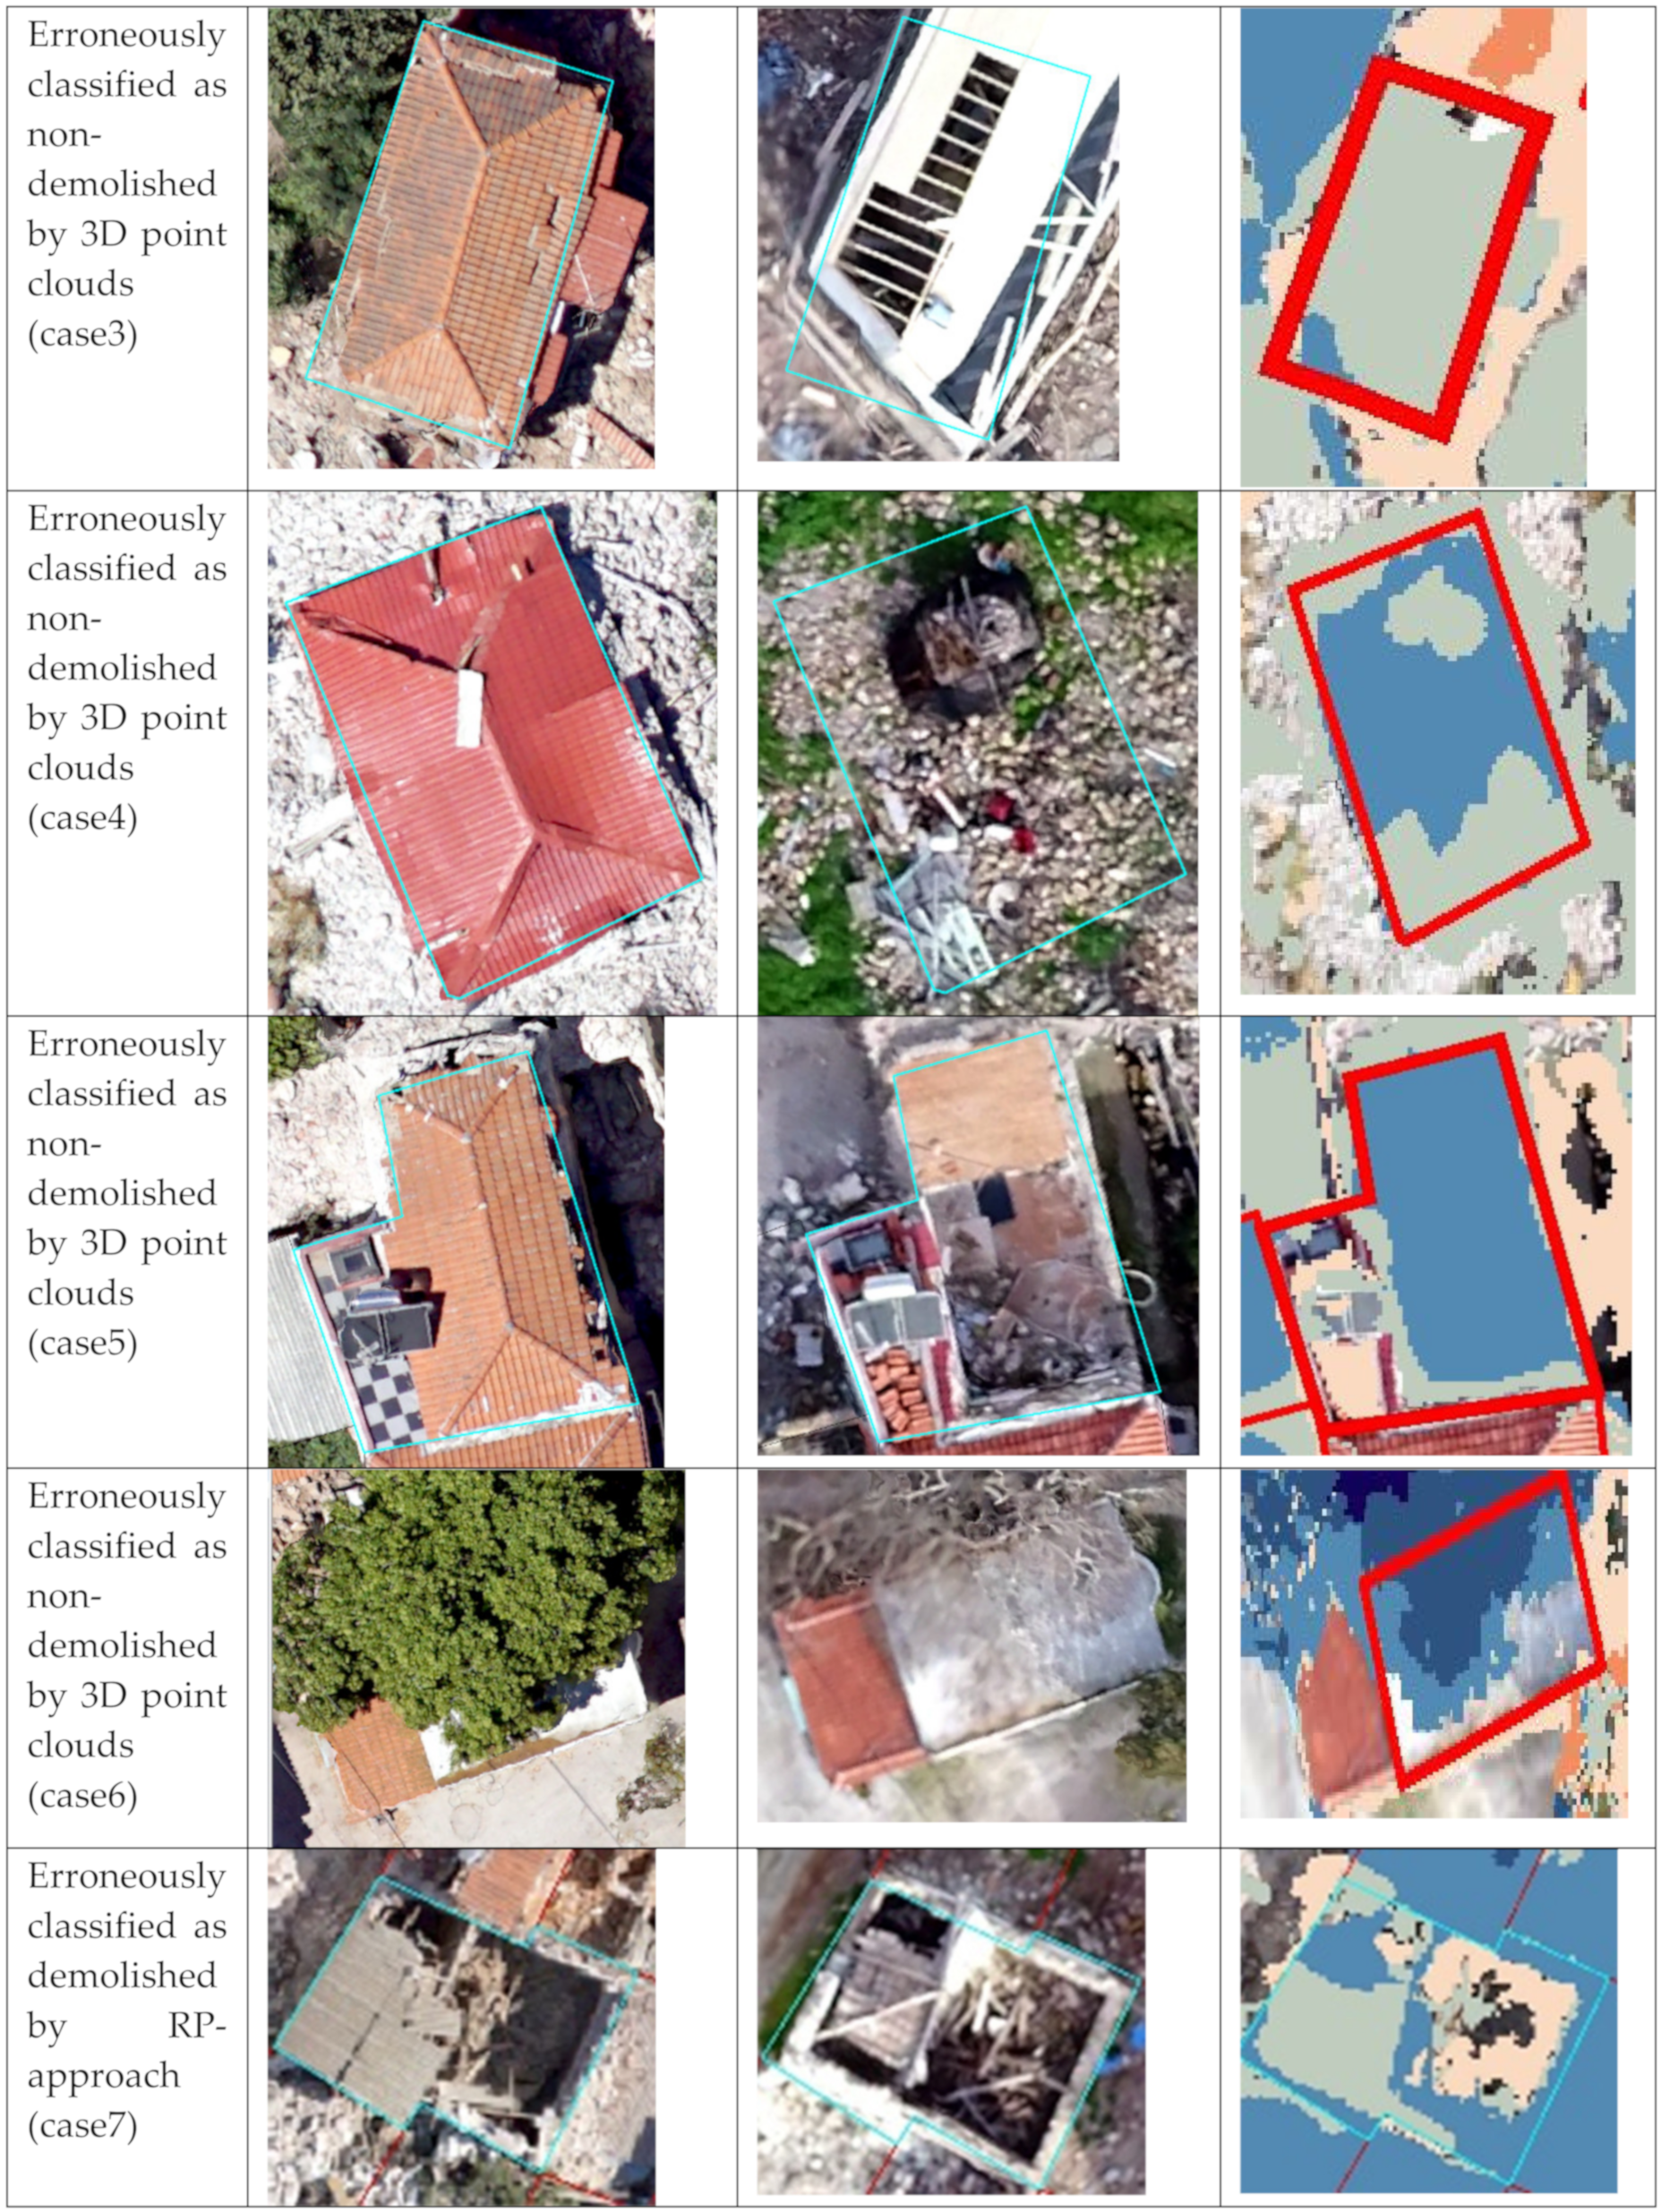
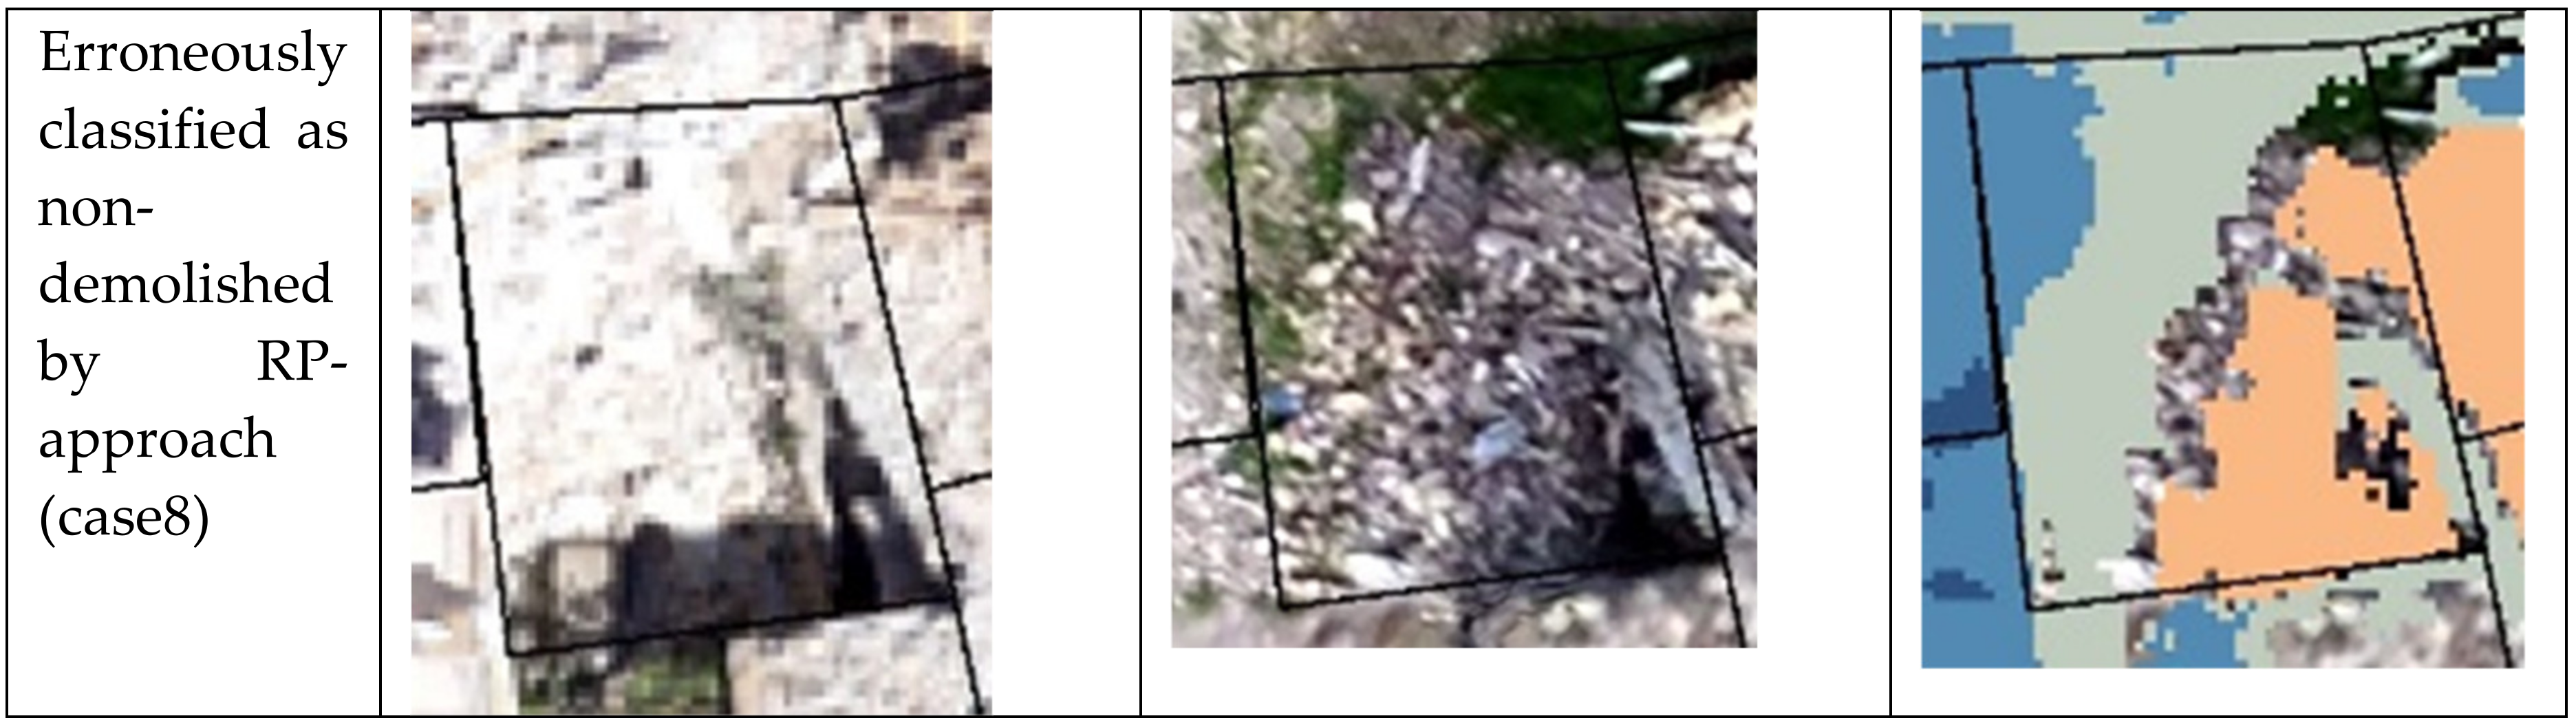
- Application of the demolition detection algorithms to above datasets for each building and evaluation of the results by field data. More analytically, two demolition detection algorithms have been developed, the first for mapping the demolished buildings by comparing 3D point clouds on different epochs while the second one by comparing the DSMs on different epochs.
3. Results and Discussion
3.1. Orthophoto Map of 3rd February 2019
3.2. 3D Point Cloud of 3rd February 2019
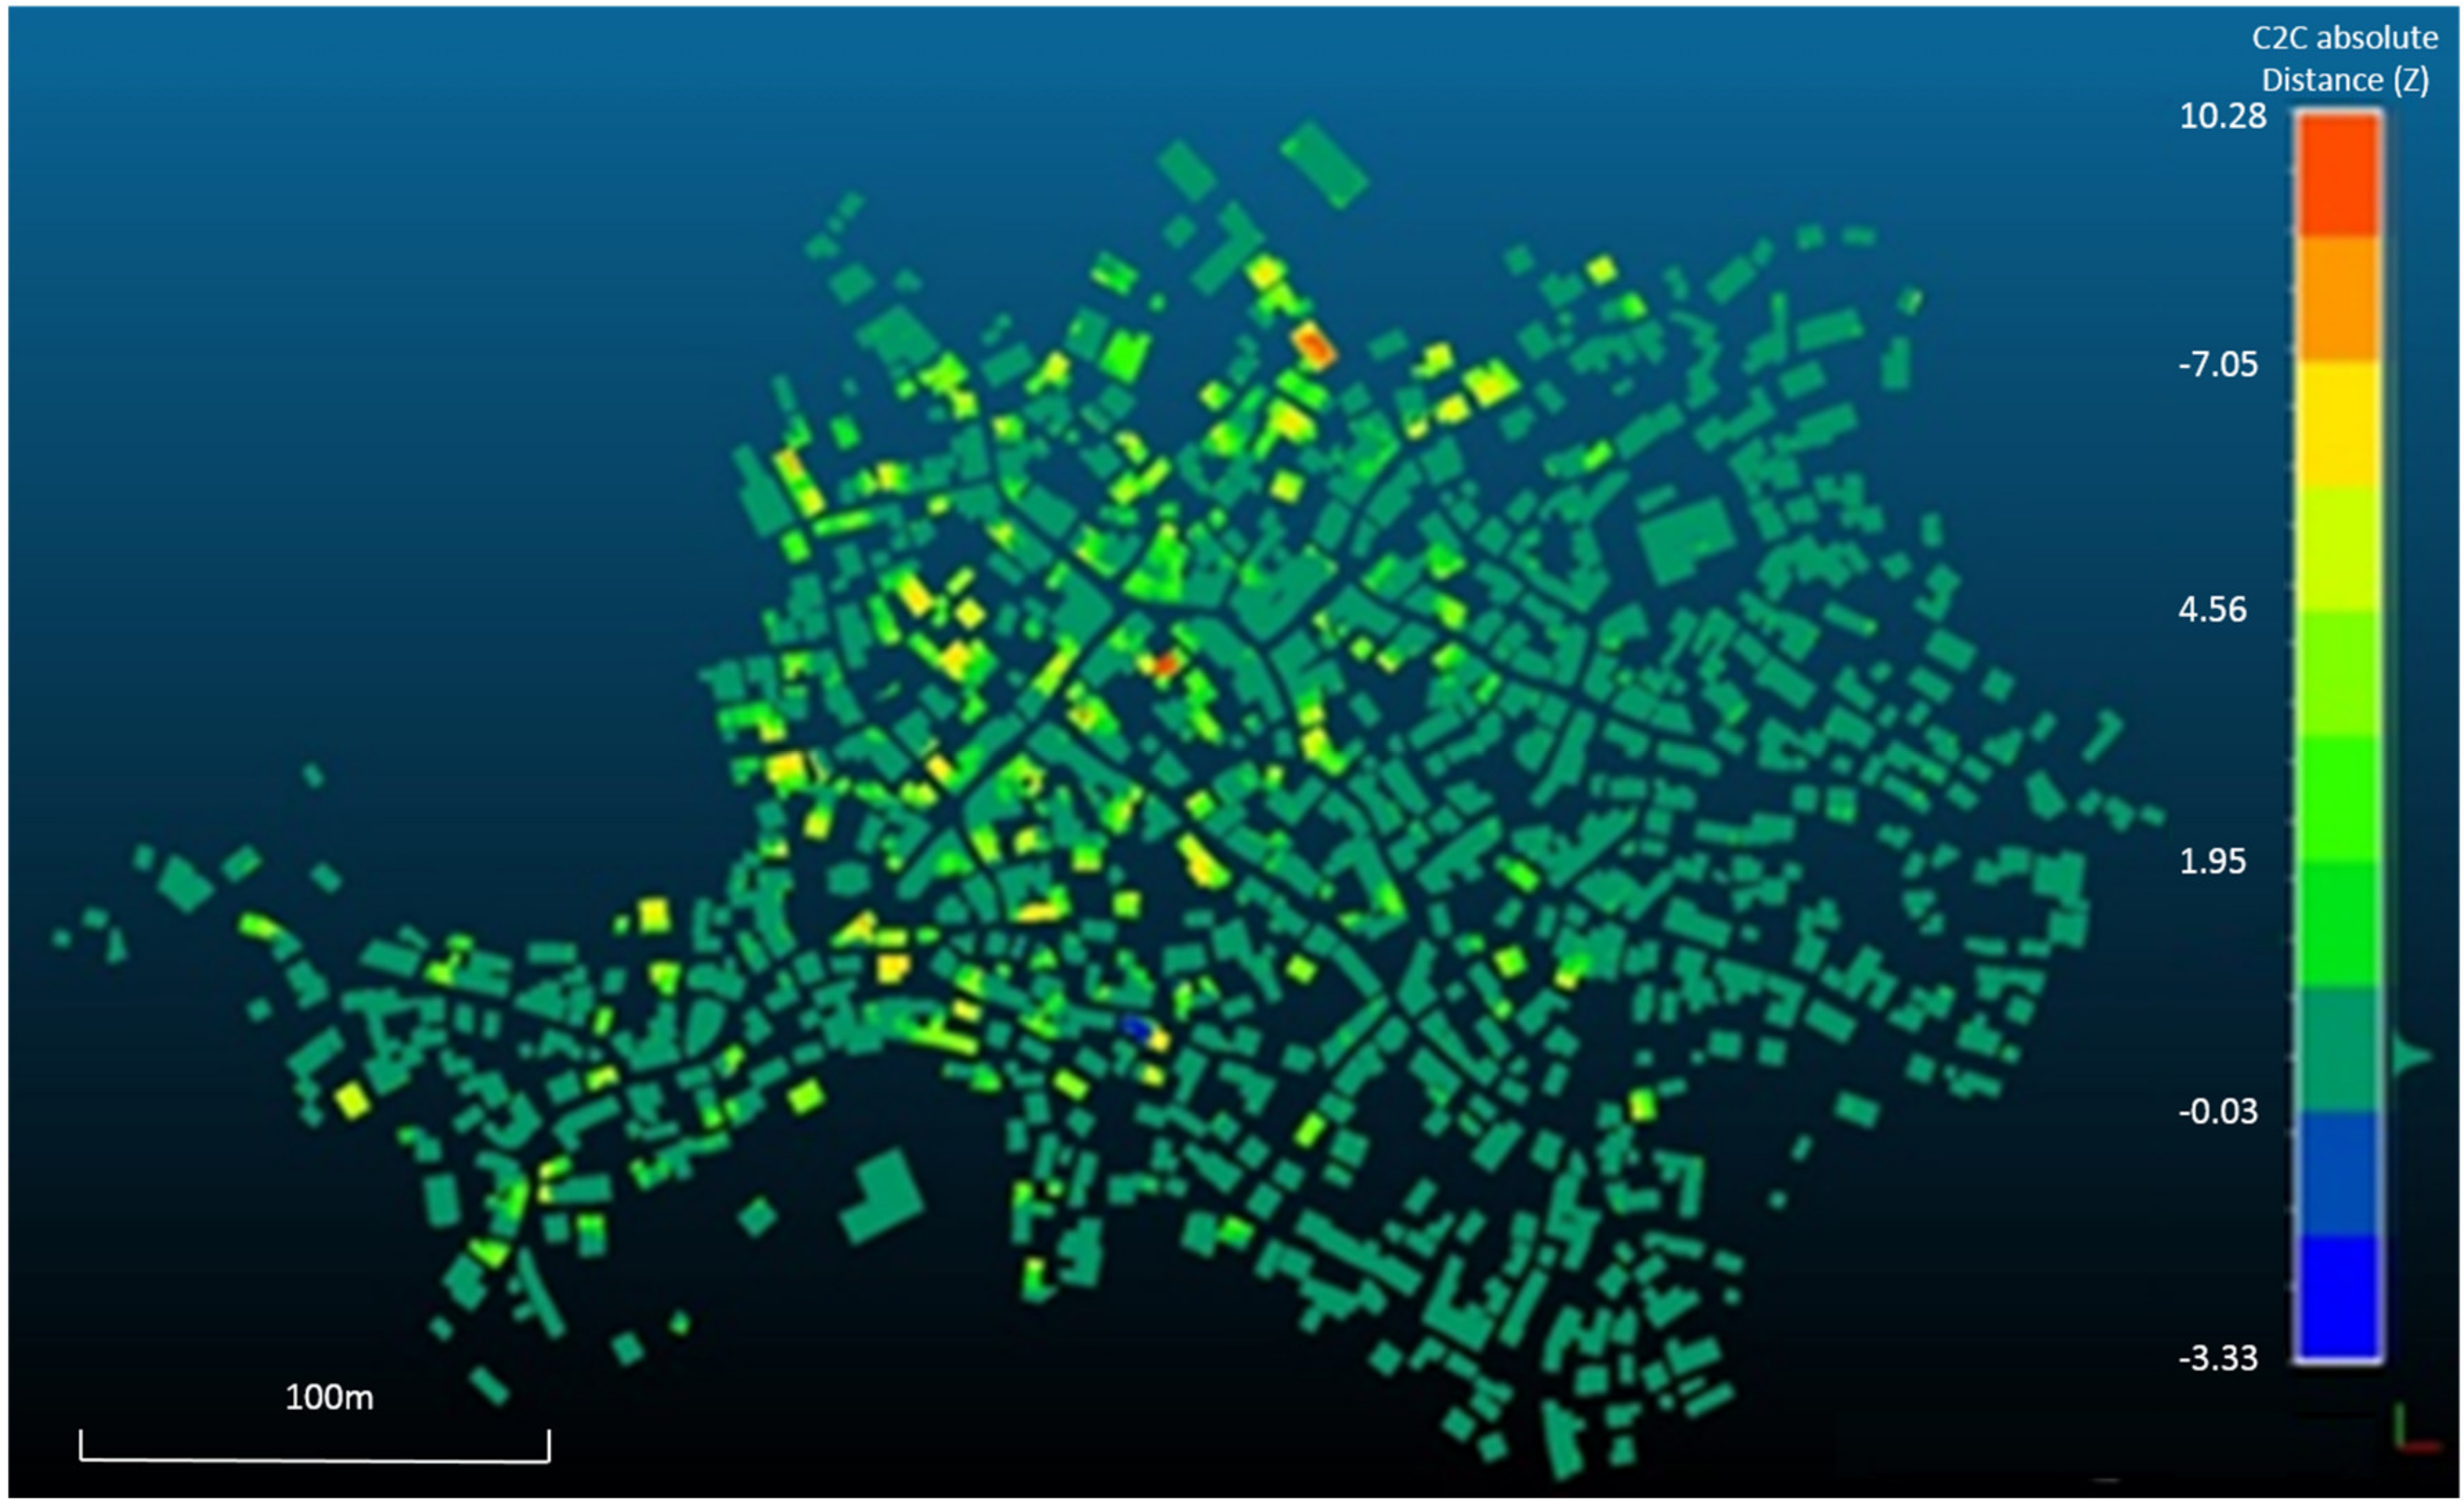
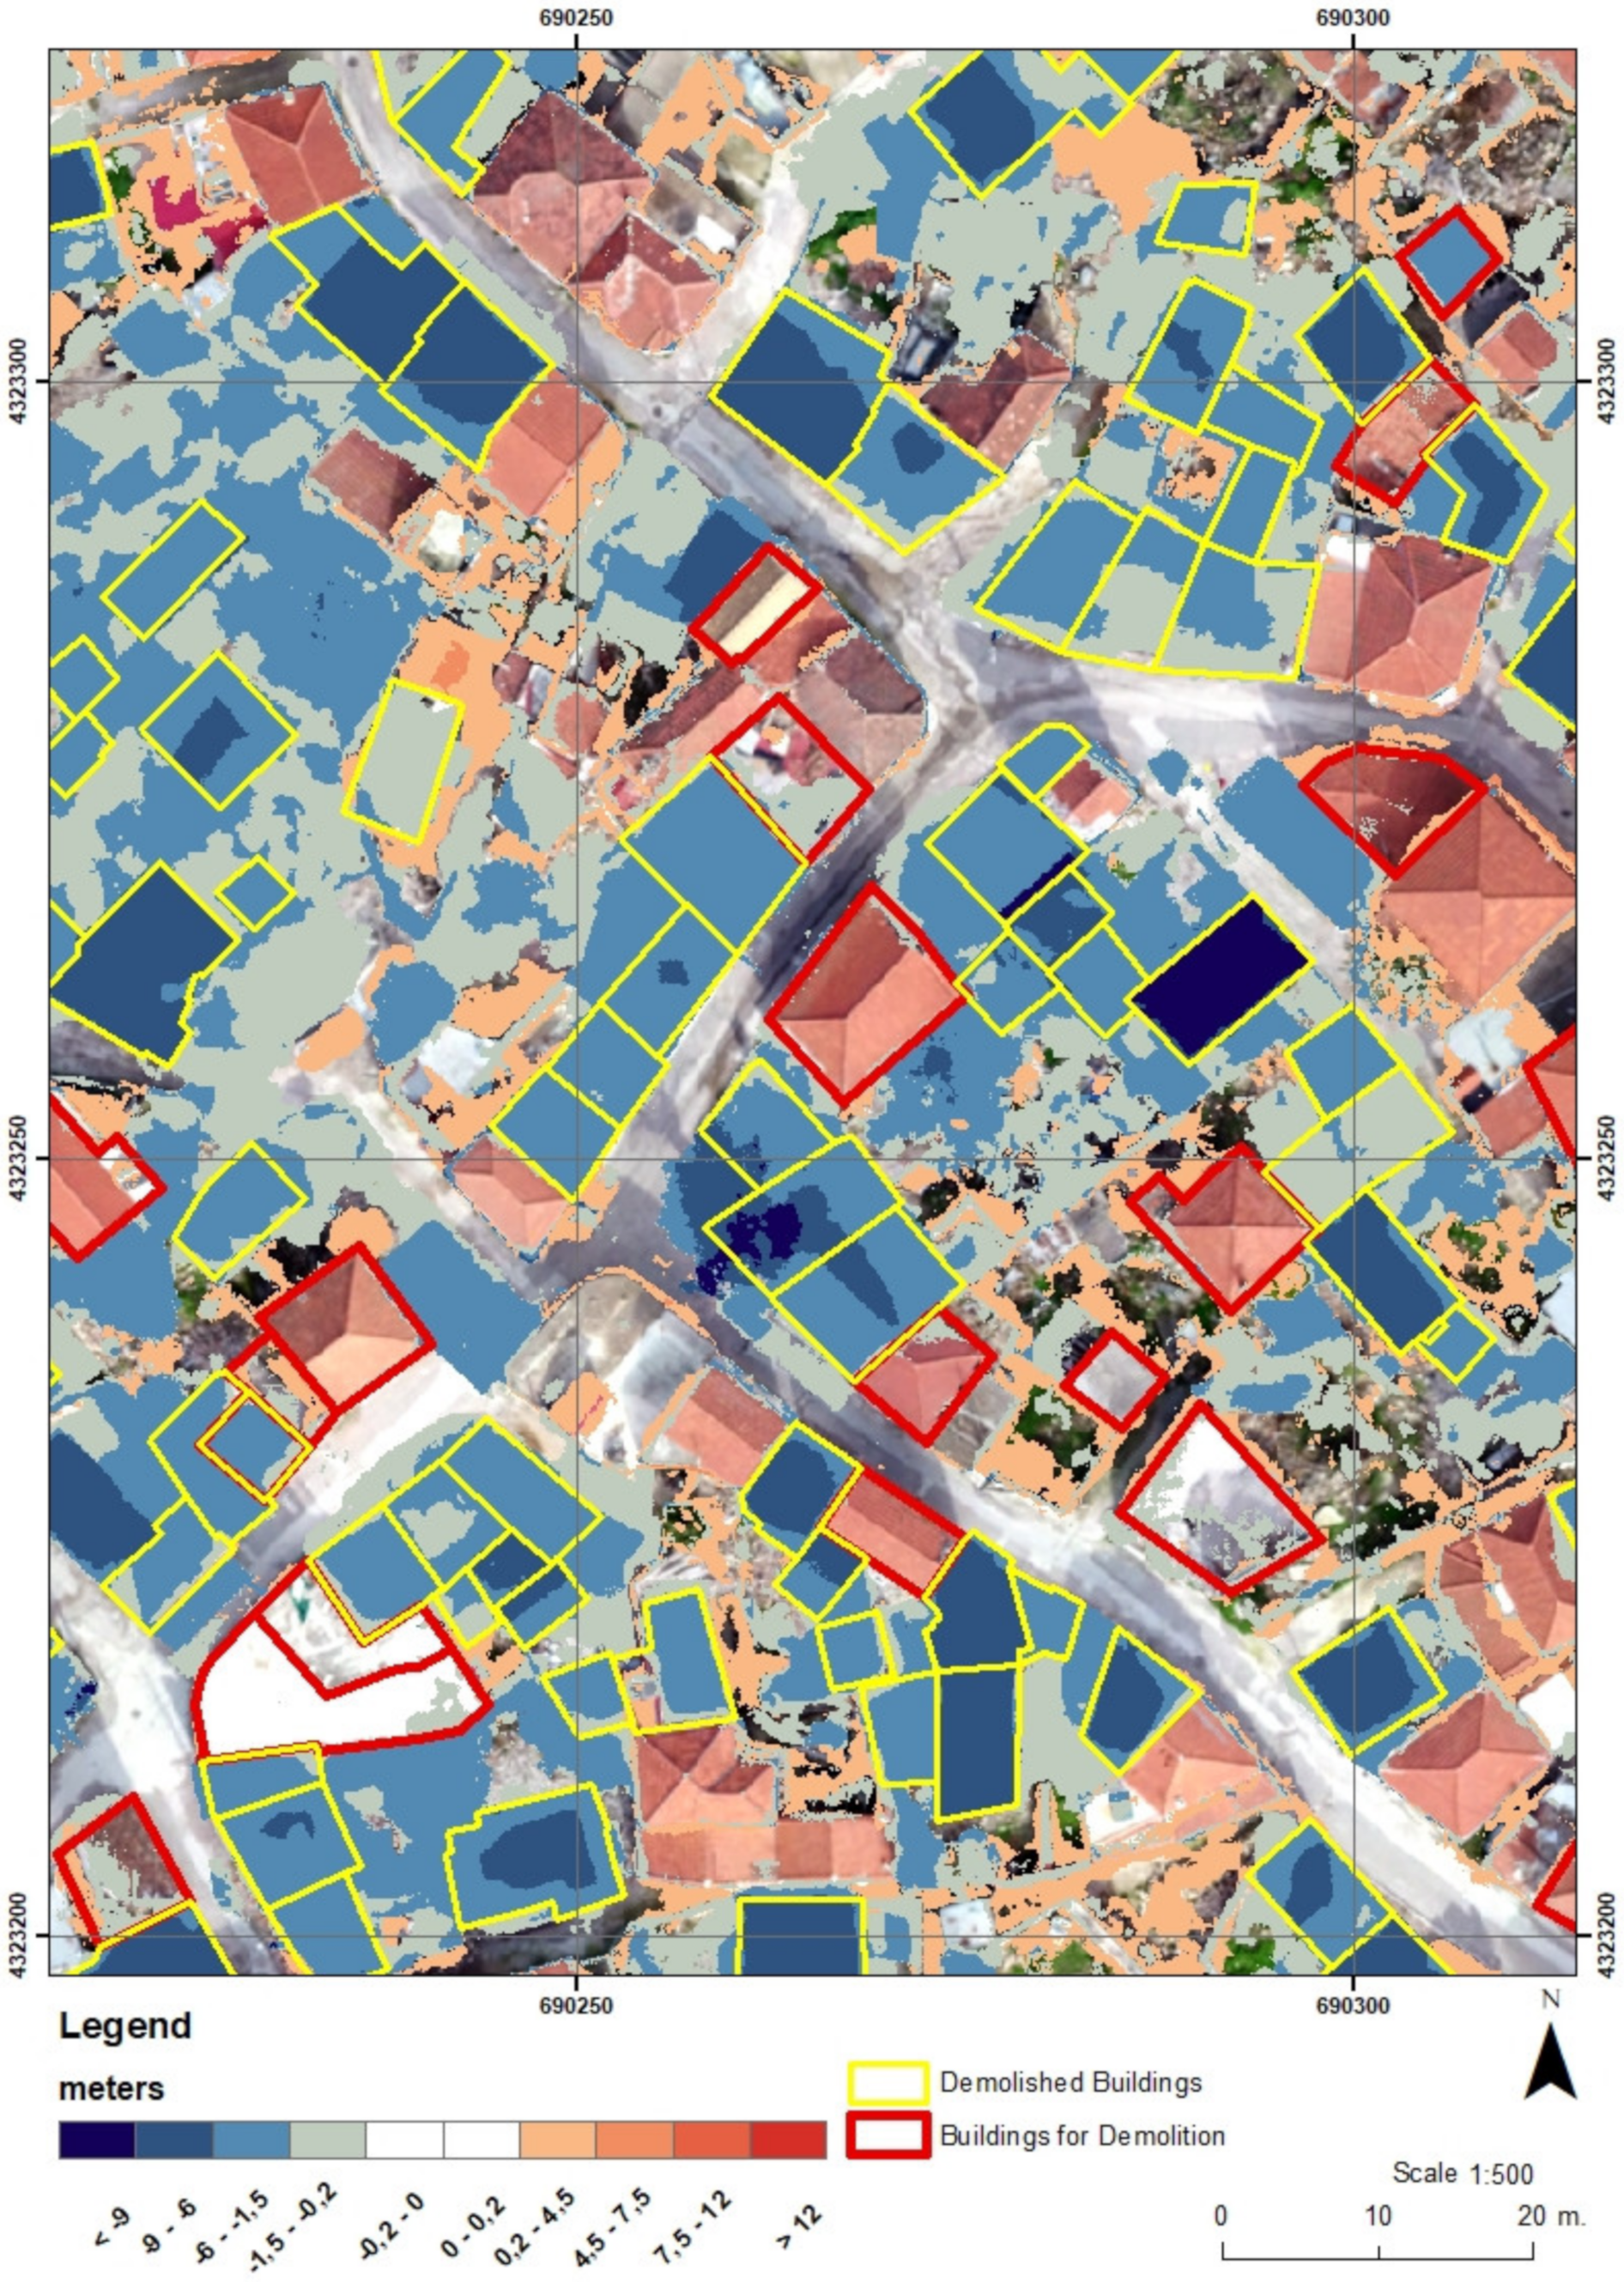
3.3. DSM of Difference Map between 3rd February 2019 and 25th July 2017
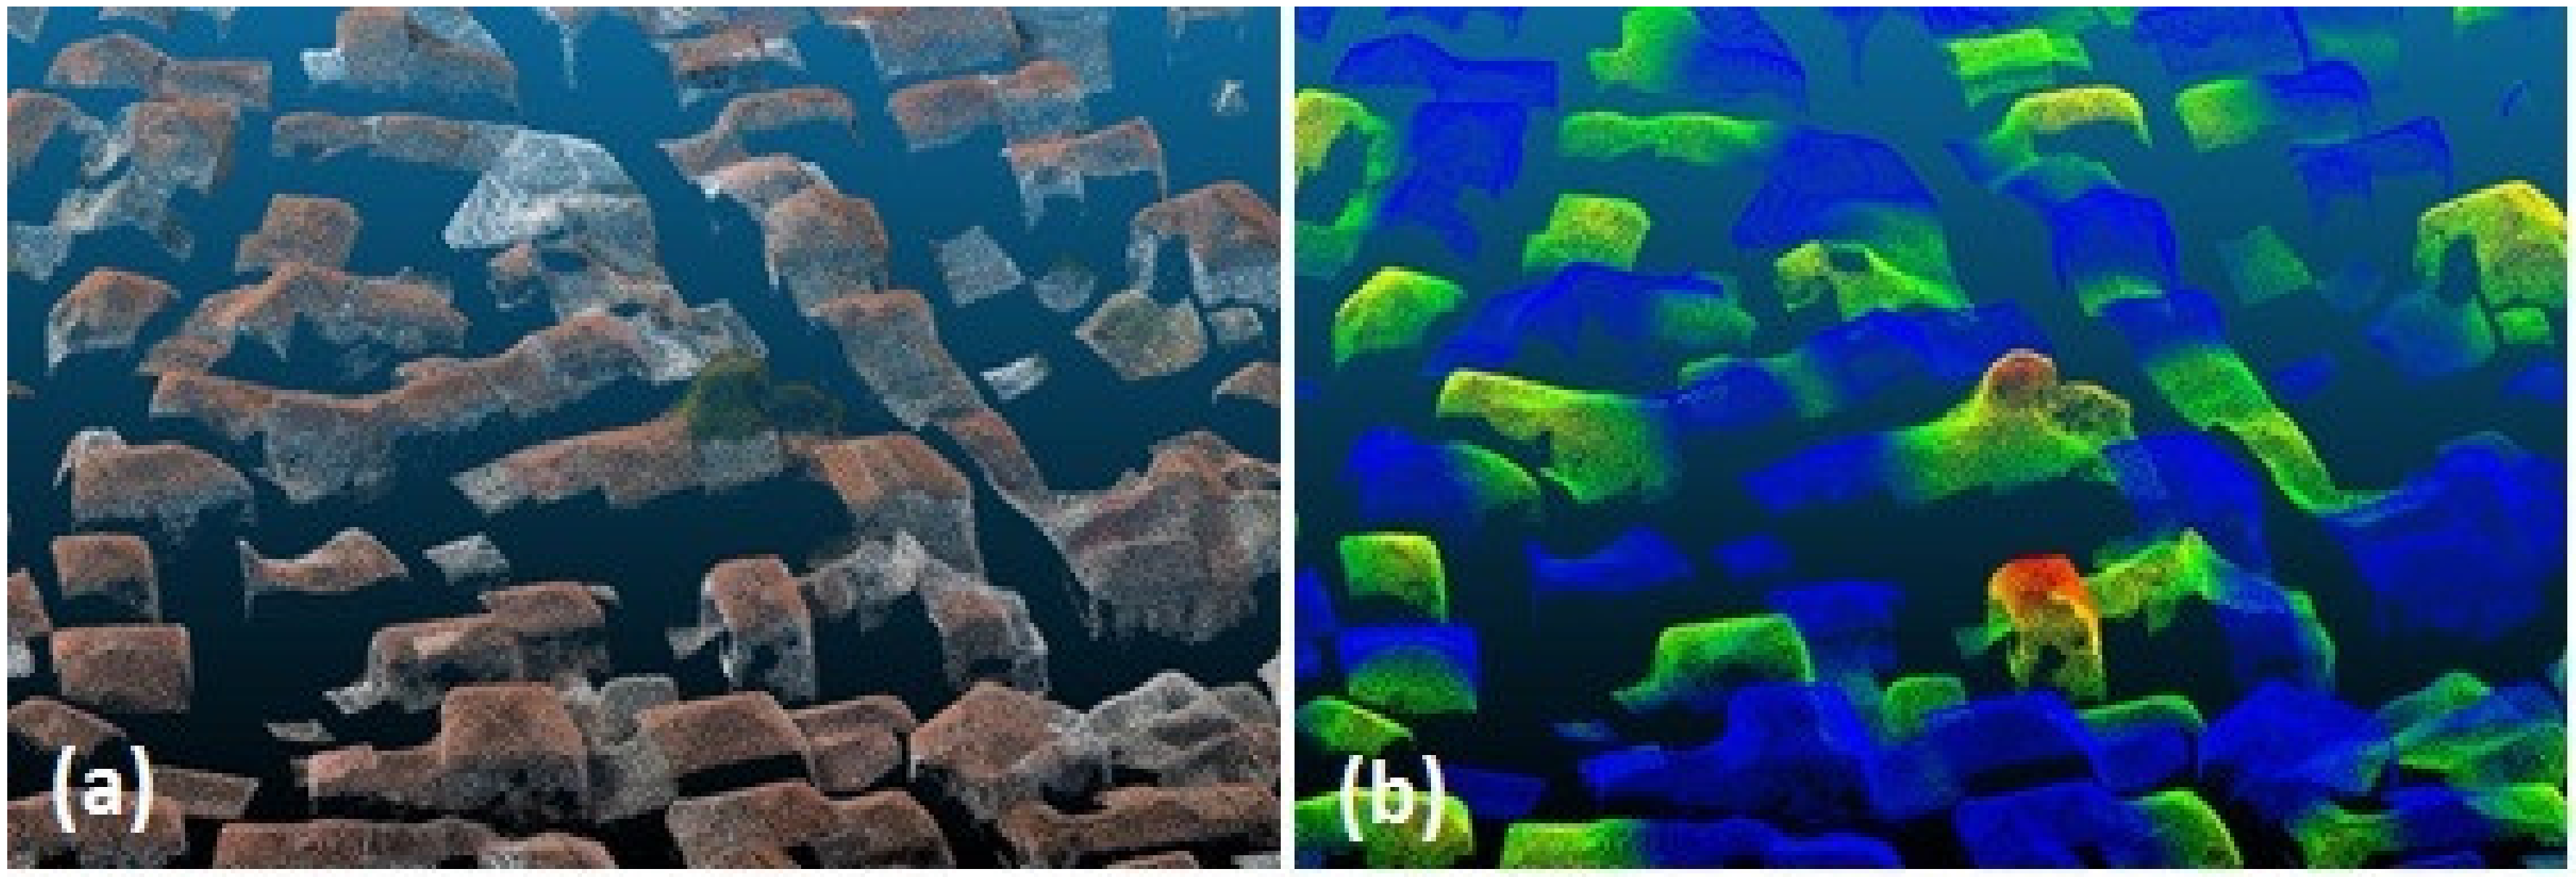
3.4. Demolition Detection Algorithm with 3D Point Cloud
3.5. Demolition Detection Algorithm from DSMs
4. Conclusions
Author Contributions
Funding
Acknowledgments
Conflicts of Interest
Appendix A


| Threshold | 0.5 | 1 | 1.5 | 2 | 2.5 | 3 | 3.5 | |||||||
|---|---|---|---|---|---|---|---|---|---|---|---|---|---|---|
| 0 | 1 | 0 | 1 | 0 | 1 | 0 | 1 | 0 | 1 | 0 | 1 | 0 | 1 | |
| 0 | 546 | 284 | 745 | 85 | 814 | 16 | 826 | 4 | 827 | 3 | 829 | 1 | 829 | 1 |
| 1 | 1 | 240 | 4 | 237 | 8 | 233 | 24 | 217 | 48 | 193 | 73 | 168 | 97 | 144 |
| Accuracy | 0.734 | 0.917 | 0.978 | 0.974 | 0.952 | 0.931 | 0.908 | |||||||
| Sensitivity | 0.996 | 0.983 | 0.967 | 0.900 | 0.801 | 0.967 | 0.598 | |||||||
| Specificity | 0.658 | 0.898 | 0.981 | 0.995 | 0.996 | 0.999 | 0.999 | |||||||
| Kappa | 0.461 | 0.787 | 0.936 | 0.923 | 0.854 | 0.778 | 0.694 | |||||||
References
- Johnson, L.A.; Olshansky, R.B.; Olshansky, J.A. After Great Disasters: How Six Countries Managed Community Recovery; Lincoln Institute of Land Policy: Cambridge, MA, USA, 2016. [Google Scholar]
- Alexander, D. Principles of Emergency Planning and Management, 6th ed.; Dunedin Academic Press Ltd.: Edinburg, UK, 2012; ISBN 978-1-903544-10-5. [Google Scholar]
- Contreras, D.; Blaschke, T.; Kienberger, S.; Zeil, P. Myths and realities about the recovery of L’Aquila after the earthquake. Int. J. Disaster Risk Reduct. 2014, 8, 125–142. [Google Scholar] [CrossRef] [PubMed] [Green Version]
- Ubaura, M. Changes in Land Use After the Great East Japan Earthquake and Related Issues of Urban Form. In The 2011 Japan Earthquake and Tsunami: Reconstruction and Restoration: Insights and Assessment after 5 Years; Santiago-Fandiño, V., Sato, S., Maki, N., Iuchi, K., Eds.; Springer International Publishing: Cham, Switzerland, 2018; pp. 183–203. ISBN 978-3-319-58691-5. [Google Scholar]
- Bhanumurthy, V.; Shankar, G.J.; Rao, K.R.M.; Nagamani, P.V. Defining a framework for integration of geospatial technologies for emergency management. Geocarto Int. 2015, 30, 963–983. [Google Scholar] [CrossRef]
- Gutman, G.; Justice, C.; Sheffner, E.; Loveland, T. The NASA Land Cover and Land Use Change Program. In Land Change Science. Remote Sensing and Digital Image Processing vol 6; Gutman, G., Janetos, A.C., Justice, C.O., Moran, E.F., Mustard, J.F., Rindfuss, R.R., Skole, D.L., Turner, B.L.I., Cochrane, M.A., Eds.; Springer: Dordrecht, The Netherlands, 2004; pp. 17–29. [Google Scholar]
- Doi, A.; Oshida, K.; Takashima, Y.; Sakakibara, K.; Itoh, T. 3D Modeling of Reconstruction Plan at Sanriku Coast for Great East Japan Earthquake: Visualization of the Reconstruction Plan for Effective Information Sharing. In Proceedings of the 2016 19th International Conference on Network-Based Information Systems (NBiS), Ostrava, Czech Republic, 7–9 September 2016; pp. 397–400. [Google Scholar]
- Zekkos, D.; Greenwood, W.; Lynch, J.; Manousakis, J.; Athanasopoulos-Zekkos, A.; Clark, M.; Saroglou, C. Lessons Learned from The Application of UAV-Enabled Structure-From-Motion Photogrammetry in Geotechnical Engineering. ISSMGE Int. J. Geoengin. Case Hist. 2018, 4, 254–274. [Google Scholar]
- Dominici, D.; Alicandro, M.; Massimi, V. UAV photogrammetry in the post-earthquake scenario: Case studies in L’Aquila. Geomat. Nat. Hazards Risk 2017, 8, 87–103. [Google Scholar] [CrossRef] [Green Version]
- Boccardo, P.; Chiabrando, F.; Dutto, F.; Tonolo, F.; Lingua, A. UAV Deployment Exercise for Mapping Purposes: Evaluation of Emergency Response Applications. Sensors 2015, 15, 15717–15737. [Google Scholar] [CrossRef] [Green Version]
- Gomez, C.; Purdie, H. UAV—Based Photogrammetry and Geocomputing for Hazards and Disaster Risk Monitoring—A Review. Geoenviron. Disasters 2016, 3, 23. [Google Scholar] [CrossRef] [Green Version]
- Perouse, E.; Benedetti, L.; Fleury, J.; Rizza, M.; Puliti, I.; Billant, J.; Van der Woerd, J.; Feuillet, N.; Jacques, E.; Pace, B. Coseismic Slip Vectors of 24 August and 30 October 2016 Earthquakes in Central Italy: Oblique Slip and Regional Kinematic Implications. Tectonics 2018, 37, 3760–3781. [Google Scholar] [CrossRef] [Green Version]
- Calantropio, A.; Chiabrando, F.; Sammartano, G.; Spanò, A.; Teppati Losè, L. UAV strategies validation and remote sensing data for damage assessment in post-disaster scenarios. ISPRS Int. Arch. Photogramm. Remote Sens. Spat. Inf. Sci. 2018, XLII-3/W4, 121–128. [Google Scholar] [CrossRef] [Green Version]
- Yamazaki, F.; Kubo, K.; Tanabe, R.; Liu, W. Damage assessment and 3d modeling by UAV flights after the 2016 Kumamoto, Japan earthquake. In Proceedings of the 2017 IEEE International Geoscience and Remote Sensing Symposium (IGARSS), Fort Worth, TX, USA, 23–28 July 2017; pp. 3182–3185. [Google Scholar]
- Chiabrando, F.; Di Lolli, A.; Patrucco, G.; Spanò, A.; Sammartano, G.; Teppati Losè, L. Multitemporal 3D modelling for cultural heritage emergency during seismic events: damage assesment of s. agostino church in amatrice (RI). ISPRS Int. Arch. Photogramm. Remote Sens. Spat. Inf. Sci. 2017, XLII-5/W1, 69–76. [Google Scholar] [CrossRef] [Green Version]
- Zekkos, D.; Manousakis, J.; Athanasopoulos-Zekkos, A.; Clark, M.; Knoper, L.; Massey, C.; Archibald, G.; Greenwood, W.; Hemphill-Haley, M.; Rathje, E.; et al. Structure-from-Motion based 3D mapping of landslides & fault rupture sites during 2016 Kaikoura earthquake reconnaissance. In Proceedings of the Eleventh U.S. National Conference on Earthquake Engineering, Integrating Science, Engineering & Policy, Los Angeles, CA, USA, 25–29 June 2018. [Google Scholar]
- Soulakellis, N.; Tataris, G.; Papadopoulou, E.; Chatzistamatis, S.; Vasilakos, C.; Kavroudakis, D.; Roussou, O.; Papakonstantinou, A. Synergistic Exploitation of Geoinformation Methods for Post-earthquake 3D Mapping and Damage Assessment. In Intelligent Systems for Crisis Management; Altan, O., Chandra, M., Sunar, F., Tanzi, T.J., Eds.; Lecture Notes in Geoinformation and Cartography; Springer International Publishing: Cham, Switzerland, 2019; pp. 3–31. ISBN 978-3-030-05329-1. [Google Scholar]
- Vasilakos, C.; Chatzistamatis, S.; Roussou, O.; Soulakellis, N. Comparison of Terrestrial Photogrammetry and Terrestrial Laser Scanning for Earthquake Response Management. In Intelligent Systems for Crisis Management; Altan, O., Chandra, M., Sunar, F., Tanzi, T.J., Eds.; Lecture Notes in Geoinformation and Cartography; Springer International Publishing: Cham, Switzerland, 2019; pp. 33–57. ISBN 978-3-030-05329-1. [Google Scholar]
- Papakonstantinou, A.; Doukari, M.; Roussou, O.; Drolias, G.C.; Chaidas, K.; Moustakas, A.; Athanasis, N.; Topouzelis, K.; Soulakellis, N. UAS multi-camera rig for post-earthquake damage 3D geovisualization of Vrisa village. In Proceedings of the Sixth International Conference on Remote Sensing and Geoinformation of Environment (RSCy2018), Paphos, Cyprus, 26–29 March 2018. [Google Scholar]
- Chang, K.J.; Chan, Y.C.; Chen, R.F.; Hsieh, Y.C. Geomorphological evolution of landslides near an active normal fault in northern Taiwan, as revealed by lidar and unmanned aircraft system data. Nat. Hazards Earth Syst. Sci. 2018, 18, 709–727. [Google Scholar] [CrossRef] [Green Version]
- Peternel, T.; Kumelj, Š.; Oštir, K.; Komac, M. Monitoring the Potoška planina landslide (NW Slovenia) using UAV photogrammetry and tachymetric measurements. Landslides 2017, 14, 395–406. [Google Scholar] [CrossRef]
- Franke, K.W.; Lingwall, B.N.; Zimmaro, P.; Kayen, R.E.; Tommasi, P.; Chiabrando, F.; Santo, A. Phased reconnaissance approach to documenting landslides following the 2016 Central Italy Earthquakes. Earthq. Spectra 2018, 34, 1693–1719. [Google Scholar] [CrossRef]
- Santo, A.; Santangelo, N.; Forte, G.; De Falco, M. Post flash flood survey: The 14th and 15th october 2015 event in the paupisi-Solopaca area (Southern Italy). J. Maps 2016, 13, 19–25. [Google Scholar] [CrossRef] [Green Version]
- Quaritsch, M.; Kruggl, K.; Wischounig-Strucl, D.; Bhattacharya, S.; Shah, M.; Rinner, B. Networked UAVs as aerial sensor network for disaster management applications. e i Elektrotechnik und Informationstechnik 2010, 127, 56–63. [Google Scholar] [CrossRef]
- Contreras, D.; Blaschke, T.; Tiede, D.; Jilge, M. Monitoring recovery after earthquakes through the integration of remote sensing, GIS, and ground observations: The case of L’Aquila (Italy). Cartogr. Geogr. Inf. Sci. 2016, 43, 115–133. [Google Scholar] [CrossRef]
- Giordan, D.; Hayakawa, Y.S.; Nex, F.; Tarolli, P. Preface: The use of remotely piloted aircraft systems (RPAS) in monitoring applications and management of natural hazards. Nat. Hazards Earth Syst. Sci. 2018, 18, 3085–3087. [Google Scholar] [CrossRef]
- Hashemi-Parast, S.O.; Yamazaki, F.; Liu, W. Monitoring and evaluation of the urban reconstruction process in Bam, Iran, after the 2003 M w 6.6 earthquake. Nat. Hazards 2017, 85, 197–213. [Google Scholar] [CrossRef]
- Qin, R.; Tian, J.; Reinartz, P. 3D change detection—Approaches and applications. ISPRS J. Photogramm. Remote Sens. 2016, 122, 41–56. [Google Scholar] [CrossRef] [Green Version]
- Menderes, A.; Erener, A.; Sarp, G. Automatic Detection of Damaged Buildings after Earthquake Hazard by Using Remote Sensing and Information Technologies. Procedia Earth Planet. Sci. 2015, 15, 257–262. [Google Scholar] [CrossRef] [Green Version]
- Turker, M.; Cetinkaya, B. Automatic detection of earthquake-damaged buildings using DEMs created from pre- and post-earthquake stereo aerial photographs. Int. J. Remote Sens. 2005, 26, 823–832. [Google Scholar] [CrossRef]
- Vetrivel, A.; Gerke, M.; Kerle, N.; Vosselman, G. Identification of damage in buildings based on gaps in 3D point clouds from very high resolution oblique airborne images. ISPRS J. Photogramm. Remote Sens. 2015, 105, 61–78. [Google Scholar] [CrossRef]
- Kiratzi, A. The 12 June 2017 Mw 6.3 Lesvos Island (Aegean Sea) earthquake: Slip model and directivity estimated with finite-fault inversion. Tectonophysics 2018, 724–725, 1–10. [Google Scholar] [CrossRef]
- Papadimitriou, P.; Kassaras, I.; Kaviris, G.; Tselentis, G.-A.; Voulgaris, N.; Lekkas, E.; Chouliaras, G.; Evangelidis, C.; Pavlou, K.; Kapetanidis, V. The 12th June 2017 Mw = 6.3 Lesvos earthquake from detailed seismological observations. J. Geodyn. 2018, 115, 23–42. [Google Scholar] [CrossRef]
- Alexander, D.E. The L’Aquila Earthquake of 6 April 2009 and Italian Government Policy on Disaster Response. J. Nat. Resour. Policy Res. 2010, 2, 325–342. [Google Scholar] [CrossRef]
- Contreras, D.; Forino, G.; Blaschke, T. Measuring the progress of a recovery process after an earthquake: The case of L’aquila, Italy. Int. J. Disaster Risk Reduct. 2018, 28, 450–464. [Google Scholar] [CrossRef]
- Mavroulis, S.; Andreadakis, E.; Spyrou, N.I.; Antoniou, V.; Skourtsos, E.; Papadimitriou, P.; Kasssaras, I.; Kaviris, G.; Tselentis, G.A.; Voulgaris, N.; et al. UAV and GIS based rapid earthquake-induced building damage assessment and methodology for EMS-98 isoseismal map drawing: The June 12, 2017 Mw 6.3 Lesvos (Northeastern Aegean, Greece) earthquake. Int. J. Disaster Risk Reduct. 2019, 37, 20. [Google Scholar] [CrossRef]
- Chatzistamatis, S.; Kalaitzis, P.; Chaidas, K.; Chatzitheodorou, C.; Papadopoulou, E.E.; Tataris, G.; Soulakellis, N. Fusion of TLS and UAV photogrammetry data for post-earthquake 3D modeling of a cultural heritage church. In Proceedings of the Int. Arch. Photogramm. Remote Sens. Spatial Inf. Sci. 2018, XLII-3/W4, 143–150. [Google Scholar]
- Soulakellis, N.A.; Novak, I.D.; Zouros, N.; Lowman, P.; Yates, J. Fusing Landsat-5/TM imagery and shaded relief maps in tectonic and geomorphic mapping: Lesvos Island, Greece. Photogramm. Eng. Remote Sens. 2006, 72, 693–700. [Google Scholar] [CrossRef]
- Post Earthquake Damage and Usability Assessment of Buildings: Further Development and Applications. Final Report. European Commission—D.G. Environment, Civil Protection—EPPO. Available online: https://ec.europa.eu/echo/files/civil_protection/civil/act_prog_rep/peadab.pdf (accessed on 10 June 2020).
- Westoby, M.J.; Brasington, J.; Glasser, N.F.; Hambrey, M.J.; Reynolds, J.M. “Structure-from-Motion” photogrammetry: A low-cost, effective tool for geoscience applications. Geomorphology 2012, 179, 300–314. [Google Scholar] [CrossRef] [Green Version]
- Furukawa, Y.; Ponce, J. Accurate, Dense, and Robust Multiview Stereopsis. IEEE Trans. Pattern Anal. Mach. Intell. 2010, 32, 1362–1376. [Google Scholar] [CrossRef]
- Ramiya, A.M.; Nidamanuri, R.R.; Krishnan, R. Segmentation based building detection approach from LiDAR point cloud. Egypt. J. Remote Sens. Sp. Sci. 2017, 20, 71–77. [Google Scholar] [CrossRef] [Green Version]
- Cohen, J. A coefficient of agreement for nominal scales. Educ. Psychol. Meas. 1960, 20 SRC, 37–46. [Google Scholar] [CrossRef]
- Therneau, T.M.; Elizabeth, J.A. An Introduction to Recursive Partitioning Using the RPART Routines; Atkinson Mayo Foundation: Rochester, MN, USA, 2018. [Google Scholar]
- Zeileis, A.; Hothorn, T.; Hornik, K. Model-based recursive partitioning. J. Comput. Graph. Stat. 2008, 17, 492–514. [Google Scholar] [CrossRef] [Green Version]
- Zhang, H.; Singer, B.H. Recursive Partitioning and Applications; Springer: New York, NY, USA, 2010. [Google Scholar]
- CloudCompare (Version 2.X) [GPL Software]. Available online: http://www.cloudcompare.org/ (accessed on 10 June 2020).
- Hornik, K. The Comprehensive R Archive Network. Wiley Interdiscip. Rev. Comput. Stat. 2012, 4, 394–398. [Google Scholar] [CrossRef]
- Miano, A.; Jalayer, F.; Forte, G.; Santo, A. Empirical fragility curves based on random ground shaking fields: Employing Copernicus-EMS damage grading maps for 2016 amatrice sequence. In Proceedings of the 7th International Conference on Computational Methods in Structural Dynamics and Earthquake Engineering Methods in Structural Dynamics and Earthquake Engineering, Crete, Greece, 24–26 June 2019. [Google Scholar]
- Norton, T.R. Lessons Learned in Disaster Debris Management of the 2011 Great East Japan Earthquake and Tsunami. In The 2011 Japan Earthquake and Tsunami: Reconstruction and Restoration: Insights and Assessment after 5 Years; Santiago-Fandiño, V., Sato, S., Maki, N., Iuchi, K., Eds.; Springer International Publishing: Cham, Switzerland, 2018; pp. 67–88. ISBN 978-3-319-58691-5. [Google Scholar]
- Karunasena, G.; Amaratunga, D. Capacity building for post disaster construction and demolition waste management. Disaster Prev. Manag. Int. J. 2016, 25, 137–153. [Google Scholar] [CrossRef] [Green Version]
- Faleschini, F.; Zanini, M.A.; Hofer, L.; Zampieri, P.; Pellegrino, C. Sustainable management of demolition waste in post-quake recovery processes: The Italian experience. Int. J. Disaster Risk Reduct. 2017, 24, 172–182. [Google Scholar] [CrossRef]


| Number | X—Easting Error (cm) | Y—Northing Error (cm) | Z—Altitude Error (cm) | Total RMS (cm) | |
|---|---|---|---|---|---|
| GCP | 10 | 1.8 | 1.2 | 0.2 | 2.2 |
| Number of Buildings | Material | Number of Stories | |||||
|---|---|---|---|---|---|---|---|
| Masonry | F/C | Mixed | 1 | 2 | 3 | ||
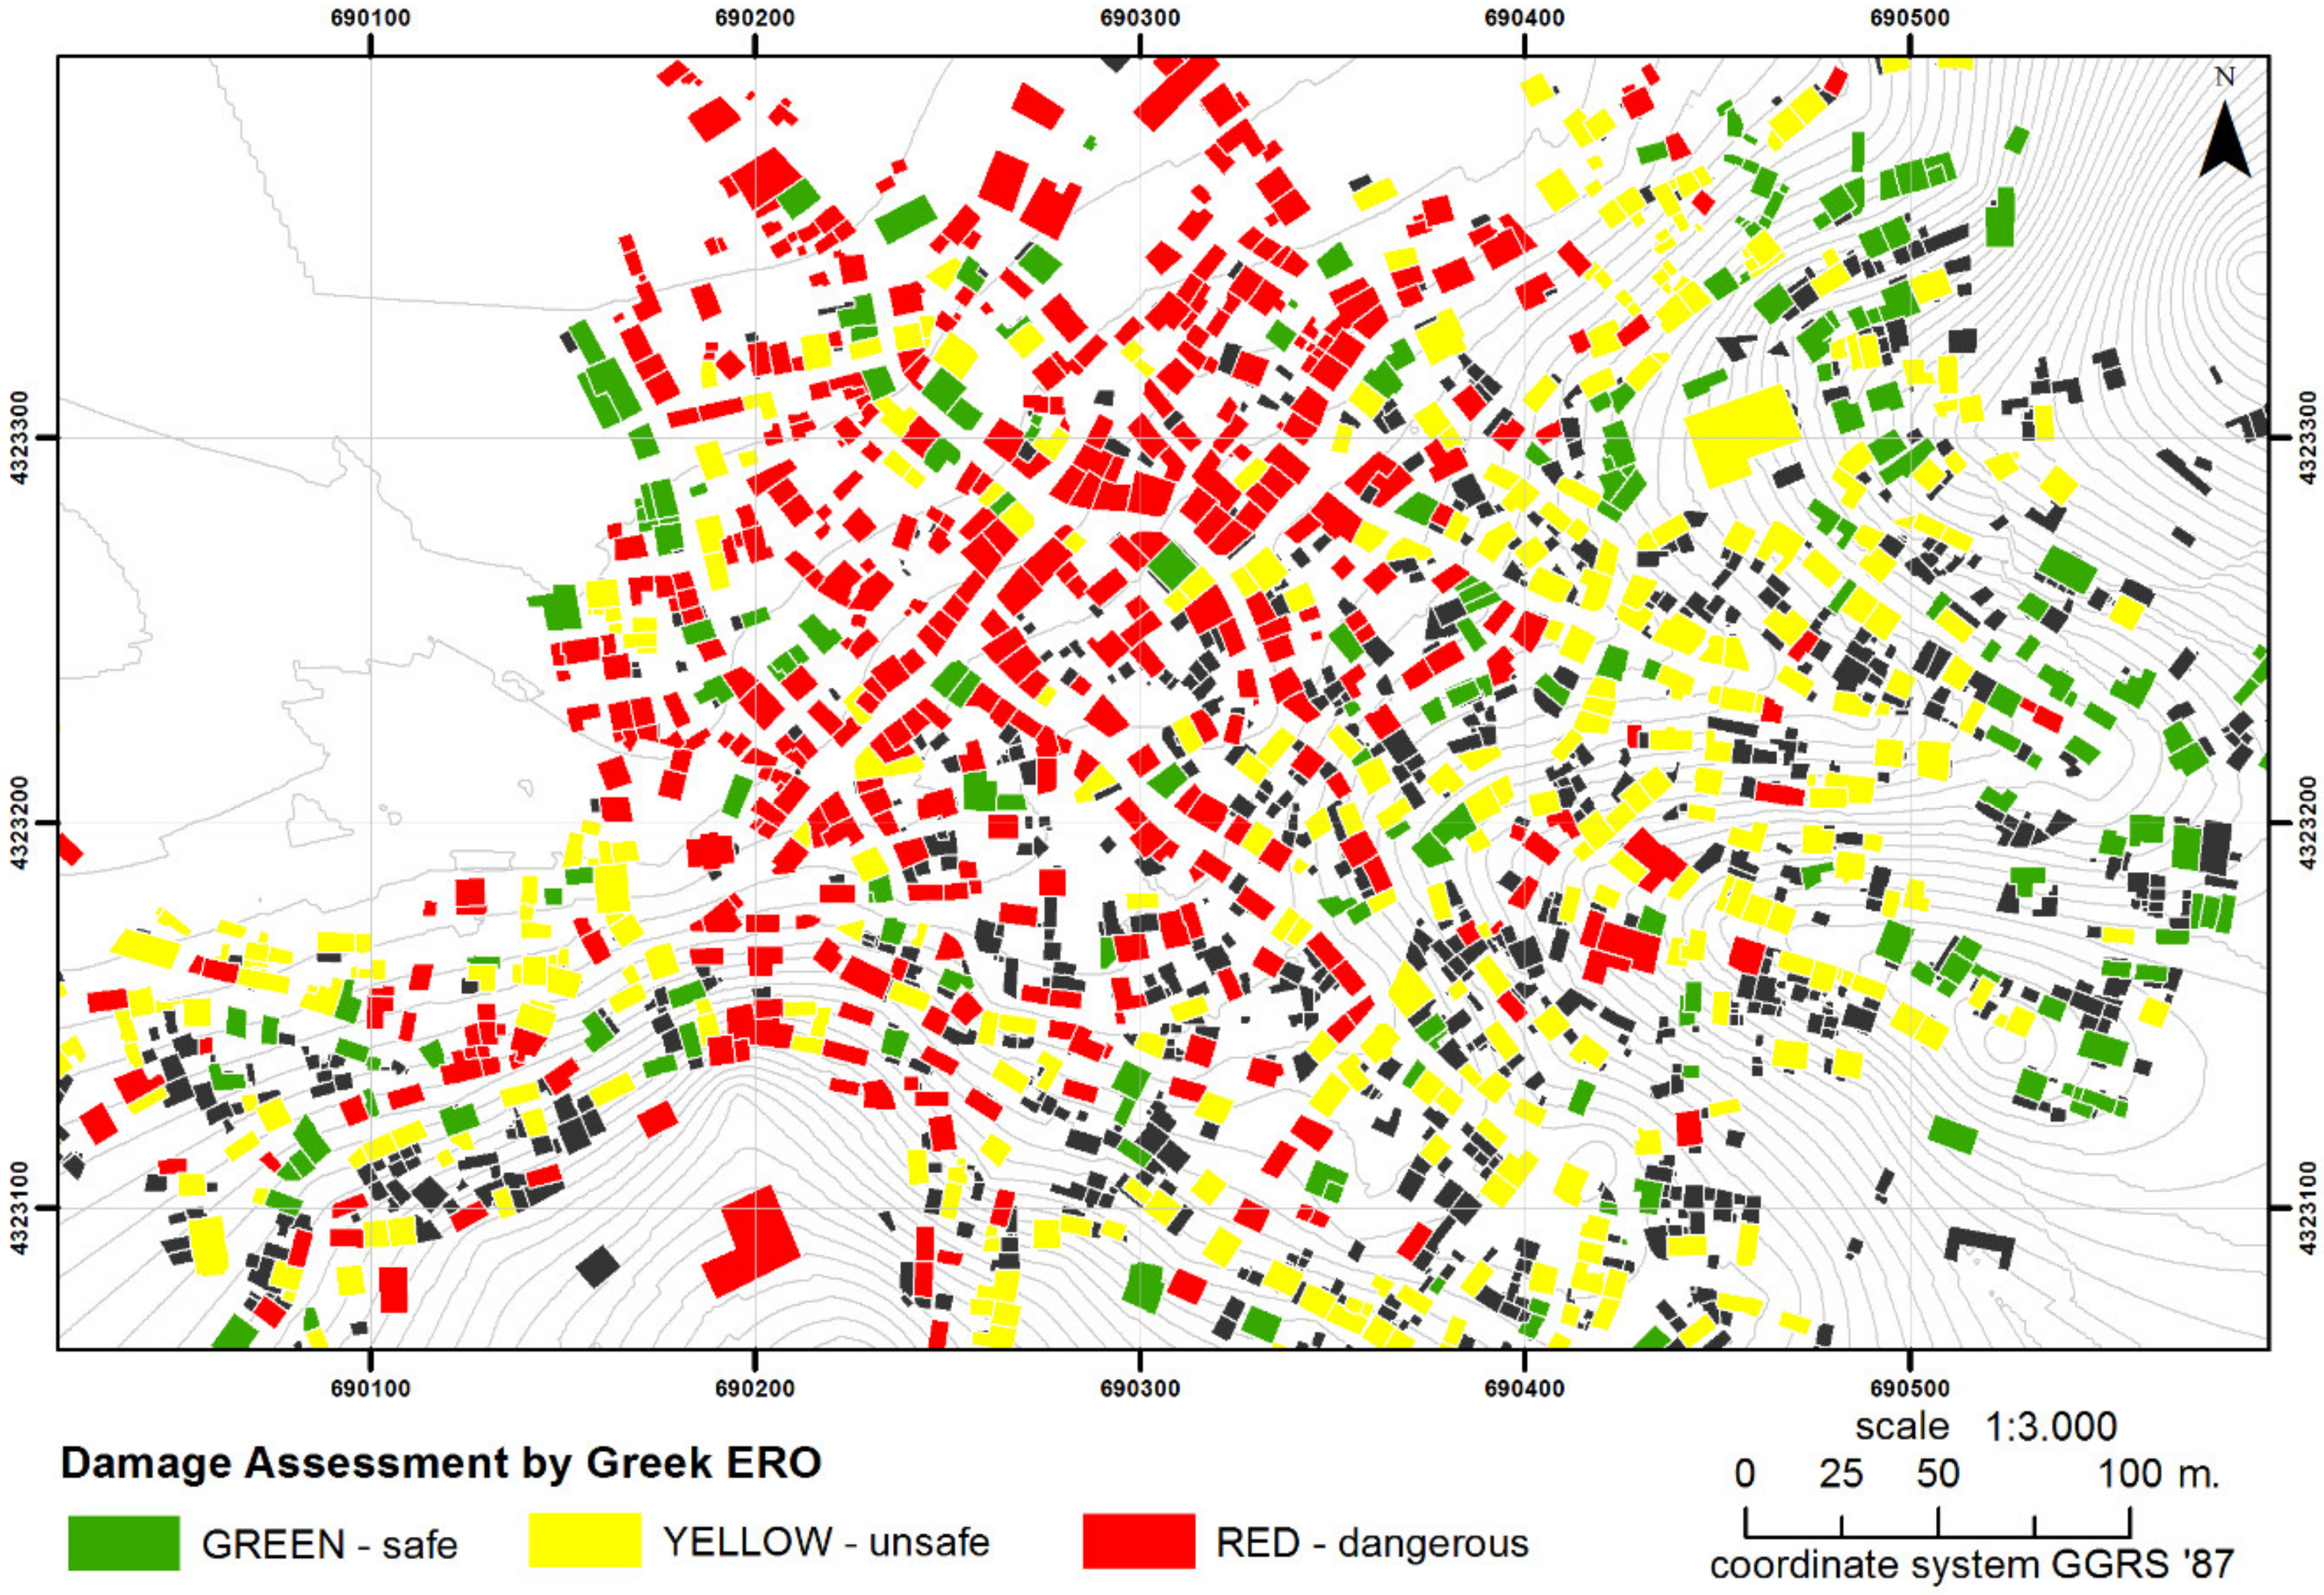
| GREEN | 427 | 357 | 54 | 11 | 113 | 107 | 2 |
| YELLOW | 258 | 242 | 9 | 7 | 107 | 149 | 2 |
| RED | 402 | 394 | 9 | 4 | 203 | 195 | 9 |
| Total | 1087 | 993 | 72 | 22 | 623 | 451 | 13 |
| Demolished buildings (3rd February 2019) | 245 | 240 | 2 | 3 | 131 | 110 | 4 |
© 2020 by the authors. Licensee MDPI, Basel, Switzerland. This article is an open access article distributed under the terms and conditions of the Creative Commons Attribution (CC BY) license (http://creativecommons.org/licenses/by/4.0/).
Share and Cite
Soulakellis, N.; Vasilakos, C.; Chatzistamatis, S.; Kavroudakis, D.; Tataris, G.; Papadopoulou, E.-E.; Papakonstantinou, A.; Roussou, O.; Kontos, T. Post-Earthquake Recovery Phase Monitoring and Mapping Based on UAS Data. ISPRS Int. J. Geo-Inf. 2020, 9, 447. https://doi.org/10.3390/ijgi9070447
Soulakellis N, Vasilakos C, Chatzistamatis S, Kavroudakis D, Tataris G, Papadopoulou E-E, Papakonstantinou A, Roussou O, Kontos T. Post-Earthquake Recovery Phase Monitoring and Mapping Based on UAS Data. ISPRS International Journal of Geo-Information. 2020; 9(7):447. https://doi.org/10.3390/ijgi9070447
Chicago/Turabian StyleSoulakellis, Nikolaos, Christos Vasilakos, Stamatis Chatzistamatis, Dimitris Kavroudakis, Georgios Tataris, Ermioni-Eirini Papadopoulou, Apostolos Papakonstantinou, Olga Roussou, and Themistoklis Kontos. 2020. "Post-Earthquake Recovery Phase Monitoring and Mapping Based on UAS Data" ISPRS International Journal of Geo-Information 9, no. 7: 447. https://doi.org/10.3390/ijgi9070447