

Abstract
In this study, the heat deposition characteristics of laser filaments formed by femtosecond laser pulses with different initial energy under influences of external focusing are numerically investigated by means of (3D + 1)-dimensional numerical simulations. The results indicate that the numbers and intensity of filaments increase with growth of the input energy. The formation of multiple filaments limits the increase of filament length. When fixing the input energy, radius of the filament becomes narrow while its numbers and intensity are both enhanced under strong focusing. Under stronger focusing, the filaments can also deposit higher laser energy and result in larger energy deposition rate for laser beams with a given input energy, which further leads to dramatic increase in local temperature and pressure. These are likely to affect the filament induced airflow velocity and eventually the mass of formed snow in the cold supersaturated cloud chamber.
Export citation and abstract BibTeX RIS
1. Introduction
In recent years, the laser-induced condensation [1–3] and snow formation [4–6] in a specific diffusion cloud chamber has gained considerable researching interests since it provides a new candidate for weather modification with ultrashort laser pulses [7]. However, as complicated as the changes of clouds and rain in nature, understanding the physical mechanism behind these laser-induced phenomena also faces many challenges [8].
The propagation of femtosecond laser pulse in air is accompanied by numerous complicated processes taking place inside the medium [9]. Due to a dynamic balance between optical Kerr self-focusing and plasma induced defocusing, a long self-guided plasma channel forms behind the laser pulse, which is called as filamentation [10]. The normal size of each filament is 40∼200 μm and the clamped intensity within the filaments is in the order of 1014 W cm−2 [11–14]. Under such intense field, on the one hand, the chemical molecules in air, especially oxygen molecules, can be ionized, resulting in high density of electrons. Petit et al [15] showed that the local concentrations of O3, NO, and NO2 generated in the laser filaments active volume could reach up to 1016 cm−3, 3 × 1014 cm−3, and 3 × 1015 cm−3, respectively. After the oxidative chemistry of nitrogen, the newly formed highly hygroscopic acids, such as HNO3 or NH4NO3, will possibly later serve as CCN and allow efficient growth of water droplets in adequate humidity conditions [16–18]. On the other hand, the plasma electrons are also the main carriers of laser energy to transparent media [19]. The deposited energy was eventually converted into gas thermal energy after plasma recombination and rotational thermalization, which results in strong local heating [20], gas expansion [21], and fluid motion [22]. In the laser-induced snowfall formation, the 'convective storm' like air-flow was subsequently proposed to sustain supersaturation [5] and increase the efficiency of particle-particle collisions, thereby assisting large-sized particles generation [23, 24].
In the laser-induced snow formation experiments by Sun et al [25], it was shown that, for a lens with 50 cm focal length, though the mass of snow and airflow velocity increase with pulse energy range from 0.71 mJ ∼ 4.5 mJ, both of them decrease instead from 4.5 mJ to 7.1 mJ. The sharp decrease was supposed to be caused by the formation of multiple filaments. However, the actual mechanism for the sharp decrease of snow mass with respect to pulse energy still remains unclear and more quantitative results of laser filaments in the experiments are still needed to be investigated.
In this paper, we address these issues numerically with a 3D + 1 propagation model. We propose a way to explain these phenomena from the perspective of heat deposition characteristics of laser filaments. In previous studies, although there have been many numerical studies on the formation of multiple filaments [26], the heat deposition of multiple filaments has not been investigated much yet. We organize the content as follows: section 2 introduces the basic physical processes and computational model employed in the simulations. In section 3, the mechanisms are discussed based on the simulation results. The conclusions are summarized in section 4.
2. Theoretical model
2.1. Basic physical processes
According to cloud physics theory, there are many physical processes that can affect the formation and growth of snow crystals [27]. Figure 1 briefly summarizes the basic physical effects involved from the filamentation. In this paper, the heat deposition process we consider mainly includes the stage from laser pulse energy deposition to local temperature disturbance (ΔT) and pressure disturbance (Δp) as shown in the yellow area in figure 1, which can be regarded as a very important link between laser physical processes and atmospheric physical processes such as thermal diffusion and turbulent motion.

Figure 1. Schematic of the heat deposition process and its related timescales.
Download figure:
Standard image High-resolution image2.2. Simulation of laser transmission
In Fourier space, the evolution of the scalar electric field envelope  along the propagation direction z is described by the 3D + 1 unidirectional pulse envelope propagation equation (UPPE) expressed by [28]:
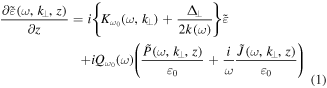
where  denotes the Fourier transform of
  and
and  is transverse wave vector. The angular frequency of the carrier wave is ω0 = 2πc/λ0 (λ0 = 800 nm). The linear effects of dispersion, diffraction, space-time coupling and normal group-velocity dispersion (GVD) is described by [29]:

The nonlinear dispersion function can be written as:

In equation (1), the Laplacian operator  accounts for the beam transverse diffraction. The other two source terms
  and
and  account for the nonlinear polarization and current, respectively. The nonlinear polarization is calculated from the following relation:

where n0 = n(ω0) and n2 denote the linear and nonlinear refractive index of the medium, respectively.
The current term in the framework of the Drude model reads:
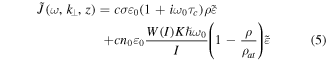
where σ denotes the cross section for inverse bremsstrahlung and τc is the collision time. The intensity dependent ionization rate  scales as
  and
and  where
where  denotes the number of photons at the frequency ω0, Ui is the ionization potential energy, ρat is the neutral atom density, and βK denotes the ionization cross section for MPA with coefficient σK corresponding to the number of K-photons. In the laser-induced snow formation experiment, because the distance of laser transmission in the cloud chamber is relatively short, we ignore the cumulative impact of possible existing background water droplets or tiny ice particles on the transmission of fs laser pulses as discussed in [30, 31].
The evolution of electron density ρ is described as:

The two terms on the right-hand side of equation (6) account for multiphoton ionization (MPI) and avalanche ionization (inverse Bremsstrahlung), respectively. A list of parameters and their values used in the simulations is provided in table 1.
Table 1. Parameters used in equations (1) to (6).
| Parameters | Symbol (units) | Values |
|---|---|---|
| Vacuum wavelength | λ0 (nm) | 800 |
| Dispersion coefficient | k'' (s2 · m−1) | 2.0 × 10⁻²⁹ |
| Collision time | τc (fs) | 350 |
| Cross section | σ (m2) | 4.7 × 10⁻²² |
| Nonlinear Kerr index | n2 (10−19 cm2 · W−1) | 1.2 |
| Ionization potential | U (eV) | 11 |
| MPA order | K | 10 |
| MPA(Keldysh) | βK (W1−K · m2K−3) | 1.27 × 10−160 |
| Neutral molecule density | ρat (cm−3) | 2.7 × 1025 |
In the simulation, equation (1) is solved using full-step (not split-step) Fast Fourier Transformation in transverse space and time dimensions and equation (6) is solved via the fourth-order Runge–Kutta method [32].
2.3. The heat conduction model
A stronger laser filament would induce more heat release through plasma recombination [33]. The instantaneous increase of temperature and pressure has a very important influence on the subsequent thermodynamic processes. Because the pulse transit time (∼ps) and the thermalization time (∼ps) are much shorter than the air flow motion time scales, the process of heating due to filamentation can be considered as an isochoric (constant volume) process [34]. The first law of thermodynamics is used to estimate the temperature variation caused by the heat release, which can be expressed as:

where cv is the gas isochoric heat capacity per molecule. At p = 1013 hPa and T = 300 K, air can be approximately regarded as an ideal diatomic molecular gas and cv = 5kB/2, where kB = 1.38 × 10⁻²³ J · K−1 is Boltzmann constant. ρ0 = 2.7 × 1027 m−3 is the neutral density of gas. In the case of an initial temperature and pressure profile with cylindrical symmetry, equation (7) can be further simplified as:


where r0(z) denotes the half width at half maximum (HWHM) of the temperature profile at z [34]. For simplicity, we assume it is approximately equal to radius of the filament (≈150 μm) in this study. Based on the above simplifications, the equations (8) and (9) can be further reduced to:

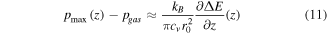
Thus, the maximum local temperature and pressure variation are approximately proportional to  defined as the energy deposition rate per unit length along the propagation axis, which can be calculated by [35]:

where  denotes the density of nonlinear losses. The plasma recombination mainly accounts for heat release [33]. Therefore, according to equation (6), we estimated the density of nonlinear losses with the following equation:

As above, the maximum local temperature and pressure variation caused by the released heat from the filament can be calculated based on equations (10) to (13).
3. Results and discussion
3.1. Characteristics of optical filaments
The initial pulse investigated in this paper is a Gaussian beam and its spatiotemporal envelope of the electric field is given as:
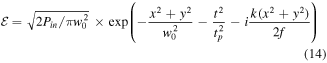
where Pin is the input power, w0 = 3 mm is the beam width, and tp = 25 fs is the pulse duration. The energy of the input pulse is  The initial beam passes through a lens with focal length f.
Figure 2 shows variation of on-axis intensity, on-axis electron density, and beam radius along propagation distance z for laser beams with Ein = 4.5 mJ and Ein = 7.1 mJ under external lens of focal length f = 30 cm and f = 50 cm, respectively. As seen from figure 2(a), the on-axis intensity of filament with f = 30 cm lens is higher than that with f = 50 cm lens, which leading to higher electron density in the filament (figure 2(b)). For a given focal length, the on-set distance of filamentation (as shown by the position where the on-axis intensity increases rapidly) is very close for pulses with Ein = 4.5 mJ and Ein = 7.1 mJ. When the input pulse energy increases from 4.5 mJ to 7.1 mJ, the peak on-axis electron density decreases whereas the length of filament tends to increase for pulse with f = 30 cm focal length as roughly seen from the evolution of on-axis intensity. For the pulse with f = 50 cm focal length, the electron density increases whereas the length of filament decreases, which is opposite to the case of f = 30 cm lens. As seen from figure 2(c), the radius of filament increases with the input energy increases. When fixing input energy, the radius tends to be slightly larger under longer external focusing.

Figure 2. Evolution of (a) on-axis intensity, (b) on-axis electron density, and (c) beam radius versus propagation distance z for laser pulse with input energy Ein = 4.5 mJ (left column) and Ein = 7.1 mJ (right column).
Download figure:
Standard image High-resolution imageIn order to acquire a deeper insight into effects of input pulse energy and external focusing on the temporal dynamics of filaments, we present the evolution of the temporal distribution of the on-axis intensity in figure 3. As shown in these figures, the external focusing strongly affects the distribution of the intensity before and after the focus lens in the clamping region. Clear on-axis pulse splitting effect can be seen at the focus position. Comparing the two figures on the left column of figures 3(a) and (b), the values of their on-axis intensity almost has no difference. However, more obvious pulse splitting (indicated by white dummy arrow) appears after the focusing position for the pulse with input energy Ein = 7.1 mJ. At the post-filamentation region, an intense few-cycle pulse with a duration of ∼50 fs forms in both cases. Comparing the two figures on the right column of figures 3(a) and (b), the pulse with input energy Ein = 7.1 mJ experiences more obvious on-axis pulse splitting than that of pulse with input energy Ein = 4.5 mJ. In particular, at the position z ≈ 0.60 m, the trailing part of the pulse is completely separated from the front of the pulse (indicated by white dotted ellipse). The pulse with input energy Ein = 4.5 mJ forms an intense few-cycle pulse with a duration of ∼40 fs, which lasts longer transmission distance than that of pulse with input energy Ein = 7.1 mJ.

Figure 3. The temporal distribution of the on-axis intensity (in units of W · m−2) along the propagation distance z for laser pulse with input energy (a) Ein = 4.5 mJ and (b) Ein = 7.1 mJ with f = 30 cm (left column) and f = 50 cm (right column), respectively.
Download figure:
Standard image High-resolution imageThe spatial distribution of energy fluence, which is defined as the total energy per unit area at different distances is depicted in figure 4. The energy fluence is calculated by:


Figure 4. The fluence distribution in x-z plane for laser pulse with input energy (a) Ein = 4.5 mJ and (b) Ein = 7.1 mJ with f = 30 cm (left column) and f = 50 cm (right column), respectively.
Download figure:
Standard image High-resolution imageAs shown in figure 4, the highlighted part of the profiles clearly indicates the on-set distance and its distribution of filaments. Only one main defocusing-refocusing cycle is visible in the filament for the four cases. Near the nonlinear focus, clear ripples emitted from the core of the filament are visible. Their peak fluence is all close to 7.0 J · cm−2. The spatial splitting of the pulse can be clearly observed after the focus position, as indicated by white dummy arrow in left column of figure 4(a). In the right column of figure 4(b), there is also spatial splitting of the pulse occurring before the fluence reaches the maximum value (indicated by white dummy arrow). The different location of multiple filament formation may have important influence on characteristics of heat deposition due to the energy competition between filaments [36]. In addition, due to the formation of multiple filaments under f = 50 cm focal length, the peak fluence slightly decreases.
To appreciate the evolution of the overall structure of the waveform more clearly, we present the transverse profile of fluence at different propagation positions in figure 5. As shown in the figures, the radius of the beam decreases during the self-focusing process (z = 0.2 m in figures 5(a) and (b), z = 0.4 m in figures 5(c) and (d)). With the filament propagation, the radius of the beam gradually becomes larger. The hot spots in the transverse section clearly indicate the formation of a structure made up of multiple filaments. During the filamentation, the intensity and numbers of filaments increase with the growth of initial pulse energy for a given external focal length of lens. When fixing the initial energy, the pulses also tend to form higher intensity and more numbers of filaments under stronger focusing.

Figure 5. Log-scale map of the spatial profile of fluence at different distances for laser pulse with input energy (a) Ein = 4.5 mJ with f = 30 cm, (b) Ein = 7.1 mJ with f = 30 cm; (c) Ein = 4.5 mJ with f = 50 cm, (d) Ein = 7.1 mJ with f = 50 cm.
Download figure:
Standard image High-resolution image3.2. Characteristics of heat deposition
As the energy deposition of filamentation and subsequent heat release is the primary cause of the air-flow motion [22], which is a key mechanism affecting the efficiency of the snow formation, the influence of the multiple filament formation on these processes was further investigated based on the simulation results. Here, the difference between the input energy and output energy (ΔE = Ein−Eout) is used to define the energy deposition. Meanwhile, the ratio of deposited energy to input energy (Eout/Ein), which is defined as the relative deposited energy, is also used to understand the characteristics of energy deposition.
Figure 6 presents the evolution of the total deposited energy, absorbed deposited energy rate, estimated local maximum temperature variation, and local maximum pressure variation (see section 2.3) along the propagation distance z. It should be noted that the energy for pulse with Ein = 4.5 mJ is increased by 2.6 mJ for comparison. As shown in figure 6(a), the total deposited energy of pulse with Ein = 7.1 mJ is significantly larger than that of pulse with Ein = 4.5 mJ. When fixing the input pulse energy, the total deposited energy becomes higher for laser pulse with a 30 cm focal length than a 50 cm focal length. The relative deposited energy is 36.76% and 32.75% for pulse with Ein = 4.5 mJ when f = 30 cm and f = 50 cm, respectively. When the input pulse energy increases to 7.1 mJ, the relative deposited energy becomes 43.62% and 40.33% for pulses with f = 30 cm and f = 50 cm. The relative deposited energy increases significantly with input energy. The energy deposition rate is also very different, which can be seen from figure 6(b). The laser pulse with Ein = 7.1 mJ and f = 30 cm can achieve the highest energy deposition rate. Its maximal value is about 95 mJ · m−1, which is much larger than that of laser pulse with Ein = 7.1 mJ and f = 50 cm (58 mJ · m−1), and also larger than laser pulse with Ein = 4.5 mJ and f = 30 cm (62 mJ · m−1).

Figure 6. Evolution of (a) total deposited energy, (b) rate of absorbed deposited energy, (c) estimated maximum local temperature, and (d) estimated maximum local pressure along propagation distance z. The solid red line represents pulse with Ein = 4.5 mJ and f = 30 cm, the dash red line represents pulse with Ein = 4.5 mJ and f = 50 cm, the solid blue line represents pulse with Ein = 7.1 mJ and f = 30 cm, and the dash blue line represents pulse with Ein = 7.1 mJ and f = 50 cm.
Download figure:
Standard image High-resolution imageAccording to the maximum temperature variation range of the transmission path depicted in figure 6(c), the local temperature variation range and the increase amplitude are much higher for the filaments with f = 30 cm. The maximum pressure experiences the similar variation as temperature. This is favorable to the formation of the stronger airflow motion and eventually more mass of snow in the cloud chamber.
In order to adequately understand the influences of input pulse energy on the characteristics of laser filaments, figure 7 shows the simulated dependence of various filamentation parameters including length of filament (Lf), maximum electron density (ρmax), peak fluence (Fmax), total deposited energy (ΔE), maximum energy deposition rate ( ), and maximum local temperature variation (ΔT) as a function of input energy. Here, we define the filament length as the length from the onset distance to the value of the peak plasma density less than 1014 cm−3 at the last beam collapse [37]. As shown in figure 7(a), the increase of filament length is limited by the formation of multiple filaments with the growth of the pulse energy. The input energy could also affect the intensity of filament. We see that both the electron density and the peak fluence in the filament increase with the input energy increases (figures 7(b) and (c)). In particular, the increase for cases with f = 30 cm is more obvious when the energy increases from 3.0 mJ to 7.1 mJ. Due to the generation of more electrons with the growth of initial energy, the deposited energy also increases with the input energy increases (figure 7(d)). When fixing the input energy, the maximum electron density of pulses with f = 30 cm is higher than that of pulses with f = 50 cm, which also leads to the higher deposited energy in the former case. We also calculate the rate of absorbed deposited energy by the gaseous medium. The evolution of maximum rate of deposited energy is presented in figure 7(e). It can be seen that the pulses with higher input energy can obtain a larger rate of deposited energy, especially for pulses with f = 30 cm. The larger rate of deposited energy indicates the higher increase of local temperature and pressure (figure 7(f)), which could help to create stronger airflow and more snow in the cloud chamber.

Figure 7. Evolution of (a) length of filament, (b) peak electron density, (c) peak fluence Fmax, (d) deposited energy, (e) maximum rate of energy deposition, and (f) maximum local temperature variation with input energy Ein for a tp = 25 fs, w0 = 3 mm laser pulse at 800 nm with a 50 cm and 30 cm focal length.
Download figure:
Standard image High-resolution image
Based on the above analysis, we can see that both the input energy and external focusing seriously influence the filaments formation. The numbers and intensity of filaments increases with the increase of input energy. The increase of filament length is limited by the formation of multiple filaments. For pulses with external lens of f = 50 cm, the filament length involves slightly decrease with the input energy increase. For pulses with a given initial energy, the formed filaments under strong external focusing can deposit higher energy with the increase of input energy due to the higher multiphoton ionization and plasma absorption. The deposited energy rate also evolves significantly increase with the input pulse energy under strong external focusing, which indicates the local maximum temperature and pressure variation also increases with the input energy increases. This is beneficial to the increase of airflow velocity and mass of snow with the input energy under f = 30 cm as reported by Sun et al [25]. However, for pulses with external lens of f = 50 cm, the deposited energy rate of the formed filaments experiences less significant increase with the increase of input energy than lens of f = 30 cm. We speculate that this might be related to the formation of multiple filaments before the focus position. As variation of local temperature and pressure can further influence the microphysical processes like turbulence, evaporation, condensation, and freezing as it in nature, we can expect that the differences in airflow velocity and mass of snow for pulses with different input energy may be primarily influenced by the heat deposition of filaments.
4. Conclusions
In conclusion, in this work, we numerically investigated the characteristics of filaments and its heat deposition undergoing multiple filamentation to understand results of the filament-induced snowfall experiments. We found that the numbers and intensity of filaments increases with the increase of input energy. When fixing the input energy, the radius of filament becomes narrow while its numbers and intensity are enhanced under strong external focusing. The increase of filament length is limited by the formation of multiple filaments. The shorter focal length of lens also helps to enhance the rate of energy deposition of filament, which results in dramatic increase in local temperature and pressure. The formation of multiple filaments before the focus position for pulses with Ein = 7.1 mJ under f = 50 cm may account for the sharp decrease of airflow velocity and mass of formed snow in the experiment. These results reported here further confirmed that the efficiency of filament-induced snowfall was closely related to the intensity and length of laser filaments, and also the heat deposition of filaments. Our results may serve as a reference for seeking the way to increase the efficiency of laser-induced water condensation applications.
Acknowledgments
This work has been funded by National Natural Science Foundation of China (NSFC) (41575024, 41875025); The Strategic Priority Research Program (B) of Chinese Academy of Sciences (No. XDB160104).