Surface Plasmon Resonance Sensor Based on Dual-Side Polished Microstructured Optical Fiber with Dual-Core
by
 , ,
, ,
Haixia Han
1 ,
,
Donglian Hou
1,
Nannan Luan
1,*,
Zhenxu Bai
1, 
Li Song
1,
Jianfei Liu
1 and
Yongsheng Hu
2 1
Tianjin Key Laboratory of Electronic Materials and Devices, School of Electronics and Information Engineering, Hebei University of Technology, Tianjin 300401, China
2
State Key Laboratory of Luminescence and Applications, Changchun Institute of Optics, Fine Mechanics and Physics, Chinese Academy of Sciences, Changchun 130033, China
*
Author to whom correspondence should be addressed.
Sensors 2020, 20(14), 3911; https://doi.org/10.3390/s20143911
Submission received: 26 May 2020
/
Revised: 2 July 2020
/
Accepted: 8 July 2020
/
Published: 14 July 2020
(This article belongs to the Special Issue Enabling Technology in Optical Fiber Communications: From Device, System to Networking)
Abstract
:A surface plasmon resonance (SPR) sensor based on a dual-side polished microstructured optical fiber (MOF) with a dual core is proposed for a large analyte refractive index (RI; na) detection range. Gold is used as a plasmonic material coated on the polished surface, and analytes can be directly contacted with the gold film. The special structure not only facilitates the fabrication of the sensor, but also can work in the na range of 1.42–1.46 when the background material RI is 1.45, which is beyond the reach of other traditional MOF-SPR sensors. The sensing performance of the sensor was investigated by the wavelength and amplitude interrogation methods. The detailed numerical results showed that the proposed sensor can work effectively in the na range of 1.35–1.47 and exhibits higher sensitivity in the na range of 1.42–1.43.
1. Introduction
Surface plasmon resonance (SPR) is a unique optical property, which refers to the resonance excitation of free electron oscillations at the interface between a metallic layer and a dielectric surface under a p-polarized light radiation, and is extremely sensitive to variations in the refractive index (RI) of the surrounding medium [1,2,3,4,5,6]. Therefore, SPR has been exploited with a wide range of sensing applications in different fields, such as biology, chemistry, and environmental medicine [1,2,3,4,5,6,7,8]. Initially, most SPR sensors were based on the Kretschmann–Raether prism geometry, but prism-based SPR sensing devices have the disadvantages of large volume, limited mechanical reliability, high cost, unsuitability for distributed sensing, and mass production, which are difficult to adapt themselves to the development of optical communication technology [1,2,3,4,5,6,7,8,9,10,11,12,13,14].
To effectively overcome the limitations of prism-based SPR sensors, optical fiber-based SPR sensors have been developed, in which the fiber acts as a prism, coupling incident light with plasmons. Compared with prism-based devices, the optical fiber design is simpler and more flexible, which can reduce the size of the sensor to a large extent. In addition, the advantages of electromagnetic immunity, high degree of integration, mechanical stability, and in situ monitoring have made optical fiber design more and more attractive [1,2,3,4,5,6,7,8,9,10,11,15,16]. However, the phase-matching condition between the core mode and the surface plasmon polariton (SPP) mode of optical fiber-based SPR sensors is difficult to meet. In principle, phase matching happens, when their effective refractive index (neff) values of the two modes are identical. For single-mode fibers, the neff of the SPP mode is usually close to that of the adjacent analyte. For example, the neff of the water is 1.33, and the neff of the core mode is close to that of the core material, which for most practical materials is higher than 1.45 [15,16,17]. Therefore, phase matching occurs only at higher frequencies, and high frequencies limit the penetration depth of the plasmon into the analyte, which reduces the sensitivity of the sensor.
To alleviate phase-matching problems of optical fiber-based SPR sensors, microstructured optical fiber (MOF)-based SPR sensors have been widely studied owing to their design flexibility [9,12,13,14,15,16,17,18,19,20,21,22,23,24,25,26,27,28,29,30,31,32,33,34,35,36,37,38,39,40,41,42,43,44,45,46]. By changing the size, shape, and arrangement of air holes along the propagation direction, the neff can be tuned to the anticipated values and thus can solve the phase-matching problem between the core mode and the SPP mode [9,15,16,17,24,25]. In addition, due to their unique structural characteristics and novel optical properties, MOF-based SPR sensors can significantly improve sensing performance. However, there exists an undetectable range of the RI detection in MOF-based SPR sensors, which limits their application in biological and chemical sensing fields. For instance, when the background material RI of an MOF is 1.45, to satisfy the total reflection condition, the upper detection limit of the analyte RI (na) is usually lower than 1.42 for low-RI MOF-SPR sensors [9,15,16,17,20,24,25,29], and the lower detection limit of na is usually higher than 1.45 for high-RI MOF-SPR sensors [30,31,32]. In addition, the size of air holes in these sensors is in the order of micrometers, which makes them difficult to be coated with metals or filled with analytes in actual manufacturing [4,6,9,12,15,16,19,24,25].
In this paper, to overcome the above problems, we propose an SPR sensor based on a dual-side polished MOF with a dual core. The dual-side polished structure can be coated with gold films and then directly contact with analytes, which helps to reduce the manufacturing difficulty of the sensor. The dual core can reduce the impact of total reflection conditions on the optical fiber, so that the sensor can work at a wide range of na, especially at 1.42–1.46, in which range the other MOF-based SPR sensors cannot work [20,21,22,23,24,25,26].
2. Structure Design and Principle
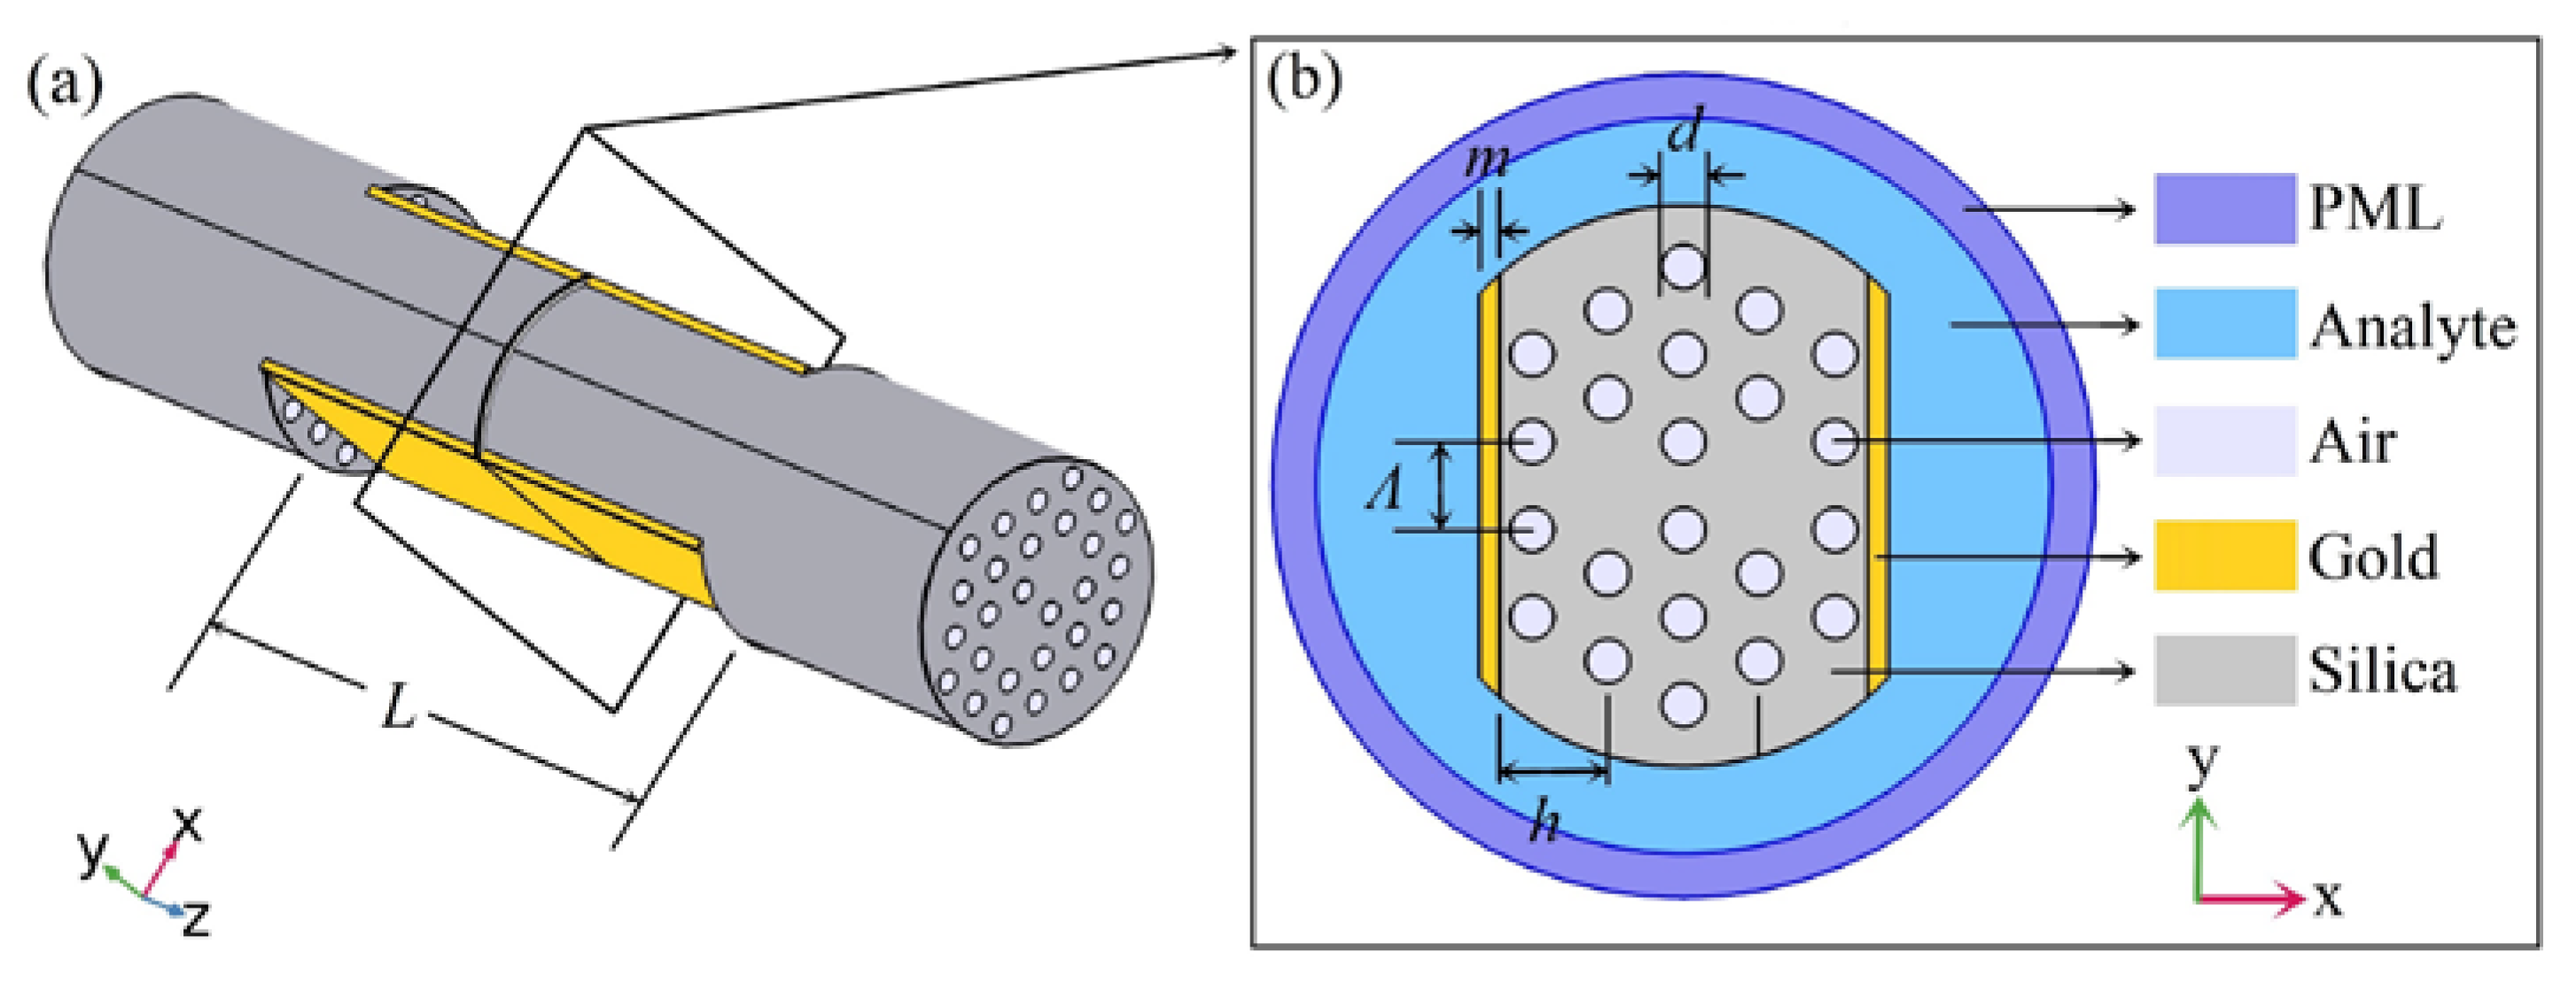
The schematic diagram of the proposed SPR sensor based on a dual-side polished MOF with a dual core is depicted in Figure 1. This structure can be obtained by a wheel-polishing setup with a 3D mechanical platform, which can move along the X, Y, and Z directions [47]. By employing a light source and an optical spectrum analyzer to online monitor the transmission spectrum during the polishing process, the polishing position, length, and depth could be easy to set up and operate accurately via a computer program [46,47]. Gold was used as a plasmonic material to coat the polished surface, which is not as difficult as coating a gold film on the inner surface of small air holes. Here, the center-to-center distance between two adjacent air holes (Ʌ) was 3 μm, and the diameter of air holes (d) was 0.5Ʌ. The thickness of the gold film (m) was 40 nm, and the polishing depth from the fiber center to the polished surface (h) was 2.1Ʌ. The mode characteristics and the sensing performance of the proposed sensor were simulated through commercially available software COMSOL. A perfectly matched layer (PML) was added to the outer computational region, which was applied to absorb scattered light [9,10,15,16,18,19,25,26,27,28,29,31,36,37,38].
In this sensor, we used fused silica as a background material and set its RI at 1.45 [17,20,24,25,27,29,41] to detect a range of na, which the other MOF-based SPR sensors cannot realize. The RI of the air was set to 1. To achieve the dielectric constant of gold (ε(ω)), we used the Drude–Lorentz model, of which the equation can be written as follows [48]:
where ε∞ is the permittivity at high frequencies, ω can be interpreted as the angular frequency, ωD and γD indicate the plasma frequency and the damping frequency, respectively, Δε is the weighting factor, and ΓL and ΩL are the spectral width and the oscillator strength of the Lorentz oscillators, respectively [10,34,36,48].
3. Simulation Results and Discussion
3.1. Coupling Properties
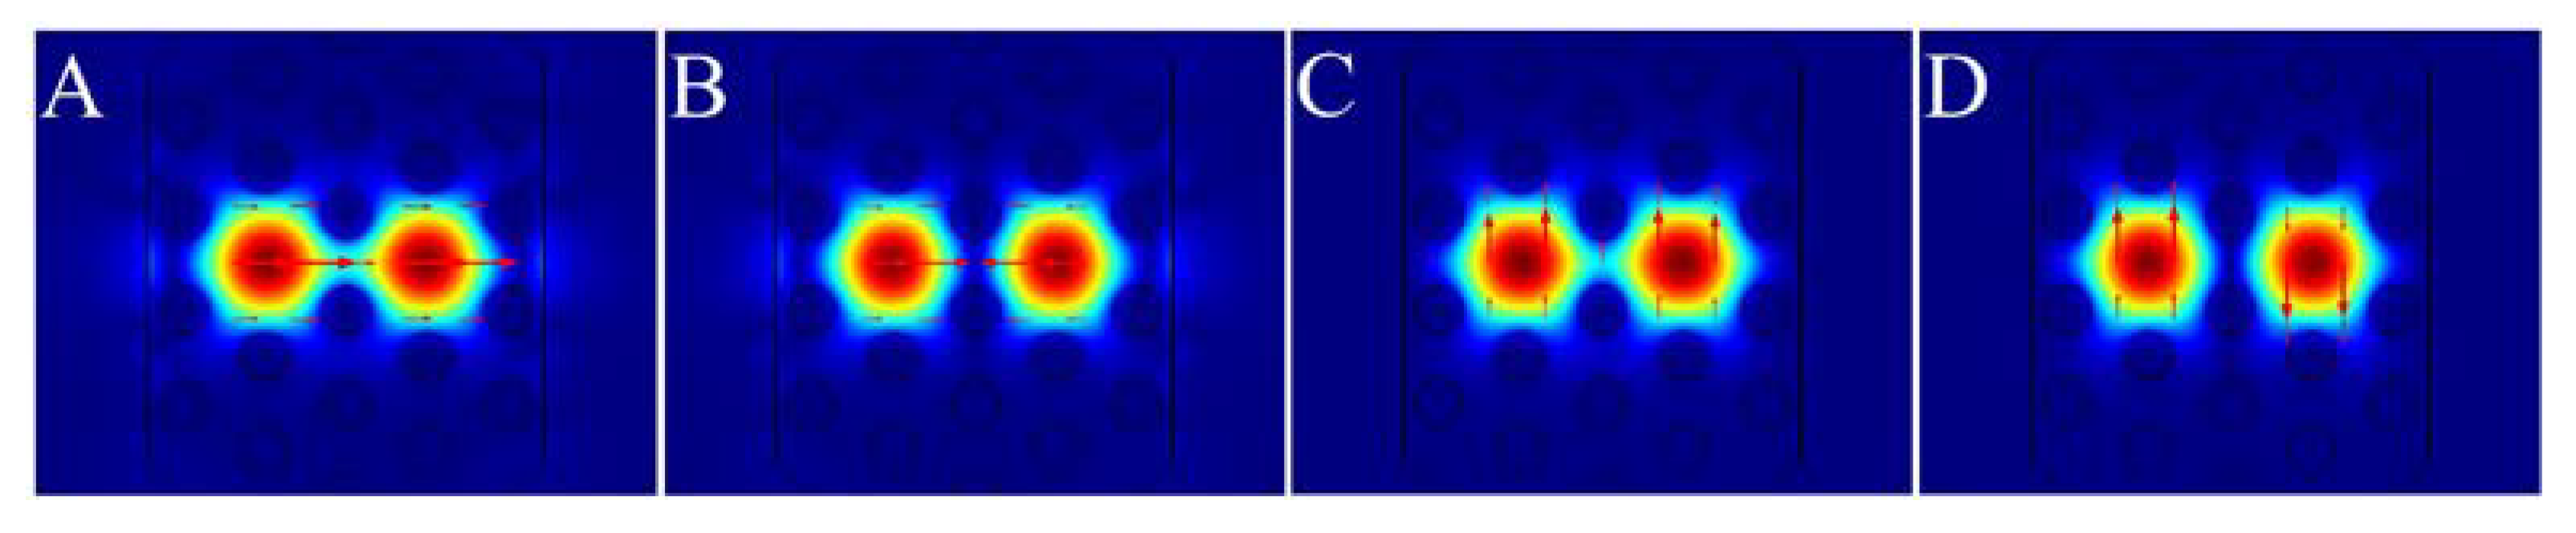
Like other dual-core MOFs [37,38,39], the proposed sensor can support four supermodes in fundamental modes. Figure 2 shows the electric field distributions of the four supermodes at 1100 nm for na =1.44. Insets A and B of Figure 2 represent the even mode and the odd mode in the x polarized direction (x-even mode and x-odd mode), respectively. Insets C and D of Figure 2 represent the even mode and the odd mode in the y polarized direction (y-even mode and y-odd mode), respectively. Here, we only investigated the coupling properties of the x-polarized core mode, because the y-polarized core mode with the electric field was parallel to the gold film surface and was not easily coupled with SPP modes [39,40,41].
In theory, when the real parts of neff (Re(neff)) of the core mode and the SPP mode are equal, the phase-matching condition between them are satisfied. Then, the two modes will be coupled with each other, and the maximum energy transfer from the core mode to the SPP mode can be achieved [5,6,7,8,10,11,12,13,14,15,16,17,18,19,20,21,22,23,24,25,26,37]. Figure 3 shows the Re(neff) curves of the x-even core modes and x-even SPP modes, the loss spectra of the x-even core modes, and the electric field distributions of the relevant modes for na = 1.44, 1.45, and 1.46. The black solid line represents the Re(neff) of the x-even core mode, while the red solid, dashed, and dotted lines represent the Re(neff) of the x-even SPP modes at na = 1.44, 1.45, and 1.46, respectively, as shown in Figure 3a. The blue solid, dashed, and dotted lines stand for the losses of the x-even core modes at na = 1.44, 1.45, and 1.46, respectively (Figure 3b). Take na equal to 1.44 as an example. The x-even core mode (inset A of Figure 3c) and the x-even SPP mode (inset B of Figure 3c) were coupled with each other (inset C of Figure 3c) at a wavelength of 1518 nm (point C in Figure 3a,b). At this wavelength (also called resonance wavelength), a significant loss peak appeared (see the blue solid curve in Figure 3b), which indicated the maximum energy transfer from the x-even core mode to the x-even SPP mode. The insets D, E, F, and G of Figure 3c represent the electric field distributions at points D, E, F, and G, respectively (Figure 3a,b), and they can also show the energy transfer from the x-even core mode to the x-even SPP mode at na = 1.45 and 1.46, respectively. As shown in Figure 3, the values of resonance wavelengths were shifted from 1518 to 1533 nm and from 1533 to 1556 nm due to the variations of na from 1.44 to 1.45 and from 1.45 to 1.46, respectively. We can observe that a tiny change of na can lead to a significant shift of resonance wavelength. This capability can be utilized to detect the changes of the analyte RI [19,24,25,26,37,38].
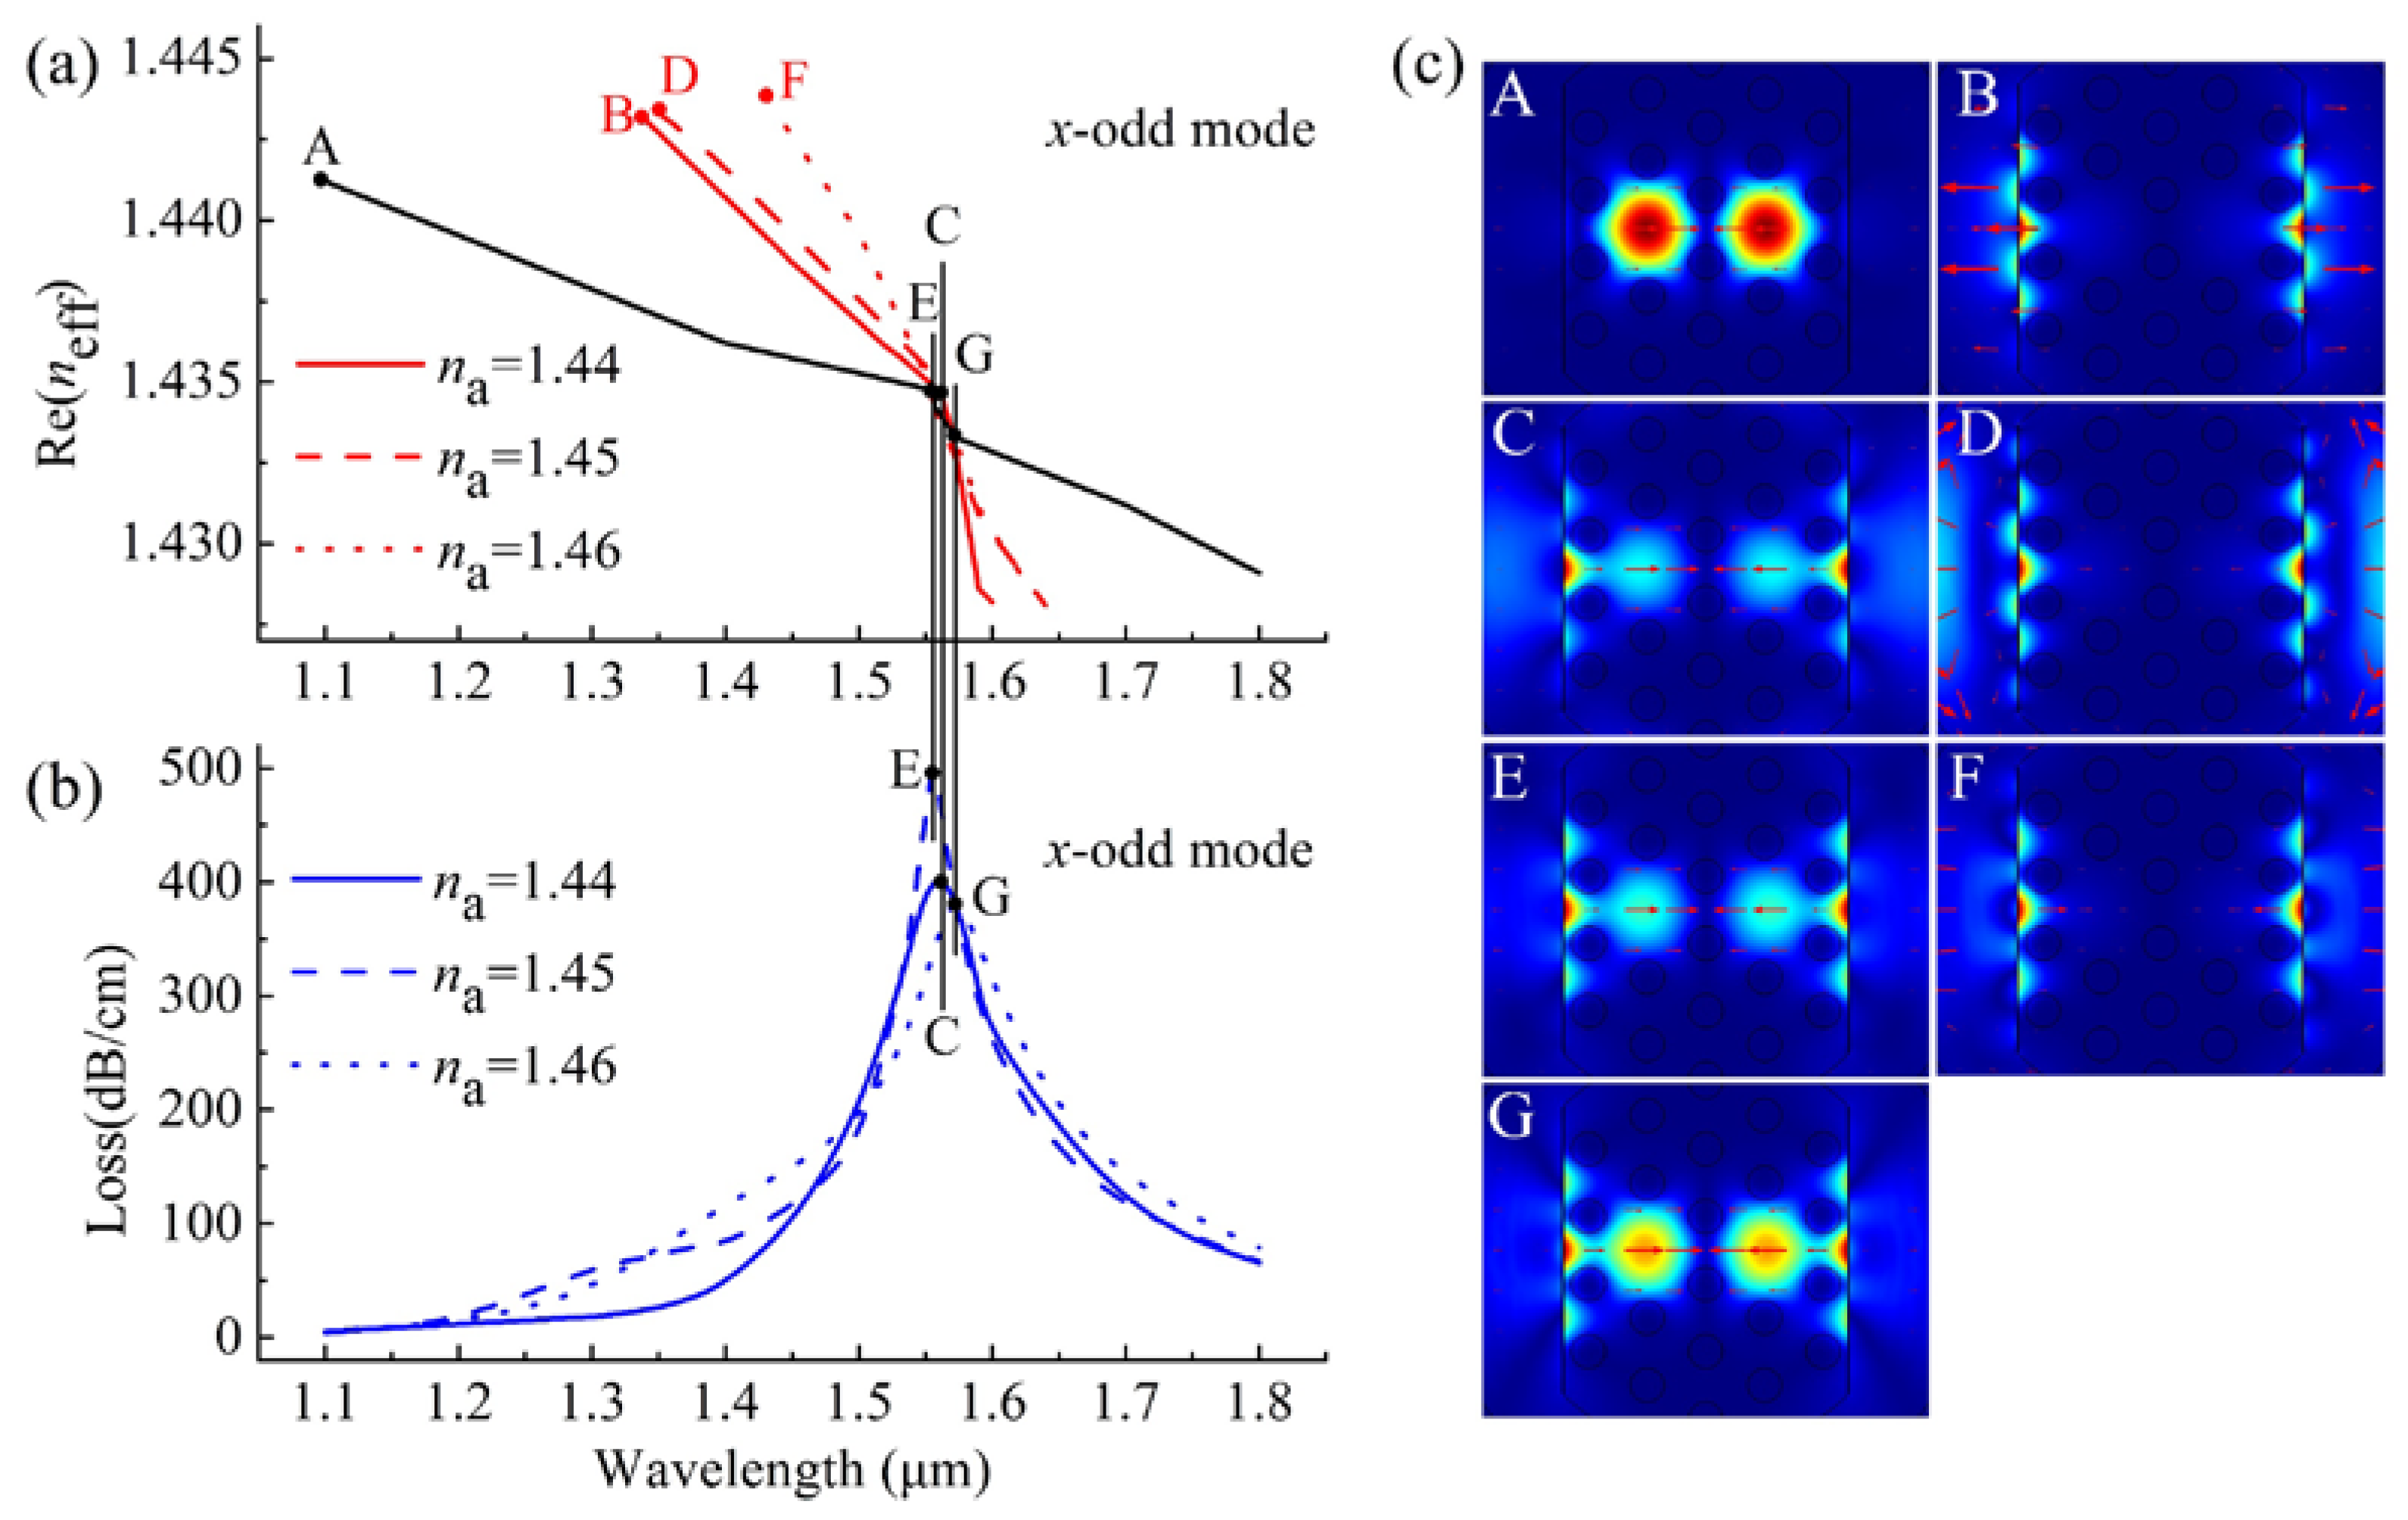
When varying the na from 1.44 to 1.46, the Re(neff) curves of the x-odd core modes (black solid lines) and the x-odd SPP modes (red solid, dashed, and dotted lines) and the loss spectra (blue solid, dashed, and dotted lines) of the x-odd core modes, as well as the electric field distributions of the relevant modes are shown in Figure 4. Similar to the coupling properties of the x-even core modes, the phase-matching conditions between the x-odd core mode and x-odd SPP modes were satisfied at the wavelength of 1518 nm (point C in Figure 4a,b) for na = 1.44, at the wavelength of 1533 nm (point E in Figure 4a,b) for na = 1.45, and at 1556 nm (point G in Figure 4a,b) for na = 1.46. At the resonance wavelengths, the corresponding electric field distributions are shown in insets C, E, and G of Figure 4c, when the na values were 1.44, 1.45, and 1.46, respectively. Compared with Figure 3a,b, we found that, unlike the resonance wavelength of the x-even core mode shifting to longer wavelengths with na increasing from 1.44 to 1.46, the resonance wavelength of the x-odd core mode moved to a shorter wavelength as na varied from 1.44 to 1.45, whereas the resonance wavelength moved towards longer wavelengths as na increased from 1.45 to 1.46. This unexpected peak behavior disturbs the regularity of the SPR sensor and therefore cannot be utilized to detect the changes of the analyte RI.
From Figure 3 and Figure 4, we can see that the resonance wavelengths of the x-even core modes move toward longer wavelengths with increasing na, but the behavior of the resonance wavelengths of the x-odd core modes is not regular and cannot be used to detect the variations of the analyte RI. In the following discussion, we only consider the sensing performance of the x-even core modes.
3.2. Sensing Performance
The sensing performance of the sensor can be evaluated by wavelength sensitivity (wavelength interrogation) and amplitude sensitivity (amplitude interrogation) [5,10,15,18,26]. The wavelength sensitivity can be calculated from the following equation [5,10,11,12,13,14,15,17,18,19,20,26,37,38]:
where Δλpeak is the shift of the resonance wavelength and Δna is the variation of na. As shown by the blue solid and dashed lines in Figure 3b, we observed Δλpeak of 15 nm when na was varied from 1.44 to 1.45. According to Equation (2), the corresponding wavelength sensitivity in terms of refractive index units (RIU) was 1500 nm/RIU.
The amplitude sensitivity can be calculated at a particular wavelength. Assuming a reasonable length of the sensor was L = 1/α(λ, na), the amplitude sensitivity was expressed as [5,10,17,18,26,29,38]:
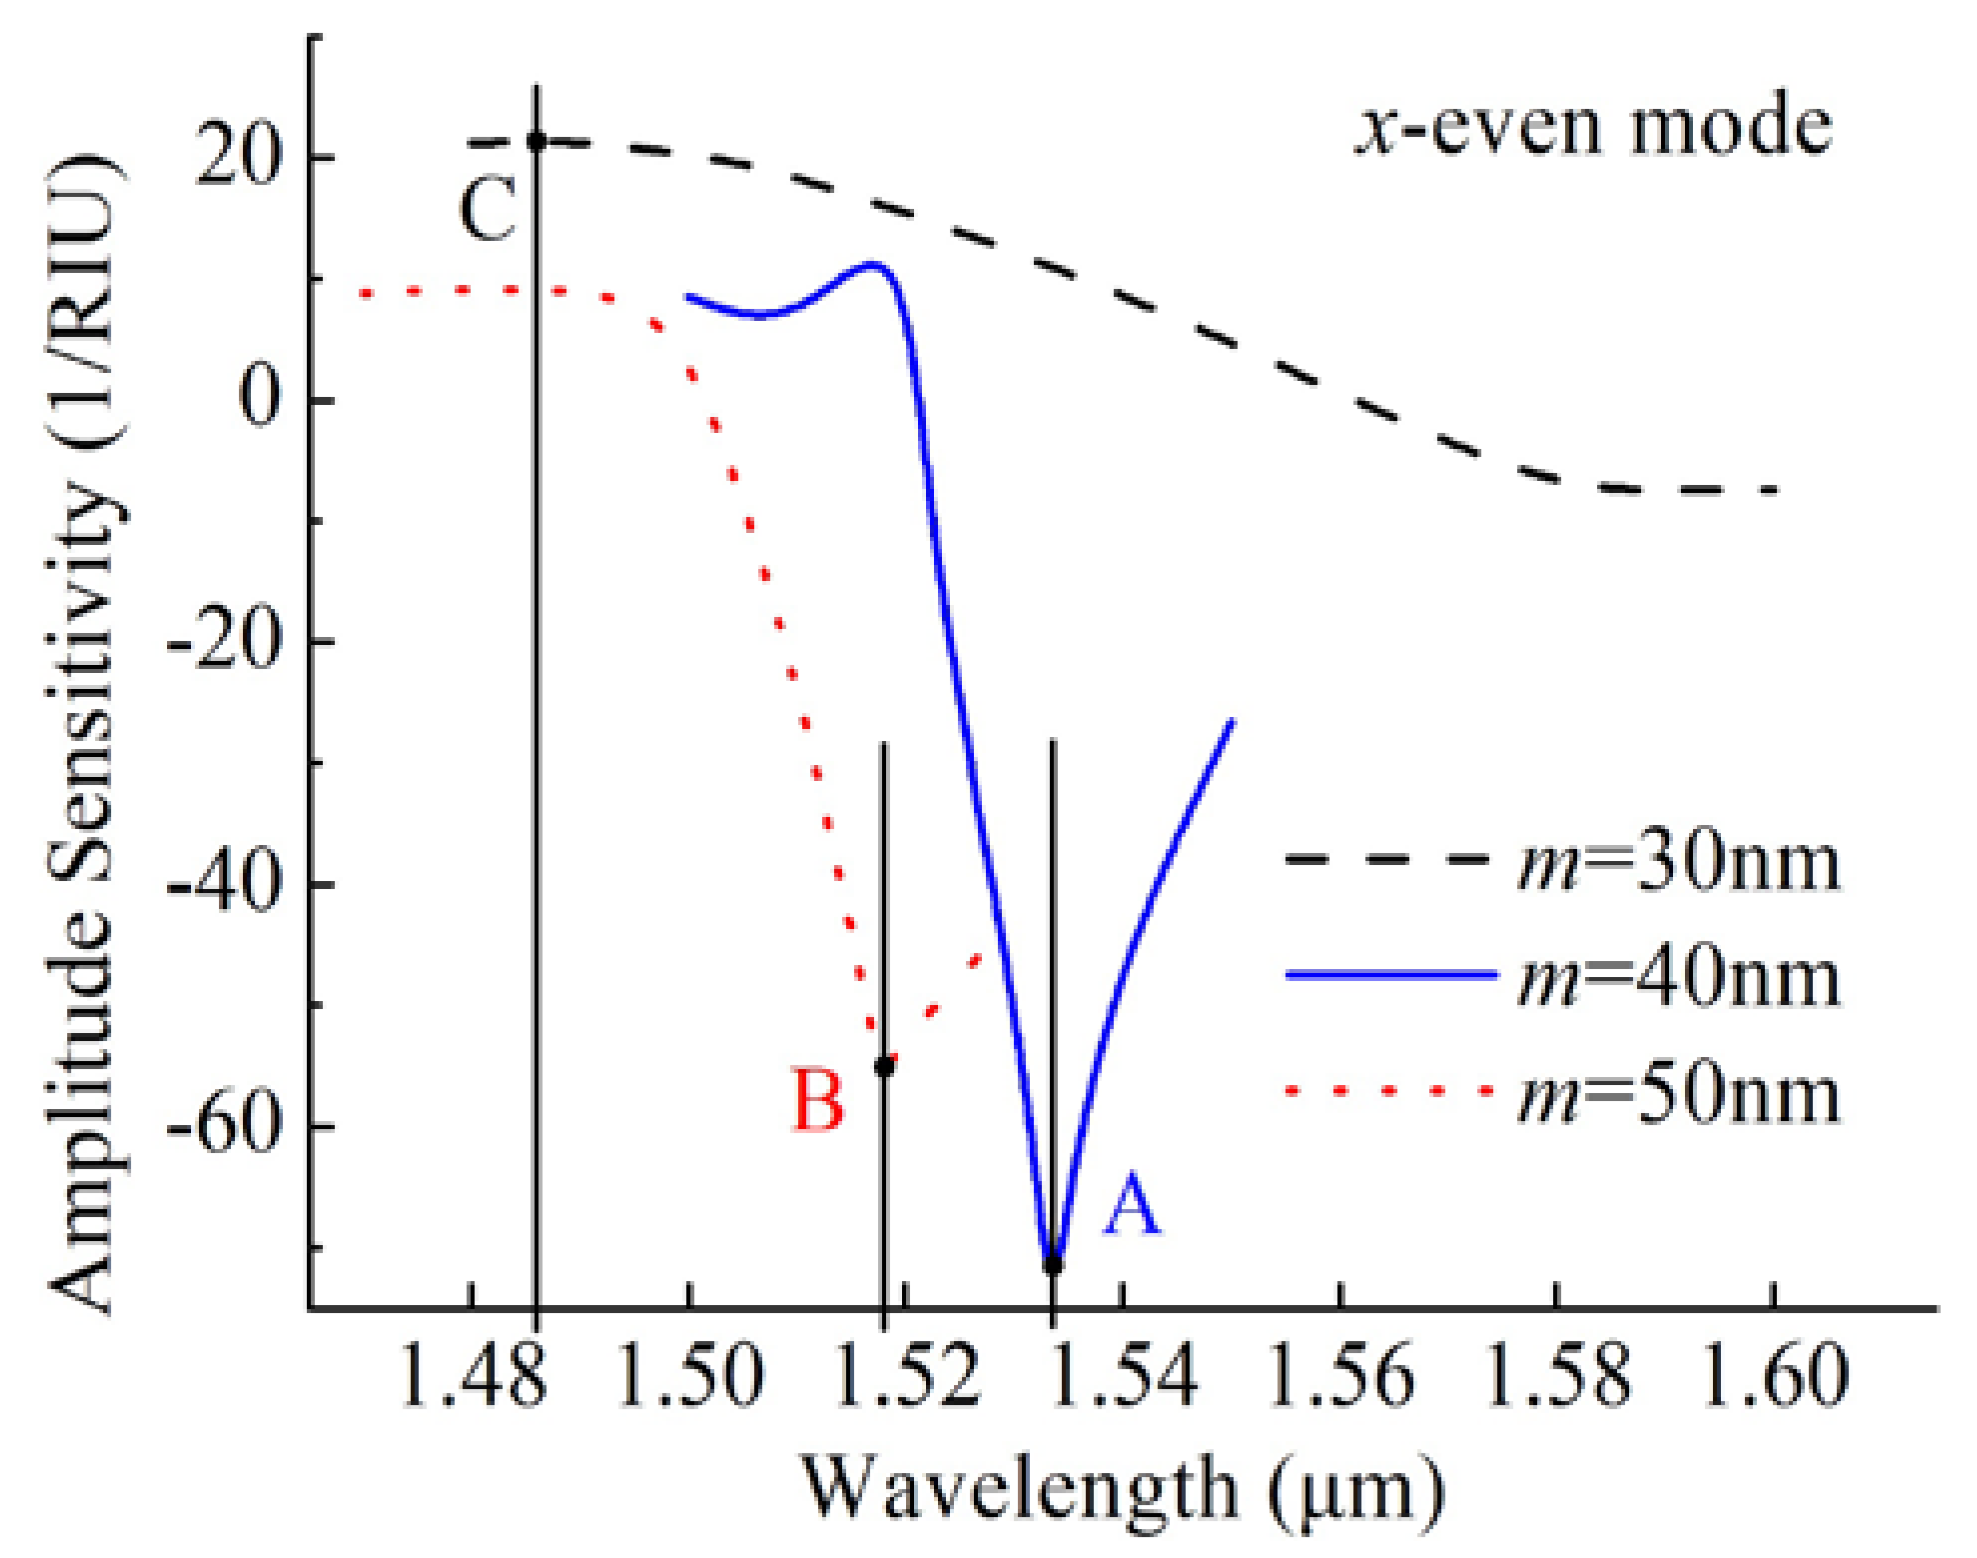
where α (λ, na) is the overall loss for a particular wavelength, ∂α(λ, na) is the difference between two adjacent loss spectra due to a small change in na, and ∂na is the change of na. According to Equation (3), we plotted the amplitude sensitivity curves in Figure 5. As is shown by the blue solid curve, the maximum amplitude sensitivity of the x-even core mode was 72.18 RIU–1 at 1534 nm for m = 40 nm.
3.3. Gold Film Thickness
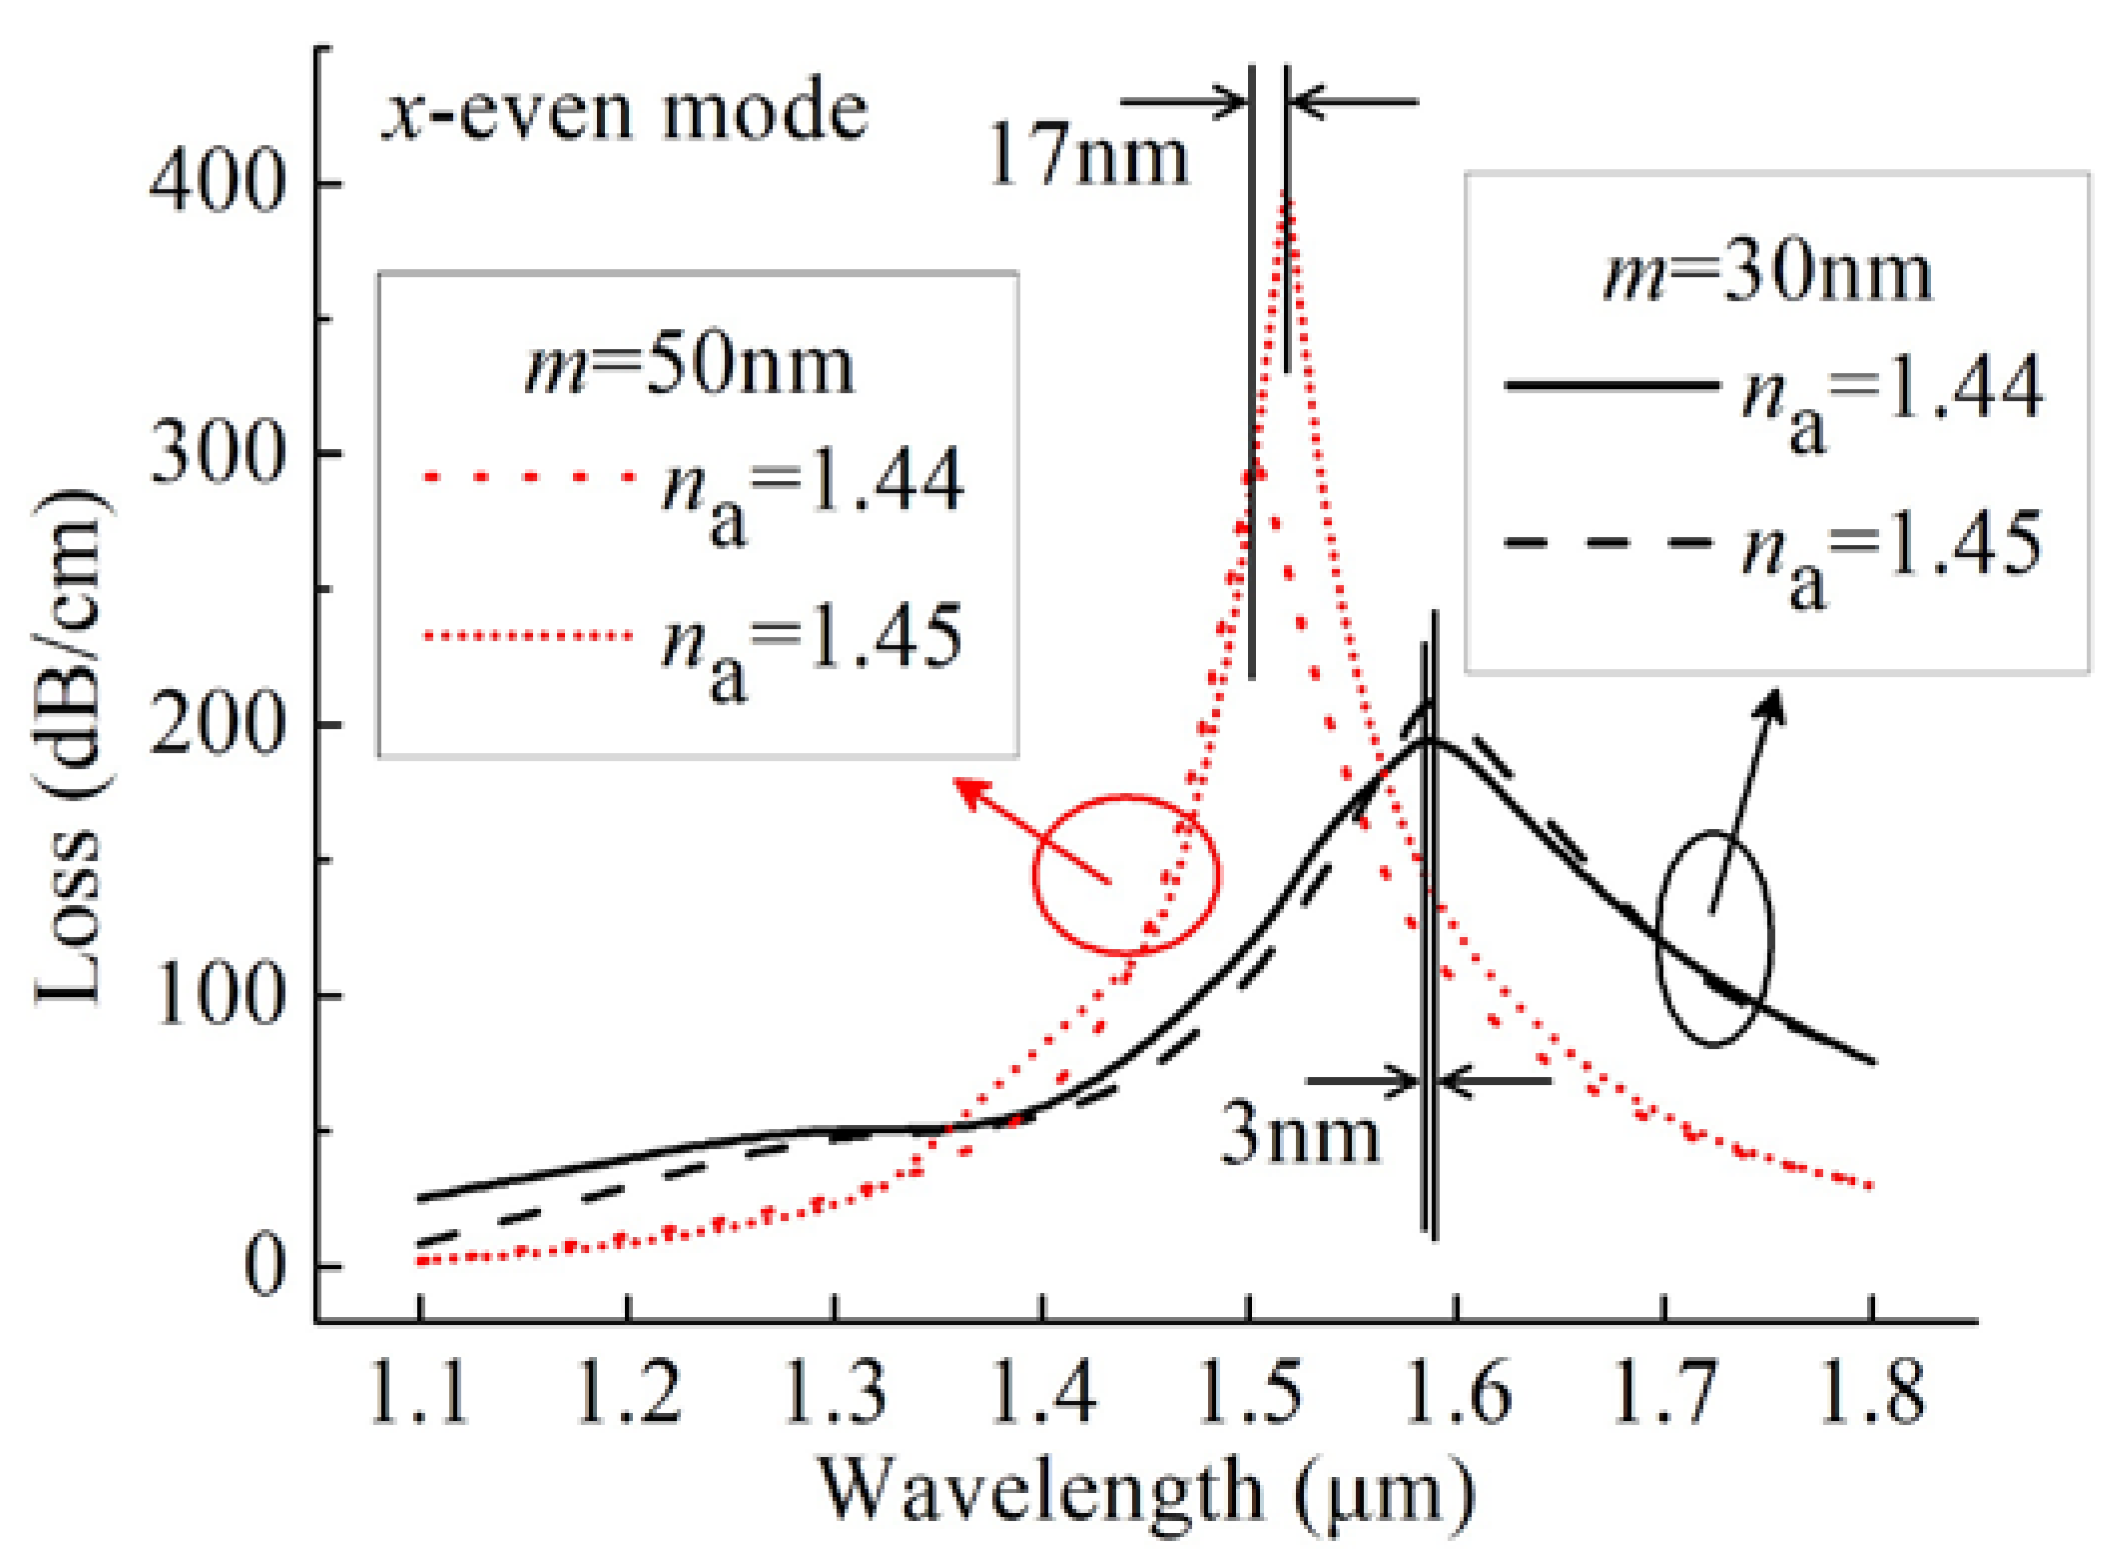
The thickness of a gold film is the most important factor that affects the SPR spectra and thus the sensing performance [8,9,10,12,13,15,16,18,24,33,34,35,36]. Figure 6 shows the loss spectra of the x-even core modes by varying m for na = 1.44 and 1.45. Comparing Figure 3b and Figure 6, it can be evident that the resonance wavelength moved to a shorter wavelength by increasing m from 30 to 50 nm in the case of na = 1.44 and 1.45. According to Equation (2), the values of the wavelength sensitivities were 300 and 1700 nm nm/RIU for m of 30 and 50 nm, respectively. The peak losses and the wavelengths influenced by varying m also affected the amplitude sensitivities. Figure 5 shows the amplitude sensitivities of x-even core modes as m varied from 30 to 50 nm. It can be found that the maximum amplitude sensitivities of 21.35 and 55.3 RIU–1 were achieved at 1486 and 1518 nm for m of 30 and 50 nm, respectively.
To further evaluate the performance of the designed sensor, Table 1 shows the summary of several sensing parameters including the peak wavelength, the peak loss, the wavelength sensitivity, the maximum amplitude sensitivity, and the wavelength for the maximum amplitude sensitivity of different m at an na range of 1.35–1.47. By means of a detailed investigation of theses parameters, it was found that m can affect the peak wavelength and the peak loss and therefore affect the wavelength sensitivity, the maximum amplitude sensitivity, and the wavelength for the maximum amplitude sensitivity. It is worth noting that the trend of the wavelength for the maximum amplitude sensitivity was roughly the same as that of the peak wavelength, because according to Equation (3), the maximum amplitude sensitivity is related to the maximum ∂α (λ, na), which generally occurs in the vicinity of the resonance peak. The change of m has a slight impact on the sensing performance in single-core MOF-SPR sensors [9,10,12,13,15,16,24,33], while it has a greater and more irregular impact on the sensing performance in the proposed dual-core MOF-SPR sensor, which indicates that this dual-core structure is more sensitive to the thicknesses of the gold film. Nevertheless, the designed dual-core MOF sensor can detect a larger RI range, and it exhibits higher wavelength and amplitude sensitivities at the na range of 1.41–1.43, even with other gold film thicknesses.
In general, the ability of detecting large RI ranges makes the designed sensor more competitive than D-shaped MOF-SPR sensors [17,21,22,23,32,33,34,38]. Compared with single-core dual-side polished MOF-SPR sensors [18,42], the designed dual-core structure can detect na higher than the RI of the background material of the MOF. Although other structures such as inner-coated or grooved MOF-SPR sensors can detect a wide RI range [19,39,43,44,45], the designed dual-side polished structure has advantages that it can be readily coated with the gold films and has outside sensing channels, making it ideal for use as a real-time sensor.
4. Conclusions
We have proposed and numerically investigated an SPR sensor based on a dual-side polished MOF with a dual core to realize a large range of na detection. The gold and the analyte layers were placed outside the MOF structure, which can be expected to simplify the manufacturing process. The coupling characteristics, sensing performance, and the influence of the gold film thickness of the sensor were investigated by the finite element method in the wavelength and amplitude interrogation. Since the peak behavior of the x-odd mode disturbed the regularity of the SPR sensor, the x-even mode was determined to analyze the sensing performance. The simulation results showed that the sensor could detect a large na range covering from 1.35 to 1.47 and had higher wavelength sensitivity and amplitude sensitivity in the na range of 1.42–1.43 when the background material RI was 1.45. The proposed sensor can overcome the defect that other traditional MOF-SPR sensors cannot work in the na range of 1.42–1.46, which makes it exhibit great potential in biological and chemical sensing fields.
Author Contributions
Conceptualization, H.H. and N.L.; investigation, H.H., D.H., and N.L.; writing of the original draft preparation, H.H.; writing of review and editing, H.H., Z.B., L.S., N.L., and J.L.; supervision, N.L., Z.B., L.S., and J.L.; funding acquisition, N.L., L.S., and Y.H. All authors have read and agreed to the published version of the manuscript.
Funding
This research was funded by the Natural Science Foundation of Hebei Province (grant numbers: F2019202294, F2019202337, and F2019202252), the State Key Laboratory of Luminescence and Applications (grant number: SKLA-2019-07), and the Natural Science Foundation of Tianjin City (grant number: 15JCYBJC17000).
Conflicts of Interest
The authors declare no conflicts of interest.
References
- Homola, J.; Yee, S.S.; Gauglitz, G. Surface plasmon resonance sensors: Review. Sens. Actuators B Chem. 1999, 54, 3–15. [Google Scholar] [CrossRef]
- Singh, P. SPR biosensors: Historical perspectives and current challenges. Sens. Actuators B Chem. 2016, 229, 110–130. [Google Scholar] [CrossRef]
- Sharma, A.K.; Pandey, A.K.; Kaur, B. A review of advancements (2007–2017) in plasmonics-based optical fiber sensors. Opt. Fiber Technol. 2018, 43, 20–34. [Google Scholar] [CrossRef]
- Zhao, Y.; Deng, Z.; Li, J. Photonic crystal fiber based surface plasmon resonance chemical sensors. Sens. Actuators B Chem. 2014, 202, 557–567. [Google Scholar] [CrossRef]
- Aruna Gandhi, M.S.; Chu, S.; Senthilnathan, K.; Babu, P.R.; Nakkeeran, K.; Li, Q. Recent advances in plasmonic sensor-based fiber optic probes for biological applications. Appl. Sci. 2019, 9, 949. [Google Scholar] [CrossRef] [Green Version]
- Rifat, A.A.; Ahmed, R.; Yetisen, A.K.; Butt, H.; Sabouri, A.; Mahdiraji, G.A.; Yun, S.H.; Adikan, F.R.M. Photonic crystal fiber based plasmonic sensors. Sens. Actuators B Chem. 2017, 243, 311–325. [Google Scholar] [CrossRef]
- Sharma, A.K.; Jha, R.; Gupta, B.D. Fiber-optic sensors based on surface plasmon resonance: A comprehensive review. IEEE Sens. J. 2007, 7, 1118–1129. [Google Scholar] [CrossRef]
- Klantsataya, E.; Jia, P.; Ebendorff-Heidepriem, H.; Monro, T.M.; Francois, A. Plasmonic fiber optic refractometric sensors: From conventional architectures to recent design trends. Sensors 2016, 17, 12. [Google Scholar] [CrossRef] [Green Version]
- Hassani, A.; Skorobogatiy, M. Design of the microstructured optical fiber-based surface plasmon resonance sensors with enhanced microfluidics. Opt. Express 2006, 14, 11616–11621. [Google Scholar] [CrossRef] [PubMed] [Green Version]
- Islam, M.S.; Sultana, J.; Rifat, A.A.; Ahmed, R.; Dinovitser, A.; Ng, B.W.; Ebendorff-Heidepriem, H.; Abbott, D. Dual-polarized highly sensitive plasmonic sensor in the visible to near-IR spectrum. Opt. Express 2018, 26, 30347–30361. [Google Scholar] [CrossRef]
- Klantsataya, E.; François, A.; Ebendorff-Heidepriem, H.; Hoffmann, P.; Monro, T. Surface plasmon scattering in exposed core optical fiber for enhanced resolution refractive index sensing. Sensors 2015, 15, 25090–25102. [Google Scholar] [CrossRef] [PubMed] [Green Version]
- Rifat, A.A.; Mahdiraji, G.A.; Chow, D.M.; Shee, Y.G.; Ahmed, Y.G.; Adikan, F.R.M. Photonic crystal fiber-based surface plasmon resonance sensor with selective analyte channels and graphene-silver deposited core. Sensors 2015, 15, 11499–11510. [Google Scholar] [CrossRef] [PubMed] [Green Version]
- Liu, C.; Yang, L.; Su, W.; Wang, F.; Sun, T.; Liu, Q.; Mu, H.; Chu, P.K. Numerical analysis of a photonic crystal fiber based on a surface plasmon resonance sensor with an annular analyte channel. Opt. Commun. 2017, 382, 162–166. [Google Scholar] [CrossRef]
- Liu, C.; Yang, L.; Liu, Q.; Wang, F.; Sun, Z.; Sun, T.; Mu, H.; Chu, P.K. Analysis of a surface plasmon resonance probe based on photonic crystal fibers for low refractive index detection. Plasmonics 2017, 13, 779–784. [Google Scholar] [CrossRef]
- Hassani, A.; Skorobogatiy, M. Design criteria for microstructured-optical fiber based surface plasmon resonance sensors. J. Opt. Soc. Am. B 2007, 24, 1423–1429. [Google Scholar] [CrossRef]
- Peng, Y.; Hou, J.; Huang, Z.; Lu, Q. Temperature sensor based on surface plasmon resonance within selectively coated photonic crystal fiber. Appl. Opt. 2012, 51, 6361–6367. [Google Scholar] [CrossRef]
- Luan, N.; Wang, R.; Lv, W.; Yao, J. Surface plasmon resonance sensor based on D-shaped microstructured optical fiber with hollow core. Opt. Express 2015, 23, 8576–8582. [Google Scholar] [CrossRef]
- Chen, N.; Chang, M.; Zhang, X.; Zhou, J.; Lu, X.; Zhuang, S. Highly sensitive plasmonic sensor based on a dual-side polished photonic crystal fiber for component content sensing applications. Nanomaterials 2019, 9, 1587. [Google Scholar] [CrossRef] [Green Version]
- Shuai, B.; Xia, L.; Zhang, Y.; Liu, D. A multi-core holey fiber based plasmonic sensor with large detection range and high linearity. Opt. Express 2012, 20, 5974–5986. [Google Scholar] [CrossRef]
- Zhao, L.; Han, H.; Lian, Y.; Luan, N.; Liu, J. Theoretical analysis of all-solid D-type photonic crystal fiber based plasmonic sensor for refractive index and temperature sensing. Opt. Fiber Technol. 2019, 50, 165–171. [Google Scholar] [CrossRef]
- Haque, E.; Hossain, M.A.; Ahmed, F.; Namihira, Y. Surface plasmon resonance sensor based on modified D-shaped photonic crystal fiber for wider range of refractive index detection. IEEE Sens. J. 2018, 18, 8287–8293. [Google Scholar] [CrossRef]
- Chen, X.; Xia, L.; Li, C. Surface plasmon resonance sensor based on a novel D-shaped photonic crystal fiber for low refractive index detection. IEEE Photonics J. 2018, 10, 1–9. [Google Scholar] [CrossRef]
- Gangwar, R.K.; Singh, V.K. Highly sensitive surface plasmon resonance based D-shaped photonic crystal fiber refractive index sensor. Plasmonics 2017, 12, 1367–1372. [Google Scholar] [CrossRef]
- Yu, X.; Zhang, Y.; Pan, S.; Shum, P.; Yan, M.; Leviatan, Y.; Li, C. A selectively coated photonic crystal fiber based surface plasmon resonance sensor. J. Opt. 2010, 12, 015005. [Google Scholar] [CrossRef] [Green Version]
- Zhang, Y.; Xia, L.; Zhou, C.; Yu, X.; Liu, H.; Liu, D.; Zhang, Y. Microstructured fiber based plasmonic index sensor with optimized accuracy and calibration relation in large dynamic range. Opt. Commun. 2011, 284, 4161–4166. [Google Scholar] [CrossRef]
- Akter, S.; Abdur Razzak, S.M. Highly sensitive open-channels based plasmonic biosensor in visible to near-infrared wavelength. Results Phys. 2019, 13, 102328. [Google Scholar] [CrossRef]
- Zhao, L.; Han, H.; Luan, N.; Liu, J.; Song, L.; Hu, Y. A temperature plasmonic sensor based on a side opening hollow fiber filled with high refractive index sensing medium. Sensors 2019, 19, 3730. [Google Scholar] [CrossRef] [Green Version]
- Liu, C.; Su, W.; Liu, Q.; Lu, X.; Wang, F.; Sun, T.; Chu, P.K. Symmetrical dual D-shape photonic crystal fibers for surface plasmon resonance sensing. Opt. Express 2018, 26, 9039–9049. [Google Scholar] [CrossRef]
- Luan, N.; Yao, J. Surface plasmon resonance sensor based on exposed-core microstructured optical fiber placed with a silver wire. IEEE Photonics J. 2016, 8, 1–8. [Google Scholar] [CrossRef]
- Liu, B.; Jiang, Y.; Zhu, X.; Tang, X.; Shi, Y. Hollow fiber surface plasmon resonance sensor for the detection of liquid with high refractive index. Opt. Express 2013, 21, 32349–32357. [Google Scholar] [CrossRef]
- Luan, N.; Yao, J. High refractive index surface plasmon resonance sensor based on a silver wire filled hollow fiber. IEEE Photonics J. 2016, 8, 1–9. [Google Scholar] [CrossRef]
- Luan, N.; Zhao, L.; Lian, Y.; Lou, S. A high refractive index plasmonic sensor based on D-shaped photonic crystal fiber with laterally accessible hollow-core. IEEE Photonics J. 2018, 10, 1–7. [Google Scholar] [CrossRef]
- Wang, G.; Li, S.; An, G.; Wang, X.; Zhao, Y.; Zhang, W.; Chen, H. Highly sensitive D-shaped photonic crystal fiber biological sensors based on surface plasmon resonance. Opt. Quant. Electron. 2016, 48, 46. [Google Scholar] [CrossRef]
- An, G.; Li, S.; Qin, W.; Zhang, W.; Fan, Z.; Bao, Y. High-sensitivity refractive index sensor based on D-shaped photonic crystal fiber with rectangular lattice and nanoscale gold film. Plasmonics 2014, 9, 1355–1360. [Google Scholar] [CrossRef]
- Hautakorpi, M.; Mattinen, M.; Ludvigsen, H. Surface-plasmon-resonance sensor based on three-hole microstructured optical fiber. Opt. Express 2008, 16, 8427–8432. [Google Scholar] [CrossRef]
- Chang, M.; Li, B.; Chen, N.; Lu, X.; Zhang, X.; Xu, J. A compact and broadband photonic crystal fiber polarization filter based on a plasmonic resonant thin gold film. IEEE Photonics J. 2019, 11, 1–12. [Google Scholar] [CrossRef]
- Wang, F.; Sun, Z.; Liu, C.; Sun, T.; Chu, P.K. A highly sensitive dual-core photonic crystal fiber based on a surface plasmon resonance biosensor with silver-graphene layer. Plasmonics 2016, 12, 1847–1853. [Google Scholar] [CrossRef]
- Jabin, M.A.; Ahmed, K.; Rana, M.J.; Paul, B.K.; Luo, Y.; Vigneswaran, D. Titanium-coated dual-core D-shaped sPR-based PCF for hemoglobin sensing. Plasmonics 2019, 14, 1601–1610. [Google Scholar] [CrossRef]
- Luan, N.; Han, H.; Zhao, L.; Liu, J.; Yao, J. Opening up dual-core microstructured optical fiber-based plasmonic sensor with large detection range and linear sensitivity. Opt. Mater. Express 2019, 9, 819–825. [Google Scholar] [CrossRef]
- Zhang, X.; Wang, R.; Cox, F.; Kuhlmey, B.; Large, M. Selective coating of holes in microstructured optical fiber and its application to in-fiber absorptive polarizers. Opt. Express 2007, 15, 16270–16278. [Google Scholar] [CrossRef]
- Luan, N.; Lv, W.; Wang, R.; Yao, J. Surface plasmon resonance sensor based on exposed-core microstructured optical fibres. Electron. Lett. 2015, 51, 714–715. [Google Scholar] [CrossRef]
- An, G.; Jia, P.; Liang, T.; Hong, Y.; Wang, H.; Ghaffar, A.; Xiong, J. Double-sided polished ultra-stable and ultra-sensitive optical fiber sensor. Plasmonics 2020. [Google Scholar] [CrossRef]
- Luan, N.; Yao, J. A hollow-core photonic crystal fiber-based SPR sensor with large detection range. IEEE Photonics J. 2017, 9, 1–7. [Google Scholar] [CrossRef]
- Wang, G.; Lu, Y.; Duan, L.; Yao, J. A refractive index sensor based on PCF with ultra-wide detection range. IEEE J. Sel. Top. Quant. 2020. [Google Scholar] [CrossRef]
- Han, H.; Hou, D.; Zhao, L.; Luan, N.; Song, L.; Liu, Z.; Lian, Y.; Liu, J.; Hu, Y. A large detection-range plasmonic sensor based on an H-shaped photonic crystal fiber. Sensors 2020, 20, 1009. [Google Scholar] [CrossRef] [PubMed] [Green Version]
- Wu, T.; Shao, Y.; Wang, Y.; Cao, S.; Cao, W.; Zhang, F.; Liao, C.; He, J.; Huang, Y.; Hou, M.; et al. Surface plasmon resonance biosensor based on gold-coated side-polished hexagonal structure photonic crystal fiber. Opt. Express 2017, 25, 20313–20322. [Google Scholar] [CrossRef] [PubMed] [Green Version]
- Zhao, J.; Cao, S.; Liao, C.; Wang, Y.; Wang, G.; Xu, X.; Fu, C.; Xu, G.; Lian, J.; Wang, Y. Surface plasmon resonance refractive sensor based on silver-coated side-polished fiber. Sens. Actuators B Chem. 2016, 230, 206–211. [Google Scholar] [CrossRef]
- Vial, A.; Grimault, A.S.; Macías, D.; Barchiesi, D.; Chapelle, M.L.D.L. Improved analytical fit of gold dispersion: Application to the modeling of extinction spectra with a finite-difference time-domain method. Phys. Rev. B. 2005, 71, 085416. [Google Scholar] [CrossRef]
Figure 1.
(a) Schematic diagram of the proposed dual-side polished microstructured optical fiber (MOF)-based surface plasmon resonance (SPR) sensor with a dual core; (b) cross-section of the proposed MOF-based SPR sensor.
Figure 1.
(a) Schematic diagram of the proposed dual-side polished microstructured optical fiber (MOF)-based surface plasmon resonance (SPR) sensor with a dual core; (b) cross-section of the proposed MOF-based SPR sensor.

Figure 2.
Electric field distributions of four fundamental supermodes at 1100 nm for the analyte refractive index (na) of 1.44: (A) x-even mode; (B) x-odd mode; (C) y-even mode; (D) y-odd mode (the arrows represent the direction of the electric field).
Figure 2.
Electric field distributions of four fundamental supermodes at 1100 nm for the analyte refractive index (na) of 1.44: (A) x-even mode; (B) x-odd mode; (C) y-even mode; (D) y-odd mode (the arrows represent the direction of the electric field).

Figure 3.
(a) The real parts of the effective refractive index (Re (neff)) curves of the x-even core modes (black lines) and the x-even SPP modes at na = 1.44, 1.45, and 1.46 represented by the red solid, dashed, and dotted lines, respectively; (b) the loss spectra of the x-even core modes at na = 1.44, 1.45, and 1.46 represented by the blue solid, dashed, and dotted lines, respectively; (c) electric field distributions of the x-even core mode A at 1100 nm, x-even SPP mode B at 1340 nm, and x-even core mode C at 1518 nm for na = 1.44, electric field distributions of x-even SPP mode D at 1350 nm and x-even core mode E at 1533 nm for na = 1.45, and electric field distributions of x-even SPP mode F at 1430 nm and x-even core mode G at 1556 nm for na = 1.46.

Figure 4.
(a) The Re (neff) curves of the x-odd core modes (black lines) and x-odd SPP modes at na = 1.44, 1.45,and 1.46 represented by the red solid, dashed, and dotted lines, respectively; (b) the loss spectra of the x-odd core modes at na = 1.44, 1.45, and 1.46 represented by the blue solid, dashed, and dotted lines, respectively; (c) electric field distributions of the x-odd core mode A at 1100 nm, the x-odd SPP mode B at 1340 nm, and the x-odd core mode C at 1561 nm for na = 1.44, electric field distributions of x-odd SPP mode D at 1350 nm and x-odd core mode E at 1556 nm for na = 1.45, and electric field distributions of x-odd SPP mode F at 1430 nm and x-odd core mode G at 1572 nm for na = 1.46.

Figure 5.
Amplitude sensitivities of x-even core modes for the gold film thicknesses of 30, 40, and 50 nm.
Figure 5.
Amplitude sensitivities of x-even core modes for the gold film thicknesses of 30, 40, and 50 nm.

Figure 6.
Loss spectra of the x-even core modes for the gold film thicknesses of 30 and 50 nm at na of 1.44 and 1.45.
Figure 6.
Loss spectra of the x-even core modes for the gold film thicknesses of 30 and 50 nm at na of 1.44 and 1.45.


Table 1.
Comparison of the sensing parameters of the x-even core modes at the na range of 1.35–1.47 for m values of 30, 40, and 50 nm, respectively.
Table 1.
Comparison of the sensing parameters of the x-even core modes at the na range of 1.35–1.47 for m values of 30, 40, and 50 nm, respectively.
| Peak Wavelength (nm) | Peak Loss (dB/m) | Wavelength Sensitivities (nm/RIU) | Maximum Amplitude Sensitivities (RIU–1) | Wavelength for the Maximum Amplitude Sensitivity (nm) | ||||||||||||
|---|---|---|---|---|---|---|---|---|---|---|---|---|---|---|---|---|
| m | 30 nm | 40 nm | 50 nm | 30 nm | 40 nm | 50 nm | 30 nm | 40 nm | 50 nm | 30 nm | 40 nm | 50 nm | 30 nm | 40 nm | 50 nm | |
| na | ||||||||||||||||
| 1.35 | 1107 | 1124 | 967 | 400.46 | 303.1 | 332.45 | 900 | 600 | 300 | 16.29 | 8.27 | 13.36 | 1132 | 1141 | 985 | |
| 1.36 | 1116 | 1130 | 970 | 420.74 | 319.45 | 337.37 | 1000 | 700 | 400 | 19.41 | 10.69 | 17.35 | 1141 | 1146 | 989 | |
| 1.37 | 1126 | 1137 | 974 | 449.8 | 343.09 | 346.69 | 1200 | 800 | 600 | 23.97 | 14.62 | 24.16 | 1152 | 1154 | 994 | |
| 1.38 | 1138 | 1145 | 980 | 493.53 | 379.69 | 365.6 | 1400 | 1100 | 800 | 31.11 | 21.73 | 37.8 | 1165 | 1164 | 1001 | |
| 1.39 | 1152 | 1156 | 988 | 563.82 | 442.55 | 407.66 | 1800 | 1300 | 1300 | 43.47 | 36.78 | 73.6 | 1182 | 1178 | 1012 | |
| 1.40 | 1170 | 1169 | 1001 | 688.61 | 568.95 | 523.56 | 2200 | 2200 | 12000 | 67.89 | 77.88 | 100.9 | 1202 | 1198 | 1127 | |
| 1.41 | 1192 | 1191 | 1121 | 946.43 | 913.32 | 748.38 | 3100 | 3100 | 4900 | 126.83 | 270.71 | 852.92 | 1230 | 1231 | 1171 | |
| 1.42 | 1223 | 1225 | 1170 | 1634.6 | 2674.4 | 5094.5 | 17500 | 17500 | 20700 | 407.64 | 1479.03 | 1411.37 | 1408 | 1340 | 1377 | |
| 1.43 | 1398 | 1340 | 1377 | 6944.1 | 18113 | 29443 | 18700 | 18700 | 12400 | 1262.38 | 1347.09 | 390 | 1591 | 1519 | 1503 | |
| 1.44 | 1585 | 1518 | 1501 | 19434 | 30453 | 30473 | 300 | 300 | 1700 | 21.35 | 72.18 | 55.39 | 1486 | 1534 | 1518 | |
| 1.45 | 1588 | 1533 | 1518 | 20922 | 48818 | 40144 | 5600 | 5600 | 600 | 42.18 | 52.2 | 54.06 | 1556 | 1533 | 1524 | |
| 1.46 | 1644 | 1556 | 1524 | 16769 | 26788 | 54836 | 2600 | 2600 | 300 | 71.72 | 11.69 | 4.3 | 1482 | 1541 | 1521 | |
| 1.47 | 1670 | 1565 | 1527 | 16005 | 24814 | 47015 | ||||||||||
© 2020 by the authors. Licensee MDPI, Basel, Switzerland. This article is an open access article distributed under the terms and conditions of the Creative Commons Attribution (CC BY) license (http://creativecommons.org/licenses/by/4.0/).
Share and Cite
MDPI and ACS Style
Han, H.; Hou, D.; Luan, N.; Bai, Z.; Song, L.; Liu, J.; Hu, Y. Surface Plasmon Resonance Sensor Based on Dual-Side Polished Microstructured Optical Fiber with Dual-Core. Sensors 2020, 20, 3911. https://doi.org/10.3390/s20143911
AMA Style
Han H, Hou D, Luan N, Bai Z, Song L, Liu J, Hu Y. Surface Plasmon Resonance Sensor Based on Dual-Side Polished Microstructured Optical Fiber with Dual-Core. Sensors. 2020; 20(14):3911. https://doi.org/10.3390/s20143911
Chicago/Turabian StyleHan, Haixia, Donglian Hou, Nannan Luan, Zhenxu Bai, Li Song, Jianfei Liu, and Yongsheng Hu. 2020. "Surface Plasmon Resonance Sensor Based on Dual-Side Polished Microstructured Optical Fiber with Dual-Core" Sensors 20, no. 14: 3911. https://doi.org/10.3390/s20143911
Note that from the first issue of 2016, this journal uses article numbers instead of page numbers. See further details here.