1. Introduction
The clothing industry is a downstream process in the textile supply chain. Taiwan’s textile industry constitutes a complete production system that covers fiber manufacturing, spinning, weaving, dyeing, and clothing finishing. The upstream of the textile industry includes the raw material suppliers of clothes, the midstream has raw material processors and clothing manufacturers, while the downstream has trade agents and brand owners. According to the Department of Statistics, Taiwan’s Ministry of Economic Affairs and the output value of the man-made fiber industry in 2019 reached NTD 356.2 billion, accounting for 95% of the total output value of the textile industry. The export market of the midstream textile industry was mainly in Vietnam and mainland China with an output value of US 2.2 billion and US 1.6 billion, accounting for 24% and 18% of the overall textile industry’s output value, of which the clothing and apparel industry has a production value of NTD 17.8 billion. This accounts for 5% of the output value of the overall textile industry with the total output value of the textile industry reaching NTD 374 billion [
1].
However, the natural resources become difficult to extract, the costs rise due to the decline of nonrenewable resources and decrease the resources used to minimize waste efficiently by focusing on the reduce, reuse, and recycle (3Rs) [
2,
3,
4]. For instance, recycling is a system aiming at optimizing the use of different resources to achieve more general profit and less waste production. Still, previous studies revealed that in the United Kingdom, about 9 million tons of second-hand clothes were discarded, of which only 17% were recycled through the curbside recycling program, much lower than that of paper (51%) and that of glass (32%) [
5,
6]. The most effective way in the United Kingdom to reuse discarded clothing is recycling through social welfare groups and second-hand clothes recycling banks. 230,000 tons of collected second-hand clothes are recycled each year. That means about 8.77 million tons are disposed of by means of landfill or incineration each year. The resulting waste is great and leads to an increase in environmental loads. It is not only polluting the environment but also harmful to humans’ well-being. The primary goal lies in how to properly deal with discarded second-hand clothing, and advocate full recycling and reuse of these resources. There are only a few studies explored on how to sort and remanufacture to maximize the second-hand clothes-recycling rate and to minimize the total cost of remanufacturing.
The second-hand clothing recycling factories and remanufacturing centers under the jurisdiction of the Taiwan Environmental Protection Administration (TEPA), it was learned that recycling second-hand clothes mainly aims to reduce discarded clothing. The second-hand clothing recycling industry has not yet developed a complete production programming model so that second-hand clothing recycling factories waste the second-hand clothing that they have collected during remanufacturing [
7]. The costs incurred are considered even if second-hand clothes can be reused due to the lack of an optimal sorting and remanufacturing mode. This study takes the second-hand clothing recycling industry as its study topic and establishes a mathematical model for multi-objective production of second-hand clothing systematic sorting and remanufacturing. It is hoped that the model can help effectively reuse every single second-hand clothes to reduce the amount of discarded clothing and even reach zero waste. The second-hand clothing recycling factories and remanufacturing centers under the TEPA jurisdiction. This is known that 50% of recycled second-hand clothes can be reused, only 30% of which are reused. This means that about 70% of reusable second-hand clothes are not effectively reused and are often disposed of as waste.
This study aims to construct a production programming model for second-hand clothes systematic sorting and remanufacturing that facilitates the maximization of the recycling rate of second-hand clothes and the minimization of the total cost of remanufacturing. This study hopes to effectively reuse every article of second-hand clothes, reduce the amount of discarded clothes, and achieve zero waste of second-hand clothes. The objectives of this study are as follows:
To establish a mathematical model of the multi-objective production programming model for second-hand clothing systematic sorting and remanufacturing;
To construct a heuristic algorithm to solve and verify the established mathematical model;
To analyze the simulated situations, comparing the situations, and verifying the applicability of the programming model.
This study is organized as follows.
Section 2 discussed the Background of this study. The method is presented in
Section 3. The results are discussed in
Section 4. The conclusion is in
Section 5.
2. Literature Review
This section includes an overview of the second-hand clothing recycling industry, product recycling, remanufacturing, and resource allocation.
2.1. 3Rs and Overview of the Second-Hand Clothing Recycling Industry
3Rs The benefits of recycling through reducing the amount of solid waste, reducing the cost of waste disposal and saving energy and natural resources, the solid waste is the proper utilization of resources, leading to enhance the recycling programs improve the recovery plan of solid wastes [
8,
9]. There are challenges to recycle solid wastes, for instance, rapidly increasing solid waste amount and management cost, lack of database on solid waste management and recycling, lack of proper technology about the 3R’s, and limited information and network among the stakeholders [
10,
11]. Gu et al. [
12] argued that before recycling, to optimize total profits in the whole supply chain in understanding the return yield, sorting rate, and the recycling rate to optimize total profits in different periods. However, there are still many attributes before the recycling process such as the manufacturing costs, recycled rate and leads to re-allocate the resources [
3].
There are few studies analyzed on how reused and recycled second-hand clothing affecting the operational performance on profit and cost optimization in the remanufacturing process. In other words, while entering the recycle or remanufacture process, second-hand clothing is deliberated as a multi-period CLSC (Closed-Loop Supply Chain), which is also supported [
13]. In reality, there is a huge volume of second-hand clothing from the multi-batches in a certain period. For instance, Lin et al. [
8] developed a holistic recycling production plan on the optimization of recycled units used and recycled product produced with the maximum total profit and understand the potential situations of recycled units adopted in the recycled product by fixing the total cost for recycled products. The model developed by Gu et al. [
12] analyzed and developed a pricing strategy to optimize total profits in a closed-loop supply chain. Moreover, Chung et al. [
14] proposed a new optimization method to maximize the collection of used tertiary packaging for reuse, meanwhile minimize the total operating cost by taking the advantages of simultaneous optimization of multi-period planning. However, these studies did not include the recycling rate and compare it to other studies. Few studies have reflected the features of second-hand clothing recycled from return, and reused to recycle in optimize the costs and recycling rate. Still, the sensitivity analysis needs to compare the situations in reality and understand what are the best strategies in second-hand clothing recycling.
2.1.1. Status Quo of the Recycling of Second-Hand Clothes Industry in Taiwan
TEPA has launched a series of second-hand recycling and sale and expo activities to increase the recycling rate of reusable second-hand resources, and indirectly reduce the amount of garbage. The activity “Used Book and Clothing Sale and Expo” has been held in the cities [
15]. In addition to the sales of clean used books and clothing, they also held activities which award points of second-hand clothes recycling bank to those who recycle their used items. This activity has found new owners for 8321 second-hand items. It also has collected 4460 kg of reusable second-hand items. TEPA presented that the recycled second-hand items are selected and cleaned by specialized personnel before they are found new homes. The activity is hoped to create an atmosphere of repeatedly recycling resources and extending the service life of the usable items. This is appealed to the public to consume reasonably, cherish items when using them, pass them on to those who need when the items are unwanted, classify garbage when the items are discarded, and show kindness to an items’ service life. This way, it is hoped to reduce the amount of garbage at its source, and step towards the vision of zero waste [
16]. For the yearly recyclable amount of second-hand clothes in Taichung City, Taiwan, please refer to
Table 1.
2.1.2. Second-Hand Clothes Recycling Technology
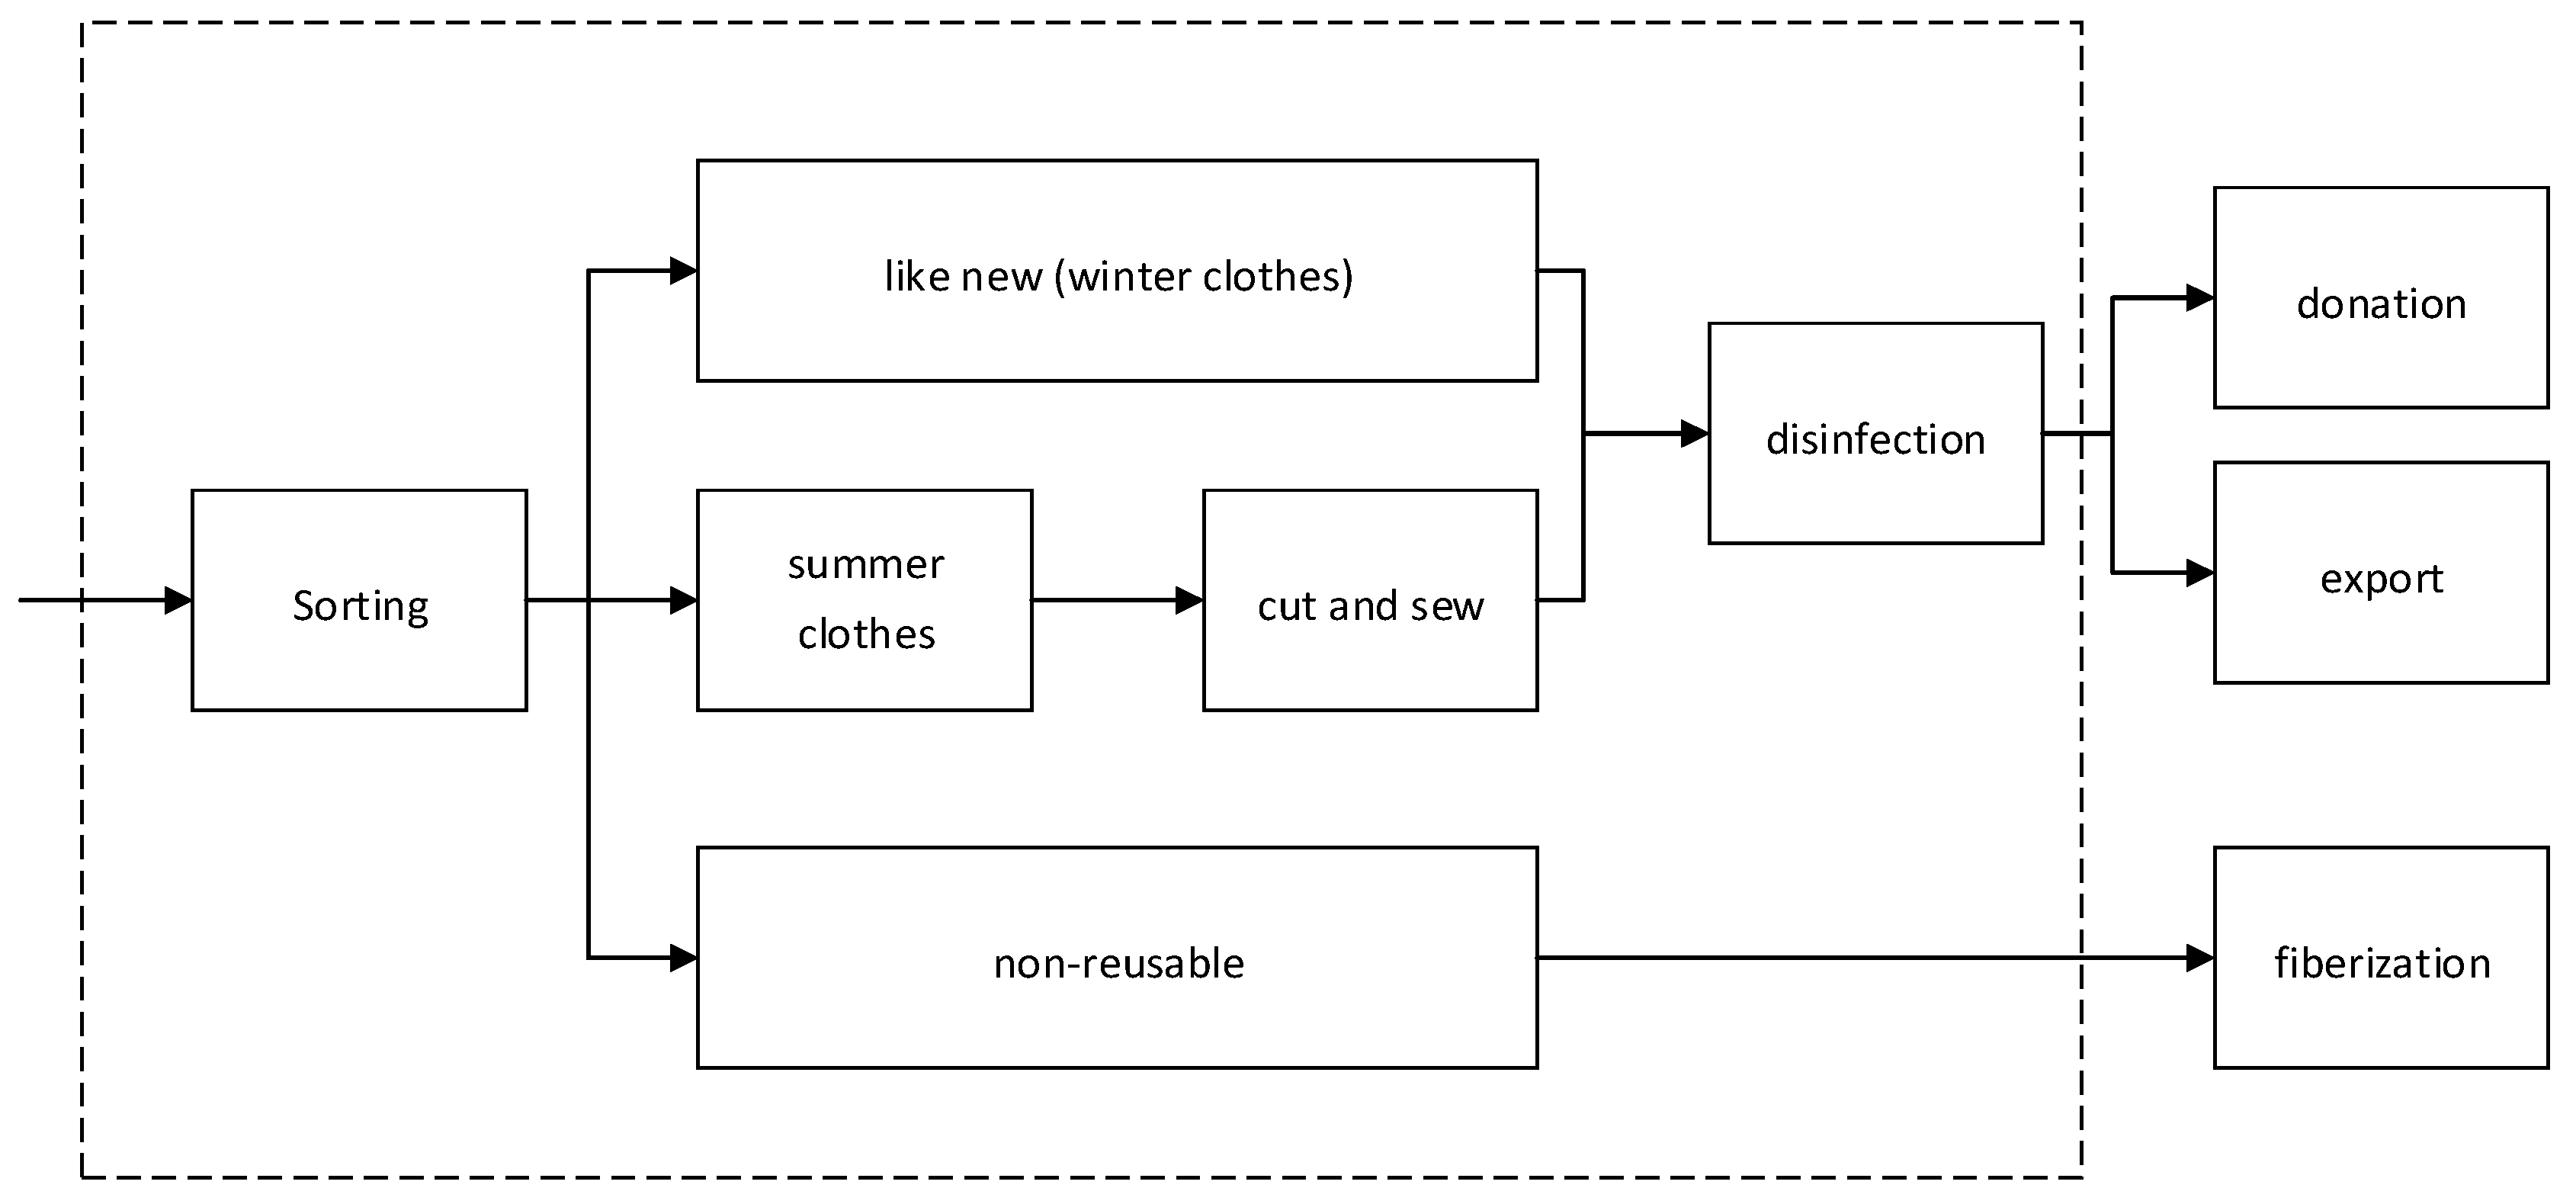
The trend of massive consumption of fast-moving consumer goods contributes to a large quantity of discarded clothes with an increase in the consumption power of emerging countries that have big populations. That necessitates the introduction of the circular economy to the apparel industry. The international fast-moving consumer goods firm has launched the Global Clothing Collection Recycling Program in many countries. Second-hand clothes are collected and transported to factories that are sorted and processed by factory workers [
17,
18,
19,
20]. The sorted clothes are dealt with through cooperation with charities, communities, and textile firms. The specific process is shown in
Figure 1.
There are several categories of old clothes that are recycled by firms, such as winter clothes and summer clothes. These second-hand clothes vary from almost new to worn out. Moreover, second-hand clothes are made from different materials, such as cotton, polyester, wool, leather, and blends. To reuse second-hand unwanted clothes, they are classified first. At present, most old clothes are sorted manually and the sorting efficiency is relatively low. Some firms adopted a semi-automatic sorting mode and introduced an old clothing sorting technique. Although this second-hand clothing sorting technique is relatively traditional and only semi-automatic, work efficiency has been greatly improved compared with the sorting completely by hand. Old clothes sorting is expected to embark on a scientific and modern track with the development of the old clothes recycling industry and an increasing awareness of the notion that old clothes are also precious resources [
8,
21,
22].
This study aims to increase the recycling rate of second-hand clothes. It explores how to establish a multi-objective production programming model for systematic sorting and remanufacturing to improve the recycling rate of old clothes and minimize remanufacturing costs. In this way, it is hoped to achieve zero waste of old clothes and adhere to the Reduce, Reevaluate, Reuse, Recycle, and Rescue principles of environmentally friendly consumption.
2.2. Product Sorting and Remanufacturing
The operation mode of traditional logistics involves raw material logistics, production logistics, sales logistics, and reverse logistics. Reverse logistics plays a role in product return, maintenance and remanufacturing, reprocessing, and waste cleaning in the logistics process. In addition to recycling expired products and providing after-sales services of the traditional logistics operations, green reverse logistics also means the backward flow of materials from the consumers to suppliers. The reasonable and efficient green reverse logistics can be divided into the following five links [
6,
13,
23].
Recycling old products: this is the starting point of reverse logistics. The quantity, quality, and method of the recycling and the timing of product return should all fall within the controllable range. Firms should not only consider their logistics’ efficiency but also cooperate with other associate parties in the supply chain and needs to organize logistics from the overall supply chain, and ultimately establish a recycling logistics system that involves suppliers, wholesalers, retailers, and consumers;
Transport of old products: both the transport and storage costs and the processing costs of products over time should be taken into consideration;
Inspection and treatment: Based on product quality, a firm should decide on the treatment of the product as soon as possible, reducing the cost of green logistics and shortening the time for the remanufactured products to return to the market;
Repair of recycled products: a reusable component from recycled products or a whole recycled product is repaired or logistics processing is carried out;
Recycling of sales products: having been repaired or reorganized, the products are put into the market for sale.
Traditional remanufacturing is defined as processing old or retired products into a new-like appearance. The definitions for traditional remanufacturing can be subdivided into processing type and upgrading type. Remanufacturing through processing is turning old products into new-like ones with surface processing techniques [
24,
25]. Remanufacturing through upgrading is using new materials or techniques to upgrade the functions of old products [
26].
Resources contain relevant assets and information, tangible or intangible. However, resources are not sufficient to satisfy the needs of all aspects because they are limited. As a consequence, how to allocate limited resources is a major issue that faces today’s countries and firms. Only an objective and forward-looking distribution approach can improve the development of firms, even in China. Everything usable can be called a resource. [
18,
27].
3. Method
3.1. Framework
This section focuses on the remanufacturing process of reusable clothing. The multi-objective production programming model for systematic sorting and remanufacturing second-hand clothing is explored to maximize the recycle rate of second-hand clothing and minimize remanufacturing costs. A mathematical model that meets its objectives was constructed, verified, and described.
3.2. Model Constraints
Referenced that a multi-objective programming method [
28], to assist decision-makers in seeking a better course of action with limited resources and conflicting goals;
Assumed that each batch of second-hand clothes in recycling factories needs to be classified. In this study, second-hand clothing of categories A, B, and C represent second-hand clothes with a high, medium, and low level of wear and tear, which the batch is a quantity of second-hand clothes at one time;
Supposed each batch of reusable clothes in recycling factories that has been sorted out can be remanufactured, second-hand clothes of Category C can be resold without remanufacturing;
Assumed that second-hand clothes of Category A and B need not putting into remanufacturing for recycled products of Level , and the rest can be put into remanufacturing various levels of recycled products. This study assumes that remanufactured products of Level are rags, those of Level are handbags, coin purses, and recycled stuffed animals, those of Level are products for recycled clothes, and those of Level is used clothes that can be resold without remanufacturing;
New raw materials are deemed feasible to be calculated by weight and measured in kilograms;
When second-hand clothes are upgraded, the input quantity and cost of new raw materials need to be taken into account. For instance, second-hand clothes of Category B are put into remanufacturing for Level products, and Category A second-hand clothes are put into remanufacturing for Level and products;
When second-hand clothes are downgraded, the quantity and cost of old clothes waste should be considered. For example, second-hand clothes of Category C are put into remanufacturing for Level and recycled products, and second-hand clothes of Category B are put into remanufacturing for Level recycled products.
3.3. Nomenclature
Parameter Description| i | The batch of recycled second-hand clothes, |
| j | The category of second-hand clothes, |
| l | The category of new raw materials for remanufacturing, |
| k | The level of remanufactured products, |
| The quantity of Batch recycled clothes |
| The unit cost for the remanufacture of Category second-hand clothes into Level products |
| The unit cost for the remanufactured Level products with new raw material |
| RDC | The unit recycling cost of Category second-hand clothes |
| WC | The unit cost of waste incurred by using Category second-hand clothes for the remanufactured Level products |
Variable Description | The input of new raw material for remanufactured Level products |
| The amount of waste incurred by using Category second-hand clothes for remanufactured products of Level |
| The recycling quantity of Category second-hand clothes from Batch |
| The output of Level products with the input of Category second-hand clothes |
| 1 means that Batch second-hand clothes are categorized into Category ; otherwise, 0 |
| 1 means new raw material used for remanufactured Level products; otherwise, 0 |
| 1 means the waste produced by Level products remade with Category second-hand clothes; otherwise, 0 |
| 1 means the remanufacture of Level products with Category second-hand clothes; otherwise, 0 |
3.4. Mathematical Model
The “multi-objective programming method” is a mathematical programming method that allows one to simultaneously consider multiple objectives during the decision-making process [
28]. Multi-objective programming aims to assist decision-makers in seeking a better course of action with limited resources and conflicting goals [
3,
29,
30]. The objective function is to maximize the recycling rate of second-hand clothes and minimize the total cost of remanufacturing.
Maximum Recycle Rate of Second-hand Clothes = The Output of Remanufactured Products
(The Quantity of New Raw Materials for Remanufacture + The Number of Second-hand Clothes)
Minimum costs of remanufacturing = Recycling Cost + Remanufacturing Cost + New Raw Material Cost + Cost Incurred by Discarding Collected Second-hand Clothes
The constraints are as follows:
The constraints are explained as follows:
The constraint (3) makes sure that each batch of second-hand clothes needs to be classified;
The constraint (4) ensures that every category of second-hand clothing needs to be put into production for remanufacturing. When second-hand clothes category and , they will not be put into production for remanufactured products of Level ; the situation is zero in this case;
The constraint (5) means that additional new raw material costs will be incurred if sorted second-hand clothes are to put into production for an upgrade;
The constraint (6) means that additional disposal costs will be generated if sorted second-hand clothes are put into production for a downgrade. When the second-hand clothes category , they will not be downgraded, so the situation is zero in this case;
The constraint (7) is the sum of the recycled amount of Category second-hand clothes from a batch is equal to the amount of this batch;
The constraint (8) makes certain that the output of the remanufactured products from second-hand clothes + the amount of waste generated by remanufacturing recycled second-hand clothes should be equal to the input of recycled second-hand clothes + the input of new raw materials;
The constraint (9) ensures that the amount of disposal waste from remanufacturing recycled products cannot exceed the output of remanufactured products;
The constraint (10) means that the quantities of various materials are non-negative integers;
The constraint (11) makes sure that a decision variable is an integer of 0 or 1.
3.5. Multi-Objective Simplex Method
By interviewing second-hand clothing remanufacturing centers under the jurisdiction of the TEPA in Taiwan, it is known that the priority of decision-making aims to maximize the recycling rate of second-hand clothes. This study uses the multi-objective simplex method to solve the problem and achieve the goal of maximizing the recycling rate of second-hand clothes as follows:
Step 1: Based on the maximization of the recycle rate, objective Equation (1) + the Constraint (9) + Slack Variable , which is transformed into an identity.
Step 2: The slack variable is chosen as the basic variable and the initial points of ,, , and are regarded as the initial feasible solutions with following settings: i = 1, j = 1, l = 1, and k = 1.
Step 3: Suppose i = i + 1, j = j + 1, l = l + 1, and k = k + 1. The maximum values of the new objective equation and the original target value are calculated. In this way, the maximum value of is calculated as the non-inferior solution for the current solution.
Step 4: The values of all corner points are calculated. If there are still other values for the corner points to be solved, then will be moved into the smaller basic solution until the maximum value is figured out.
Step 5: The target value from maximizing the recycling rate is substituted into the PSO to obtain the target value of minimizing the total cost of remanufacturing.
3.6. PSO Construction
Particle Swarm Optimization (PSO) is a heuristic algorithm to simulate the predation of bird populations. Its main principle is to simulate a bird group flying and looking for food in a space where there is food. The bird group does not know the exact location of food, so when some birds find a place closer to food, they will communicate with others through some communicative behaviors. This way, other deviating birds will be attracted to a place closer to the food source. As a result, birds can find food by following the ones closest to the food. Li and Chang [
31] indicated the velocity bias is measured as the difference between the ideal velocity and current absolute velocity; a smaller velocity bias reflects a more optimal state, therefore, the parameter values of partic 789 pm le with the smallest velocity bias are assigned as the global optimum for the reference point.
In the PSO, each bird flying in space is regarded as a particle in the D-dimensional space, namely a possible solution. Each particle has a fitness value measured by a fitness function. In addition, each particle has a flying velocity that determines the direction to which the particle moves and the distance it covers. The particle dynamically adjusts its flying based on their flight experience and the whole particles. They update their speed and position with two types of memory search, one of which is the particle best (pbest) that can be regarded as its own best flight experience while the other is the global best (gbest) found in the entire particle population so far, which can be regarded as the best flight experience of the particle groups. The equation for the particles’ updating speeds and positions is as follows [
32,
33]. A swarm of individuals, known as the particles, flow through the swarm space. Each particle represents a candidate solution to the given problem. Each particle is associated with two parameters, namely, current position,
and current velocity,
as described below [
34]:
The proposed PSO method in this paper is to obtain the feasible solutions, and
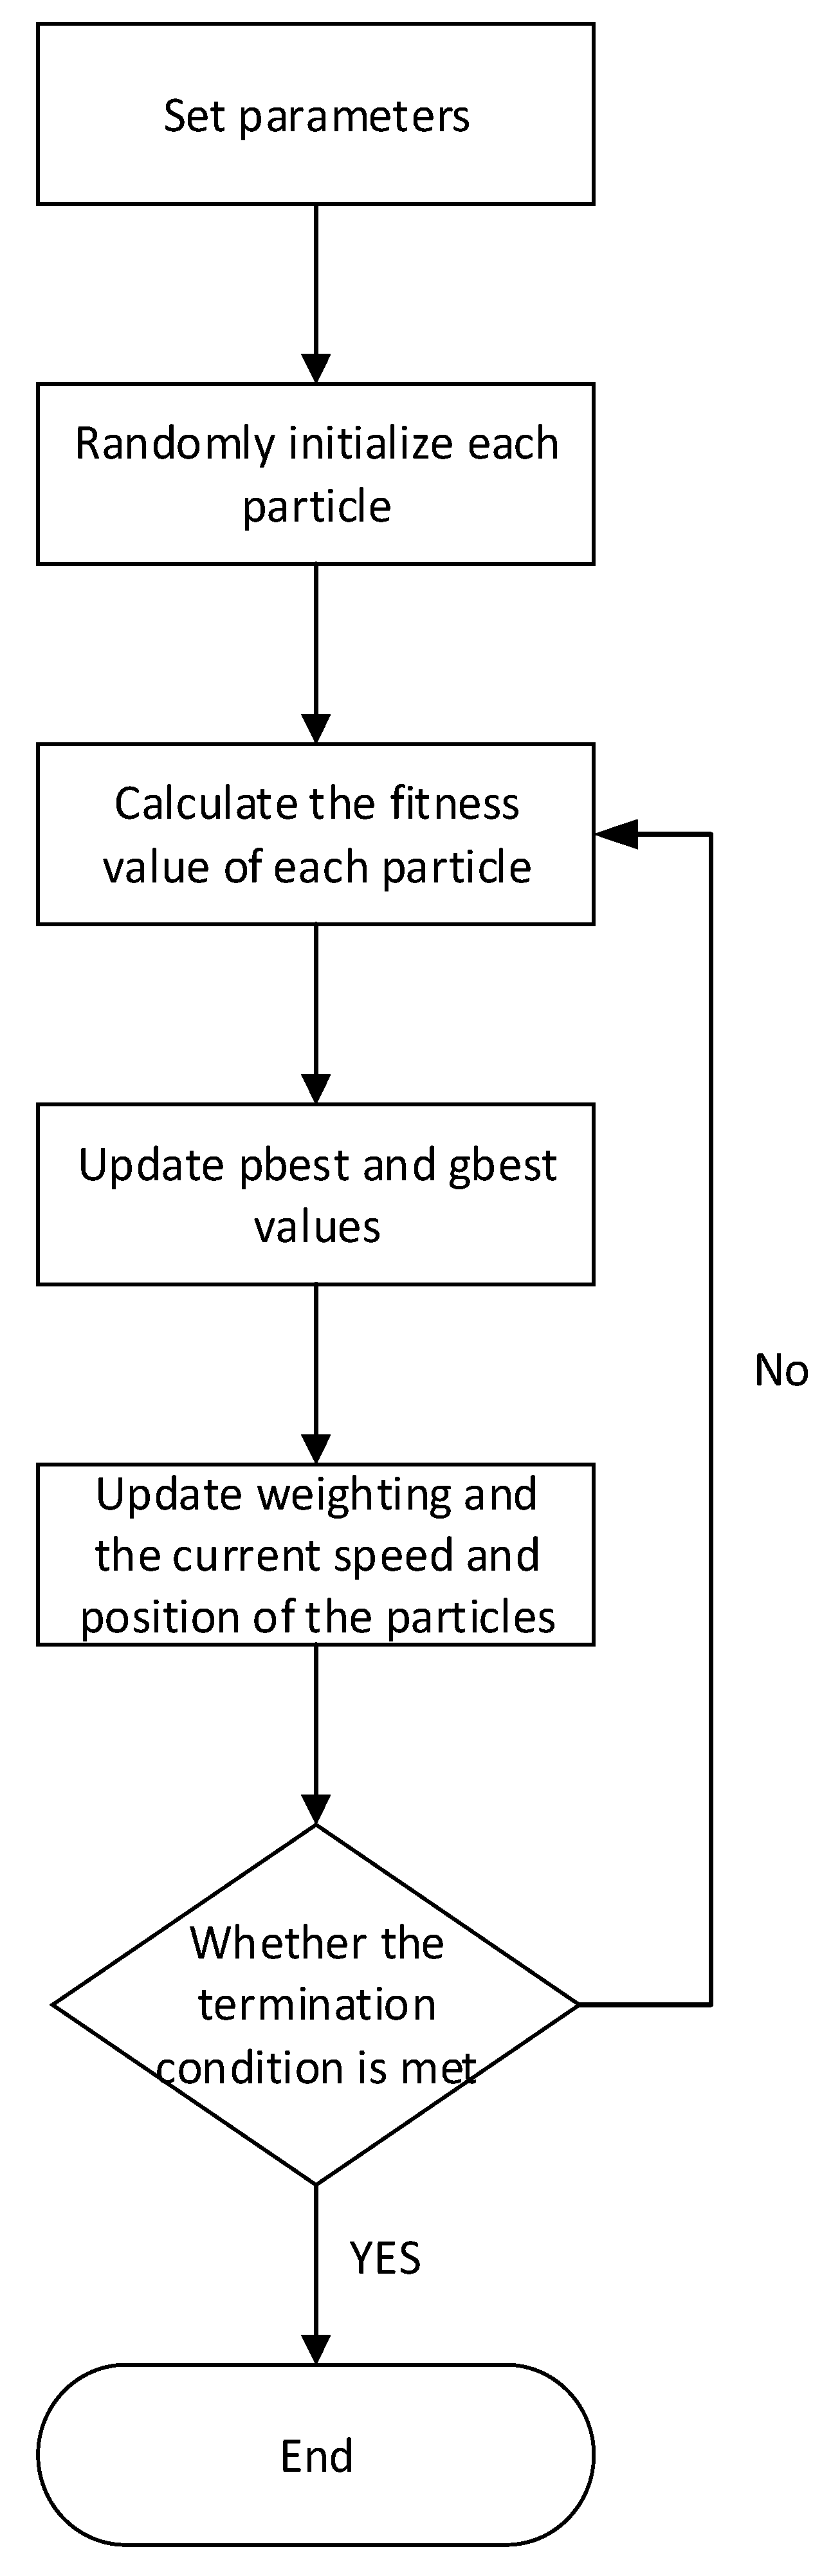
Figure 2 shows the PSO of the proposed algorithm, the algorithm is fully described elsewhere [
35] and is summarized in the following step, the calculation process of the PSO is described below:
Step 1: Set parameters, including dimensions, the number of particles, inertia weight, learning factor, etc.;
Step 2: Establish an initial solution, initializing the position, velocity, individual best position (pbest) and global best position (gbest) of each particle, and randomly generator and initialize each particle;
Step 3: Calculate the fitness value of the initial position of the particle according to the set objective function;
Step 4: Compare the fitness value of the particle with that of pbest. If the fitness value of the particle is better than that of pbest, then the individual optimal position is updated. After that, the fitness value of each particle is compared with that of gbest. If the fitness value of each particle is better than that of gbest, then gbest is updated;
Step 5: The update Equations (1) and (2) and update weighting (3) through a linear decrement method is used to calculate the speed and position of the particle after it moves;
Step 6: Determine whether the termination condition for the maximum number of searches is satisfied. If not, go back to Step 3 to calculate the fitness value of the particle after it moves.
The mathematical model established for systematic sorting and remanufacturing old clothing in this study is a multi-objective programming problem. The larger the scale of the problem, the harder it is to solve the problem with the optimization method. Therefore, this study used particle swarm optimization to obtain an approximately optimal solution. The corresponding calculation process is as follows [
3,
32,
33].
3.6.1. Setting Parameters
The parameter setting of PSO is presented as follows:
(i) Dimensions and Number of Particles
In the PSO, the number of particles affects the solution efficiency. The bigger the number of particle groups is, the larger the solution space is. Relatively speaking, the larger a group is, the longer the time needed to find solutions. Therefore, to save computation time and maintain the quality of the solution, the study sets the dimensions and the number of particles as , , and based on the following eight variables , ,, ,, , and .
(ii) Learning Factors
Learning Factor 1 (C1) and Learning Factor 2 (C2) affect the velocity of new particles when the particles move to the individual best position (pbest) and the global best position (gbest). During this process, the particles will possess the ability to learn. Generally, C1 and C2 are set to be equal, ranging from 0 to 4. If Learning Factor 1 (C1) is set to be relatively large, the particles likely wander around the local range. In another case, when Learning Factor 2 (C2) is set to be relatively large, it is likely for the particles to reach local optimal values (premature convergence). Therefore, the ratio of the two learning factors must be set properly to avoid excess divergence or premature convergence. This study sets both factors to 2, i.e., C1 = 2 and C2 = 2.
(iii) Inertia weight
In the updating PSO equation, the magnitude of the inertia weight is closely related to the PSO convergence. The inertia weight determines the speed of the previous iteration, and the proportion occupied during the update and the evolution. The greater the inertia weight is, the better the global search ability of the PSO; the smaller the inertia weight is, the better the local searchability of the PSO. This study adopted the linear decrement method, so the maximum weight was set as while the minimum weight was set as .
3.6.2. Update Rule
(i) Update of Particle Speed and Position
The PSO updates the velocity and position of each particle according to the equation and In the equations, represents the velocity of Particle i in Dimension d. means the position of Particle i in Dimension d. means in the best position of Particle i (pbest) in Dimension d, means the global best position (gbest) in Dimension. d, and t means the times of current iteration.
(ii) Weight update
This study updates the weights in Step 6 with the linear decrement method by using the equation, wmax is the maximum value of the weight, which is set to be 0.9 while wmin is the minimum value of the weight, which is set to be 0.4, and tmax represents the times of iteration.
4. Results
This study established a multi-objective programming model for the systematic sorting and remanufacturing of second-hand clothing. The programming comparison and performance evaluation were carried out based on the actual situations of the old clothing recycling factories and remanufacturing centers under the jurisdiction. Three sorting methods were proposed with the factories as cases: the first sorting method, to classify the second-hand clothes by category; the second method, to classify second-hand clothes by the worn-out condition; and the third method, to classify second-hand clothes based on clothes materials. Relevant data, such as the batch of second-hand clothes put into production, the amount of recycled second-hand clothes, and the input of new raw materials were substituted into the programming model that aims to maximize the recycle rate and minimize the remanufacturing costs. The batch of second-hand clothes collected in the same month was coded in an ascending order based on their weights. The number of recycling clothes was arranged by weights in the ascending order. The three sorting methods were used to compare the recycling rate and the total costs of remanufacturing. In addition, corresponding performance evaluation was carried out.
4.1. Analytical Results
The study scope fell within second-hand clothing recycling factories and remanufacturing centers under the TEPA jurisdiction. The basic data for simulation were set according to the amount of the used, recycled clothing, which are its most recent data and the amount and cost of used recycled clothes, the input and cost of new raw materials, remanufacturing costs, and disposal costs.
4.1.1. The Simulation Amount of Recycling Clothes
The amount of old recycled clothes is restricted by the maximum production of the month. The simulation was carried out to the output that had been generated by a random number under the constraint of the maximum output of remanufactured products out of recycled products in each batch.
Table 2 shows that the number of recycling clothes for each batch and this study selected the quantity with the fourth, eighth, and tenth batches as the case.
4.1.2. Input of Simulated Amount of New Raw Materials
The new raw materials are necessary while remanufacturing new recycled products, e.g., sewing new buttons for the missing ones on the recycled clothes. The input of the new raw materials of the center in December 2015, as shown in
Table 3, includes (1) cotton and linen, (2) buttons, and (3) printing material. The simulation plan was carried out with fourth, eighth, and tenth batches as cases. The input of new raw materials was constrained by the maximum output of remanufactured products. The simulation was done with the input generated by random numbers, which was constrained by the maximum output.
4.1.3. Real Relevant Costs Information Obtained from TEPA
The costs of second-hand clothes systematic sorting and remanufacturing mainly include the cost of recycling old clothes, the cost of new raw material input, the remanufacturing cost of old clothes, and the cost of disposal of old clothes waste. The price is expressed within the unit cost per kilogram. This study refers to the information on the relevant costs provided by the Taiwan Environmental Protection Administration and calculates the costs as shown in
Table 4,
Table 5,
Table 6,
Table 7 and
Table 8.
Table 4 indicates the processing cost and disposal cost for recycled old clothes per kilogram.
Table 5 shows the costs of different types of new raw materials added to the remanufacturing processes.
Table 6 includes the remanufacturing cost per kilogram under the second-hand clothes sorting by the worn-out condition.
Table 7 includes the remanufacturing cost per kilogram under the second-hand clothes sorting by category.
Table 8 is the remanufacturing cost per kilogram under the sorting based on clothes materials.
This study used the PSO to solve the mode of multi-objective programming for systematic sorting and remanufacturing second-hand clothing. The program was written with Matlab R2009b. Therefore, this section will explore the performance of the recycling rate of second-hand clothes that have been classified and remade, and remanufacturing costs under three different sorting methods.
4.2. Result Analysis
The fourth, eighth, and tenth batches of second-hand clothing were chosen for this study. In this case, the respective impact of the three different sorting methods on the recycle rate and remanufacture of second-hand clothes are explored. Through the comparison of the recycling rate and the remanufacturing costs between the first and second method, and that between the first and third method, it is hoped to find out the best way to achieve the goal of minimizing the remanufacturing cost and maximizing the recycle rate.
4.2.1. The Fourth Batch of Second-hand Clothes
Table 9 is a comparison of the first and second sorting methods. Under the second sorting method (according to the level of worn-out condition), the recycling rate is reduced by 2.4% and the total remanufacturing cost is reduced by NTD 55,855, a reduction of 24%.
Table 10 shows the comparison of the first and third sorting method. Under these two methods, the recycling rate of second-hand clothing is the same. However, the total remanufacturing costs under the third method are reduced by NTD 11,625, a decrease of 5%.
4.2.2. The Eighth Batch of Second-Hand Clothes
Table 11 shows the comparison between the first (items) and the second (the level of worn-out condition) sorting method. Although the recycling rate was reduced by 2.1% under the second method, the total remanufacturing cost decreased by NTD 84,422, a reduction of 24%.
Table 12 displays the comparison between the first and third sorting method. The recycle rate of second-hand clothing was the same under the two methods. However, the total remanufacturing cost decreased by NTD 17,671, a reduction of 5%.
4.2.3. The Tenth Batch of Second-hand Clothes
Table 13 shows the comparison of the recycling rate and remanufacturing cost between the first and second methods. Under the second method, the recycling rate of sorted old clothes was reduced by 2.2%, and the total remanufacturing cost was reduced by NTD 95,769, a reduction of 24%.
Table 14 shows the comparison between the first and third methods. The recycling rate under the two methods was the same. However, under the first method, the total remanufacturing cost was reduced by 5%, a reduction of NTD 19,813.
The first method is better under the consideration of the maximum utilization rate. In terms of the minimum remanufacturing costs, the second sorting method is better.
4.3. Situational Simulation
The simulation analysis was carried out with the United States, Bangladesh, and Taiwan as cases; the United States is a developed country that has a relatively complete technology for remanufacturing second-hand clothes while Bangladesh and Taiwan are still developing and have a much less advanced remanufacturing technology. The fourth, eighth, and tenth batches of the collected second-hand clothes in a single month were used for the evaluation of the performances under three different sorting methods. The costs were estimated based on the average real GDP per capita in Taiwan, the United States, and Bangladesh in 2015, which were US $56,421, US $22,294, and US $3373, respectively.
4.3.1. Situation I: Taiwan
Taiwan’s resource recycling industry has flourished. With the consumers’ rising awareness of the need for environmental protection, the government has actively assisted the industry. Due to the lack of a comprehensive old clothing sorting and production programming in Taiwan, discarded old clothes cannot be effectively reused. Currently, the government is actively promoting the recycling and remanufacturing of wasted textiles. In this case, it is expected that the goal of zero waste of second-hand clothes can be achieved.
4.3.2. Situation II: United States
Actively investing in the development of the textile industry and introducing high-tech and innovative technology, the United States has complete remanufacturing technologies. However, with the labor costs relatively high, old clothing remanufacturing factories may not choose a remanufacturing method that incurs a relatively high cost.
4.3.3. Situation III: Bangladesh
Bangladesh’s resources are scarce, and its industrial production is relatively backward. Even if labor costs are relatively low in Bangladesh, it has no perfect remanufacturing techniques. Most old clothes are not discarded until worn out. Consequently, the amount of old clothes put into remanufacturing is relatively small, resulting in a relatively low recycle rate of old clothes.
The three sorting methods in different situations are compared. The average of the total remanufacturing costs and recycling rates for the fourth, eighth, and tenth batches of the old clothes under different methods are obtained. The average costs and recycle rates under the first method (to sort by category) were set as the benchmark to compare with those under the second (to sort according to worn-out condition) and third (to sort according to clothes materials) methods, respectively. In the situation of the United States, the second sorting method had a higher improvement rate of old clothing reuse. In the situation of Taiwan and Bangladesh, a comprehensive comparison of recycling rates and total costs of remanufacturing showed that the recycle rate decreased by 0.1% while the total remanufacturing rate was reduced by 5%. The third sorting method was the best for both countries, as shown in
Table 15.
The recycling rates are arranged in the descending order: Taiwan > the United States > Bangladesh. The recycling rate of the United States is lower than that of Taiwan due to the high remanufacturing cost of the United States. The total remanufacturing costs are arranged in the descending sequence: the US > Taiwan > Bangladesh. Even though Bangladesh’s remanufacturing costs are low, its recycling rate is low because it is lacking in remanufacturing technology, for which it is hard for them to remake second-hand clothes and sell them, and in the awareness of sustainable development and environmental protection.
4.4. Sensitivity Analysis
Taiwan Textile Research Institute has proposed to develop functional fibers, assisting Taiwan’s textile industry in continuing to develop differentiated products, to expand product application scope, and to increase added values. It also helps the industry innovate an integrated structure of yarn and fabrics, including the development of materials, such as functional nano-fibers and Ultra-lightweight fibers that offer optimal warmth, develop functional nano-fiber materials, develop synthetic fibers with non-inorganic substances that are both hydrophobic and quick-drying. It helps create “energy-saving and carbon-reducing cool fiber products”, which makes a more diversified market. It directly increases fiber production capacity, which reduces the material cost of fiber acquisition by at least 30% to enhance market competitiveness. Therefore, the impacts of the changes in variable costs of remanufacturing on the total remanufacturing costs and the recycling rate are considered, as shown in
Table 16 when the new raw materials that were used to obtain natural fibers and synthetic fibers were reduced by 20%.
The cost of new raw materials was reduced by 20%, with the increase of remanufacturing, the total cost of remanufacturing increased while the recycle rate decreased. The recycling rate under the third sorting method was the highest. With the increase of remanufacturing costs, the recycle rate under the first sorting method was higher than that under the first sorting method.
With the occurrence of natural disasters, explored was the effect of variable costs of remanufacturing on the total cost of remanufacturing and the recycle rate, as shown in
Table 17 when new raw materials of natural fiber and synthetic fiber were increased to 20%.
The cost of new raw materials increased by 20%, the total cost of remanufacturing reduces while the recycle rate increased along with the reduction of remanufacturing costs. The recycling rate was the highest under the third sorting method, which was followed by those under the first and second methods. With the reduction of remanufacturing costs, the recycling rates under the three methods increased in parallel.
5. Conclusions
Environmental protection has become an inevitable trend. When clothes reach the end of their service life, they are discarded and put into landfills or incineration furnaces with general garbage resulting in high environmental baggage. Thus, this study proposes a multi-objective production programming for systematic sorting and remanufacturing second-hand clothes, with the hopes of fully recycling and reusing old discarded clothes. The concept of multi-objective production programming for systematic sorting and remanufacturing second-hand clothes, a corresponding mathematical model has been established with the old clothing recycling industry as an example to discuss the remanufacturing of second-hand clothes. Three second-hand clothes sorting methods were proposed as follows: old clothing sorting by category, old clothing sorting by the worn-out condition, and old clothing sorting based on clothes materials. In addition, this study compared the three methods in the context of different countries and regions and explored the impact of the three sorting methods on the total cost of remanufacturing and the recycling rate in the sensitivity analysis. The study summarizes as follows:
The comparison of the three sorting methods shows that the total remanufacturing cost is relatively low under the second method, and the recycling rate is the highest under the first sorting method;
The situation analysis presented the recycling rate of the old clothes recycling industry in Taiwan was the highest, followed by the United States. Although the labor cost in Bangladesh is relatively low, clothes there are not often discarded until they are worn out. Therefore, the recycling rate is not that high in Bangladesh. The labor cost in the United States is quite expensive. Consequently, not all old clothes will be remanufactured. Thus, the recycling rate of the US is lower than that of Taiwan;
The recycling rate and the total remanufacturing cost under the three sorting methods are significantly different in the United States. However, in the context of Taiwan and Bangladesh, the two attributes have no significant difference under the second and three sorting methods;
In the sensitivity analysis, the new raw material cost was fixedly reduced by 20%, the recycling rate was the highest under the third sorting method, and the total remanufacturing cost was the lowest under the second method. When the new raw material cost increased by 20%, the recycling rate was the highest under the third sorting method, and the total remanufacturing cost was the lowest under the second method.
This study considers the process of recycling and remanufacturing old clothes. It does not take into account the process of turning old clothes into raw materials and putting them into clothing production. If a circular production mode is made so that raw materials used for textile products can be extracted from old clothes and put into remanufacturing, the notion of “Cradle to Cradle” sustainable development can be turned into reality. To lay a solid foundation for sustainable development, relevant attributes that measure environmental loads are further included in production programming, such as the benefit of carbon emission reduction from old clothes recycling. A production programming model is constructed with the consideration of old clothes recycle rates, total remanufacturing costs, and the goal of carbon emissions.
This study approaches the green production logistics of old clothes remanufacturing. In the future studies, green raw material logistics and green sales logistics can be added to explore the benefits of turning old clothes into raw materials and selling the remanufactured clothes in the second-hand market after the raw materials are used for remanufacturing. The second-hand clothing recycling factories and remanufacturing centers are under the jurisdiction of the TEPA. The second-hand clothes recycling factory is responsible for preliminary sorting, cleaning, and disinfection of second-hand clothes. The remanufacturing center is responsible for remanufacturing and judging what kind of clothes can be remanufactured from the existing second-hand clothes.
The limitations of this study are described below. (1) the production programming model for the systematic sorting and remanufacturing of second-hand clothing is studied mainly based on second-hand clothing recycling factories and remanufacturing centers; (2) this study takes into consideration the production plan for classifying and remanufacturing reusable second-hand clothes; it does not take into account the subsequent recovery process that non-reusable second-hand clothes are converted back to raw materials; (3) this study considers the cost of recycling, remanufacturing, and discarding second-hand clothes, and is incurred by adding new raw materials for remanufacturing products. The inventory cost is not taken into account and (4) discarded second-hand clothes are often calculated in kilograms, and the remanufactured products made from second-hand clothes can be calculated by weight or quantity. Thus, the amount of recycled second-hand clothes, the output of remanufactured products made from second-hand clothes, the input of new raw materials, and the number of second-hand clothes discarded after being recycled and remanufactured are all calculated in kilograms.
If the maximization of the recycling rate is taken into account, the first sorting method (sorting second-hand clothes by category) is better. If the minimization of the total remanufacturing cost is considered, the second sorting method (sorting by the worn-out condition of second-hand clothes) is better. The recycle rate under the first sorting method was higher than those under the second and third (sorting based on clothes materials) methods. When the recycle rate increased by 5%, the total remanufacturing costs under the first sorting method reduced by 26% in comparison with those under the second method. When the recycle rate increased by 3.5%, the total remanufacturing costs under the first sorting method was reduced by 6% in comparison with those under the third method.
The comparison of the situations in the three countries shows that their recycling rates are arranged in descending order as Taiwan > the United States > Bangladesh. Because of a high remanufacturing cost in the United States, the recycling rate of the United States is lower than that of Taiwan. The total remanufacturing costs are arranged in the descending sequence: the US > Taiwan > Bangladesh. Even though Bangladesh’s remanufacturing costs are low, its recycling rate is not high because Bangladesh is lacking in remanufacturing technology, for which it is hard for them to remake second-hand clothes and sell them, and in the awareness of sustainable development and environmental protection. When the United States, Bangladesh, and Taiwan took into account the maximum recycle rate and minimum total remanufacturing costs, the recycling rate of old clothes could not reach 100%. The second sorting method (sorting by the worn-out condition of second-hand clothes) is applicable only to the countries where labor costs are relatively expensive while the third method (sorting according to the clothes materials of second-hand clothes) is more applicable to countries where labor costs are relatively inexpensive.

 ,
, 

