Article

Interaction of a Low-Pressure System, an Offshore Trough, and Mid-Tropospheric Dry Air Intrusion: The Kerala Flood of August 2018

1
Department of Environmental Engineering, Texas A&M University, Kingsville, TX 78363, USA
2
Department of Physics, Sri Venkateswara University, Tirupati 517502, India
*
Author to whom correspondence should be addressed.
Atmosphere 2020, 11(7), 740; https://doi.org/10.3390/atmos11070740
Submission received: 28 May 2020 / Revised: 29 June 2020 / Accepted: 9 July 2020 / Published: 13 July 2020

Abstract

:
The present study examines the Kerala Flood Event (KFE, 15–16 August 2018, in India) that occurred along the west coast of India and resulted in ~400 mm of rainfall in one day. The KFE was unique in comparison to previous floods in India, not only due to the rainfall duration and amount, but also due to the fact that the dams failed to mitigate the flood, which made it the worst in history. The main goal of this study is to analyze and elucidate the KFE based on meteorological and hydrological parameters. A propagating low-pressure system (LPS) from the Bay of Bengal (BoB) caused the streak of plenty of rainfall over Kerala, the west coast, central India, and the BoB. Additionally, the upper-tropospheric anti-cyclonic system over the Middle East region inhibited a northward advancement of LPS. On the western coast of India, a non-propagating (with diurnal fluctuations) offshore trough was observed over the west coast (from Kerala to Gujarat state). Therefore, a synergic interaction between LPS, an intrusion of dry air in the middle-troposphere, and the offshore trough was the main reason for KFE. However, after around ten days, rainfall saturated the dam capacities; thus, the released water, along with the amount of precipitation on the day of the event, was one of the other possible reasons which worsened the flood over Kerala.

1. Introduction

The quantity and availability of surface precipitation play important roles not only in hydrometeorology, but also in water resource management. Be it irrigation, agriculture, controlling floods, coping with droughts, or administering a freshwater supply, the timely assessment of events is vital to answering critical questions, such as when, where, and how much will it rain. Over the Indian subcontinent, the northward propagation of the monsoon and surface rainfall amounts are governed by remote teleconnections and internal dynamics of the monsoon itself [1]. During the summer monsoon, extreme flood events have significant social, economic, ecological, environmental, hydrological, and health impacts on regional and local communities. Therefore, the sudden kick-off of a natural disaster requires a detailed prioritization list of flood forecasts, assessments of the damages, risks, and improved management of floods. July and August are the rainiest months in India, and bring moderate to plenty of rainfall and sometimes floods over various parts of India. Recently, the state of Kerala (in India) witnessed the worst flooding of the century, which occurred from 15 to 16 August in 2018. The flood destroyed thousands of houses, leading to about 500 deaths, inundated water in cities and villages, collapsed bridges, and severely damaged communications [2]. The impact of the Kerala Flood Event (KFE) was much more severe in the following districts in Kerala: Idukki, Palakkad, Kollam, Kottayam, Malappuram, Ernakulam, and Pathanamthitta. The damages that occurred during the KFE were so severe that restoration facilities were obtained from various parts of India and transported to Kerala state. After the flood, in the last week of August, drought and a high temperature took over the Idduki district, where the water levels in the wells were reported to have fallen by 20 feet (from various online websites, e.g., Business Insider and Swarajyamag).
Extreme weather events are associated with low-pressure systems, cloud bursts, cyclones, and landslides, which have significant socioeconomic impacts [3,4]. However, over India, low-pressure systems (LPS) embedded in mean monsoonal flow produce abundant rainfall over land and oceanic regions; almost every year, LPS remains a leading cause of the flood. The KFE region is located along the orography of the western coast (~2.5 km height) of India. The torrential rainfall that occurred during the KFE caused landslides in the mountain regions and loosened soil in the hill slopes. Flash floods collect mud and debris along their way to the river.
Several research works have appeared on KFE, considering various aspects of this flood, e.g., hydrology [5,6,7], natural disasters [8], meteorological modeling [9], and a climate change perspective [10]. They have analyzed rainfall data of more than 100 years and used generalized extreme value distributions [5,6]. They have presented a return period of 1 to 3 days of extreme rainfall and contributions of dams in KFE. In terms of the analysis of hydrological datasets for the Periyar basin, the probability of such extreme rainfall in August is quite low, with a value of 0.6% over Kerala [7]. Kerala state has almost seven river basins (Achencoil River, Bharathappuzha, Ithikkara, Karuvannur, Karamana, Manimala, Muvattupuzha, Pallikkal and Kallada, and Periyar). A dataset obtained from the Sentinel-2A satellite and the modified normalized difference water index demonstrated that the water was lodged in the low-lying coastal area of Kerala based on [8].
Furthermore, the role of monsoonal depression over the Bay of Bengal (BoB), mid-tropospheric moisture transport, and the modeling of vorticity have been used to explain features of Kerala floods [9]. A recent study hinted at a possible increase in flooding events over the Kerala region in the future, based on climate projections and scenarios [10]. All of the studies, as mentioned above, were either limited to a smaller portion of the flood region or considered other aspects of the flood than we elucidate here. Additionally, the present study used high-resolution rainfall station datasets to explain rainfall over a larger area of the flood and considered other crucial atmospheric factors to explain KFE, in order to draw unique conclusions.
We will now revisit some of the well-known flood events of India, other than KFE, and their causes and details. The Mumbai flood (~900 mm/day), which occurred on 26 July 2005, is a widely known example of extreme rainfall which drew the attention of the Indian community and researchers. The eastward movement and intensification of the offshore trough is considered to be one of the main reasons for this flood [11]. Floods, followed by continuous heavy precipitation for days (1 or 2 days), remain the costliest natural disasters in India, such as the Uttarakhand flood (15 June 2013, ~400 mm/day), Jammu and Kashmir (J&K) flood (5 September 2014, ~200 mm/day), and Chennai flood (2 December 2015, ~350 mm/day) [12,13,14,15,16]. In the case of Uttarakhand’s flood, the moisture supply was the result of a combined contribution from nearby water bodies, the Arabian Sea, and the Bay of Bengal. A fast-moving LPS and Himalayan orographic effect played an essential role in this flood [17]. Extreme rainfall events in the orographic region may be attributed to cloud burst, e.g., the Leh flood (6 August 2010, ~150 mm/day) [18]. Some extreme rainfall events are the result of scale interactions between several events, e.g., a synoptic scale, mesoscale, large scale, and LPS [15]. In most flood events, LPS and it’s interactions with other local systems remain a crucial reason for the occurrence of floods. The KFE of 2018 attracted attention from the media, scientific community, and policymakers, because it was one of the worst floods of the century over Kerala [5]. Due to continuous rainfall over the Western Ghats, major dams in Kerala reached full capacity before the KFE [5]. Furthermore, it has been noted that during the active southwest monsoon season, heavy rainfall events (HREs) along the west coast of India cause flash floods; such floods are the most common natural disasters of the region [19].
To study HREs, over the west coast of India, during the monsoon season, a field experiment, namely ARMEX-I (Arabian Monsoon Experiment, Phase I), was performed by the Indian Climate Research Programme (ICRP), Govt. of India [20]. As part of the ARMEX-I (observational data that was collected from June to August in 2002), particular observations were collected to study the HREs associated with synoptic systems, such as offshore troughs, strong low-level jets, and low-pressure-systems [21,22,23,24,25]. Several modeling studies on HREs along the west coast, notably the Mumbai flood case, have been reported [22,26]. These studies suggest that mesoscale model techniques have commendable skills for simulating the HREs 48 h in advance. Around 80% of intense rainfall events along the west coast of India are associated with offshore troughs [12,19,20,27,28], strong cross-equatorial flow over the Arabian Sea [29], and the low-pressure system over the Arabian Sea near the Gujarat and Maharashtra coast [30]. Other well-known low-pressure systems that form over BoB and move inward across land along the monsoonal trough-lane are parts of the monsoonal system [31]. Among the many dynamic features of a monsoon, strong cross-equatorial flow in the lower troposphere, widely known as the low-level monsoon jet, plays a vital role in the Indian summer monsoon rainfall (ISMR), which occurs during June–September [32]. All extreme rainfall events are diverse in their initiation, spread, and impacts. In recent work, it has been speculated that a rise in the surface temperature and moisture over orographic regions favors flood events, due to an increase in convective available potential energy [33]. Many stations in west coast regions have exhibited a rise in temperature in the last 100 years [34].
Some of the valid questions that can be raised regarding KFE are as follows: Did intensification of the offshore trough, LPS over BoB, and mid-tropospheric dry air intrusion air from the Middle East region trigger extreme precipitation over the Kerala region? Did the release of water from dams add fuel to KFE? Furthermore, what were the favorable conditions for the serial clustering of convection along the west coast of India? Can the strength of the monsoonal kinetic energy, net-tropospheric moisture, and mean tropospheric temperature field across BoB, the Arabian Sea, and the Indian monsoon zone play any crucial role in the enhancement of the convection over Kerala? Is there a synergic role of the interaction of LPS, the offshore trough, and mid-tropospheric dry air intrusion from Middle East regions for KFE? Such probable issues associated with KFE are analyzed and discussed in this research. Furthermore, the present research work addresses the regional and dominant features of the synoptic conditions over the Indian subcontinent. As a whole, this study tried to fill the gap in the understanding of the interaction between monsoonal LPS, the offshore trough, and other regional features.

2. Data and Methodology

The daily rainfall dataset from the Global Precipitation Measurement (GPM) satellite, Indian Meteorological Society (IMD) rain gauge in-situ datasets, and the IMD + TRMM (Tropical Rainfall Measuring Mission) merge rainfall dataset were used in this study [35]. GPM is a constellation-based satellite mission specifically designed to provide a new generation of observations of rainfall and snowfall from space to improve our understanding of Earth’s water and energy cycle and has been in operation since 28 February 2014. These datasets provide near real-time precipitation at a spatial-temporal resolution of 25 × 25 km horizontal resolutions. Furthermore, the Indian Meteorological Society’s satellite products (esp. the water vapor channel) were used to study the synoptic features of KFE. These datasets were used for understanding the dynamic characteristics of the convective systems that caused severe rainfall along the west coast of Kerala state.
INSAT-3D images are an improved design of the Very High-Resolution Radiometer (VHRR-2) capable of generating images of the Earth in six wavelength bands. These images are available in visible, shortwave infrared, middle infrared, water vapor, and two bands in thermal infrared regions. They offer an improved 1-km resolution in the visible band for the monitoring of mesoscale phenomena and severe local storms [36]. For KFE, we used water vapor and thermal infrared bands to understand the synoptic features and convection. To address the issues involving the dynamics of HREs during KFE, we used the European Centre for Medium-Range Weather Forecast (ECMWF) ERA-Interim reanalysis of the global atmosphere covering the data-rich period since 1979 (https://apps.ecmwf.int). The ECMWF reanalysis (ERA-Interim) dataset [37], along with ground-based and satellite observations, were used in this study. The ERA-Interim reanalysis uses a state-of-the-art model with four-variational data assimilation (4DVAR) scheme. The datasets have high spatial resolutions and are easy to access for use in research.
Additionally, these ERA-Interim meteorological variables are available at a T255 resolution, but we optimally interpolated all required variables at a 25 × 25 km horizontal resolution. The data on runoff was obtained from ECMWF reanalysis. Data for the flooded water for Kerala’s dam were acquired from http://tamcnhp.com/wris/#/waterData.

3. Overview of the Kerala Flood Event

The daily accumulated rainfall, 850 mb wind anomalies, and track of the monsoon depression through 13–18 August 2018 over the Indian region are portrayed in Figure 1a. The path of low pressure is ~4° south of the mean position of LPS tracks (the black dashed line is the mean position of monsoon depressions) and lasted for six days. As usual, most of the heavy rainfall is located in the southern part of the LPS track. A low-pressure system embedded in the mean monsoon flow brings copious rainfall to its southwest sector. Over BoB, LPS lingered for a while; thus, heavy rainfall is evident over that area. Furthermore, it will be interesting to investigate the rainfall over west-coastal regions and Kerala, as LPS advances westward. It has been observed that when LPS over BoB and the offshore trough near the Gujrat region are active, then the Indian landmass receives plenty of rainfall. Some of the prominent features of rainfall are visible over central BoB; these are extended inland along the track of monsoonal depression, central India, and over the western coast (Figure 1a). The authors focus on the spatial spread of rainfall over Kerala and adjoining states through 13–17 August, 2018 (Figure 1b). The maximum accumulation of rainfall (>350 mm) was recorded over northern Kerala and southern coastal regions of Karnataka. An adjacent state, Tamilnadu, being under the rain-shadow influence (receives low rainfall due to the subsidence of cold and dry air), received less rainfall. A central water commission report on the Kerala flood also recorded rainfall of 214 to 398 mm over various cities of the Kerala districts [38]. Notably, on a single day (15 August), the recorded rainfall was more than the climatological precipitation of August. The daily area-averaged rainfall over the Kerala region (8° N–13° N; 74° E–78° E) is depicted in Figure 1c, which shows moderate to heavy rainfall during 8–19 August 2018, while heavy rainfall on 15 August and 16 August only. Rain-gauge rainfall (from IMD) for some of the flood-affected cities of Kerala shows an abundant amount of rainfall (>300 mm) on 15–16 August (Figure 1d). A previous study documented that, during active spells, the western coast, between 14° N–16° N and 18° N–20° N, is the most favorable location of intense rainfall due to deeper cloud systems [39]. It has been noted that the heavy rainfalls over Kerala state and the adjoining west coast of India are associated with a quasi-stationary trough, in which a cyclonic vortex is sometimes embedded [27].

4. Discussion of Results

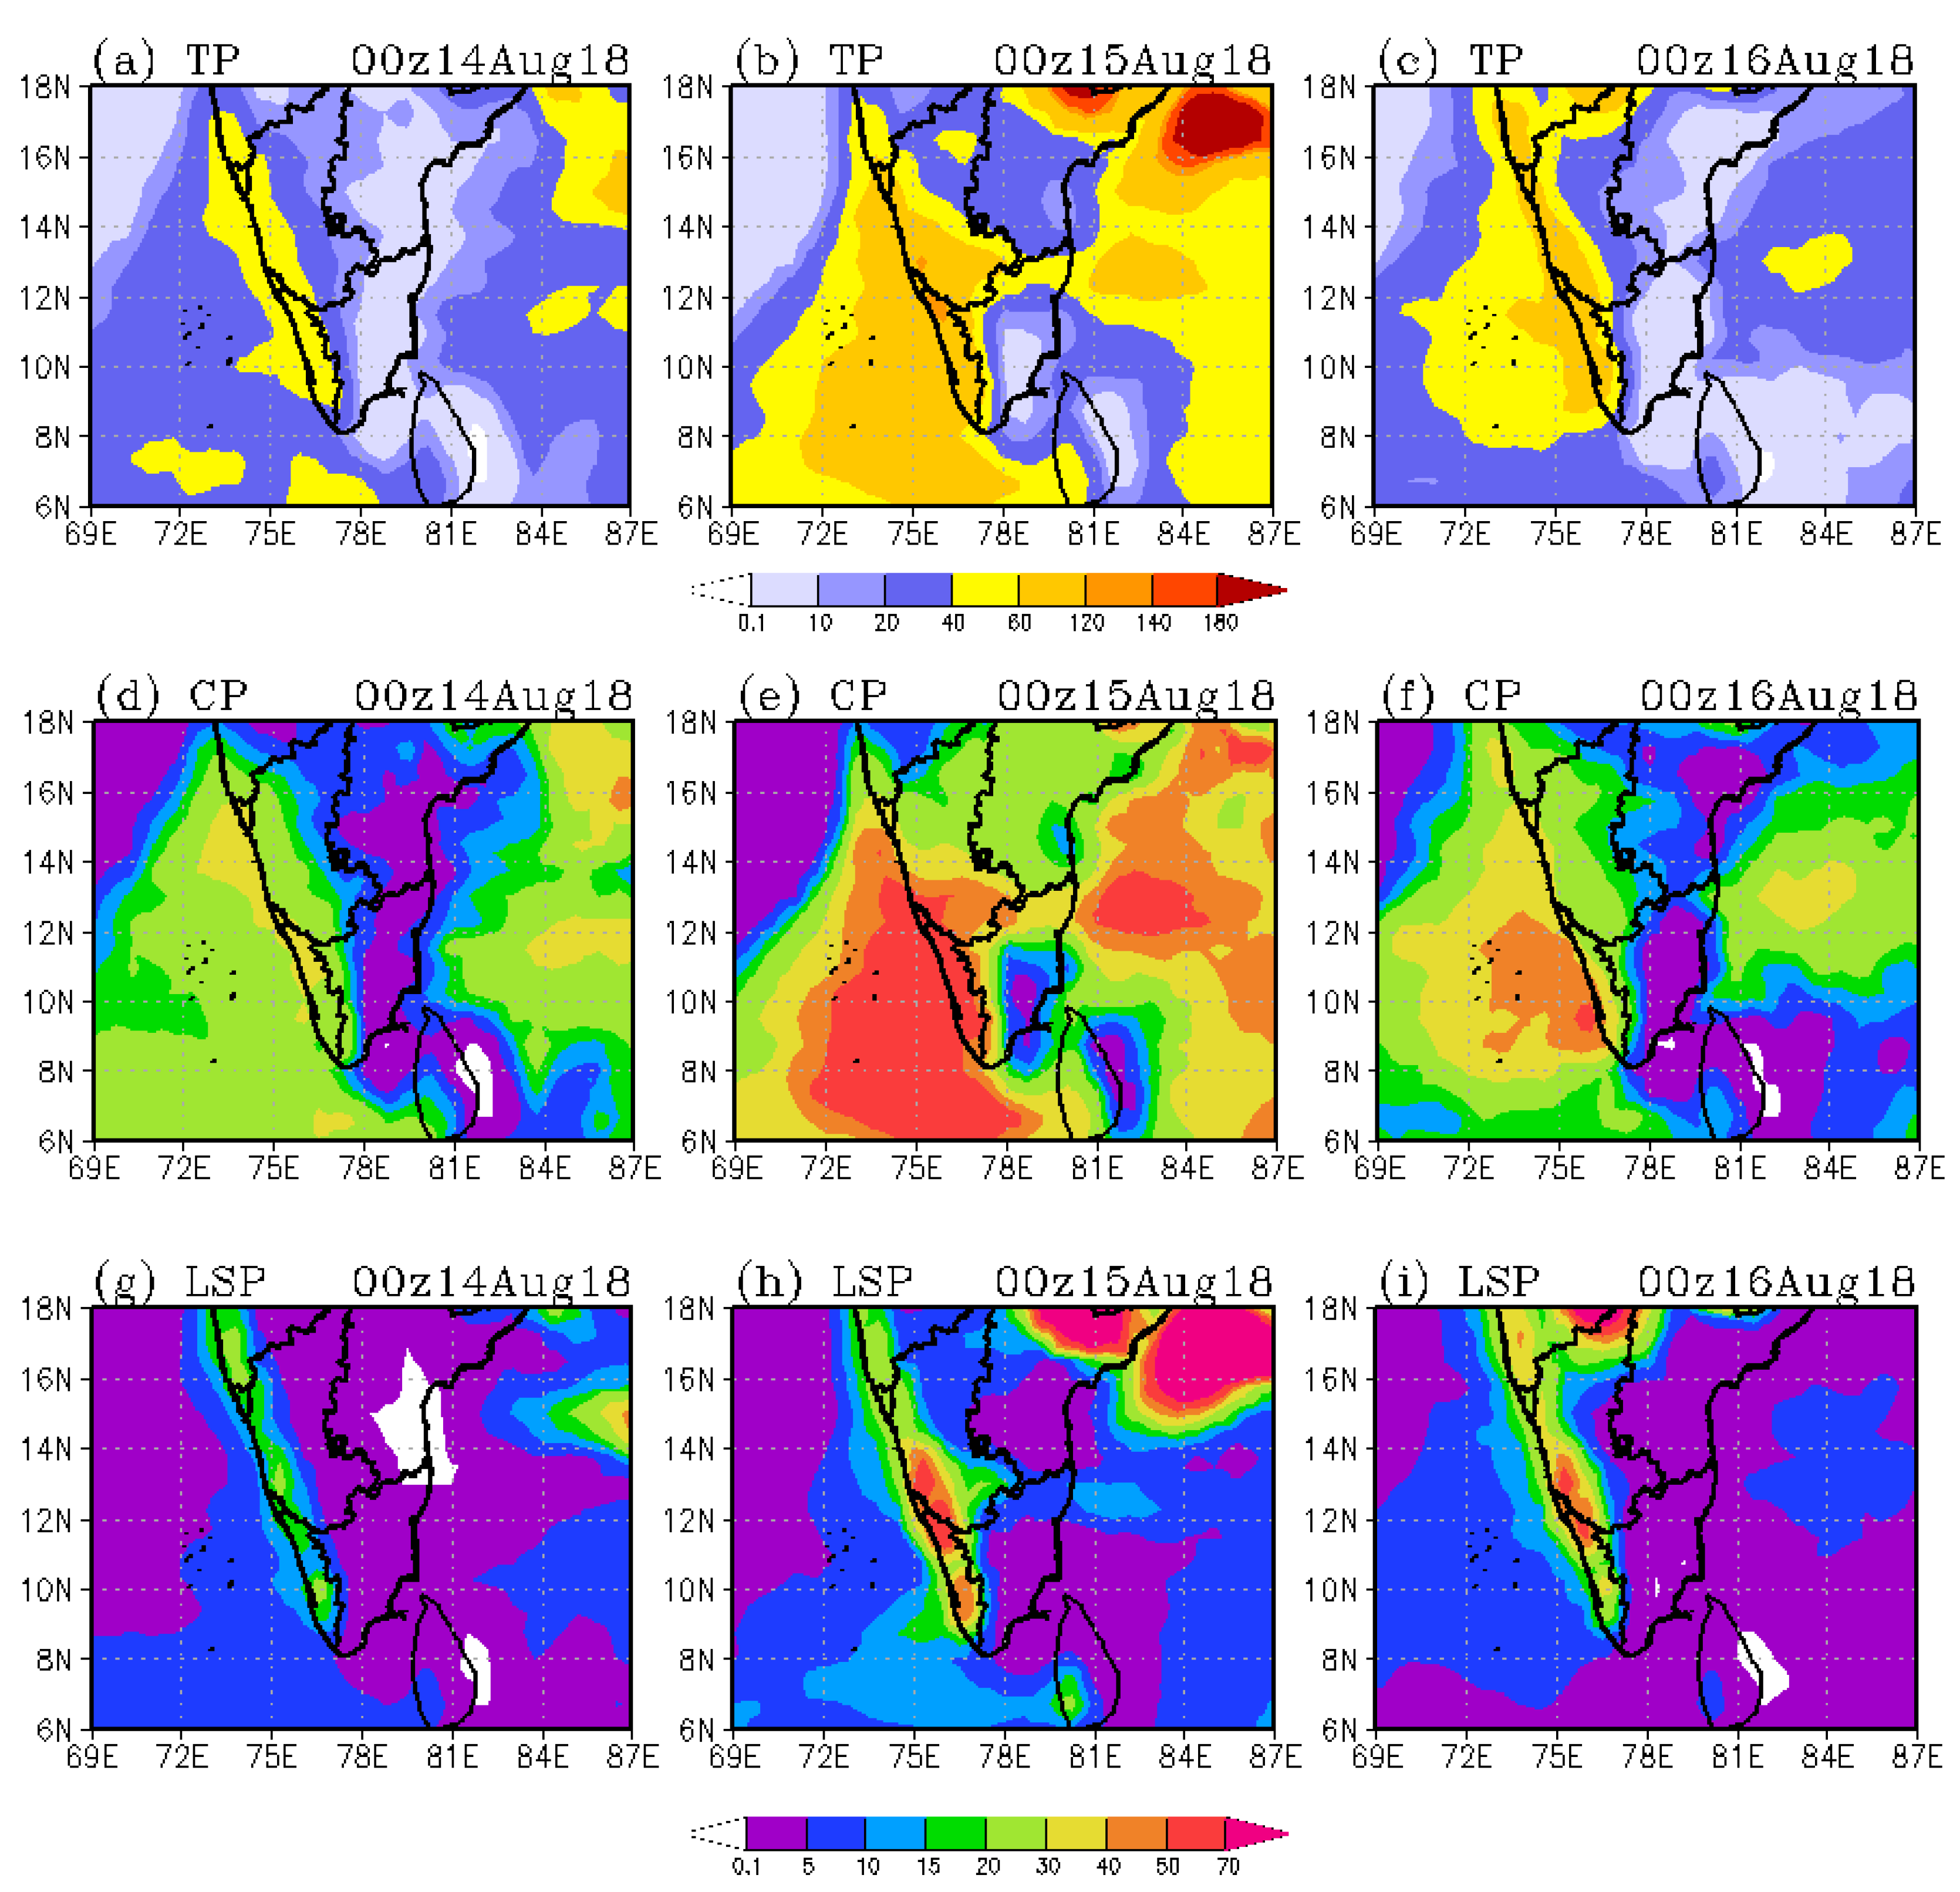
4.1. Heavy Rainfall Detection Using Satellite Images

The INSAT-3D cloud imagery of the water vapor channel from 14 to 17 August 2018 at 0300 UTC is shown in Figure S1a–d (see Supplementary Materials). The INSAT 3-D satellite imagery exhibits the distribution of dense clouds over BoB along the monsoon trough. However, deep clouds along the west coast of India (around 8–20° N) display convective activity associated with LPS and active monsoon conditions over the southwest monsoon region (Figure 1a). On 12 August 2018, at 0300 UTC, the offshore vortex was noticed along (in a red circular box in Figure S1) the west coast from Kerala to Konkan. During the next 24 h, the offshore trough weakened, which led the convection to remain isolated on 13 August 2018 at 0300 UTC (Figure S1). On the other hand, well-organized dense cloud puffs can be observed over the central BoB on 14 August and 15 August 2018 at 0300 UTC. Furthermore, clouds appeared over Andhra Pradesh, the Tamilnadu coast, and the adjoining region (Figure S1c,d). On these two days, scattered but intense convection was observed over the east and central part of BoB, which can be attributed to the formation of well-organized monsoonal LPS, reported by IMD, which is a prominent feature of a vigorous monsoon over BoB.

4.2. Large and Synoptic-Scale Systems Concomitant with the Kerala Flood

Low-Level Jet (LLJ), Low-Pressure-System, Offshore Trough, and Blocking High
During the summer monsoon LPS over BoB (at ~996 mb), the offshore trough (green dashed line), and dry air intrusion from the middle-East (at 600 mb) are as displayed in Figure 2a–e. A well-organized feature of ISMR, the offshore trough, is visible in the MSLP from Kerala to the Gujrat region (Figure 2, see along the west coast of India). Besides, the intrusion of dry air from the Middle East is well-mixed at 600 mb into the LPS over the Indian region. A previous study showed that in such situations, dry air intrusion can introduce non-uniform saturated instability to produce heavy rainfall [40]. Along with LPS and the offshore trough, the mixing of cold-dry air from the Middle East and warm-moist air from as it is one of the critical features in the formation of non-uniformly saturated air and static instability that can be exploited to lead to heavy rainfall. This kind of instability is not a very common element in the generation of flood events. The interaction between monsoon depression, the offshore trough, and dry air intrusion is responsible for the heavy rainfall over Kerala state (Figure 2).
The daily mean wind flow pattern at 850 to 300 hPa levels from 13 to 17 August 2018 is displayed in Figure 3a–t. At the 850 hPa level, wind flow characterized by strong south-westerlies (strong wind speed within a range of 15–20 ms−1) along the west coast of India, known as a low-level jet [41], can be seen over AS. The wind speed of the core of the low-level jet is ~20 ms−1 from 5° N to 15° N over AS and the west coast of India. A strong dry-cold, north-westerly wind flow pattern from Middle East countries merged over the Indian landmass, with highly moist-warm, south-westerly wind causing unstable atmospheric conditions between the longitude of 50° E–70° E (Figure 2 and Figure 3 and Figure S2). The combination of two contrasting air masses in a boundary layer flow produces heavy rainfall over the western coast, termed the coastal phase [42]. The anti-cyclonic circulation over the Middle East region and Tibet region at 300 mb served as the anomalous blocking high, limiting LPS to the south of the mean position (black dashed line in Figure 1a). On many of the occasions, it is perceived that the blocking high produces a dry spell of the monsoon, droughts, heatwaves, and floods in the pre-monsoon and monsoon season. A previous study advocated that the moist and cold air-mass advected from the maritime region could be referred to as LLJ, and another dry-cold air-mass from the Middle East desert could be referred to as continental tropical [43]. Both air-masses were observed from 850 to 500 hPa levels and the system of different air masses merged into LPS over the eastern coast of India (Figure 3a–d). For the middle to upper troposphere, two high-pressure systems are prominent: one over the Middle Eastern area (30° N–35° N and 50° E–60° E) and Tibet region (Figure 3d), and the other acting as the blocking high and forcing monsoon depression to be limited to the south of the mean position of monsoonal depressions.
As an analogy, KFE carries a silent feature of an active monsoon viz. a high speed of LLJ, 18 ms−1 (Figure 3i), and relative vorticity of 100 × 10−6·s−1 (Figure S3a,b), which are way higher than the corresponding typical values recorded during the monsoon season [30]. The west coast rainfall is associated with the offshore trough, the interaction between TEJ and STWJ, and LPS embedded with mesoscale bands, which are linked to the movement of a disturbance from the BoB to Indian landmass.

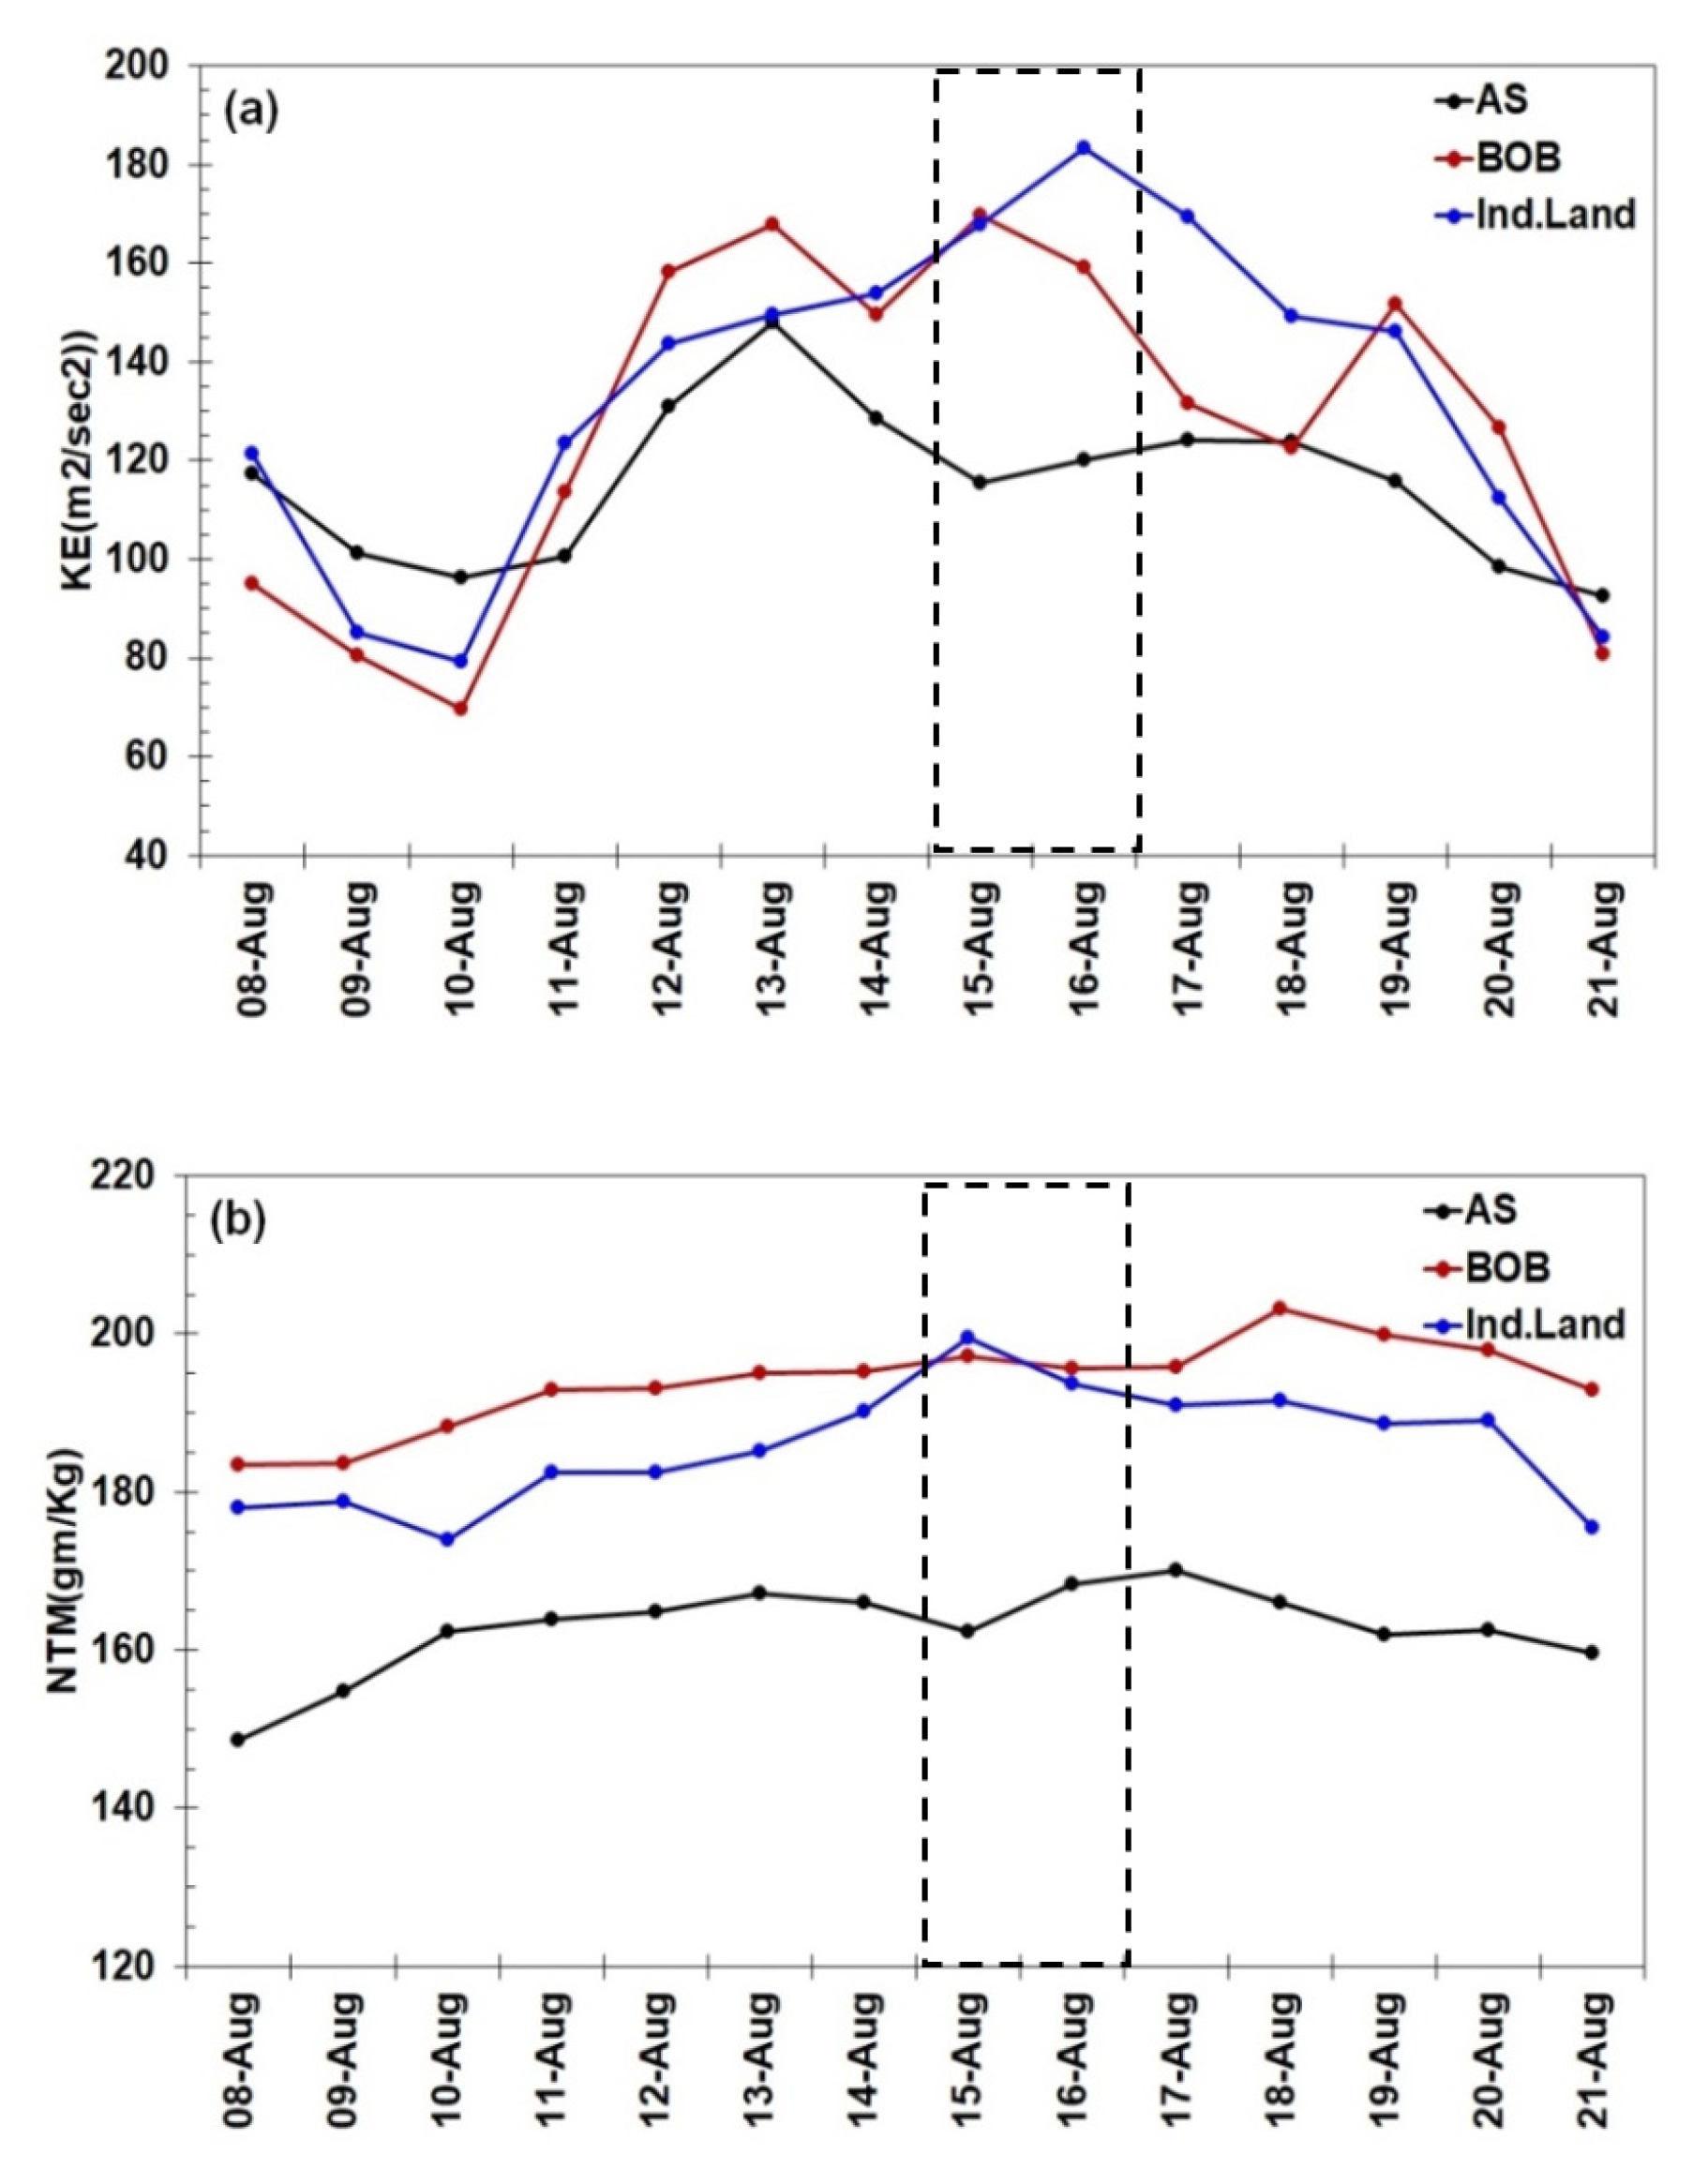
4.3. Role of Kinetic Energy During the Kerala Flood

The diurnal variability of kinetic energy (KE at 850 hPa), net tropospheric moisture (from 1000 to 300 hPa), and mean tropospheric temperature (from 1000 to 100hPa) were averaged for the active period of 8–21 August 2018. The average was obtained for over the Arabian Sea (50° E–72.5° E; 5° N–15° N), Bay of Bengal (0–19.5° N, 78° E–96° E), and Indian landmass (72.5° E–82.5° E; 5° N–15° N) (Figure 4a–c), respectively. We followed the procedure presented in [44,45] to compute the kinetic energy, net tropospheric moisture, and mean tropospheric temperature. Figure 4a depicts the daily variations of kinetic energy over AS, BoB, and the Indian landmass at 0000 UTC on 8–21 August 2018. It shows a significant difference in kinetic energy over the Kerala flood region and other nearby regions. It is suggested that the threshold value of kinetic energy (at 850 hPa) during the onset period was about ~40 m2s−2 over the Indian monsoon domain [45]; during KFE, the kinetic energy was always >80 m2s−2. Additionally, the kinetic energy was quite strong over the BoB, with a peak of ~150 m2s−2, as shown in Figure 4a. The magnitude of kinetic energy and net mean temperature during the Kerala flood were higher than their corresponding climatological/average values (Figure S4) for the same days and over the same region. It is evident from the display that the kinetic energy over the entire Indian monsoon region (AS, BoB, and Indian landmass) varied from 65 to 160 m2s−2, which indicates highly active conditions of the Indian monsoon. The mean tropospheric temperature remained lower than its climatology, which is due to the excess rainfall over AS, BoB, and the Indian landmass (Figure 4c). Two apparent indicators of the extreme rainfall event (here, KFE), viz. the net tropospheric moisture and kinetic energy, were significantly superior to their corresponding climatological values (Figure 4b,c). In the case of KFE, the transport of moisture was distinct from the nearby Arabian Sea, while the offshore trough was responsible for the convergence of the flux of moisture.

5. Precipitation and Tropospheric Features

An accurate estimate of the precipitation intensity and accumulation is essential to understanding the cycle of global water fluxes and the energy balance of Earth’s system [46]. A rainfall of >150 mm/day is defined as extreme rainfall over central India [47,48]. However, in the monsoon period, the amount and duration of extreme rainfall, which can produce floods, differs from one geographical location to another. In the case of KFE, the total daily rainfall was more than 200 mm/day, which occurred over the west coast of India (Figure 5a–i). Additionally, in (Figure 5a–i), the rainfall is continuous, stationary, and intense over Kerala state and adjacent regions of India. At the same time, over other areas (e.g., BoB), the rainfall remains nonstationary. On 14 August, moderate to heavy rainfall occurred over coastal regions of Karnataka state and continued over Kerala state for the next two days (Figure 5a). The next day, very heavy rainfall was recorded over both Karnataka and Kerala states (Figure 5b), but the core of the intense rainfall centered in the middle of Kerala state (Figure 1b and Figure 5b). On 16 August, the rainfall was reduced over the Kerala state, as represented in Figure 5c. Figure 5a–c shows the clustering of total rainfall (sum of large-scale precipitation and convective precipitation) during KFE, closely agreeing with IMD + TRMM merge analysis (Figure 5a–c). Before and on the day of the flood, most of the rainfall was due to convective precipitation (Figure 5d,e) rather than large-scale stratiform rainfall (Figure 5g,h). On the next day, 16 August, rainfall from CP and LSP reduced in intensity and space (Figure 5f,i). Over the west coast, rainfall is associated with an offshore trough produced by shallow convective clouds (cloud top ~6 km). Figure 5g–i shows large-scale rainfall along the west coast and east coast that is attributed to offshore troughs. However, on 17 August (Figure is not shown), the quantity of rainfall reduced drastically, because the intensity of the LPS and offshore trough was diminished. The combination of synoptic systems, such as monsoon depression, strong LLJ, offshore troughs along the west coast, and the low-pressure system over BoB caused convective rainfall over the west coast. However, the large-scale precipitation represents the regular monsoonal rainfall of Western Ghats due to LLJ and offshore troughs.
Finally, we examined some of the valued hydrological variables over the KFE region. The total runoff, temperature at 2 m, and evaporation are displayed in Figure 6a–i. One of the recognizable hydrological impacts of the flood is runoff, which reached the maximum over the Kerala region, especially on 15 and 16 August (Figure 6b,c). On the next day of KFE, runoff increased over a large part of the land surface. Generally, temperature and evaporation are temporarily lowered over locations of moderate to heavy rainfall (Figure 6d–f,g–i). A low value of 2 m shows the areas of Western Ghats with a higher peak and maximum rainfall spots. However, a reduction of temperature and evaporation due to the occurrence of rainfall can be seen, whose maxima do not match the peaks of rainfall. The magnitude of temperature and evaporation shows a reduction in most of the rainfall episodes.

6. Vertical Cross-Sections Over the Flood Event and LPS

Meteorological variables related to heavy rainfall have a relatively large magnitude and penetrate deep in the troposphere. The cross-sections (longitudinal and pressure level) at the location of KFE and LPS of the relative humidity, abnormal temperature, and wind flow are shown in Figure 7a–f. The center of LPS significantly demonstrates strong LLJ at the lower troposphere during the intrusion of colder and drier air in the middle troposphere. The dry air imposition in the middle troposphere is seen on all days over AS and BoB. At a 300 mb level, a divergence of wind is observed on 15 August; however, at a lower level, LLJ dominates over convergence.
Additionally, lower-level westerly wind and an accumulation of moisture with vigorous vertical motion are evident from 14 to 16 August (Figure 7d–f). The values of the temperature anomaly at the center of the monsoon depression are significantly higher (~1.0 °K) than those of the environment (surroundings), whereas significant cooling is noticed in the upper troposphere. These features closely agree with the study [44] on the formation of LPS during flood events. The location of KFE at the lower level accumulated plenty of moisture transported from the AS (Figure 7a–c).
The time-evolution of the vertical variation of the specific humidity over KFE displays an enhancement of the moisture content from the surface to the 500 hPa level (Figure 8a). The accumulation of specific humidity reached up to 350 mb over the Kerala region, while over BoB, it was up to 600 mb during the KFE. Notably, the middle troposphere was wetter than the boundary layer (Figure 8a), with vigorous upward flow depicting heavy rainfall from 14 to 16 August compared to BoB. Concomitantly, on 15 August 2018, there was a substantial build-up of moisture in the lower troposphere that conforms to the accumulation of moisture associated with upward motion (Figure 8a). The regions of vigorous convection show the strong vertical velocity on the order of 5 and 10 m/s over BoB and KFE, respectively.
In contrast, the order of magnitude of specific humidity is almost constant, but a little extended in the vertical direction. These numbers are very typical and sufficient for the initiation of active rainfall events. Furthermore, such moisture build-up in the atmospheric column may support flood events on a local scale.
A spatial pattern and vertical cross-section of the total column water vapor (kg·m−2) and cloud ice water content (mg/kg) are displayed in Figure 9. These variables reveal the kind of cloud that microphysics carry during KFE and are displayed spatially and vertically. The cloud liquid water content and cloud ice water content are evident along the west coast of India, but not over the KFE location (Figure 9a–c). This excludes the possibility of any big system being responsible for the KFE. The KFE seems to have been influenced regionally and locally by low-pressure systems, which favored torrential downpour. The figure indicates that the maximum values of moisture layers are indeed overlapping over the locations of the offshore trough and monsoon depression along the west coast of India and east coast of BoB. The intensity of the offshore trough does not vary much (Figure S5a), but its small deviation when moving inland can produce heavy rainfall. The total perceptible water content did surge a little during the KFE (Figure S5b).

7. Other Details of the Extreme Flood Event

There are many other issues (hydrological, social, economic, and environmental) that made the KFE the worst flood of the century and left footprints on the community in the short and long term. There were two episodes of heavy rainfall: one through 8–9 August and another that included very heavy rainfall through 15–17 August. Therefore, it appeared that most of the Kerala reservoirs were saturated and reached their capacity of the Full Reservoir Level (FRL) before KFE. A CWC report (Central Water Commission, India) indicates that the major dams of Kerala were filled with water ~95% of their storage capacity. Gates of about 35 dams were suddenly opened (without warming) during KFE due to a massive inflow of water from the first week of August rainfall, specifically from severe rainfall on 15–16 August 2018. The CWC (Central Water Commission) report adds that the dams did not help in mitigating the flood; however, dams are not to be blamed for KFE dams being at their full capacity before the KFE. In such a case, dams have to release excess water or they may collapse [7].
Dams, reservoirs, and wetlands are, in general, created for the generation of electricity, flood control, and maintaining a water supply. However, heavy rainfall for an extended period and the release of excess water from overflowing dams may be answerable to some extent [5,6]. The path of rivers, location of four dams, and orography of Kerala are shown in Figure 10. Idukki, Periyar, and Kakki represent the center of excess rainfall. Kakki is the major reservoir in the Pamba sub-basin. The collected water in the four major and well-known dams (Kakki, Periyar, Idukki, and Malampuzha) during the Kerala event in 2018 surpassed the average value of accumulated water from 2009–2018 and the previous year (2017) (Figure 11a–d). The maximum water discharged from Idukki and Idamalayar dams into Pariyar River was 8800 cumes on 16 August 2019, and the maximum amount of water attained in the river was 12.40 m high in comparison to the last flood on 27 July 1974, which had a value of 11.11 m high.
Before and during the time of KFE, the water collected in several dams reached FRL. In terms of the Idukki dam, about 345 million cubic meters (mcm, for spill) of water was released in 3 days (15–17 August 2018) [38]. The water runoff in Figure 5j–l indicates a jump on 15 August and 16 August. This runoff water due to heavy precipitation shows the development of a flood due to the filling of rivers, reservoirs, and dams. Idukki dam and Mullaperiya dam are located across the Periyar River. There was a release of water into Periyar and Pamba rivers from their associated dams; thus, the villages and lives in their catchment area were affected the most (Figure 11) [38]. Flooding execrated due to the release of water from dams can be attributed to the underestimation of water management in the KFE case. A NASA report on the Kerala flood and this study demonstrate the role of water released from the dams, as well as water from heavy precipitation, resulted in it becoming the worst flood of the century in Kerala [7].
Apart from the heavy precipitation over Kerala, the flood was exacerbated by the mismanagement of water released from dams, landslides, and stormwater. Another issue left behind by the KFE was that the course of rivers was altered, due to the erosion of soil and storm surge. Most of the dams of Kerala are dedicated to hydro-electric power generation, and the rest are used to regulate irrigation practices. Therefore, other aspects of Kerala dams and reservoirs, e.g., flood control and water availability, are debatable. The old and poor management practices of the dams in terms of floodwater management may also have contributed. Poor dam and reservoir management may have aggravated the flood. However, even if the authority of dams had released the total water collected before KFE, the dams still would not have mitigated this flood [7], because unexpected rainfall distributed a lot of water over the region.

8. Concluding Remarks and Discussion

Continuous rainfall of more than a week occurred during 9–18 August, 2018, over Kerala, including a heavy rainfall event from 15 to 16 August. The KEF did not manifest any single prominent synoptic feature which one can rely upon. The interactions between the quasi-stationary offshore trough and deviated LPS embedded in the large-scale flow and mid-tropospheric cold-dry air triggered the KFE for almost two days. Based on the diagnostics of MSLP, the winds from 850 to 300 hPa, kinetic energy, net tropospheric moisture, and mean tropospheric temperature can be employed to paint a realistic picture of Kerala’s extreme rainfall event. The results are summarized in the following points:
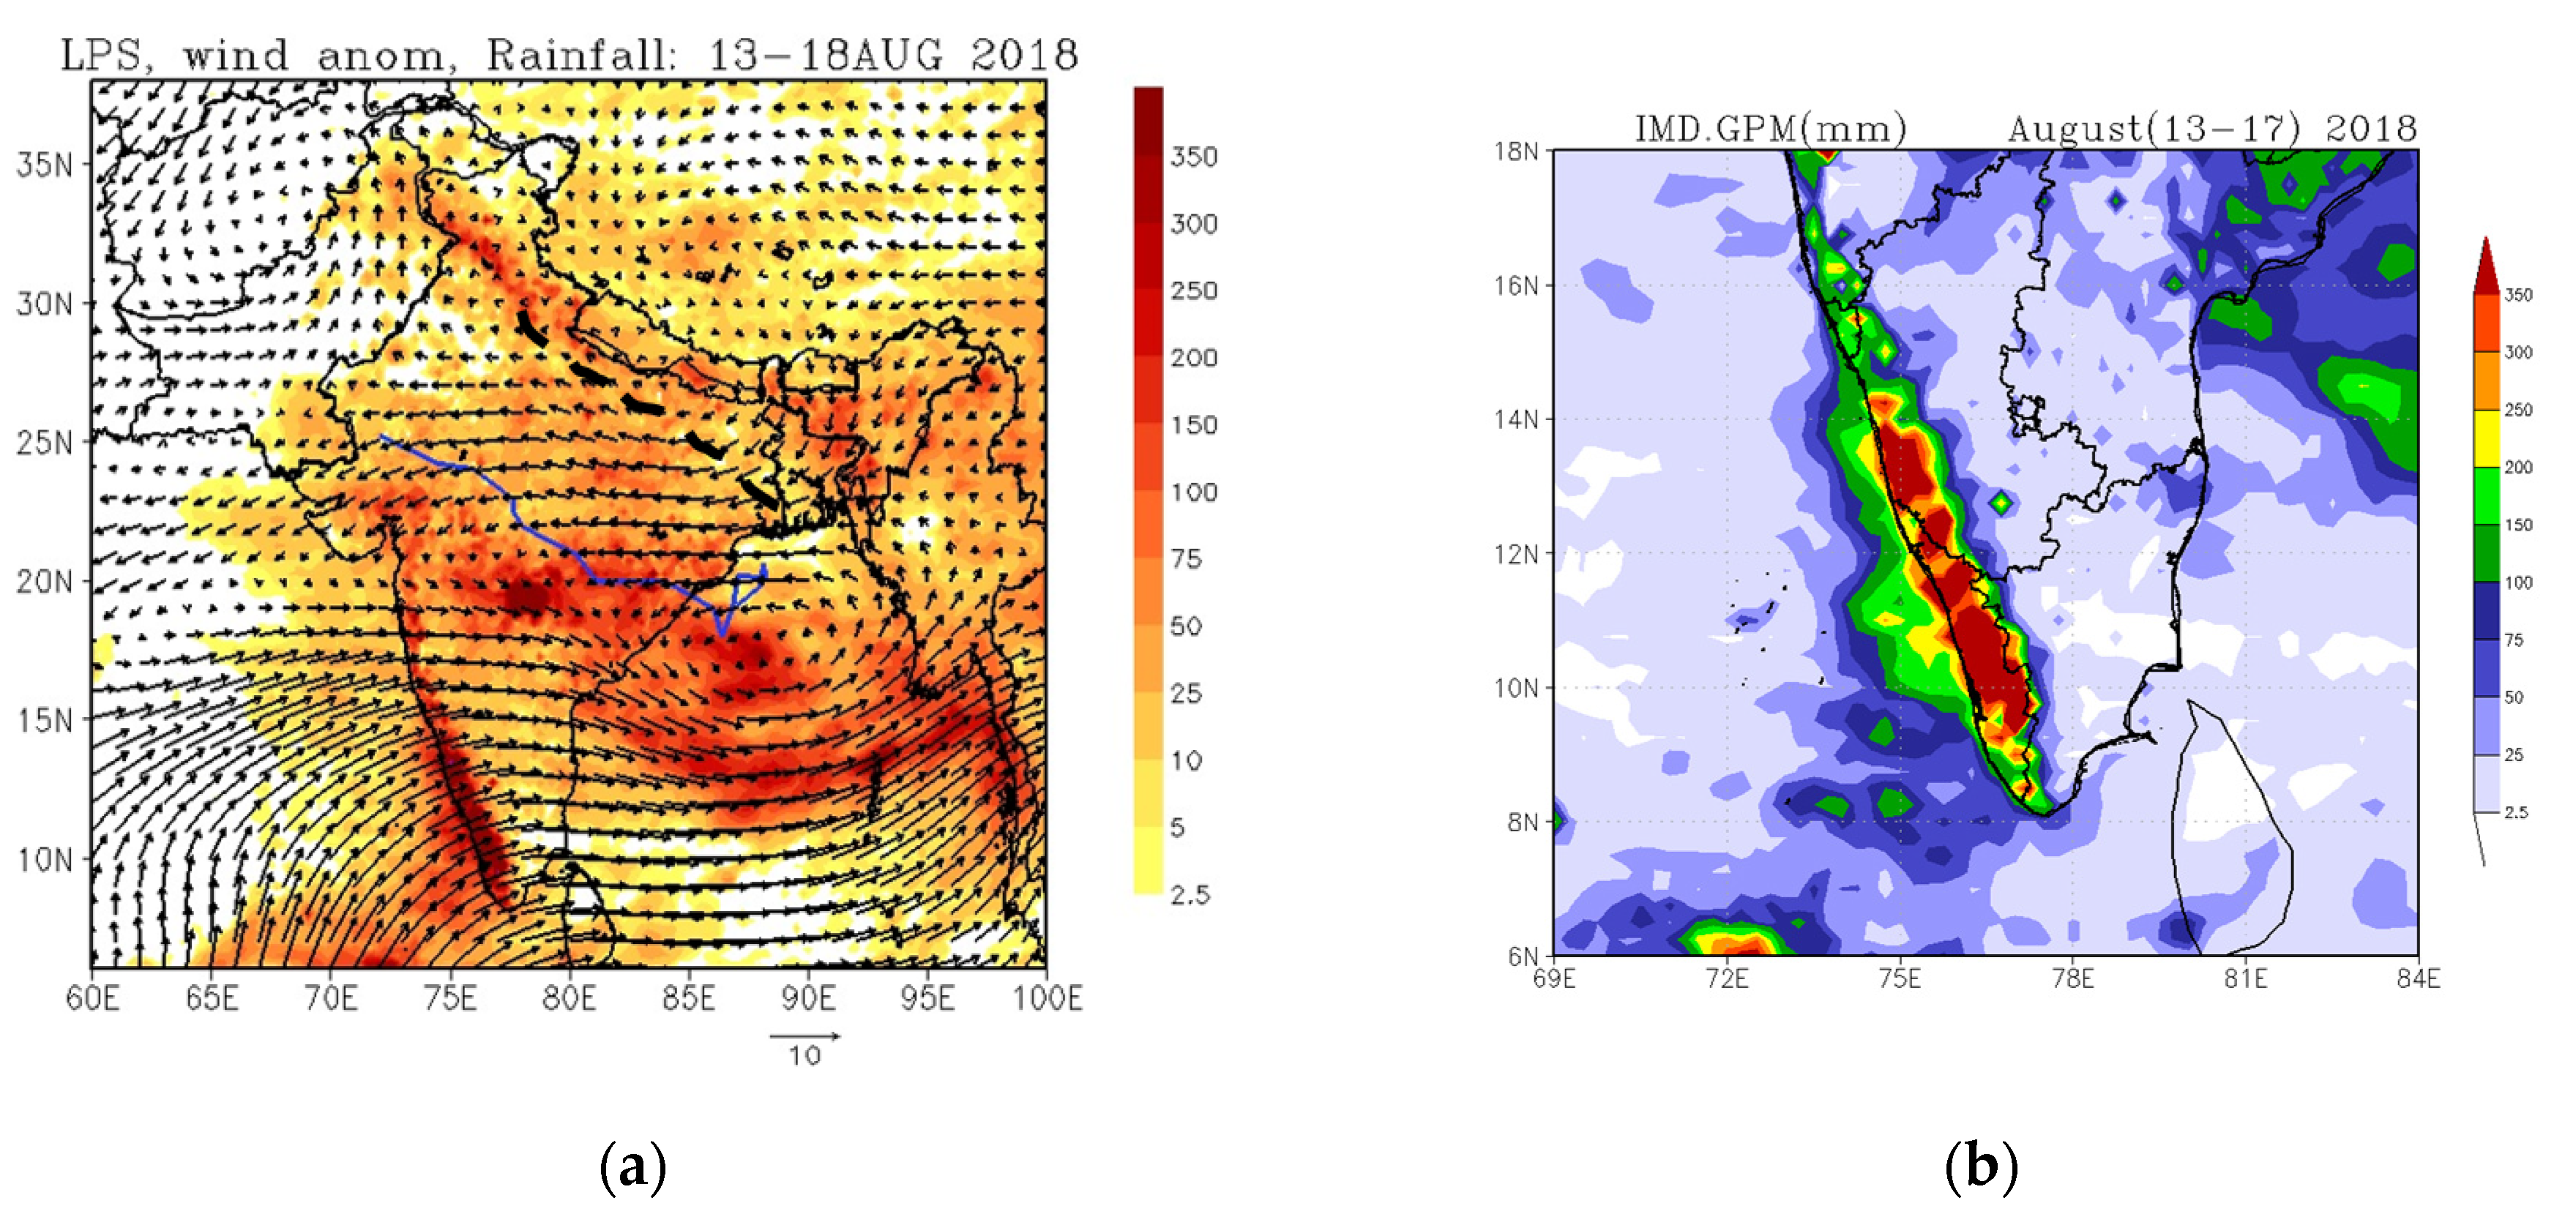
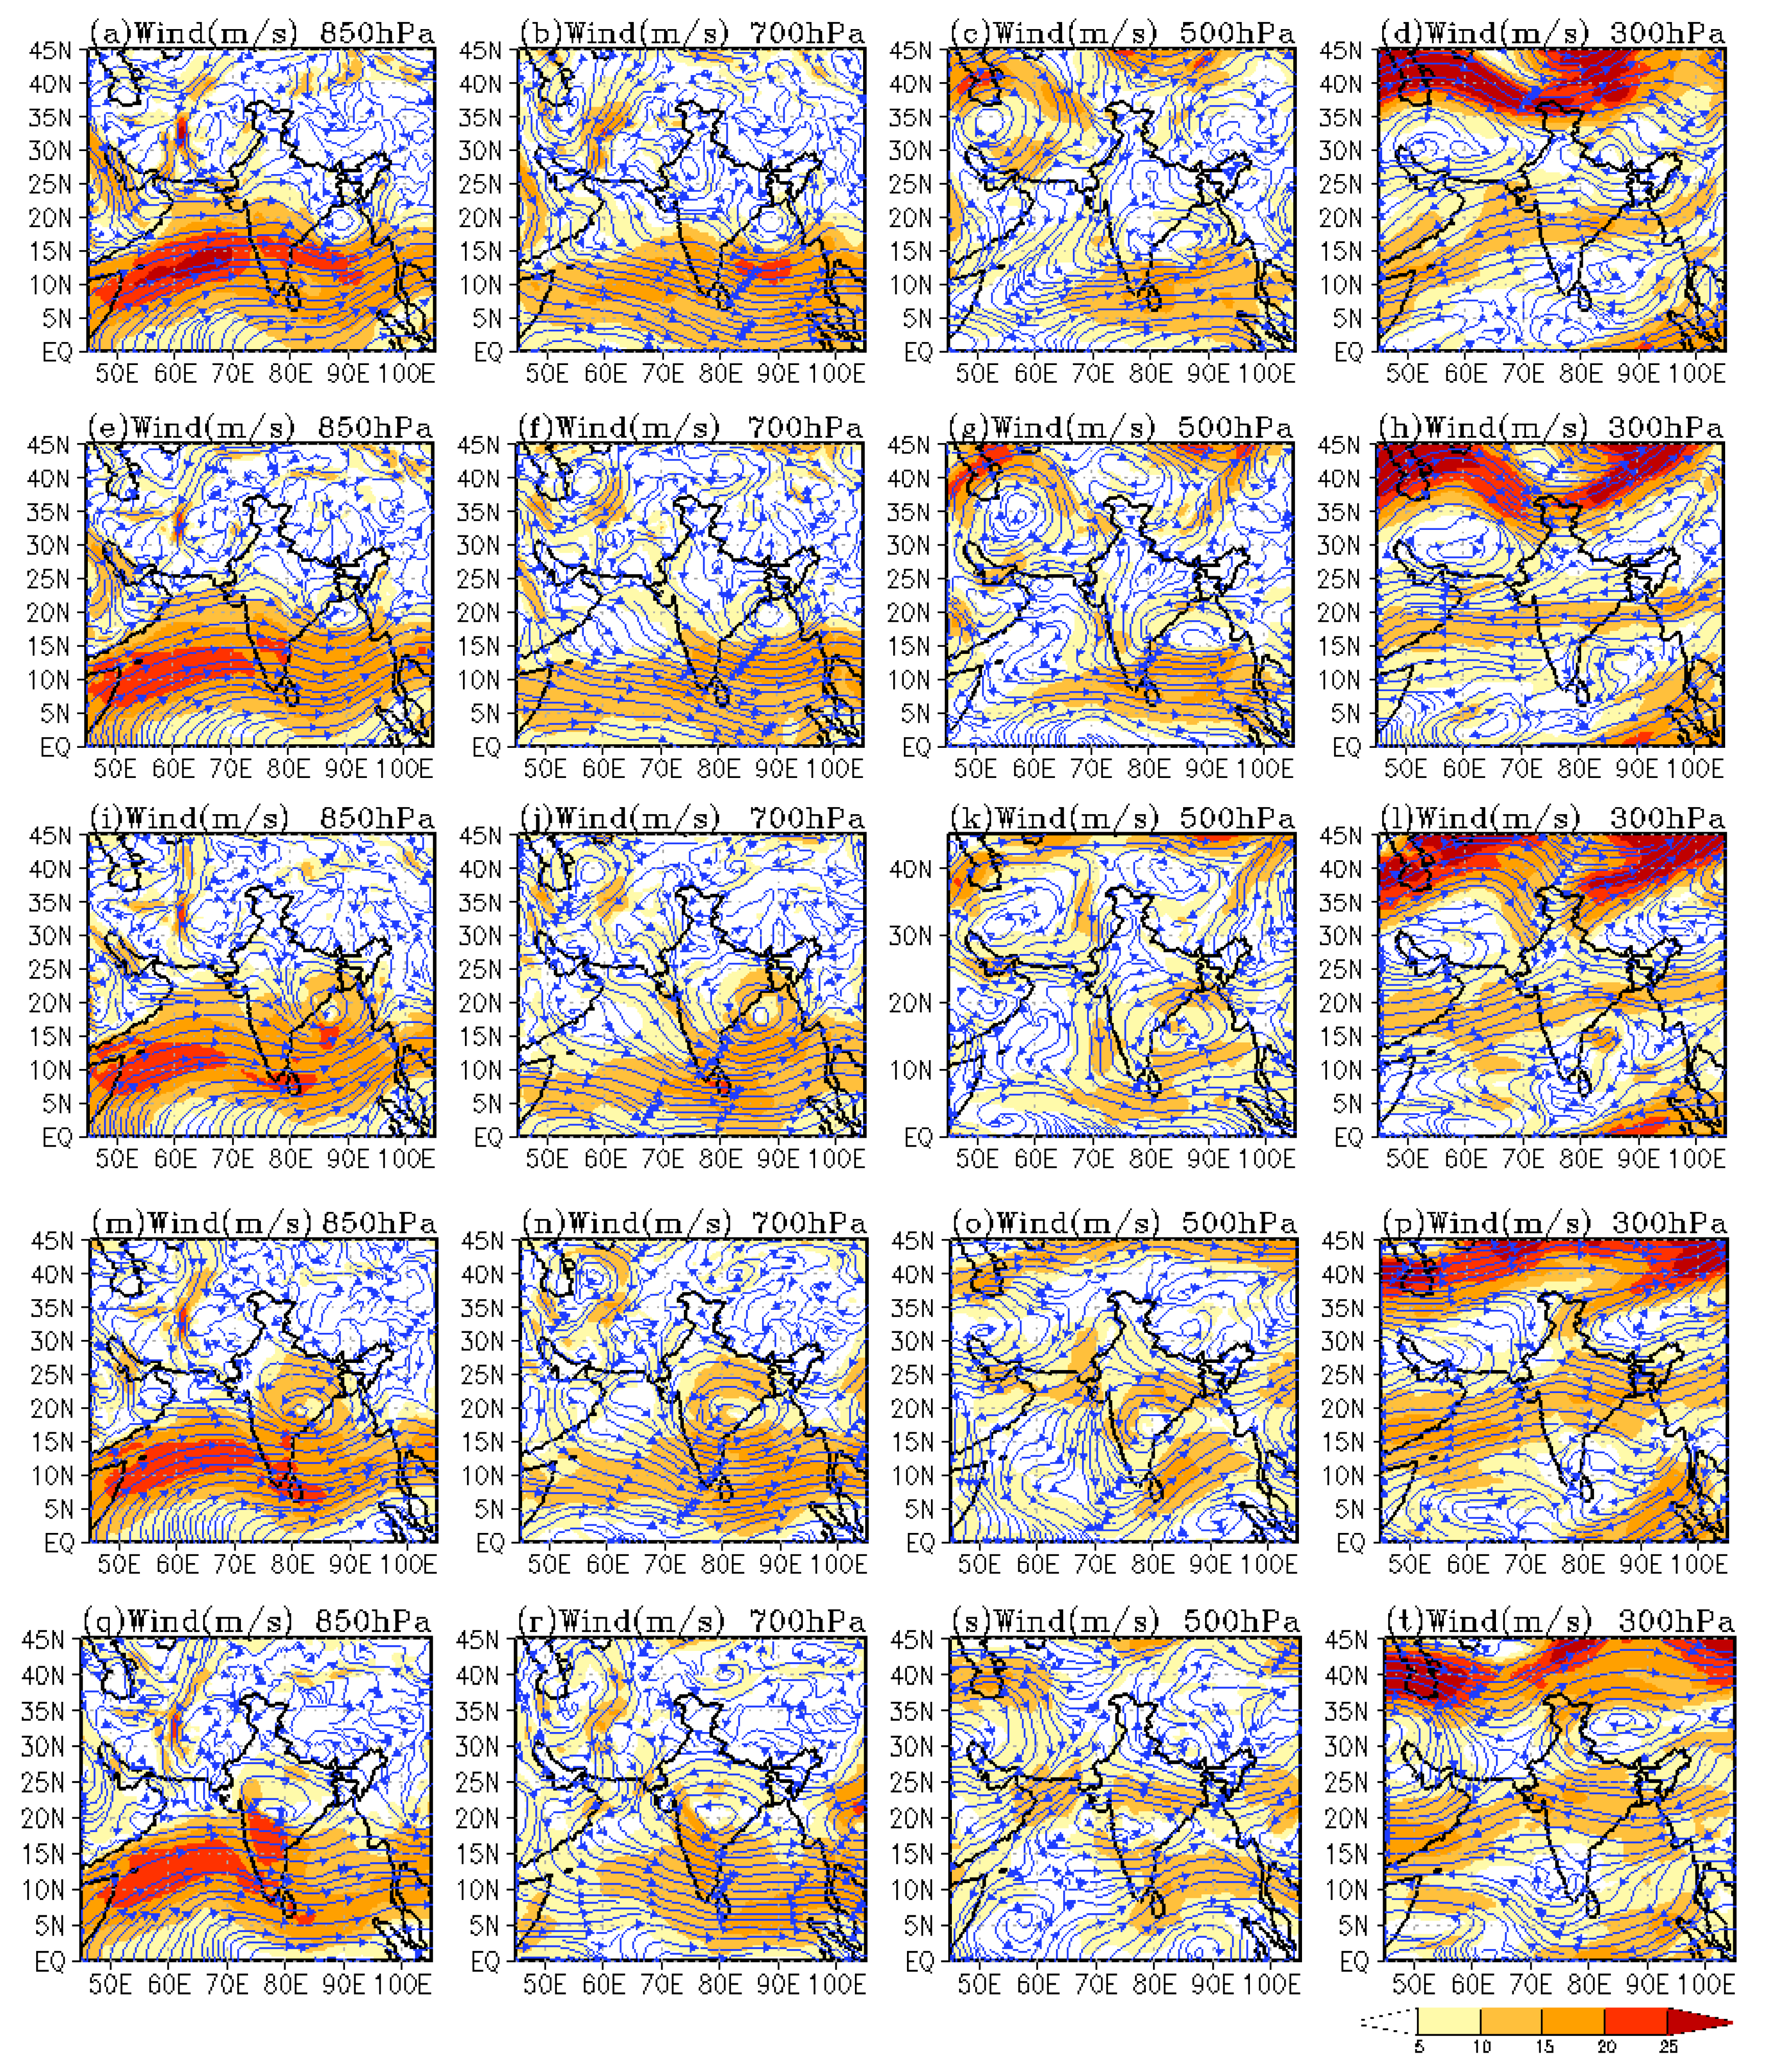
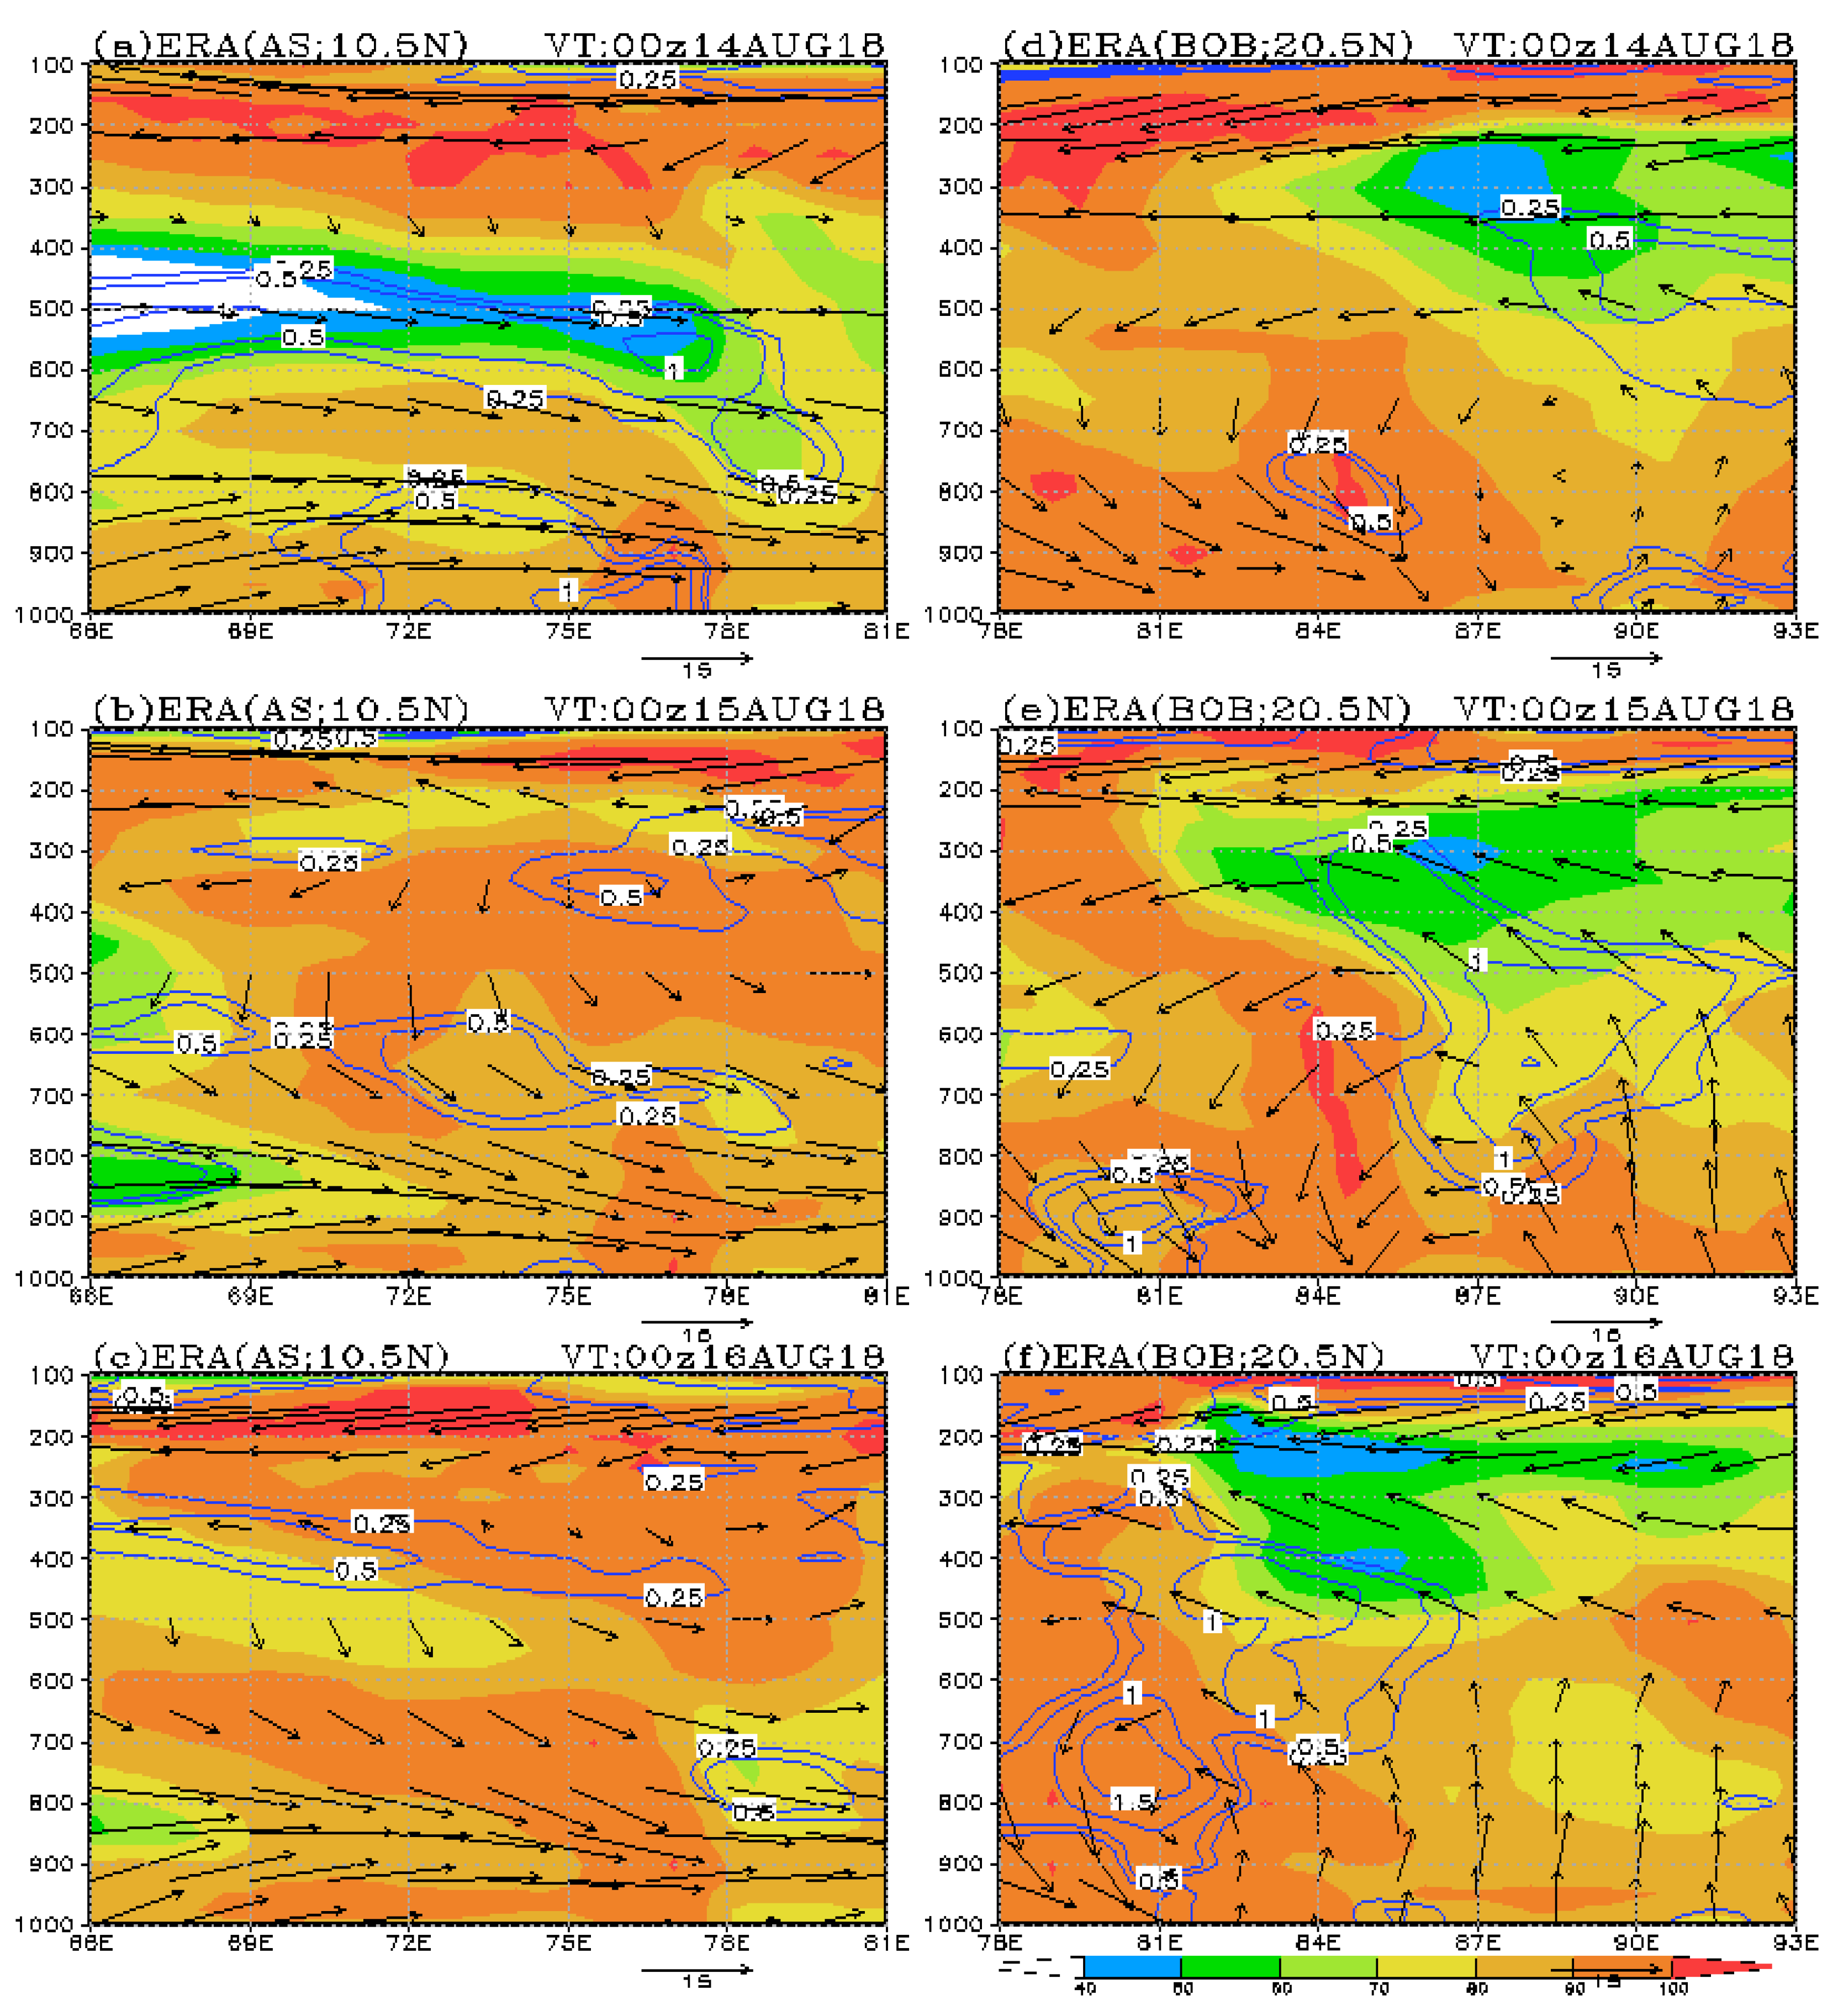
  • The wind and vorticity field over the coast of the BoB (18° N; 86° E) was consistent with the maximum rainfall in the south-west sector of the long-lasting monsoon depression. The cyclonic circulation somehow extended from the BoB to AS and persisted for up to two days, which caused severe rainfall over Kerala and the Western Ghats. Monsoonal depression has a southwest tilt in the vertical direction; thus, the pumping of moisture by the depression into the middle troposphere is a possible aspect (Figure 1 and Figure 2);
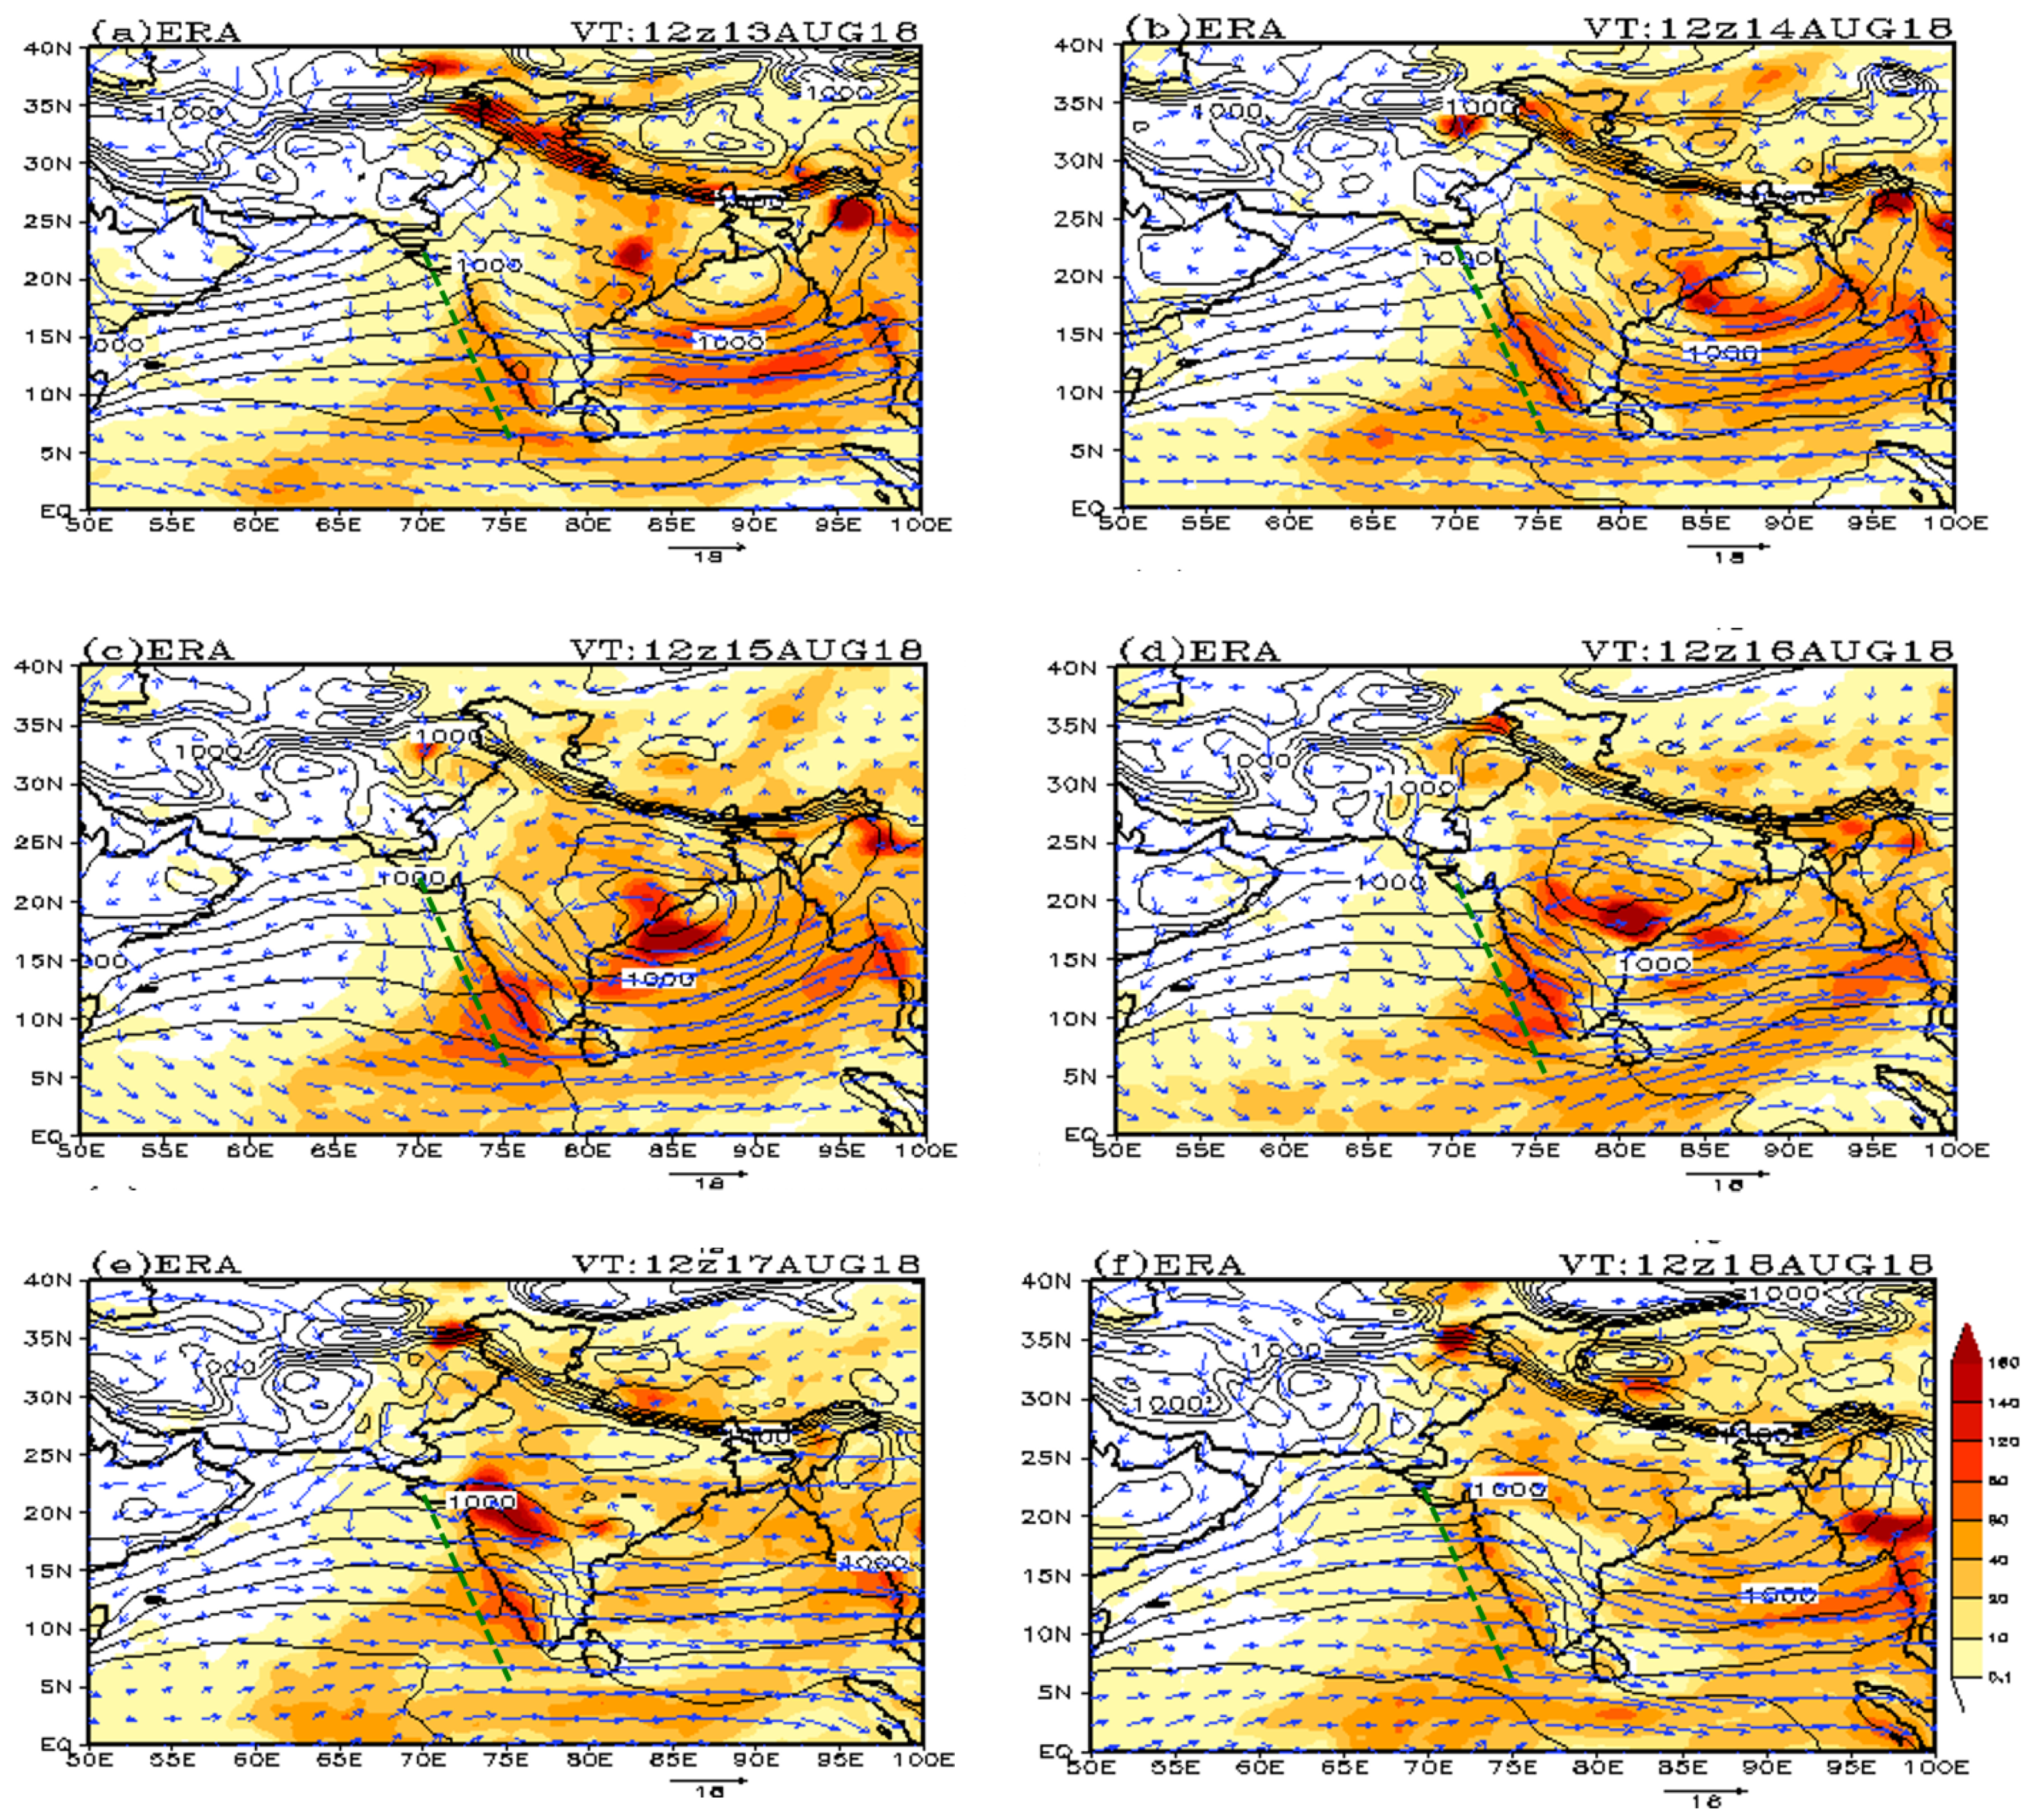
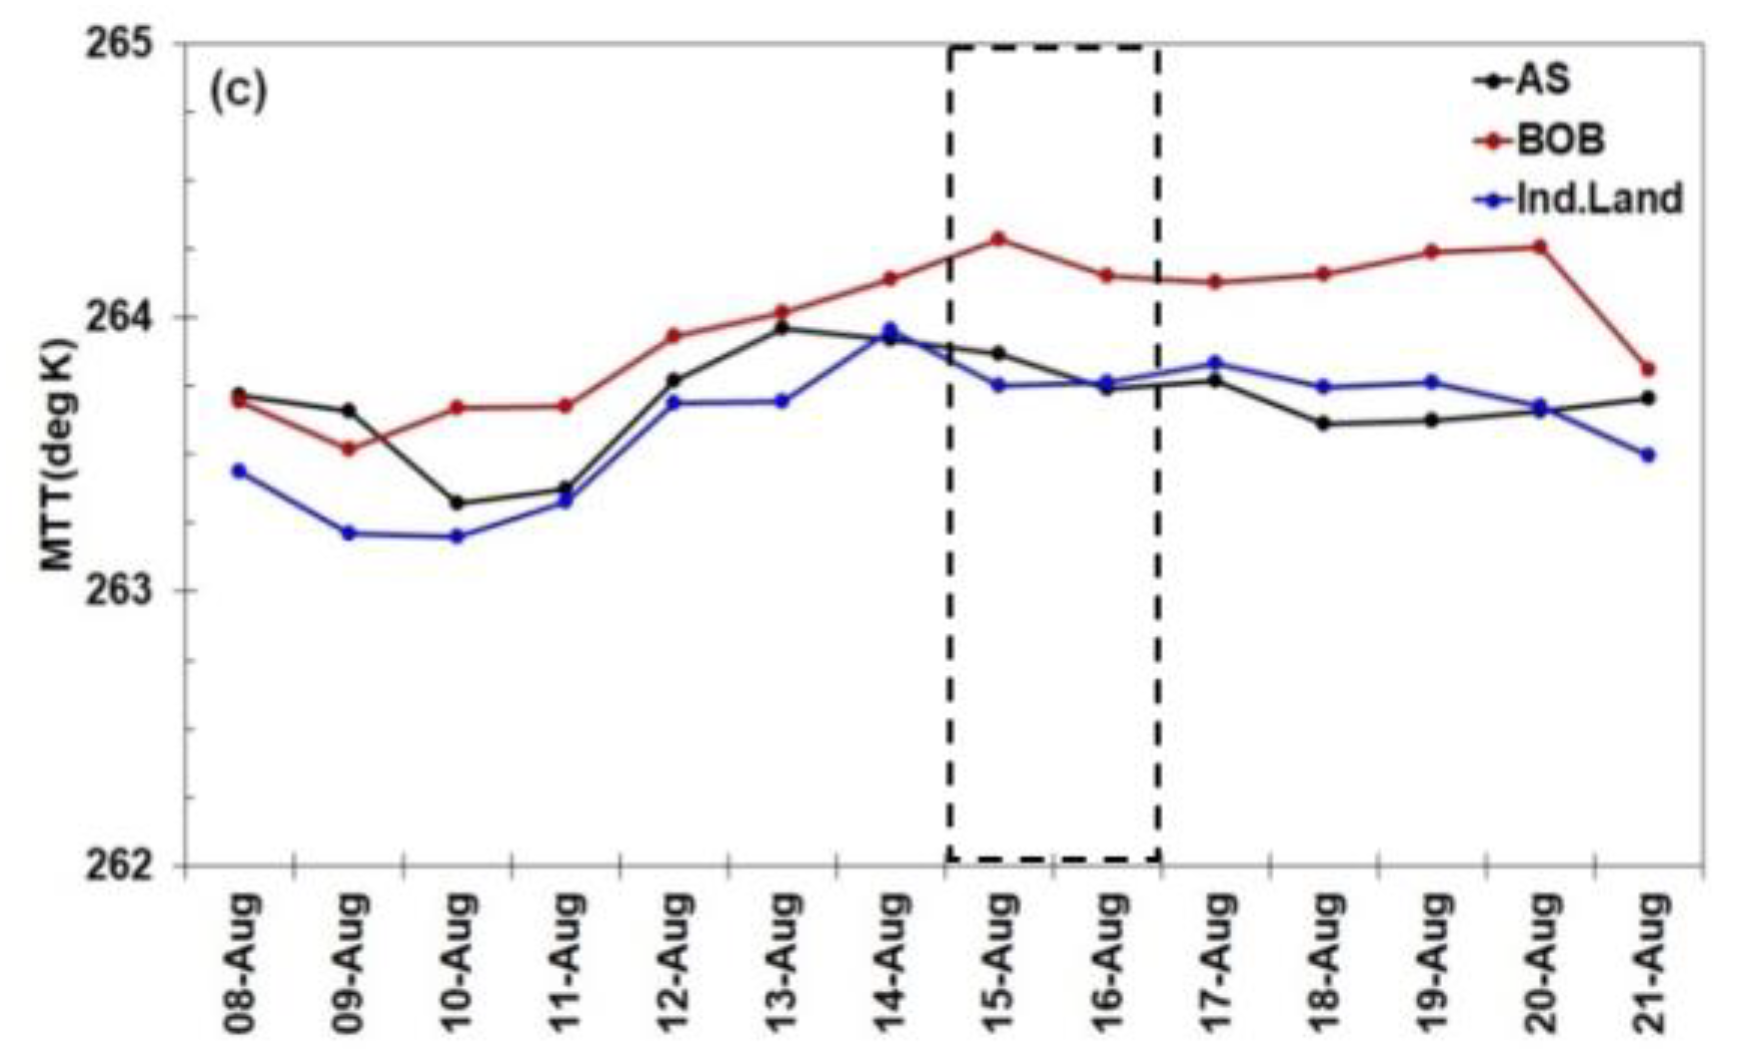
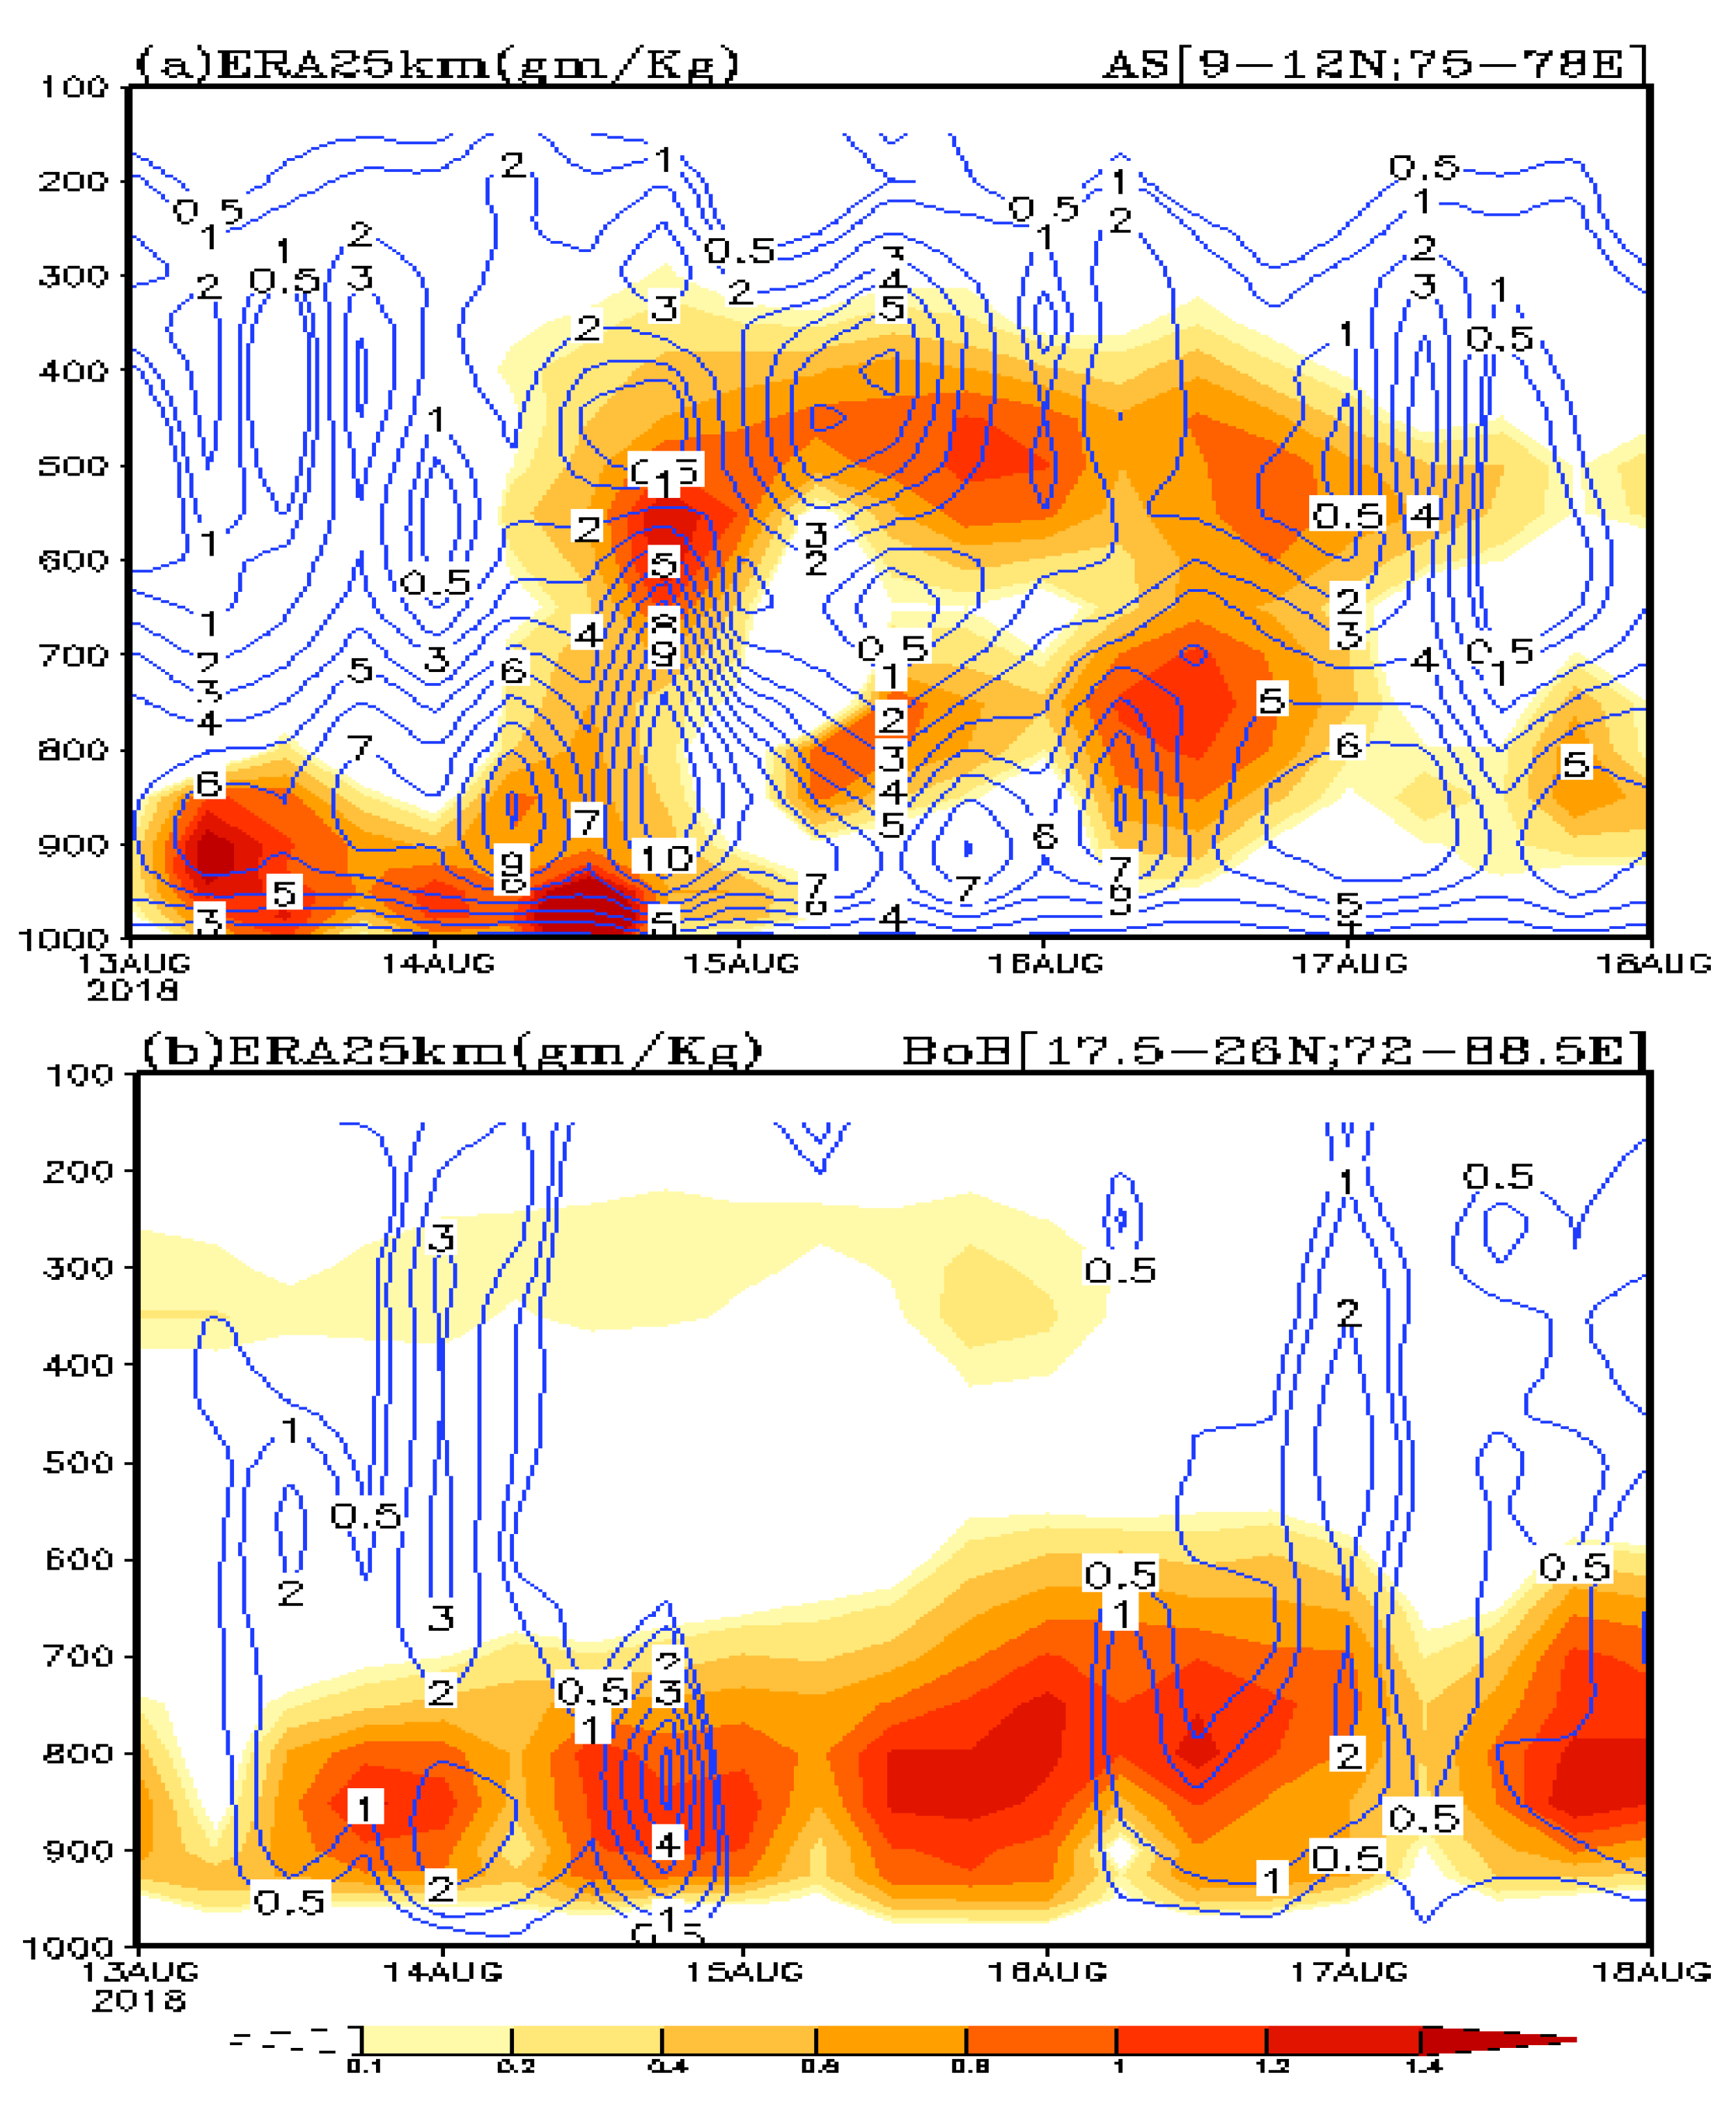
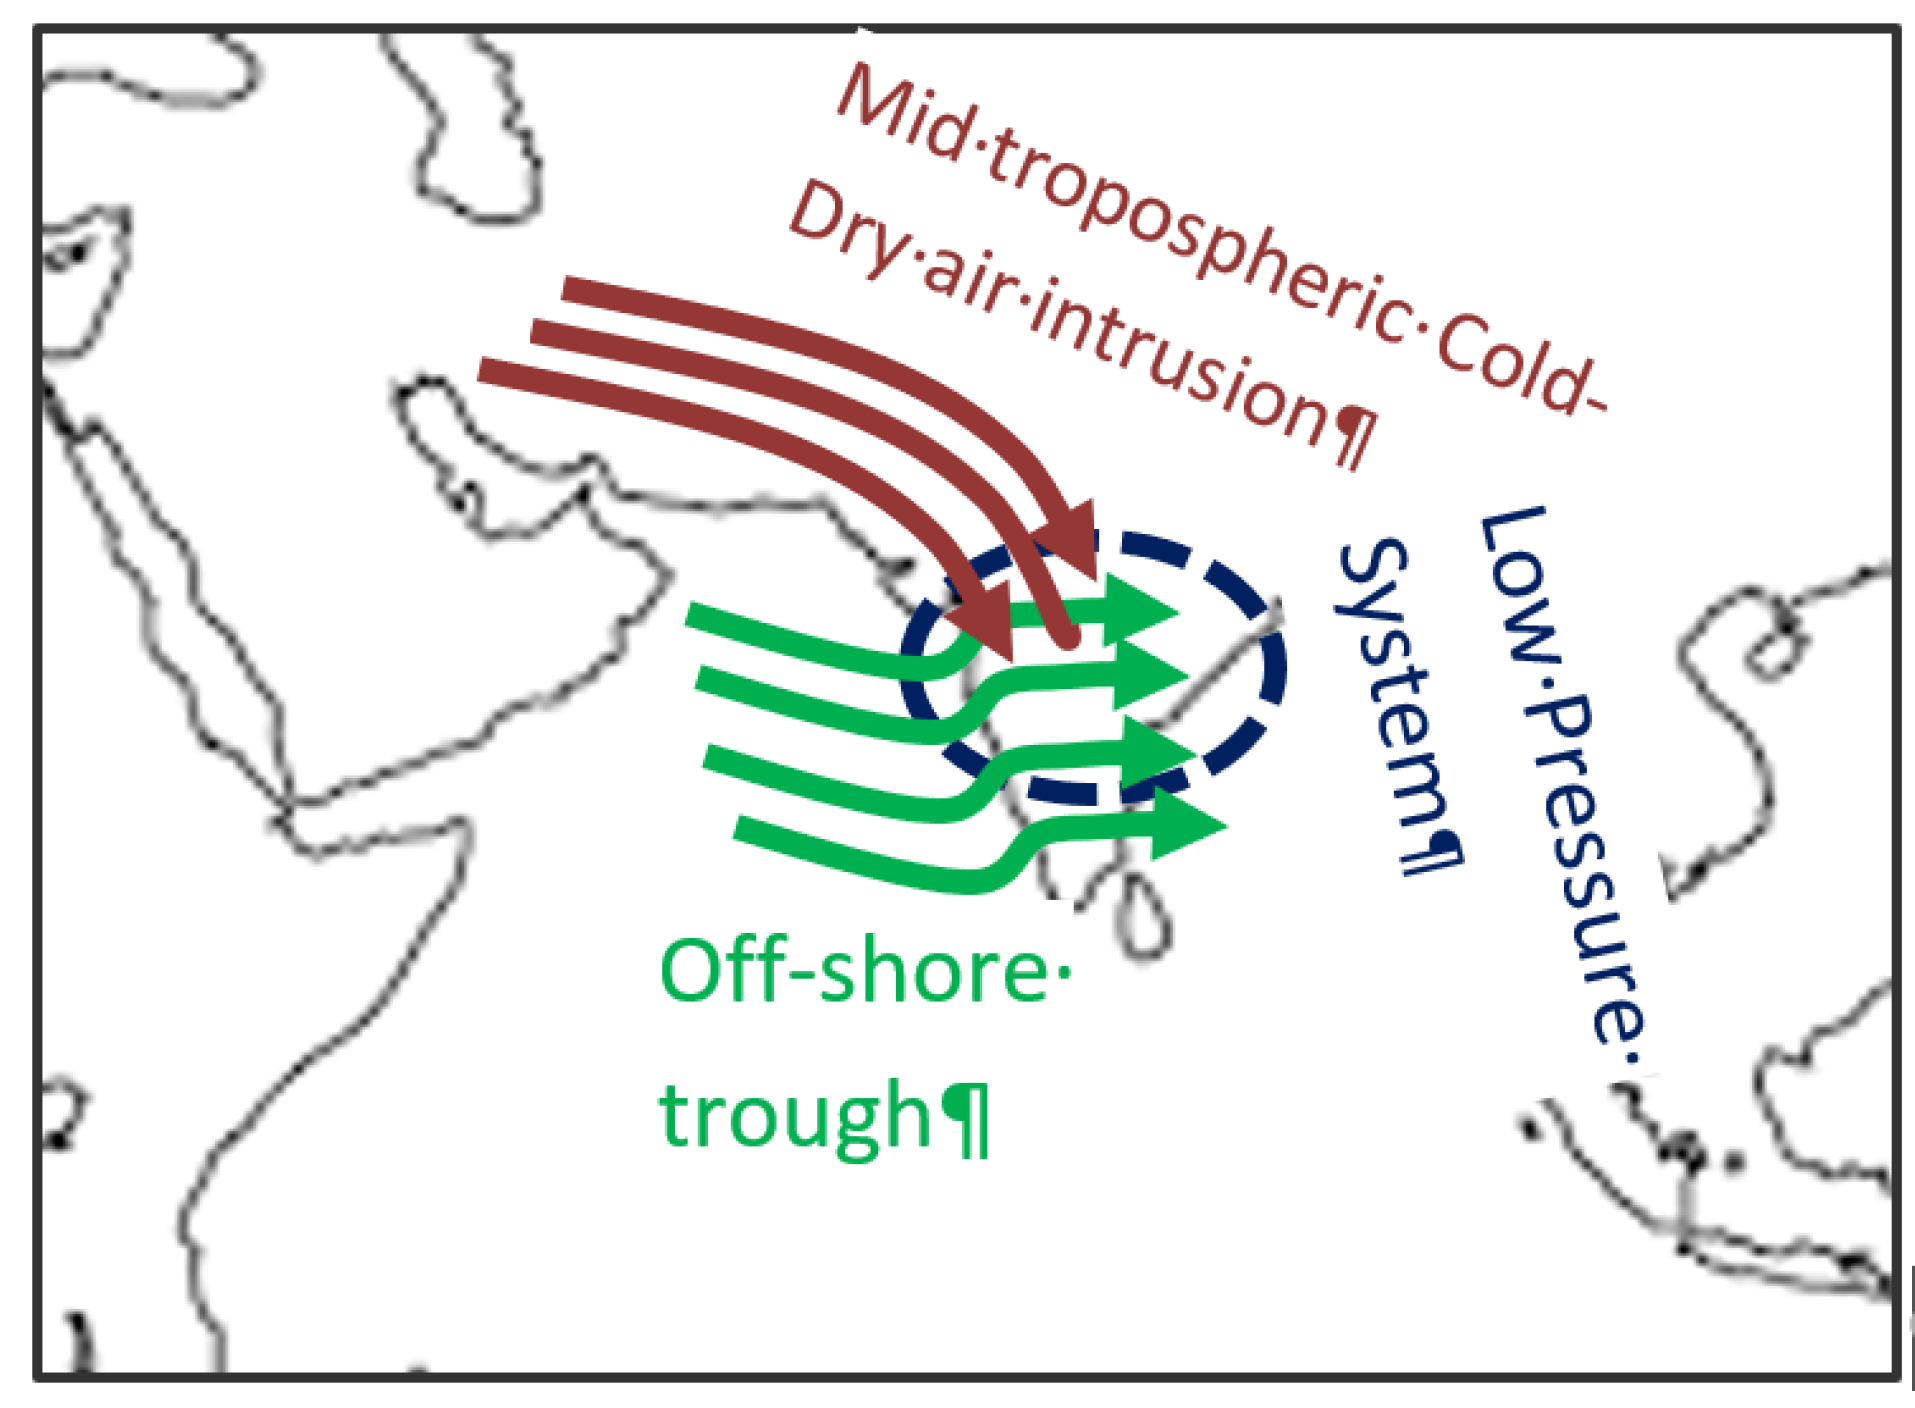
  • The KFE was an outcome of the interaction between the offshore trough, LPS, dry air intrusion in the middle troposphere, and other regional features (Figure 12). Additionally, the mixing of cold-dry air from the Middle East region in the middle troposphere with south-westerly winds in the lower troposphere was sufficient to create an unstable atmosphere during KFE (Figure 3);
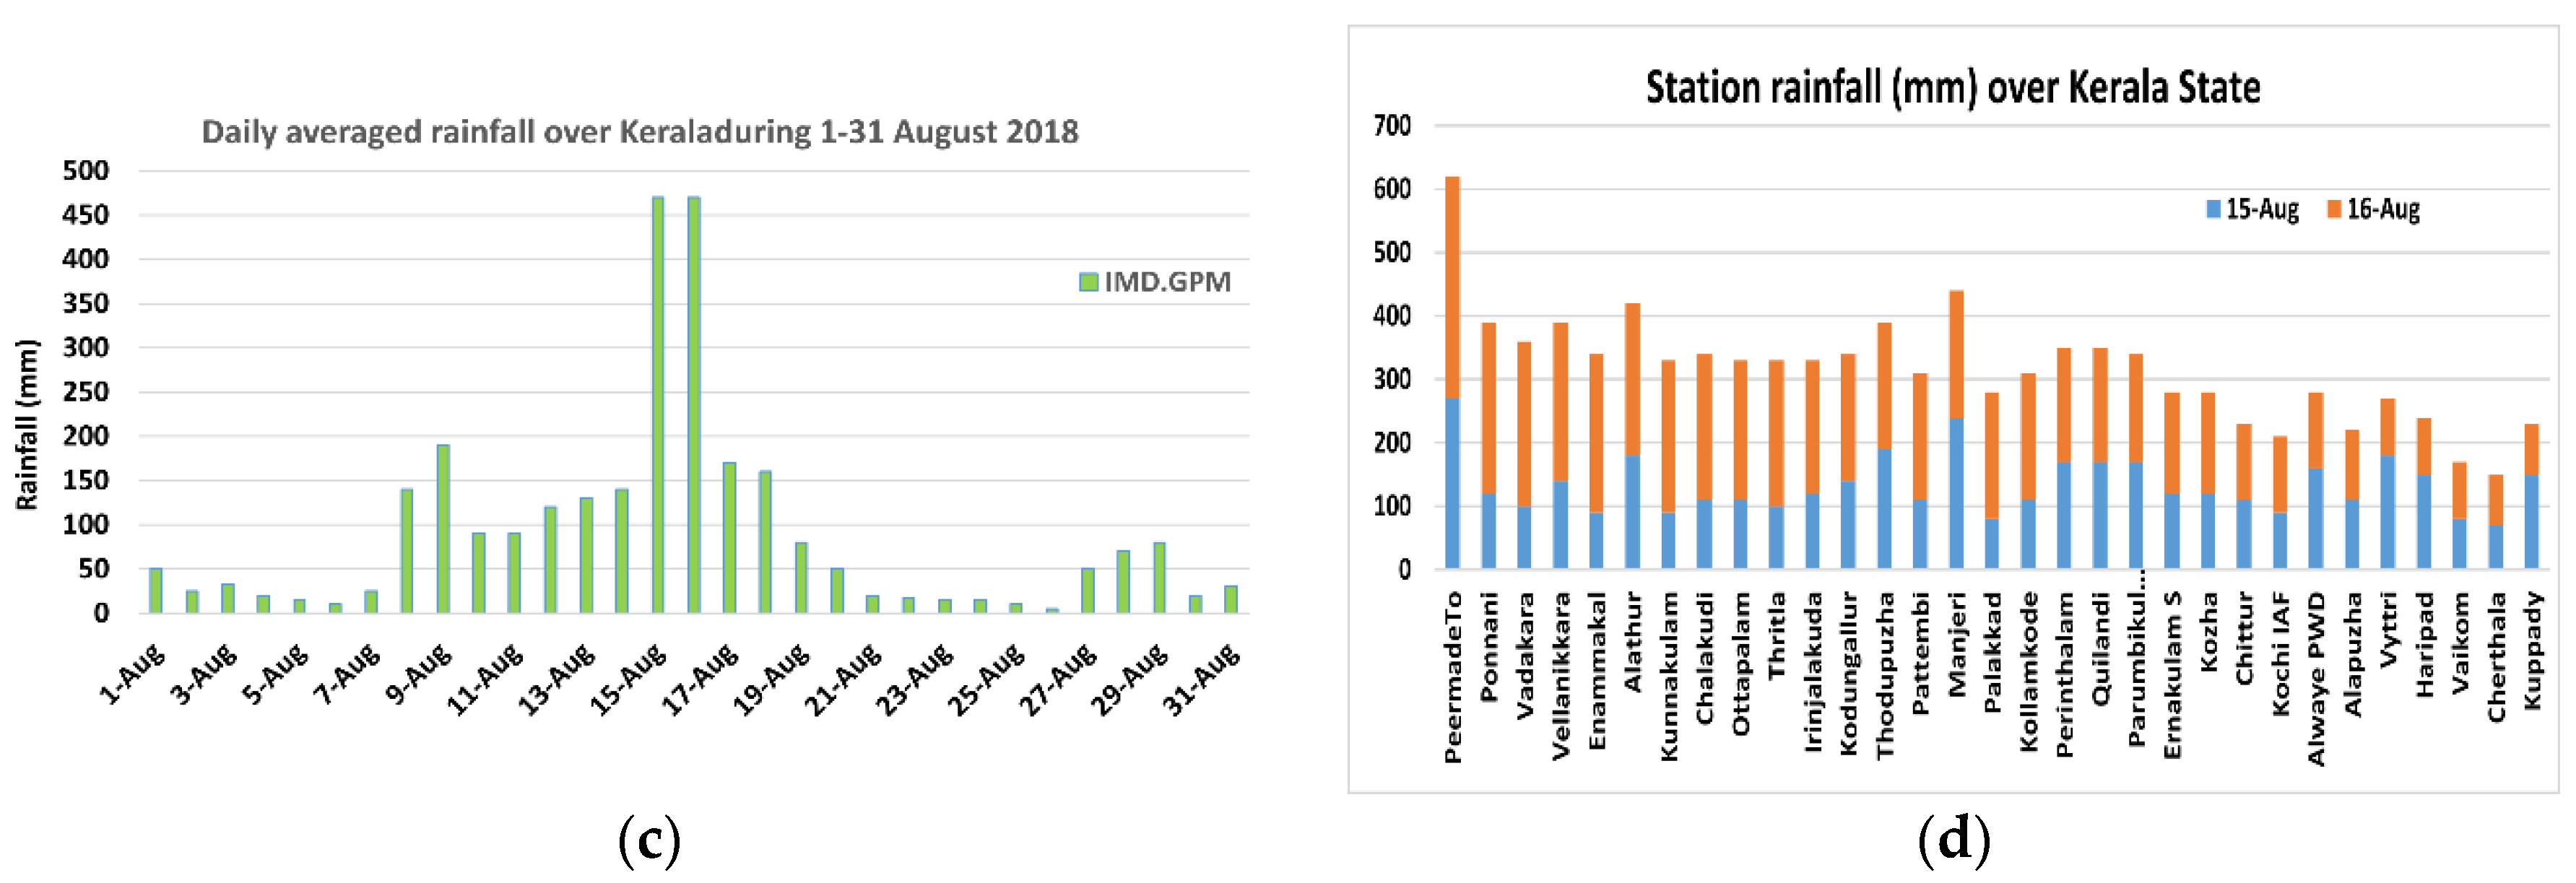
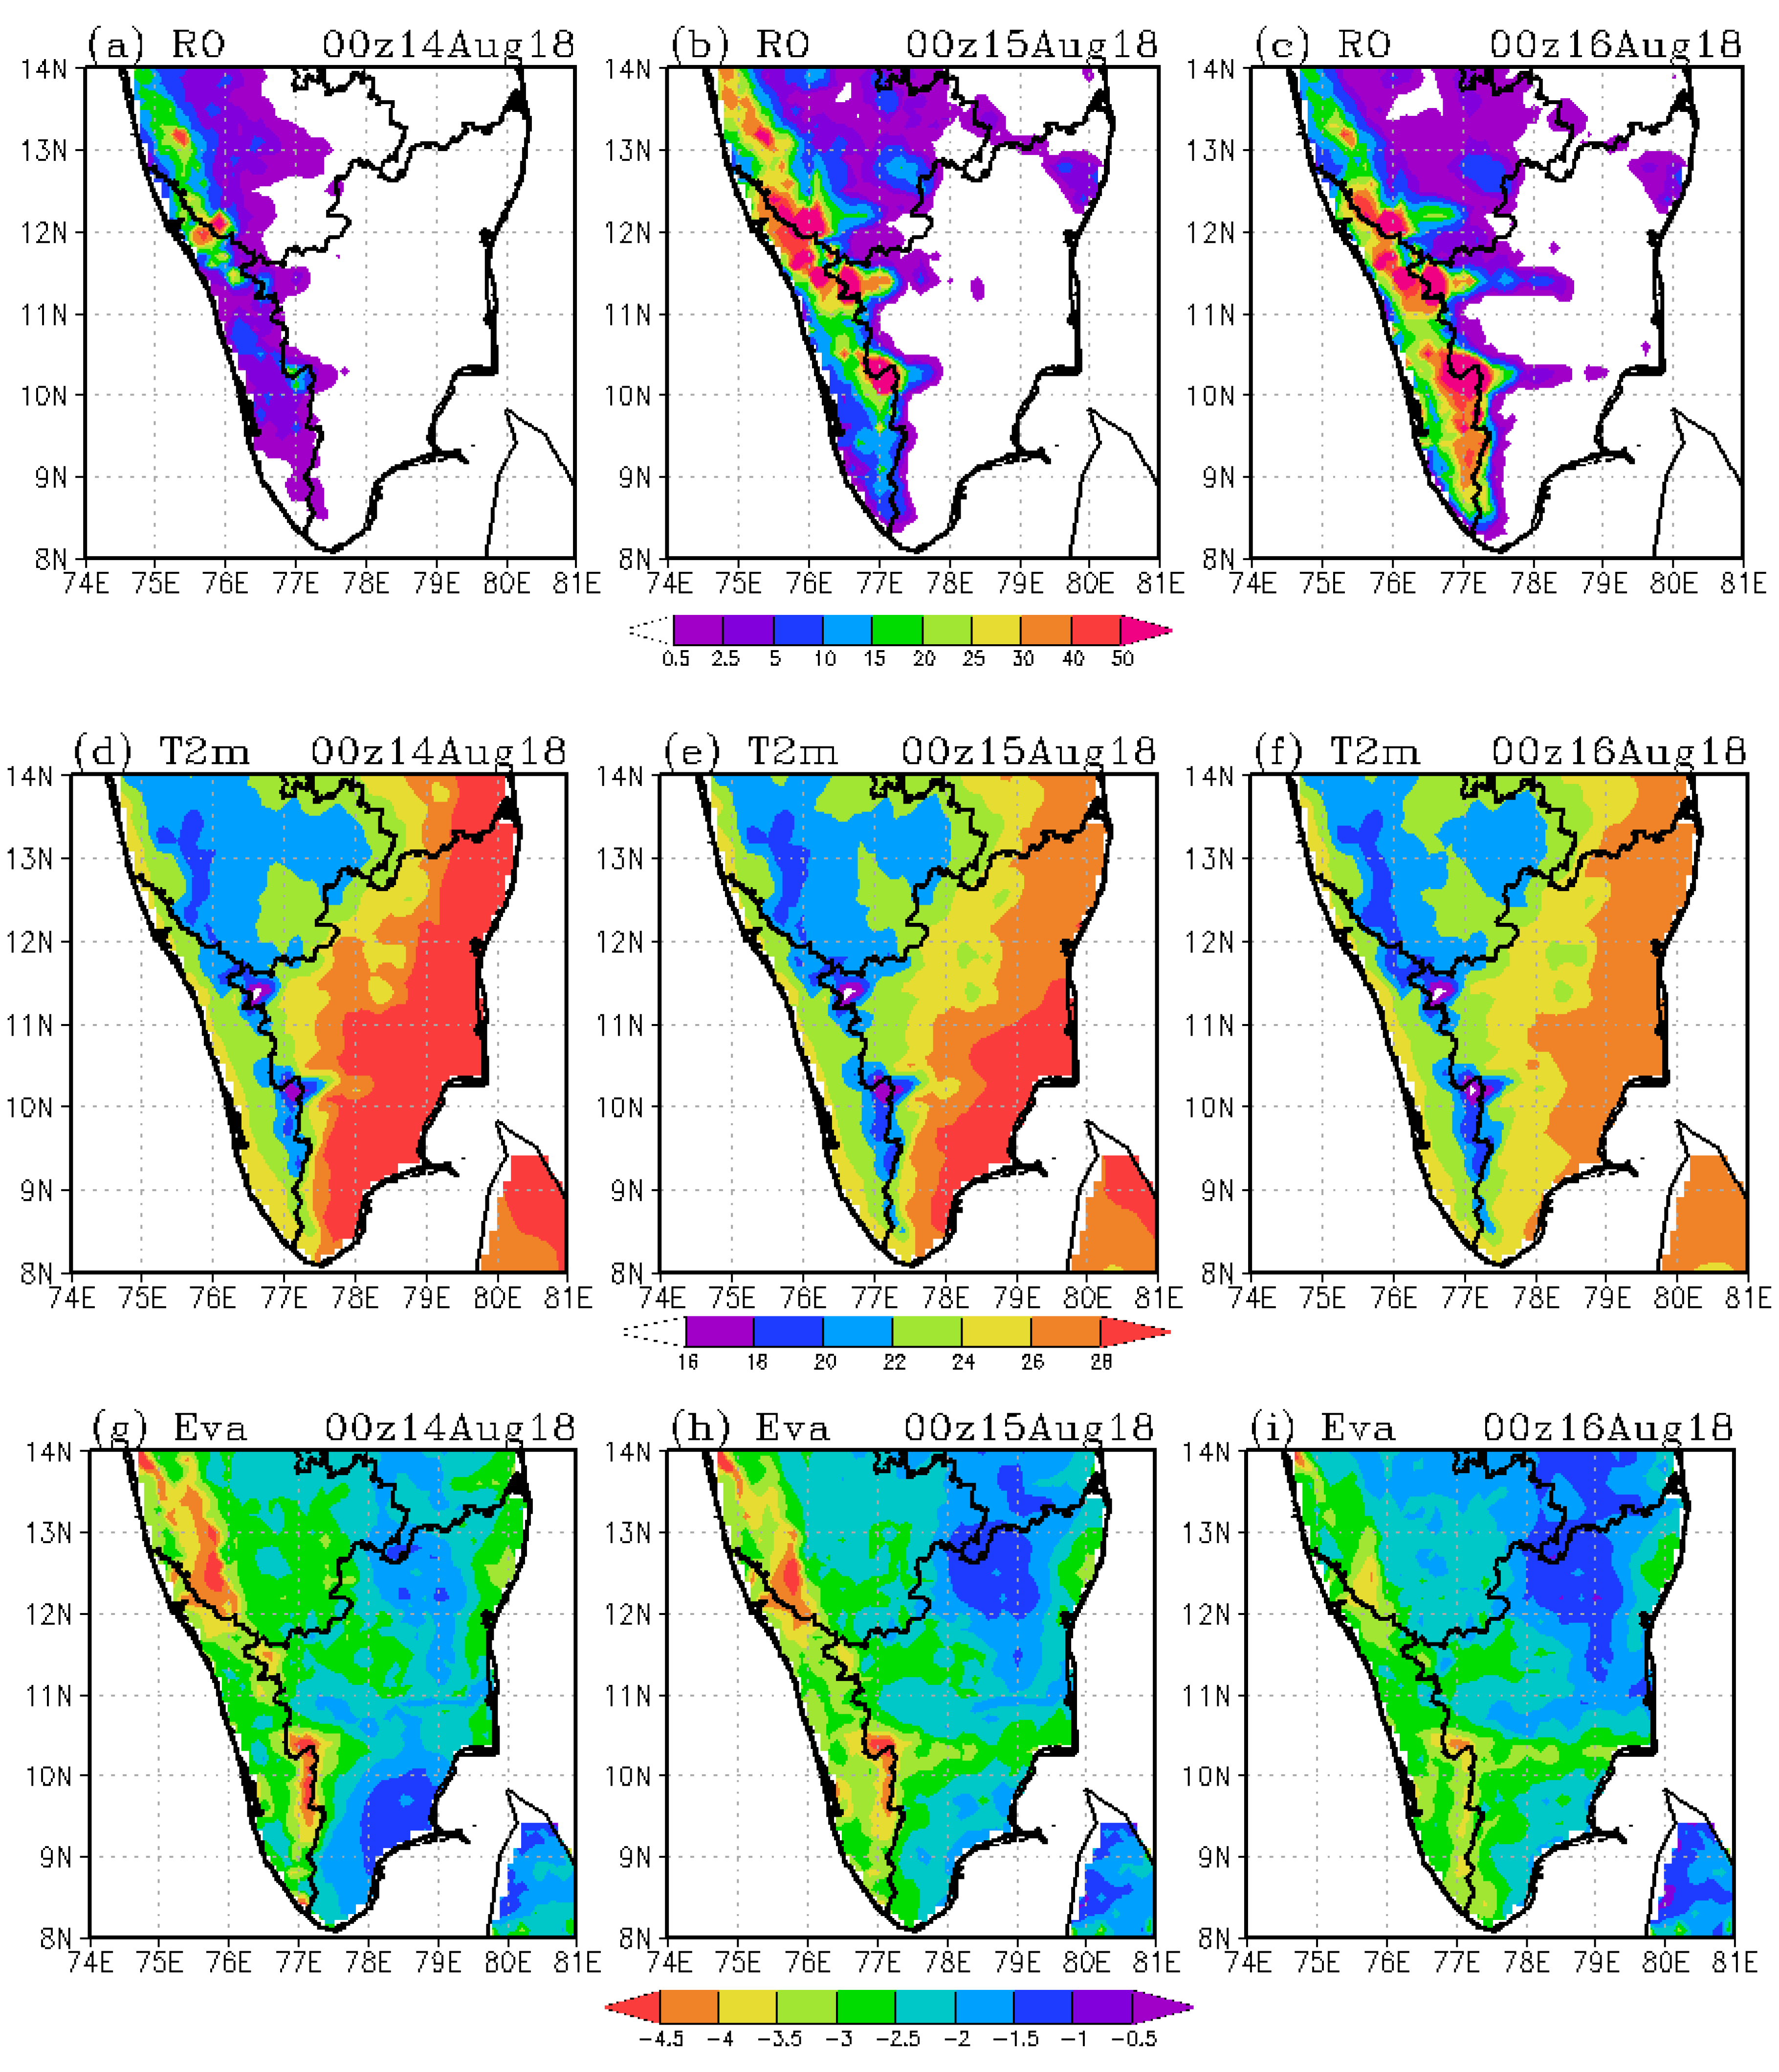
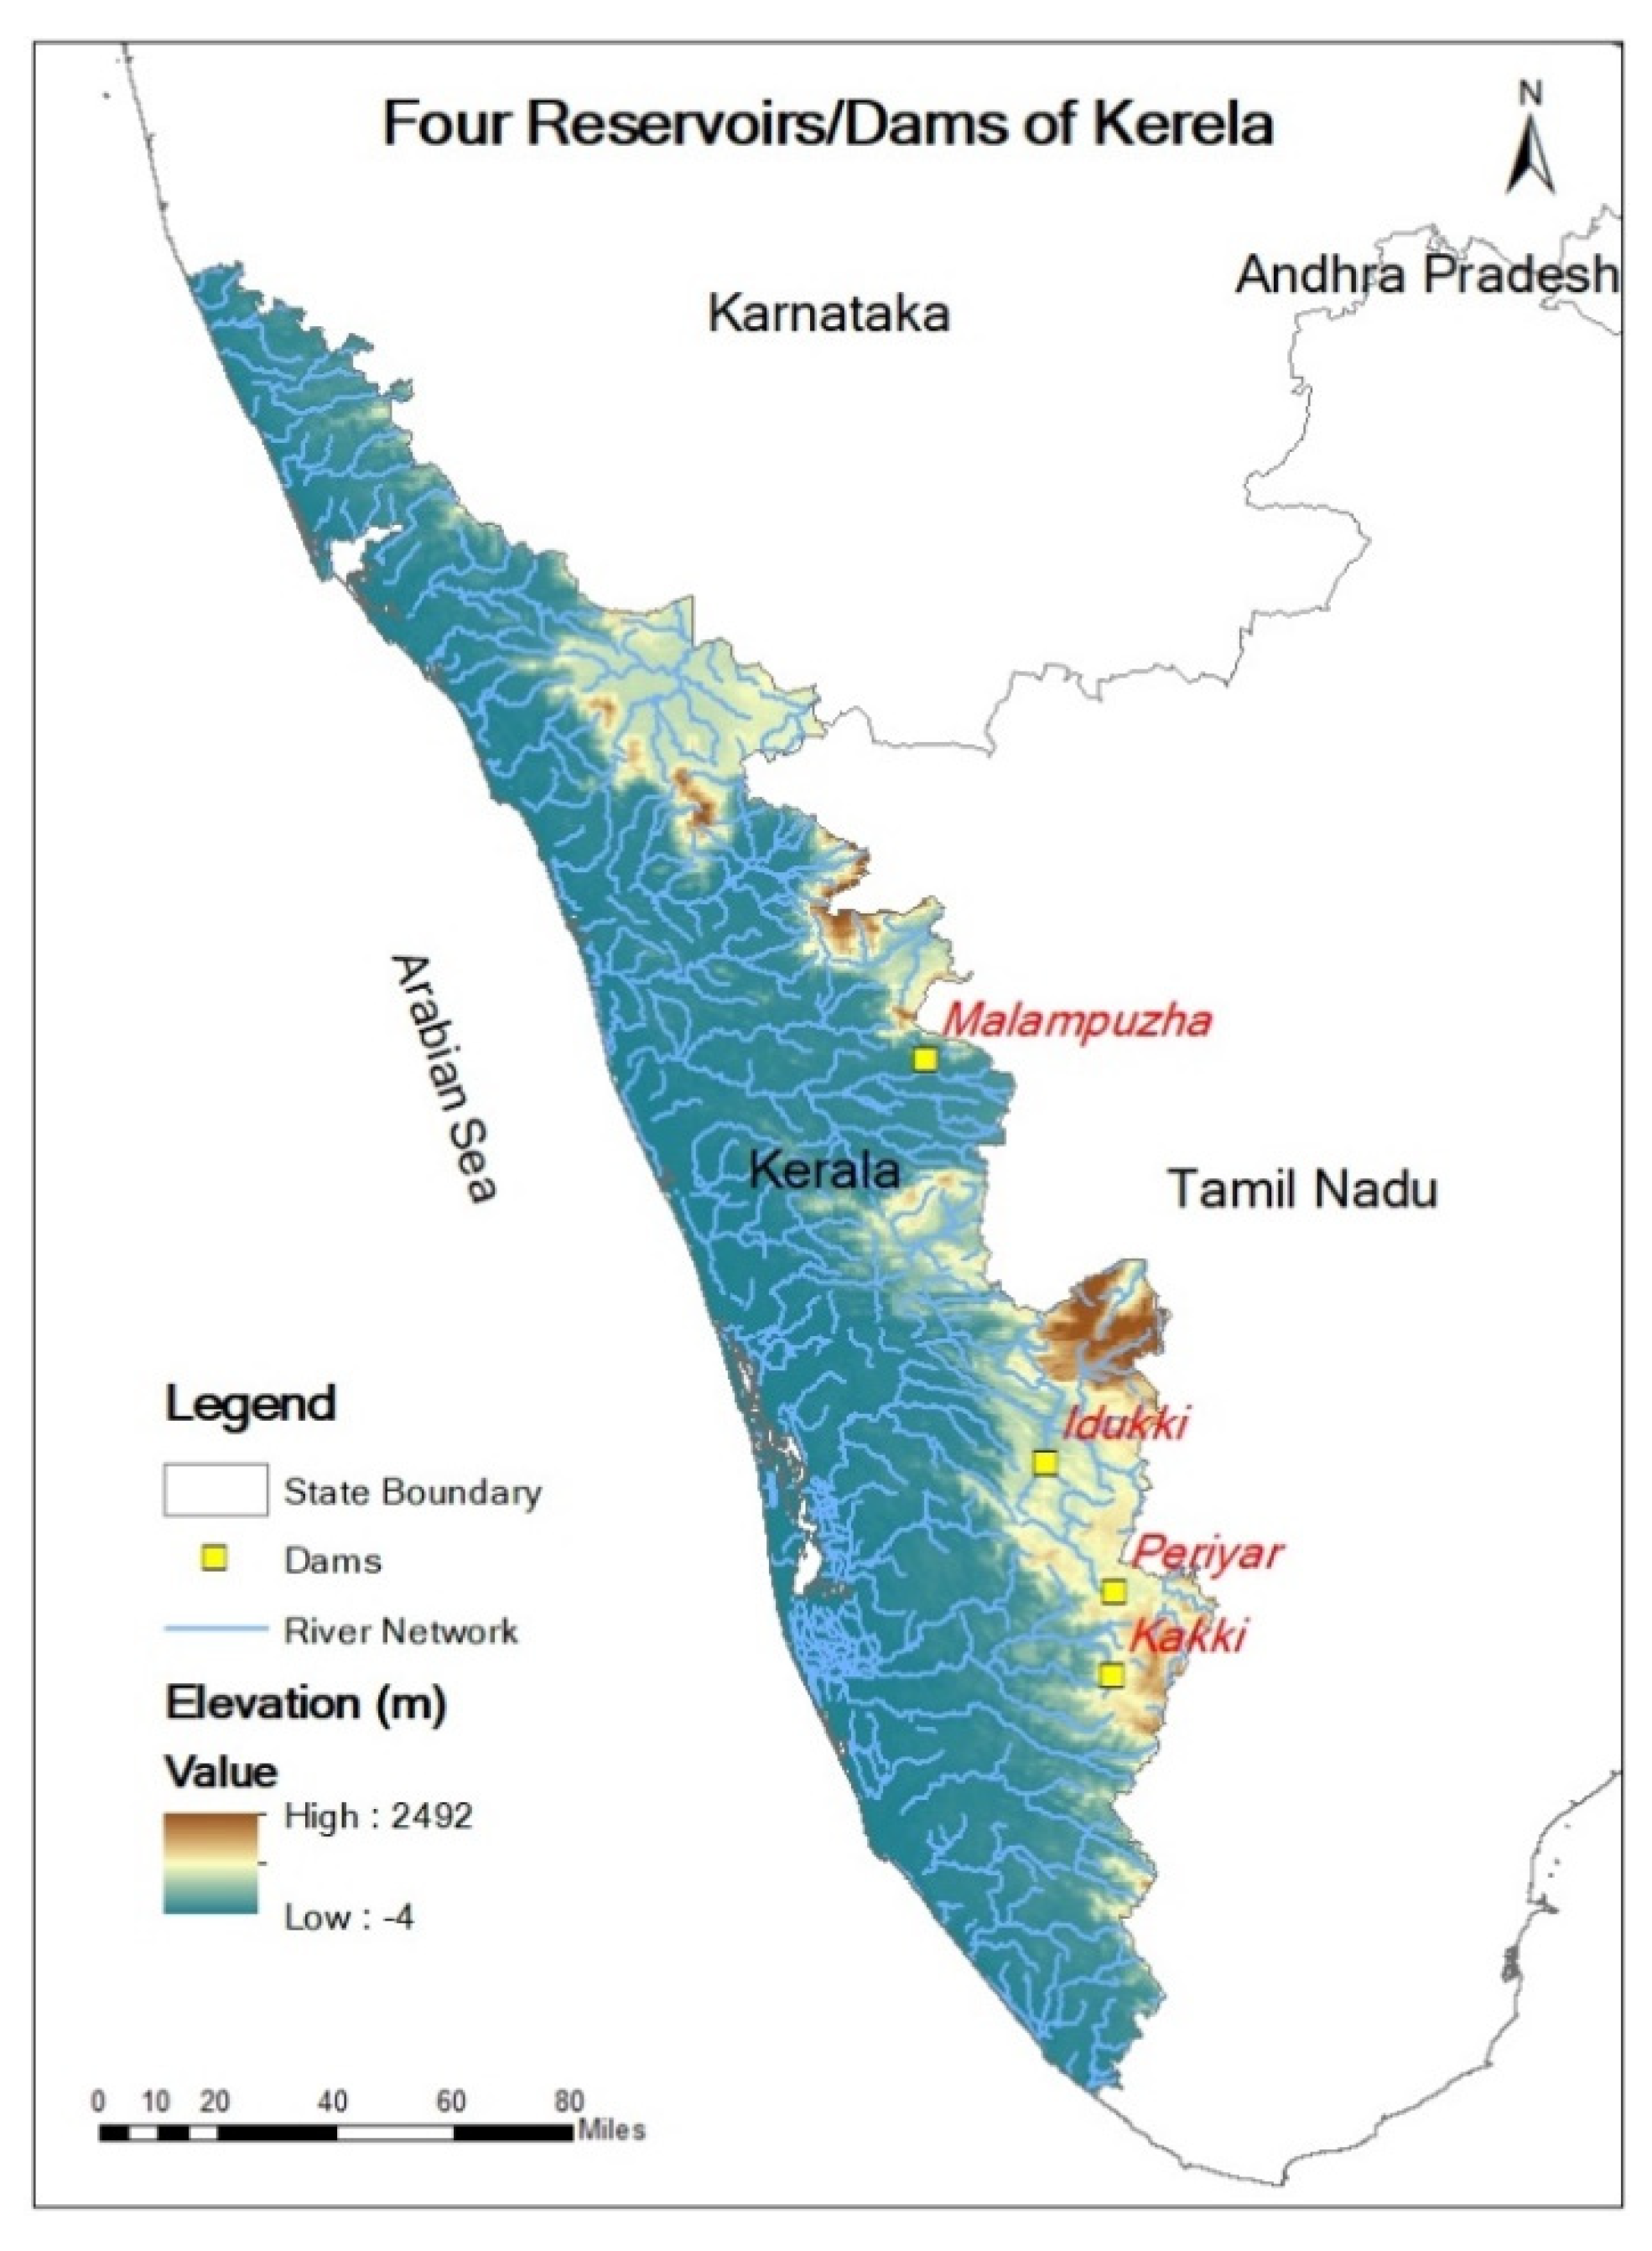
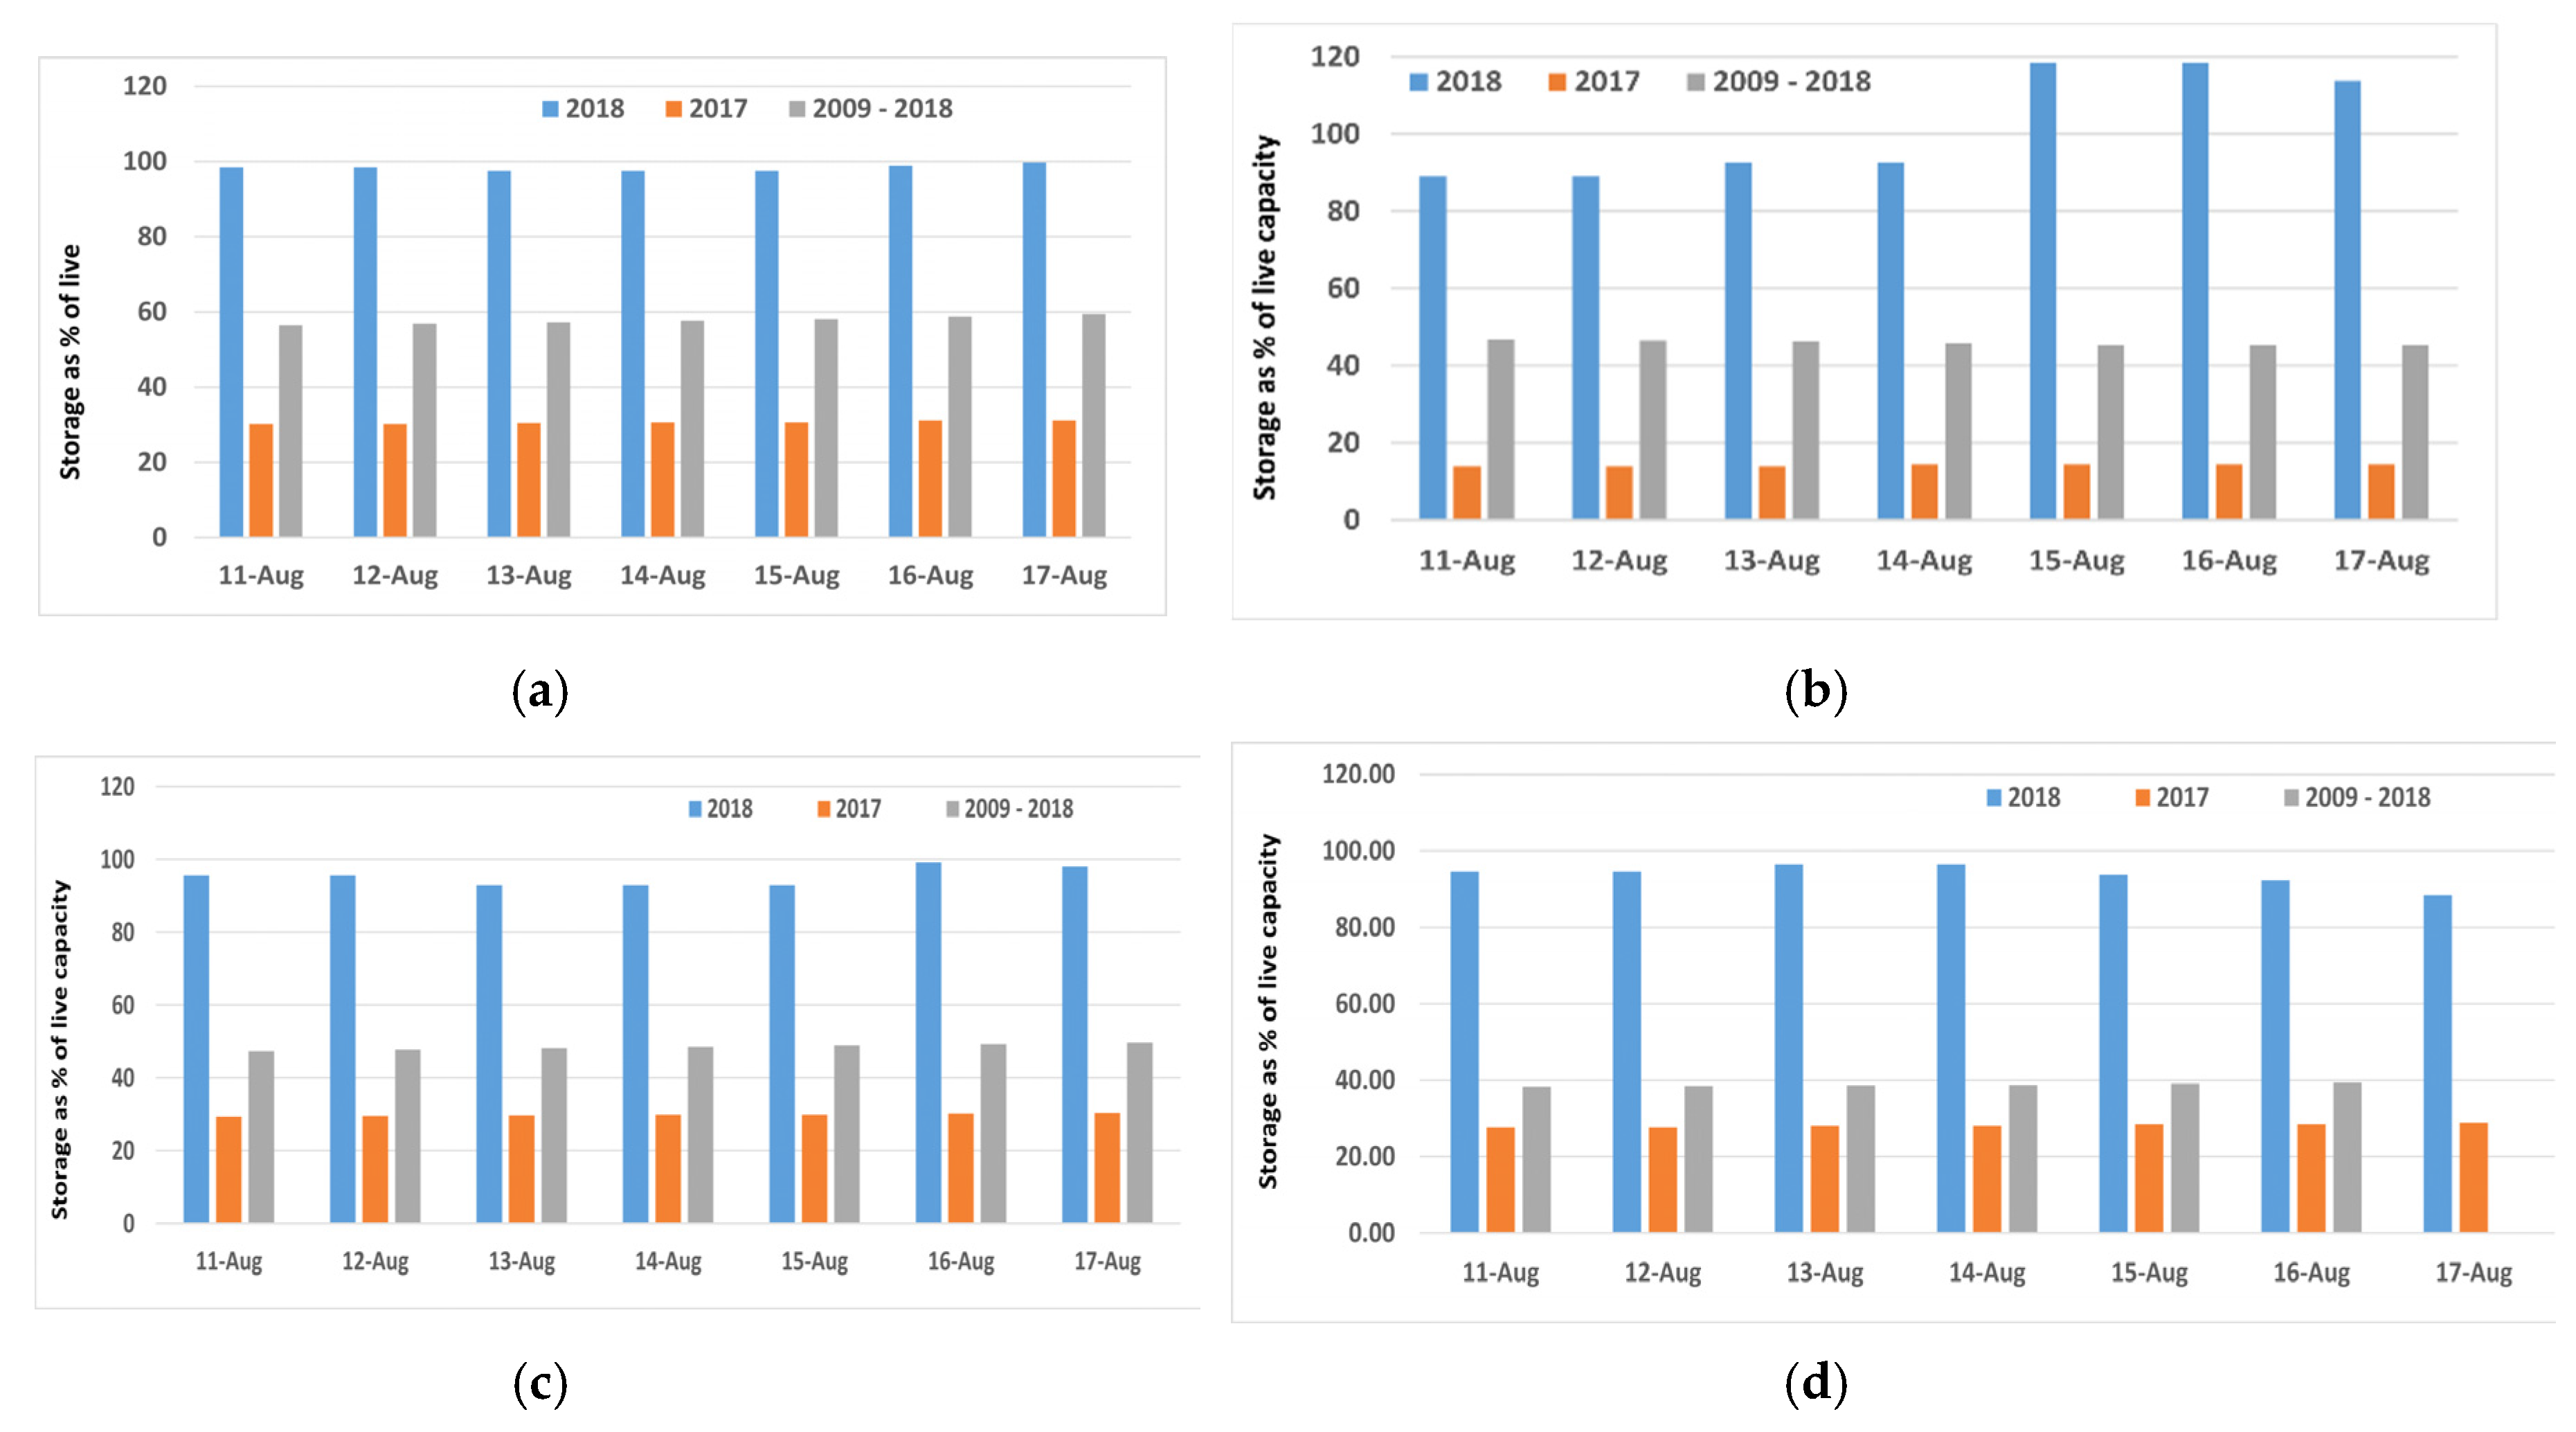
  • Due to continuous rainfall, most of the major dams in the Kerala state were filled with rainwater before the KFE. Water released from major reservoirs into the rivers might be one of the other possible factors which worsened this flood (Figure 11).
In the last few decades, the mean surface temperature over the Western Ghats has significantly escalated. Thermodynamic situations favor intense and deep precipitation over the Western Ghats, which makes the region prone to flash floods at present and in the future [34]. Additionally, landslide and storm surges are other possible reasons for the KFE. The floodwater remained turbidly muddy. One of the unique aspects of the Kerala flood was the ~7 days long rainfall before the day of the flood. Surface winds due to monsoonal flow excited a water surge, which inundated low-lying areas. Many factors played a synergic role in making it the worst historical flood of Kerala. However, it is known that LPS over AS and BoB initiates rainfall over central India [49]. Over the Indian region, multiple low-pressure systems may play an essential role in influencing extreme rainfall events [50], and KFE was one such case. At present, the ultimate goal of weather forecasts should be dedicated to extreme rainfall events, which always pose a challenging task [5,14], because every new flood is unique. Predicting such events may be possible with the improvement of medium-range modeling. The reliability of weather forecasts for such extreme rainfall and a long duration of active spells of the monsoon should be prioritized, rather than just criticizing the operation of dams during unprecedented extreme rainfall.
Due to unidirectional and robust wind, it is possible that there was a more significant sea surface height anomaly during the KFE around the Kerala state, which may have blocked the outflow of rivers. The ecological and environmental losses are too numerous to count owing to flood damage. The state, Kerala, was affected by drought at the end of August 2019, followed by flooding. Therefore, the region was marred by two natural disasters, almost two weeks apart. Such striking features of meteorology are intriguing and challenging for the scientific community to focus on.
The construction of new reservoirs and wetland serves the purpose of flood mitigation and ensuring an availability of water during dry seasons. A multipurpose and hybrid system of water resources may be one of the resolutions for handling hydropower generation, flood control, and water availability options.
This work does not include the influence of remote teleconnection (e.g., ENSO) on heavy monsoonal rainfall over Kerala [51]. However, such connections are outside of the scope of the present research work. Weather forecasters of extreme events are advised to look at the aspect of the interaction among LPS, dry-air intrusion, and offshore troughs over the Indian region for extreme rainfall events. An increase in global temperature can influence the fundamental atmospheric variables, e.g., pressure, wind circulation, evaporation, and many other variables. It is difficult to pinpoint the locations of heavy rainfall events, yet preferred locations fall under and nearby the path of low-pressure systems. Orographic regions of heavy rainfall are other favored locations of extreme precipitation. Further research work is required to understand this theory of interactions in heavy rainfall, maybe through modeling.

Supplementary Materials

The following are available online at https://www.mdpi.com/2073-4433/11/7/740/s1, Figure S1: INSAT-3D satellite cloud imagery in thermal imagery channel valid at 0300 UTC (a) 14 August 2018, (b) 15 August 2018, (c) 16 August 2018 and (d) 17 August 2018 respectively. Figure S2 Wind speed (shaded; ms−1) and direction at 200 hPa level valid on 00 UTC of (a) 13 August (b) 14 August (c) 15 August and (d) 16 August (e) 17 August and (f) 18 August 2018 derived from ERA Interim reanalysis at 25 km resolutions. Figure S3 Vorticity field (x106 s−1) valid on 12UTC of (a) 14 August (b) 15 August 2018 at 600 hPa levels derived from ERA Interim reanalysis at 25 km resolutions. Figure S4 (a) Daily climatology of kinetic energy (m2s−2) over the Arabian Sea (AS: 50° E–72.5° E; 5° N–15° N; black colour), Bay of Bengal (BOB: 82.5° E–97.5° E; 5–15° N; red colour) and Indian landmass (INL: 72.5° E–82.5° E; 5–15° N; blue colour) at 850 hPa level are derived from ERA-Interim Reanalysis on 00 UTC of 8–21 August 2018. Similarly (b) depicts net tropospheric moisture (NTM; gm kg−1) and (c) mean tropospheric temperature (MTT; K) respectively. Figure S5 (a) Off-shore trough (hPa) along the west coast average (8°–10° N; 76°–77° E) and (b) total precipiatable water content (kg m−2) derived from ERA Intrim reanalysis at 25 km resolutions.

Author Contributions

V.K. conceived and fumulated the study. V.K., P.K.P. and H.-P.C. prepared the figures. All other authors (T.S. and S.V.B.R.) along with V.K. discussed the results and prepared the manuscript. All authors have read and agreed to the published version of the manuscript.

Funding

This research received no external funding.

Acknowledgments

The authors acknowledge TAMU Kingsville, TX, USA and SV University for the support. Furthermore, the authors gratefully acknowledge various datasets, e.g., ERA-Interim reanalysis fields, IMD datasets, INSAT-3D, IMD + TRMM 3b42 merged analysis, and GrADS package.

Conflicts of Interest

The authors declare no conflicts of interest.

References

  1. Neena, J.M.; Suhas, E.; Goswami, B.N. Leading role of internal dynamics in the 2009 Indian summer monsoon drought. J. Geophys. Res. 2011, 116. [Google Scholar] [CrossRef] [Green Version]
  2. Duncombe, J. Making sense of landslide danger after Kerala’s floods. Eos 2018, 99. [Google Scholar] [CrossRef]
  3. Futrell, J.H.; Gephart, R.E.; Kabat-Lensch, E.; McKnight, D.M.; Pyrtle, A.; Schimel, J.P.; Smyth, R.L.; Gephart, J.M. Water: Challenges at the Intersection of Human and Natural Systems; NSF/DOE Technical Report PNWD-3597; Pacific Northwest National Laboratory (PNNL): Richland, WA, USA, 2005; 50p. [Google Scholar] [CrossRef] [Green Version]
  4. NRC. When Weather Matters: Science and Service to Meet Critical Societal Needs; National Academies Press: Washington, DC, USA, 2010; 198p. [Google Scholar]
  5. Mishra, V.; Aaadhar, S.; Shah, H.; Kumar, R.; Pattanaik, D.R.; Tiwari, A.D. The Kerala flood of 2018: Combined impact of extreme rainfall and reservoir storage. Hydrol. Earth Syst. Sci. Discuss. 2018, 1–13. [Google Scholar] [CrossRef] [Green Version]
  6. Mishra, V.; Shah, H. Hydroclimatological Perspective of the Kerala Flood of 2018. J. Geol. Soc. India 2018, 92, 645–650. [Google Scholar] [CrossRef]
  7. Sudheer, K.P.; Bhallamudi, S.M.; Narasimhan, B.; Thomas, J.; Bindhu, V.M.; Vema, V.; Kurian, C. Role of dams on the floods of August 2018 in Periyar River Basin, Kerala. Curr. Sci. 2019, 116, 780–974. [Google Scholar] [CrossRef]
  8. Vishnu, C.L.; Sajinkumar, K.S.; Oommen, T.; Coffman, R.A.; Thrivikramji, K.P.; Rani, V.R.; Keerthy, S. Satellite-based assessment of the August 2018 flood in parts of Kerala, India. Geomat. Nat. Hazards Risk 2019, 10, 758–767. [Google Scholar] [CrossRef] [Green Version]
  9. Yesubabu, V.; Challa, V.; Srinivas, V.; Basha, G.; Dasari, H.P.; Langodan, S.; Ratnam, M.V.; Hoteit, I. A diagnostic study of extreme precipitation over Kerala during August 2018. Atmos. Res. Lett. 2019. [Google Scholar] [CrossRef]
  10. Hunt, K.M.R.; Menon, A. The 2018 Kerala floods: A climate change perspective. Clim. Dyn. 2020, 54, 2433–2446. [Google Scholar] [CrossRef] [Green Version]
  11. Bohra, A.K.; Basu, S.; Rajagopal, E.N.; Iyengar, G.R.; DasGupta, M.; Ashrit, R.; Athiyaman, B. Heavy rainfall episode over Mumbai on 26 July 2005: Assessment of NWP guidance. Curr. Sci. 2006, 90, 1188–1194. [Google Scholar]
  12. Gupta, A.K. Uttarakhand Disaster 2013; National Institute of Disaster Management New Delhi: New Delhi, India, 2014. [Google Scholar]
  13. Dube, A.; Ashrit, R.; Ashish, A.; Sharma, K.; Iyengar, G.R.; Rajagopal, E.N.; Basu, S. Forecasting the heavy rainfall during Himalayan flooding-June 2013. Weather Clim. Extrem. 2014, 4, 22–34. [Google Scholar] [CrossRef] [Green Version]
  14. Krishnamurti, T.N.; Kumar, V.; Simon, A.; Thomas, A.; Bhardwaj, A.; Das, S. March of buoyancy elements during extreme rainfall over India. Clim. Dyn. 2016, 48, 1931–1951. [Google Scholar] [CrossRef]
  15. Krishnamurti, T.N.; Dubey, S.; Kumar, V.; Linoj, D.; Bhardwaj, A. Scale interaction and the flood event over south India. Q. J. R. Metereol. Soc. 2017, 143, 1442–1458. [Google Scholar] [CrossRef]
  16. Srinivas, C.V.; Yesubabu, V.; Prasad, D.H.; Prasad, K.H.; Greeshma, M.M.; Baskaran, R.; Venkatraman, B. Simulation of an extreme heavy rainfall event over Chennai, India using WRF: Sensitivity to grid resolution and boundary layer physics. Atmos. Res. 2018, 210, 66–82. [Google Scholar] [CrossRef]
  17. Kotal, S.D.; SenRoy, S.; RoyBhowmik, S.K. Catastrophic heavy rainfall episode over Uttarakhand during 16–18 June 2013—Observational aspects. Curr. Sci. 2014, 107, 234–245. [Google Scholar]
  18. Thayyen, R.J.; Dimri, A.P.; Kumar, P.; Agnihotri, G. Study of cloudburst and flash floods around Leh, India, during August 4–6, 2010. Nat. Hazards 2013, 65, 2175–2204. [Google Scholar] [CrossRef]
  19. Rao, P.S.; Sikka, D.R. Interactive Aspects of the Indian and the African Summer Monsoon Systems; Atmospheric and Oceanic Pageoph Topical, Volumes; Sharan, M., Raman, S., Eds.; Birkhäuser: Basel, Switzerland, 2007. [Google Scholar]
  20. Rao, P.S. Arabian Sea monsoon experiment: An overview. Mausam 2005, 56, 1–7. [Google Scholar]
  21. Madan, O.P.; Mohanty, U.C.; Iyenger, G.; Shivhare, R.P.; PrasadRao, A.S.; Sam, N.V.; Bhatla, R. Offshore trough and very heavy rainfall events along the west Coast of India during ARMEX-2002. Mausam 2005, 56, 37–48. [Google Scholar]
  22. Routray, A.; Mohanty, U.C.; Das, A.K.; Sam, N.V. Study of heavy rainfall event over the west-coast of India using analysis nudging in MM5 during ARMEX-I. Mausam 2005, 56, 107–120. [Google Scholar]
  23. Dodla, D.B.; Prasad, D.H. Impact of special observations on the numerical simulation of a heavy rainfall event during ARMEX-Phase I. Mausam 2005, 56, 121–130. [Google Scholar]
  24. Das, S.; Ashrit, R.; Moncrieff, M.W.; DasGupta, M.; Dudhia, J.; Liu, C.; Kalsi, S.R. Simulation of intense organized convective precipitation observed during the Arabian Sea Monsoon Experiment (ARMEX). J. Geophys. Res. Atmos. 2007, 27, 112. [Google Scholar] [CrossRef] [Green Version]
  25. Pradhan, P.K.; Dasamsetti, S.; Ramakrishna, S.S.; Dodla, V.B.; Panda, J. Mesoscale simulation of off-shore trough and mid-tropospheric cyclone associated with heavy rainfall along the West Coast of India using ARMEX Reanalysis. Int. J. Earth Atmos. Sci. 2015, 2, 1–15. [Google Scholar]
  26. Dodla, V.B.; Ratna, S.B. Mesoscale characteristics and prediction of an unusual extreme heavy precipitation event over India using a high resolution mesoscale model. Atmos. Res. 2010, 95, 255–269. [Google Scholar] [CrossRef]
  27. Rao, Y.P. South West Monsoon. In Meteorological Monograph: Synoptic Meteorology; Indian Meteorological Deptartmant: Delhi, India, 1976. [Google Scholar]
  28. Kumar, S.; Bhat, G.S. Vertical structure of orographic precipitating clouds observed over south Asia during summer monsoon season. J. Earth Syst. Sci. 2017, 126, 114. [Google Scholar] [CrossRef] [Green Version]
  29. Findlater, J. Interhemispheric transport of air in the lower troposphere over the western Indian Ocean. Q. J. R. Meteorol. Soc. 1969, 95, 400–403. [Google Scholar] [CrossRef]
  30. Miller, F.R.; Keshavamurthy, R.N. Structure of an Arabian Sea Summer Monsoon System. In International Indian Ocean Meteorological Monographs; East–West Center Press: Honolulu, HI, USA, 1968; Volume 1, 94p. [Google Scholar]
  31. Krishnan, R.; Sundaram, S.; Swapna, P.; Kumar, V.; Ayantika, D.C.; Mujumdar, M. The crucial role of ocean-atmosphere coupling on the Indian monsoon anomalous response during dipole events. Clim. Dyn. 2011, 37, 1–17. [Google Scholar] [CrossRef]
  32. Raman, M.; Ratnam, M.V.; Rajeevan, M.; Rao, V.V.J.; Rao, S.V. Intriguing Aspects of the Monsoon Low-Level Jet over Peninsular India Revealed by High-Resolution GPS Radiosonde Observations. J. Atmos. Sci. 2011, 68, 1413–1423. [Google Scholar] [CrossRef]
  33. Houze, R.A., Jr.; Wang, J.; Fan, J.; Brodzik, S.; Feng, Z. Extreme convective storms over high-latitude continental areas where maximum warming is occurring. Geophys. Res. Lett. 2019, 46, 4059–4065. [Google Scholar] [CrossRef] [Green Version]
  34. Kothawale, D.R.; Deshpande, N.R.; Kolli, R.K. Long Term Temperature Trends at Major, Medium, Small Cities and Hill Stations in India during the Period 1901–2013. Am. J. Clim. Chang. 2016, 5, 383–398. [Google Scholar] [CrossRef] [Green Version]
  35. Mitra, A.K.; Bohra, A.K.; Rajeevan, M.N.; Krishnamurti, T.N. Daily Indian precipitation analysis formed from a merge of rain-gauge data with the TRMM TMPA satellite-derived rainfall estimates. J. Meteorol. Soc. Jpn. Ser. II 2009, 87, 265–279. [Google Scholar] [CrossRef] [Green Version]
  36. Indian Meteorological Department. End of Session Report for the 2018 Southwest Monsoon; Indian Meteorological Department Report; Indian Meteorological Department: New Delhi, India, 2018.
  37. Dee, D.P.; Uppala, S.M.; Simmons, A.J.; Berrisford, P.; Poli, P.; Kobayashi, S.; Andrae, U.; Balmaseda, M.A.; Balsamo, G.; Bauer, P.; et al. The ERA-Interim reanalysis: Configuration and performance of the data assimilation system. Q. J. R. Meteorol. Soc. 2011, 137, 553–597. [Google Scholar] [CrossRef]
  38. Central Water Commission. Kerala Floods of August 2018; CWC Study report; Central Water Commission, Hydrological Studies Organisation, Hydrology (S) Directorate, Government of India: New Delhi, India, 2018; p. 48. [Google Scholar]
  39. Francis, P.A.; Gadgil, S. Intense rainfall events over the west coast of India. Meteorol. Atmos. Phys. 2006, 94, 27–42. [Google Scholar] [CrossRef]
  40. Yang, S.; Cui, X.; Ran, L. Analyses of dry intrusion and instability during a heavy rainfall event that occurred in Northern China. Atmos. Ocean. Sci. Lett. 2009, 2, 108–112. [Google Scholar]
  41. Joseph, P.V.; Raman, P.L. Existence of low level westerly jet-stream over peninsular India during July. India J. Meteorol. Geophys. 1966, 17, 407–410. [Google Scholar]
  42. Fletcher, J.K.; Parker, D.J.; Turner, A.G.; Menon, A.; Martin, G.M.; Birch, C.E.; Mitra, A.K.; Mrudula, G.; Hunt, K.M.R.; Taylor, C.M.; et al. The dynamic and thermodynamic structure of the monsoon over southern India: New observations from the INCOMPASS IOP. Q. J. R. Meteorol. Soc. 2018, 1–24. [Google Scholar] [CrossRef]
  43. Saha, K.R. Air and water vapour transport across the equator in western Indian Ocean during northern summer. Tellus 1970, 22, 681–687. [Google Scholar] [CrossRef]
  44. Basu, S.; Ramesh, K.J.; Begum, Z.N. Medium Range Prediction of Summer Monsoon Activities over India vis a vis Their Correspondence with the Observational Features. Adv. Atmos. Sci. 1999, 16, 133–146. [Google Scholar] [CrossRef]
  45. Raju, P.V.; Mohanty, U.C.; Bhatla, R. Interannual variability of onset of the summer monsoon over India and its prediction. Nat. Hazards 2007, 42, 287–300. [Google Scholar] [CrossRef]
  46. Trenberth, K.E.; Jones, P.D.; Ambenje, P.; Bojariu, R.; Easterling, D.; Klein Tank, A.; Parker, D.; Rahimzadeh, F.; Renwick, J.A.; Rusticucci, M.; et al. Observations: Surface and atmospheric climate change. In Climate Change 2007: The Physical Science Basis; Contribution of Working Group I to the Fourth Assessment Report of the Intergovernmental Panel on Climate Change; Parry, M.L., Canziani, O.F., Palutikof, J.P., van der Linden, P.J., Hanson, C.E., Eds.; Cambridge University Press: New York, NY, USA, 2007; pp. 235–336. [Google Scholar]
  47. Goswami, B.N.; Venugopal, V.; Sengupta, D.; Madhusoodanan, M.S.; Xavier, P. Increasing Trend of Extreme Rain Events over India in a Warming Environment. Science 2006, 314, 1442–1445. [Google Scholar] [CrossRef] [Green Version]
  48. Roxy, M.K.; Ghosh, S.; Pathak, A.; Athulya, R.; Mujumdar, M.; Murtugudde, R.; Terray, P.; Rajeevan, M. A threefold rise in widespread extreme rain events over central India. Nat. Comm. 2017, 8, 708. [Google Scholar] [CrossRef]
  49. Kumar, V.; Krishnamurti, T.N. Mesoscale modeling for the rapid movement of monsoonal isochrones. Atmos. Sci. Lett. 2015, 17, 78–86. [Google Scholar] [CrossRef] [Green Version]
  50. Nibumbh, A.C.; Chakraborty, A.; Bhat, G.S.; Frierson, D.M.W. Large-scale extreme rainfall producing synoptic systems of the Indian summer monsoon. Geophys. Res. Lett. 2020. [Google Scholar] [CrossRef]
  51. Boers, N. Complex networks reveal global pattern of extreme-rainfall teleconnections. Nature 2019. [Google Scholar] [CrossRef] [PubMed]
Figure 1. (a) Accumulated rainfall (mm, shaded), wind anomaly (850 mb), and low-pressure system (LPS) track (blue line) over India during 13–18 August 2018, where the dark dashed line represents the mean positions of monsoon depressions. (b) Kerala state derived from Indian Meteorological Society (IMD) + Global Precipitation Measurement (GPM) merged products at a 25 km resolution for 13–17 August 2018. (c) Daily area-averaged rainfall (mm) over the Kerala state (8° N–13° N and 74° E–78° E) during August 2018. (d) Different station rainfall over Kerala derived from an IMD rain gauge during 03 UTC 15–16 August 2018 (stations with <7 cm of rainfall are ignored). In all the figures “Aug” is used as the short form of “August”.
Atmosphere 11 00740 g001aAtmosphere 11 00740 g001b
Figure 2. Accumulated total rainfall (shaded; mm·d−1), mean sea level pressure (contours), and wind flow pattern at the 600 hPa level valid at 00 UTC on (a) 13 August, (b) 14 August, (c) 15 August (d) 16 August, (e) 17 August, and (f) 18 August 2018 derived from ERA-Interim reanalysis at 25 km resolutions. Dashed green lines indicate the position of the offshore trough.
Atmosphere 11 00740 g002
Figure 3. Wind speed (shaded; ms−1) and direction at (a) 850, (b) 700, (c) 500, and (d) 300 hPa levels valid at 00 UTC on (a) 13 August, 2018; similarly, (eh, il, mp and qt) present the 14, 15, 16, and 17 August 2018 data derived from ERA-Interim reanalysis at 25 km resolutions.
Atmosphere 11 00740 g003
Figure 4. (a) 850 hPa daily variation of kinetic energy (m2s−2) over the Arabian Sea (50° E–72.5° E; 5° N–15° N; in black), Bay of Bengal (BoB) (82.5° E–97.5° E; 5° N–15° N; in red), and Indian landmass (72.5° E–82.5° E; 5° N–15° N; in blue) were derived from ERA-Interim reanalysis for 00 UTC of 8–21 August 2018, as were (b) the net tropospheric moisture (NTM; gm kg−1) and (c) mean tropospheric temperature (MTT; °K).
Atmosphere 11 00740 g004aAtmosphere 11 00740 g004b
Figure 5. (ac) 24-h accumulated rainfall (mm·d−1) distributions valid at 0300 UTC on 14 August 2018, 0300 UTC on 15 August 2018, and 0300 UTC on 16 August 2018, respectively, derived from IMD + TRMM merged analysis. Figure (df,gi) is the same as (ac), but for convective and large-scale stratiform precipitation (mm·d−1 ERA-Interim reanalysis), respectively. Both the datasests used 25 km resolutions.
Atmosphere 11 00740 g005
Figure 6. Total surface runoff (mm·d−1) distributions over the Kerala land region valid at 00 UTC on (a) 14 August, (b) 15 August, and (c) 16 August 2018 derived from ERA-Interim reanalysis at 25 km resolutions; both Figure (df) and (gi) are the same as (ac), but for temperature (°C) and evaporation (mm·d−1), respectively.
Atmosphere 11 00740 g006
Figure 7. (ac) Longitudinal and pressure level cross-section of the relative humidity (%; shaded), temperature anomaly (°K; blue contour), and wind flow pattern (ms−1) along the coast of the Arabian Sea at 10.5° N valid at 00 UTC on 14–16 August 2018; (df) are the same as (ac), but for the cross-section over the east coast of BoB at 20.5° N derived from ERA-Interim reanalysis at a 25 km resolution.
Atmosphere 11 00740 g007
Figure 8. Pressure-time cross-section of the area averaged over Kerala and adjoining the Arabian Sea (9° N–12° N; 72° E–77° E): (a) Specific humidity anomaly (shaded; gm·kg−1) and vertical velocity (×100; m−1s; blue contour) at 00 UTC on 13–18 August 2018 derived from ERA-Interim reanalysis at 25 km resolutions. Figure (b) is the same as Figure (a), but shows area-averaged values of the low-pressure system over the Bay of Bengal (17.5° N–26° N; 72° E–88.5° E).
Atmosphere 11 00740 g008
Figure 9. The cloud liquid water content (shaded) and cloud ice water content (contour) horizontal (a) and vertical-cross section (b) valid at 00 UTC on 14 August 2018. Both (cd) and (ef) are the same as (ab), but are valid for 00 UTC 15–16 on August 2018 derived from ERA-Interim reanalysis at 25 km resolutions.
Atmosphere 11 00740 g009
Figure 10. Thenetwork of rivers, the elevation of the coastal region, and the location of four major reservoirs/dams in Kerala.
Atmosphere 11 00740 g010
Figure 11. (ad). The storage capacity of four reservoirs/dams in Kerala: (a) Kakki, (b) Periyar, (c) Idukki, and (d) Malampuzha.
Atmosphere 11 00740 g011
Figure 12. Interaction of the mid-tropospheric cold-dry air, off-shore trough, and low-pressure system over the Indian region during the Kerala Flood Event (KFE).
Atmosphere 11 00740 g012

