Article

The Study of Emission Inventory on Anthropogenic Air Pollutants and Source Apportionment of PM2.5 in the Changzhutan Urban Agglomeration, China

1
Hunan Provincial Key Laboratory of Water Pollution Control Technology, Hunan Research Academy of Environmental Sciences, Changsha 410004, China
2
College of Resources and Environment, Hunan Agricultural University, Changsha 410128, China
*
Authors to whom correspondence should be addressed.
Atmosphere 2020, 11(7), 739; https://doi.org/10.3390/atmos11070739
Submission received: 27 May 2020 / Revised: 2 July 2020 / Accepted: 6 July 2020 / Published: 12 July 2020
(This article belongs to the Special Issue Air Pollution Estimation)

Abstract

:
As one of China’s emerging urban agglomerations, the Changzhutan urban area is suffering from regional composite air pollution. Previous studies mainly focus on single cities or world-class urban agglomerations, which cannot provide a scientific basis for air pollution in emerging urban agglomerations. This paper proposes the latest high-resolution emission inventory through the emission factor method and compares the results with the rest of the urban agglomeration. The emission inventory shows that the estimates for sulfur dioxide (SO2), nitrogen oxides (NOX), particulate matter 10 (PM10), particulate matter 2.5 (PM2.5), volatile organic compounds (VOCs), and ammonia (NH3) emission are 132.5, 148.9, 111.6, 56.5, 119.0, and 72.0 kt, respectively. From the 3 × 3 km emission grid, the spatial difference of air pollutant emissions in the Changzhutan urban agglomeration was more obvious, but the overall trend of monthly pollutant discharge was relatively stable. Depending on the source apportionment, SO42−, OC, and NO3 are the main chemical constituents of PM2.5, accounting for 13.06, 8.24, and 4.84 μg/m3, respectively. Simultaneously, industrial emissions, vehicle exhaust, and dust are still three main sources that cannot be ignored. With the support of these data, the results of this study may provide a reference for other emerging urban agglomerations in air quality.

Graphical Abstract

1. Introduction

With the effective management of traditional pollution, the continuous expansion of urban areas, and the long-distance transmission of atmospheric pollution, the characteristics of regional composite air pollution is gradually emerging. Analysis of pollution sources is the precondition for the treatment of regional composite air pollution. The emission inventory method can demonstrate the spatial–temporal distribution of air pollutants emissions in various regions and accurately simulate the atmospheric environmental quality of the region [1]. Therefore, establishing an air pollution source information database and constructing a key pollution source spectrum are of major practical significance for comprehensively grasping regional environmental pollution characteristics and improving regional environmental quality. As one of the economic engines in Central China, the Changzhutan (CZT) urban agglomeration is famous for the metallurgical and chemical industry in China, which may inevitably lead to the deterioration of urban and regional atmospheric quality.
Air pollutant emission inventory is a crucial basis for pollutant emission control and management. It contributes to establishing an air quality model and provide guidance for decision-makers by supplying information on pollutant emission sources and their characteristics. Over the past ten years, considerable emission inventories have been established covering Asia [2], Europe [3], and America [4]. These studies focus more on the primary air pollutants including NOX, SO2, NH3, etc. In China, the air pollutant emission inventory has also been developed widely. Hao has established a NOx emission inventory utilizing energy consumption over the past decade [5]. Cao and Chen estimate the emission inventory of aerosols throughout China [6,7]. Qiang (2007) has classified the emission of particulate into three size ranges by a technology-based emission inventory approach [8]. After that, more studies have begun to consider volatile organic compounds (VOCs) emission in China due to its potential formation of ozone [9,10].
At present, the research areas of emission inventory are mainly concentrated on single cities or world-class city clusters. These studies cannot provide regional composite air pollution data support or technical assistance for the newly developed urban agglomeration. The CZT urban agglomeration is the first urban agglomeration in China to conduct regional economic integration experiments spontaneously in the early 21st century. It is a typical representative of the newly emerging urban agglomeration in the Yangtze River Economic Belt. Studying the emission inventory and source apportionment of particulate matter 2.5 (PM2.5) of CZT urban agglomeration can provide new ideas for other emerging urban agglomerations.
This paper focuses on creating an air pollutant emission inventory of the CZT urban agglomeration (the primary agglomeration for economic development) based on the year 2015. Air pollutants studied in this research include sulfur dioxide (SO2), nitrogen oxides (NOX), particulate matter 10 (PM10), particulate matter 2.5 (PM2.5), volatile organic compounds (VOCs), and ammonia (NH3). Utilizing the main pollution source emission inventory treatment model, we established an air pollution source emission inventory platform serving the total atmospheric pollutant control and air quality simulation of typical regional industries. At the same time, our findings in CZT urban agglomeration can provide data support and theoretical basis for other emerging urban agglomerations to explore development governance and improve urban air quality.

2. Materials and Methods
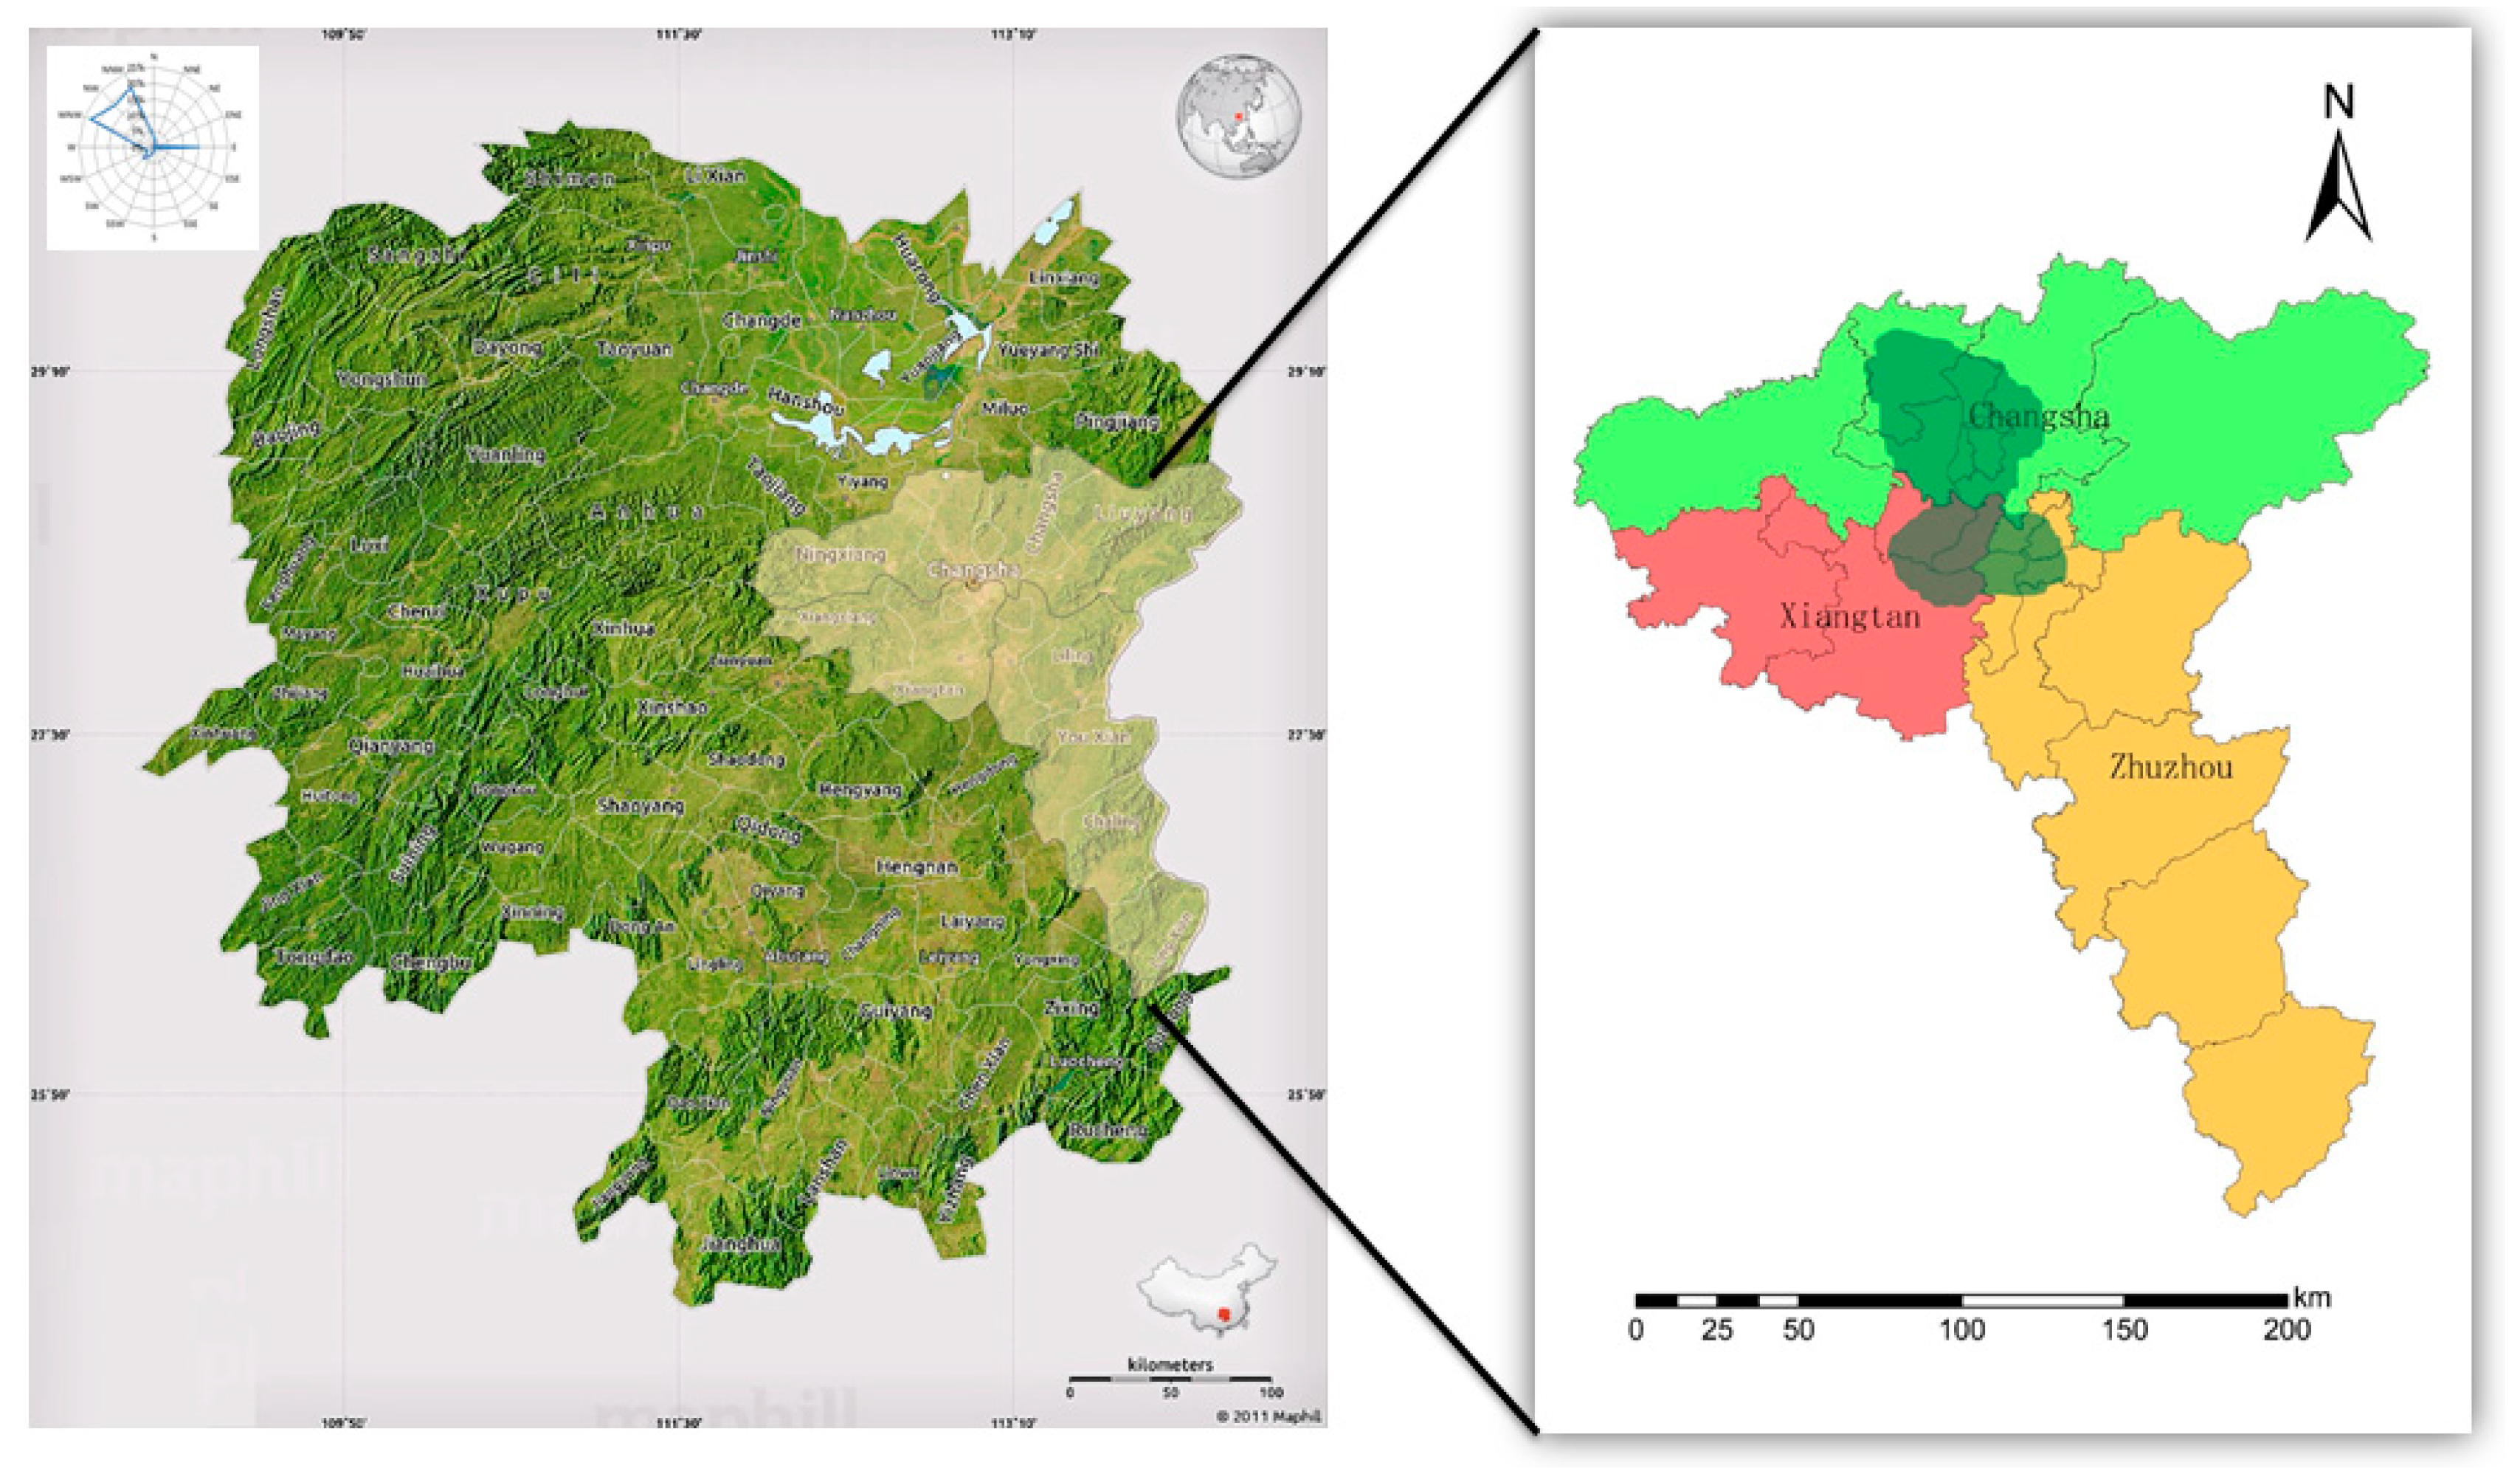
2.1. Study Domain

The CZT urban agglomeration lies in the central-eastern part of Hunan Province, consisting of Changsha, Zhuzhou, and Xiangtan. It is located at 111°53′ E–114°15′ E and 26°03′ N–28°41′ N (see Figure 1). Owing to its central position in South China, this region is not only worked as a transportation junction but also regarded as an engine of Central China. The terrain is low in the northwest and high in the southeast. Additionally, this region is surrounded by mountains on three sides. Hence, this region is prone to suffering from heavy air pollution during a pollution episode.

2.2. Methodology

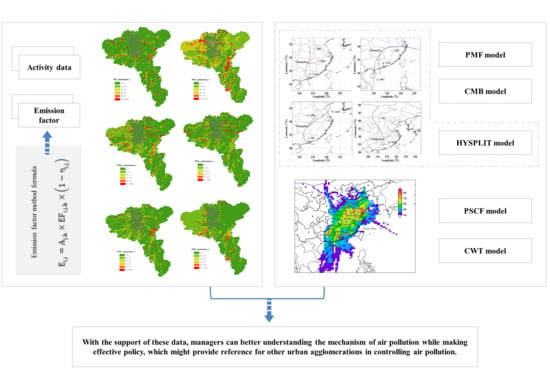
2.2.1. Emission Inventory Methods

This study considers six conventional air pollution sources(SO2, NOX, PM10, PM2.5, VOCs, and NH3). The research methods in this paper mainly refer to Kurokawa [1], including the emission factor method used to estimate the emission value and the Monte Carlo method to analyze the uncertainty. According to the actual situation of the air pollution source and emission factor method, we divide our emission sources into 4 levels, including 10 major industries (i.e., stationary fuel combustion source, process source, mobile source, solvent source, agricultural source, dust source, biomass combustion source, storage and transportation sources, waste treatment source, and other sources). The detailed pollution source categories are summarized in Table S1.
Emission estimation using the emission factor method is achieved by Formula (1):
E i , j = A j , k × EF i , j , k × ( 1 η i , j )
where A is activity data; EF is the average emission factor; η is the removal efficiency of pollution control measures for pollutants; i, j, k represent the pollutant type, source category, and technology type, respectively.
In the process of quantitative estimation, the list of emission sources is usually calculated by selecting representative emission factors and activity level data. The uncertainty of emission factors is inevitable due to the lack of key data and the differences between various pollution sources. Therefore, it is important to quantitatively estimate the potential uncertainty of the emission inventory. The Monte Carlo method was used to quantify the emission uncertainty of each pollution source. This method relies on repeated and random sampling to obtain results. Within the 95% confidence interval, 10,000 tests were conducted to calculate the emission range. The input parameters of each pollution source refer to the studies of other scholars.

2.2.2. Source Apportionment Methods

The Chemical Mass Balance model (CMB) and the Positive Matrix Factorization model (PMF) are the most widely used source resolution receptor models [11]. These two models can start from the receptor and estimate the contribution value of various pollution sources to the receptor based on the physical and chemical characteristics of VOCs in the atmospheric environment. In addition, for regional transmission characteristics, the mixed single-particle Lagrangian ejector model (HYSPLIT) was applied to calculate the atmospheric trajectory, revealing the air mass motion of PM2.5 in the CZT urban agglomerations. The whole research area was divided into a 0.5° × 0.5° grid, and the potential source contribution factor (PSCF) and concentration weight trajectory (CWT) analysis by the MeteoInfo method were used to semi-quantitatively analyze the PM2.5 emission source intensity. Cij is a numerical value calculated by the model, representing the concentration of the value of ingredient in the grid i × j, which can be used to explain the influence of the air volume of grid i × j on the concentration of pollutants. Models used in this study are described in the supplementary information Table S2.

2.3. Activity Data

We used eight major data sources to ensure the refinement of emission inventory data, including longitude/latitude coordinates of pollution sources, product types, fuel categories, technical processes, and pollution control measures. These data cover the vast majority of the required activity level, and the sources of these data used for the CZT inventory are summarized in Table S3. Moreover, the PM2.5 concentration data comes from the automatic air monitoring station of the Hunan Environmental Protection Agency. The source spectrum data required by the CMB model comes from the study by You [12]. The uncertainty required by the PMF model was obtained by fitting the system formula in the model.

3. Results and Discussion

3.1. Emission Factor

This study used the emission factor method, which requires the collection of localized emission factors. The Chinese emission inventory was mostly based on foreign emission factors in the past. The difference in actual development has made these databases unable to adapt to the CZT urban agglomeration. It is necessary to select appropriate emission factors from the literature based on the current situation of pollution in CZT urban agglomeration to ensure the accuracy of data estimation. This study summarized the emission factor database suitable for CZT urban agglomeration. The emission factors of SO2, NOX, PM (PM10, PM2.5), VOCs, and NH3 come from the latest literature. Domestic measurement or related research should be given priority in this study. Unspecified emission factors refer to the AP-42 database [13] and the CORINAIR (Core Inventory of Air Emissions) database. The general description of our selection or estimation of specific emission factors is described below.

3.1.1. SO2

SO2 is mainly derived from the combustion of sulfur-containing fuels in power plants and heating plants. This study is based on this feature to update the emission factor database. Among them, Lei [14] and Zhao [15] explore the emission factors of process sources, including the cement and chemical industries that cannot be ignored. The biomass combustion source is also an important source of SO2. Li [16], Wang [17], Jetter [18], and Shen [19] have tested the emission characteristics of domestic household biomass stoves. The pollution emission factor of straw open burning is studied by Li [16]. As for the forest fires and grassland fires section, this study refers to the authoritative data of Andreae and Merlet [20].

3.1.2. NOX

There are many types of NOX, and the main causes of atmospheric pollution are NO and NO2. Combined with the measured data, the AP-42 database and the CORINAIR database can cover most of the NOX emission sources. But for the mobile source, the emission factor of the research in this study can be further localized. The emission factors of mobile sources are mostly from the researches by Liu [21], Zhang [22], Zhou [23], and Hu [24], who have measured the typical urban vehicles in China. Fu [25] has used the latest portable emission measurement system (PENS) to audit a large number of localized emission factors.

3.1.3. PM (PM10 and PM2.5)

The anthropogenic sources of PM are mainly fuel combustion processes, various industrial process emissions, and vehicle emissions. For most sources, their emission factors are consistent with the sources above. Through research on pollutant emissions in Hunan, we find that the dust source also provides a certain contribution rate. This study directly refers to the Urban Air Pollutant Emission Inventory Weaving Technical Manual.

3.1.4. VOCs

The VOCs emission factors for stationary fuel combustion sources are from Bo [26]. The solvent content of some products is limited by Chinese national standards, such as GB18581-2009 (wood coating), GB18582-2008 (interior wall coating), and HBC12-2003 (decorative adhesives), etc., and specific emission factors can be collected in these national standards. The studies by Wei [27] and Fu [28] can cover products outside national standards. Other sources of emissions refer to the categories of emissions that are not included in the above categories, especially the catering fume. After consulting the manual, the VOCs emission factor corresponding to the catering fume is 0.0095 g/(person·d).

3.1.5. NH3

Agricultural sources are the main sources of NH3 emissions. Most of the data come from the study by You [12] and also refers to some Chinese local research [22,29]. Waste treatment source is also a source of NH3 that cannot be ignored. The NH3 produced by the sewage treatment project uses the emission factor recommended by GBT32150. Landfill and incineration emission factors are based on the study by You [12]. The emission factor for flue gas denitration comes from the technical guidelines of the Ministry of Environmental Protection.

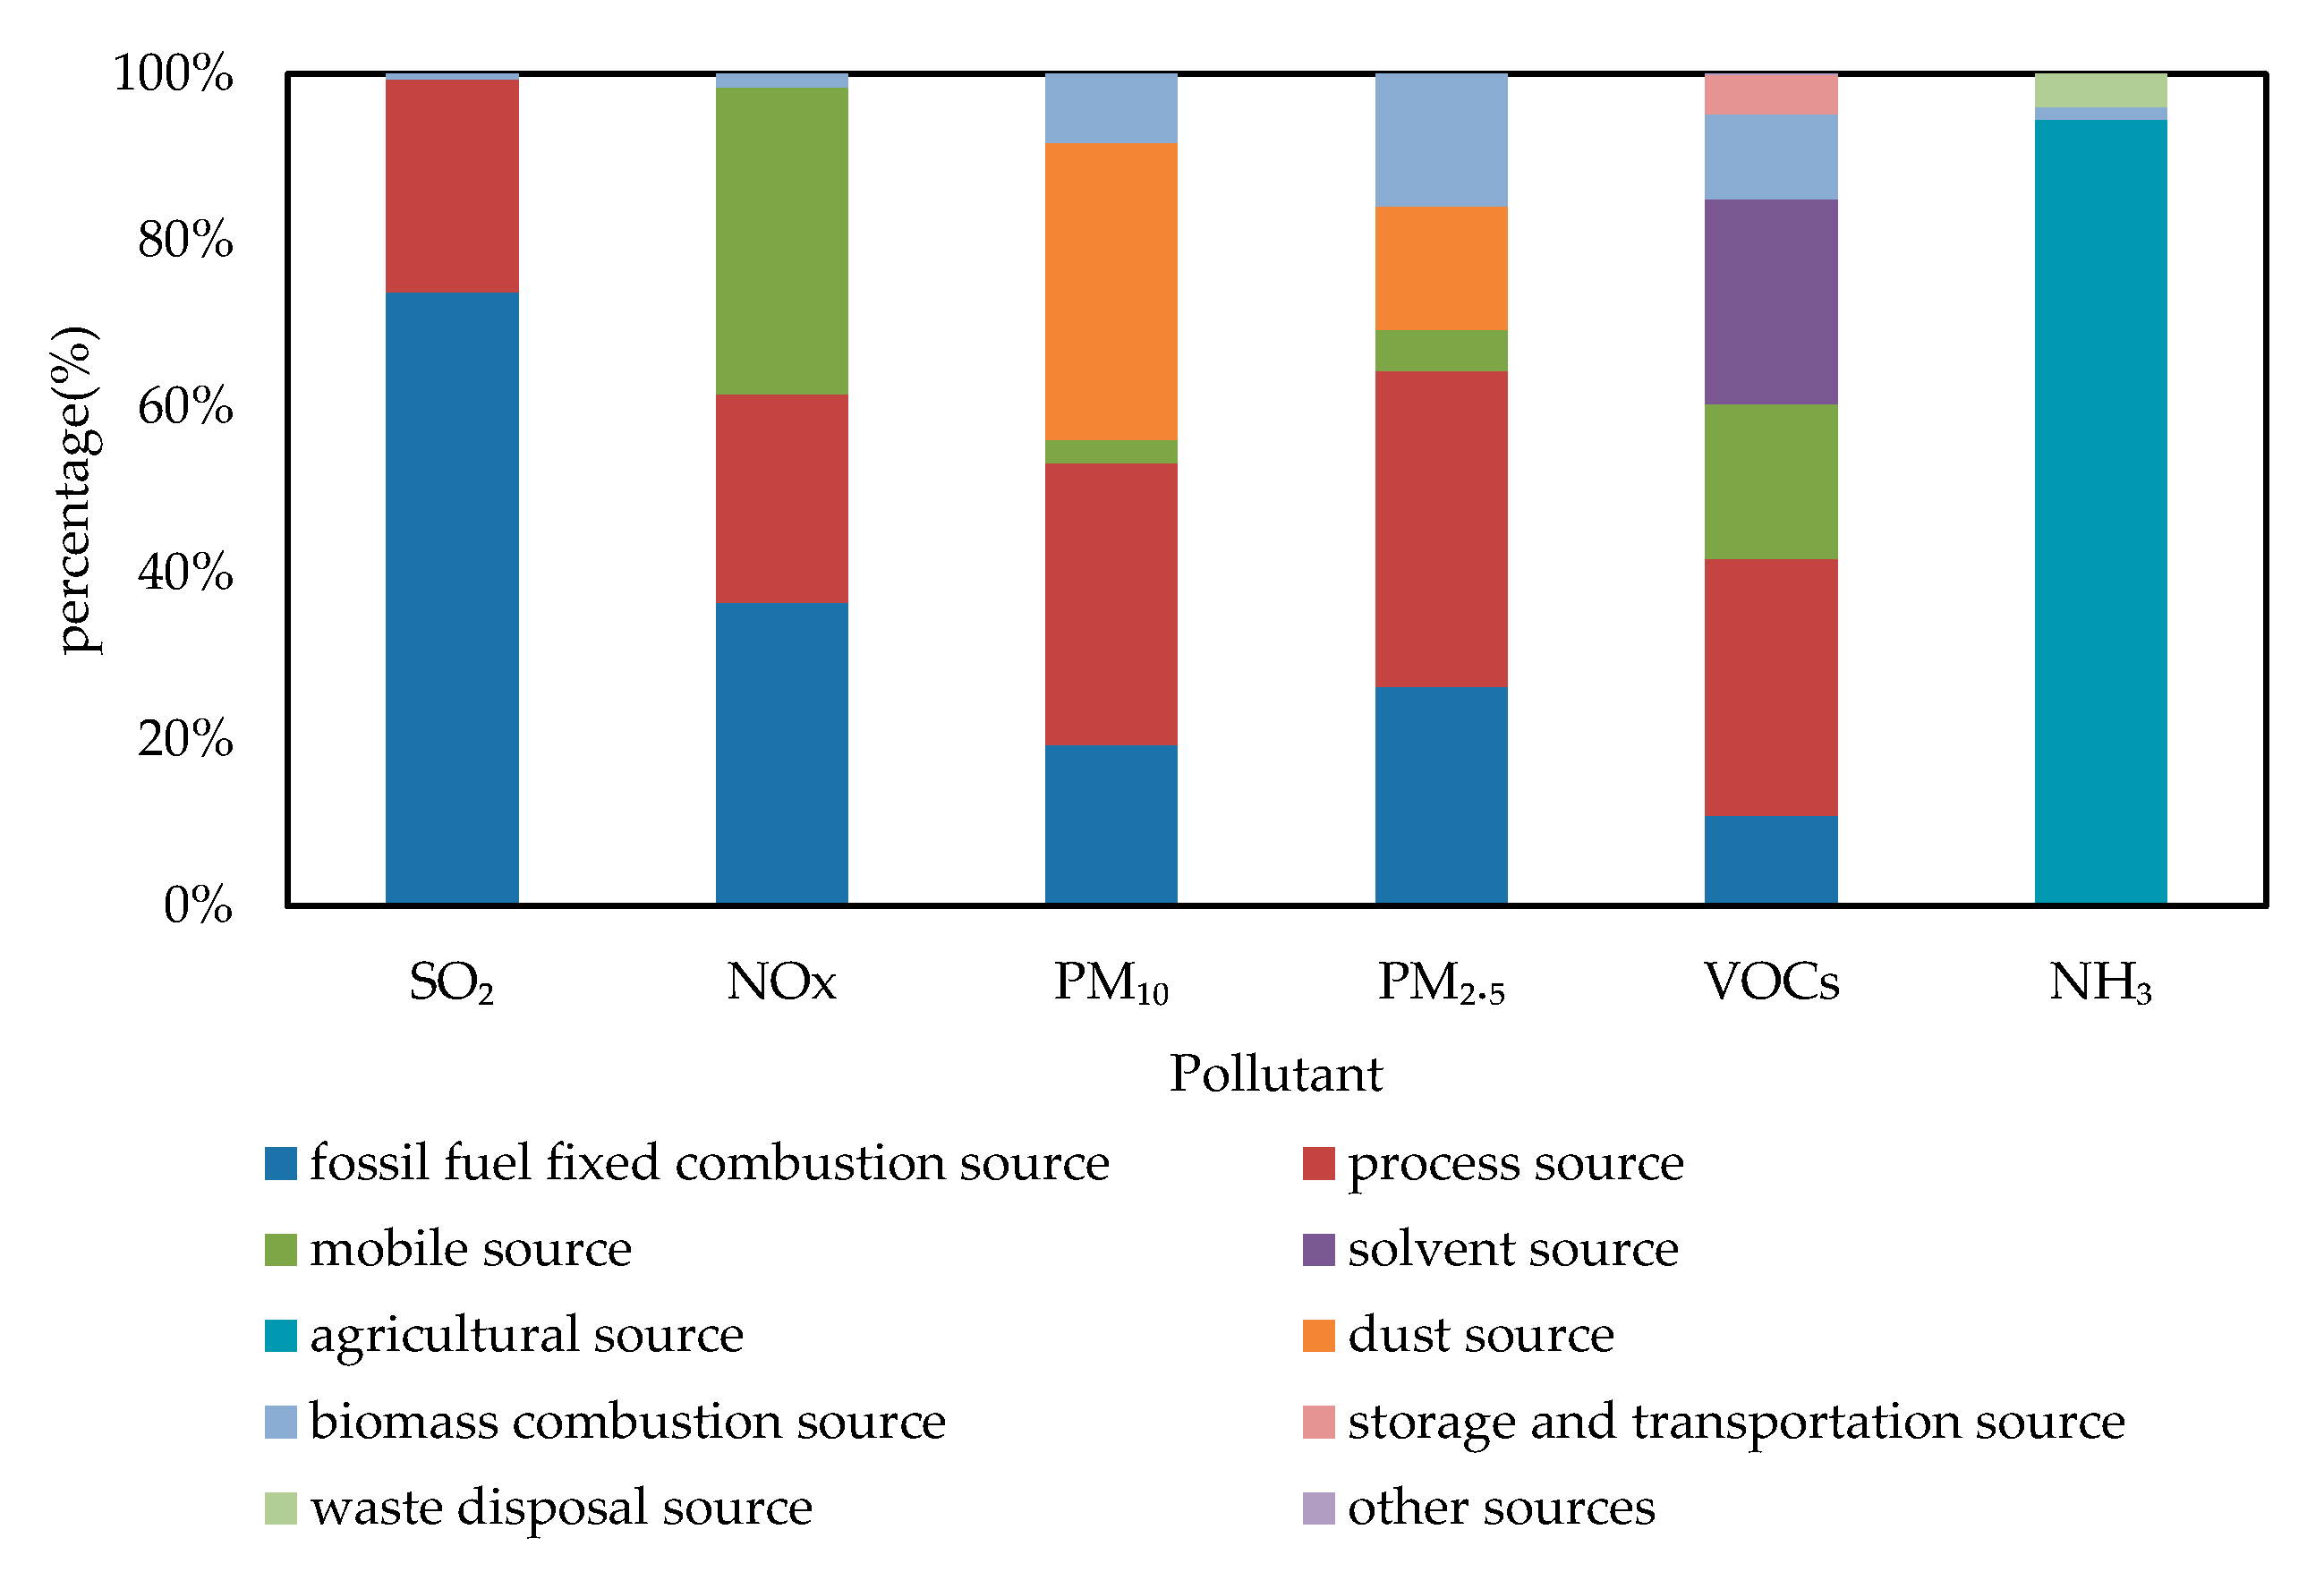
3.2. Air Pollutant Emissions Status

Table 1 summarizes the anthropogenic emission inventory for the 2015 CZT urban agglomeration. The total emissions of SO2, NOX, PM10, PM2.5, VOCs, and NH3 are 132.5, 148.9, 111.6, 56.5, 119.0, and 72.0 kt, respectively.
Figure 2 shows the emission contributions of 10 source categories in the CZT urban agglomeration. Stationary fuel combustion source and process source are the main sources of SO2, contributing 73.75% and 25.61%, respectively, to the total emissions. The largest contribution of NOX emissions is from the mobile source (39.45%) and stationary fuel combustion source (34.91%). It is worth mentioning that the car is the main source of nitrogen oxides and particulate matter on the road. Among them, the truck discharge contribution rate is twice that of the passenger car. Therefore, reducing the number of cars effectively plays a significant role in controlling NOX emission. In addition, thermoelectric production also contributes to the formation of NOX. The process source is the primary source of PM10 and PM2.5, contributing 35.12% to the emission, followed by the dust source (about 26.63%). When it comes to the industrial sectors, the emissions from building materials production and ferrous metal smelting take up nearly 76.86% of the total industrial emission. The process source and solvent source account for 30.17% and 24.10% to VOCs emissions. So far, an increasing number of researchers have begun to study VOCs, and the results show that VOCs are not only harmful to human health, but also have a significant impact on the Earth’s climate [30]. NH3 emission differs from other sources of pollution. The contribution of agricultural sources to NH3 emission is so large that other sources are nearly negligible. Among agricultural sources, NH3 emission from livestock and poultry accounts for 62.55%, and the rest is basically from fertilizer usage (31.73%).

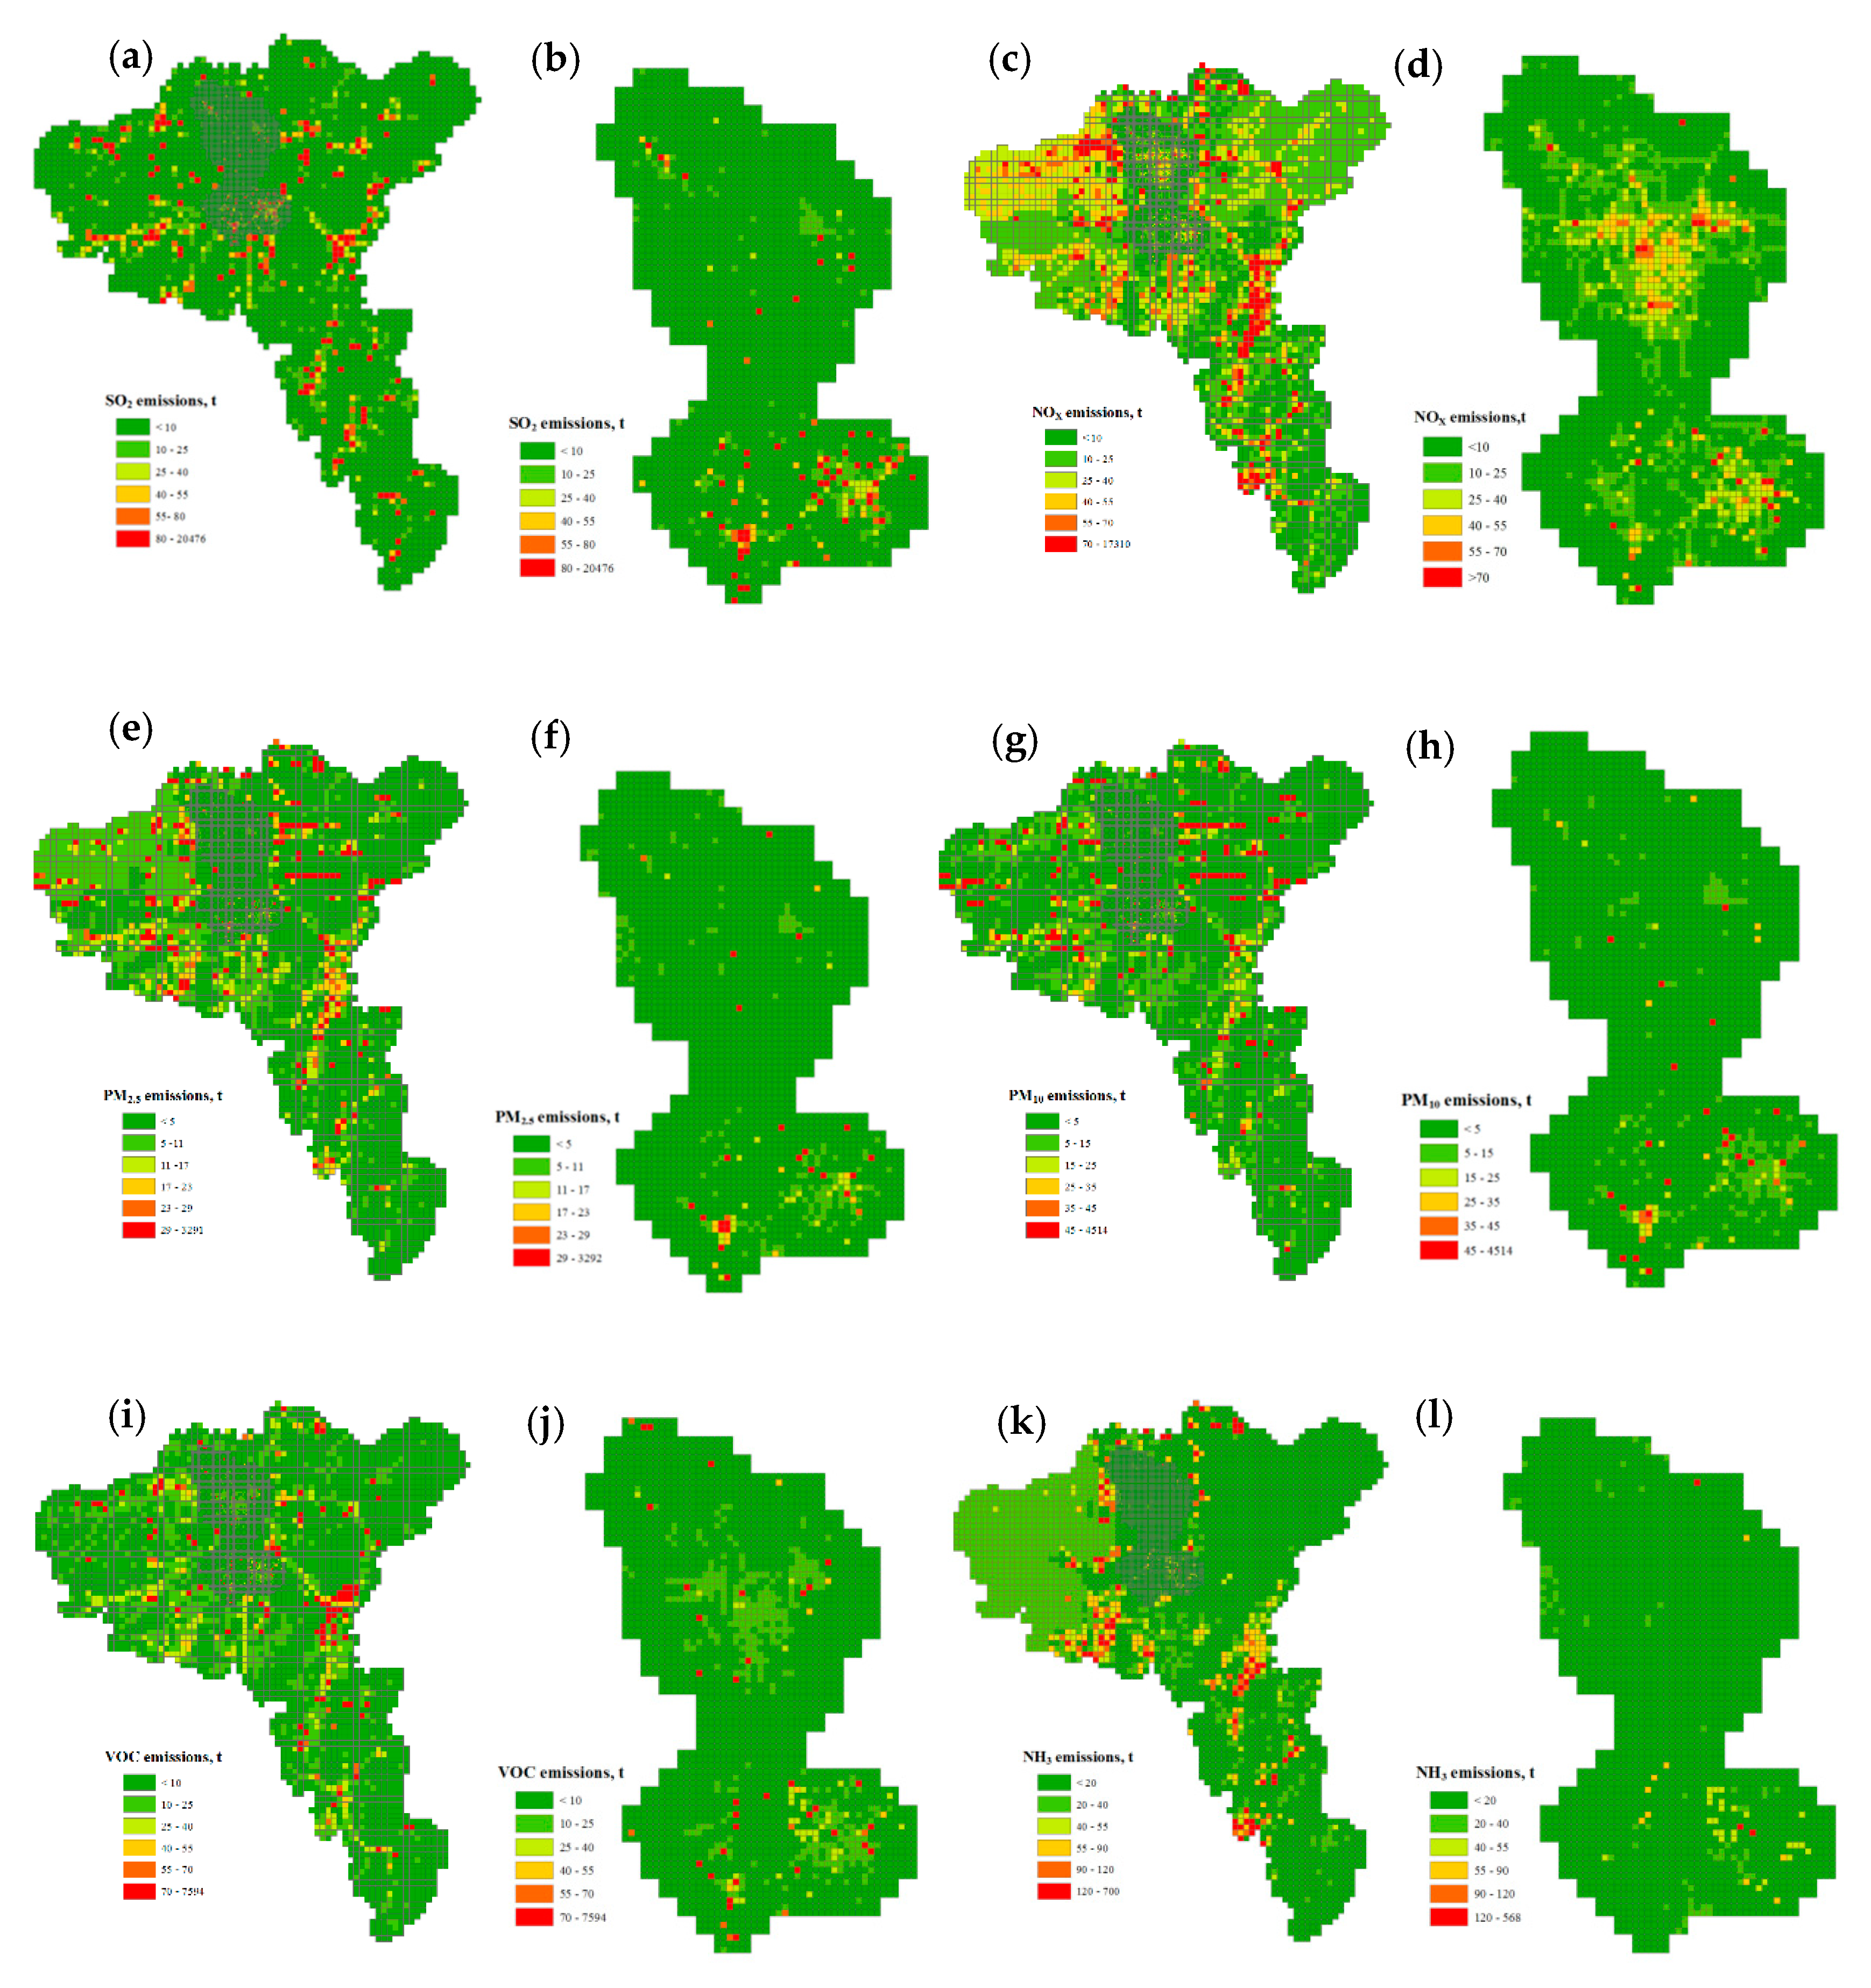
3.3. Spatial-Temporal Distribution Of Air Pollutants

We divided the emission inventory grid into a 3 × 3 km with the application of the air quality model. Furthermore, we elevated the resolution within the core areas of the CZT urban agglomeration to a 1 × 1 km grid (see Figure 3), where has a concentrated population and a high level of industrial production. There are great spatial differences in the distribution of SO2 in CZT urban agglomeration. On the whole, the SO2 emission in Zhuzhou and Xiangtan is higher than that in Changsha, which may be ascribed to the larger scale of industrial production in Zhuzhou and Xiangtan. Furthermore, NOX emission is not only from industrial activity, but also from mobile sources. The emission of nitrogen oxides from urban central areas and major highways is significantly higher. In highly developed areas with booming industry and transportation, NOX emission shows significant linearity and polygonal distribution. Overall, the spatial distribution of PM2.5 and PM10 is consistent. Counties like Ningxiang, Changsha, and Liuyang owning a large number of manufactories will emit more particulate matter, resulting in large regional emission. In addition, the emission intensity of particulate matter in the central area of CZT urban agglomeration is high due to a large number of construction sites for infrastructure in urban areas. VOCs emission also shows an obvious spatial distribution. For most regions, the VOCs emission in urban areas are higher than that in suburban and rural areas. This phenomenon is likely related to the larger traffic flow and population in urban areas. The usage of architectural coatings and decoration coatings are more frequent in urban areas, which can also contribute to the fugacity of VOCs. Other regions such as Liling, Xiangtan County distribute ceramics, chemicals, and other VOCs emissions enterprises. In addition, thermoelectric production and other large industrial coal-fired sources also have a larger emission grid. Unlike other sources, the distribution of NH3 emission areas is extremely uneven, and the large emission is mainly concentrated in Ningxiang County, Zhuzhou County, and other regions. In these areas, people rely heavily on farming and livestock breeding for living, so the amount of livestock and poultry feeding, nitrogen fertilizer application is relatively large, causing a high emission of NH3.
Figure 4 illustrates the monthly changes in the emission of major air pollutants in the CZT urban agglomeration. It can be seen from the figure that the monthly trend of pollutant discharge is relatively stable overall. Nevertheless, the monthly discharge of some pollutant’s peaks in autumn and winter. Among them, the concentration of SO2 reaches the highest in December, and NO2 emission reaches two peaks during July–August and November–December throughout the year. VOCs are found to peak in October, and the concentration of PM (PM10, PM2.5) rose rapidly in November. Generally, it is obvious that multiple pollutants peak in the autumn or winter. This may be caused by the following three points: firstly, heating in winter leads to the increase of coal consumption and the emission of a variety of air pollutants; secondly, the weather conditions in this period are not conducive to the spread of pollutants, resulting in constant deposition of pollutants; thirdly, the CZT urban agglomeration is surrounded by mountains on three sides. Atmospheric pollutants in the north migrate to the CZT urban agglomeration under the influence of the winter monsoon. The mountainous areas block the air mass and limit the diffusion of atmospheric pollutants. The accumulation of atmospheric pollutants in the CZT urban agglomeration causes a peak value. On the contrary, the peak of NH3 emission appears in the June–August, which probably relates to a sharp rise in temperatures in June. During this time, high temperatures will promote the breeding of livestock and increase the evaporation of NH3 in livestock and poultry, as observed in the study of Wang [31]. Besides, nitrogen fertilizer will be widely applied for crop planting, which can also contribute to the emission of NH3.

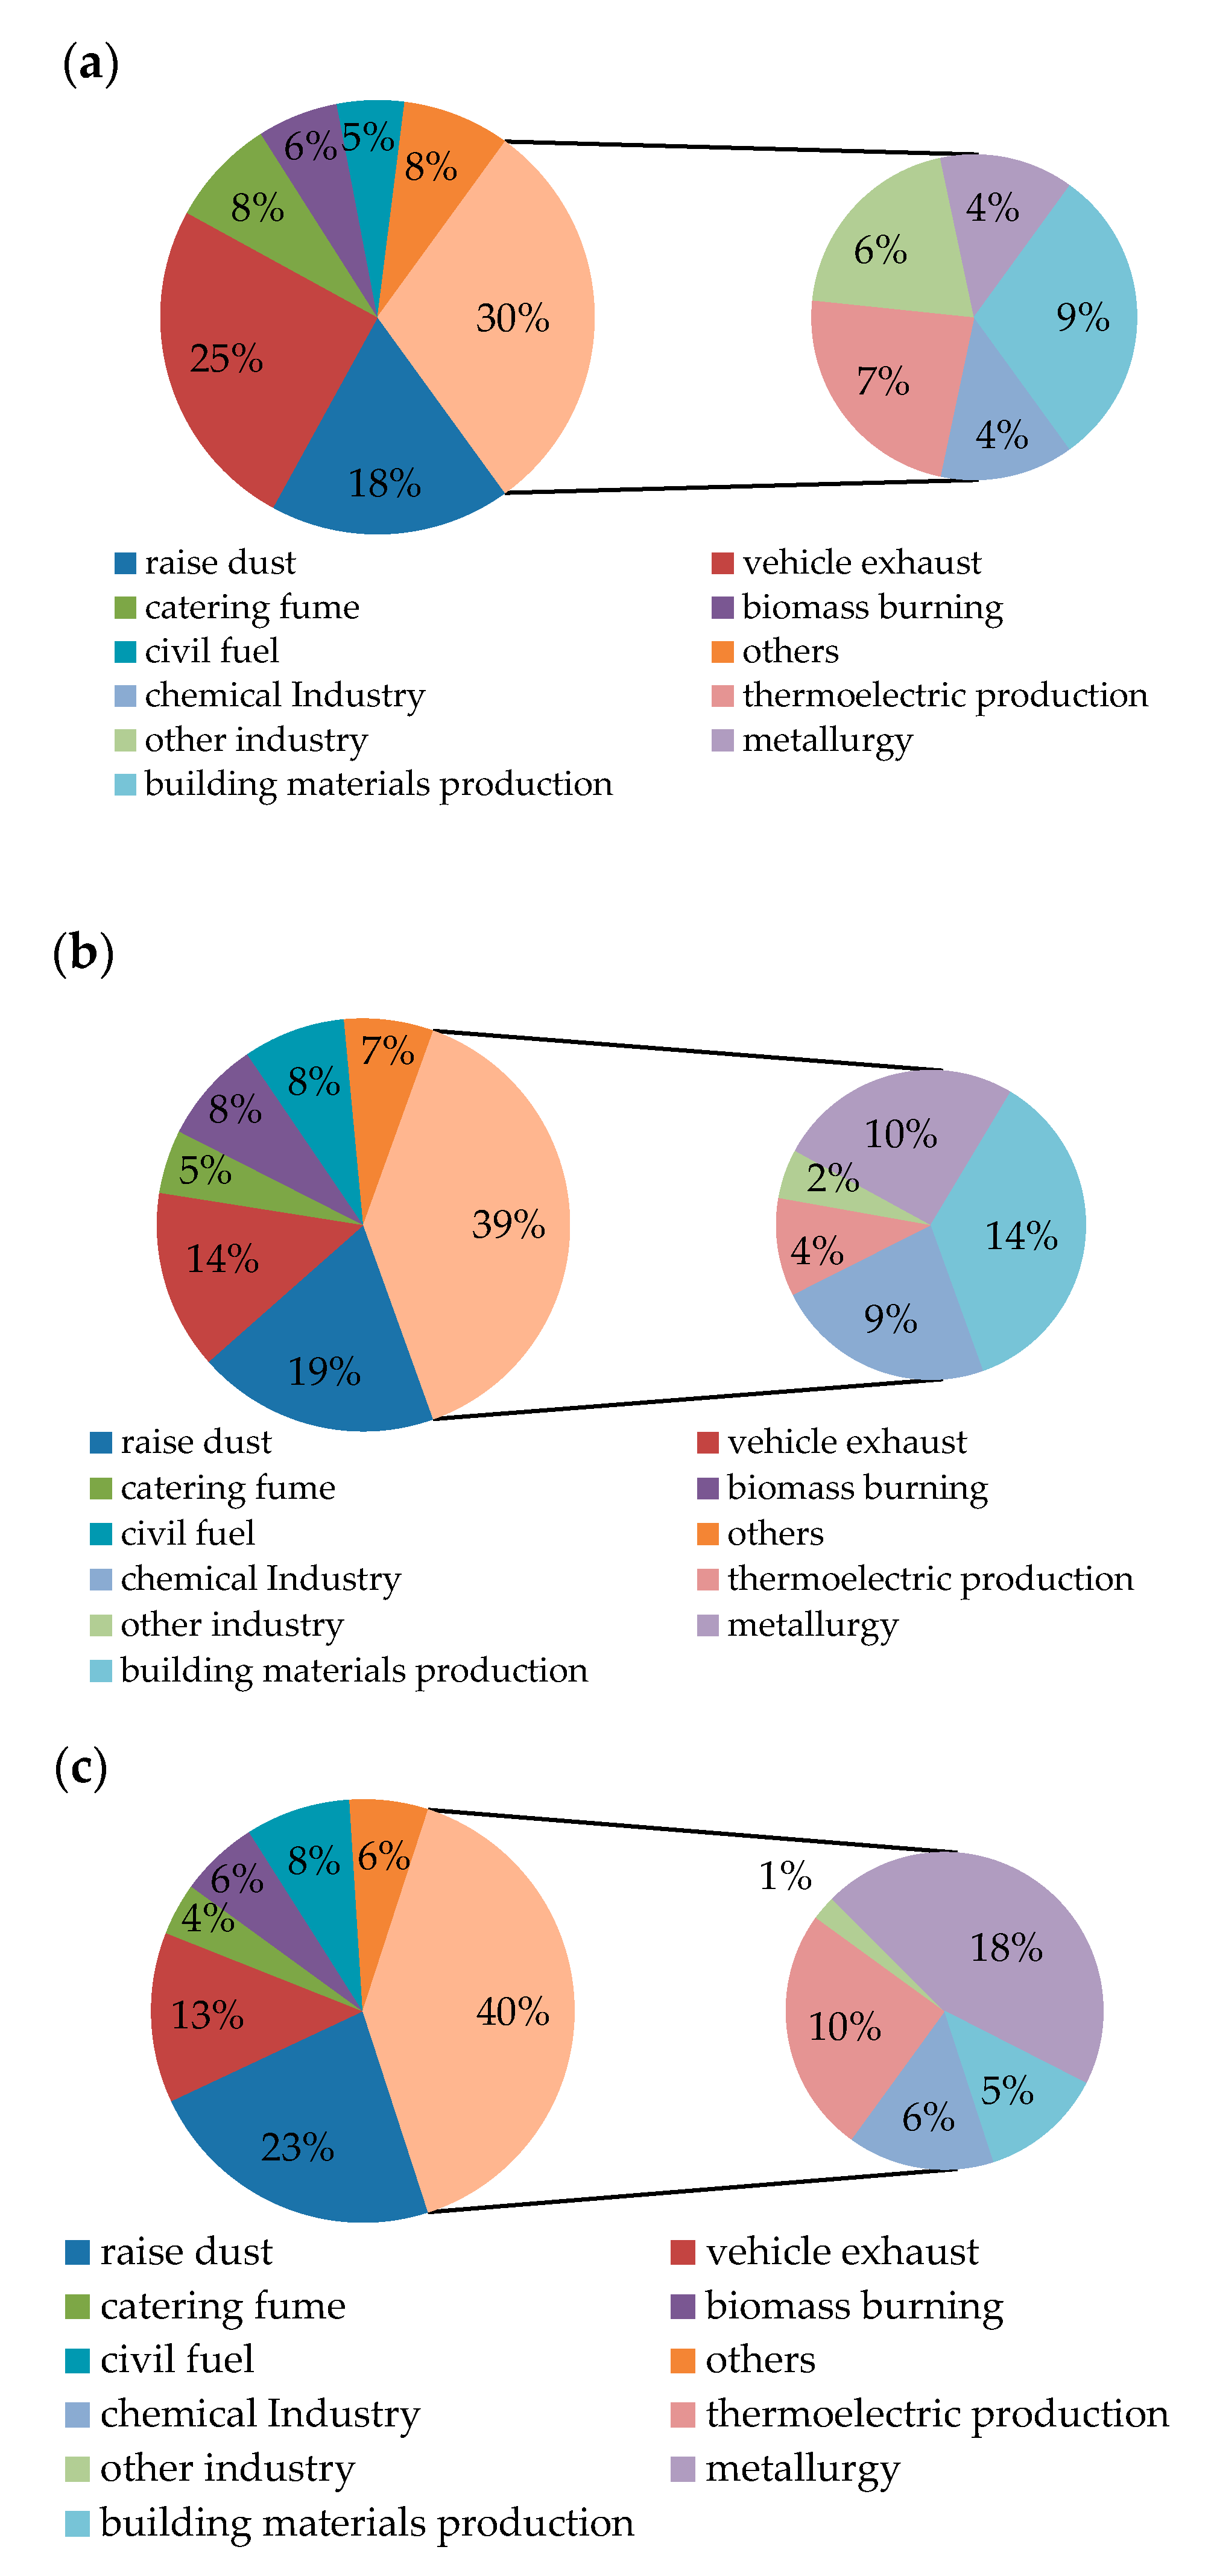
3.4. Source Apportionment of PM2.5

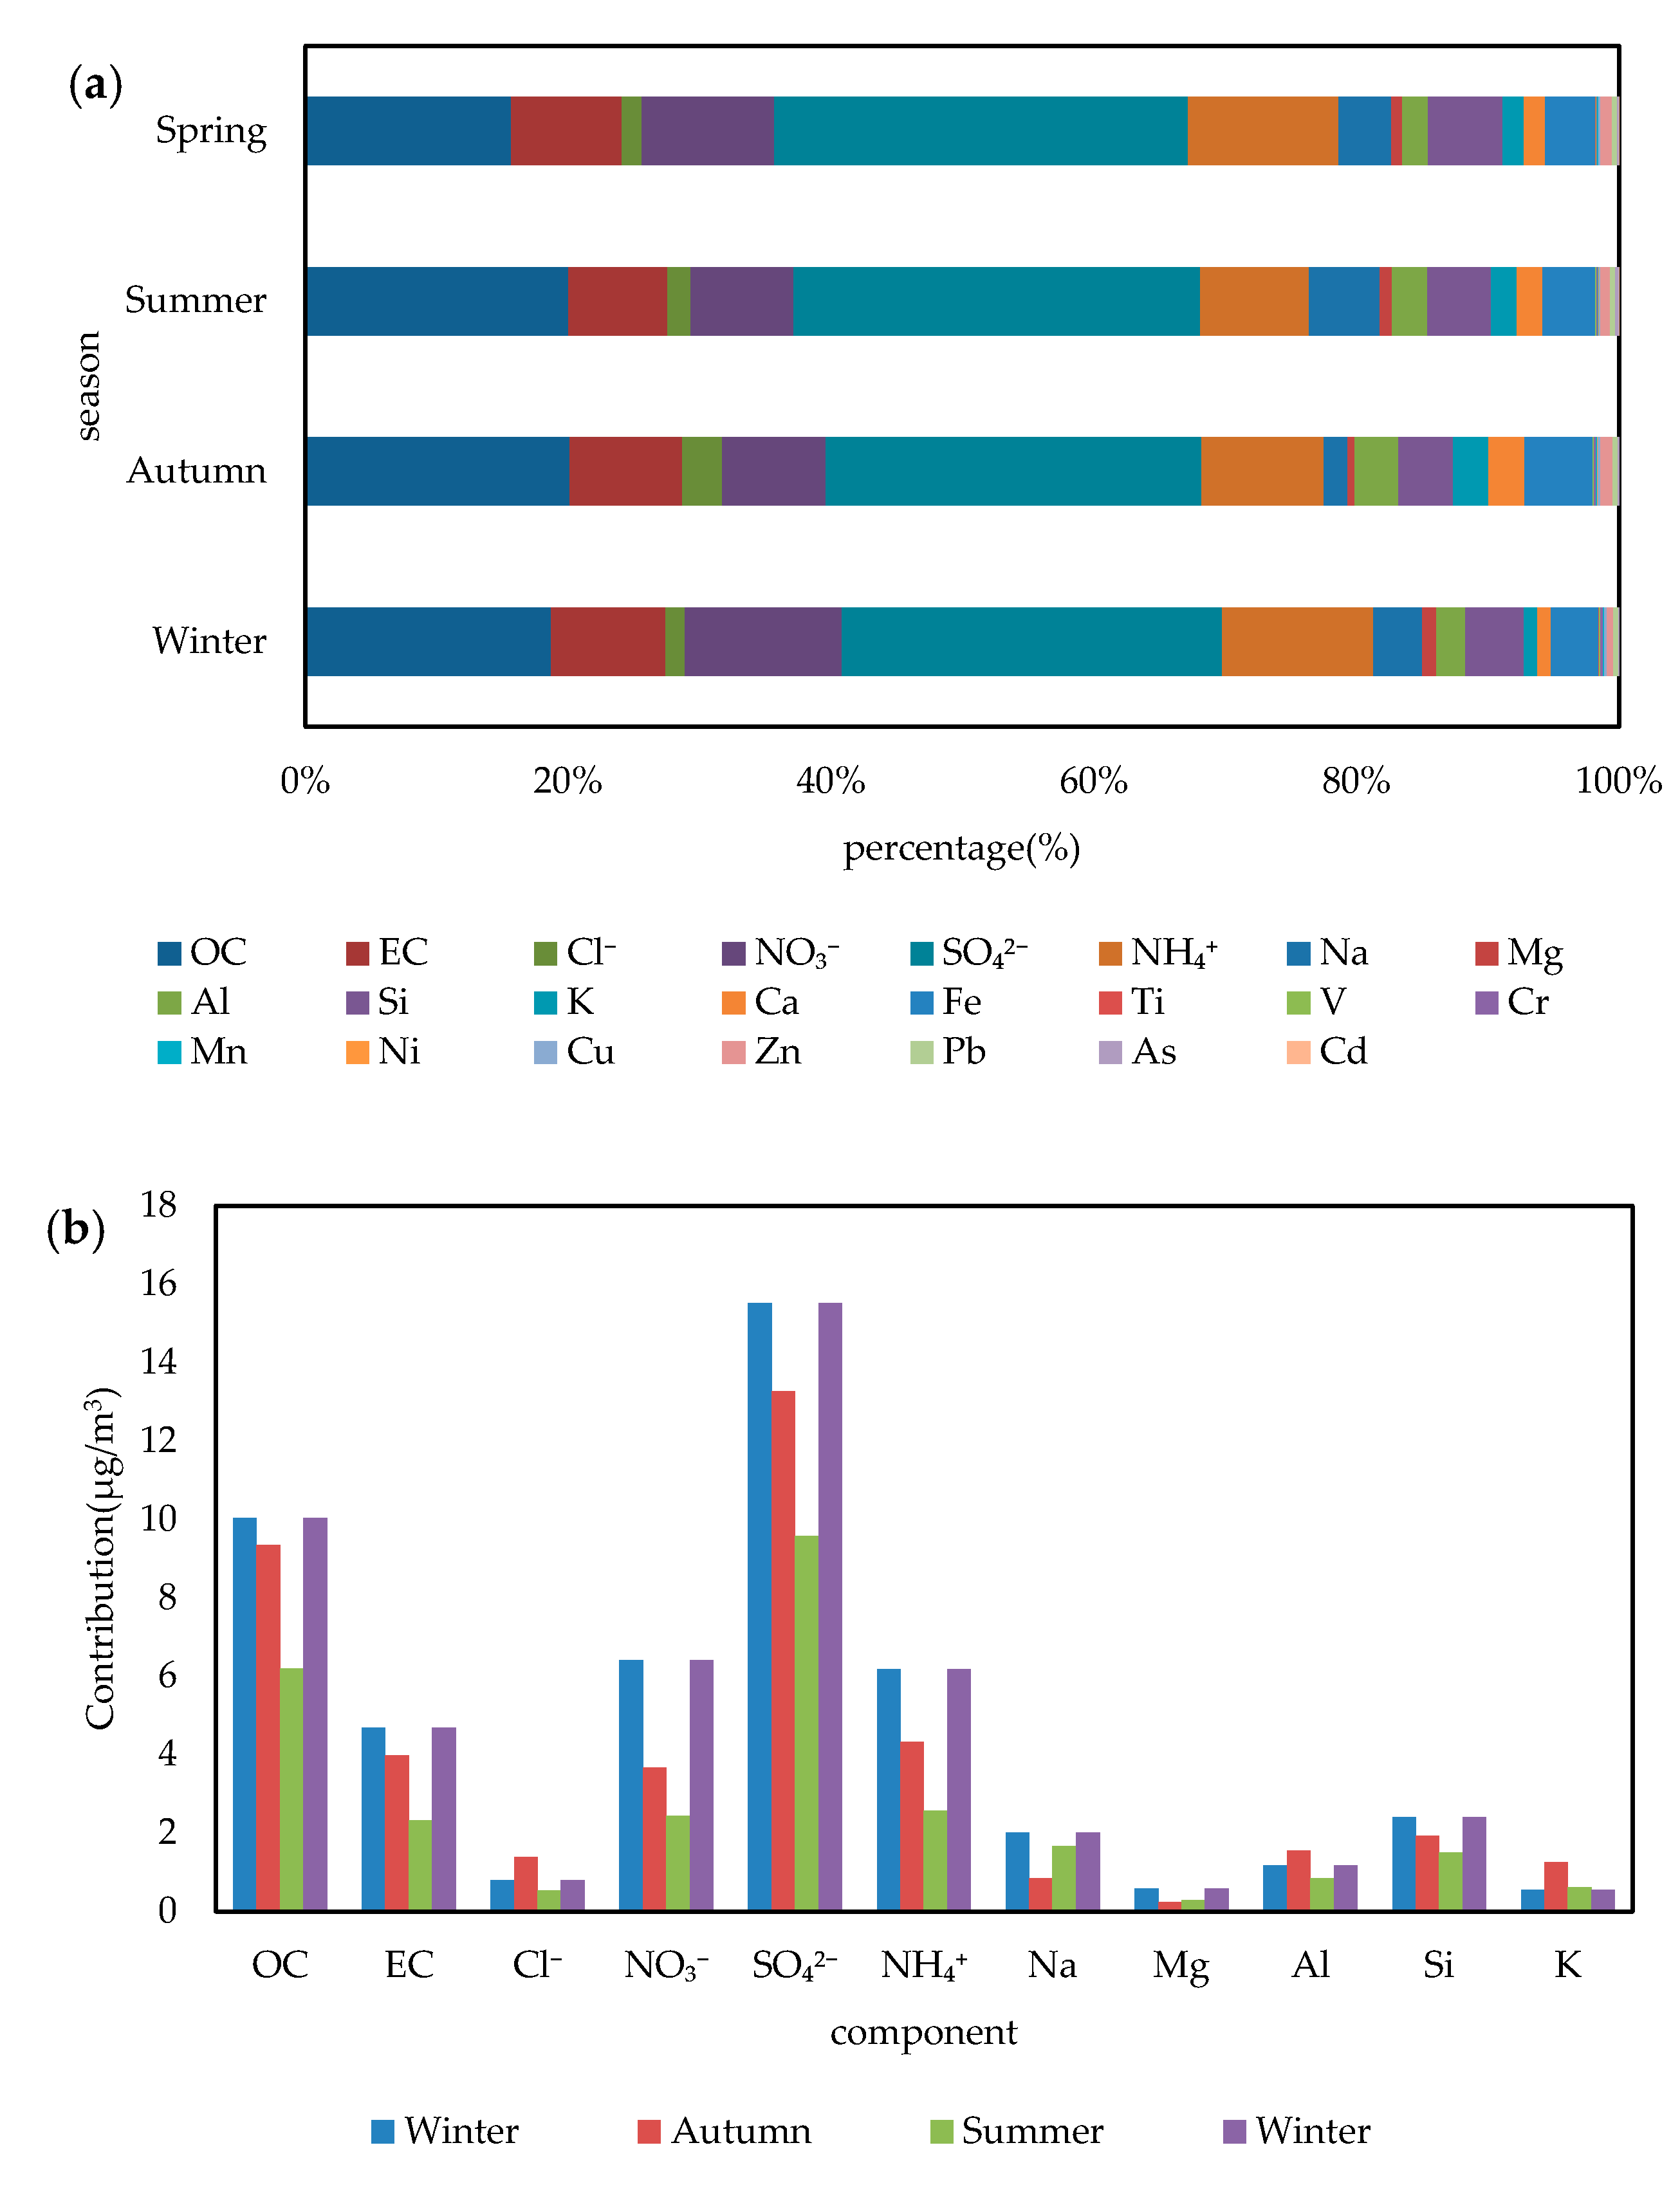
3.4.1. Chemical Speciation and Source Apportionment

The composition of PM2.5 in three regions are determined based on the local measurement. There are 23 kinds of components found in the particles as shown in Table S4. On the whole, there is little difference in the content of the main components in three cities. The major species of the PM2.5 in CZT urban agglomeration in 2015 are SO42−, OC, and NO3, with the annual average concentration reaching 13.06, 8.24, and 4.84 μg/m3, respectively. Zhuzhou has the largest industrial area in the CZT urban agglomeration, so it has more SO2 and NOX emission from industrial coal-burning than the other two cities. The reason may be due to the conversion of SO2 and photochemical reaction to NOX, and then the formation of sulfate and nitrate [32], which has a great influence on the concentration of PM2.5 in the three cities. Organic carbon(OC) and elemental carbon(EC) are the major emissions in the transportation sector, and the number of motor vehicles in Changsha is much larger than that of Zhuzhou and Xiangtan [12], accounting for about 50.75% to the total vehicles of the three cities. Therefore, the percentages of OC and EC are higher in Changsha rather than the other two cities. What cannot be ignored is that the crustal elements (Si, Al, Ca, Fe, Mg, Mn, Ti, V, etc.) occupy 16.13%, which is also an important composition of PM2.5. K+ and Cl are mainly derived from biomass burning [33], and they combine with dust generated by construction and transportation activities [34] in the air. There is little difference in the concentrations of K+ and Cl among three cities, suggesting that the CZT urban agglomeration may have a similar source of K+ and Cl. However, the content of crust elements in Xiangtan is always higher than that in the other two cities. This may be explained by the presence of more lead and zinc smelting enterprises near the Xiangtan sampling point. Figure 5 shows the components of PM2.5 in different cities.
Figure 6 shows the average content of major chemical components in PM2.5 in different seasons. SO42− has the highest proportion in four seasons, with the value reaching 18.43%. Five components (including SO42−, NO3, NH4+, OC, and EC) are attributed to the increase of PM2.5 concentration in winter, with the most dominant increase in NO3 and NH4+. Coal-fired emissions from industrial power generation and industrial production have important contributions to OC and EC [35]. At the same time, CZT urban agglomeration has more cold air activity in winter, which is beneficial to the input of exogenous pollutants [36]. The concentration of OC and EC are the lowest in summer, which is mainly due to the abundant precipitation in summer. The wash-out effect of rain plays a vital role in eliminating the atmospheric particulate matter. The concentration of K+ and Cl in autumn is significantly higher, and the concentrations are 1.9 times and 2.2 times than the average of spring, summer, and winter, respectively. Combined with the analysis of chemical composition characteristics of pollution sources [33], the content of these two components in biomass combustion sources is significantly higher than that of other sources, which indicates that the influence of biomass combustion on PM2.5 in autumn CZT region is strengthened.
Based on the chemical composition data above, the source apportionment of the regional fine particulate matter is carried out by a comprehensive analysis method (combining the CMB model, PMF model, and this emission inventory). The difference between comprehensive analysis results of PM2.5 in the three cities is obvious, as seen in Figure 7. The comprehensive contribution rate of vehicle exhaust is 25% in Changsha, while that of Zhuzhou and Xiangtan is less than 15%. It proves that automobile exhaust is still a source of pollution worthy of attention. In addition, the effect of industrial emissions from Zhuzhou and Xiangtan is prominent. The overall contribution rate of industrial emissions to PM2.5 from Xiangtan and Zhuzhou is about 40%, while that of Changsha is 30%. Among industrial emission sources in Changsha, the highest contribution is from building materials production (8%), followed by thermoelectric production (7%). Zhuzhou also has the largest contribution of industrial emission from building materials production (14%), followed by the metallurgical industry and chemical industry, both contributing about 10%. The proportion of SO2, NOX, and VOCs emitted by Xiangtan’s metallurgical industry accounts for 30–40% of total emissions, which indicates a large contribution to PM2.5 pollution in Xiangtan.
Seasonal variation has been observed in the contribution rate of different PM2.5 sources in CZT urban agglomeration as showed in Figure 8. The contribution of secondary sulfate and vehicle exhaust rank first and second in each season. The secondary sulfate contribution rate is the highest in autumn (24%), and the vehicle exhaust is the highest in summer (17%). Since industrial source emissions contribute the most to the secondary sulfate concentration in PM2.5, the impact of industrial emissions continues to be of concern. The contribution rate of secondary organic carbon is the highest in summer, accounting for about 13%. Raise dust and building cement dust have a relatively high contribution in spring and summer, which is 2–4% higher than autumn and winter. In the case of significantly less precipitation during the autumn and winter seasons, the reason for this phenomenon may be that the construction time in spring and summer is longer than that in autumn and winter. In addition, the relative contribution rate of coal-fired dust in different seasons is between 8% and 13%, which is relatively stable. The contribution of catering fume and metallurgical dust in four seasons is very small, but it cannot be ignored.

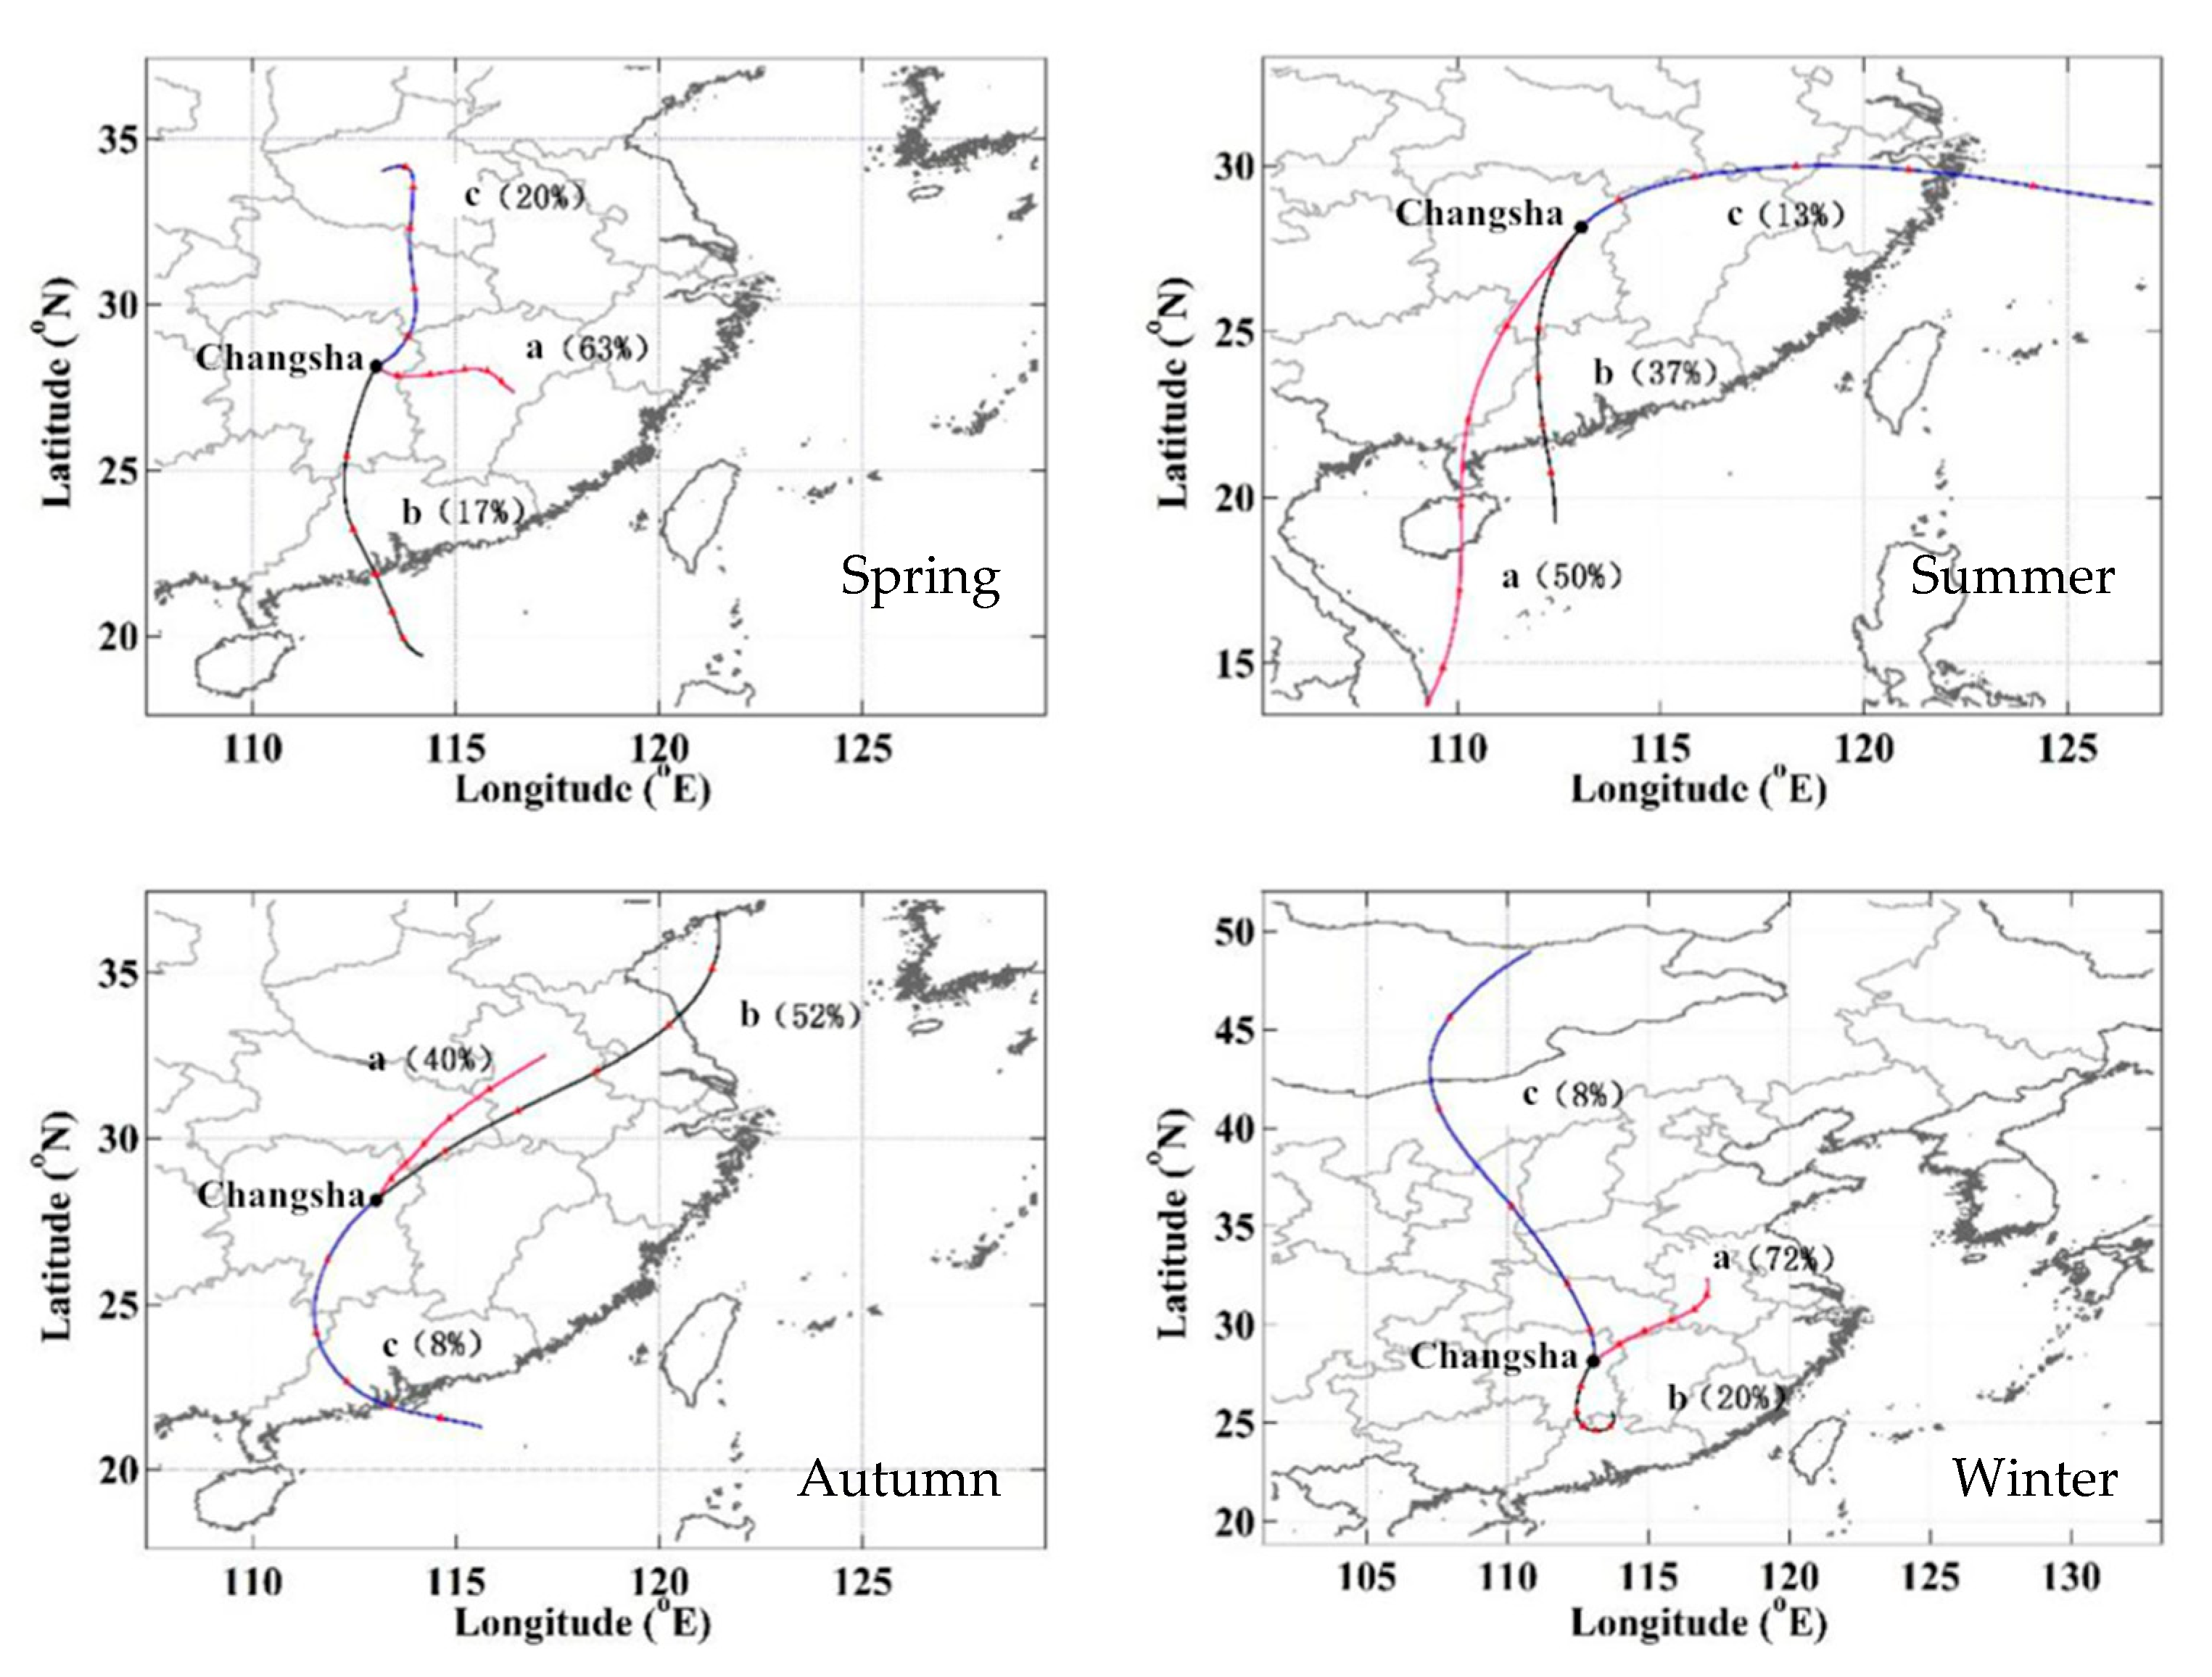
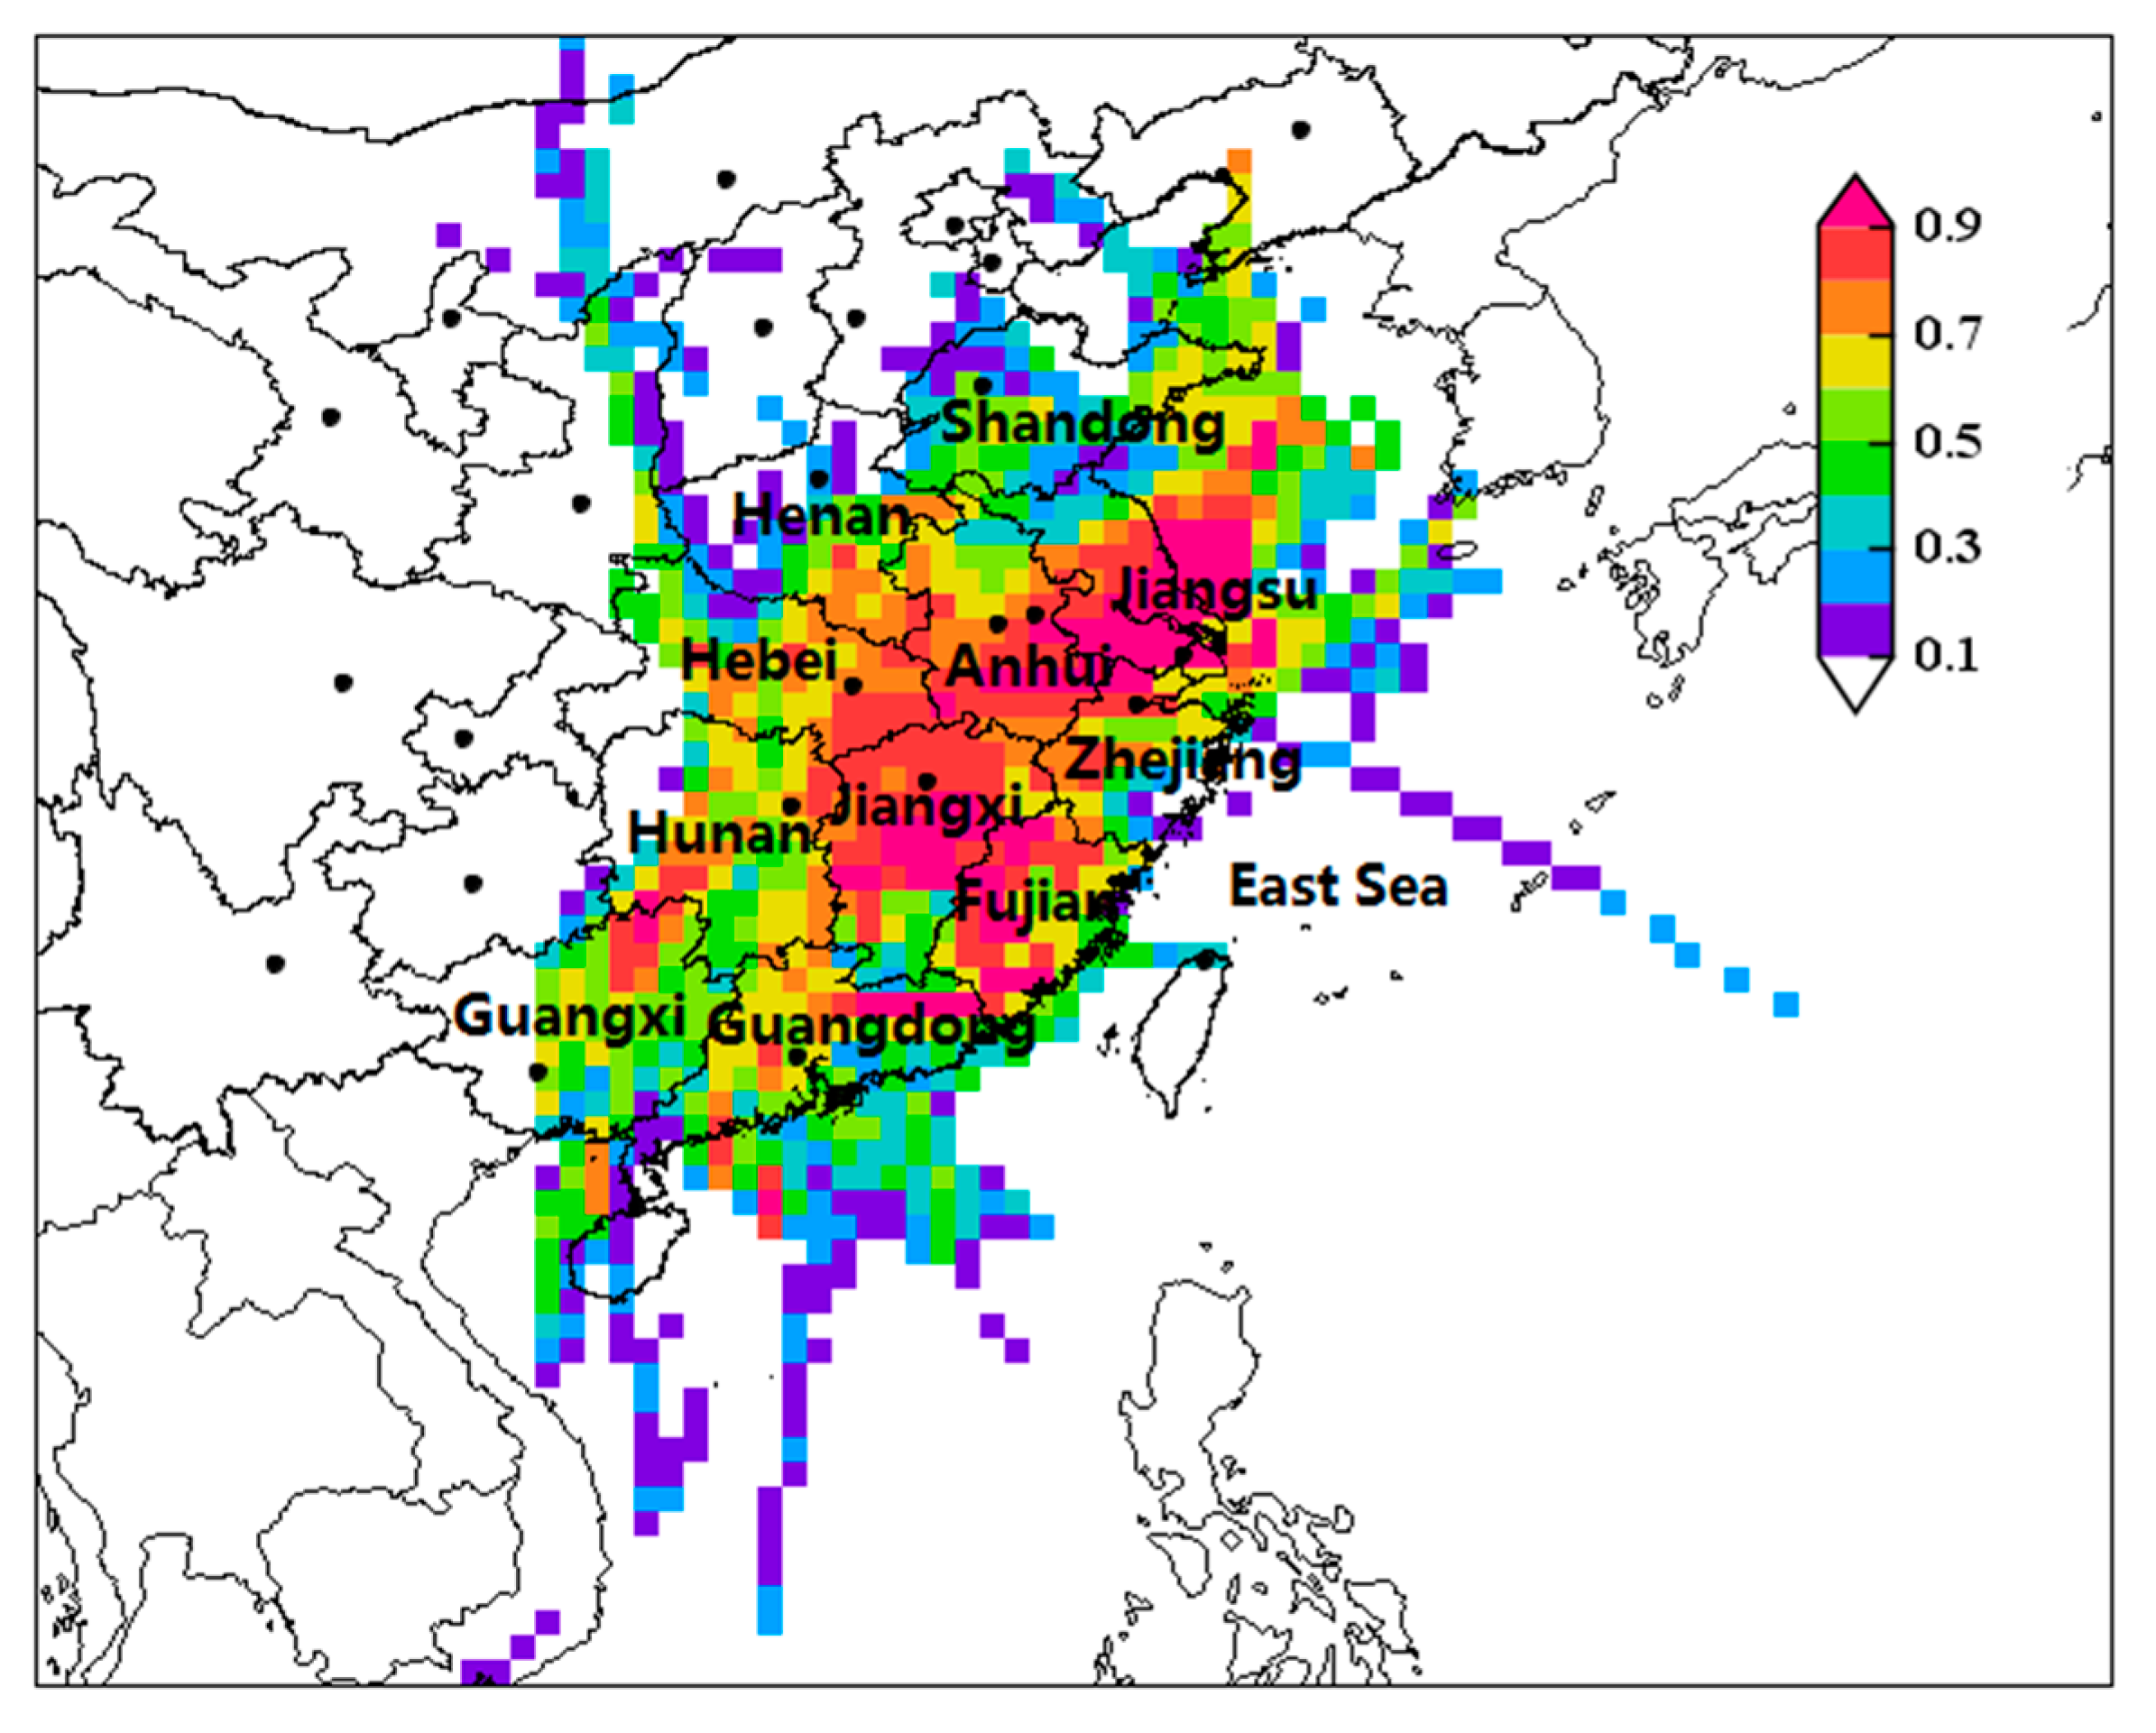
3.4.2. Regional Transmission Characteristics and Potential Source Domain Analysis

The pollution level of local atmospheric pollutants is affected by many factors. Under the control of different air masses, the concentration of pollutants varies greatly [37]. The clustering of airflow sources after 72 h in four seasons is illustrated in Figure 9. The CZT urban agglomeration is mainly affected by the medium-distance transmission air masses. The source and transmission path of air masses are greatly affected by the season. In spring, the eastern air mass originated from the central part of Jiangxi accounts for 63% of the airflow transfer; 20% are attributed to air mass moving north by passing through Henan and Hubei, and 17% of the airflow transfer is determined by the southwestern air mass passing Guangdong. In summer, southwestern air masses from Guangxi and Guangdong controls 87% of the airflow transfer while 13% left is affected by the northeastern air mass passing through Zhejiang, southern Anhui, and northern Jiangxi. The northeastern air mass, which passes through Jiangsu, Anhui, and Hubei, determines 92% of the airflow transfer in autumn, and the 8% left is impacted by the southwestern air mass passing through Guangdong. Variation of air mass in transfer distance and direction is observed in winter. The southwestern air mass passing through Anhui, southern Hubei, and northern Jiangxi controls 72% of the airflow transfer. Air mass from southern Guangdong affects 20% of the airflow transfer while the 8% left is impacted by air mass passing through Inner Mongolia, Shanxi, Henan, and Hubei. The relatively short airflow trajectory indicates that the atmospheric environment is relatively stable and prone to cause the accumulation of pollutants. Judging from the transmission distance to the air mass after 72 h in each season, the main airflow trajectory is longer in summer and autumn, which is not conducive to the accumulation of pollutants.
PSCF and CWT are two gridding statistical analysis methods based on the HYSPLIT model and were applied in semi-quantifying the distribution of pollutant sources in this study. The study area was divided into a grid of 0.5° × 0.5°.
PM2.5 potential source contribution distribution is shown in Figure 10. The threshold of PM2.5 is 35 μg/m3, and the result of PSCF shows that PM2.5 pollution in CZT urban agglomeration has a similar pollutant source, mainly originated from Jiangsu, Anhui, southern Hubei, and northwestern Jiangxi.
The PM2.5 trajectory weight concentration distribution is shown in Figure 11.
The larger Cij value indicates that the air mass passing through the grid i × j will cause a higher concentration of pollutants in the target area. The area corresponding to the grid is the main outer source area that contributes to the high-concentration pollutants in the target area. The trajectory through the grid is the main transmission path that contributes to the pollutants. As the main potential contributing area in CZT urban agglomeration, northern areas such as Jiangsu, southern Hubei, and northwestern Jiangxi appear higher value. Besides, the southern regions such as southern Guangdong and southern Guangxi present high contribution rates, which cannot be ignored.

3.5. Comparison with Other Inventories

To better understand the emission levels of CZT urban agglomeration, we have compared our inventory with the inventory of the Yangtze River Delta (YRD) region and the Beijing–Tianjin–Hebei (BTH) region. The results are shown in Figure 12. The emission data came from the 2010 YRD region Fu, Wang, Zhao, Xing, Cheng, Liu, and Hao [28] and the 2013 BTH region [38] emission inventory. These two regions are not only geographically larger but also have larger emissions than the CZT urban agglomeration, so it will be less precise to directly compare the emission status between CZT urban agglomeration and other two regions. Therefore, we allocated the air pollutants in the area unit, population, and GDP to better evaluate the emission status in different regions. The SO2 emission per unit area of the YRD region and BTH region is about twice that of the CZT urban agglomeration, and the per capita emission and per unit GDP are roughly twice and four times that of the CZT urban agglomeration. The first reason can be that central heating is required in the northern region, and the fuel consumption process generates a large amount of SO2; the second is that the YRD region and BTH region are affiliated to industrial provinces which consumes a lot of energy and results in more SO2. For NOX emission, the values per unit area emissions of the YRD region and BTH region are 2.13 times and 2.65 times higher than that of the CZT urban agglomeration respectively. This phenomenon may be attributed to the dense transportation hub and a large number of motor vehicle holdings in the YRD region. Combined with per capita emission and per unit GDP, it is not difficult to speculate that pollution control measures for motor vehicles in the YRD region have significant effects, which are worth learning from the CZT urban agglomeration. The total amount of PM (PM10, PM2.5) in the CZT urban agglomeration and the BTH region is quite different, but the emission per unit area is consistent. It may be attributed to the fact that both regions belong to inland areas and particulate matter can be capable of accumulating better. Except for the East China Sea, the YRD region is highly affected by sea wind, facilitating the transport of particulate matter. There are significant differences in VOCs emission among the three regions. There are fewer VOCs emission enterprises in CZT urban agglomeration. The other two regions, acting as the Chinese economic backbone have continual industrial activities and cause large emissions. Compared with the data of INTEX-B [39] in Hunan Province, the VOCs emission per unit area of this study are 13.99 times higher than that of INTEX-B, which shows that the control measures of VOCs in Hunan Province have yet to be strengthened. It is difficult to acquire the activity data from solvent use sources collected directly at the city level, and a lack of accurate data sources may also be responsible for differentiation. It is worth noting that the NH3 emission in the BTH region is much larger than that in the CZT urban agglomeration, but they are equal in NH3 emissions per unit area and per capita emissions. The reason is that CZT urban agglomeration is located near Dongting Lake, known as the “land of fish and rice”. NH3 emission caused by nitrogen fertilizer and livestock and poultry in this area is higher than the average value.

3.6. Uncertainty Analysis

This emission inventory is estimated using the Monte Carlo method, which has been widely applied for calculating the uncertainty of emission inventory. As illustrated in Table S5, the total uncertainty for the anthropogenic emission of NOX, SO2, NH3, VOCs, PM10, and PM2.5 are 20% to 42%, −34% to 58%, −42% to 89%, −46% to 73%, −42% to 67%, −38% to 69%, respectively. Among them, NH3 and VOCs have higher uncertainty. The low uncertainty of NH3 from livestock breeding and agricultural system (−51% to 42% and −43% to 47% respectively) contributes to relatively accurate emission data, while the uncertainty value is large for biomass burning (−82% to 125%) ascribed to the lack of local data. For VOCs, high uncertainties are contributed by the unavailability of specific data from non-road mobile sources as well as residential fuel sources. Moreover, PM2.5 and PM10 also share a high uncertainty, which mainly results from the non-road mobile source and dust (−40% to 117% and −60% to 121% respectively). Lower uncertainty is found in SO2 and NOX due to the less complicated composition and more effective control measures than other pollutants.

4. Discussion

Changsha should emphasize on controlling the number of the vehicle in reducing pollutant emissions. Various measures can effectively reduce air pollution, such as accelerating the phase-out of used cars, increasing fuel quality, and upgrading vehicle emission standards. For heavily polluting diesel vehicles, exhaust gas recirculation and lean-burn NOX traps are recommended to reduce pollutant emissions. The NOX emission in Xiangtan is significantly higher than that in Changsha and Zhuzhou. Therefore, restricting industries dominated by metallurgy is an urgent issue in Xiangtan. Xiangtan should consider rebuilding the industrial structure by reducing the production capacity of steel and strengthening the utilization efficiency of waste heat. Moreover, it is also necessary to accelerate the construction of denitrification equipment in the metallurgical industry, such as the selective non-catalytic reduction method and the selective catalytic reduction method. In addition, SO2 emission in Zhuzhou accounts for 41.67% of total emissions. Industrial boilers should be a key factor for managers to consider. Not only do industrial boiler emission standards need to be improved to control SO2, but the existing desulfurization facilities should be upgraded to the limestone (lime)/gypsum process. Film-coated bag filters are widely used because of their efficient dust removal efficiency. Enterprises should be strictly required to equip dust removal equipment and prohibit unorganized emissions. Besides, regarding the governance of VOCs and NH3, the three cities should simultaneously develop more stringent standard standards and recommend enterprises to use VOCs removal technologies, including regenerative thermal oxidizers and regenerative catalytic oxidation. Last but not least, Changsha should provide more information technology and financial services to help Zhuzhou and Xiangtan save energy and reduce emissions.

5. Conclusions

In this study, we developed a high-resolution CZT urban agglomeration air pollutant emission inventory for the year 2015. Conclusions are as follows:
  • The total emissions of SO2, NOX, PM10, PM2.5, VOCs, and NH3 are 132.5, 148.9, 111.6, 56.5, 119.0, and 72.0 kt, respectively. The discharge of atmospheric pollutants in the CZT urban agglomeration shows obvious spatial differences. The monthly variation trend of major air pollutants is relatively stable, and the monthly emission of some pollutants peak in autumn and winter.
  • The chemical composition data indicate that the main species in the PM2.5 of the CZT urban agglomeration in 2015 are SO42−, OC, and NO3, and the annual average concentrations are 13.06, 8.24, and 4.84 μg/m3, respectively. The regional PM2.5 pollution shows obvious seasonal differences, and the PM2.5 concentration in winter varies greatly. The results show that the influence of the source types of Changsha, Zhuzhou, and Xiangtan on PM2.5 is not significant and consistent, but pollution causes of PM2.5 are similar.
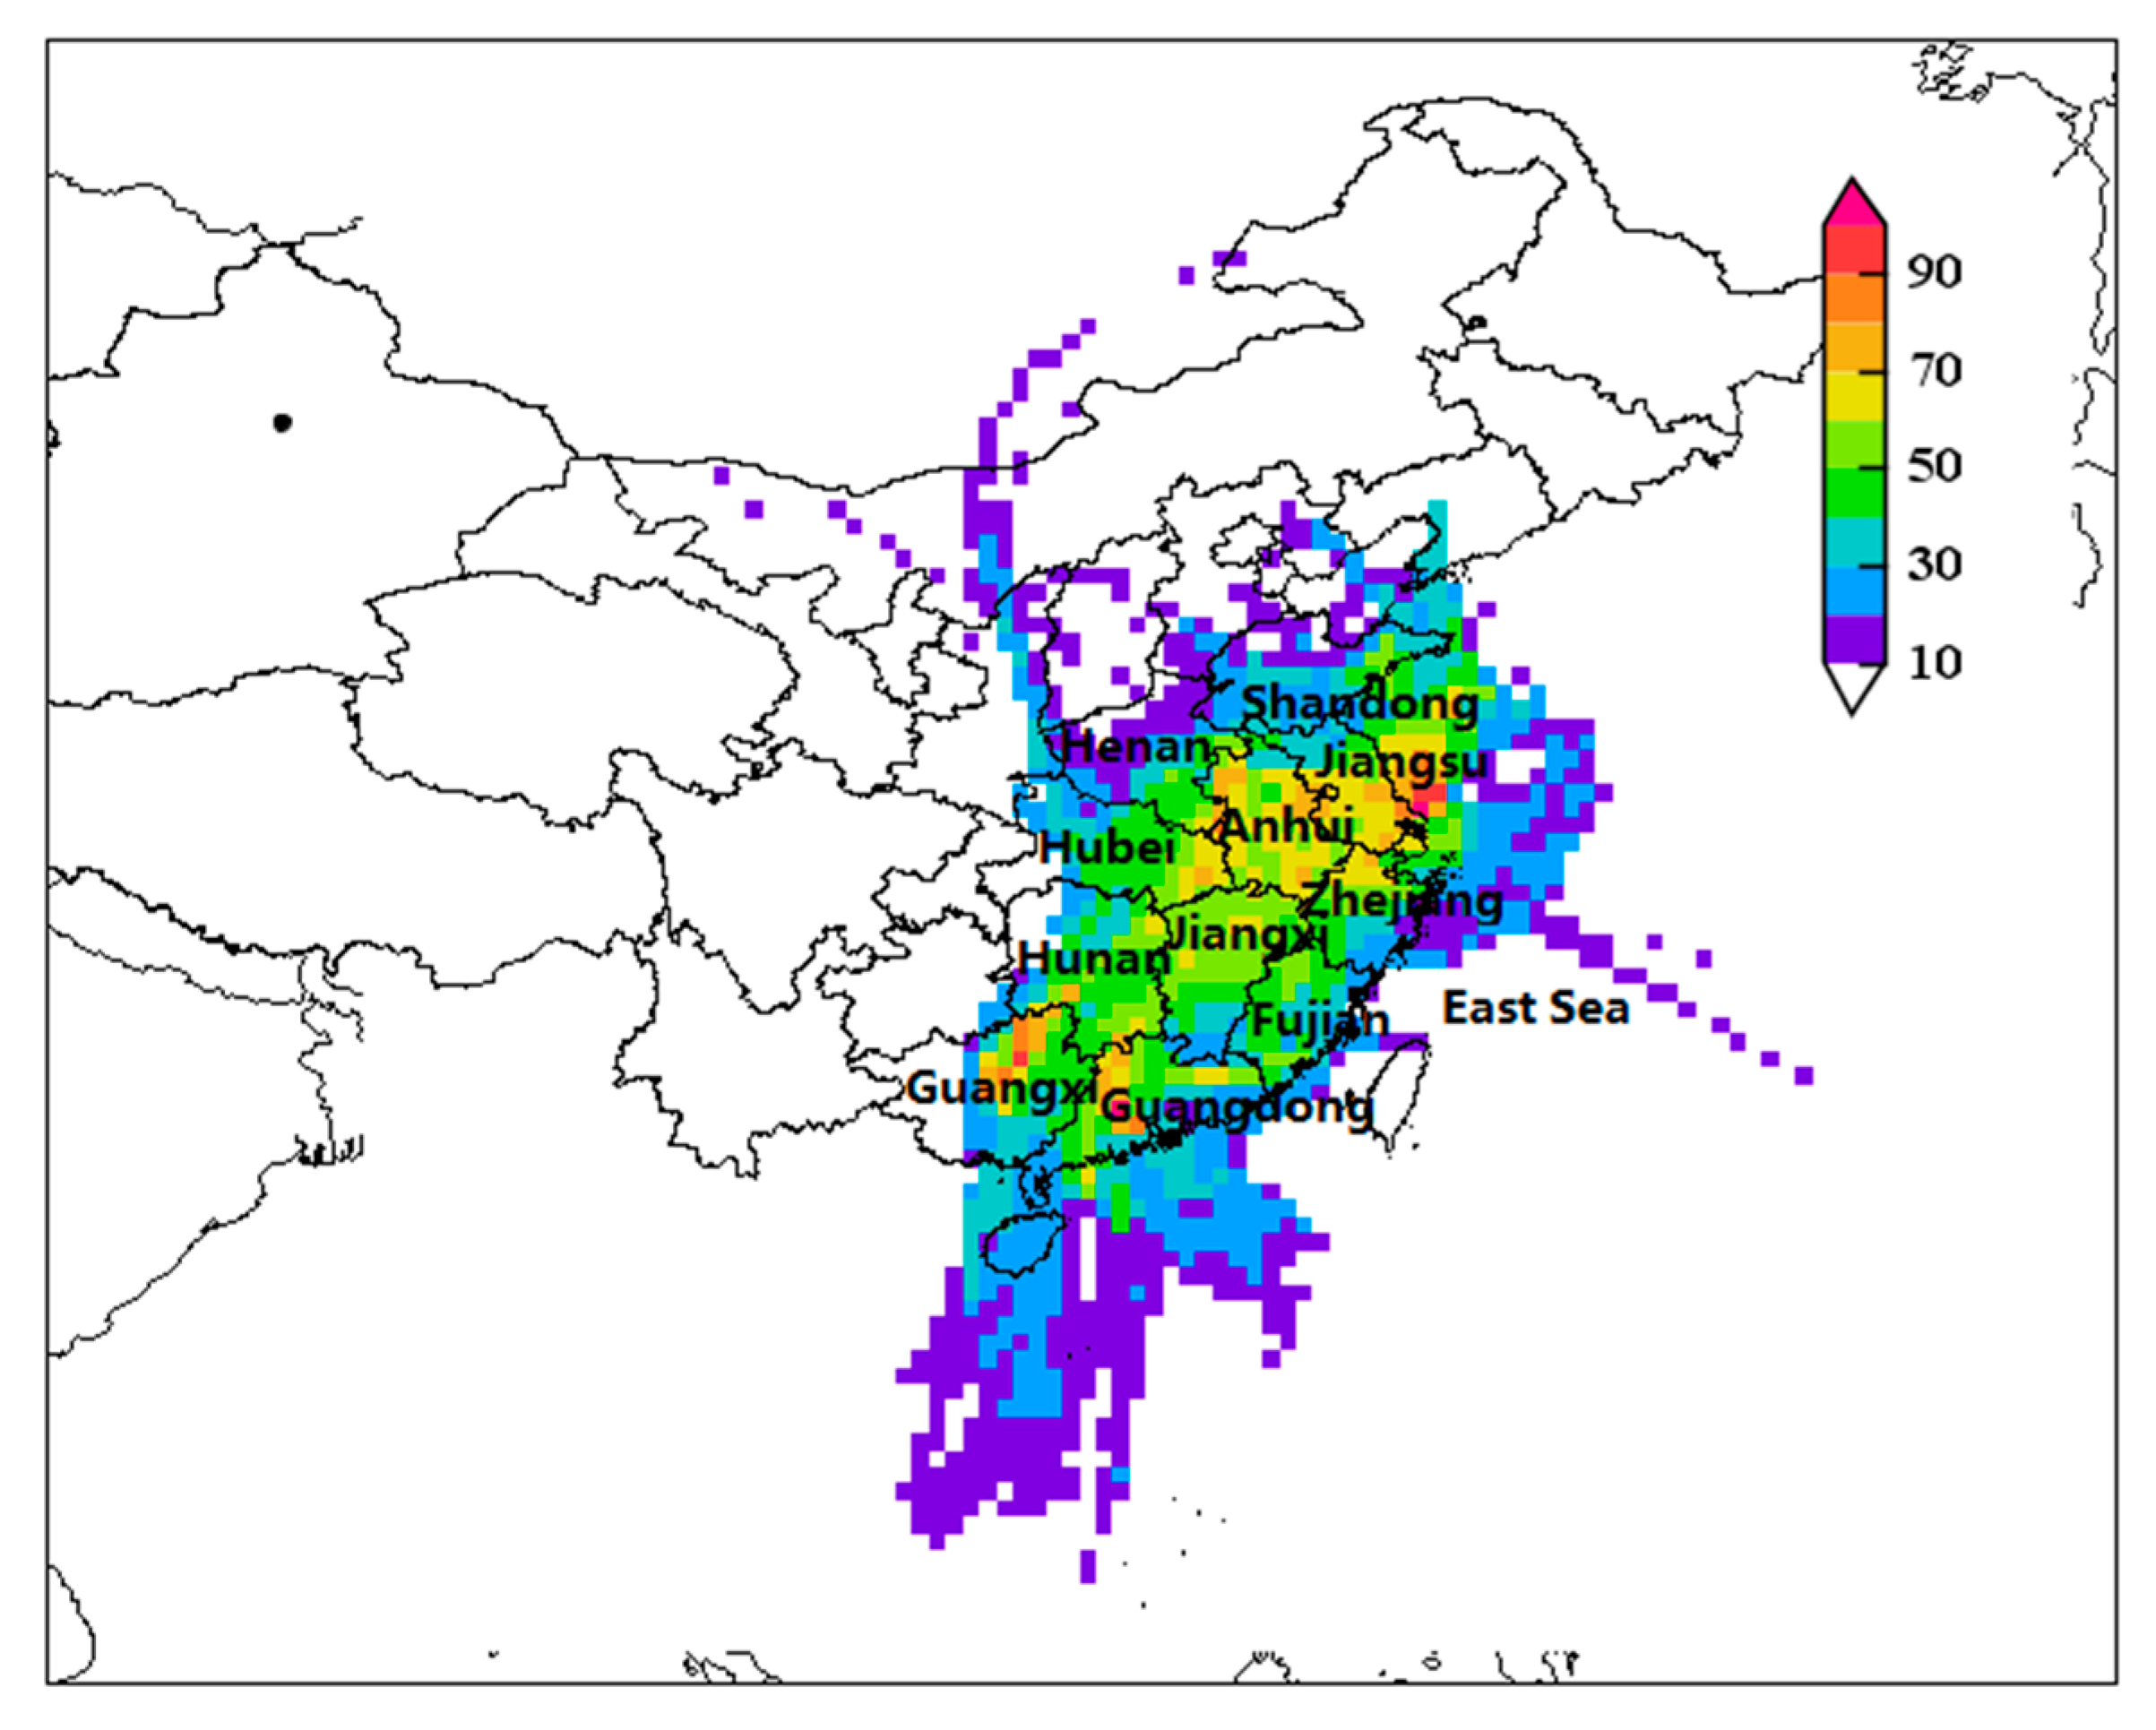
  • The source and transmission path of the air mass in the CZT urban agglomeration vary in different seasons. In summer, it is mainly controlled by the air mass transmitted by the middle distance of Guangdong and Guangxi along the coast, accounting for 87%. The autumn and winter are mainly controlled by the transmission air masses in the southeast direction of Jiangsu–Anhui–South Hubei, accounting for 92% and 72%, respectively. Potential source analysis shows that Jiangsu, Anhui, southern Hubei, and northwestern Jiangxi are potential contributing areas for major particulate matter in CZT urban agglomeration.
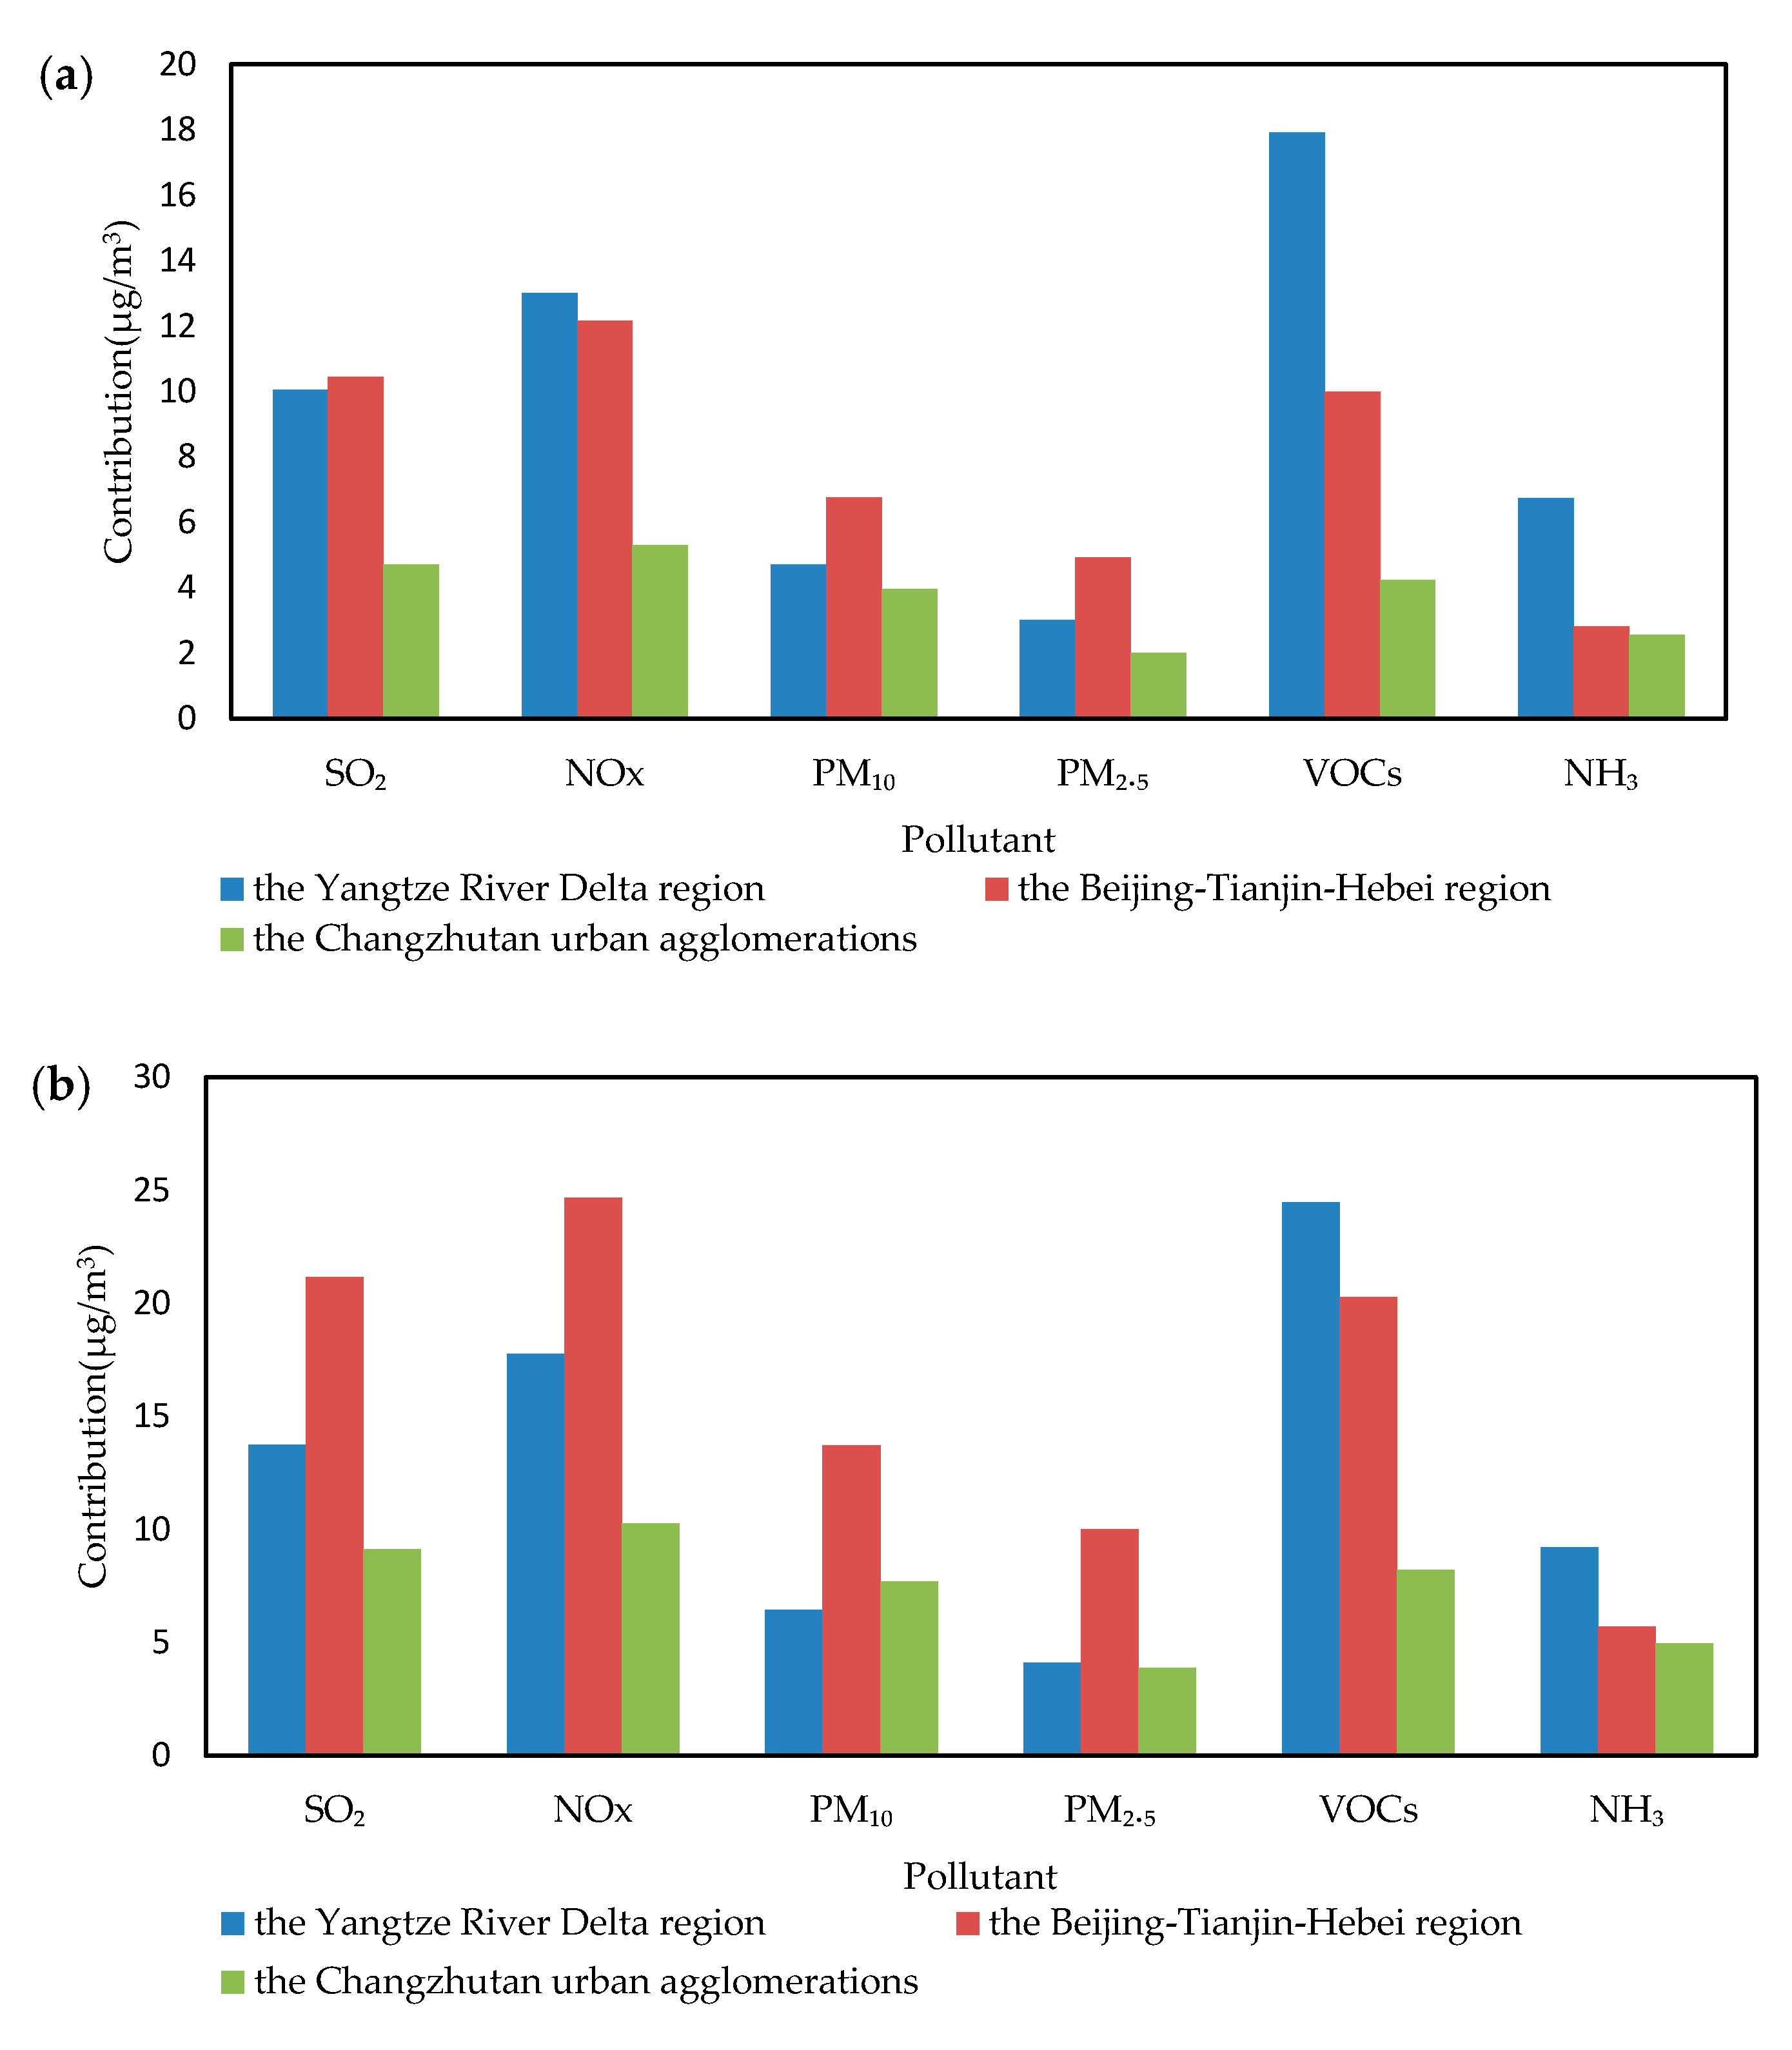
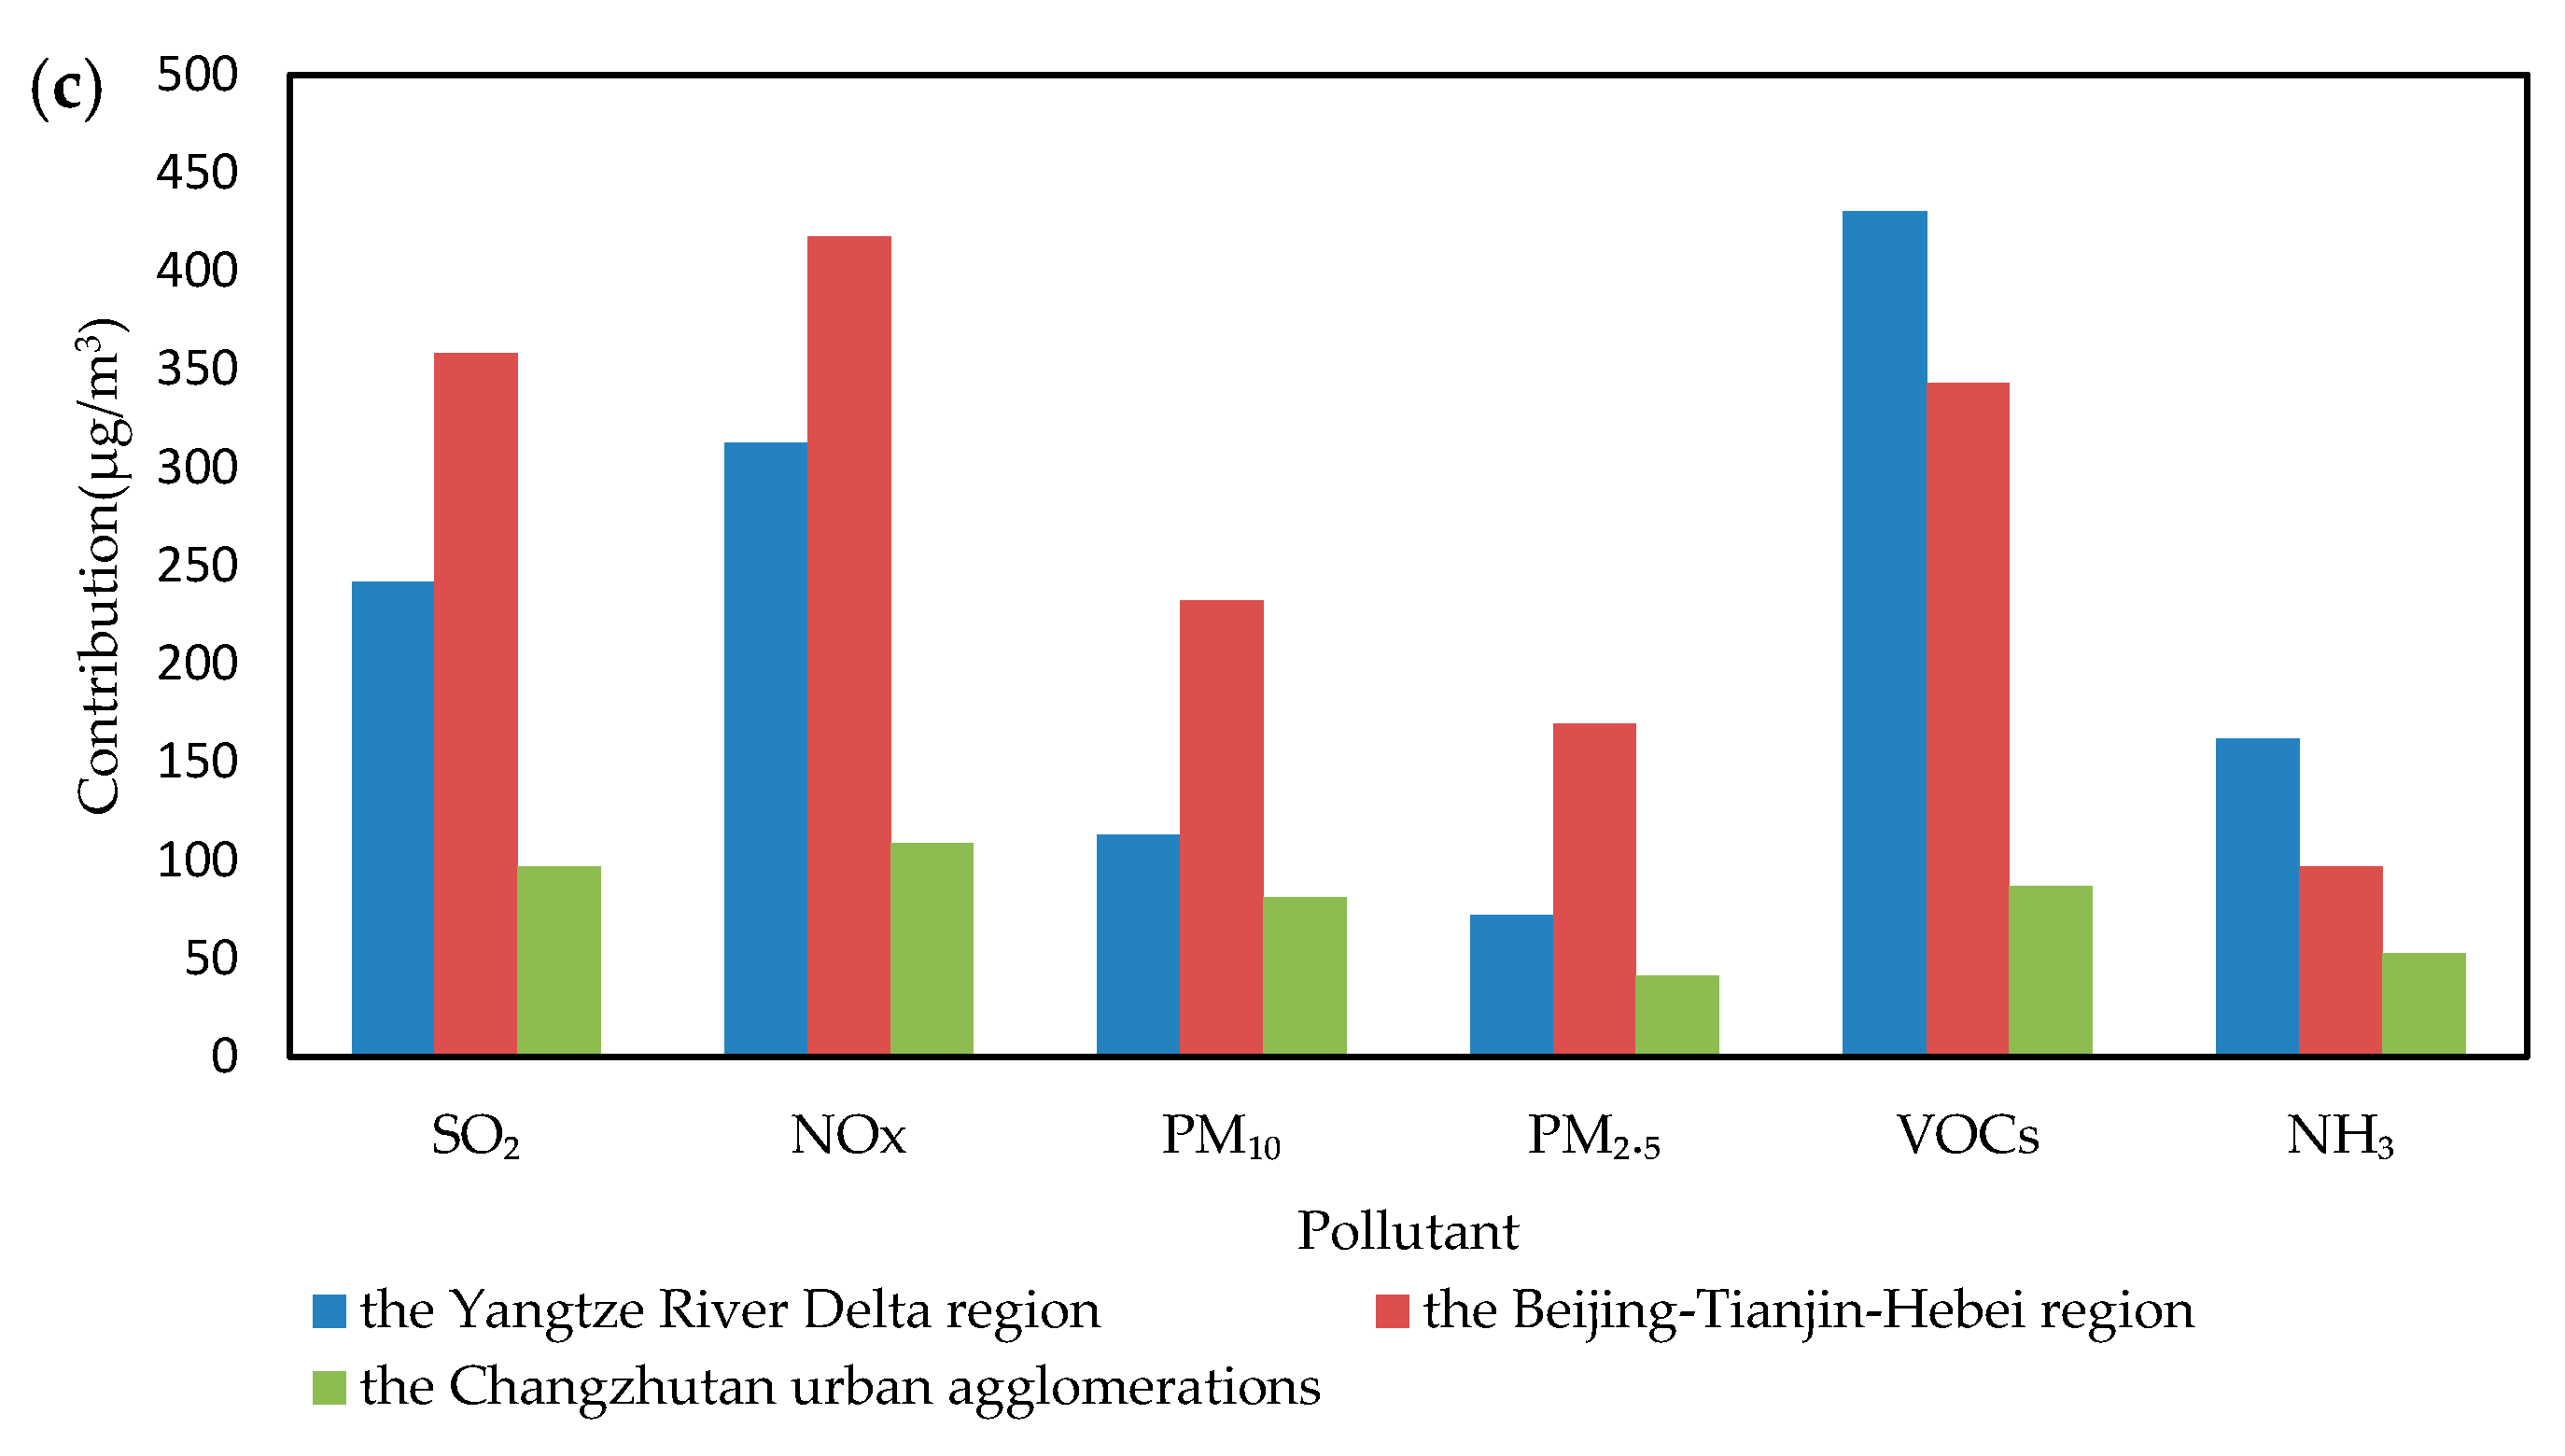
  • The comparison of this inventory of the YRD region and the BTH region presage that the emissions of six major pollutants in CZT urban agglomeration need to be taken seriously in the next decade. The concentration of PM and NH3 in CZT urban agglomeration is not much different from that in the YRD region and the BTH region.

Supplementary Materials

The following are available online at https://www.mdpi.com/2073-4433/11/7/739/s1, Table S1: Classification of air pollutant emission sources, Table S2. Detailed information of various models, Table S3: Data sources used to derive the parameters needed for the CZT inventory, Table S4: Content of main chemical components in PM2.5 in different cities of Changsha, Zhuzhou and Xiangtan, Table S5: Uncertainty assessment of major emission sources in the Changzhutan urban agglomeration.

Author Contributions

Conceptualization, B.X. and C.D.; Data curation, B.X. and X.Y.; Formal analysis, Y.Z.; Funding acquisition, C.D. and Z.L.; Methodology, X.Y.; Software, D.L.; Supervision, Y.Z., Z.L., S.H. and H.P.; Visualization, B.X.; Writing—original draft, B.X.; Writing—review & editing, C.D. and S.H. All authors have read and agreed to the published version of the manuscript.

Funding

This research was funded by the Key Research and Development Program of Hunan Province (2019SK2071), Natural Science Foundation of Hunan Province (2018JJ3240), Project of Science and Technology of Hunan Education Department (16C0761).

Conflicts of Interest

No conflict of interest exits in the submission of this manuscript, and the manuscript has approved by all authors for publication. The authors would like to declare that the manuscript is original and has not been published previously, and is not under consideration for publication elsewhere, in whole or in part.

References

  1. Kurokawa, J.; Ohara, T.; Morikawa, T.; Hanayama, S.; Janssens-Maenhout, G.; Fukui, T.; Kawashima, K.; Akimoto, H. Emissions of air pollutants and greenhouse gases over Asian regions during 2000–2008: Regional Emission inventory in Asia (REAS) version 2. Atmos. Chem. Phys. 2013, 13, 11019–11058. [Google Scholar] [CrossRef] [Green Version]
  2. Kato, N.; Akimoto, H. Anthropogenic emissions of SO2 and NOx in Asia: Emission inventories. Atmos. Environ. Part A Gen. Top. 1992, 26, 2997–3017. [Google Scholar] [CrossRef]
  3. Benkovitz, C.M.; Scholtz, M.T.; Pacyna, J.; Tarrasón, L.; Dignon, J.; Voldner, E.C.; Spiro, P.A.; Logan, J.A.; Graedel, T.E. Global gridded inventories of anthropogenic emissions of sulfur and nitrogen. J. Geophys. Res. Atmos. 1996, 101, 29239–29253. [Google Scholar] [CrossRef]
  4. Goebes, M.D.; Strader, R.; Davidson, C. An ammonia emission inventory for fertilizer application in the United States. Atmos. Environ. 2003, 37, 2539–2550. [Google Scholar] [CrossRef]
  5. Hao, J.; Tian, H.; Lu, Y. Emission inventories of NOx from commercial energy consumption in China, 1995−1998. Environ. Sci. Tech. 2002, 36, 552–560. [Google Scholar] [CrossRef]
  6. Chen, Y.; Zhi, G.; Feng, Y.; Fu, J.; Feng, J.; Sheng, G.; Simoneit, B.R.T. Measurements of emission factors for primary carbonaceous particles from residential raw-coal combustion in China. Geophys. Res. Lett. 2006, 33, 382–385. [Google Scholar] [CrossRef]
  7. Cao, G.; Zhang, X.; Zheng, F. Inventory of black carbon and organic carbon emissions from China. Atmos. Environ. 2006, 40, 6516–6527. [Google Scholar] [CrossRef]
  8. Qiang, Z.; David, G.S.; Kebin, H.; Zbigniew, K. Major components of China’s anthropogenic primary particulate emissions. Environ. Res. Lett. 2007, 2, 045027. [Google Scholar]
  9. Zheng, J.; Shao, M.; Che, W.; Zhang, L.; Zhong, L.; Zhang, Y.; Streets, D. Speciated VOC Emission Inventory and Spatial Patterns of Ozone Formation Potential in the Pearl River Delta, China. Environ. Sci. Tech. 2009, 43, 8580–8586. [Google Scholar] [CrossRef]
  10. Ou, J.; Zheng, J.; Li, R.; Huang, X.; Zhong, Z.; Zhong, L.; Lin, H. Speciated OVOC and VOC emission inventories and their implications for reactivity-based ozone control strategy in the Pearl River Delta region, China. Sci. Total Environ. 2015, 530–531, 393–402. [Google Scholar] [CrossRef]
  11. Lee, S.; Liu, W.; Wang, Y.; Russell, A.G.; Edgerton, E.S. Source Apportionment of PM2.5: Comparing PMF And CMB Results For Four Ambient Monitoring Sites In The Southeastern United States. Atmos. Environ. 2008, 42, 4126–4137. [Google Scholar] [CrossRef]
  12. You, X. Anthropogenic Ammonia Emission Inventory and Its Spatial Distribution in Chang-Zhu-Tan Region. Environ. Sci. 2016, 37, 94–101. [Google Scholar]
  13. United States Environmental Protection Agency. Compilation of Air Pollutant Emission Factors, AP-42; Office of Air Quality Standards, Emission Inventory Branch, US Environmental: Washington, DC, USA, 1995.
  14. Lei, Y.; Qiang, Z.; Nielsen, C.; He, K. An inventory of primary air pollutants and CO2 emissions from cement production in China, 1990–2020. Atmos. Environ. 2011, 45, 147–154. [Google Scholar] [CrossRef]
  15. Zhao, Y.; Wang, S.; Nielsen, C.P.; Li, X.; Hao, J. Establishment of a database of emission factors for atmospheric pollutants from Chinese coal-fired power plants. Atmos. Environ. 2010, 44, 1515–1523. [Google Scholar] [CrossRef]
  16. Li, X.G.; Wang, S.X.; Duan, L.; Hao, J.; Li, C.; Chen, Y.S.; Yang, L. Particulate and trace gas emissions from open burning of wheat straw and corn stover in China. Environ. Sci. Tech. 2007, 41, 6052–6058. [Google Scholar] [CrossRef] [PubMed]
  17. Wang, S.; Wei, W.; Du, L.; Li, G.; Hao, J. Characteristics of gaseous pollutants from biofuel-stoves in rural China. Atmos. Environ. 2009, 43, 4148–4154. [Google Scholar] [CrossRef]
  18. Jetter, J.; Zhao, Y.; Smith, K.R.; Khan, B.; Yelverton, T.; DeCarlo, P.; Hays, M.D. Pollutant Emissions and Energy Efficiency under Controlled Conditions for Household Biomass Cookstoves and Implications for Metrics Useful in Setting International Test Standards. Environ. Sci. Tech. 2012, 46, 10827–10834. [Google Scholar] [CrossRef] [PubMed]
  19. Shen, G.; Tao, S.; Wei, S.; Zhang, Y.; Wang, R.; Wang, B.; Li, W.; Shen, H.; Huang, Y.; Chen, Y.; et al. Reductions in Emissions of Carbonaceous Particulate Matter and Polycyclic Aromatic Hydrocarbons from Combustion of Biomass Pellets in Comparison with Raw Fuel Burning. Environ. Sci. Tech. 2012, 46, 6409–6416. [Google Scholar] [CrossRef] [PubMed] [Green Version]
  20. Andreae, M.O.; Merlet, P. Emission of trace gases and aerosols from biomass burning. Glob. Biogeochem. Cycl. 2001, 15, 955–966. [Google Scholar] [CrossRef] [Green Version]
  21. Liu, H. Research on Coupled Mapping Model of Urban Vehicle Activity and Emissions; Tsinghua University, China Academic Journal Electronic Publishing House: Beijing, China, 2008. [Google Scholar]
  22. Zhang, C.; Chai, C.; Zhou, Z.; Lu, X. Research on Ammonia Emission from Agricultural Sources in Chongqing Urban City. Environ. Monit. China 2014, 30, 90–96. [Google Scholar] [CrossRef]
  23. Zhou, Y.; Wu, Y.; Zhang, S.; Fu, L.; Hao, J. Evaluating the emission status of light-duty gasoline vehicles and motorcycles in Macao with real-world remote sensing measurement. J. Environ. Sci. 2014, 26, 2240–2248. [Google Scholar] [CrossRef] [PubMed]
  24. Hu, J.; Wu, Y.; Wang, Z.; Li, Z.; Zhou, Y.; Wang, H.; Bao, X.; Hao, J. Real-world fuel efficiency and exhaust emissions of light-duty diesel vehicles and their correlation with road conditions. J. Environ. Sci. 2012, 24, 865–874. [Google Scholar] [CrossRef]
  25. Fu, M.; Ge, Y.; Tan, J.; Zeng, T.; Liang, B. Characteristics of typical non-road machinery emissions in China by using portable emission measurement system. Scie. Total Environ. 2012, 437, 255–261. [Google Scholar] [CrossRef] [PubMed]
  26. Bo, Y.; Cai, H.; Xie, S.D. Spatial and temporal variation of historical anthropogenic NMVOCs emission inventories in China. Atmos. Chem. Phys. 2008, 8, 11519–11566. [Google Scholar] [CrossRef] [Green Version]
  27. Wei, W.; Wang, S.; Hao, J. Uncertainty analysis of emission inventory for volatile organic compounds from anthropogenic sources in China. J. Environ. Sci. 2011, 32, 305–312. [Google Scholar]
  28. Fu, X.; Wang, S.; Zhao, B.; Xing, J.; Cheng, Z.; Liu, H.; Hao, J. Emission inventory of primary pollutants and chemical speciation in 2010 for the Yangtze River Delta region, China. Atmos. Environ. 2013, 70, 39–50. [Google Scholar] [CrossRef]
  29. Ying, Z.; Cheng, S.; Lang, J.; Chen, D.; Zhao, B.; Chao, L.; Ran, X.; Li, T. A comprehensive ammonia emission inventory with high-resolution and its evaluation in the Beijing-Tianjin-Hebei (BTH) region, China. Atmos. Environ. 2015, 106, 305–317. [Google Scholar]
  30. Wu, W.; Zhao, B.; Wang, S.; Hao, J. Ozone and secondary organic aerosol formation potential from anthropogenic volatile organic compounds emissions in China. J. Environ. Sci. 2017, 53, 224–231. [Google Scholar] [CrossRef]
  31. Wang, Y.; Dong, H.; Zhu, Z.; Li, L.; Zhou, T.; Jiang, B.; Xin, H. CH4, NH3, N2O and NO emissions from stored biogas digester effluent of pig manure at different temperatures. Agric. Ecosys. Environ. 2016, 217, 1–12. [Google Scholar] [CrossRef]
  32. Jiang, X.; Wiedinmyer, C.; Carlton, A.G. Aerosols from fires: An examination of the effects on ozone photochemistry in the Western United States. Environ. Sci Tech. 2012, 46, 11878–11886. [Google Scholar] [CrossRef]
  33. Chandrasekaran, S.R.; Hopke, P.K.; Newtown, M.; Hurlbut, A. Residential-Scale Biomass Boiler Emissions and Efficiency Characterization for Several Fuels. Energy Fuels 2013, 27, 4840–4849. [Google Scholar] [CrossRef]
  34. Liu, H.; Tian, H.; Zhang, K.; Liu, S.; Cheng, K.; Yin, S.; Liu, Y.; Liu, X.; Wu, Y.; Liu, W.; et al. Seasonal variation, formation mechanisms and potential sources of PM2.5 in two typical cities in the Central Plains Urban Agglomeration, China. Sci. Total Envion. 2019, 657, 657–670. [Google Scholar] [CrossRef]
  35. Yang, J.; Kang, S.; Ji, Z.; Yang, S.; Li, C.; Tripathee, L. Vital contribution of residential emissions to atmospheric fine particles (PM2.5) during the severe wintertime pollution episodes in Western China. Environ. Pollut. 2019, 245, 519–530. [Google Scholar] [CrossRef]
  36. Dai, C.; Huang, S.; Peng, H.; Yi, K.; Zhou, Y.; Qin, P. Particulate pollution status and its characteristics during 2015–2016 in Hunan, China. Atmos. Pollut. Res. 2018, 739–748. [Google Scholar] [CrossRef]
  37. Atwood, S.A.; Reid, J.S.; Kreidenweis, S.M.; Cliff, S.S.; Zhao, Y.; Lin, N.-H.; Tsay, S.-C.; Chu, Y.-C.; Westphal, D.L. Size resolved measurements of springtime aerosol particles over the northern South China Sea. Atmos. Environ. 2013, 78, 134–143. [Google Scholar] [CrossRef]
  38. Qi, J.; Zheng, B.; Li, M.; Yu, F.; Chen, C.; Liu, F.; Zhou, X.; Yuan, J.; Zhang, Q.; He, K. A high-resolution air pollutants emission inventory in 2013 for the Beijing-Tianjin-Hebei region, China. Atmos. Environ. 2017, 170, 156–168. [Google Scholar] [CrossRef]
  39. Zhang, Q.; Streets, D.G.; Carmichael, G.R.; He, K.; Huo, H.; Kannari, A.; Klimont, Z.; Park, I.; Reddy, S.; Fu, J. Asian emissions in 2006 for the NASA INTEX-B mission. Atmos. Chem. Phys. 2009, 9, 5131–5153. [Google Scholar] [CrossRef] [Green Version]
Figure 1. Regional diagram of the Changzhutan urban agglomeration.
Atmosphere 11 00739 g001
Figure 2. The emission contributions of ten source categories in the Changzhutan urban agglomeration.
Atmosphere 11 00739 g002
Figure 3. Spatial allocation of air pollutant emissions and annual concentrations in the Changzhutan (CZT) urban agglomeration in 2015. (a) sulfur dioxide (SO2) emission (3 × 3 km). (b) SO2 emission (1 × 1 km). (c) nitrogen oxides (NOX) emission (3 × 3 km). (d) NOX emission (1 × 1km). (e) particulate matter 2.5 (PM2.5) emission (3 × 3 km). (f) PM2.5 emission (1 × 1 km). (g) particulate matter 10 (PM10) emission (3 × 3 km). (h) PM10 emission (1 × 1 km). (i) volatile organic compounds (VOCs) emission (3 × 3 km). (j) VOCs emission (1 × 1 km). (k) ammonia (NH3) emission (3 × 3 km). (l) NH3 emission (1 × 1 km).
Atmosphere 11 00739 g003
Figure 4. The emission contributions of ten source categories in the Changzhutan urban agglomeration. The monthly changes in emissions of major air pollutants in the CZT urban agglomeration.
Atmosphere 11 00739 g004
Figure 5. PM2.5 speciation by cities. (a) The percentage of 23 components of PM2.5 in different regions. (b) PM2.5 main component concentration in different regions (μg/m3).
Atmosphere 11 00739 g005
Figure 6. PM2.5 compositions in different seasons. (a) The percentage of 23 components of PM2.5 in different seasons. (b) PM2.5 main component concentration in different seasons (μg/m3).
Atmosphere 11 00739 g006
Figure 7. Analytical results of PM2.5 comprehensive source in Changsha, Zhuzhou, and Xiangtan. (a) Changsha. (b) Zhuzhou. (c) Xiangtan.
Atmosphere 11 00739 g007
Figure 8. PM2.5 source contribution rate in different seasons.
Atmosphere 11 00739 g008
Figure 9. Airflow trajectory clustering in different seasons.
Atmosphere 11 00739 g009
Figure 10. PM2.5 potential source contribution distribution.
Atmosphere 11 00739 g010
Figure 11. PM2.5 concentration weight trajectory distribution.
Atmosphere 11 00739 g011
Figure 12. Comparison of air pollutant emission inventory established by different studies [27,38]. (a) Emissions of atmospheric pollutants per unit area (kg/m2). (b) Emissions of atmospheric pollutants per capita emissions (kg/person). (c) Emissions of atmospheric pollutants per unit GDP (kg/billion).
Atmosphere 11 00739 g012aAtmosphere 11 00739 g012b
Table 1. The anthropogenic emission inventories of the Changzhutan urban agglomeration in 2015 (kt).
CitySO2NOXPM10PM2.5VOCsNH3
Changsha28.757.554.323.249.932.4
Zhuzhou55.039.924.415.344.921.0
Xiangtan48.851.532.918.024.218.6
Total132.5148.9111.656.5119.072.0

