Crystal Size Distribution (CSD) Analysis of Volcanic Samples: Advances and Challenges
 Katharine V. Cashman
- School of Earth Sciences, University of Bristol, Bristol, United Kingdom
Studies of magmatic systems have long used the textures of erupted samples to infer processes that control the location and duration of magma storage and drive volcanic eruptions from these storage regions. Models of volcanic processes and magmatic systems have evolved substantially over the past decades, in large part because of advances in analytical and experimental techniques. Cooling- and decompression-experiments have greatly enhanced our understanding of crystal textures produced by crystallization associated with volcanic eruptions, while advances in compositional mapping, isotopic analysis and diffusion chronometry provide the tools to unravel complex histories of individual crystals. Experiments, however, have failed to replicate the full range of groundmass textures observed in volcanic samples and the recognition that magma commonly includes both indigenous (grown from the transporting liquid) and exogenous (incorporated from elsewhere in the system) crystals complicates interpretation of crystal populations in volcanic samples. Analysis and interpretation of crystal size distributions (CSDs) and other physical measures of crystal populations, in particular, have yet to fully account for crystal populations with diverse origins and growth histories. Here I assess the extent to which experiments replicate observed crystal populations and thus can be used to improve understanding of volcanic processes. I then review conditions under which the size characteristics of crystal populations can be reasonably interpreted, examine possible reasons for experimental failure to achieve the very high crystal number densities that characterize some eruptive samples, and suggest ways to link CSD analysis to other techniques that seek to constrain the origin of the complex crystal populations. Finally, I show that compositionally based crystal size measurements are critical for interpreting different stages of crystal growth and can be yield well constrained growth histories if linked to diffusion time scales and phase constraints on crystallization conditions.
Introduction
The crystal population of volcanic samples represents the integration of processes that occur throughout magmatic systems. Reconstructing these processes from the crystal record is challenging, however, and requires integration of compositional and physical analysis of both individual crystals and crystal ensembles. A wide array of tools is now available for such analysis; the challenge lies in integrating analysis of crystal populations with evolving understanding of the physical processes that control magma evolution (e.g., Jerram et al., 2018) and modulate volcanic activity (e.g., Martel et al., 2019). Addressing the former requires unraveling complex textures and compositional zonation preserved in the phenocryst (macrocryst) population; addressing the latter involves interpreting groundmass measurements using kinetic constraints provided by laboratory experiments.
The past decades have seen accumulating evidence that many of the crystals present in volcanic samples did not grow exclusively from the melt that transported them to the Earth’s surface (e.g., Nakada and Motomura, 1999; Davidson et al., 2005, 2007; Humphreys et al., 2006, 2008; Smith et al., 2009; Viccaro et al., 2010; Cashman and Blundy, 2013; Neave et al., 2013). Instead, crystal cores commonly preserve records of formation in diverse parts of the magmatic system and complex histories of growth, reaction, resorption and agglomeration. For this reason, the phenocryst population (sensu lato) of a volcanic sample is often separated into indigenous phenocrysts that have grown entirely from the transporting melt and entrained exogenous antecrysts and xenocrysts. Many exogenous crystals, however, have mantles and/or rims that are in equilibrium with the melt and thus have a mixed exogenous-indigenous origin. Signatures of crystal growth histories are easily mapped via stunning advances in compositional imaging (e.g., QEMSCAN, Neave et al., 2014, 2017), tomographic imaging (e.g., Gualda et al., 2004; Mock and Jerram, 2005; Pamukcu and Gualda, 2010; Jerram et al., 2018; Polacci et al., 2018; Tripoli et al., 2019), microstructural analysis (e.g., Kahl M. et al., 2017; Holness et al., 2019) and isotopic analysis (e.g., Davidson et al., 2007; Morgan et al., 2007). Textural (size and shape) analysis of phenocryst populations, however, has yet to capitalize on these advances, particularly from the perspective of analyzing and interpreting the crystallization histories of crystals with mixed origins.
The past few decades have also seen a dramatic increase in both analysis of groundmass textures and experimental studies of crystallization relevant to syn-eruptive volcanic processes. Measurements of groundmass crystal populations can be linked to volcanic processes where sample times are well constrained (e.g., Cashman et al., 1999; Hammer et al., 1999, 2000; Cashman and McConnell, 2005; Wright et al., 2012; Preece et al., 2016; Harris et al., 2020) but textural interpretations must rely on experimental constraints when temporal data are not available. Experimental studies, in turn, underline the sensitivity of groundmass crystal populations to initial conditions (super- or sub-liquidus) and melt composition as well as cooling and decompression paths (e.g., Brugger and Hammer, 2010a, b; Martel, 2012; Riker et al., 2015a; Befus and Andrews, 2018).
Here I illustrate ways in which analysis of crystal textures can be linked to dynamic views of crystallization processes in volcanic systems. I focus primarily on studies of plagioclase crystallization, as this phase is both the most common and the most commonly analyzed; an excellent review of crystallization of mafic phases is provided by Hammer (2008). Context is provided by a brief review of the basic tenets of textural analysis and the relation between sample textures and the crystallization pathways that produced them. This is followed by an overview of cooling-driven crystallization of basaltic lava on the Earth’s surface, where experimental results can be linked to textural and compositional measurements of well-constrained samples. Syn-eruptive decompression-driven crystallization is more challenging to study in both experimentally and active volcanic systems; studies in these systems show broad agreement but highlight the need for experimental constraints on very shallow subvolcanic processes. Unraveling complex histories of phenocryst populations poses more profound challenges that will require, ultimately, combining techniques of isotopic analysis, diffusion chronometry and compositionally based crystal size distribution (CSD) and shape analysis.
Background
The basic concepts of crystallization and crystal size distribution (CSD) analysis are well reviewed by Marsh (1998) and Hammer (2008) and are only briefly reviewed here. Crystallization requires both crystal nucleation and growth of those nuclei. Rates of crystal nucleation and growth are functions of magma supersaturation, which is commonly described by the effective undercooling (ΔTeff), or the temperature difference between the magma and the saturation temperature of the phase in question.
ΔTeff is a straightforward concept for cooling-driven crystallization; it is less intuitive for decompression-driven crystallization, where supersaturation is more logically formulated as Δφ, the difference between the reference crystallinity (e.g., the crystallinity at the starting pressure) and the crystallinity at some lower pressure (Brugger and Hammer, 2010a, b; Riker et al., 2015a, b; Befus and Andrews, 2018). Importantly, in multicomponent systems supersaturation is not a fixed value, but varies with temperature and/or pressure. This is illustrated in Figure 1A, which shows equilibrium Δφ as a function of pressure for decompression of different H2O-saturated bulk compositions. Experimentally, Δφ can be imposed by rapid decompression from liquidus conditions to a final pressure (Pf). Under these conditions, rates of crystal nucleation (J) peak at larger Δφ than rates of crystal growth (G), as illustrated in Figure 1B, where the ratio J/G is shown as a function of Pf. At a given Pf, the rate of crystallization is time-dependent, decreasing as the system approaches equilibrium. For this reason, measured nucleation and growth rates will vary depending on the time interval of measurement. For example, time-sequential measurements of crystal size (filled circles and solid line in Figure 1C) yield instantaneous growth rates (dashed lines) that are both faster and slower than the time-averaged value derived from the final experiment alone (line labeled apparent G).
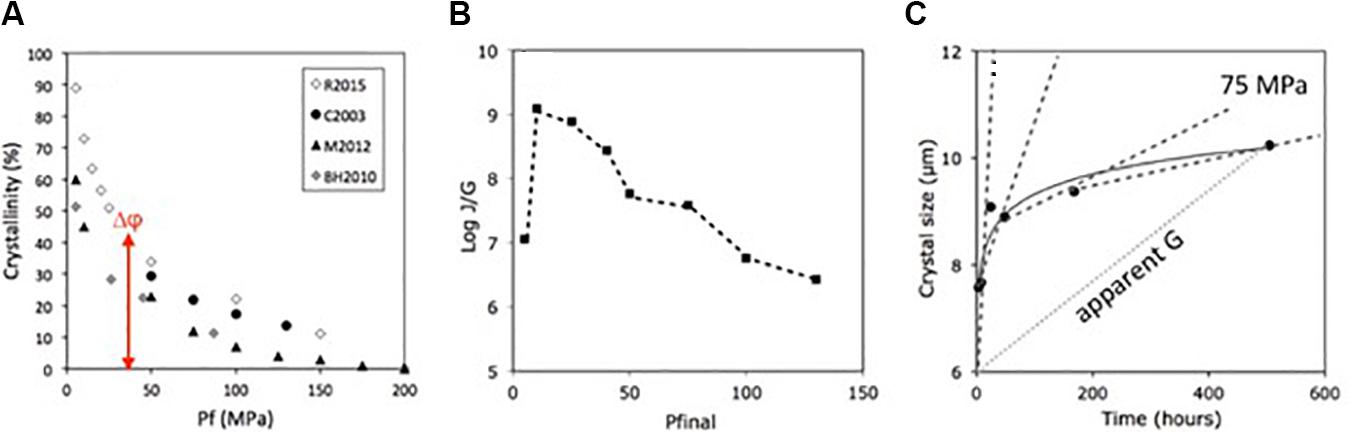
Figure 1. Experimental constraints on phase relations and kinetics. (A) Equilibrium crystallinity as a function of pressure. Data from Riker et al. (2015a; R2015), Couch et al. (2003; C2003), Martel (2012; M2012), and Brugger and Hammer (2010b; BH2010). (B) Average ratio of nucleation rate (J) to growth rate (G); data from experiments of Hammer and Rutherford (2002). (C) Crystal size as a function of time at Pf = 75MPa. Dashed lines show growth rates between different experiment times; dotted line shows the time-averaged, or apparent, growth for the entire duration of the experiment.
The relative rates of crystal nucleation and growth determine the final texture of a sample, where here I use the term texture to mean the abundance and size distribution of the constituent crystals. For the same total crystallinity, high nucleation rates produce numerous small crystals, while high rates of growth on a limited number of sites produce fewer but larger crystals. Theoretical studies of crystallization provide expressions for crystal nucleation and growth that can be parameterized to link crystal size (L) and number density (Nv, per volume) to time-averaged rates of J and G (e.g., Brandeis and Jaupart, 1987):
In both expressions, the constant of proportionality is of order 1 except where nucleation is an exponential function of time (Marsh, 1998). This parameterization illustrates the strong control of J/G on crystal number and can be linked directly to experimental data (Figure 1B).
Quantitative Textural Analysis
The simplest (and often most expedient) form of textural analysis relates measured crystal number density (Na, number per area) to the total area fraction occupied by the crystals (φa) through the average crystal area (d2, where d is a measure of crystal size) as
Where progressive crystallization is achieved primarily by adding new crystals (nucleation), φa increases linearly with Na and the slope of the line yields the average crystal area (1/slope = d2; Hammer et al., 1999). In contrast, where an initial period of nucleation is followed by crystal growth, crystallinity increases at a near-constant (or even decreasing) Na. A plot of Na vs. φa for sequentially crystallized samples can thus be used to determining the relative importance of nucleation and growth in driving crystallization (Hammer et al., 1999, 2000).
Measurements of Na and φa in two dimensions can be related to three-dimensional measurements through use of simple stereological assumptions. When crystals are randomly oriented, the measured area fraction is directly equivalent to the volume fraction (φv). The number per volume (Nv) can be related to the measured number per area (Na) as
if the average size (dav) is known. Since the average crystal size can be determined from Eq. (3; dav = √d2), Nv for each sample may also be determined (Nv = Na1.5/ φa0.5).
Crystal size distributions analysis provides a more complete view of a sample’s crystallization history. CSD analysis was developed for steady state crystallizers (e.g., Randolph and Larson, 1988). Here the desired output CSD is controlled by (1) the seed crystals in the input solution, (2) the time spent in the crystallizer, and (3) the rate at which crystals nucleate and grow within the crystallizer (controlled by the supersaturation). Under steady conditions, the crystal number density n (the slope of the cumulative distribution, with units of number per size class per volume) is related to crystal size L as
where n°, the nucleation density, is the intercept at L = 0; Ld, the dominant size, is measured by the slope of the distribution (Ld = −1/slope = −1/Gt). Mathematically, Ld is the mode of the size-based distribution (the first moment of the integral form of Eq. 5) and is analogous to the half-life described by the radioactive decay equation; the equivalent half-size would be Ld/ln 2. In an industrial crystallizer, t is known and G can be calculated. The nucleation rate J is related to the nucleation density as J = n°G, the total number of crystals is n°Gt, and the total volume fraction (VT) of the measured phase is
where kv is the shape factor required to convert Ld3 to the true three-dimensional volume of a single crystal.
The application of CSD analysis to volcanic samples presents numerous challenges. The first relates to definition of crystal size. In thin section, crystal size can be measured variously as the short axis, long axis, √area or average intersection length; the choice of size metric affects both the slope and the intercept of the resulting CSD (Cashman, 1988; Muir et al., 2012). A second challenge relates to conversion of data collected on 2D thin sections to the 3D formulation of CSD analysis. A solution to this problem is provided by the widely used program CSDCorrections, where a constant average crystal shape (determined from CSDSlice) is used to correct for both the cut effect and the intersection probability (Higgins, 2006). An alternative approach is to make measurements directly in 3D. Techniques to obtain direct 3D measurements have included deconstruction of vesicular volcanic material to extract individual crystals (Dunbar et al., 1994; Gualda et al., 2004), serial sectioning of samples (Castro et al., 2003; Duchene et al., 2008), and, more recently, tomographic techniques that allow non-destructive 3D measurements (e.g., Gualda et al., 2004; Mock and Jerram, 2005; Gualda and Rivers, 2006; Jerram et al., 2010; Pamukcu and Gualda, 2010), and even 4D (e.g., Polacci et al., 2018; Tripoli et al., 2019).
Direct comparison of CSDs calculated from 2D and 3D measurements shows that the cumulative area distribution in 2D closely approximates the cumulative volume distribution in 3D (Jerram et al., 2009). This observation lends support to the definition of average crystal size as d = √area (Eq. 3). CSD slopes and number densities are generally in good agreement except at the smallest sizes, where CSDs calculated using CSDCorrections may show high number densities that contrast with downturns in the number of small crystals measured in 3D (Castro et al., 2003). One explanation for this discrepancy is that crystals of different sizes have different shapes. For example, prismatic pyroxene microlites measured by Castro et al. (2003) become more anisotropic with increasing size, while the tabular plagioclase crystals imaged by Duchene et al. (2008) are more equant with increasing size. More generally, the response of specific morphologies to sectioning affects the accuracy of shape correction. Tabular crystals, for example, are more easily recognized and quantified than prismatic crystals because of statistical problems associated with intersecting the longest axis in very acicular forms (Morgan and Jerram, 2006); this problem is further complicated in mixed crystal populations. The sensitivity of stereological corrections to crystal shape suggests caution when calculating CSDs over a large size range using a single shape factor (see also Mock and Jerram, 2005; Brugger and Hammer, 2010a).
More fundamental challenges to CSD analysis lie in the extent to which conditions of crystallization in natural systems deviate from those in steady state industrial crystallizers. Even in simple volcanic systems, crystallization does not occur at fixed undercoolings (Figure 1), or with constant crystal and melt compositions, and the final crystal size distribution preserved in any sample necessarily represents an integration of nucleation and growth processes over time. This means that extraction of kinetic parameters is possible only for samples with independent time constraints. Other complications relate to the effects of simultaneous crystallization of multiple phases, which may increase the potential for heterogeneous nucleation and as well as the likelihood of crystal-crystal impingement (e.g., Zieg and Lofgren, 2006; Holness et al., 2007). The presence of pre-existing crystals also affects the conditions under which a new batch of nuclei will form (Fokin et al., 1999). Below I explore these challenges through the lens of recent experiments and their applications to the interpretation of crystal size characteristics of volcanic samples.
Cooling-Driven Crystallization of Basalt at 1 Atm
Experimental investigation of cooling-induced crystallization at 1 atm has a long history, reaching back to the Neptunist-Plutonist arguments of the late 18th and early 19th centuries. By the early 20th century, establishment of the Hawaiian Volcano Observatory had prompted volcanologists to examine the chemical and physical properties of basaltic lava and controls on flow emplacement. Included in this work was investigation of the contrasting surface morphologies of pāhoehoe and ‘a‘ā flows and the observed along-channel transformation of lava from pāhoehoe to ‘a‘ā with increasing transport distance. Emerson (1926) addressed this problem by melting lava in a forge and stirring it as it cooled, experiments that demonstrated the importance of shear in generating the numerous small crystals that characterize ‘a‘ā lava.
Cooling Rate Experiments
Kinetic experiments on low viscosity basaltic melts performed at 1 atm (e.g., Kouchi et al., 1986; Sato, 1995; Pupier et al., 2008; Vona and Romano, 2013) provide quantitative insight into the crystallization kinetics of lava flows on the Earth’s surface. First, experiments that start at super-liquidus conditions show small changes in initial temperatures can have profound impacts on the final sample textures (Sato, 1995; Vetere et al., 2013). Second, for similar initial conditions, cooling rate exerts a strong control on plagioclase number density (and size) but does not affect the crystallinity, which rapidly approaches equilibrium values (Pupier et al., 2008). Deformation experiments (Kouchi et al., 1986; Vona and Romano, 2013; Tripoli et al., 2019) have validated Emerson’s (1926) conclusions about the role of stirring in generating high crystal nucleation rates, interpreted to reflect the role of melt advection during stirring, although mechanical breakage to form secondary nuclei may also be important.
Textural analysis of cooling rate experiments highlights additional controls on final sample textures. Experiments initiated at superliquidus temperatures (Pupier et al., 2008) produce Na-φ trends positive (low cooling rates) to negative (high cooling rates) slopes and CSDs that “fan” with decreasing quench temperature (increasing crystallinity; Figure 2). The reduction in crystal number accompanying increasing crystallinity requires a substantial increase in crystal size as well as loss of some crystals; both signatures can be explained by crystal agglomeration (synneusis; Schwindinger and Anderson, 1989). Alternative explanations come from recent innovations in 1 atm experiments (e.g., Schiavi et al., 2009) that allow in situ observations of olivine growth (Ni et al., 2014). In these experiments, a decrease in the number of early-formed nuclei is attributed to Ostwald ripening, consistent with results of Cabane et al. (2005) that show ripening is most effective for very small crystals. Also important is size-dependent growth, such that large crystals grow faster than small crystals (e.g., Eberl et al., 2002; Kile and Eberl, 2003). In the experiments of Ni et al. (2014), size-dependent growth is attributed to melt advection, as measured growth rates are faster than those expected for diffusion alone. Size-dependent growth also produces fanning CSDs, as required to conserve the total number of crystals (=n°Gt).
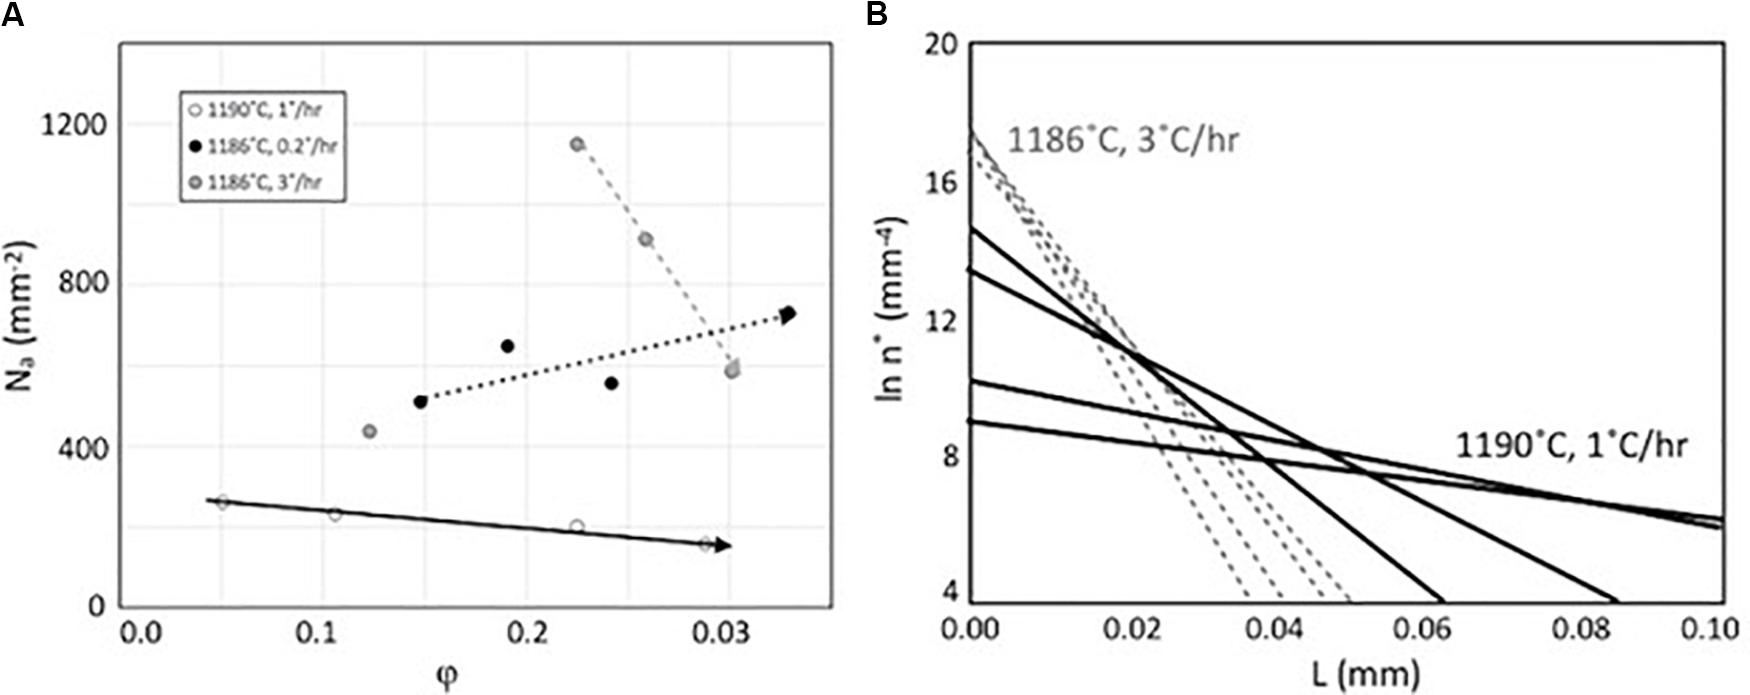
Figure 2. Plagioclase textures in cooling experiments on basalt. (A) Crystal number density (mm–2) vs. plagioclase volume fraction (φ) for different initial temperatures (all above the plagioclase liquidus temperature of 1175°C) and cooling rates. (B) CSDs for two of the three sample suites shown in (A). Data from Pupier et al. (2008).
Natural Cooling Experiments
Natural examples of cooling-driven crystallization are provided by studies of crystallization in Hawaiian lava flows (e.g., Cashman et al., 1999; Soule et al., 2004; Riker et al., 2009; Cashman and Mangan, 2014). Here time constraints are provided by samples collected along active lava channels on the same day (e.g., Crisp et al., 1994; Cashman et al., 1999), flow cooling is measured by glass geothermometry and eruption of lava at near-liquidus temperatures means that crystallization is driven by cooling accompanying flow. Rates of cooling (∼18°C/hr) and crystallization (∼1.8 φ/hr) are obtained by combining distance with known flow velocities along proximal to medial flow reaches. Temporal rates of both cooling and crystallization appear to be independent of eruption rate, which suggests that textural analysis of older flows can be used to infer eruption rates (e.g., Riker et al., 2009).
Crystallization of Hawaiian lavas is dominated by cotectic precipitation of plagioclase and pyroxene, which typically form crystal clusters that indicate the prevalence of heterogeneous, rather than homogeneous, nucleation (Figure 3A). Textural analysis of along-channel samples shows positive correlations between Nv and φ for both phases (Figure 3B), consistent with rapid and nucleation-dominated crystallization (e.g., Cashman et al., 1999; Riker et al., 2009). CSDs are linear, as expected for continuous cooling from near-liquidus conditions, and, when sample locations and flow rates are well constrained, yield nucleation rates of ∼50–150/mm3s and growth rates ∼10–7 mm/s (Cashman and Mangan, 2014). These high rates likely reflect strong advection driven by efficient heat loss at the channel margins (e.g., Cashman et al., 2006).
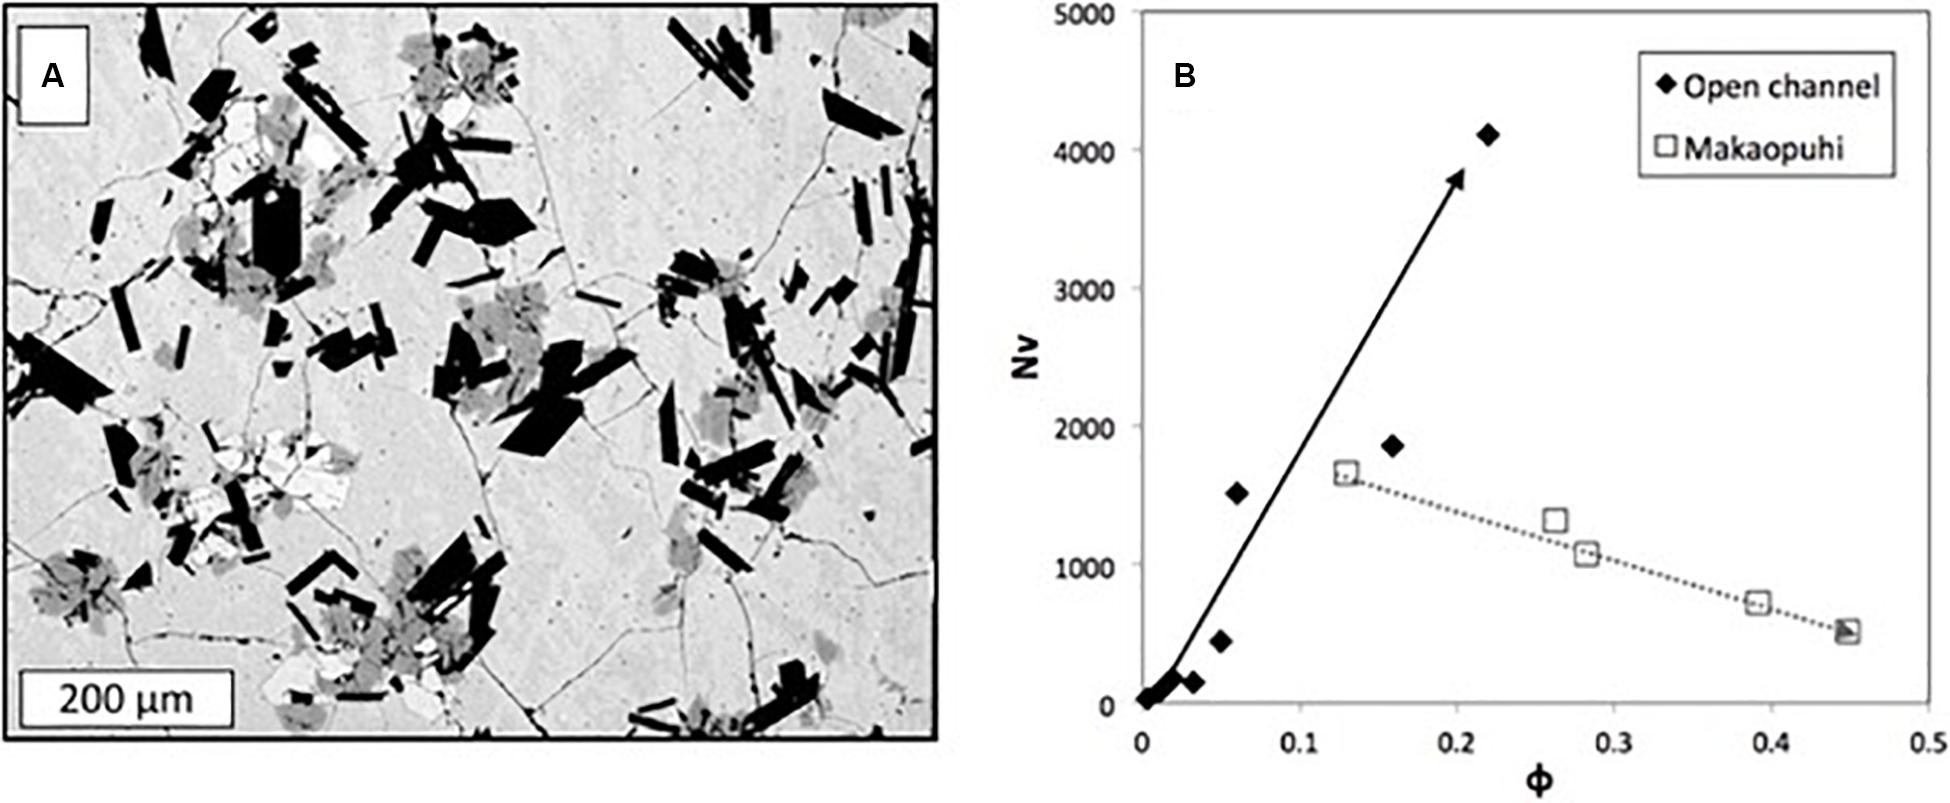
Figure 3. Plagioclase textures in Hawaiian basalts. (A) Sample from the Makaopuhi lava lake drill core showing heterogeneous nucleation of plagioclase (black), pyroxene (gray) and olivine (white) crystals. (B) Nv-φ data illustrating the contrasting crystallization regimes of open channel flows from Kilauea and drill core samples from Makaopuhi lava lake.
The nucleation-controlled crystallization observed in open channel samples contrasts with the growth-dominated crystallization observed in insulated pahoehoe flows and lava lakes (Cashman and Marsh, 1988; Cashman and Mangan, 2014). The latter show both decreasing Nv with decreasing φ (Figure 3B) and fanning CSD trends similar to those produced by super-liquidus experiments (Pupier et al., 2008; Ni et al., 2014; Figure 2). It seems likely that crystal agglomeration, loss of the smallest crystals via Ostwald ripening and size-dependent growth rates all contribute to these textural trends. Mafic enclaves may also show linear CSDs with characteristics (n°, Ld; e.g., Martin et al., 2006a) that are similar to the most crystalline samples from lava lakes (e.g., Cashman and Mangan, 2014). The implied slow cooling suggests that crystallization of these enclaves occurred before, not after, entrainment in the melt. Pre-entrainment crystallization is further suggested by the lack of correlation between measured textures and enclave size (Coombs et al., 2003) and suggests that existing plagioclase frameworks may help to preserve enclaves during the entrainment process (Martin et al., 2006b; Andrews and Manga, 2014).
Decompression-Driven Crystallization of Hydrous Magmas
Questions about conditions leading to explosive vs. effusive eruptions (e.g., Cassidy et al., 2018) have driven an explosion of experiments designed to characterize decompression-driven crystallization of hydrous magma (e.g., Hammer, 2008). These experiments span a wide range of compositions and initial conditions (P, T, and XH2O), although most have been conducted on H2O-saturated silicic melts. Plagioclase is the most abundant crystallizing phase, and the most universally quantified for crystal size and shape. Experimental aims are to determine rates of crystallization, often with the goal of constraining magma ascent paths for specific eruptions. The past two decades have also seen an impressive increase in the number of textural studies of volcanic samples, many of which have been done in conjunction with experimental studies. Although very rapid decompression prevents crystallization, syn-eruption crystallization is observed in products of (1) short explosions that mark the buildup to large Plinian eruptions, (2) cycles of Vulcanian activity, and (3) episodic or continuous lava effusion (including ash venting and dome collapse).
Decompression Experiments
Decompression experiments are conducted using (1) single-step decompressions (SSD), which involve an initial rapid pressure decrease followed by time at the final pressure, (2) multi-step decompressions (MSD), where steps and dwell times are varied to approximate different decompression rates, and (3) continuous decompression (CD). SSD experiments typically produce high Nv (high initial nucleation rates) but require annealing at final pressures to achieve equilibrium crystallinity values; nucleation and growth rates reported for these experiments vary depending on anneal duration (e.g., Befus and Andrews, 2018; Figure 1C). MSD experiments are difficult to generalize as they vary in both step size and hold time at each step. CD experiments (Brugger and Hammer, 2010a, b; Riker et al., 2015a, b; Waters et al., 2015; Befus and Andrews, 2018) are not annealed at the final pressure (Pf), so that the crystallization time is controlled by the decompression rate and pressure interval of interest.
Decompression experiments have been performed over time periods of hours to weeks; this means that they are most relevant to syn- and short intra-eruptive periods of crystallization. Resulting plagioclase textures span a wide range that reflects variations in melt composition, initial conditions and rates and modes of decompression. Experimental data are shown in Figure 4; here Nv and φ are used as plotting parameters as they are the easiest textural parameters to measure and correlate well with the results of more detailed CSD analysis (Brugger and Hammer, 2010a). Experimental crystallinities are typically less than 0.3 and number densities range from 102 to 107/mm3; they vary most strongly with Pf and melt composition such that low Pf, low temperatures and silicic compositions produce the highest Nv.
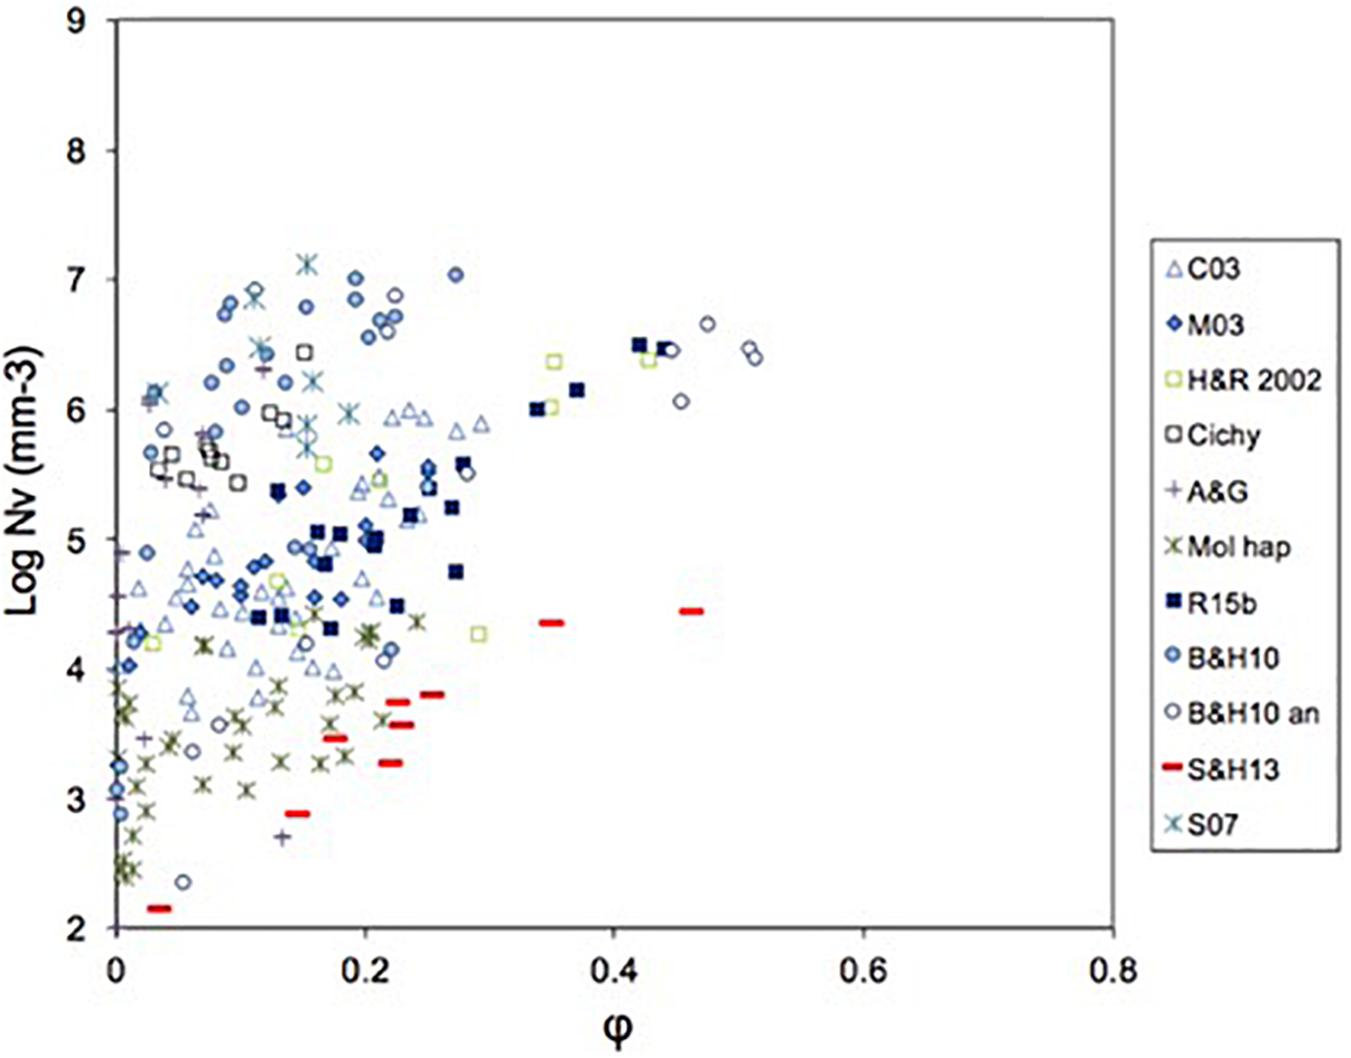
Figure 4. Compilation of textural data from decompression experiments. Data from Couch et al. (2003; C03), Martel and Schmidt (2003; M03), Hammer and Rutherford (2002; H&R2002), Cichy et al. (2011); Andrews and Gardner (2010; A&G), Mollard et al. (2012; Mol hap), Riker et al. (2015b; R15b), Brugger and Hammer (2010b; B&H10), Shea and Hammer (2013; S&H13), and Suzuki et al. (2007; S07).
As observed in cooling experiments, the initial conditions matter. Super-liquidus starting conditions inhibit crystal nucleation and promote crystal growth relative to sub-liquidus samples run at the same conditions (Martel, 2012; Waters et al., 2015). Pre-existing crystals, in contrast, provide sites for crystal growth and therefore allow crystallization even when Δφ is sufficiently small to prohibit nucleation of new crystals. Growth on pre-existing crystals can be significant. For example, if growth rates are linear and similar on all major growth faces, adding rims to large crystals will produce more efficient crystallization, volumetrically, than adding new small crystals (Befus and Andrews, 2018). One consequence is development of those pre-existing crystals as a separate population that adds pronounced curvature to CSD plots (Brugger and Hammer, 2010b; Riker et al., 2015b; Figure 5).
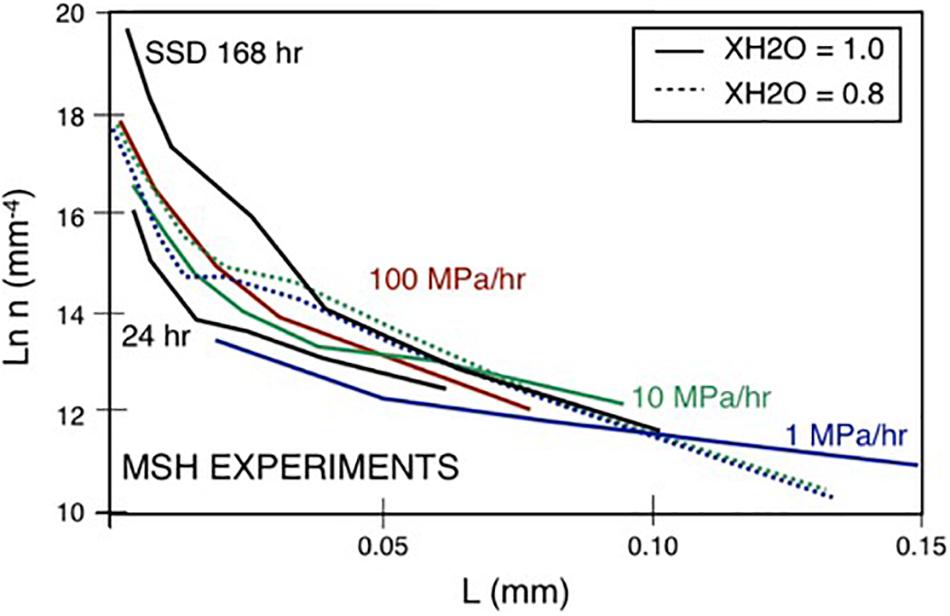
Figure 5. Variations in texture with decompression rate, decompression style (SSD experiments denoted by labeled annealing time) and XH2O. Redrafted from Riker et al. (2015b).
Decompression-Crystallization During Eruptions
A compilation of groundmass plagioclase data from pyroclasts and lavas produced by recent eruptions is shown in the Nv-φ plot of Figure 6. The data are from a range of bulk compositions and eruption styles, span wide range of Nv (102 to > 108 mm–3) and include variations of φ from near 0 to 0.8. Although all samples were quenched at the surface, they are interpreted to reflect a range of P and T conditions that record different conduit processes. In detail, rhyolitic samples from Pinatubo, Philippines (PIN), have the lowest crystallinities while basaltic andesite samples from Merapi, Indonesia (MER), and Spurr, Alaska have the highest. Pyroclasts from an individual eruption sequence can show a wide range of crystallinities, but less common is a wide range in Nv.
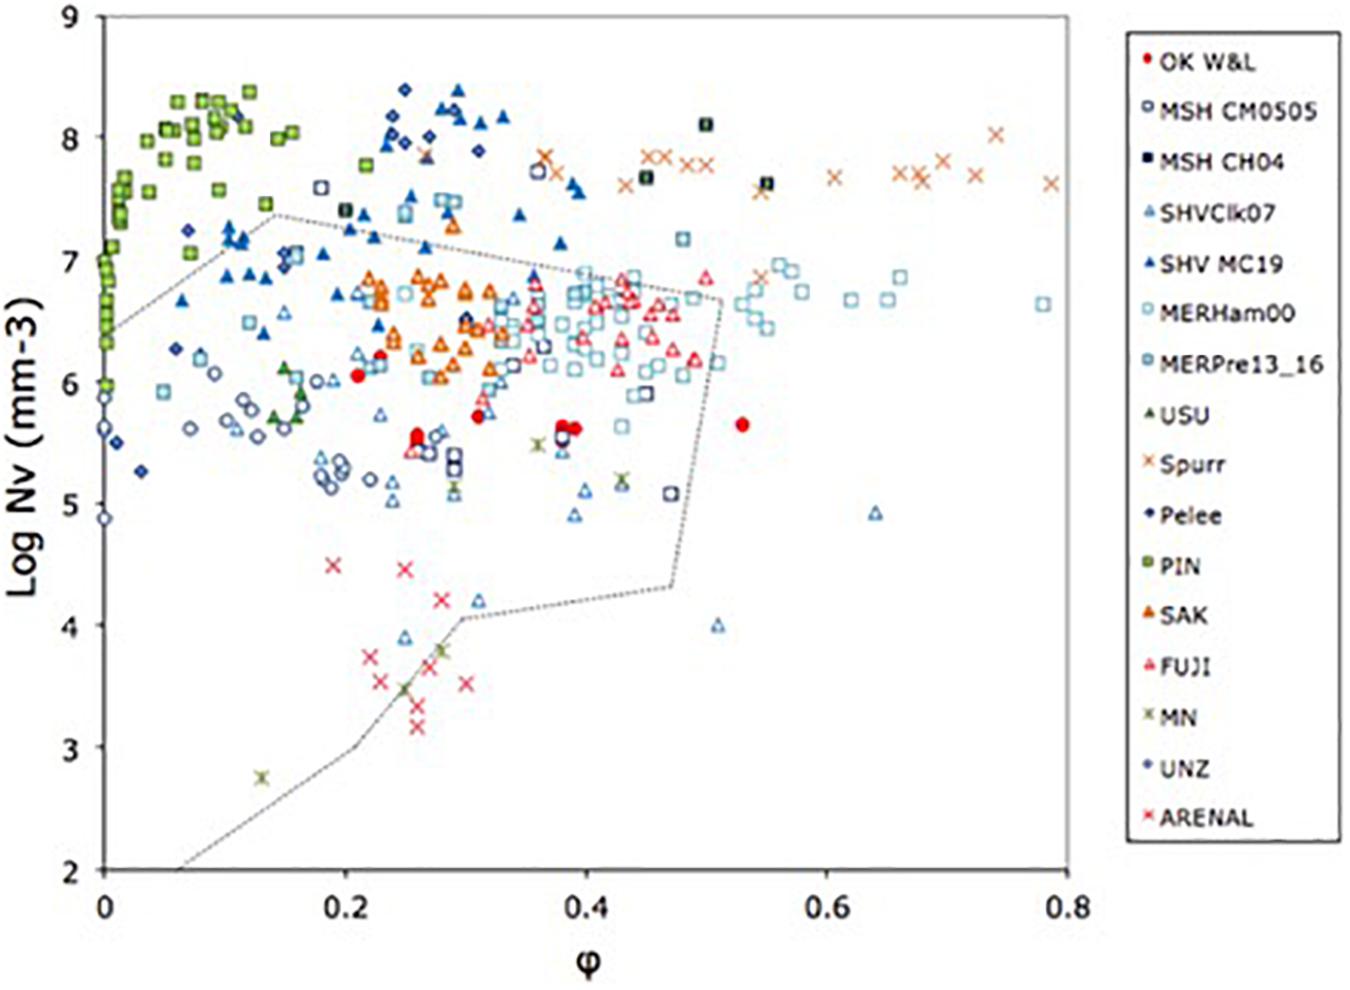
Figure 6. Compilation of textural data from erupted samples. Data from Wong and Larsen (2010; OK W&L); Cashman and McConnell (2005; MSH CM0505); Cashman and Hoblitt (2004; MSH CH04); Clarke et al. (2007; SHVClk07); Murch and Cole (2019; SHVMC19); Hammer et al. (2000; MERHam00); Preece et al. (2013, 2016; MERPre13_16); Suzuki et al. (2007; USU); Gardner et al. (1998; Spurr); Martel and Poussineau (2007; Pelee); Hammer et al. (1999; PIN); Miwa et al. (2009; SAK9); Suzuki and Fujii (2010; FUJI); D’Oriano et al. (2005; MN); Noguchi et al. (2008; UNZ); Szramek et al. (2006; Arenal).
Comparison of Figures 4, 6 shows good agreement between experimental data and many of the sample suites, thus demonstrating the power of combining these two approaches to constrain eruption conditions. Where experiments attempt to replicate textures of natural samples (e.g., Mount St. Helens – Muir et al., 2012 and Riker et al., 2015b; Pinatubo – Hammer et al., 1999 and Befus and Andrews, 2018) the CSDs are similar in form but experiments fail to reproduce the large number of small microlites observed in some natural samples. This mismatch can be seen in Figure 6, where number densities of natural samples can exceed experimental values by 1–2 orders of magnitude.
Eruption Conditions That Produce Very High Nv
Very high groundmass crystal number densities were first measured in pyroclasts from eruptions that preceded the 1991 climactic eruption of Pinatubo, Philippines, the largest well-documented volcanic eruption in the 20th century. The climactic eruption was preceded first by a dome and then 3 days of explosive activity that decreased in duration and increased in frequency approaching the climactic eruption (Hoblitt et al., 1996); this pattern of activity has been interpreted to record construction of a connected conduit from the magma reservoir to the surface (Scandone et al., 2007). The very high plagioclase number densities occur in the most crystalline samples and increase in maximum crystal size with increasing inter-eruptive repose time (Hammer et al., 1999; Figure 6). Crystals in individual samples form linear CSDs with very high n° and steep slopes (Figure 7A). A limited range in matrix glass H2O records magma arrest in the conduit at effective pressures of c. 8–16 MPa. Together the textural data and glass volatile contents suggest crystallization by rapid decompression during an explosion, followed by annealing at shallow levels in the conduit during the short inter-explosion repose periods (28–262 min) and expulsion during the next explosion.
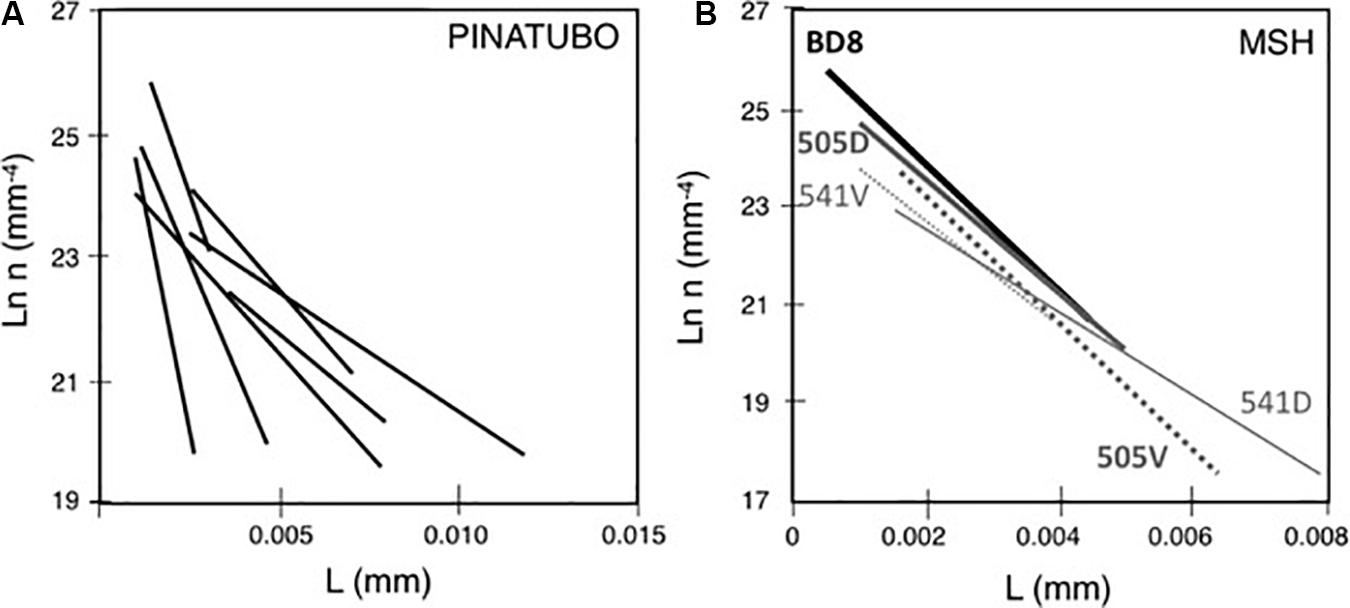
Figure 7. CSDs for high number density groundmass samples. (A) Pinatubo, 1991; data from Hammer et al. (1999). (B) MSH cryptodome. 541 samples were erupted early, and 505 samples were erupted late; D and dense and V are vesicular. Samples described in Cashman and Hoblitt (2004).
The high number densities of Pinatubo pyroclasts are not unique to this eruption but have also been observed in pyroclasts associated with the P1 Plinian eruption of Mont Pelee (650 ybp; Martel and Poussineau, 2007) and in some samples from the 1980 eruptions of Mount St. Helens (Klug and Cashman, 1994; Cashman and McConnell, 2005; Figure 6). As at Pinatubo, the high Nv pyroclasts likely record rapid decompression followed by short (hours) anneal times. Interestingly, very high crystal numbers are also reported in cryptodome samples from Mount St. Helens (MSH; Cashman and Hoblitt, 2004), in surge deposits from Mont Pelee (Martel and Poussineau, 2007) and in block-and-ash flow deposits formed by collapse of the Soufriere Hills dome in 2010 (Murch and Cole, 2019; Figure 8). Although individual pyroclasts from MSH reach higher overall crystallinities than those from Pinatubo (Figure 8), crystal populations form linear CSDs that have a similar range of intercept and slope (Figure 7B). The very high crystal number densities in dome and cryptodome samples are puzzling. Both observational and experimental constraints show that effusive eruption and emplacement of silicic lava domes (and cryptodomes) requires very slow magma ascent to very low pressures. Under these conditions, we might expect extensive decompression-driven crystallization at relatively low Δφ. How is it possible, then, to generate a uniform, finely crystalline but still melt-rich groundmass?
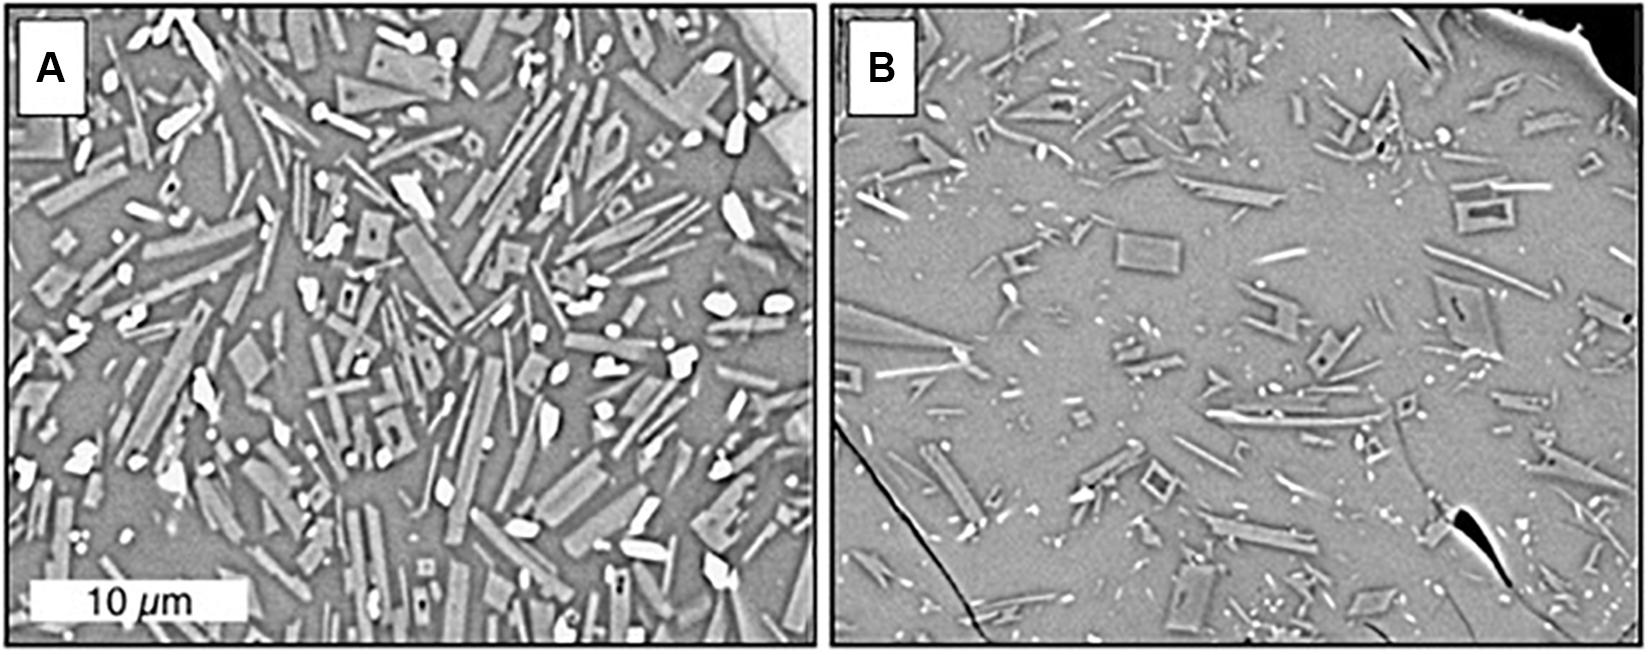
Figure 8. Groundmass textures in MSH cryptodome samples. These samples are from precursory explosions described in Cashman and Hoblitt (2004) but show the same textural range as the blast dacite erupted on 18 May. (A) Shows abundant well-formed plagioclase crystals and (B) shows sparser and more skeletal plagioclase crystals. Scale bar is the same in both images.
Complex Crystallization in Volcanic Systems
Overwhelming documentation of the prevalence of antecrysts in magmatic systems (e.g., Bacon and Lowenstern, 2005; Humphreys et al., 2006; Smith et al., 2009; Viccaro et al., 2010; Neave et al., 2013, 2014, 2017; van der Zwan et al., 2013; Witter et al., 2016) has been critical for the development of mush-dominated paradigms of magmatic systems (e.g., Edmonds et al., 2019; Sparks et al., 2019). Entrained crystals can be identified by major element and/or isotopic compositions that are not in equilibrium with the transporting magma (e.g., Morgan et al., 2006, 2007; Berlo et al., 2007; Martin et al., 2010; Sakyi et al., 2012; Cashman and Blundy, 2013; Sides et al., 2014; Brenna et al., 2018; Shane et al., 2019) and by evidence of deformation in crystal-rich mush zones (e.g., Kahl W. et al., 2017; Befus et al., 2019; Holness et al., 2019; Wieser et al., 2020). These crystals are often mantled by crystal rims that are compositionally and/or texturally distinct from the entrained core and typically in equilibrium with the carrier liquid.
Complex crystallization histories are particularly well recorded by plagioclase crystals. Examples from Mount St. Helens include inherited cores with a range of compositions and dissolution/reaction textures (Figure 9), mantles with complex oscillatory zones (Figure 9A), rims that are distinct (Figure 9B) to almost non-existant (Figure 9C) and evidence of agglomeration both before (Figure 9B) and after (Figure 9D) final rim growth. Importantly, patterns of rim growth may be mirrored by adjacent microphenocrysts (Figures 10A,B), demonstrating that both formed in response to the same decompression conditions, in this case multi-stage decompression in the volcanic conduit (e.g., Cashman, 1992; Geschwind and Rutherford, 1995; Blundy and Cashman, 2005; Cashman and McConnell, 2005).
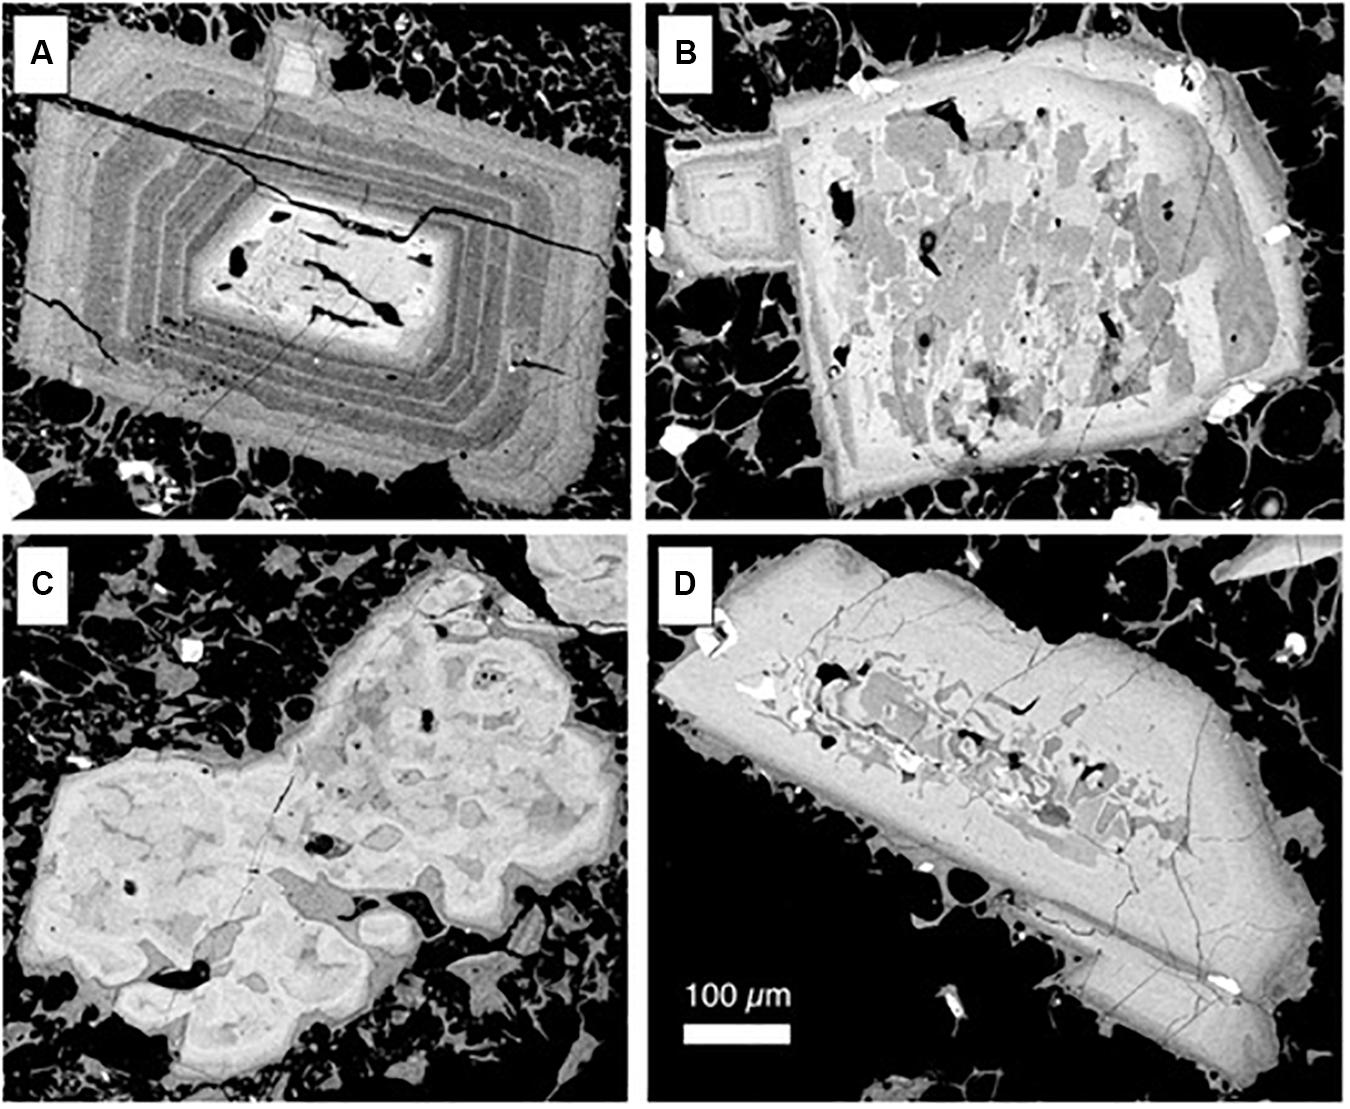
Figure 9. Example phenocryst textures from summer 1980 eruptions of Mount St. Helens (described in Cashman and McConnell, 2005). BSE images show compositional variations; brighter zones are An-rich. (A) Crystal with resorbed An-rich core and thick oscillatory zoned rim. (B) Crystal with extensive patchy resorption in the core and overgrowth rim with two zones; note the agglomerated oscillatory zoned crystal enclosed within the outer rim. (C) Highly resorbed and anhedral An-rich crystal with no rim growth. (D) Resorbed Ab-rich core with thick normally zoned rim; note late-adhering crystal with its own late-stage rim.
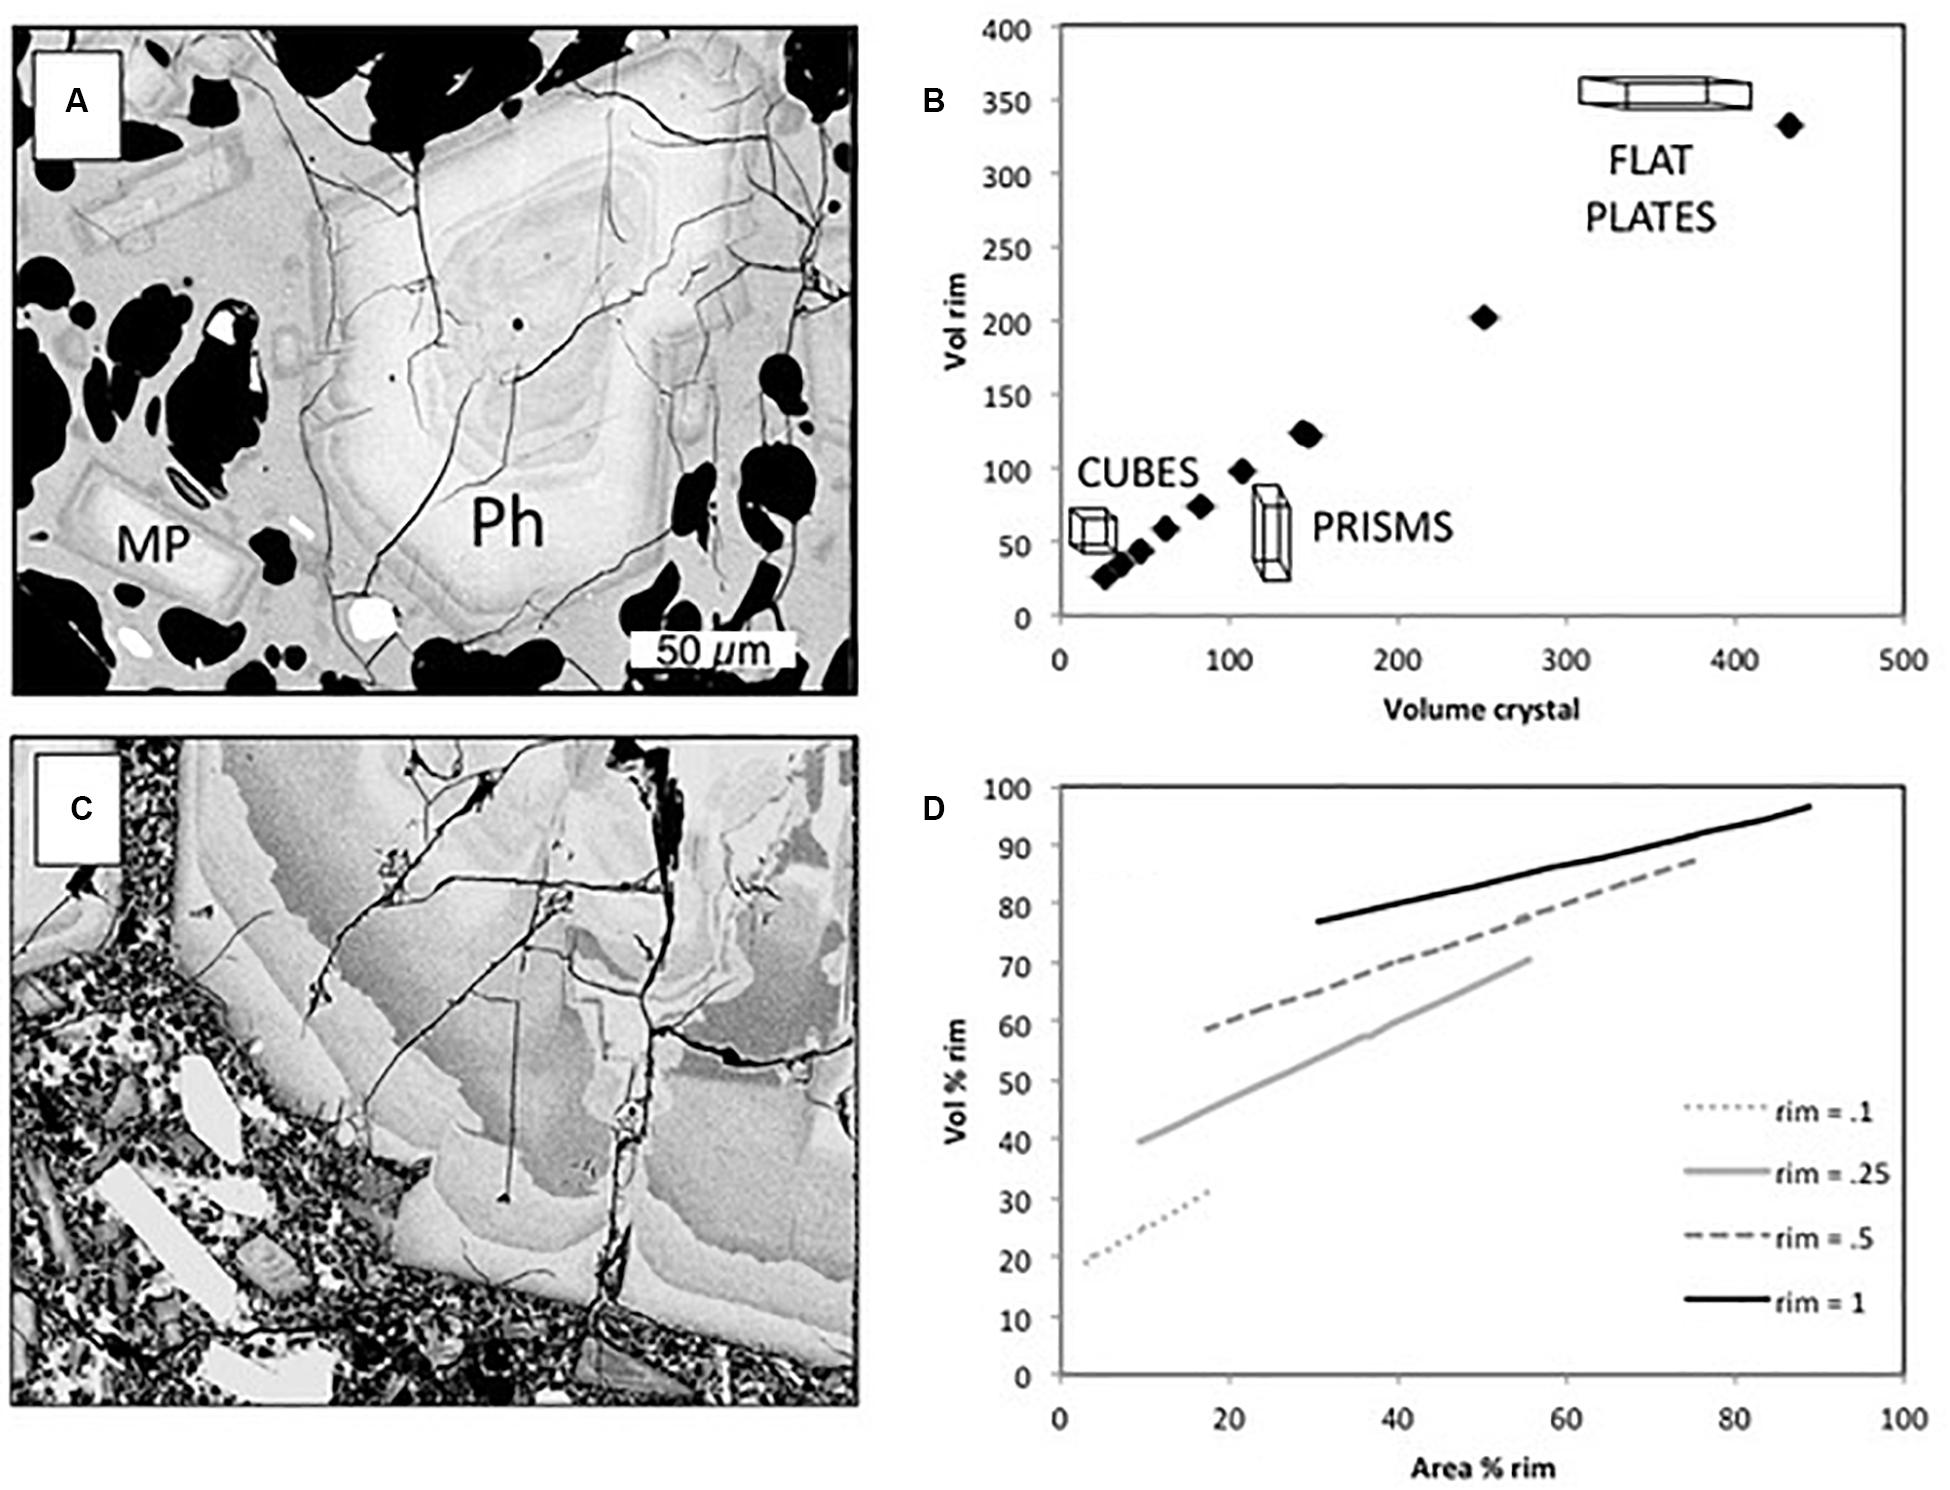
Figure 10. Rim growth in MSH samples. (A) and (C) show rim growth on crystals from summer 1980 eruptions; in (A) MP and Ph refer to the crystals mentioned in the text. (B) Calculated variations in crystal volume relative to rim volume for crystals with a short axis (SA) = 1, Intermediate axis = 1, 2, 5, 10 and Long axis = 1, 2, 5, 10 and a rim thickness of 1SA. (D) Comparison of rim area to rim volume for the same range of crystal shapes as in (B) but with variable rim thickness (0.1, 0.25, 0.5, and 1 × SA).
Although crystal rims associated with decompression are often thin, they may contribute significantly to the total volume of both individual crystals (e.g., Befus and Andrews, 2018) and the total amount of decompression-driven crystallization (Riker et al., 2015b). For example, Figure 10C shows the relation between crystal volume and rim volume for the same rim thickness but variable crystal shapes and Figure 10D shows the relation between area % and volume % of rims for variable shapes and rim thicknesses. Specifically, measurement of core and rim areas for the phenocryst (Ph) and microphenocryst (MP) in Figure 10A show that the rim comprises 16% of the phenocryst area and 46% of the microphenocryst area; this illustrates the relative importance of adding approximately the same linear thickness of rim growth to a larger and smaller crystal. The absolute addition of crystal area via rim growth, however, is ∼3.6 times larger for the phenocryst (2577 μm2) than for the microphenocryst (710 μm2); the volumetric contribution will be substantially larger. From the perspective of crystallization history, therefore, the growth of phenocryst rims can contribute substantially to the amount of decompression-driven crystallization, which is typically assessed via groundmass crystallization alone.
Alternative Approaches to CSD Analysis of Complex Crystal Populations
The diverse and complex crystal populations described above raise important questions about current approaches to CSD analysis. It is clear that the phenocrysts (sensu lato) often record more than one crystallization episode and may have time breaks, for example at resorption boundaries. Crystals in explosively erupted pyroclasts may also be extensively fragmented (e.g., Bindeman, 2005; Jerram et al., 2009; van Zalinge et al., 2018). Crystal cores may be drawn from different populations and therefore do not always represent a single crystallization event. Finally, crystal rims represent a late stage of crystallization which is often correlative with formation of the groundmass population. Therefore, if the intent of CSD analysis is to decipher crystallization histories, interpretation of CSDs by absolute crystal size may not be adequate.
Several alternative approaches to textural analysis have been suggested. Early stages of crystallization may be preserved within oikocrysts or megacrysts; measurement of these crystals is particularly useful for determining the initial crystallization conditions of plutonic rocks (e.g., Higgins, 2017). Patterns of crystal zoning can be used to identify different crystal populations and magma recharge events, which in turn can be combined with diffusion analysis to constrain the timing of magma inputs (e.g., Morgan et al., 2004, 2006; Kahl et al., 2013). Isotopic microdrilling can be used to identify individual crystallization episodes and to synchronize individual crystals for use as chronometers (e.g., Martin et al., 2010); when combined with CSD analysis (iCSDs; Morgan et al., 2007), identified crystallization events can be tied to episodic magma recharge. These methods provide important constraints on the relation between crystallization and magma input; none, however, isolates the late-stage crystallization responsible for growth of both phenocryst rims and groundmass crystals.
Here I suggest an additional approach that complements the applications of isotope tagging and diffusion chronometry described above. When crystal cores and rims/groundmass differ in composition, the contribution of different crystal components to the overall sample crystallinity can be assessed using compositional maps made directly from BSE images or element maps (e.g., Muir et al., 2012), including automated analysis such as QEMSCAN (e.g., Neave et al., 2014, 2017). To illustrate the use of compositional information in BSE images, I use an example from Mount St. Helens, where the diversity of the plagioclase population has been well documented (e.g., Berlo et al., 2007; Cashman and Blundy, 2013).
As illustrated in Figure 9, plagioclase crystals from Mount St. Helens have diverse core populations and mantles that vary in thickness, most likely as a consequence of different durations of pre-eruptive storage in the upper crust. Figure 11A shows the distribution of resorbed (yellow), high-An (turquoise) and low-An (blue) core components as well as mantle zones (green). For measurement simplicity, the crystal populations were separated into only core and mantle components; the former includes cores of variable compositions and textures, the latter includes thin rims that were difficult to isolate at the full thin section scale. Cumulative length (diamonds) and volume (triangles) distributions of cores, rims and whole crystals were calculated assuming size d = √area and volume = d3 (Figure 11B). Resulting CSDs (with Nv calculated as in Eq. 4) are linear; individual core and mantle populations have steeper slopes than measured for the whole crystal population (Figure 11C), consistent with the smaller average sizes of individual core and mantle components. The diversity of the core population prohibits interpretation of core size data as a singe crystallization event. Size information related to the mantles, however, yield information on crystal growth during pre-eruptive magma storage at ∼100–125 MPa (Cashman and Blundy, 2013). Timescales of pre-eruptive magma storage derived from diffusion studies of orthopyroxene rim growth are ≤ ∼2 years (Saunders et al., 2012); if these time scales also apply to plagioclase mantles, then the measured Gt of 0.1 mm yields growth rates ≥1.5 × 10⁻⁹ mm/s. Interestingly, this is similar to rates inferred for crystallization in mafic magmas (e.g., Patwardham and Marsh, 2011; Fornaciai et al., 2015) but faster than rates of 10–10 to 10–11 mm/s typically assumed for more silicic melts (e.g., Witter et al., 2016).
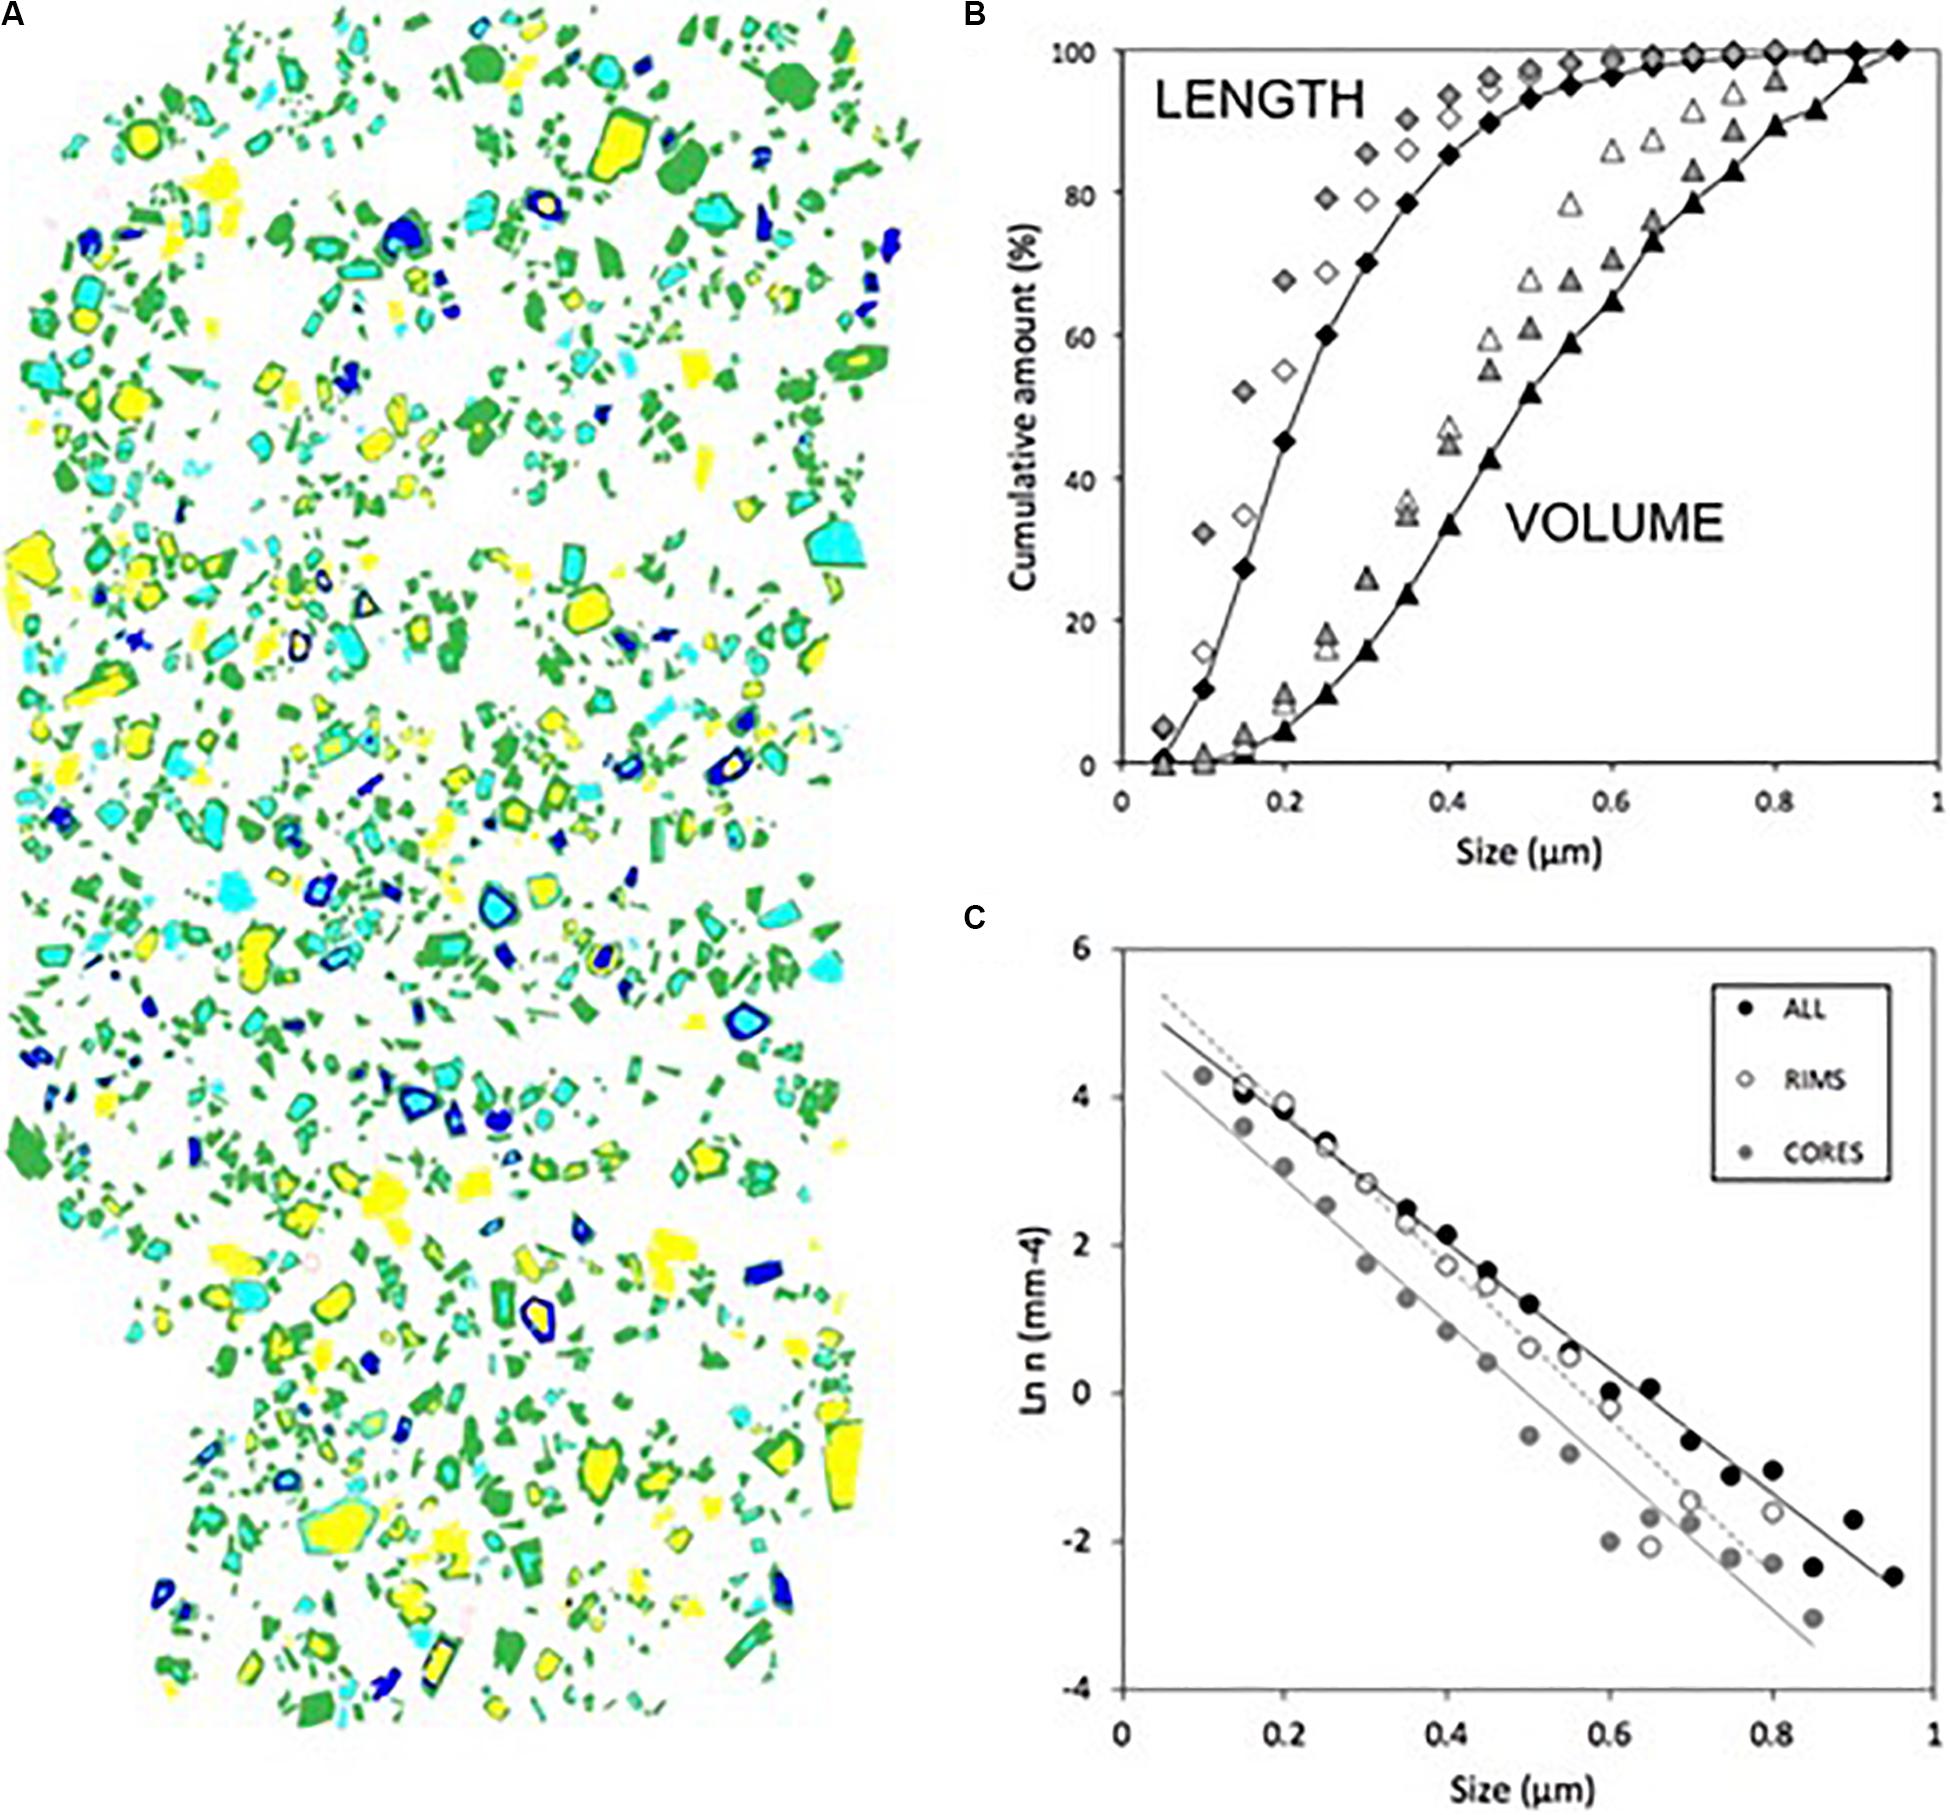
Figure 11. Example of compositionally based textural analysis of a MSH lava sample. (A) compositional discrimination of different crystallization units; yellow are An-rich cores, aqua are An-poor cores, blue are very high An zones, green are mantles plus rims. (B) Cumulative distributions of the lengths and volumes of cores (yellow + aqua), rims (green + blue) and whole crystals [identified by color, see caption of (C)]. (C) CSDs of cores, rims and complete crystals.
Discussion and Conclusion
The examples provided above illustrate both the power and the challenges of using the textures of volcanic rocks to reverse engineer the processes that formed them. Fundamental questions to ask when assessing such samples include:
(1) Does the crystal population of interest represent a single crystallization event or a mixed population?
(2) How can the measured textures be linked to the physical processes responsible for transporting magma to, and across, the Earth’s surface?
Eruption Conditions That Produce Linear CSDs
Examination of both experiments and natural samples shows that cooling-driven crystallization of basaltic lava at the Earth’s surface produces linear CSDs when the erupted magma is at near-liquidus temperatures (few to no pre-existing crystals). Studies of well-constrained lava samples have shown that the kinetics of cooling-driven crystallization are tied closely to the conditions of flow emplacement. Flow emplacement conditions, in turn, are controlled by a balance between rates of advection and rates of cooling and crust formation, coupled with the internal flow dynamics (Griffiths et al., 2003). Time- and temperature-sequential samples may show either nucleation-dominated crystallization, where plots of Nv-φ are positively and linearly correlated (Figure 3B), or growth-dominated crystallization, where CSDs fan around one or more pivot points. Nucleation-dominated crystallization characterizes open-channel basaltic lava flows, where nucleation is enhanced by shearing and melt advection in response to rapid head loss from crust-free marginal shear zones. Crystal growth dominates when cooling occurs after emplacement, for example in well-insulated lava flows and lava lakes. Sequential samples have crystal numbers that often decrease with increasing crystallinity (Figures 2A,3B), a pattern attributed to crystal agglomeration (synneusis), Ostwald ripening and/or size-dependent growth rates.
Decompression of hydrous melts can also produce Nv-φ trends that are positively and linearly correlated and associated linear CSDs; these trends are common for groundmass plagioclase crystals preserved in pyroclasts produced by pulsatory explosions (e.g., Hammer et al., 1999; Cashman and McConnell, 2005; Martel and Poussineau, 2007; Martel, 2012; Figure 7). Co-eruption of crystal-free pyroclasts that require very rapid decompression from depth and crystal-bearing pyroclasts that annealed at shallow levels provide a snapshot of the conduit stratigraphy (Cashman and McConnell, 2005); crystallization rates at different depths (pressures) can be inferred if the time of magma residence in the conduit is known. Textural analysis of these samples provides important constraints on models of magma ascent, arrest, and pressure buildup associated with cyclic eruptive activity (e.g., Diller et al., 2006; Clarke et al., 2007; Burgisser et al., 2011). Inferring time scales from measured CSDs is more difficult because growth rates vary substantially with decompression path (e.g., Brugger and Hammer, 2010a). Importantly, decompression experiments have failed to replicate the very high Nv values observed in some pyroclasts (Figures 4, 6).
The Paradox of Very High Nv
The paradox of very high Nv can be illustrated by the cryptodome that intruded into the Mount St. Helens edifice in the months prior to the 1980 eruption. Here magma intrusion into the edifice was slow and therefore the expectation would be that decompression-driven crystallization would proceed under conditions of low nucleation rates and high growth rates (small Δφ) to produce high crystallinities and relatively low crystal number densities. Instead, cryptodome samples have very high plagioclase number densities and variable plagioclase crystallinities (Figure 8). The very high groundmass number densities therefore raise two questions: (1) what conditions of magma ascent prohibited extensive decompression-driven crystallization during slow magma ascent and (2) what produced the high Nv values of the cryptodome samples?
In the 2 months prior to May 18, the volcano’s north flank was moving outward at ∼2 meters per day (0.08 m/h), which equates to a decompression rate of ∼0.002 MPa/h for an overburden thickness of density of 2500 kg/m3. This intrusion rate estimate overlaps with extrusion rates measured during continuous dome growth in 2004–2008 (0.07–0.36 m/h, or ∼0.002–0.01 MPa/h; Dzurisin, 2018) but is two orders of magnitude slower than the minimum decompression rate used in experiments. Experiments show that crystallization efficiency is reduced when decompression is slow, particularly when growth is on pre-existing crystals. This raises the interesting question of whether very slow ascent might allow magma to rise to shallow levels without (significant) groundmass crystallization, perhaps explaining the stealth nature of cryptodome emplacement.
Reconstruction of the cryptodome geometry (Donnadieu and Merle, 1998) suggests that the shallowest part of the cryptodome occupied a pressure range of ∼7–18 MPa consistent with a maximum pressure of ∼20 MPa suggested by measured H2O of 0.07–1.5 wt% in cryptodome glass (Hoblitt and Harmon, 1993; Newman and Lowenstern, 2002; Neill et al., 2010). Phreatomagmatic eruptions in the months prior to the 18 May eruption ejected material from the cryptodome (Cashman and Hoblitt, 2004); there is also isotopic evidence of open system degassing from the cryptodome during this time period (Neill et al., 2010). This raises the question of whether rapid decompression of shallow-stored magma (during a precursory eruption) followed by annealing during an inter-eruption repose period could generate the characteristic high Nv of the cryptodome samples. Similarly, the high Nv pyroclasts at Pinatubo occur in magma that stalled at pressures of 8–16 MPa between precursory eruptions (Hammer et al., 1999); here the low crystallinities can be explained by repose intervals that were much shorter than at Mount St. Helens (hours instead of days to weeks). Importantly, most decompression experiments have used initial pressures Pi ≥ 125 MPa. This raises the questions of whether very high crystal number densities could be replicated experimentally by single step decompression from low pressures followed by annealing times of hours to weeks.
Re-thinking CSD Analysis of Volcanic Material
There is abundant evidence that most volcanic materials contain a complex mixture of crystals from multiple sources. Experiments show that the presence of pre-existing crystals creates CSDs that are either kinked or curved because new groundmass crystals are added as rims grow on pre-existing crystals (Figure 5). Kinked or curved CSDs measured in volcanic samples, however, are typically treated as two populations – groundmass and phenocrysts - that experienced two separate (and unrelated) crystallization histories (e.g., Higgins, 1996; Neave et al., 2013; Witter et al., 2016). There are several problems with this interpretation. First, heterogeneous crystal cores record crystallization over different time scales (e.g., Cooper and Kent, 2014), and under different PH2O-T-X conditions (e.g., Berlo et al., 2007; Humphreys et al., 2009), and therefore do not represent a single and unique crystallization episode. Second, most crystals also have mantles (often oscillatory zoned) that record growth in pre-eruptive upper crustal magma storage regions. Variations in the thickness and composition of these mantles requires individual crystals erupted together to have spent different amounts of time, and even in different parts of, magma reservoirs prior to eruption (Cashman and Blundy, 2013). Finally, crystal rims form during magma ascent (decompression) and therefore represent the same crystallization event responsible for nucleation and growth of groundmass crystals. Treating large crystals as a single crystallizing population is therefore misleading. This problem is compounded when resulting CSD data are used to infer a crystal residence time, which requires assumption of a single average growth rate for the entire phenocryst population.
To move forward, it is important to examine the goals of textural analysis. The reason to study crystallization during eruptive episodes is clear: groundmass crystallization affects magma rheology and permeability and thus understanding syn-eruptive crystallization histories provides critical constraints for estimating magma rheology (e.g., Klein et al., 2018), modeling lava flow advance (e.g., Dietterich et al., 2017) and anticipating transitions in eruptive styles (e.g., Cassidy et al., 2018). To examine the evolution of magmatic systems and assembly of eruptive magma bodies (e.g., Flaherty et al., 2018) further requires not only identification of different crystal populations (e.g., Morgan et al., 2007; Kahl et al., 2013; Wieser et al., 2020) and sources of those populations (e.g., Morgan et al., 2007) but also the extent and conditions of their shared ascent histories (e.g., Cashman and Blundy, 2013). Measuring the amount of crystallization that can be attributed to each population would allow textural analysis to be linked, for example, to diffusion chronometry (e.g., Jerram et al., 2018) and to models of magmatic systems (e.g., Blundy and Cashman, 2008). Unraveling the crystallization histories of diverse crystal populations in thin section requires, ideally, large area compositional mapping at high resolution (e.g., QEMSCAN) coupled with detailed isotopic measurements and diffusion chronometry of individual crystals to identify the origin of, and time of entrainment, different components of each crystal population. Advances in tomographic imaging could further allow compositional textural analysis in 3D. The primary challenges of this approach are balancing spatial coverage with resolution, as well as handling the computational expense.
Author Contributions
The author confirms being the sole contributor of this work and has approved it for publication.
Funding
KC acknowledges the AXA Research Fund (Volcanology Chair) and a Royal Society Wolfson Research Merit Award for supporting this research.
Conflict of Interest
The authors declare that the research was conducted in the absence of any commercial or financial relationships that could be construed as a potential conflict of interest.
Acknowledgments
I thank reviewer DJ for a very helpful review, Jenny Riker for help with interpreting the experimental literature (although mis-interpretations are all mine!) and Jon Blundy for years of collaborative work on the Mount St. Helens magmatic system. I also acknowledge the AXA Research Fund and a Royal Society Wolfson Research Merit Award for support for this work.
References
Andrews, B., and Gardner, J. (2010). Effects of caldera collapse on magma decompression rate An example from the 1800 C-14 yr BP eruption of Ksudach Volcano, Kamchatka, Russia. J. Volcanol. Geother. Res. 198, 205–216. doi: 10.1016/j.jvolgeores.2010.08.021
Andrews, B., and Manga, M. (2014). Thermal and rheological controls on the formation of mafic enclaves or banded pumice. Contribut. Mineral. Petrol. 167:961.
Bacon, C. R., and Lowenstern, J. B. (2005). Late Pleistocene granodiorite source for recycled zircon and phenocrysts in rhyodacite lava at Crater Lake. Oregon. Earth Planet. Sci. Lett. 233, 277–293. doi: 10.1016/j.epsl.2005.02.012
Befus, K., and Andrews, B. (2018). Crystal nucleation and growth produced by continuous decompression of Pinatubo magma. Contribut. Mineral. Petrol. 173:92.
Befus, K., Manga, M., Stan, C., and Tamura, N. (2019). Volcanoes erupt stressed quartz crystals. Geophys. Res. Lett. 46, 8791–8800. doi: 10.1029/2019gl083619
Berlo, K., Blundy, J., Turner, S., and Hawkesworth, C. (2007). Textural and chemical variation in plagioclase phenocrysts from the 1980 eruptions of Mount St. Helens, USA. Contribut. Mineral. Petrol. 154, 291–308. doi: 10.1007/s00410-007-0194-8
Bindeman, I. (2005). Fragmentation phenomena in populations of magmatic crystals. Am. Mineral. 90, 1801–1815. doi: 10.2138/am.2005.1645
Blundy, J., and Cashman, K. (2005). Rapid decompression-driven crystallization recorded by melt inclusions from Mount St. Helens volcano. Geology 33, 793–796.
Blundy, J., and Cashman, K. (2008). “Petrologic reconstruction of magmatic system variables and processes,” in Minerals, Inclusions and Volcanic Processes, eds K. D. Putirka and F. J. Tepley (Berlin: Walter de Gruyter GmbH & Co KG), 179–239. doi: 10.2138/rmg.2008.69.6
Brandeis, G., and Jaupart, C. (1987). The kinetics of nucleation and crystal-growth and scaling laws for magmatic crystallization. Contribut. Mineral. Petrol. 96, 24–34. doi: 10.1007/bf00375522
Brenna, M., Cronin, S., Smith, I., Tollan, P., Scott, J., Prior, D., et al. (2018). Olivine xenocryst diffusion reveals rapid monogenetic basaltic magma ascent following complex storage at Pupuke Maar, Auckland Volcanic Field, New Zealand. Earth Planet. Sci. Lett. 499, 13–22. doi: 10.1016/j.epsl.2018.07.015
Brugger, C., and Hammer, J. (2010a). Crystal size distribution analysis of plagioclase in experimentally decompressed hydrous rhyodacite magma. Earth Planet. Sci. Lett. 300, 246–254. doi: 10.1016/j.epsl.2010.09.046
Brugger, C., and Hammer, J. (2010b). Crystallization Kinetics in Continuous Decompression experiments: Implications for interpreting natural magma ascent processes. J. Petrol. 51, 1941–1965. doi: 10.1093/petrology/egq044
Burgisser, A., Arbaret, L., Druitt, T., and Giachetti, T. (2011). Pre-explosive conduit conditions of the 1997 Vulcanian explosions at Soufriere Hills Volcano, Montserrat: II. Overpressure and depth distributions. J. Volcanol. Geother. Res. 199, 193–205. doi: 10.1016/j.jvolgeores.2010.11.014
Cabane, H., Laporte, D., and Provost, A. (2005). An experimental study of Ostwald ripening of olivine and plagioclase in silicate melts: implications for the growth and size of crystals in magmas. Contribut. Mineral. Petrol. 150, 37–53. doi: 10.1007/s00410-005-0002-2
Cashman, K. (1988). Crystallization Of Mount-St-Helens 1980-1986 Dacite - A Quantitative Textural Approach. Bull. Volcanol. 50, 194–209. doi: 10.1007/bf01079682
Cashman, K. (1992). Groundmass crystallization of Mount St Helens dacite, 1980-1986 - A tool for interpreting shallow magmatic processes. Contribut. Mineral. Petrol. 109, 431–449. doi: 10.1007/bf00306547
Cashman, K., and Blundy, J. (2013). Petrological cannibalism: the chemical and textural consequences of incremental magma body growth. Contribut. Mineral. Petrol. 166, 703–729. doi: 10.1007/s00410-013-0895-0
Cashman, K., and Hoblitt, R. (2004). Magmatic precursors to the 18 May 1980 eruption of Mount St. Helens, USA. Geology 32, 141–144.
Cashman, K., Kerr, R., and Griffiths, R. (2006). A laboratory model of surface crust formation and disruption on lava flows through non-uniform channels. Bull. Volcanol. 68, 753–770. doi: 10.1007/s00445-005-0048-z
Cashman, K., and Marsh, B. (1988). Crystal Size Distribution (CSD) in rocks and the kinetics and dynamics of crystallization .2. Makaopuhi lava lake. Contribut. Mineral. Petrol. 99, 292–305. doi: 10.1007/bf00375363
Cashman, K., and McConnell, S. (2005). Multiple levels of magma storage during the 1980 summer eruptions of Mount St. Helens, WA. Bulle. Volcanol. 68, 57–75. doi: 10.1007/s00445-005-0422-x
Cashman, K., Thornber, C., and Kauahikaua, J. (1999). Cooling and crystallization of lava in open channels, and the transition of Pahoehoe Lava to ‘A’(a)over-bar. Bull. Volcanol. 61, 306–323. doi: 10.1007/s004450050299
Cashman, K. V., and Mangan, M. T. (2014). A century of studies of effusive eruptions in Hawai‘i. USGS Profess. Paper 1801, 357–394.
Cassidy, M., Manga, M., Cashman, K., and Bachmann, O. (2018). Controls on explosive-effusive volcanic eruption styles. Nat. Commun. 9:2839.
Castro, J., Cashman, K., and Manga, M. (2003). A technique for measuring 3D crystal-size distributions of prismatic microtites in obsidian. Am. Mineral. 88, 1230–1240. doi: 10.2138/am-2003-8-906
Cichy, S., Botcharnikov, R., Holtz, F., and Behrens, H. (2011). Vesiculation and microlite crystallization induced by decompression: a case study of the 1991-1995 Mt Unzen eruption (Japan). J. Petrol. 52, 1469–1492. doi: 10.1093/petrology/egq072
Clarke, A., Stephens, S., Teasdale, R., Sparks, R., and Diller, K. (2007). Petrologic constraints on the decompression history of magma prior to Vulcanian explosions at the Souffiere Hills volcano, Montserrat. J. Volcanol. Geother. Res. 161, 261–274. doi: 10.1016/j.jvolgeores.2006.11.007
Coombs, M. L., Eichelberger, J. C., and Rutherford, M. J. (2003). Experimental and textural constraints on mafic enclave formation in volcanic rocks. J. Volcanol. Geother. Res. 119, 125–144. doi: 10.1016/s0377-0273(02)00309-8
Cooper, K., and Kent, A. (2014). Rapid remobilization of magmatic crystals kept in cold storage (vol 506, pg 480, 2014). Nature 508, 554–554. doi: 10.1038/nature13280
Couch, S., Sparks, R., and Carroll, M. (2003). The kinetics of degassing-induced crystallization at Soufriere Hills volcano. Montserrat. J. Petrol. 44, 1477–1502. doi: 10.1093/petrology/44.8.1477
Crisp, J., Cashman, K., Bonini, J., Hougen, S., and Pieri, D. (1994). Crystallization history of the 1984 Mauna-Loa lava flow. J. Geophys. Res. Solid Earth 99, 7177–7198.
Davidson, J., Hora, J., Garrison, J., and Dungan, M. (2005). Crustal forensics in arc magmas. J. Volcanol. Geother. Res. 140, 157–170. doi: 10.1016/j.jvolgeores.2004.07.019
Davidson, J. P., Morgan, D. J., Charlier, B. L. A., Harlou, R., and Hora, J. M. (2007). Microsampling and isotopic analysis of igneous rocks: Implications for the study of magmatic systems. Ann. Rev. Earth Planet. Sci. 35, 273–311. doi: 10.1146/annurev.earth.35.031306.140211
Dietterich, H. R., Lev, E., Chen, J., Richardson, J. A., and Cashman, K. V. (2017). Benchmarking computational fluid dynamics models of lava flow simulation for hazard assessment, forecasting, and risk management. J. Appl. Volcanol. 6:9.
Diller, K., Clarke, A., Voight, B., and Neri, A. (2006). Mechanisms of conduit plug formation: Implications for vulcanian explosions. Geophys. Res. Lett. 33: L20302.
Donnadieu, F., and Merle, O. (1998). Experiments on the identation process during cryptodome intrusions: New insights into Mount St. Helens deformation. Geology 26, 79–82.
D’Oriano, C., Poggianti, E., Bertagnini, A., Cioni, R., Landi, P., Polacci, M., et al. (2005). Changes in eruptive style during the AD 1538 Monte Nuovo eruption (Phlegrean Fields, Italy): the role of syn-eruptive crystallization. Bull. Volcanol. 67, 601–621. doi: 10.1007/s00445-004-0397-z
Duchene, S., Pupier, E., De Veslud, C., and Toplis, M. (2008). A 3D reconstruction of plagioclase crystals in a synthetic basalt. Am. Mineral. 93, 893–901. doi: 10.2138/am.2008.2679
Dunbar, N. W., Cashman, K. V., Dupre, R., and Kyle, P. R. (1994). Crystallization processes of anorthoclase phenocrysts: Evidence from crystal compositions, crystal size distributions and volatile contents of melt inclusions. Antarctic Res. Ser. 66, 129–146. doi: 10.1029/ar066p0129
Dzurisin, D. (2018). Mount St. Helens retrospective: Lessons learned since 1980 and remaining challenges. Front. Earth Sci. 6:142. doi: 10.3389/feart.2018.00142
Eberl, D., Kile, D., and Drits, V. (2002). On geological interpretations of crystal size distributions: Constant vs. proportionate growth. Am. Mineral. 87, 1235–1241. doi: 10.2138/am-2002-8-923
Edmonds, M., Cashman, K., Holness, M., and Jackson, M. (2019). Architecture and dynamics of magma reservoirs. Philos. Trans. R. Soc. a Math. Phys. Eng. Sci. 377:20180298. doi: 10.1098/rsta.2018.0298
Emerson, O. (1926). The formation of aa and pahoehoe. Am. J. Sci. 12, 109–114. doi: 10.2475/ajs.s5-12.68.109
Flaherty, T., Druitt, T., Tuffen, H., Higgins, M., Costa, F., and Cadoux, A. (2018). Multiple timescale constraints for high-flux magma chamber assembly prior to the Late Bronze Age eruption of Santorini (Greece). Contribut. Mineral. Petrol. 173:75.
Fokin, V., Potapov, O., Chinaglia, C., and Zanotto, E. (1999). The effect of pre-existing crystals on the crystallization kinetics of a soda-lime-silica glass. The courtyard phenomenon. J. Non Cryst. Solids 258, 180–186. doi: 10.1016/s0022-3093(99)00417-2
Fornaciai A., Perinelli C., Armienti P., and Favalli M. (2015). Crystal size distributions of plagioclase in lavas from the July–August 2001 Mount Etna eruption. Bullet. Volcanol. 77:70. doi: 10.1007/s00445-015-0953-8
Gardner, C., Cashman, K., and Neal, C. (1998). Tephra-fall deposits from the 1992 eruption of Crater Peak, Alaska: implications of clast textures for eruptive processes. Bull. Volcanol. 59, 537–555. doi: 10.1007/s004450050208
Geschwind, C., and Rutherford, M. (1995). Crystallization of microlites during magma ascent - the fluid-mechanics of 1980-1986 eruptions at Mount-St-Helens. Bull. Volcanol. 57, 356–370. doi: 10.1007/s004450050099
Griffiths, R., Kerr, R., and Cashman, K. (2003). Patterns of solidification in channel flows with surface cooling. J. Fluid Mech. 496, 33–62. doi: 10.1017/s0022112003006517
Gualda, G., Cook, D., Chopra, R., Qin, L., Anderson, A., and Rivers, M. (2004). Fragmentation, nucleation and migration of crystals and bubbles in the Bishop Tuff rhyolitic magma. Trans. R. Soc. Edinburgh Earth Sci. 95, 375–390. doi: 10.1017/s0263593300001139
Gualda, G., and Rivers, M. (2006). Quantitative 3D petrography using X-ray tomography: Application to Bishop Tuff pumice clasts. J. Volcanol. Geother. Res. 154, 48–62. doi: 10.1016/j.jvolgeores.2005.09.019
Hammer, J., Cashman, K., Hoblitt, R., and Newman, S. (1999). Degassing and microlite crystallization during pre-climactic events of the 1991 eruption of Mt. Pinatubo, Philippines. Bull. Volcanol. 60, 355–380. doi: 10.1007/s004450050238
Hammer, J., Cashman, K., and Voight, B. (2000). Magmatic processes revealed by textural and compositional trends in Merapi dome lavas. J. Volcanol. Geother. Res. 100, 165–192. doi: 10.1016/s0377-0273(00)00136-0
Hammer, J., and Rutherford, M. (2002). An experimental study of the kinetics of decompression-induced crystallization in silicic melt. J. Geophys. Res. Solid Earth 107:ECV 8-1-ECV 8-24.
Hammer, J. E. (2008). Experimental studies of the kinetics and energetics of magma crystallization. Rev. Mineral. Geochem. 69, 9–59. doi: 10.2138/rmg.2008.69.2
Harris, A., Mannini, S., Thivet, S., Chevrel, M., Gurioli, L., Villeneuve, N., et al. (2020). How shear helps lava to flow. Geology 48, 154–158. doi: 10.1130/g47110.1
Higgins, M. (1996). Crystal size distributions and other quantitative textural measurements in lavas and tuff from Egmont volcano (Mt Taranaki), New Zealand. Bull. Volcanol. 58, 194–204. doi: 10.1007/s004450050135
Higgins, M. (2017). Quantitative investigation of felsic rock textures using cathodoluminescence images and other techniques. Lithos 277, 259–268. doi: 10.1016/j.lithos.2016.05.006
Higgins, M. D. (2006). Quantitative Textural Measurements in Igneous and Metamorphic Petrology. Cambridge: Cambridge University Press, 265.
Hoblitt, R., and Harmon, R. (1993). Bimodal density distribution of cryptodome dacite from the 1980 eruption of Mount St-Helens. Washington. Bull. Volcanol. 55, 421–437. doi: 10.1007/bf00302002
Hoblitt, R. P., Wolfe, E. W., Scott, W. E., Couchman, M. R., Pallister, J. S., and Javier, D. (1996). “The preclimactic eruptions of Mount Pinatubo, June 1991,” in Fire and Mud: Eruptions and Lahars of Mount Pinatubo, Philippines, eds C. G. Newhall and R. S. Punongbayan (Seattle: University of Washington Press), 457–512.
Holness, M., Stock, M., and Geist, D. (2019). Magma chambers versus mush zones: constraining the architecture of sub-volcanic plumbing systems from microstructural analysis of crystalline enclaves. Philos. Trans. R. Soc. a-Math. Phys. Eng. Sci. 377Google Scholar
Holness, M. B., Anderson, A. T., Martin, V. M., Maclennan, J., Passmore, E., and Schwindinger, K. (2007). Textures in partially solidified crystalline nodules: a window into the pore structure of slowly cooled mafic intrusions. J. Petrol. 48, 1243–1264. doi: 10.1093/petrology/egm016
Humphreys, M., Blundy, J., and Sparks, R. (2008). Shallow-level decompression crystallisation and deep magma supply at Shiveluch Volcano. Contribut. Mineral. Petrol. 155, 45–61. doi: 10.1007/s00410-007-0223-7
Humphreys, M., Christopher, T., and Hards, V. (2009). Microlite transfer by disaggregation of mafic inclusions following magma mixing at SoufriSre Hills volcano, Montserrat. Contribut. Mineral. Petrol. 157, 609–624. doi: 10.1007/s00410-008-0356-3
Humphreys, M. C. S., Blundy, J. D., and Sparks, R. S. J. (2006). Magma evolution and open-system processes at Shiveluch Volcano: Insights from phenocryst zoning. J. Petrol. 47, 2303–2334. doi: 10.1093/petrology/egl045
Jerram, D., Dobson, K., Morgan, D., Pankhurst, M., and Burchardt, S. (2018). The petrogenesis of magmatic systems: using igneous textures to understand magmatic processes. Volcanic Igneous Plumb. Syst. 2018, 191–229. doi: 10.1016/b978-0-12-809749-6.00008-x
Jerram, D., Mock, A., Davis, G., Field, M., and Brown, R. (2009). 3D crystal size distributions: A case study on quantifying olivine populations in kimberlites. Lithos 112, 223–235. doi: 10.1016/j.lithos.2009.05.042
Jerram, D. A., Davis, G. R., Mock, A., Charrier, A., and Marsh, B. D. (2010). Quantifying 3D crystal populations, packing and layering in shallow intrusions: A case study from the Basement Sill, Dry Valleys, Antarctica. Geosphere 6, 537–548. doi: 10.1130/ges00538.1
Kahl, M., Chakraborty, S., Costa, F., Pompilio, M., Liuzzo, M., and Viccaro, M. (2013). Compositionally zoned crystals and real-time degassing data reveal changes in magma transfer dynamics during the 2006 summit eruptive episodes of Mt. Etna. Bull. Volcanol. 75:692.
Kahl, M., Viccaro, M., Ubide, T., Morgan, D., and Dingwell, D. (2017). A branched magma feeder system during the 1669 eruption of Mt Etna: Evidence from a time-integrated study of zoned olivine phenocryst populations. J. Petrol. 58, 443–472. doi: 10.1093/petrology/egx022
Kahl, W., Dilissen, N., Hidas, K., Garrido, C., Lopez-Sanchez-Vizcaino, V., and Roman-Alpiste, M. (2017). 3-D microstructure of olivine in complex geological materials reconstructed by correlative X-ray mu-CT and EBSD analyses. J. Microsc. 268, 193–207. doi: 10.1111/jmi.12598
Kile, D., and Eberl, D. (2003). On the origin of size-dependent and size-independent crystal growth: Influence of advection and diffusion. Am. Mineral. 88, 1514–1521. doi: 10.2138/am-2003-1014
Klein, J., Mueller, S., Helo, C., Schweitzer, S., Gurioli, L., and Castro, J. (2018). An expanded model and application of the combined effect of crystal-size distribution and crystal shape on the relative viscosity of magmas. J. Volcanol. Geother. Res. 357, 128–133. doi: 10.1016/j.jvolgeores.2018.04.018
Klug, C., and Cashman, K. (1994). Vesiculation of May 18, 1980, Mount St-Helens magma. Geology 22, 468–472.
Kouchi, A., Tsuchiyama, A., and Sunagawa, I. (1986). Effect of stirring on crystallization kinetics of basalt - texture and element partitioning. Contribut. Mineral. Petrol. 93, 429–438. doi: 10.1007/bf00371713
Marsh, B. (1998). On the interpretation of crystal size distributions in magmatic systems. J. Petrol. 39, 553–599. doi: 10.1093/petroj/39.4.553
Martel, C. (2012). Eruption dynamics inferred from microlite crystallization experiments: application to Plinian and dome-forming eruptions of Mt. Pelee (Martinique, Lesser Antilles). J. Petrol. 53, 699–725. doi: 10.1093/petrology/egr076
Martel, C., Brooker, R., Andujar, J., Pichavant, M., Scaillet, B., Blundy, J., et al. (2019). Experimental simulations of magma storage and ascent. Sci. Soc. 336, 101–110. doi: 10.1007/11157_2017_20
Martel, C., and Poussineau, S. (2007). Diversity of eruptive styles inferred from the microlites of Mt Pelee andesite (Martinique, Lesser Antilles). J. Volcanol. Geother. Res. 166, 233–254. doi: 10.1016/j.jvolgeores.2007.08.003
Martel, C., and Schmidt, B. C. (2003). Decompression experiments as an insight into ascent rates of silicic magmas. Contrib. Mineral. Petrol. 144, 397–415.
Martin, V. M., Davidson, J. P., Morgan, D. J., and Jerram, D. A. (2010). Using the Sr isotope compositions of feldspars and glass to distinguish magma system components and dynamics. Geology 38, 539–542. doi: 10.1130/G30758.1
Martin, V. M., Holness, M. B., and Pyle, D. M. (2006a). Textural analysis of magmatic enclaves from the Kameni Islands, Santorini, Greece. J. Volcanol. Geother. Res. 154, 89–102. doi: 10.1016/j.jvolgeores.2005.09.021
Martin, V. M., Pyle, D. M., and Holness, M. B. (2006b). The role of crystal frameworks in the preservation of enclaves during magma mixing. Earth Planet. Sci. Lett. 248, 787–799. doi: 10.1016/j.epsl.2006.06.030
Miwa, T., Toramaru, A., and Iguchi, M. (2009). Correlations of volcanic ash texture with explosion earthquakes from vulcanian eruptions at Sakurajima volcano, Japan. J. Volcanol. Geother. Res. 184, 473–486. doi: 10.1016/j.jvolgeores.2009.05.012
Mock, A., and Jerram, D. (2005). Crystal size distributions (CSD) in three dimensions: Insights from the 3D reconstruction of a highly porphyritic rhyolite. J. Petrol. 46, 1525–1541. doi: 10.1093/petrology/egi024
Mollard, E., Martel, C., and Bourdier, J. (2012). Decompression-induced crystallization in hydrated silica-rich melts: empirical models of experimental plagioclase nucleation and growth kinetics. J. Petrol. 53, 1743–1766. doi: 10.1093/petrology/egs031
Morgan, D. J., Blake, S., Rogers, N. W., De Vivo, B., Rolandi, G., and Davidson, J. P. (2006). Magma chamber recharge at Vesuvius in the century prior to the eruption of AD 79. Geology 34, 845–848.
Morgan, D. J., Blake, S., Rogers, N. W., DeVivo, B., Rolandi, G., Macdonald, R., et al. (2004). Time scales of crystal residence and magma chamber volume from modelling of diffusion profiles in phenocrysts: Vesuvius 1944. Earth Planet. Sci. Lett. 222, 933–946. doi: 10.1016/j.epsl.2004.03.030
Morgan, D. J., and Jerram, D. A. (2006). On estimating crystal shape for crystal size distribution analysis. J. Volcanol. Geother. Res. 154, 1–7. doi: 10.1016/j.jvolgeores.2005.09.016
Morgan, D. J., Jerram, D. A., Chertkoff, D. G., Davidson, J. P., Pearson, D. G., Kronz, A., et al. (2007). Combining CSD and isotopic microanalysis: magma supply and mixing processes at Stromboli volcano, Aeolian Islands, Italy. Earth Planet. Sci. Lett. 260, 419–431. doi: 10.1016/j.epsl.2007.05.037
Muir, D., Blundy, J., and Rust, A. (2012). Multiphase petrography of volcanic rocks using element maps: a method applied to Mount St. Helens, 1980-2005. Bull. Volcanol. 74, 1101–1120. doi: 10.1007/s00445-012-0586-0
Murch, A., and Cole, P. (2019). Using microlites to gain insights into ascent conditions of differing styles of volcanism at Soufriere Hills Volcano. J. Volcanol. Geother. Res. 384, 221–231. doi: 10.1016/j.jvolgeores.2019.07.022
Nakada, S., and Motomura, Y. (1999). Petrology of the 1991-1995 eruption at Unzen: effusion pulsation and groundmass crystallization. J. Volcanol. Geother. Res. 89, 173–196. doi: 10.1016/s0377-0273(98)00131-0
Neave, D., Buisman, I., and Maclennnnan, J. (2017). Continuous mush disaggregation during the long-lasting Laki fissure eruption. Iceland. Am. Mineral. 102, 2007–2021. doi: 10.2138/am-2017-6015ccby
Neave, D., Maclennan, J., Hartley, M., Edmonds, M., and Thordarson, T. (2014). Crystal storage and transfer in basaltic systems: the Skuggafjoll eruption. Iceland. J. Petrol. 55, 2311–2346. doi: 10.1093/petrology/egu058
Neave, D., Passmore, E., Maclennan, J., Fitton, G., and Thordarson, T. (2013). Crystal-melt relationships and the record of deep mixing and crystallization in the AD 1783 Laki Eruption. Iceland. J. Petrol. 54, 1661–1690. doi: 10.1093/petrology/egt027
Neill, O., Hammer, J., Izbekov, P., Belousova, M., Belousov, A., Clarke, A., et al. (2010). Influence of pre-eruptive degassing and crystallization on the juvenile products of laterally directed volcanic explosions. J. Volcanol. Geother. Res. 198, 264–274. doi: 10.1016/j.jvolgeores.2010.09.011
Newman, S., and Lowenstern, J. (2002). VOLATILECALC: a silicate melt-H2O-CO2 solution model written in Visual Basic for excel. Comput. Geosci. 28, 597–604. doi: 10.1016/s0098-3004(01)00081-4
Ni, H., Keppler, H., Walte, N., Schiavi, F., Chen, Y., Masotta, M., et al. (2014). In situ observation of crystal growth in a basalt melt and the development of crystal size distribution in igneous rocks. Contribut. Mineral. Petrol. 167:1003.
Noguchi, S., Toramaru, A., and Nakada, S. (2008). Relation between microlite textures and discharge rate during the 1991-1995 eruptions at Unzen, Japan. J. Volcanol. Geother. Res. 175, 141–155. doi: 10.1016/j.jvolgeores.2008.03.025
Pamukcu, A., and Gualda, G. (2010). Quantitative 3D petrography using X-ray tomography 2: Combining information at various resolutions. Geosphere 6, 775–781. doi: 10.1130/ges00565.1
Patwardham, K., and Marsh, B. D. (2011). Dynamics of the development of the Isle au Haut gabbro-diorite layered complex: Quantitative implications for mafic-silicic magma interactions. J. Petrol. 52, 2365–2395. doi: 10.1093/petrology/egr049
Polacci, M., Arzilli, F., La Spina, G., Le Gall, N., Cai, B., Hartley, M., et al. (2018). Crystallisation in basaltic magmas revealed via in situ 4D synchrotron X-ray microtomography. Sci. Rep. 8:8377.
Preece, K., Barclay, J., Gertisser, R., and Herd, R. (2013). Textural and micro-petrological variations in the eruptive products of the 2006 dome-forming eruption of Merapi volcano, Indonesia: Implications for sub-surface processes. J. Volcanol. Geother. Res. 261, 98–120. doi: 10.1016/j.jvolgeores.2013.02.006
Preece, K., Gertisser, R., Barclay, J., Charbonnier, S., Komorowski, J., and Herd, R. (2016). Transitions between explosive and effusive phases during the cataclysmic 2010 eruption of Merapi volcano, Java, Indonesia. Bull. Volcanol. 78:54.
Pupier, E., Duchene, S., and Toplis, M. (2008). Experimental quantification of plagioclase crystal size distribution during cooling of a basaltic liquid. Contribut. Mineral. Petrol. 155, 555–570. doi: 10.1007/s00410-007-0258-9
Randolph, A. D., and Larson, M. A. (1988). Theory of Particulate Processes. New York, NY: Academic Press.
Riker, J., Cashman, K., Kauahikaua, J., and Montierth, C. (2009). The length of channelized lava flows: Insight from the 1859 eruption of Mauna Loa Volcano, Hawai’i. J. Volcanol. Geother. Res. 183, 139–156. doi: 10.1016/j.jvolgeores.2009.03.002
Riker, J., Blundy, J., Rust, A., Botcharnikov, R., and Humphreys, M. (2015a). Experimental phase equilibria of a Mount St. Helens rhyodacite: a framework for interpreting crystallization paths in degassing silicic magmas. Contribut. Mineral. Petrol. 170:6.
Riker, J., Cashman, K., Rust, A., and Blundy, J. (2015b). Experimental constraints on plagioclase crystallization during H2O- and H2O-CO2- saturated magma decompression. J. Petrol. 56, 1966–1998.
Sakyi, P., Tanaka, R., Kobayashi, K., and Nakamura, E. (2012). Inherited Pb isotopic records in olivine antecryst-hosted melt inclusions from Hawaiian lavas. Geochim. Cosmochim. Acta 95, 169–195. doi: 10.1016/j.gca.2012.07.025
Sato, H. (1995). Textural difference between pahoehoe and aa lavas of Izu-Oshima Volcano, Japan - an experimental-study on population-density of plagioclase. J. Volcanol. Geother. Res. 66, 101–113. doi: 10.1016/0377-0273(94)00055-l
Saunders, K., Blundy, J., Dohmen, R., and Cashman K. (2012). Linking petrology and seismology at an active volcano. Science 336, 1023–1027. doi: 10.1126/science.1220066
Scandone, R., Cashman, K. V., and Malone, S. D. (2007). Magma supply, magma ascent and the style of volcanic eruptions. Earth Planet. Sci. Lett. 253, 513–529. doi: 10.1016/j.epsl.2006.11.016
Schiavi, F., Walte, N., and Keppler, H. (2009). First in situ observation of crystallization processes in a basaltic-andesitic melt with the moissanite cell. Geology 37, 963–966. doi: 10.1130/g30087a.1
Schwindinger, K., and Anderson, A. (1989). Synneusis of kilauea iki olivines. Contribut. Mineral. Petrol. 103, 187–198. doi: 10.1007/bf00378504
Shane, P., Cocker, K., Coote, A., Stirling, C., and Reid, M. (2019). The prevalence of plagioclase antecrysts and xenocrysts in andesite magma, exemplified by lavas of the Tongariro volcanic complex, New Zealand. Contribut. Mineral. Petrol. 174:89.
Shea, T., and Hammer, J. (2013). Kinetics of cooling- and decompression-induced crystallization in hydrous mafic-intermediate magmas. J. Volcanol. Geother. Res. 260, 127–145. doi: 10.1016/j.jvolgeores.2013.04.018
Sides, I., Edmonds, M., Maclennan, J., Houghton, B., Swanson, D., and Steele-MacInnis, M. (2014). Magma mixing and high fountaining during the 1959 Kilauea Iki eruption, Hawai’i. Earth Planet. Sci. Lett. 400, 102–112. doi: 10.1016/j.epsl.2014.05.024
Smith, V. C., Blundy, J. D., and Arce, J. L. (2009). A temporal record of magma accumulation and evolution beneath nevado de toluca, mexico, preserved in plagioclase phenocrysts. J. Petrol. 50, 405–426. doi: 10.1093/petrology/egp005
Soule, S., Cashman, K., and Kauahikaua, J. (2004). Examining flow emplacement through the surface morphology of three rapidly emplaced, solidified lava flows, Kilauea Volcano, Hawai’i. Bull. Volcanol. 66, 1–14. doi: 10.1007/s00445-003-0291-0
Sparks, R., Annen, C., Blundy, J., Cashman, K., Rust, A., and Jackson, M. (2019). Formation and dynamics of magma reservoirs. Philos. Trans. R. Soc. a-Math. Phys. Eng. Sci. 377:20180019.
Suzuki, Y., and Fujii, T. (2010). Effect of syneruptive decompression path on shifting intensity in basaltic sub-Plinian eruption Implication of microlites in Yufune-2 scoria from Fuji volcano, Japan. J. Volcanol. Geother. Res. 198, 158–176. doi: 10.1016/j.jvolgeores.2010.08.020
Suzuki, Y., Gardner, J., and Larsen, J. (2007). Experimental constraints on syneruptive magma ascent related to the phreatomagmatic phase of the 2000AD eruption of Usu volcano. Japan. Bull. Volcanol. 69, 423–444. doi: 10.1007/s00445-006-0084-3
Szramek, L., Gardner, J., and Larsen, J. (2006). Degassing and microlite crystallization of basaltic andesite magma erupting at Arenal volcano, Costa Rica. J. Volcanol. Geother. Res. 157, 182–201. doi: 10.1016/j.jvolgeores.2006.03.039
Tripoli, B., Manga, M., Mayeux, J., and Barnard, H. (2019). The effects of deformation on the early kinetics of basaltic magmas. Front. Earth Sci. 7:250. doi: 10.3389/feart.2019.00250
van der Zwan, F., Chadwick, J., and Troll, V. (2013). Textural history of recent basaltic-andesites and plutonic inclusions from Merapi volcano. Contribut. Mineral. Petrol. 166, 43–63. doi: 10.1007/s00410-013-0864-7
van Zalinge, M., Cashman, K., and Sparks, R. (2018). Causes of fragmented crystals in ignimbrites: a case study of the Cardones ignimbrite, Northern Chile. Bull. Volcanol. 80:22.
Vetere, F., Iezzi, G., Behrens, H., Cavallo, A., Misiti, V., Dietrich, M., et al. (2013). Intrinsic solidification behaviour of basaltic to rhyolitic melts: A cooling rate experimental study. Chem. Geol. 354, 233–242. doi: 10.1016/j.chemgeo.2013.06.007
Viccaro, M., Giacomoni, P. P., Ferlito, C., and Cristofolini, R. (2010). Dynamics of magma supply at Mt. Etna volcano (Southern Italy) as revealed by textural and compositional features of plagioclase phenocrysts. Lithos 116, 77–91. doi: 10.1016/j.lithos.2009.12.012
Vona, A., and Romano, C. (2013). The effects of undercooling and deformation rates on the crystallization kinetics of Stromboli and Etna basalts. Contribut. Mineral. Petrol. 166, 491–509. doi: 10.1007/s00410-013-0887-0
Waters, L., Andrews, B., and Lange, R. (2015). Rapid crystallization of plagioclase phenocrysts in silicic melts during fluid-saturated ascent: phase equilibrium and decompression experiments. J. Petrol. 56, 981–1006. doi: 10.1093/petrology/egv025
Wieser, P., Edmonds, M., Maclennan, J., and Wheeler, J. (2020). Microstructural constraints on magmatic mushes under Kilauea Volcano, Hawai’i. Nat. Commun. 11:14.
Witter, M., Furman, T., LaFemina, P., and Feineman, M. (2016). Understanding magmatic processes at Telica volcano, Nicaragua: Crystal size distribution and textural analysis. Am. Mineral. 101, 1052–1060. doi: 10.2138/am-2016-5379
Wong, L., and Larsen, J. (2010). The Middle Scoria sequence: A Holocene violent strombolian, subplinian and phreatomagmatic eruption of Okmok volcano, Alaska. Bull. Volcanol. 72, 17–31. doi: 10.1007/s00445-009-0301-y
Wright, H., Cashman, K., Mothes, P., Hall, M., Ruiz, A., and Le Pennec, J. (2012). Estimating rates of decompression from textures of erupted ash particles produced by 1999-2006 eruptions of Tungurahua volcano, Ecuador. Geology 40, 619–622. doi: 10.1130/g32948.1
Keywords: crystallization, crystal size distribution, volcanic processes, textural analysis, magmatic systems
Citation: Cashman KV (2020) Crystal Size Distribution (CSD) Analysis of Volcanic Samples: Advances and Challenges. Front. Earth Sci. 8:291. doi: 10.3389/feart.2020.00291
Received: 09 February 2020; Accepted: 23 June 2020;
Published: 10 July 2020.
Edited by:
Alan Whittington, The University of Texas at San Antonio, United StatesReviewed by:
Dougal Jerram, University of Oslo, NorwayChad Deering, Michigan Technological University, United States
Copyright © 2020 Cashman. This is an open-access article distributed under the terms of the Creative Commons Attribution License (CC BY). The use, distribution or reproduction in other forums is permitted, provided the original author(s) and the copyright owner(s) are credited and that the original publication in this journal is cited, in accordance with accepted academic practice. No use, distribution or reproduction is permitted which does not comply with these terms.
*Correspondence: Katharine V. Cashman, glkvc@bristol.ac.uk